energy transport and structure of the solar convection zone james armstrong university of hawai’i...
TRANSCRIPT
Energy Transport and Structure of the Solar Convection Zone
James Armstrong
University of Hawai’i Manoa
5/25/2004
Ph.D. Oral Examination

Introduction
• Magnetic Solar Cycle
• Solar Irradiance Cycle– Structural changes– Surface features
• How do proxy models work?

Introduction
• Observations– PSPT
• Red, Blue, and CaIIK
– MDI• Used as a check
• Faculae– Bright wall model– Comparison to proxy models

Introduction
• Sunspot bright rings– Simple resistor model– 2D diffusive model
• Bright ring observations– Temperature Profiles– How much energy do they radiate?– Facular regions– PSF and other corrections
• Discussion and Conclusions

Note For Convenience
• I’ll often refer to pixels or regions as being bright. This should be taken to mean bolometrically bright.
• I will often also use μ. μ is the cosine of the viewing angle.

Magnetic Solar Cycle
• Roughly periodic with period of 11 years.
• Sunspots appear at higher latitudes early in the cycle and lower in the cycle.
• Magnetic field flips from one cycle to the next.

Magnetic Solar Cycle
• Solar magnetic field begins with a poloidal field
• Poloidal field is wound up generating a torroidal field
• Magnetic field rises and recycled

Solar Irradiance
• Solar irradiance changes by 0.1% over the solar cycle.
• This is correlated with the solar magnetic cycle.
• Short term variability is large.
Fröhlich 2003

Irradiance vs. Luminosity
• Irradiance– Amount of energy radiated in a particular direction –
e.g. toward earth
• Luminosity– The total energy radiated by the sun
• They are not the same!– Changes in irradiance does not imply changes in
luminosity.

Irradiance vs. Luminosity
Solar irradiance cycle is caused by the time average of irradiance.
Why? Two explanations
• Solar irradiance cycle is driven by structural changes in the solar interior.
• Solar irradiance cycle is driven by surface features.

Deeper Structure Changes
• Magnetic fields generated at or near base of convection zone
• Magnetic fields lead to changes in the solar structure
• This leads to observed solar irradiance changes
ConvectionZone
RadiativeZone
Tachocline region
Photosphere
Radiative flux through magnetizedfluid sees lower opacity and increasedentropy relative to non-magnetized fluid
Solar cycle magnetic fields
Magnetized fluidis “hotter”
3Cpl
16T 2dT dz

Surface Features• Magnetic fields cause
holes.• Facular regions appear
bright.• Due to suppression of
convective motion sunspots appear dark.
• Use average area of bright and dark features to predict the irradiance.

Proxy Models• Faculae are bright
and increase solar irradiance
• Sunspots are dark and decrease solar irradiance
• Assumes that the quiet sun doesn’t change
Predict about 95% of irradiance variability

End of slide show, click to exit
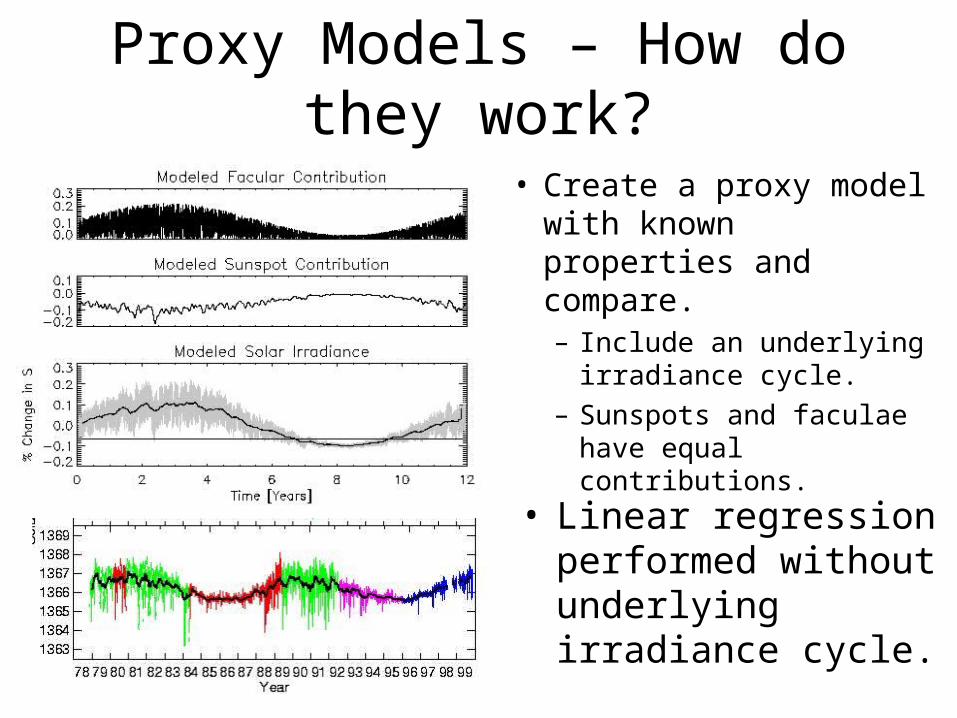
Proxy Models – How do they work?
• Create a proxy model with known properties and compare.– Include an underlying
irradiance cycle.
– Sunspots and faculae have equal contributions.
• Linear regression performed without underlying irradiance cycle.

Comparison
• Real proxy models have an R of 95%
• Simulated proxy models have an 94%– Didn’t include the underlying solar cycle– Only had two independent variables– Adding an independent variable which is
random noise increased R to 95%– Over estimated contributions from faculae– Under estimated contributions for sunspots

Observations
• Precision Solar Photometric Telescope (PSPT)– Located on Mauna Loa– Seeing Limited Observations– Pixels of 1”– Photometry of 0.1%– Three bands:
• Red 606.7 – 607.2 nm• Blue 409.3 – 409.6• CaIIK 393.1 – 393.4 nm

Red and Blue Temperature

CaIIK Traces Magnetic Field
Other Facular studies compute line of sight magnetic field by dividing by m.

Faculae - The Hot Wall Model
• Magnetic fields provide pressure support.
• Pressure equilibrium implies lower density.
• Lower density leads to lower opacity providing an energy shunt – a preferred route for energy to emerge from the solar surface.

Properties of Faculae
• Faculae redistribute the angular surface irradiance.
• Represent a local increase in the radiated energy.
• Stronger faculae appear dark at disk center.

Comparison of Faculae to Hot Wall Models
• We can relate the temperature at the base of the flux tube to the surface temperature
Zw=100Km
Walls are hot, but surrounding down flows are cold.
Tw/T=97%

Comparison of Observations to Proxy Models
Now we can use “conversion factor”.
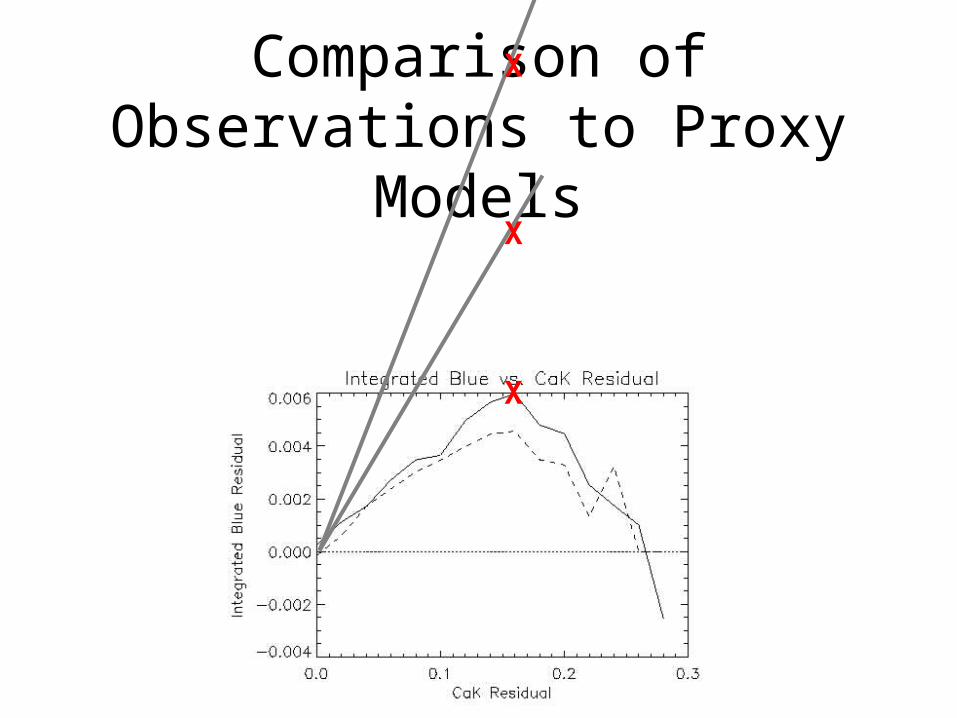
Comparison of Observations to Proxy Models
X
X
X

Sunspot Bright Rings
• Sunspots inhibit energy transport in the convection zone
• Heat will build up at the bottom of the sunspot
• This excess heat flows around the sunspot increasing temperature of neighboring solar surface

Simple Resistor Model
FU
D
ldz
uR0
l
dzdR
T=I-Fk
I
F=I-T F
lk=0
Perturbed temperature solution generatedfrom effective source at base of sunspot withan effective luminosity of F
0013.0 ]150/1000/[ /
kmkmHleRR
RFU Hl
ud
d

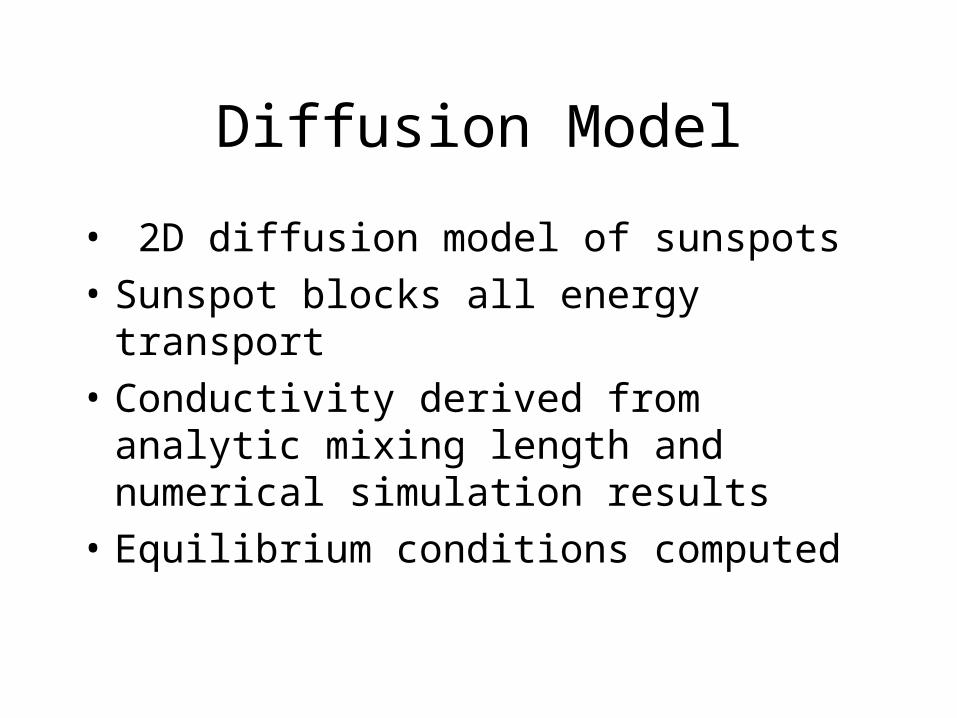
Diffusion Model
• 2D diffusion model of sunspots
CpdT
dt
1
r
r
rkrTr
z
kzTz
T T T0
dU
dtT 4
Diffusion Model
• 2D diffusion model of sunspots
• Sunspot blocks all energy transport
• Conductivity derived from analytic mixing length and numerical simulation results
• Equilibrium conditions computed

Conductivity

2D Diffusion Model
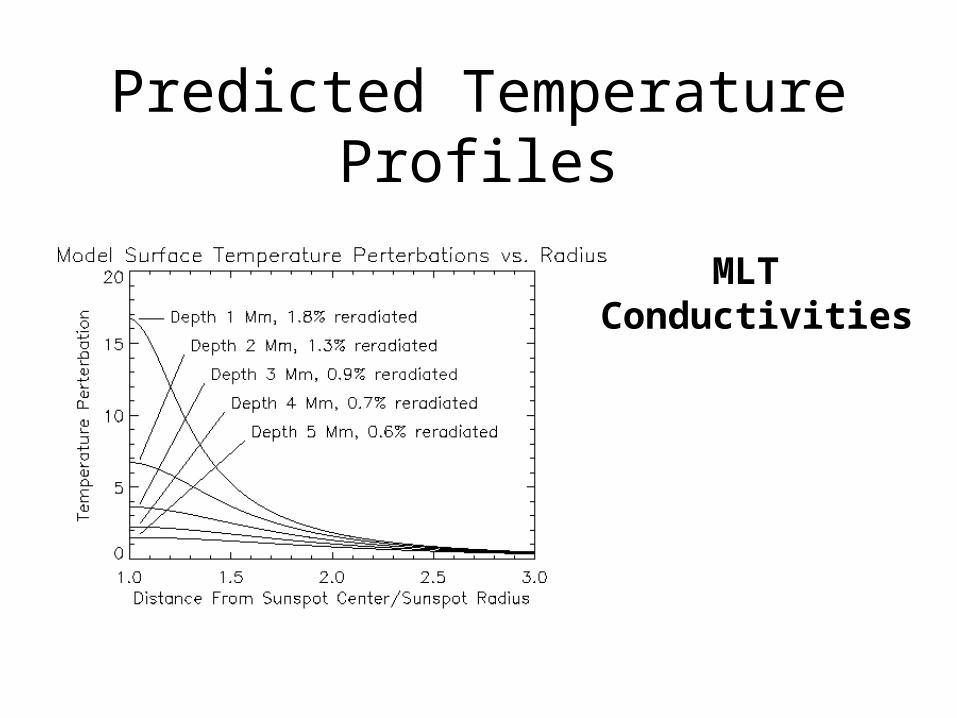
Predicted Temperature Profiles
MLT Conductivities

Predicted Temperature Profiles
NumericalConductivities

Observations

MDI
• Michaelson Doppler imager aboard SOHO– 2” pixels– Lower Photometry
• Not designed for photometry
– Used as a check
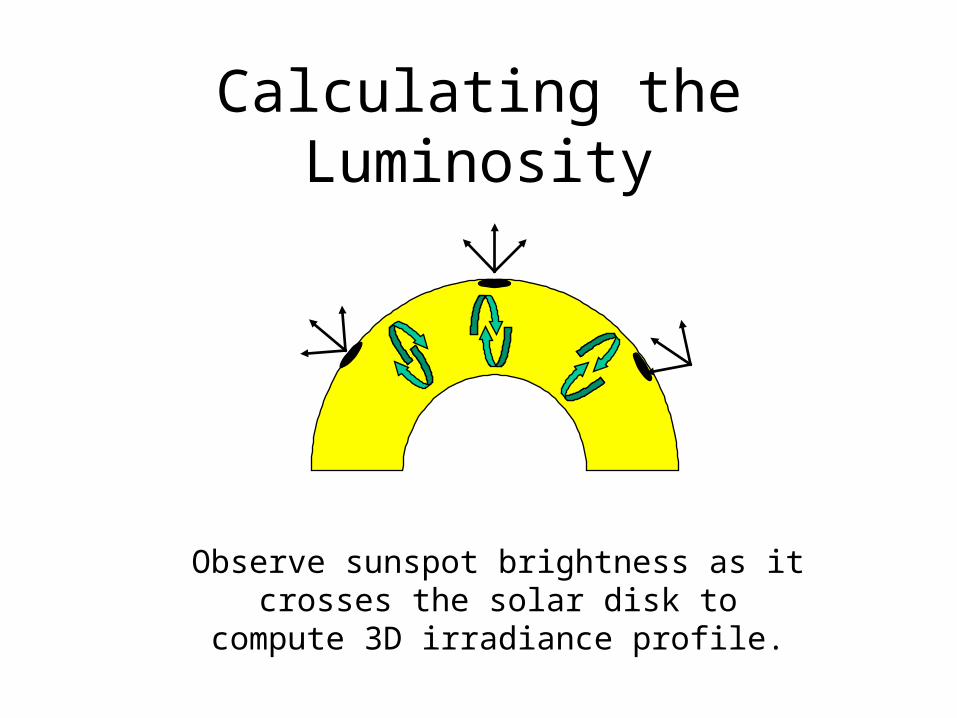
Calculating the Luminosity
Observe sunspot brightness as it crosses the solar disk to compute 3D irradiance profile.

Observational Results
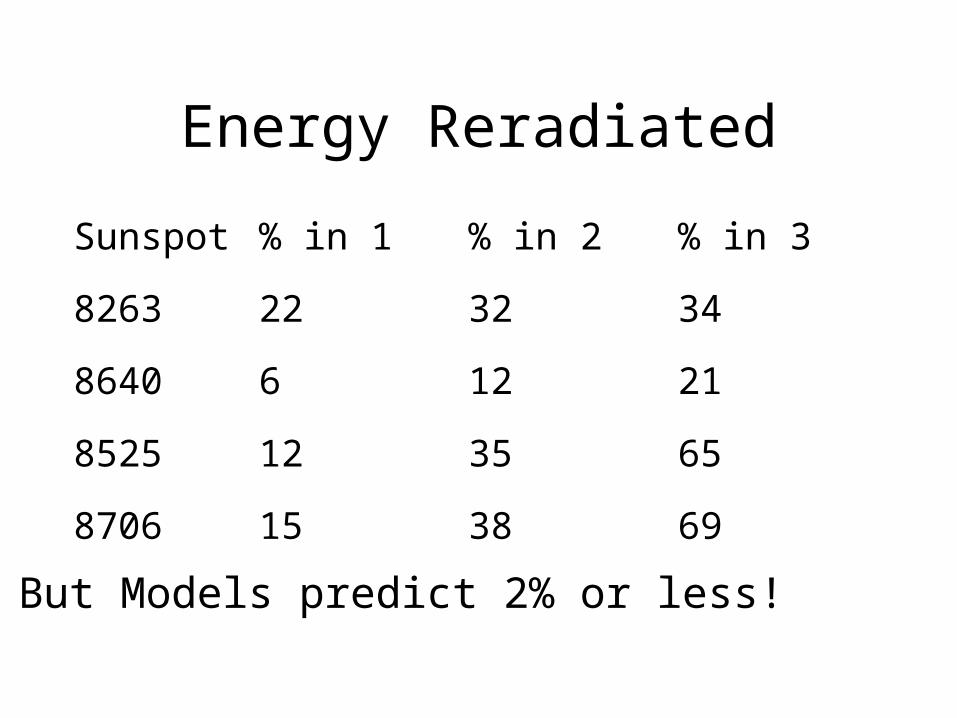
Energy Reradiated
But Models predict 2% or less!
Sunspot % in 1 % in 2 % in 3
8263 22 32 34
8640 6 12 21
8525 12 35 65
8706 15 38 69

Diffusion Doesn’t Work
• Mixing length or anisotropic diffusion conductivities don’t explain bright ring data
• Correlated flows over scales much larger than a density scale height seem to be required
• Faculae or CaIIK bright pixels are puzzling -- important local perturbations to heat flow?

What about Faculae?
• Faculae redistribute energy
• May represent increase in energy
• Are probably in all sunspot rings
• Should be corrected for?Try excluding them from
computation.

Bright Rings - Filtered
• Removing the bright CaIIK regions
Sunspot % in 1 % in 2 % in 3
8263 -5.0 -5.5 -10
8640 -1.3 -3.3 -8
8525 -0.4 -1.2 -6.2
8706 -0.2 -2.0 -5.3

What Happened?Scattered light ?

• Scattering of light causes a slight dark ring around the sunspot.
• Compute the PSF and correct.
Scattered Light
• Due to remaining defects, compute forward problem
• Bright are rings missing.

Bright Ring Faculae Are Different
• Faculae in bright rings are fainter than in quiet sun.
• Correction implies a bright ring ~which reradiates 10% of energy blocked.

Comparison of Observations to Proxy Models
X
X
X

Plausibility Check
• We see large changes in solar irradiance associated with sunspots and faculae.
• Other evidence indicates that sunspots and faculae don’t have a large effect on solar irradiance
• Conflict is resolved by considering a complete disk crossing.

Plausibility Check
• Most of the energy reradiated by bright rings are associated with magnetic fields. (They are facular in nature)
• Faculae are darker at disk center.• Sunspots are darker at disk
center.• Sunspots + bright ring must be
darker at disk center.
Conclusions
• Facular regions– Redistribute radiated energy.– Act as a local increase in energy budget.– Might not represent an increase in solar
irradiance.
• Proxy models overestimate the contributions of facular regions.– They are hiding something.

Conclusions
• Sunspot bright rings reradiate at least 40% of energy blocked by sunspots.
• The excess energy radiated by bright rings is preferentially channeled through CaIIK bright regions.
• After correction for scattered light, no bright ring remains, but facular regions imply that 10% of energy is reradiated
Conclusions
• Energy transport in the solar convection zone is not diffusive.– Diffusion models predict that less than 1% of the
energy blocked by a sunspot is reradiated.
– Faculae must represent an energy increase.
– Diffusion models predict that they don’t.
– This represents a contradiction.
• Energy is transported by large scale bulk motions.• In small features, radiative transfer is important.

Questions?Questions?