energy transitions: adapting to the new normal of the
TRANSCRIPT

Energy Transitions: Adapting to the New Normal of the Changing World

Boston Consulting Group partners with leaders in business and society to tackle their most important challenges and capture their greatest opportunities. BCG was the pioneer in business strategy when it was founded in 1963. Today, we help clients with total transformation—inspiring complex change, enabling organizations to grow, building competitive advantage, and driving bottom-line impact.
To succeed, organizations must blend digital and human capabilities. Our diverse, global teams bring deep industry and functional expertise and a range of perspectives to spark change. BCG delivers solutions through leading-edge management consulting along with technology and design, corporate and digital ventures—and business purpose. We work in a uniquely collaborative model across the firm and throughout all levels of the client organization, generating results that allow our clients to thrive.
Kaustav Mukherjee, Anirban Mukherjee, Kaustubh Verma, Sonal Tripathy and Akash Govil
December 2019
Energy Transitions: Adapting to the New Normal of the Changing World

1 Energy Transitions: Adapting to the new normal of the changing world
Introduction: The global energy system is witnessing progressive transforma-tion as the world looks to transition into a decarbonized future. The global energy
mix has seen transitions before but the current scenario is significantly more complex as we look to balance the growing affordable energy requirement to drive economic growth and secure universal energy access coupled with the need to transition into a low carbon economy.
Key factors driving the current transitions are rising demand, technological innovations, environment concerns and also geopolitical shifts. The world energy demand is expect-ed to continue to increase by 1.2 percent during 2017-2040 as countries work towards proving energy access to all. The expanding economies of developing countries will con-tinue to need more energy even as the consumption in developed nations stagnates.
In addition, advancements in technology are making non-fossil fuels affordable and economically viable; Renewables are increasingly playing a vital role in the energy mix of many countries. Renewable energy sources accounted for 44 percent of the electricity consumption in Germany in the first half of 2019. In the UK too, the re-newable energy share in electricity generation was 40 percent in Q3 of 2019 sur-passing, for the first time, the total share of fossil fuels in the country.
But most importantly, concerns about the rising levels of atmospheric emissions, that are the leading cause of climate change, are forcing countries to relook at their future energy mix. Countries are looking at stricter emissions norms and exploring carbon tax on fossil fuels. More than 40 countries globally have currently adopted some kind of carbon pricing either through direct taxes or carbon trading programs. Another example of increasing global concerns over emissions is the initiation of the IMO (international maritime organization) regulations from January 2020 that will cap the sulphur content in shipping fuel to 0.5 percent from the current 3.5 per-cent. The regulations aims to replace high sulphur fuel with low sulphur compliant fuel and marine gas oil which will significantly reduce marine pollution.
The break-through in shale gas in the US has significantly increased global natural gas resources. In 2018, US became the largest natural gas producer globally, driven by the shale boom and is all set to become world’s largest LNG exporter by 2025 taking gas market dominance away from countries such as Russia and Qatar
As the world moves towards a low emission future, it is imperative for oil and gas companies to revisit their positions with a dual focus: to stress-test their portfolios for a better understanding of the impact of reduced use of fossil fuels; and to man-

Boston Consulting Group • FIPI 2
age the risks arising out of climate change concerns, thereby developing a strategy to respond to energy transitions.
This paper focuses on the challenges that global oil and gas firms are facing due to the expected rapid transitions in the energy space. Other than the growth of renew-ables, rising emissions and climate change are becoming a big challenge, question-ing the sector’s business operations. Oil and gas companies are having to deal with public campaigns and legal challenges from environmental activists; demands from investors to disclose climate change-related business risks; calls for greater transpar-ency in releasing emission information from government regulators; reduced lend-ing for some of oil and gas projects; and the diminishing potential of the industry to attract talent from the younger population. This paper also examines possible solu-tions as companies strive to create a resilient portfolio that will not only help them operate in the long term, but also offer solutions to meet the growing global energy demand with reduced emissions. We navigate through some options that companies may consider as they prepare to be part of a world with net zero emissions by 2050.
Key Drivers of Energy Transition:Energy transition is a shift in the global energy mix, which may occur due to a range of reasons including national priorities (as at the time of World War I); tech-nological advancements that make new energies feasible; the growing energy needs of people and industries; and, more recently, public awareness and regulatory poli-cies around climate change (Exhibit 1).
Source: V. Smil, Energy Transitions , Praeger, 2010; V. Smil, Power Density, MIT Press, 2015
60
0
20
100
80
40
Fuel
Con
sum
ptio
n (%
)
1900 1910 1920 1930 1940 1950 1960 1970 1980 1990 2000 2010
Renewables HydroNuclear OilNatural Gas Coal Traditional biofuels
1965:Oil
takes #1
EXHIBIT 1 | Shift in the Global Energy Mix From Traditional Bio-fuels to Coal to Oil Over the Past Centuries
1901:Coal
takes #1
3 Energy Transitions: Adapting to the New Normal of the Changing World
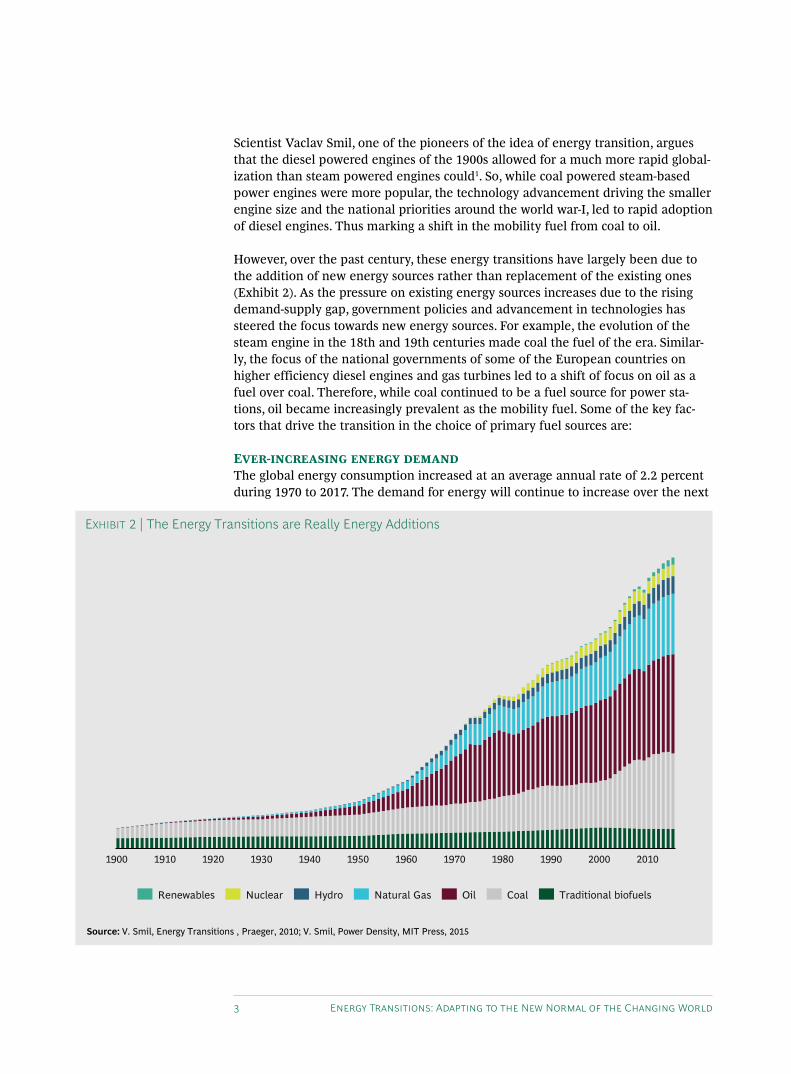
Scientist Vaclav Smil, one of the pioneers of the idea of energy transition, argues that the diesel powered engines of the 1900s allowed for a much more rapid global-ization than steam powered engines could1. So, while coal powered steam-based power engines were more popular, the technology advancement driving the smaller engine size and the national priorities around the world war-I, led to rapid adoption of diesel engines. Thus marking a shift in the mobility fuel from coal to oil.
However, over the past century, these energy transitions have largely been due to the addition of new energy sources rather than replacement of the existing ones (Exhibit 2). As the pressure on existing energy sources increases due to the rising demand-supply gap, government policies and advancement in technologies has steered the focus towards new energy sources. For example, the evolution of the steam engine in the 18th and 19th centuries made coal the fuel of the era. Similar-ly, the focus of the national governments of some of the European countries on higher efficiency diesel engines and gas turbines led to a shift of focus on oil as a fuel over coal. Therefore, while coal continued to be a fuel source for power sta-tions, oil became increasingly prevalent as the mobility fuel. Some of the key fac-tors that drive the transition in the choice of primary fuel sources are:
Ever-increasing energy demandThe global energy consumption increased at an average annual rate of 2.2 percent during 1970 to 2017. The demand for energy will continue to increase over the next
EXHIBIT 2 | The Energy Transitions are Really Energy Additions
Source: V. Smil, Energy Transitions , Praeger, 2010; V. Smil, Power Density, MIT Press, 2015
195019401900 1910 1920 20101930 1960 1970 1980 1990 2000
OilRenewables Nuclear Natural Gas Traditional biofuelsHydro Coal

Boston Consulting Group • FIPI 4
two decades driven by economic growth in the developing world. The energy con-sumption is expected to increase at 1.2 percent annually over the next two decades (Exhibit 3). This will require technological innovations to improve yield of existing fuels and use of new fuel sources.
Technology AdvancementTechnology is playing a dual role for the renewables and the O&G industry. While, on one hand technology is allowing lower cost of renewables and making it eco-nomically competitive to fossil fuels, on the other hand technology is also leading to higher efficiency of fossil fuel systems (such as ICE and power generation) and enabling increased productivity from fossil fuels.
The falling cost of renewables have enabled them to emerge as sources for afford-able, secure, sustainable energy. The cost of solar PV has plunged more than 80 per-cent since 2010, making the technology increasingly competitive to fossil fuels in most of the countries globally. According to Bloomberg New Energy Finance (BNEF), the overall capacity of renewables has quadrupled from 414 GW to about 1,650 GW during 2010-2019. Solar capacity increased by over 26 times from 25 GW in 2009 to ~663 GW in 2019 itself. Similarly, the advancements in battery technolo-gy have led to significant drop in battery prices providing further viability to renew-able (where batteries are often used for storage) as a credible energy source. Ac-cording to BNEF, costs of volume weighted average battery pack fell 85 percent
EXHIBIT 3 | Share of Energy Sources in Overall Global Energy Consumption
Source: BP Outlook 2019
0
5,000
10,000
20,000
15,000
204020101970
Million tons of oil equivalent
1980 1990 2000 2017 2020 2030
+2.2%
+1.2%
NuclearOil Gas Coal Hydro Renewables
5 Energy Transitions: Adapting to the New Normal of the Changing World
from 2010-2018, reaching an average of $176 / kWh from $1,160 / kWh. The fall in battery prices are also making electric vehicle competitive to the traditional inter-nal combustion engines.
On the other hand, the breakthrough in hydraulic fracturing or ‘fracking’ technolo-gy has given the oil and gas industry huge push by providing access to additional re-sources. The growth of the shale industry in the US has completely changed the oil geopolitics. The United States—the largest oil importer in 2008—became an oil ex-porter driven by the shale boom, and went on to become the largest oil producer globally in 2018 on the back of large shale reserves and better fracking technology. Competitive prices of fossil fuels due to increased supplies and increased efficien-cies of power plants and mobility solutions helps maintain a strong case for the fossil fuels in near future.
Thus, technology will continue to play a significant role in allowing countries to meet the rising energy demands and will push for the right balance between both renewables and fossil fuels.
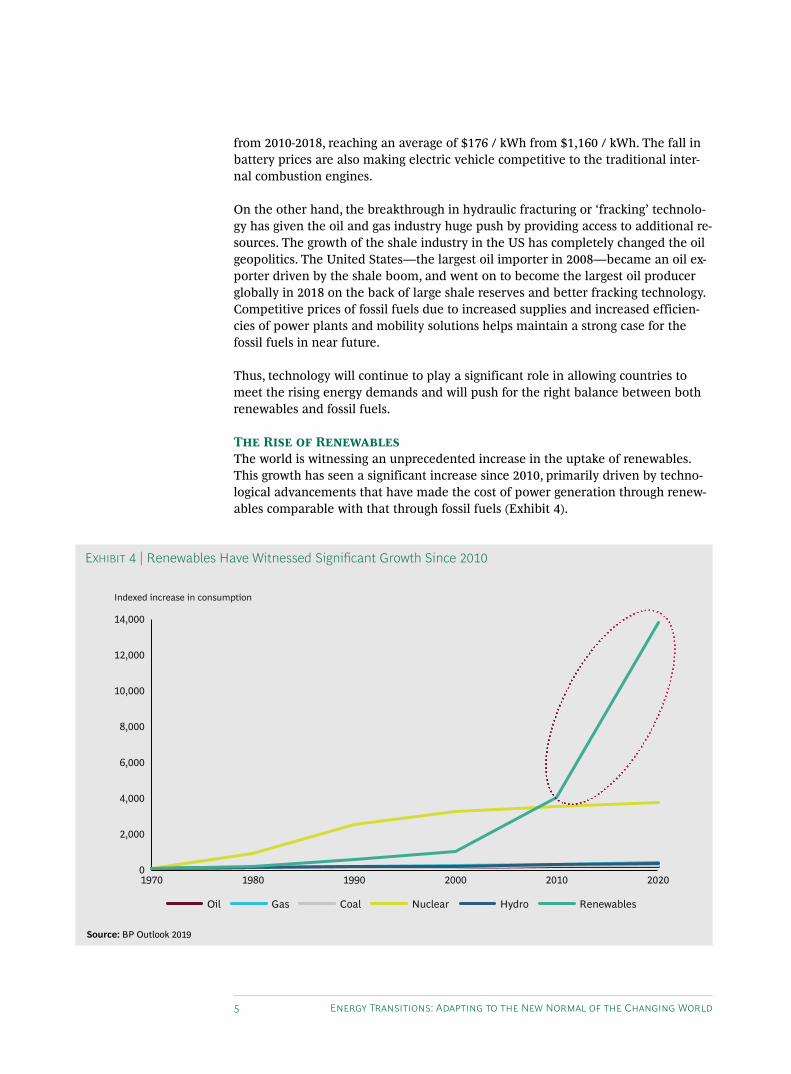
The Rise of RenewablesThe world is witnessing an unprecedented increase in the uptake of renewables. This growth has seen a significant increase since 2010, primarily driven by techno-logical advancements that have made the cost of power generation through renew-ables comparable with that through fossil fuels (Exhibit 4).
Source: BP Outlook 2019
01970 200019901980 2010 2020
2,000
4,000
6,000
8,000
10,000
12,000
14,000
Indexed increase in consumption
Oil Gas HydroCoal Nuclear Renewables
EXHIBIT 4 | Renewables Have Witnessed Significant Growth Since 2010

Boston Consulting Group • FIPI 6
The cost of renewables has steadily fallen since 2010 and is expected to continue to fall until 2040 with average learning curve of ~25 percent.
The lower cost of renewables is leading to their wider adoption globally. According to International Energy Agency, renewable power capacity (including hydro) is set to expand by 50 percent between 2019 to 2024, led by solar PV which alone ac-counts for 60 percent of expected growth while onshore wind to account for anoth-er 25 percent (Exhibit 5).
Rising Emissions and Climate ChangeThe Paris Agreement signed in 2015 committed nearly 200 countries to the goal of limiting global warming to ‘well below 2 degrees Celsius’. However, the increase in energy demand is driving the increase in global CO2 emissions. As per the IEA, global energy-related CO2 emissions, driven by higher energy demand in 2018, rose by 1.7 percent to a historic high of 33.1 Gt CO2. According to the U.N. World Meteo-rological Organization, global temperatures are on course for a 3–5 degrees Celsius rise in this century, in the absence of any major interventions.
However, the world is now witnessing increasing concerns over climate change issues. Governments, environmental groups and an ever more resolute millennial generation are scrutinizing companies that generate greenhouse gas (GHG) emissions (Exhibit 6). With the oil and gas sector accounting for 40 percent of global GHG emissions, the sector faces a huge challenge to be part of a low carbon / decarbonized world.
EXHIBIT 5 | Steep Learning Rates Drive Further LCOE Reduction and Increase Competitiveness of Renewables on Merchant Market
Source: Irena, BNEF, WoodMackenzie, BCG analysis
1 10 100 1,000 10,0000.01
0.10
1.00
2040
GW
2030
2020
2020
$ / kWh (2018 values)
2010
2010
2020
2030
2040
2010
2030
2040
Onshore Wind Solar PVOffshore Wind
26%Offshore Windavg. learning
rate
26%Solar PV
avg. learning rate 24%
Onshore Windavg. learning
rate

7 Energy Transitions: Adapting to the New Normal of the Changing World
Global Geopolitics and national priorities:1. US and its changed role in global energy geopolitics: The technological
advancements that unlocked vast shale potential in the US have brought about significant changes in global energy markets. The increased oil supply from the country has reduced the global oil supply risk as the dependence on OPEC has reduced. In the gas sector too, the new resources from shale have added abun-dant supply and will drive the country to be a key LNG exporter over the coming years. The additional resources from shale have not only put US as key oil and gas supplier on the world map but also led to significant adjustments in oil and gas prices that is likely to continue over the coming years. The fall in global gas / LNG prices is likely to drive natural gas adoption in global energy mix. According to IEA, in 2018, the demand for natural gas increased by 4.6 percent, accounting for half of overall demand growth. Gas demand in the coming five years is set to be driven by Asia Pacific, forecast to account for almost 60 percent of the total consumption increase to 2024.
2. Government budgets and oil product taxes: The phenomena which started in OECD in early 1980s post the oil shock of 1970, (increase the sales taxes on oil products to maintain a high consumer price in order to incentivize reduced consumption of oil) has over the past years been adopted by a large number of non-OECD countries. This ensured that over the past years even as global oil prices fell, the product prices from consumers remained higher providing the economic benefit to move away from hydrocarbons to renewables.
Source: IEA (2017)
68%
44%
Non O&G
100%
O>otal GHG emissions EnergyNon energy
Emissions by sector Emissions by energy type
GLOBAL GHG EMISSIONS FROM ENERGY AND O&G
EXHIBIT 6 | Contribution of O&G Firms to Total GHG Emissions

Boston Consulting Group • FIPI 8
3. Health issues and need to curb increasing pollution levels: Ambient air pollution is also becoming a key challenge globally specially for the developing nations. The World Health Organization estimates 4.2 million premature deaths globally are linked to ambient air pollution. The deterioration in air quality and increasing levels of pollution both in China and India are also compelling the governments to strict actions towards reducing carbon emissions. Both countries have aggressively expanded the renewable energy share in their global mix, however the growth in economy has also led to increasing pollution levels year on year. China specifically over the past few years, has come with number of policies to reduce share of coal in power and heating sectors. The country is also leading the global electric vehicle boom. IEA under different scenarios expects EV sales in China to account for 57 percent to 75 percent of the total vehicle sales by 2030.
4. National priorities to fight climate change: There is also significant pressure, especially in developed nations from the public, on the government to act on climate change now. In May 2019, the governments of France, the Netherlands, Belgium, Sweden, Denmark, Spain, Portugal and Luxembourg announced that they support the development of an EU roadmap to net-zero emissions “by 2050 at the latest”. Germany’s Chancellor Angela Merkel formed a ‘Climate Cabinet’ in March 2019 and later also announced her ambition to drive Germany to become carbon neutral by 2050. New-York in July 2019 announced the most ambitious climate target in the US. The state aims to achieve Carbon-free electricity by 2040 and a net-zero carbon economy by 2050.
Energy Transitions and the Challenges for the Oil and Gas IndustryInterestingly, the growth of renewables in the global energy mix has not reduced the demand for oil and gas. Even though the share of renewables in the global energy mix increased from 2 percent to 4 percent between 2010 and 2017 and the share of oil and gas remained stagnant at 57 percent during the same time, the actual consumption of oil and gas went up from ~6.9 billion tons of oil equivalent in 2010 to 7.7 billion tons of oil equivalent in 2017. As the global energy demand is expected to grow by ~1.2 per-cent over the next two decades, oil and gas together are likely to continue to play a key role in the global energy mix, accounting for 52 percent of the energy basket in 2040.
The major challenge that the O&G industry is facing is the need to tackle the emissions arising from operations. In order to limit global warming to 1.5 degrees Celsius, carbon dioxide (CO2) emissions must reach net-zero on average by 2050. There is growing pressure on the industry from all stakeholders (Exhibit 7).
There is growing concern about climate change among investors and the general population (Exhibit 8). According to press reports, investors managing more than $34 trillion in assets (nearly half the world’s invested capital) are demanding urgent ac-tion from governments on climate change, putting significant pressure on the gov-ernments of top economies. The general public perception is also fast changing across countries with more and more people perceiving climate change as a big is-sue. The investors are pressuring companies to look at how their strategy is aligned to 2015 Paris commitments. Oil & Gas majors are facing increasing pressure to act on the global pledge towards reduction of emission.

9 Energy Transitions: Adapting to the New Normal of the Changing World
EXHIBIT 8 | Changing Public Perception and Increasing Resolutions on Climate Change Putting Pressure on Company Board
Source: Pew Global Attitudes and Trends, Sustainable Investments Institute, BCG (CEI) analysisNotes: Voted on or pending, 2018 is year to date as of June 2018
PUBLIC PERCEPTION OF CLIMATE CHANGE AND GREENHOUSE GAS REGULATIONS
768687
7889 86
69
84
71 70
8389
63
8880
56
0
50
100
Ger
man
y
18
45
Chin
a
Fran
ceUK
Indi
a
% respondents agreeing
Cana
da
Ital
y
51
US
Japa
n
Sout
h K
orea
Indo
nesi
a
Bra
zil
Aust
ralia
Sout
h Af
rica
55
41
55 56
4345 4841 45
Global climate change is a very serious problem
Support country limiting greenhouse gas emissions as part of an international agreement
EUROPE N.AM. ASIA OTHER
36 37
22 19
32
5155
46
71
0
60
20
40
80
2010 2015
No. of resolutions
2011 2012 2013 2014 2016 2017 2018
INCREASING RESOLUTIONS FROM SHAREHOLDERS ON CLIMATE CHANGE
EXHIBIT 7 | The Industry is Facing New Challenges—Threatening Its Fundamental Moral Legitimacy
GLOBAL OIL & GAS INDUSTRY
Global Oil & Gas industry
Local resistance (for
example,fracking, oil
trains)
Blockage of licensing and
permitting
Accelerating policy support
for EVs and renewables
Changes to fiscal terms
"Tobacco-ization" to de-legitimize the
industry
Government investigations (for example, NY AG office)
Demanddestruction
(efficiency, biofuels mandates)
"Fossil fuel" industry—
associating O&Gwith coal
Divestment and shareholder
activism
Source: Media reports
Boston Consulting Group • FIPI 10
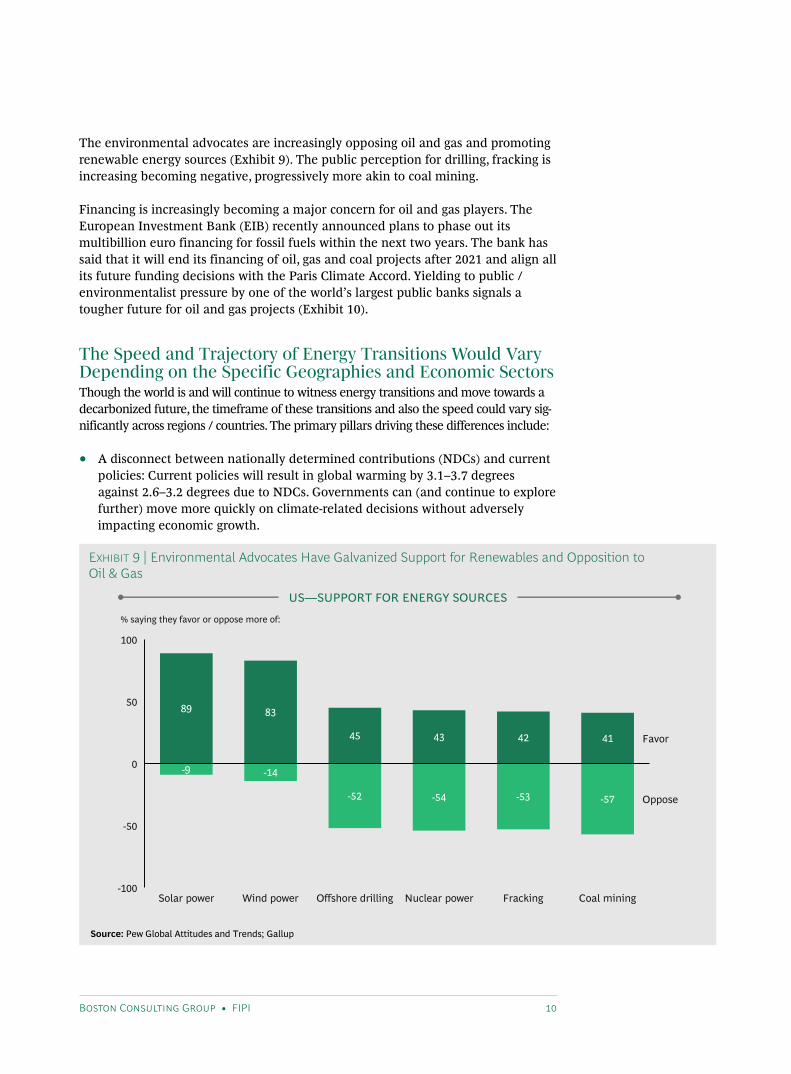
The environmental advocates are increasingly opposing oil and gas and promoting renewable energy sources (Exhibit 9). The public perception for drilling, fracking is increasing becoming negative, progressively more akin to coal mining.
Financing is increasingly becoming a major concern for oil and gas players. The European Investment Bank (EIB) recently announced plans to phase out its multibillion euro financing for fossil fuels within the next two years. The bank has said that it will end its financing of oil, gas and coal projects after 2021 and align all its future funding decisions with the Paris Climate Accord. Yielding to public / environmentalist pressure by one of the world’s largest public banks signals a tougher future for oil and gas projects (Exhibit 10).
The Speed and Trajectory of Energy Transitions Would Vary Depending on the Specific Geographies and Economic SectorsThough the world is and will continue to witness energy transitions and move towards a decarbonized future, the timeframe of these transitions and also the speed could vary sig-nificantly across regions / countries. The primary pillars driving these differences include:
• A disconnect between nationally determined contributions (NDCs) and current policies: Current policies will result in global warming by 3.1–3.7 degrees against 2.6–3.2 degrees due to NDCs. Governments can (and continue to explore further) move more quickly on climate-related decisions without adversely impacting economic growth.
EXHIBIT 9 | Environmental Advocates Have Galvanized Support for Renewables and Opposition to Oil & Gas
Source: Pew Global Attitudes and Trends; Gallup
US—SUPPORT FOR ENERGY SOURCES
89 83
45 43 42 41
-14
-52 -54 -53 -57
-50
-100
0
50
100
Solar power
% saying they favor or oppose more of:
-9
Wind power Offshore drilling Nuclear power Fracking Coal mining
Favor
Oppose

11 Energy Transitions: Adapting to the New Normal of the Changing World
• Varying levels access and affordability of technological advancement and speed of deployment of renewables, EVs and energy storage: The cost of renewables and battery storage has declined faster than expected, resulting in a market-led shift towards renewables in some countries. The timing, scope and impact of carbon capture and storage (CCS) technologies across different geographies will play an important role in making a viable case for EV and energy storage.
• Shift in consumers’ consumption habits towards technology adoption and sensitization towards climate change.
The NOCs and IOCs of the world are progressively taking holistic approach to identify and answer the key questions arising from higher stakeholder pressure to mitigate climate change and the increased uncertainty of the effects of energy transition on their businesses.
India’s Path to Energy TransitionsGovernment’s policies: India is striving to control the challenge of rising emissions, not only in terms of increasing pollutions levels but also in terms of contribution to the risks arising out of climate change. According to the Global Climate Risk Index released by the German-based think tank, Germanwatch, India is the 14th most climate change-affected country in the world.
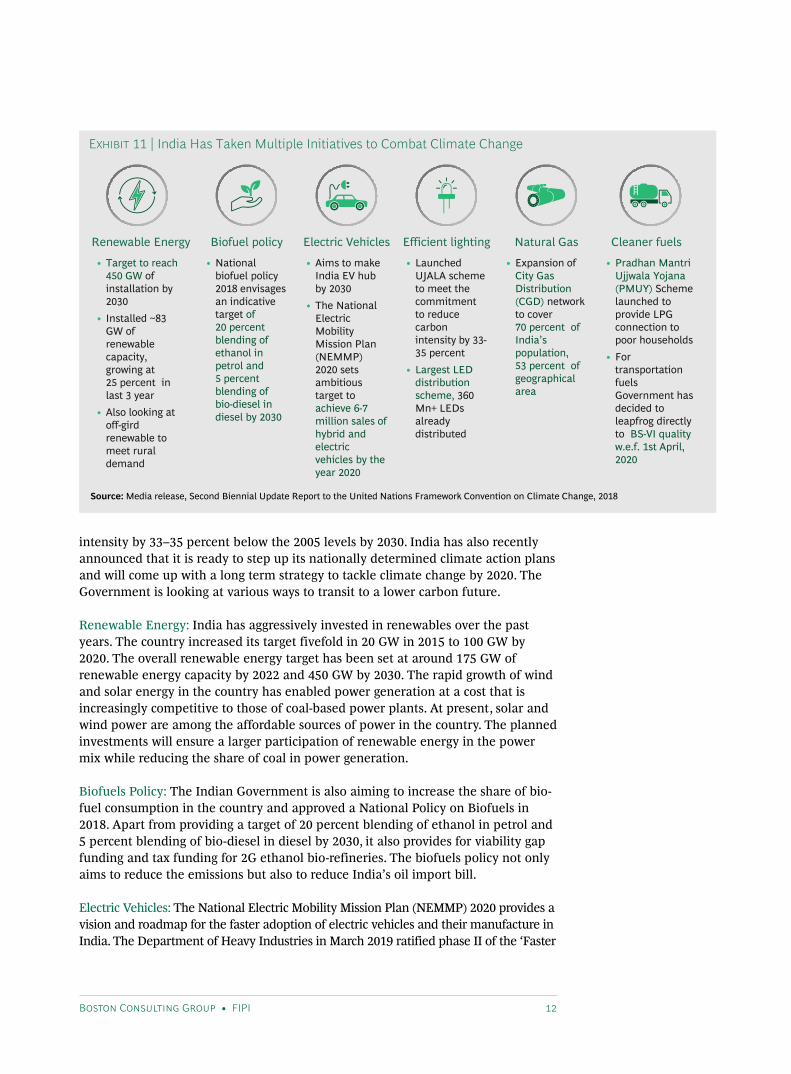
The Indian government has taken a multitude of steps (Exhibit 11) towards mitigat-ing these risks but a lot more remains to be done. India ratified the Paris agreement in 2016. One of the key commitments of the country is to reduce its GHG emissions
EXHIBIT 10 | Debt Financing Mainly at Risk Through Pressure on European & North American Banks
Source: Thomson One; BCG (CEI) analysis
2013-2018 OIL & GAS MAJORS
73
49
2114
0
50
100
Bonds
Debt issuance by lender type (%)
3
Loans
15 3
27
4
Development Banks
Other Investment Banks
Asia-Pacific Universal Banks
Asia-Pacific Investment Banks
Europe/N. Am. Universal Banks
Europe/N. Am. Investment Banks
Highest potential risk—target of divestment campaigners
Risk TBD—to date only project finance the subject of direct pressure
Low risk—minimal exposure to public divestment campaigns
DIVESTMENT RISK BY INVESTOR TYPE
Boston Consulting Group • FIPI 12
intensity by 33–35 percent below the 2005 levels by 2030. India has also recently announced that it is ready to step up its nationally determined climate action plans and will come up with a long term strategy to tackle climate change by 2020. The Government is looking at various ways to transit to a lower carbon future.
Renewable Energy: India has aggressively invested in renewables over the past years. The country increased its target fivefold in 20 GW in 2015 to 100 GW by 2020. The overall renewable energy target has been set at around 175 GW of renewable energy capacity by 2022 and 450 GW by 2030. The rapid growth of wind and solar energy in the country has enabled power generation at a cost that is increasingly competitive to those of coal-based power plants. At present, solar and wind power are among the affordable sources of power in the country. The planned investments will ensure a larger participation of renewable energy in the power mix while reducing the share of coal in power generation.
Biofuels Policy: The Indian Government is also aiming to increase the share of bio-fuel consumption in the country and approved a National Policy on Biofuels in 2018. Apart from providing a target of 20 percent blending of ethanol in petrol and 5 percent blending of bio-diesel in diesel by 2030, it also provides for viability gap funding and tax funding for 2G ethanol bio-refineries. The biofuels policy not only aims to reduce the emissions but also to reduce India’s oil import bill.
Electric Vehicles: The National Electric Mobility Mission Plan (NEMMP) 2020 provides a vision and roadmap for the faster adoption of electric vehicles and their manufacture in India. The Department of Heavy Industries in March 2019 ratified phase II of the ‘Faster
EXHIBIT 11 | India Has Taken Multiple Initiatives to Combat Climate Change
Source: Media release, Second Biennial Update Report to the United Nations Framework Convention on Climate Change, 2018
Renewable Energy
• Target to reach 450 GW of installation by 2030
• Installed ~83 GW of renewable capacity, growing at 25 percent in last 3 year
• Also looking at off-gird renewable to meet rural demand
Biofuel policy
• National biofuel policy 2018 envisages an indicative target of 20 percent blending of ethanol in petrol and 5 percent blending of bio-diesel in diesel by 2030
Electric Vehicles
• Aims to make India EV hub by 2030
• The National Electric Mobility Mission Plan (NEMMP) 2020 sets ambitious target to achieve 6-7 million sales of hybrid and electric vehicles by the year 2020
Efficient lighting
• Launched UJALA scheme to meet the commitment to reduce carbon intensity by 33-35 percent
• Largest LED distribution scheme, 360 Mn+ LEDs already distributed
Natural Gas
• Expansion of City Gas Distribution (CGD) network to cover70 percent of India’s population, 53 percent of geographical area
Cleaner fuels
• Pradhan MantriUjjwala Yojana(PMUY) Scheme launched to provide LPG connection to poor households
• For transportation fuels Government has decided to leapfrog directly to BS-VI quality w.e.f. 1st April, 2020
13 Energy Transitions: Adapting to the New Normal of the Changing World
Adoption and Manufacturing of (Hybrid &) Electric Vehicles in India’ (FAME India) with an outlay of Rs 10,000 crore for a period of three years commencing 1st April 2019. The scheme aims to encourage faster adoption of electric and hybrid vehicles by providing incentives on the purchase of vehicles and also building the requisite charging infrastructure. The government is also exploring / offering additional in-centives, such as:
• The rates of GST on electric vehicles has been kept in the lower bracket of 12 percent (with no cess) as against the 28 percent GST rate with cess up to 22 percent for conventional vehicles.
• The Ministry of Power has allowed the sale of electricity as a ‘service’ for the charging of electric vehicles.
• The Ministry of Road Transport and Highways issued a notification regarding the exemption of permits in case of battery operated vehicles.
• Deployment of 5000 electric buses by state transport departments / undertakings.
Efficient Lighting: In 2015-2016, the Government announced a program for the replacement of incandescent lamps with LED bulbs; this program was named UJALA (UnnatJyoti by Affordable LEDs for All) and is being implemented by Energy Efficiency Services Limited (EESL). As of November 2019, over 360 million LED bulbs have been distributed under the scheme with a total saving of Rs 18,742 crore per year and emission reduction of ~38 million tons of CO2 per year.
Natural Gas: India is targeting an increase in its share of natural gas to 15 percent by 2030. The Government has aggressively expanded the city gas distribution network in the country in the past two–three years, offering 136 new geographical areas in rounds 9 and 10 of bidding conducted in 2018-2019. Post round 10 of bidding, the Petroleum & Natural Gas Regulatory Board (PNGRB) has authorized 228 geographical areas, covering 70 percent of India’s population and 53 percent of its geographical area. The growth in piped natural gas and CNG over the coming years will drive the use of natural gas both in heating and transport.
Cleaner Fuels: In order to provide cleaner cooking fuel in rural India, the Government launched the Pradhan Mantri Ujjwala Yojana (PMUY) Scheme in 2016, which aims to provide free LPG connections to women from BPL (below poverty line) households. The scheme that earlier targeted 5 crore households by March 2019 was later expanded to 8 crore connections by March 2020. Laudably, the Government achieved its target in Sep-tember 2019 itself, seven months before schedule. The scheme has led to LPG coverage rising to about 95 percent of the population in 2019 from 55 percent in May 2014.
In addition, the Government also took steps to improve the emissions arising from key transport fuels. In 2016, the Government decided to leapfrog from BS-IV to BS-VI emission norms directly by April 2020.
The Indian government together with France also unveiled International Solar Alliance (ISA) in 2015. The alliance was created with a shared ambition to undertake joint efforts
Boston Consulting Group • FIPI 14
to reduce the cost of finance and the cost of technology, mobilize more than US$ 1000 billion of investments needed by 2030 for massive deployment of solar energy.
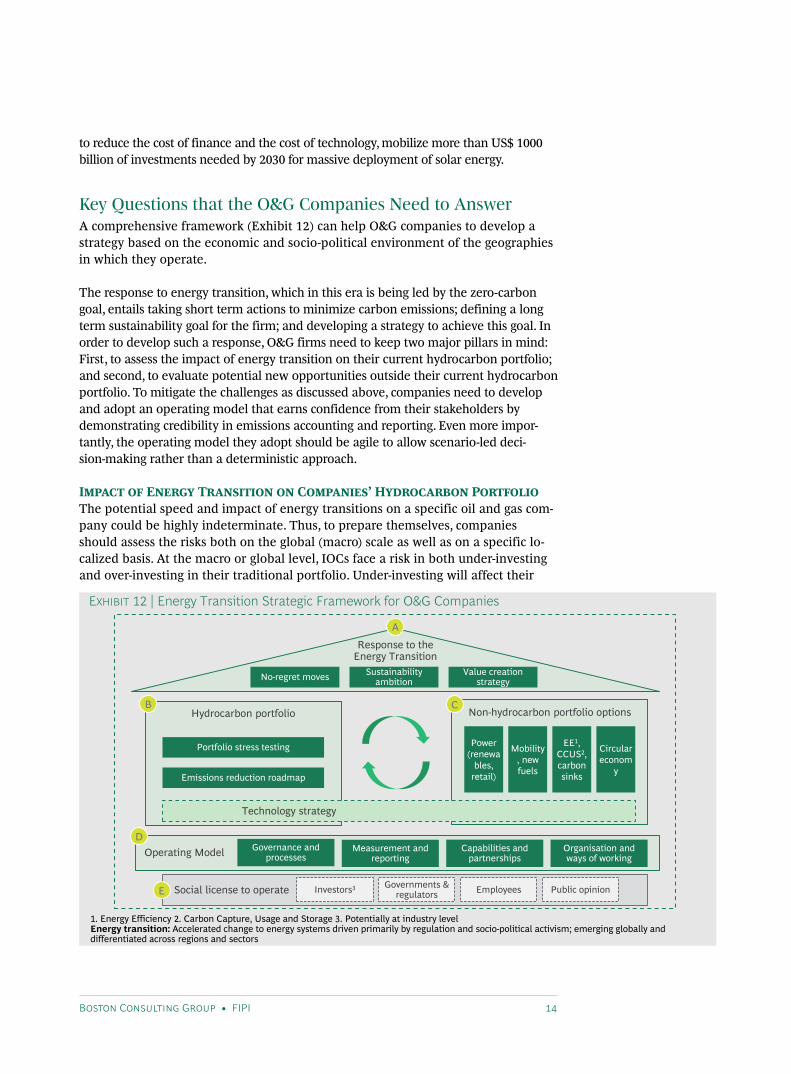
Key Questions that the O&G Companies Need to Answer A comprehensive framework (Exhibit 12) can help O&G companies to develop a strategy based on the economic and socio-political environment of the geographies in which they operate.
The response to energy transition, which in this era is being led by the zero-carbon goal, entails taking short term actions to minimize carbon emissions; defining a long term sustainability goal for the firm; and developing a strategy to achieve this goal. In order to develop such a response, O&G firms need to keep two major pillars in mind: First, to assess the impact of energy transition on their current hydrocarbon portfolio; and second, to evaluate potential new opportunities outside their current hydrocarbon portfolio. To mitigate the challenges as discussed above, companies need to develop and adopt an operating model that earns confidence from their stakeholders by demonstrating credibility in emissions accounting and reporting. Even more impor-tantly, the operating model they adopt should be agile to allow scenario-led deci-sion-making rather than a deterministic approach.
Impact of Energy Transition on Companies’ Hydrocarbon PortfolioThe potential speed and impact of energy transitions on a specific oil and gas com-pany could be highly indeterminate. Thus, to prepare themselves, companies should assess the risks both on the global (macro) scale as well as on a specific lo-calized basis. At the macro or global level, IOCs face a risk in both under-investing and over-investing in their traditional portfolio. Under-investing will affect their
EXHIBIT 12 | Energy Transition Strategic Framework for O&G Companies
1. Energy Efficiency 2. Carbon Capture, Usage and Storage 3. Potentially at industry levelEnergy transition: Accelerated change to energy systems driven primarily by regulation and socio-political activism; emerging globally and differentiated across regions and sectors
Response to the Energy Transition
Hydrocarbon portfolio Non-hydrocarbon portfolio options
Operating Model
Social license to operate
No-regret moves Value creation strategy
Portfolio stress testing
Emissions reduction roadmap
B C
D
Technology strategy
Sustainability ambition
Governments & regulators Public opinionInvestors3 Employees
Capabilities and partnerships
Organisation and ways of working
Governance and processes
Measurement and reporting
Power (renewa
bles, retail)
EE1, CCUS2, carbon sinks
Mobility, new fuels
Circular econom
y
A
E
15 Energy Transitions: Adapting to the New Normal of the Changing World
ability to meet future hydrocarbon demands; and over-investing may result in stranded assets. At a micro or localized level, companies could face differentiated exposure to localized energy transitions depending on their specific portfolios and the current state and trajectory of energy transition in that geography.
Localized energy transitions may prove to be faster paced and more diverse than global-scale changes. Energy transitions at this level will have can have a more di-rect impact on the business performance of companies, far ahead of any global or portfolio-wide impacts.
• The shift in US from coal to natural gas and renewable energy sources over the past years driven mainly by the shale gas revolution has significantly impacted the coal players in the country. The share of coal in US’ electricity generation fell from 45 percent in 2010 to ~24 percent in 2019. The rapidly shrinking coal industry in the country has forced five private coal companies to file bankrupt-cies in 2019.
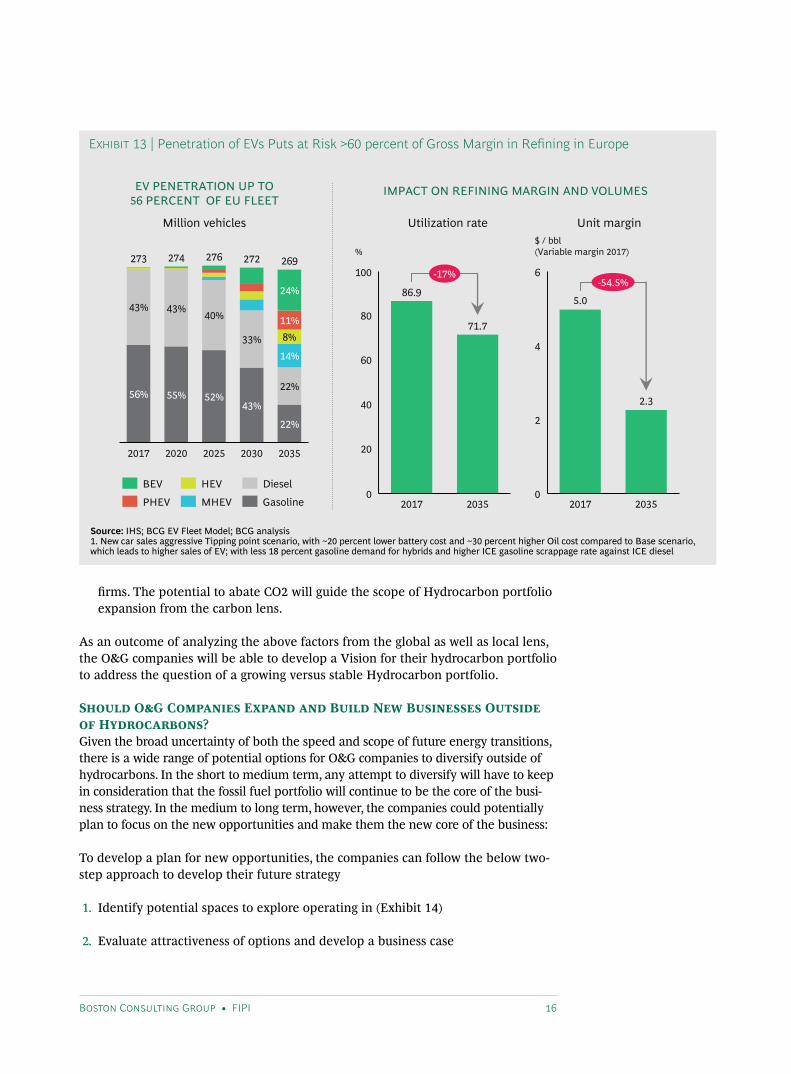
• Sales of electric vehicles in Norway has seen an unprecedented growth over the past years with EV accounting for ~55 percent of sales in first half of 2019 from 6 percent in 2013. The uptake of EV is expected to grow in other European nations too with EV penetration expected to increase to ~56 percent by 2035. The growth of EV is expected to lead to a 17 percent drop in utilization rates in refining assets and about 55 percent drop in the variable margins for the refiners (Exhibit 13).
In order to make their current hydrocarbon portfolio future-ready, companies need to assess the impact of energy transition on their hydrocarbon portfolio and develop a strategy, considering the following factors:
• Identify the measures taken to reduce CO2 emissions in past and the results that have been achieved from such efforts. This would indicate the efficiency of the actions taken and provide a reference point for such future initiatives.
• Set the Vision for scope 1, 2 and 3 targets, with an action plan, tracking in place and KPIs embedded in performance management. It is this vision that will set the pace of actions required to control emissions.
• Assess the potential to develop and replicate relevant technology solutions for CO2 abatement. For example, options such as carbon credit trading and affor-estation for small to mid-size companies while CCS opportunities for the larger
Should the companies expand and build new businesses outside of hydrocarbons
Impact of energy transition on
Hydrocarbon portfolio
How should companies respond to energy
transition
Boston Consulting Group • FIPI 16
firms. The potential to abate CO2 will guide the scope of Hydrocarbon portfolio expansion from the carbon lens.
As an outcome of analyzing the above factors from the global as well as local lens, the O&G companies will be able to develop a Vision for their hydrocarbon portfolio to address the question of a growing versus stable Hydrocarbon portfolio.
Should O&G Companies Expand and Build New Businesses Outside of Hydrocarbons?Given the broad uncertainty of both the speed and scope of future energy transitions, there is a wide range of potential options for O&G companies to diversify outside of hydrocarbons. In the short to medium term, any attempt to diversify will have to keep in consideration that the fossil fuel portfolio will continue to be the core of the busi-ness strategy. In the medium to long term, however, the companies could potentially plan to focus on the new opportunities and make them the new core of the business:
To develop a plan for new opportunities, the companies can follow the below two-step approach to develop their future strategy
1. Identify potential spaces to explore operating in (Exhibit 14)
2. Evaluate attractiveness of options and develop a business case
EXHIBIT 13 | Penetration of EVs Puts at Risk >60 percent of Gross Margin in Refining in Europe
Source: IHS; BCG EV Fleet Model; BCG analysis1. New car sales aggressive Tipping point scenario, with ~20 percent lower battery cost and ~30 percent higher Oil cost compared to Base scenario, which leads to higher sales of EV; with less 18 percent gasoline demand for hybrids and higher ICE gasoline scrappage rate against ICE diesel
IMPACT ON REFINING MARGIN AND VOLUMES
43%
56%
43%
2017
55% 52%
274
2020
276
40%
2025
33%
43%
273
8%
2030
24%
11%
22%
14%
22%
2035
272 269
BEV
PHEV MHEV
DieselHEV
Gasoline
Million vehicles Utilization rate Unit margin
0
80
20
60
40
100
2017
%
2035
86.9
71.7
-17%
5.0
2.3
0
2
4
6
2017
$ / bbl(Variable margin 2017)
2035
-54.5%
EV PENETRATION UP TO 56 PERCENT OF EU FLEET

17 Energy Transitions: Adapting to the New Normal of the Changing World
EXHIBIT 14 | Identify potential spaces to explore operating in
GLOBALMEGATRENDS
LOCAL GOVERNMENT PRIORITIES
EV Solar
ColdStorage
PE/ VCINVESTMENTS
ADJACENCIES INCOMPANY VALUE CHAIN
Solar EV SmartCars
EV charging at fuel stations
Wind ChargingStations
Fast Battery Charging
Lithium mining for coal mining companies
Source: BCG analysis
The key lenses to identify potential spaces to operate are: • Global Megatrends: The renewable energy sources such as solar, wind, biofuels
have gained massive momentum in the past two decades, globally. Such trends offer a relatively lower risk for long term investment. On the other hand there are trends such as consumerism and health consciousness which provide for diversification opportunities outside of oil and gas.
• Priorities of local governments: The governments of the geographies in which the companies explore to operate have priorities based on the country’s vision. In the Indian context, electric vehicles, electric charging stations, solar, storage technologies are some such examples. Such priorities provide attractive options locally, but come with the risks associated with changing governments.
• Investments from PE / VC firms: Smart cars, fast battery charging, artificial leaf are some examples that are attracting investments from global private equity and venture capital funds. These options provide a high risk high reward opportunity for investment
• Adjacencies with company’s existing value chain: Electric charging stations for oil marketing companies, Lithium mining for coal mining companies are some such examples of adjacent opportunities, which would be relatively easier to implement, once their business case is established.
The opportunities that the companies choose to explore would be a combination of the above options. A right mix of low risk long-term options and high-reward ex-ploratory investments would be the key for a successful venture outside the core hydrocarbon portfolio.

Boston Consulting Group • FIPI 18
The diversification options need to be classified at either adjacent or new frontier opportunities.
• Adjacent opportunities: These are adjacent to the company’s current value chain in terms of products, channel or customers. As the company has strong capability in the value chain, the key to success for these opportunities is the market attractiveness from the financial perspective and the company’s right to win mitigating the risks associated with the new venture.
• New frontier opportunities: The attractive options here would be those with high growth potential along with high materiality. The companies would require to build new capabilities to be able to succeed with these options.
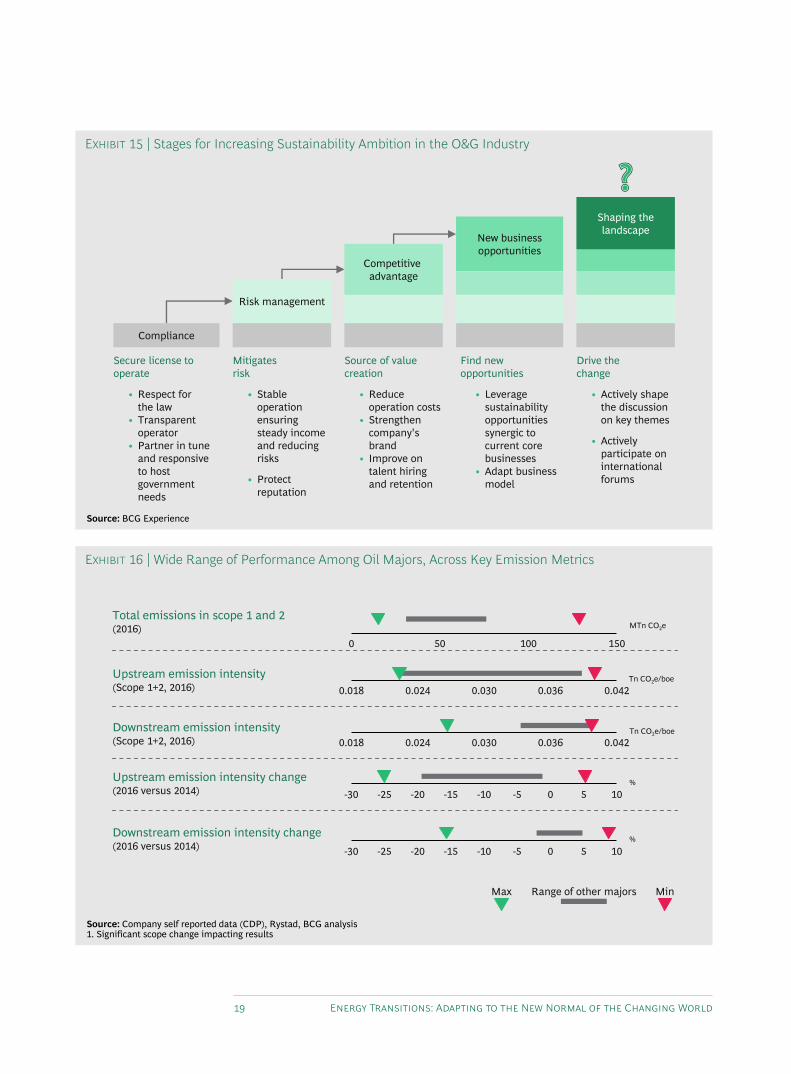
It will be critical that O&G companies see any diversification into new businesses in a long term context and in conjunction with the targets set and an ambition for high level sustainability (Exhibit 15). Setting an overall sustainability ambition and specific emissions targets will be a critical driver for determining the type and pace of diversification from hydrocarbons.
Responding to Energy Transition
Responding to energy transitions presents new types of operational challenges for oil and gas companies which will require new operating models, underpinned by governance and process, reporting / compliance, capability, and organizational enablers.
There are three key ways in which companies can respond to the energy transition:
1. O&G companies to assess ‘No regret’ moves: with the business portfolios based on hydrocarbons, the no-regret moves for the O&G companies are centered around taking quick steps to reduce emissions and be prepared for the short term policy changes. The key no-regret moves are:
ǟ Reduce own emissions through more efficient operations (Exhibit 16): As pressure mounts to demonstrate material emission reduction, industry participants have initiated a number of projects to reduce emissions. In 2016, IOCs launched over 100 projects2 to further reduce operations emissions by ~20 MtCO2, focusing on energy efficiency (25 percent), flaring reduction (21 percent), carbon capture (42 percent) and fugitive emissions reduction (12 percent). Thus, a positive business case can support many types of emission reduction measures. For example, an estimated two thirds of all oil, gas and methane emissions are estimated to have no net cost to eliminate.
ǟ Anticipate and plan for forthcoming regulatory requirements relating to climate change: Regardless of a sustainability ambition defined at the corporate level, O&G companies should enhance their risk mitigation and compliance processes in order to stay ahead of regulations, given the rapid pace of development. New capabilities will be required at diffirent levels for effective oversight, and will require boards and audit committees to commit to and manage climate risks and reporting.
19 Energy Transitions: Adapting to the New Normal of the Changing World
EXHIBIT 15 | Stages for Increasing Sustainability Ambition in the O&G Industry
Source: BCG Experience
Secure license to operate
• Respect for the law
• Transparent operator
• Partner in tune and responsive to host government needs
Mitigatesrisk
• Stable operation ensuring steady income and reducing risks
• Protect reputation
Source of value creation
• Reduce operation costs
• Strengthen company's brand
• Improve on talent hiring and retention
Find new opportunities
• Leverage sustainability opportunities synergic to current core businesses
• Adapt business model
Drive thechange
• Actively shape the discussion on key themes
• Actively participate on international forums
Shaping the landscape
Risk management
Competitive advantage
New business opportunities
Compliance
EXHIBIT 16 | Wide Range of Performance Among Oil Majors, Across Key Emission Metrics
Source: Company self reported data (CDP), Rystad, BCG analysis1. Significant scope change impacting results
Total emissions in scope 1 and 2(2016)
Upstream emission intensity(Scope 1+2, 2016)
Downstream emission intensity(Scope 1+2, 2016)
Upstream emission intensity change(2016 versus 2014)
Downstream emission intensity change(2016 versus 2014)
1500 50 100
0.0420.0300.018 0.0360.024
0.0360.018 0.0420.024 0.030
0-30 -25 -5-20 5-15 -10 10
-20-30 -25 -15 -10 -5 0 5 10
MTn CO2e
Tn CO2e/boe
Tn CO2e/boe
%
%
Max Range of other majors Min

Boston Consulting Group • FIPI 20
ǟ Seize opportunities where energy transitions create new prospects for oil and gas companies: Explore opportunities which benefits the industry directly; and new renewables technologies, the decreasing costs of which allow for integration into companies’ own operations, such as solar / wind applications in upstream operations.
2. Companies to define a clear ambition in relation to climate change: As the current energy transition is being led by concerns related to climate change, in order to maintain credibility, it is first necessary for the O&G companies to acknowledge the challenge presented by climate change, accept responsibility to address it, and demonstrate a commitment to act. Many companies have begun to articulate their positions on climate change, but not all have yet defined their position, nor are they consistent in asserting what their own responsibilities are.
Along with other industries, O&G companies are also facing rising pressure to provide a clear emissions target that can be tracked and enforced. In the US for example, near-ly half of all Fortune 500 companies have now committed to a public climate change emissions target.
However, when it comes to overall ambition on climate change, O&G companies are different from others—a case which must be articulated well to the public and in-vestors, for example, the indirect emissions (scope 3) from O&G companies is a function of not just the company’s own actions, but the overall response to climate change from consumers and society in general.
Thus when setting an overall target or climate change ambition, instead of treating the response as a compliance or risk management measure, companies should consider energy transitions and the implications of the same on their future portfolios. Once the companies define their long term emissions targets, then they need to define their long-term portfolio strategy.
3. Companies need to define their long term value strategy, and the role of the existing hydrocarbon portfolio in that strategy: There are broadly three scenari-os, from which companies can choose (or a combination amongst the three) to develop their long-term strategy:
The Green Scenario is led by high efficiency across thermal power plants and elec-tricity transmission & consumption, EV breakthrough, centralized wind and solar power generation and focused push from governments to limit CO2 emission. This scenario would result in a lower demand for hydrocarbons due to higher efficien-cies and also in a lower proportion of coal and oil in the energy mix. It would re-quire significant investments towards efficiency improvements across systems.
The Blue Scenario focusses on a gas based economy, from power generation to pet-rochemicals production to mobility to building heating and assumes some but mini-mal efficiency improvements. While the overall demand for hydrocarbons is higher than the Green scenario, coal and oil contributions are much lower due to focus on gas (less polluting).

21 Energy Transitions: Adapting to the New Normal of the Changing World
The Black Scenario assumes abundant coal and oil supply and limited efficiency improvements. It, however, considers strong government push on the CCS technolo-gy. Thus the higher demand for hydrocarbons, with traditional lower efficiencies is met with increasing coal and oil supply.
While in the context of the USA, a Blue-Green scenario might be more relevant due to access to huge amounts of gas and continuous technology advancement, in the Indian context, factors such as domestic availability of natural gas and coal com-pared to that of oil might drive adoption of EV in order to reduce the country’s im-port bill, even if EV might be carbon neutral to IC engines. On the other hand, lim-ited technology advancement in the short term might limit efficiency improvements and wide-scale renewable adoption.
Thus, even in the most aggressive ‘Green Scenario’, oil and gas will remain a large part of the energy mix for the next few decades. Thus, substantial value can be de-livered to investors by O&G companies, which may be at risk if companies prema-turely shift away from hydrocarbon production.
Equally though, companies must acknowledge that the growth rates in the oil and gas industry are increasingly uncertain and that risks are inevitable when maintain-ing an unchanged hydrocarbon portfolio.
As a result, companies will face increasing pressure to articulate what types of investment they are willing to make outside of their core hydrocarbon portfolio and a transition plan towards making those investments. To develop this strategy, companies need to define a target CO2 reduction potential, determine the feasibility and abatement costs associated with achieving the potential and plan for different energy demand scenarios.
Whatever path is ultimately chosen for a portfolio to be credible, it is critical that it be clearly articulated and linked to tangible actions (both near and longer term) leading to increasing shareholder value.
Conclusion:
The global energy system are transforming and this transition is being triggered by the need to move towards a decarbonized world. There is a significant pressure
from almost all stakeholders of the global ecosystem on governments of the world to take strict actions against carbon emissions and move to a cleaner energy future.
The technology advancements have led to significant growth of new energy sources with solar and wind increasingly playing an important role in the world energy mix. The sharp fall in battery prices are making electric vehicles cost comparable to in-ternal combustion engines making total electrification of transport sector a reality in future. As cleaner technologies become cost competitive, this transition, in con-trast to the ones in history, may involve displacing the fossil fuels demand with cleaner energy sources, as countries look to lower their carbon emissions.
The actual impact of these transitions on the oil and gas companies will depend

Boston Consulting Group • FIPI 22
upon rate at which these transition happen. At a gradual pace, as the world energy demand continues to increase, oil and gas will remain a key source of energy until at least 2050 with limited challenges for the oil and gas players. However, if we witness rapid transitions, though oil and gas will still continue to play a role in the global energy mix, it is likely to see significant displacement of demand from key sectors like transport and power and thus facing significant challenges.
However, in both the scenarios, there is an increasing need for the sector to find solutions to reduce / capture the CO2 emitted from oil and gas in order to ensure that their social license to operate is not challenged. It is critical for the sector to invest in technology, digital solutions, and clean tech advancements in order to ensure that they can move their portfolio towards net zero emissions.
The companies also need to stress test their portfolio continuously in line with the speed of transition in order to ensure profitability of operations. It is imperative that oil and gas companies continue to support the innovations that could drive these transitions and remain invested in the future energy systems. The oil and gas companies have both the financial capability and the breadth in their operations to lead any major energy transition in the future.
Notes
1. The Two Prime Movers of Globalization by Vaclav Smil,.2. IEA NPS, SDS scenarios; CDP data

23 Energy Transitions: Adapting to the New Normal of the Changing World
About the AuthorsKaustav Mukherjee is a Managing Director and Senior Partners based out of the New Delhi of-fice. He leads BCG’s India Energy practice with diverse experience in Oil & Gas, Power, Utilities and Process industries
Anirban Mukherjee is a Managing Director and Partner based out of the New Delhi office. He has worked extensively in Oil and Gas space and is helping global companies to prepare better for transitions in Energy
Kaustubh Verma is a Partner based out of the New Delhi office. He is a core member of Energy practice with vast experience in strategy and operations in oil and gas, chemical and petchem space
Sonal Tripathy leads the knowledge team for BCG India energy practice. She has worked extensively with various global oil and gas companies on key strategy topics
Akash Govil is a senior associate and has worked extensively with the downstream industry across the globe on key operational and strategic issues
AcknowledgmentsA special thanks to Bhumika Gupta and Jasmin Pithawala for managing the marketing process along with Jamshed Daruwalla, Pradeep Hire, Seshachalam Marella and Rajan Vasu for their editing, design and production support for this report.
For Further ContactIf you would like to discuss the themes and content of this report, please contact
Kaustav Mukerjee Senior Partner and Managing Director BCG New Delhi +91 124 459 7256 [email protected]
Anirban Mukherjee Partner and Managing Director BCG New Delhi +91 124 459 7408 [email protected]
Kaustubh Verma Partner BCG New Delhi +91 124 459 7030 [email protected]

For information or permission to reprint, please contact BCG at [email protected].
To find the latest BCG content and register to receive e-alerts on this topic or others, please visit bcg.com. Follow Boston Consulting Group on Facebook and Twitter.
© Boston Consulting Group 2019. All rights reserved.12/19