energy ocean 2008 -...
TRANSCRIPT
George W. Taylor
Energy Ocean 2008Galveston, TexasJune 24 - 26, 2008
Ocean Power Technologies, Ltd.Warwick Innovation Centre, Warwick Technology Park, Gallows Hill, WarwickshireCV346UWU.K.
Ocean Power Technologies, Inc. 1590 Reed RoadPennington, NJ 08543USAPhone: 609-730-0400Fax: 609-730-0404www.oceanpowertechnologies.com
2
Forward-Looking Statements
In addition to historical information, this presentation contains forward-looking statements that are based on assumptions made by management regarding future circumstances over which the company may have little or no control and involve risks, uncertainties and other factors that may cause actual results to be materially different from any future results expressed or implied by such forward-looking statements. These factors include, among others, the following: future financial performance indicating expected cash flow, the ability to reduce costs and improve operational efficiencies, revenue growth and increased sales volume, or success in key markets, our ability to enter into relationships with partners and other third parties, delivery and deployment of PowerBuoys®, increasing the power output of our PowerBuoys and hiring new key employees and expected costs of our PowerBuoy product, and building strong long-lasting customer relationships. Many of these risks are discussed in our recent filings with the Securities and Exchange Commission.

3
OPT Wave Power Station

4
View of OPT Wave Power Station from Shore

5
PowerBuoy Schematic

6
PowerBuoy In Operation

7
Individual PowerBuoy and Undersea Substation
Float
Spar
Under Sea Sub
Station
Cables from other
PowerBuoys
Sea FloorCable to Shore

8
Ocean-tested and proprietary technology – 37 Patents issued
World-class customer and partner relationships
Attractive economics versus other renewable energy technologies
Rapid commercialization under way with a defined growth plan
Experienced management team with strong execution track record
$130 million (net) raised with listings on Nasdaq and London’s AIM market
Very strong cash position
O.P.T.: Leading Wave Power Story
Ocean waves are the ultimate renewable energy source
9
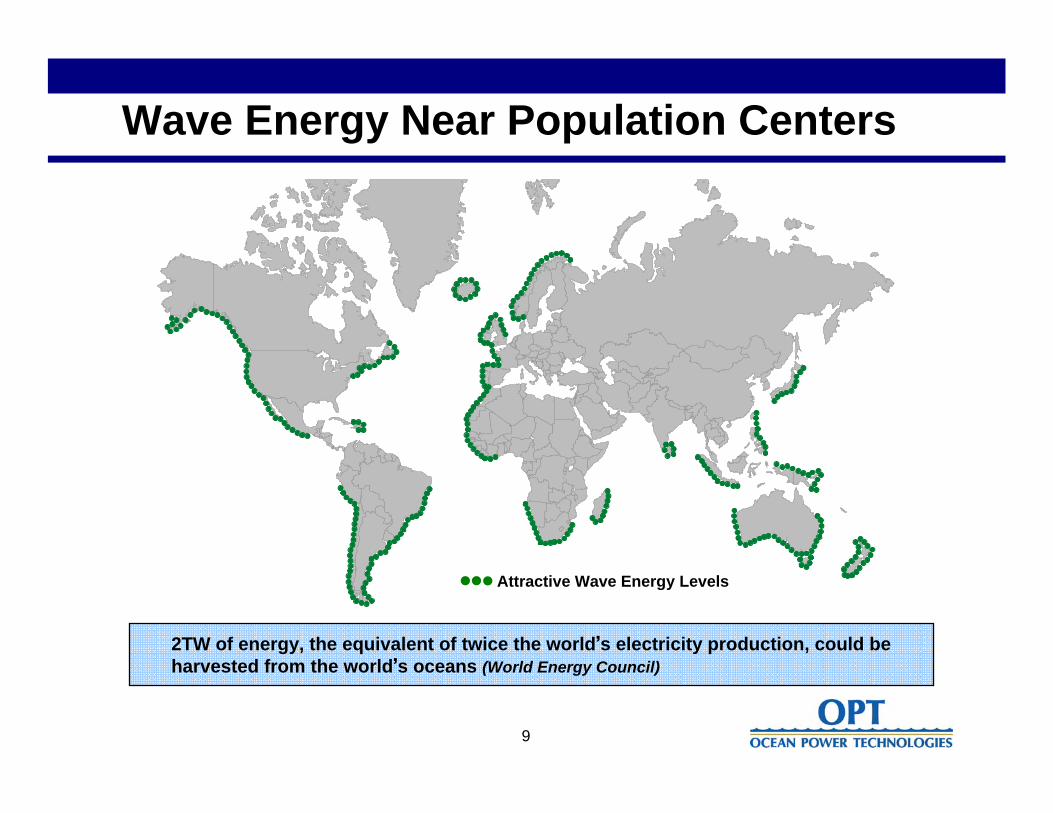
Wave Energy Near Population Centers
2TW of energy, the equivalent of twice the world’s electricity production, could be harvested from the world’s oceans (World Energy Council)
Attractive Wave Energy Levels
10
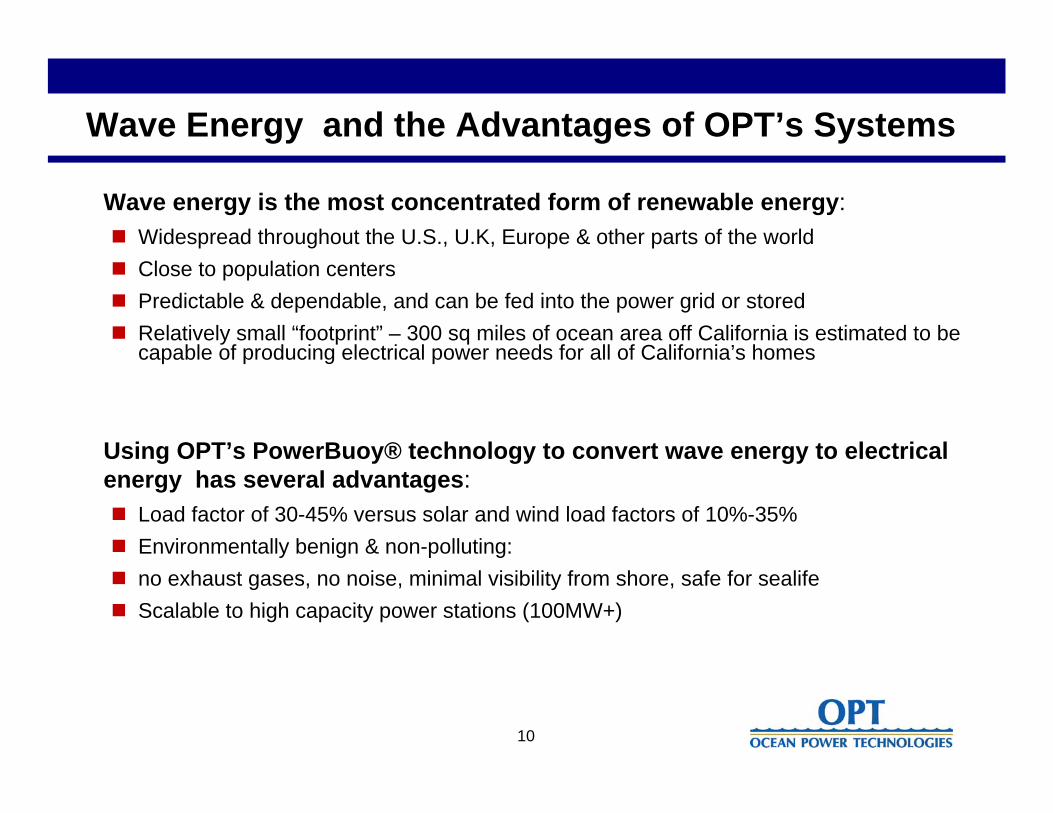
Wave Energy and the Advantages of OPT’s Systems
Wave energy is the most concentrated form of renewable energy:Widespread throughout the U.S., U.K, Europe & other parts of the worldClose to population centersPredictable & dependable, and can be fed into the power grid or storedRelatively small “footprint” – 300 sq miles of ocean area off California is estimated to be capable of producing electrical power needs for all of California’s homes
Using OPT’s PowerBuoy® technology to convert wave energy to electrical energy has several advantages:
Load factor of 30-45% versus solar and wind load factors of 10%-35%Environmentally benign & non-polluting: no exhaust gases, no noise, minimal visibility from shore, safe for sealifeScalable to high capacity power stations (100MW+)

11
Profile of PowerBuoy System
PB40Currently
in Production
PB1502007
PB5002010
(Drawn to scale)

12
PowerBuoy system is based on ocean-going buoys, and is primarily below the ocean
surface
Extensive in-ocean experience, including successfully withstanding hurricanes and
winter storms
Electronic “tuning” capability to optimize power output in changing wave conditions
Certified grid connection system
Independent environmental assessment resulted in “Finding of No Significant Impact”
Strong partners (Iberdrola, Total, Scottish Government, US Navy, PNGC Power)
Strong capital base
Competitive Advantages

13
Survivability
Operating range 1.5 to 7m
Automatically detunes between 4 to 7m
Automatically locks up for storm and hurricane wave conditions above 7m
Automatically unlocks when waves less than 7m
Designed to survive 100 year storm wave conditions
– 24m - Orkney Islands, Scotland
– 20m - Bay of Biscay, Spain
– 18m - Oregon and Cornwall
– 16m - MCBH Hawaii
Lloyds has provided OPT, since 1999, commercial insurance for loss or liability for PowerBuoys operating in Atlantic and Pacific
Demonstrated survivability in two separate hurricanes

14
Streamlined Manufacturing and DeploymentOutsourced buoy structure → Electrical integration and testing → Component integration + quality control
MA
NU
FAC
TUR
ING
DEP
LOYM
ENT
Buoy leaves facility → towed horizontally to site → deployment complete

15
Multiple Market Opportunities
Desalinization
Water Treatment
Aquaculture
Off-Shore PlatformsHomeland Security
Oceanography
Tax Credit Monetization
Green Tags, Renewable Obligation Certificates, Carbon Credits
Large Primary Market for Utility PowerBuoys
Other Application Driven Markets for Utility and Autonomous PowerBuoys
Regulatory Incentives for PowerBuoy Systems
Hydrogen Production
Grid-Connected Power Stations for Utilities and IPPs - $150 Billion worldwide market

16
OPT Competitive with Other Energy Sources Renewables Fossil Fuel
OPT Wave
Powerd Solar Wind Natural Gas Coal
Capital Cost per MW a $1.8 – 3.9mm c $2.5 – 4.5mm $1.7 – 2.3mm $0.6 – 1.0mm $1.5 – 2.0mm
Energy Cost Per kWh a 5-15¢ 10-25¢ 6.5-9¢ 4.0-7.0¢ 4.0-7.0¢
(a) International Energy Agency, Projected Costs of Generating Electricity 2005. Wind low-high range reflects on-shore and off-shore generation(b) Company estimated number of buoys produced per year to achieve indicated energy cost(c) Company estimated sales price per MegaWatt for large-volume production of PB 150 and PB 500(d) Company estimates
Production Levels b
PB 150 $3.9mm / 15¢ 400 buoys/yr
PB 500 $1.8mm / 5¢ 300 buoys/yr
OPT PowerBuoy:

17
Global Contracts
ScotlandScottish Executive
Orkney Islands, Scotland
Phase: DevelopmentCapacity: 0.15-2MW
PB150
Phase: DemonstrationCapacity: 0.1-1MW
PB40
US NavyMarine Corps Base
Oahu, Hawaii
OregonIPP
Reedsport, OR
Phase: Permit FiledCapacity: 2-50MW
PB 150
WashingtonLockheed Martin
Gray’s Harbor, WA
Phase: CompleteCapacity: 1kW
PB1
Phase: DemonstrationCapacity: 40kW
PB40
State of New JerseyAtlantic City, NJ
Phase: DevelopmentCapacity: 2-5MW
PB150
FranceTotal and IberdrolaWest Coast France
Phase: ConstructionCapacity: 1.4MWPB40 & PB150
SpainIberdrola and Total
Santona, Spain
EnglandIPP
Cornwall, UK
Phase: DevelopmentCapacity: 5MW
PB150

18
Ongoing Marketing Initiatives
Australasia20-35 MW
Japan1-5 MW
Europe30-140 MWNorth America
30-150 MW
Commercialization Ramp-UpSpain: Iberdrola (PB40 and PB150’s) Orkney Islands, Scotland: Scottish Government (PB150)
Reedsport, Oregon: FERC Application for 50 MW’s (PB150’s) Hawaii: US Navy (PB40’s)
Coos Bay, Oregon: FERC Application for 100 MW’s (PB500’s) Cornwall Wave Hub, United Kingdom: British Government (PB150)
18
19
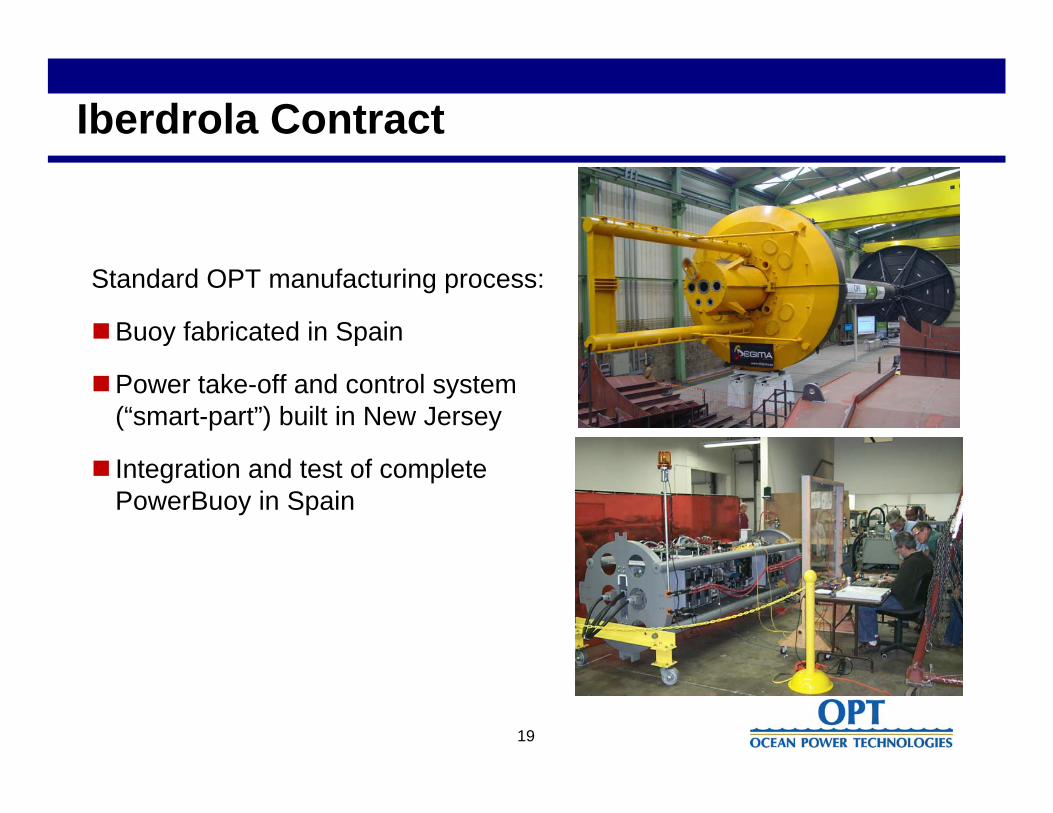
Iberdrola Contract
Standard OPT manufacturing process:
Buoy fabricated in Spain
Power take-off and control system (“smart-part”) built in New Jersey
Integration and test of complete PowerBuoy in Spain
20
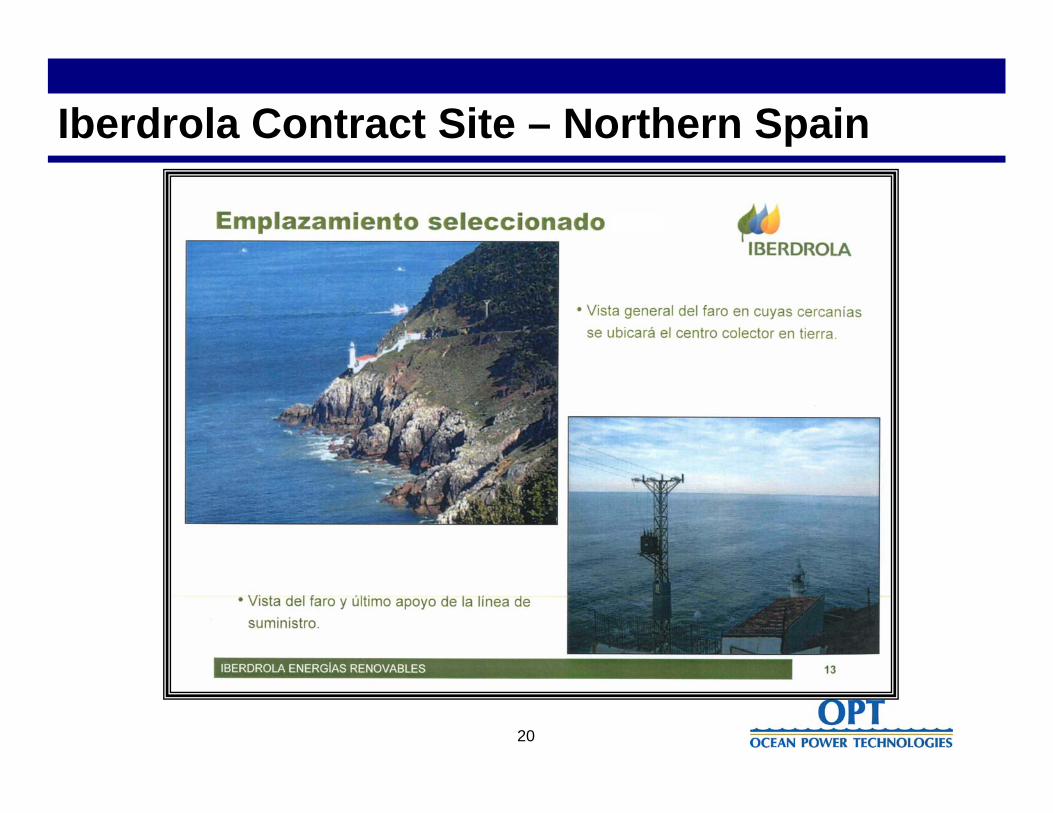
Iberdrola Contract Site – Northern Spain

21
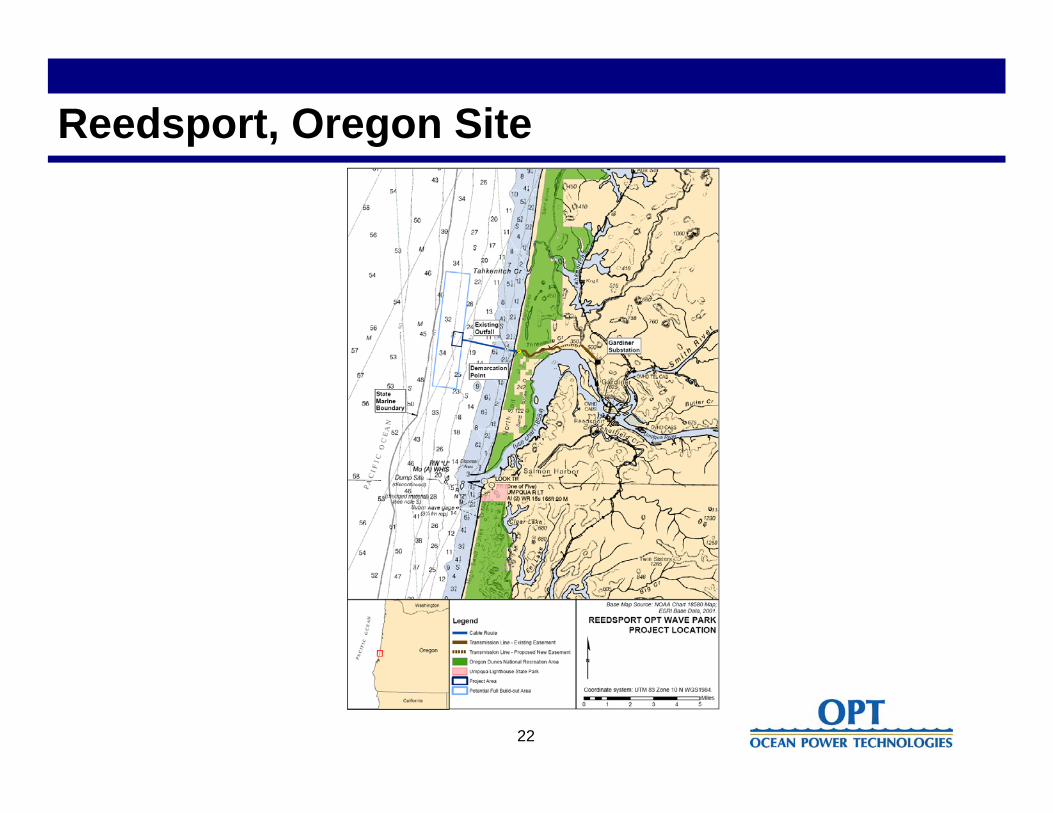
Oregon ProjectsIntegrated coastal strategy to develop a wave industry by licensing 250 MW’s of Wave Parks from FERC at three sites
Reedsport
• Initially 2M using PB150’s
• Future build out to 50 MW
Coos Bay
• 100 MW using PB500’s
Newport
• 100 MW using PB500’s
Financing
• Business Energy Tax Credit (BETC)
• Renewable Energy Credits (REC’s)
• Tariffs under discussion
22
Reedsport, Oregon Site

23
OPT is the first wave power company to have:
Achieved over 40 months of in-ocean testing
Entered into a commercial contract with a utility
Received an Operations and Maintenance contract with a utility
Listed its shares on two public markets (LSE’s AIM and Nasdaq)
Sold rights associated with the generation of carbon emissions credits
Opened US utility markets with FERC permit applications for a total of 270MW in Oregon and
California at four separate sites
Certified grid connection system
Independent environmental assessment resulting in “Finding of No Significant Impact”
PIONEER ACHIEVEMENTS
EnergyOcean 2008 presentation_June 08.ppt