sidoti & company -...
TRANSCRIPT

Sidoti
& Company Emerging Growth Conference March 24, 2009

2 ©2009 Veeco Instruments Inc 020909 Investor Slides
Veeco Business SnapshotVeeco Business Snapshot
LED & SolarProcess Equipment
Data StorageProcess Equipment Metrology
Core Technologies
MOCVD, MBE,CIGS Sources, CIGS Web Coaters
Ion Beam Etch & Deposition,
DLC, PVD, CVD,Saws & Lappers
Atomic Force Microscopes,
Stylus & Optical Profilers
2008 Revenue $166M $149M $128M
Veeco Market Position #1 or #2 #1 equipment supplier
for TFMH manufacturing
#1 or #2 -
large share in
all products
Multi-YearEnd Market Growth Rate*
20% LED
50% Solar5% 3-10%
*Sources: Strategies Unlimited, Canaccord, IDC, SDI, NSF, Veeco Estimates

3 ©2009 Veeco Instruments Inc 020909 Investor Slides
2008 Financial Results2008 Financial Results
Revenue up 10% to $443M
OPEX flat
EBITA increased 163% from $11M to $28M
Significantly improved balance sheet: generated cash and paid down debt
Met Street guidance every quarter
LED & Solar$166M
37% of Total43% Growth Rate
Data Storage $149M
34% of Total10% Growth Rate
Metrology$128M
29% of Total-15% Growth Rate
LED & Solar Becomes Largest Veeco Business in 2008

4 ©2009 Veeco Instruments Inc 020909 Investor Slides
2008: Refocused Company and Drove Improved Performance 2008: Refocused Company and Drove Improved Performance
Increased growth & profit in “green” equipment business (LED & Solar)–
Secured key new customers for MOCVD with K465 –
Realigned R&D spend: LED & Solar up 38%–
Grew “Solar”
revenues to >$40M in 2008 (CIGS and CPV)
Realigned Data Storage Business–
Consolidated overhead and locations; increased outsourcing–
Remained aligned with customers on key technology requirements
Refocused Metrology business with new leadership to execute operational turnaround
Strengthened organization and increased effectiveness across theCompany–
Better product development programs –
Improved manufacturing efficiency: supply chain management, outsourcing initiatives
–
Strengthened sales channel
5 ©2009 Veeco Instruments Inc 020909 Investor Slides
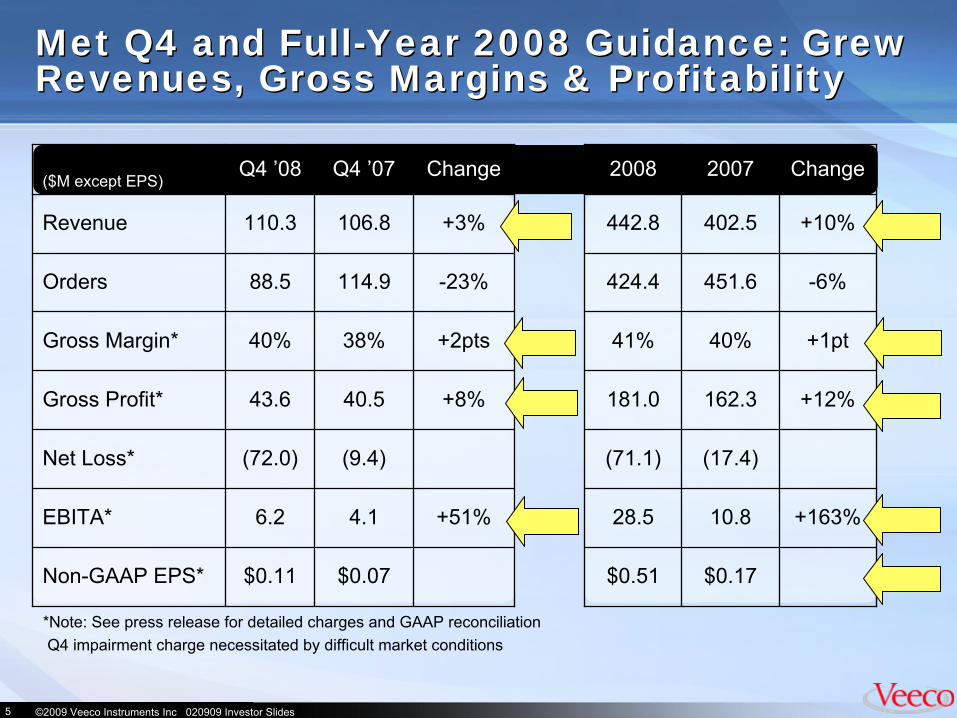
Met Q4 and Full-Year 2008 Guidance: Grew Revenues, Gross Margins & Profitability Met Q4 and Full-Year 2008 Guidance: Grew Revenues, Gross Margins & Profitability
*Note: See press release for detailed charges and GAAP reconciliationQ4 impairment charge necessitated by difficult market conditions
($M except EPS)Q4 ’08 Q4 ’07 Change 2008 2007 Change
Revenue 110.3 106.8 +3% 442.8 402.5 +10%
Orders 88.5 114.9 -23% 424.4 451.6 -6%
Gross Margin* 40% 38% +2pts 41% 40% +1pt
Gross Profit* 43.6 40.5 +8% 181.0 162.3 +12%
Net Loss* (72.0) (9.4) (71.1) (17.4)
EBITA* 6.2 4.1 +51% 28.5 10.8 +163%
Non-GAAP EPS* $0.11 $0.07 $0.51 $0.17

6 ©2009 Veeco Instruments Inc 020909 Investor Slides
Market Conditions WeakenMarket Conditions Weaken
End Market Conditions:–
LED & Solar: Q4 bookings better than expected…$44M included multi-system orders for LED & Solar…but outlook weak for new orders
–
Data Storage: customers have frozen CAPEX; Q4 bookings of $14M included no system orders…some “technology buy”
opportunities exist
–
Metrology: Relatively stable environment for industrial and research market products, Q4 bookings flat at $31M…
weak conditions continue in data storage and semiconductor
LED & Data Storage customers push-out $30M of revenue from Q109…nearly half of $147M backlog currently forecasted for 2H09 revenue
Q1 Guidance:–
Q109 Orders expected to be weaker than Q408–
Q109 Revenue Guidance: $60-70M–
non-GAAP EPS ($0.25)-($0.17)
Restructuring program implemented to significantly lower Company breakeven

7 ©2009 Veeco Instruments Inc 020909 Investor Slides
Significantly Improved Balance Sheet in 2008 Significantly Improved Balance Sheet in 2008
Retired $25M notes due 12/08
Repurchased $12.2M due 4/12 at very favorable pricing
Q2 acquisition of Mill Lane, initial purchase price $11M
Generated significant cash in 2008 - $19M free cash flow in Q4 alone
Cash balance at year-end $104M…net debt now $5M
Currently anticipate positive generation of cash in 2009
Balance of 12/31220
200
143
10596
5326
50
50
100
150
200
250
2005 2006 2007 2008
($M
)
Convertible Debt Net Debt

Restructuring Plan
9 ©2009 Veeco Instruments Inc 020909 Investor Slides
Restructuring Goal: To Emerge from Downturn in a Position of Strength Restructuring Goal: To Emerge from Downturn in a Position of Strength
Increased Variable Cost percentage for better performance through industry cycles
Simplified organizational structure and lower company breakeven point
An improved balance sheet
Excellent customer connectivity and relationships
Aligned to customers’ technology roadmaps–
Driving R&D spend toward high growth markets–
Leading market positions in our core technologies
TARGETED POSITION FOR MARKET RECOVERY

10 ©2009 Veeco Instruments Inc 020909 Investor Slides
Restructuring Program To Lower Quarterly Breakeven to $80M Goal to Return to EBITA Profitability by Q409
Restructuring Program To Lower Quarterly Breakeven to $80M Goal to Return to EBITA Profitability by Q409
26% reduction in force (340 employees) – 70% complete by end Q1’09–
1318 employees as of 9/30/08–
Remainder of impacted employees will exit Veeco by 12/31/09 aligned with manufacturing transitions
–
End of year headcount targeted <1,000
Centralized supply chain and operational organizations (began ’08)…qualified key APAC critical component vendors…driving material cost reductions
Reduce manufacturing sites from 8 to 4 by end 2009–
Product development/R&D groups remain for core technologies
Increase outsourcing: lower expenses & improve variable cost structure–
2008 progress begins to pay-off: by end of 2009 >80% of Veeco’s PE systems will be outsourced
MOVE TO AN ORGANIZATIONAL STRUCTURE THAT ENABLES NEAR-TERM RETURN TO PROFITABILITY AND 15% EBITA AFTER MARKET RECOVERY

11 ©2009 Veeco Instruments Inc 020909 Investor Slides
Decrease number of individual Veeco business units (cuts G&A)
2009 Compensation Changes:–
Executive pay cuts–
Decreased Board of Director compensation–
Employee wage freezes
Significantly cut discretionary spending: travel, IT,Telecom, operating supplies, MarCom, etc.
Restructuring results annualized savings of >$36M: –
Approximately $20M reduction in manufacturing labor and overhead
and service costs which are included in cost of goods sold
–
$16M reduction in operating spending
MOVE TO AN ORGANIZATIONAL STRUCTURE THAT ENABLES NEAR-TERM RETURN TO PROFITABILITY AND 15% EBITA AFTER MARKET RECOVERY
Restructuring Program ContinuedRestructuring Program Continued
12 ©2009 Veeco Instruments Inc 020909 Investor Slides
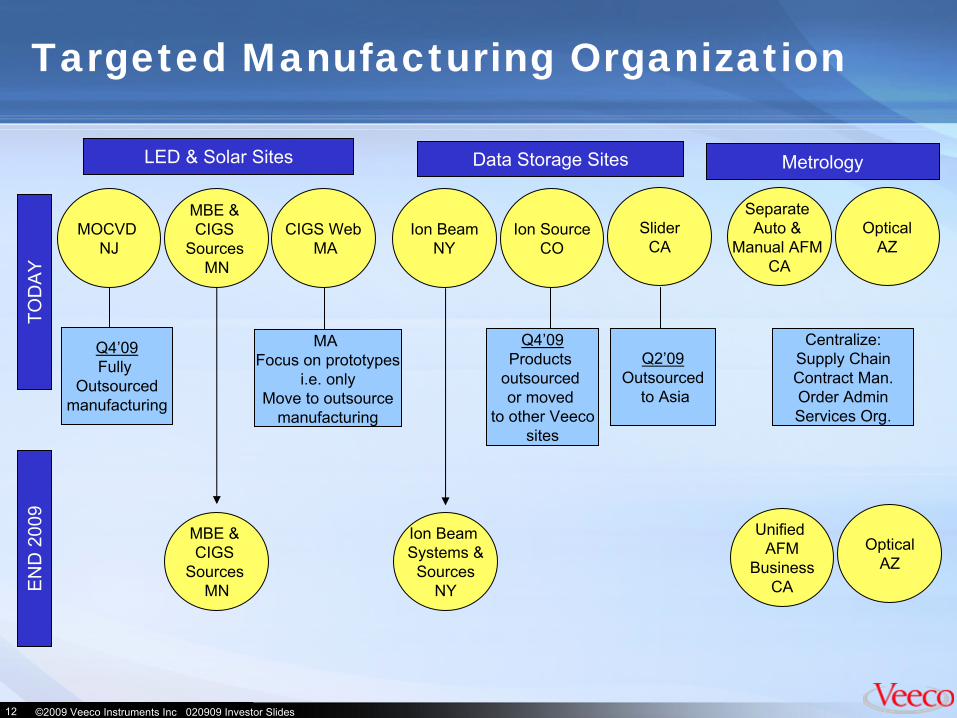
Targeted Manufacturing Organization
OpticalAZ
Separate Auto &
Manual AFM CA
SliderCA
Ion SourceCO
Ion BeamNY
CIGS WebMA
MBE & CIGS
Sources MN
MOCVD NJ
MBE & CIGS
Sources MN
MA Focus on prototypes
i.e. onlyMove to outsource
manufacturing
Q4’09Fully
Outsourcedmanufacturing
Q4’09Products
outsourced or moved
to other Veecosites
Q2’09Outsourced
to Asia
Centralize:Supply ChainContract Man.Order AdminServices Org.
Ion Beam Systems &
SourcesNY
OpticalAZ
Unified AFM
BusinessCA
LED & Solar Sites Data Storage Sites Metrology
TOD
AY
EN
D 2
009

13 ©2009 Veeco Instruments Inc 020909 Investor Slides
Restructuring Program Drives Lower Breakeven in 2009 Restructuring Program Drives Lower Breakeven in 2009
Q4 ’08 Q1 ’09 “Trough” Breakeven Quarter
“Modest Recovery”
Quarter
“End Market Recovery”
Model
Revenue $110M $60-70M $80M $90-100M $110-120M
GM 39.5% 33-36% 41-42% 43-44% 45-46%
Operating Spending $37M $33-34M $34-35M $35-36M $35-36M
EBITA%* 6% (10) –
(20)% 0-1% 6-7% 15-17%*
*Note: Beginning in Q1’09 EBITA calculation will exclude equity-based compensation. Q4 08 EBITA exclusive of equity based compensation is 7%.

14 ©2009 Veeco Instruments Inc 020909 Investor Slides
Aligning Veeco R&D to High Growth Market Opportunities Aligning Veeco R&D to High Growth Market Opportunities
20%20%16%
44% 44%
23%
7%
26%
0%
10%
20%
30%
40%
50%
Hard Disk Drives Semiconductor Chips Research & Industrial Market LED & Solar Devices
Actual R&D Spending % by Mkt '07 Forecasted R&D Spending % by Mkt '09
Approx. End Market 5% 5% 3-10% LED 20% Solar 50% Growth Rate
MAINTAIN COMMITMENT TO CUSTOMER ROADMAPSIN ALL MARKETS
More than doubling R&Din LED & Solar

Growth Opportunities

LED & Solar

17 ©2009 Veeco Instruments Inc 020909 Investor Slides
HB-LED Growth OpportunityHB-LED Growth Opportunity
Strategies Unlimited LED Growth Forecast
2,000
4,000
6,000
8,000
10,000
12,000
020122007 2008 2009 2010 2011
$B
other illumination signals automotive
signs & displays other mobile mobile phones
Veeco is #2 supplier of MOCVD for HB-LEDs
–
Significant in-roads in penetrating key customers in ‘08
Despite current overcapacity…remain optimistic about MOCVD TAM and end market applications:–
$250M 2007–
$500M 2011*
Customers are investigating transition to larger wafer size
*internal forecasts
>40%
Displays for outdoor apps, LCD-TV & Architectural growing >40%
20% CAGR

18 ©2009 Veeco Instruments Inc 020909 Investor Slides
LED Market Segmentation & Trends LED Market Segmentation & Trends
Standard LED(<0.1W)
High Current – HB LED
(0.1W to 1W)
High Power – UHB LED
(1W to 10W)Market GrowthCAGR (’07-’11)
0% -
5% > 10% > 40%
Main Applications Keypad lightingTraffic SignalsMobile Devices
Laptop BLUSigns/DisplaysOther Mobile
General LightingAutomotiveSign/Displays
Key Challenge for Customers
Low cost devicesHigh Volume
UniformityBrightnessLowest CoO
Brightness is kingUniformityLowest CoO
Customer Types Cost PlayersChina, CMLT, Tier
2 customers in Taiwan & China
Mass Production Tier 1, AUO,
Semco, LG, Epistar
Technology PlayersTier 1 – Lumileds,
Osram, SDK, TG, Nichia, Cree, Semco
Chip Size < 0.2mm2 0.2mm2
to 0.5mm2 0.5mm2
to 1.0mm2
Wafer Size Trend 2” 2”
→ 4” 2”
→ 4”
→ 6”
Source: Veeco/Strategies Unlimited

19 ©2009 Veeco Instruments Inc 020909 Investor Slides
Lowering LED Customer Cost/WaferLowering LED Customer Cost/Wafer
Three focus areas to increase yield and lower cost/wafer:
–
Improve binning through uniformity improvements
–
Increase productivity to reduce CoO
–
Reduce source consumption
Veeco MOCVD enables seamless transition to larger wafer sizes
Working closely with several strategic accounts to gain share
0.00
0.01
0.02
0.03
0.04
0.05
0.06
0.07
0.08
0.09
0.10
0.11
0.12
0.13
452 454 456 458 460 462 464 466 468
K465 GaNK465 GaN
K300 GaNK300 GaN
Bin 1 Bin 2 Bin 3 Bin 4 Bin 5
$0.01 $0.03 $0.07 $0.03 $0.01

20 ©2009 Veeco Instruments Inc 020909 Investor Slides
MOCVD for Concentrator (CPV) Solar Cells MOCVD for Concentrator (CPV) Solar Cells
Past market driven primarily by space applications
Potential expansion for terrestrial applications to 1GW by 2012
TurboDisc E475: Market share leader with highest productivity & lowest CoO for CPV
–
World-class process performance = high cell efficiency
–
Highest production throughput
–
Low maintenance enables industry’s highest uptime
TurboDisc E475

21 ©2009 Veeco Instruments Inc 020909 Investor Slides
0
500
1,000
1,500
2,000
2,500
3,000
3,500
4,000
4,500
5,000
2008 2009 2010 2011 2012 2013 2014 2015
Source: NanoMarkets, LC
Emerging Opportunity in Thin Film CIGS Solar
Handful of companies producing up to 30MW of CIGS cells
Dozens more in various stages of pilot production
CIGS on flexible substrate provides new application opportunities compared to rigid materials
Equipment needs to be developed & performance improved – excellent entry point for Veeco solutions
CIGS/CIS thin-film Production Capacity (MW)
CIGS EMERGING AS LOW COST/HIGH EFFICIENCY ALTERNATIVE TO SILICON SOLAR WITH BROAD MARKET APPLICATIONS

22 ©2009 Veeco Instruments Inc 020909 Investor Slides
0.00
0.25
0.50
0.75
1.00
1.25
Silicon a-Si a-Si* CdTe CIGS
CIGS Projected to be Most Cost Competitive PV Technology CIGS Projected to be Most Cost Competitive PV Technology
Source: NREL, Presented at the 33rd IEEE Photovoltaic Specialists Conference San Diego, California May 11–16, 2008
Lower is Better
Anticipated Future Relative Cost
*Triple Junction
[Relative Cost analysis comparing factors such as efficiency, materials and manufacturing process]

23 ©2009 Veeco Instruments Inc 020909 Investor Slides
CIGS on Flexible Has Broadest Market Opportunity CIGS on Flexible Has Broadest Market Opportunity
Market CIGS C-Si a-Si Note
Solar FarmsLow efficiency ok
for large area installations
Building Integrated PV (BIPV)
Flexible substrate required, black
appearance
Rooftop Grid Connected
High efficiency required for small
surface area
Portable Devices
Flexible substrate required with high
efficiency

24 ©2009 Veeco Instruments Inc 020909 Investor Slides
Veeco’s Rapidly Expanding CIGS Product Portfolio Veeco’s Rapidly Expanding CIGS Product Portfolio
Veeco thermal deposition sources used by 14 CIGS manufacturers
FastFlex Platform for Flexible CIGS Solar Cells: Mo, TCO & now offer CIGS layer
Anticipate Q1 launch of FastLinePlatform for Glass CIGS Solar Cells
Quoting Veeco solutions to broad range of customers
FastFlex Web Coating System
PV-Series CIGS Sources

25 ©2009 Veeco Instruments Inc 020909 Investor Slides
Veeco Supplies Equipment for 3 out 4 Process Steps Veeco Supplies Equipment for 3 out 4 Process Steps
SEM Cross section Picture of a Typical CIGS film
TCOCdS
CIGS
Mo
Liquid Bath Deposited CdS Buffer Layer
Sputtering of ZnO+AZO Front Window Layer
Co-evaporation of Cu-In-Ga-Se Absorber Layer
Sputtering of the Mo Back Contact Layer

26 ©2009 Veeco Instruments Inc 020909 Investor Slides
Evaporation is the Best CIGS SolutionEvaporation is the Best CIGS Solution
Process of record for 20.0% efficiency cells65% of today’s CIGS manufacturing capacity use thermal evaporationLowest manufacturing costVeeco supplies sources to more than 50% of CIGS companies 3/5/09: –
Received Large Multi-Million Dollar Order
–
Korean Steel Manufacturer to Build CIGS Solar Cell Line

Data Storage

28 ©2009 Veeco Instruments Inc 020909 Investor Slides
Technology Trends & Areal Density Growth Technology Trends & Areal Density Growth
Customer capexdeclines in difficult economic climate
HDD makers must invest in new technology to lower $/GB cost
Veeco products aligned to technology requirements–
#1 provider of TFMH equipment
–
Leading edge products throughout TFMH process
0
200
400
600
800
1000
1200
1400
1600
1800
2006 2007 2008 2009 2010 2011 2012Year
WRITER PMR Damascene Pole HAMR/Assisted
READER TMR Low Energy Etch CPP-GMR
SLIDER Ultra-thin Carbon Overcoat (<20 Å)
MEDIA Conventional DTM
HDD Technology Trends and Areal Density Growth
DLC-X
CVD
IBE 420-EX
PVD-HR
Are
alD
ensi
ty [G
B/in
2 ]
Lab & Leading Edge Products
Volume Production Areal Density

29 ©2009 Veeco Instruments Inc 020909 Investor Slides
Key Products Aligned with Customers’ Technology Roadmaps for 2009 Key Products Aligned with Customers’ Technology Roadmaps for 2009
NEXUS PVD-HR
NEXUS DLC-X
Step coverage95 -105 %
~ 0.4 μm trenches
Step coverage95 -105 %
~ 0.4 μm trenches
NEXUS IBE
420-EX
Conformal films for small dimensions High productivity for overcoat films
Ultra-thin diamond-like coating for heads 3x uniformity improvement and low energy etching for smaller features
NEXUS CVD

Metrology

31 ©2009 Veeco Instruments Inc 020909 Investor Slides
Leadership in Scientific and Focus on Growth Markets within Industrial Metrology
Leadership in Scientific and Focus on Growth Markets within Industrial Metrology
Take share and expand market in AFM–
Turning the product development machine around
–
Increasing Nano-Functionality: Nano-
Analytical Thermal Analysis, Material properties mapping and Nano-Biological
–
Attacking operational costs
Growth in Optical / Stylus–
Focused application work on growth segments
–
Orienting product development towards significant industrial opportunities
–
Alignment with strong regional growth opportunities
Innova AFM
Wyko NT 9100

32 ©2009 Veeco Instruments Inc 020909 Investor Slides
New AFM Products Are Best in ClassNew AFM Products Are Best in Class
New Dimension Icon AFMThe world’s highest resolution large sample AFMMost productive AFM – Fastest time to resultsVery easy to use – intuitive user interface
Innovative New Nano-Analytical Components that Expand Functionality•VITA: Mapping thermal properties at the nanoscale•HarmonixTM: Mapping material properties at the nanoscale
33 ©2009 Veeco Instruments Inc 020909 Investor Slides
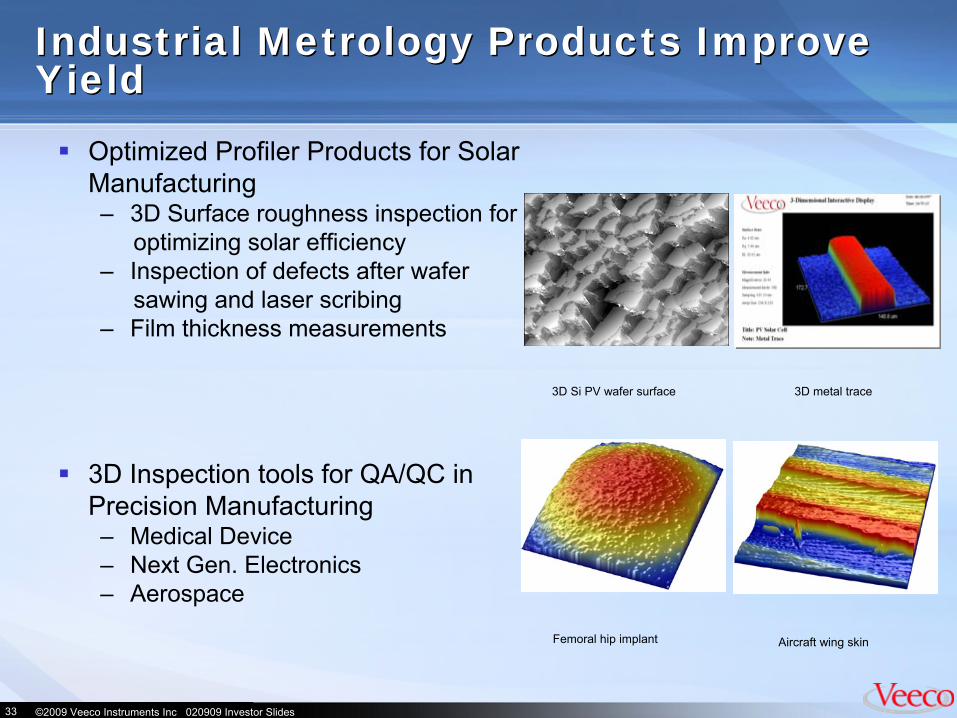
Industrial Metrology Products Improve Yield Industrial Metrology Products Improve Yield
Optimized Profiler Products for Solar Manufacturing–
3D Surface roughness inspection for optimizing solar efficiency
–
Inspection of defects after wafer sawing and laser scribing
–
Film thickness measurements
3D Inspection tools for QA/QC in Precision Manufacturing–
Medical Device –
Next Gen. Electronics–
Aerospace
Femoral hip implant Aircraft wing skin
3D Si PV wafer surface 3D metal trace

34 ©2009 Veeco Instruments Inc 020909 Investor Slides
SummarySummary
Q308 Actual“End Market Recovery”
Model
Revenue $116M $110-120M
GM 41% 45-46%
Operating Spending $39M $35-36M
EBITA%* 7.2% 15-17%*
Track record of solid execution in challenging 2008
Swift action to restructure Veeco:–
Simpler, more cost effective structure–
New quarterly breakeven $80M
Scalable operational model capable of delivering solid profitability
Aligned to multi-year technology growth opportunities
*Note: Beginning in Q1’09 EBITA calculation will exclude equity-based compensation. Q3 08 EBITA exclusive of equity based compensation is 8%.
35 ©2009 Veeco Instruments Inc 020909 Investor Slides
Safe Harbor StatementSafe Harbor Statement
To the extent that this presentation discusses expectations or otherwise make statements about the future, such statements are forward-looking and are subject to a number of risks and uncertainties that could cause actual results to differ materially from the statements made. These factors include the risk factors discussed in the Business Description and Management's Discussion and Analysis sections of Veeco's Annual Report on Form 10-K for the year ended December 31, 2007 and subsequent Quarterly Reports on Form 10-Q and current reports on Form 8-K. Veeco does not undertake any obligation to update any forward-looking statements to reflect future events or circumstances after the date of such statements.
In addition, this presentation includes non-GAAP financial measures. For GAAP reconciliation, please refer to the reconciliation section in this presentation as well as Veeco’s financial press releases and 10-K and 10-Q filings available on www.veeco.com.

36 ©2009 Veeco Instruments Inc 020909 Investor Slides
Back-Up and Reconciliation SlidesBack-Up and Reconciliation Slides

37 ©2009 Veeco Instruments Inc 020909 Investor Slides
Income StatementIncome Statement
(In thousands, except per share data)2008 2007 2008 2007
(Unaudited) (Unaudited)
Net sales $110,344 $106,822 $442,809 $402,475Cost of sales 70,189 71,145 266,215 244,964 Gross profit 40,155 35,677 176,594 157,511
Operating expenses:Selling, general and administrative expense 22,310 21,625 92,838 90,972 Research and development expense 15,180 14,833 60,353 61,174 Amortization expense 3,215 2,014 10,745 10,250 Restructuring expense 3,567 4,752 10,562 6,726 Asset impairment charge 73,037 1,068 73,322 1,068 Other income, net (77) (13) (668) (618)
Operating loss (77,077) (8,602) (70,558) (12,061)
Interest expense, net 899 757 3,812 3,013 Gain on extinguishment of debt (4,969) - (4,969) (738)
Loss before income taxes and noncontrolling interest (73,007) (9,359) (69,401) (14,336)
Income tax (benefit) provision (968) 161 1,892 3,651 Noncontrolling interest (30) (146) (230) (628) Net loss ($72,009) ($9,374) ($71,063) ($17,359)
Loss per common share:Net loss per common share ($2.29) ($0.30) ($2.27) ($0.56)Diluted net loss per common share ($2.29) ($0.30) ($2.27) ($0.56)
Weighted average shares outstanding 31,500 31,128 31,347 31,020 Diluted weighted average shares outstanding 31,500 31,128 31,347 31,020
Year endedDecember 31,December 31,
Three months ended
38 ©2009 Veeco Instruments Inc 020909 Investor Slides
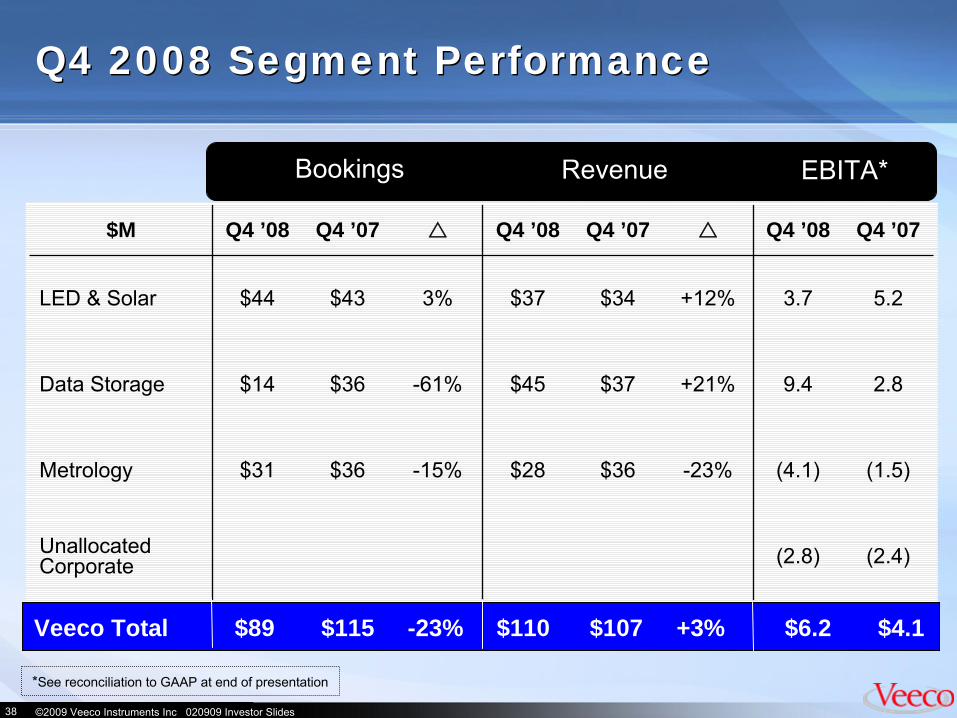
Q4 2008 Segment Performance Q4 2008 Segment Performance
*See reconciliation to GAAP at end of presentation
$M Q4 ’08 Q4 ’07 Q4 ’08 Q4 ’07 Q4 ’08 Q4 ’07
LED & Solar $44 $43 3% $37 $34 +12% 3.7 5.2
Data Storage $14 $36 -61% $45 $37 +21% 9.4 2.8
Metrology $31 $36 -15% $28 $36 -23% (4.1) (1.5)
Unallocated Corporate (2.8) (2.4)
Bookings Revenue EBITA*
Veeco Total $89 $115 -23% $110 $107 +3% $6.2 $4.1

39 ©2009 Veeco Instruments Inc 020909 Investor Slides
Segment InformationSegment Information
** Refer to footnotes on "Reconciliation of operating loss to earnings excluding certain items"
(In thousands) 2008 2007 2008 2007
LED & Solar Process EquipmentBookings 43,649$ 42,522$ 160,162$ 163,970$ Revenues 37,608$ 33,675$ 165,812$ 115,863$
Operating income 783$ 4,681$ 19,616$ 9,694$ Amortization expense 1,587 489 4,627 4,263 Restructuring expense 725 34 732 34 Purchase accounting adjustment 565 - 1,492 - EBITA 3,660$ 5,204$ 26,467$ 13,991$
Data Storage Process EquipmentBookings 13,968$ 35,826$ 138,653$ 141,663$ Revenues 45,026$ 37,329$ 149,123$ 136,169$
Operating loss (42,877)$ (6,374)$ (35,411)$ (6,332)$ Amortization expense 934 952 3,790 3,806 Restructuring expense 272 2,339 396 2,498 Asset impairment charge 51,102 1,068 51,102 1,068 Inventory write-off - 4,821 - 4,821 EBITA 9,431$ 2,806$ 19,877$ 5,861$
MetrologyBookings 30,884$ 36,547$ 125,622$ 145,939$ Revenues 27,710$ 35,818$ 127,874$ 150,443$
Operating loss (30,044)$ (2,479)$ (31,348)$ (997)$ Amortization expense 585 351 1,880 1,486 Restructuring expense 511 554 1,138 1,952 Asset impairment charge 21,935 - 21,935 - Inventory write-off 2,900 - 2,900 - EBITA (4,113)$ (1,574)$ (3,495)$ 2,441$
Unallocated CorporateOperating loss (4,939)$ (4,430)$ (23,415)$ (14,426)$ Amortization expense 109 222 448 695 Restructuring expense 2,059 1,825 8,296 2,242 Asset impairment charge - - 285 - EBITA (2,771)$ (2,383)$ (14,386)$ (11,489)$
TotalBookings 88,501$ 114,895$ 424,437$ 451,572$ Revenues 110,344$ 106,822$ 442,809$ 402,475$
Operating loss (77,077)$ (8,602)$ (70,558)$ (12,061)$ Amortization expense 3,215 2,014 10,745 10,250 Restructuring expense 3,567 4,752 10,562 6,726 Purchase accounting adjustment 565 - 1,492 - Asset impairment charge 73,037 1,068 73,322 1,068 Inventory write-off 2,900 4,821 2,900 4,821 EBITA 6,207$ 4,053$ 28,463$ 10,804$
December 31, December 31,Year endedThree months ended

40 ©2009 Veeco Instruments Inc 020909 Investor Slides
ReconciliationReconciliation
(1)
During 2008, the Company recorded a restructuring charge of $10.6 million, of which $3.6 million was incurred during the fourth quarter, $4.1 million was incurred during the third quarter and $2.9 million was incurred during the first quarter. These restructuring charges consisted of personnel severance costs and lease-related commitments.
(2)
During 2007, the Company recorded a restructuring charge of $6.7
million, of which $4.7 million was incurred during the fourth quarter, $0.5 million was incurred during the third quarter and $1.5 million was incurred during the second quarter. The fourth quarter restructuring charge consisted of $2.9 million of personnel severance costs, and $1.8 million of commitments associated with discontinued product lines. The third quarter and second quarter restructuring charges consisted of personnel severance costs.
(3)
During 2008, the Company recorded $1.5 million in cost of sales related to the acquisition of Mill Lane Engineering, of which $0.6 million was recorded during the fourth quarter. This was the
result of purchase accounting, which requires adjustments to capitalize inventory at fair value.
(4)
During 2008, the Company recorded a $73.3 million asset impairment charge, of which $73.0 million was recorded during the fourth
quarter and $0.3 million was recorded during the first quarter.
The fourth quarter charge consisted of $52.3 million related to goodwill and $20.7 million related to other long-lived assets. The first quarter charge consisted of $0.3 million related to fixed asset write-offs associated with the consolidation and relocation of our Corporate headquarters.
(5)
During the fourth quarter of 2007, the Company recorded a $1.1 million asset impairment charge related to fixed assets associated with discontinued product lines. (6)
During the fourth quarter of 2008, the Company recorded a $2.9 million inventory write-off in its Metrology segment associated with legacy semiconductor products. This was included in cost of sales in the GAAP income statement.
(7)
During the fourth quarter of 2007, the Company recorded a $4.8 million inventory write-off associated with discontinued product lines. This was included in cost of sales in the GAAP income statement.(8)
During the fourth quarter of 2008, the Company repurchased $12.2
million aggregate principal amount of its 4.125% convertible subordinated notes. As a result of these repurchases, the Company
recorded a net gain from the early extinguishment of debt in the
amount of $5.0 million.(9)
During the first quarter of 2007, the Company repurchased $56.0 million aggregate principal amount of its 4.125% convertible subordinated notes. As a result of these repurchases, the Company recorded a net gain from the early extinguishment of debt in the
amount of $0.7 million.Note: The above reconciliation is intended to present Veeco's operating results, excluding certain items and providing income taxes at
a 35% statutory rate. This reconciliation is not in accordance with, or an alternative method for, generally accepted accounting principles
in the United States, and may be different from similar measures presented by other companies. Management of the Company evaluates performance of its business units based on earnings before interest, income taxes and amortization excluding certain items ("EBITA"), which is the primary indicator used to plan and forecast future periods. The presentation of this financial measure facilitates meaningful comparison with prior periods, as management of the Company believes EBITA reports baseline performance and thus provides useful information.
(In thousands, except per share data) 2008 2007 2008 2007
Operating loss ($77,077) ($8,602) ($70,558) ($12,061)Adjustments:Amortization expense 3,215 2,014 10,745 10,250 Restructuring expense 3,567 (1) 4,752 (2) 10,562 (1) 6,726 (2)Purchase accounting adjustment 565 (3) - 1,492 (3) - Asset impairment charge 73,037 (4) 1,068 (5) 73,322 (4) 1,068 (5)Inventory write-off 2,900 (6) 4,821 (7) 2,900 (6) 4,821 (7)Earnings before interest, income taxes and amortization excluding certain items ("EBITA") 6,207 4,053 28,463 10,804Interest expense, net 899 757 3,812 3,013Gain on extinguishment of debt (4,969) (8) - (4,969) (8) (738) (9)Adjustment to exclude gain on extinguishment of debt 4,969 - 4,969 738 Earnings excluding certain items before income taxes and noncontrolling interest 5,308 3,296 24,651 7,791Income tax provision at 35% 1,858 1,154 8,628 2,727Noncontrolling interest, net of income tax provision at 35% (20) (95) (150) (408)Earnings excluding certain items $3,470 $2,237 $16,173 $5,472Earnings excluding certain items per diluted share $0.11 $0.07 $0.51 $0.17Diluted weighted average shares outstanding 31,564 31,399 31,516 31,346
Three months endedDecember 31,
Year endedDecember 31,

41 ©2009 Veeco Instruments Inc 020909 Investor Slides
Balance SheetBalance Sheet
(In thousands)
December 31, December 31,2008 2007
(Unaudited)
ASSETSCurrent assets: Cash and cash equivalents 103,799$ 117,083$ Accounts receivable, net 59,659 75,207 Inventories, net 94,930 98,594 Prepaid expenses and other current assets 6,425 8,901 Deferred income taxes 2,185 2,649 Total current assets 266,998 302,434
Property, plant and equipment, net 64,372 66,142 Goodwill 59,160 100,898 Other assets, net 39,011 59,860 Total assets 429,541$ 529,334$
LIABILITIES AND SHAREHOLDERS' EQUITYCurrent liabilities: Accounts payable 29,610$ 36,639$ Accrued expenses 66,964 60,201 Deferred profit 1,346 3,250 Income taxes payable 354 2,278 Current portion of long-term debt 196 25,550 Total current liabilities 98,470 127,918
Deferred income taxes 4,540 3,712 Long-term debt 108,669 121,035 Other non-current liabilities 2,391 1,978
Noncontrolling interest 784 1,014
Shareholders' equity 214,687 273,677 Total liabilities and shareholders' equity 429,541$ 529,334$

42 ©2009 Veeco Instruments Inc 020909 Investor Slides
Q1 2009 GuidanceQ1 2009 Guidance
LOW HIGH
Operating loss ($21,000) ($15,800)
Adjustments:
Amortization expense 1,800 1,800 Restructuring expense 6,000 (1) 5,000 (1)Equity-based compensation expense 1,700 1,700
Earnings before interest, income taxes and amortization excluding certain items ("EBITA") (11,500) (7,300)
Interest expense, net 1,500 1,500Adjustment for non-cash portion of interest expense (700) (2) (700) (2)
Earnings excluding certain items before income taxes (12,300) (8,100)
Income tax benefit at 35% (4,305) (2,835)
Earnings excluding certain items ($7,995) ($5,265)
Earnings excluding certain items per diluted share ($0.25) ($0.17)
Diluted weighted average shares outstanding 31,600 31,600
Guidance for the three months ended March 31, 2009
(1)
During the first quarter of 2009, the Company expects to record a restructuring charge between $5.0 and $6.0 million.(2)
Adjustment to exclude non-cash interest on convertible subordinated notes.(3)
NOTE -
The above reconciliation is intended to present Veeco's operating results, excluding certain items and providing income taxes at a 35% statutory rate. This reconciliation is not in accordance with, or an alternative method for, generally accepted accounting principles in the United States, and may be different from similar measures presented by other companies. Management of the Company evaluates performance of its business units based on earnings before interest, income taxes and amortization excluding certain
items ("EBITA"), which is the primary indicator used to plan and forecast future periods. The presentation of this financial measure facilitates meaningful comparison with prior periods, as management of the Company believes EBITA reports baseline performance and thus provides useful information.
(Unaudited)