innovations 2000 -...
TRANSCRIPT

2
O
O
O
AN
NU
AL
R
EP
OR
T
IS
SU
E
230017
03>
0
02001
0
March 20, 2001
www.halliburton.com
INNOVATIONS2000

comparative highlights
Net income in 2000 inc ludes a ga in on d isposal o f d iscont inued operat ions of$215 mi l l ion or $0.48 per d i lu ted share. Net income in 1999 inc ludes a ga in ondisposal o f d iscont inued operat ions of $159 mi l l ion or $0.36 per d i lu ted share.
Mil l ions of dol lars and shares except per share data 2000 1999 1998
Diluted income (loss) per share from continuing operations $ 0.42 $ 0.39 $ (0.27)Diluted net income (loss) per share 1.12 0.99 (0.03)Cash dividends per share 0.50 0.50 0.50Shareholders’ equity per share 9.20 9.69 9.23Revenues $ 11,944 $ 12,313 $ 14,504Operating income 462 401 170Income (loss) from continuing operations 188 174 (120)Net income (loss) 501 438 (15)Long-term debt ( including current maturit ies) $ 1,057 $ 1,364 $ 1,426Shareholders’ equity 3,928 4,287 4,061Capital expenditures $ 578 $ 520 $ 841Depreciat ion and amortization 503 511 500Diluted average shares outstanding 446 443 439

nnovation is the theme of our Annual Report for the year 2000. It’s the story of the
changes, great and small, technical and organizational, that our more than 90,000 men
and women are delivering every day.
We take great pride in their contributions. Naturally, the decisions of senior management
are most often in the spotlight, because those decisions set the direction and the tone for
the organization.
But there is much more to our success – the extraordinary results produced by the
scientists and software developers, the sales people and the project managers, the
roughnecks and field engineers.
Their results come from having the right people and the right environment – the culture
that helps them focus on the customer, on solving the most important problems, and on
delivering excellent service. Creating and nurturing this culture is our most important task.
We welcome this opportunity to show our shareholders and the public some of our impor-
tant and dramatic innovations, and to thank the extraordinary Halliburton people who are
bringing them about. H
3 Halliburton Today
4 Letter to Shareholders
8 Energy Services Group
12 Technology Flagships
24 Engineering and Construction Group
30 Health, Safety and Environment
32 Financial Section
76 Board of Directors
H A L L I B U R T O N C O M P A N Y 2 0 0 0 A N N U A L R E P O R T
1
I N N O V A T I O N S 2 0 0 0 & A N N U A L R E P O R T E D I T I O N
i
HALLIBURTON TODAY More than 90,000professionals producing extraordinaryresults for customers worldwide.
ENERGY SERVICES Through innovationand technology, impacting every aspectof the oil and gas asset.
ENGINEERING & CONSTRUCTION Theworld’s most respected designer,builder and facilitator of energy andinfrastructure projects.
Cover illustration by C.F.Payne

2 HALLIBURTON COMPANY 2000 ANNUAL REPORT
CORPORATE OFFICERSDavid J. Lesar Chairman of the Board, President and Chief Executive Officer,
Donald C. Vaughn Vice Chairman, Gary V. Morris Executive Vice President and Chief Financial
Officer, Lester L. Coleman Executive Vice President and General Counsel, John W. KennedyExecutive Vice President - Global Business Development, Jerry H. Blurton Vice President
and Treasurer, Margaret Carriere Vice President – Human Resources, Robert F. Heinemann Vice President and Chief Technology Officer, Arthur D. Huffman Vice President and Chief
Information Officer, Susan S. Keith Vice President, Secretary and Corporate Counsel,
Guy T. Marcus Vice President – Investor Relations, R. Charles Muchmore, Jr. Vice President
and Controller
ENERGY SERVICES GROUPEdgar Ortiz President and Chief Executive Officer
ENGINEERING AND CONSTRUCTION GROUPKELLOGG BROWN & ROOT
A. Jack Stanley Chairman, R. Randall Harl President and Chief Executive Officer
GO TO WWW.HALLIBURTON.COMFOR A COMPLETE LISTING OF OFFICERS.
SHAREHOLDER INFORMATION
Corporate Office 3600 Lincoln Plaza, 500 North Akard Street, Dallas, Texas 75201-3391. Shares Listed New York Stock Exchange Symbol: HAL, Swiss Exchange.
Transfer Agent and Registrar Mellon Investor Services, L.L.C., 85 Challenger Road, OverpeckCentre, Ridgefield Park, New Jersey 07660-2104 • (800) 279-1227.
Form 10-K Report Shareholders can obtain a copy of the Company’s annual report to the Securitiesand Exchange Commission, Form 10-K, by contacting: Vice President – Investor Relations,
Halliburton Company, 3600 Lincoln Plaza, 500 North Akard Street, Dallas, Texas 75201-3391.For up-to-date information on Halliburton Company, shareholders may use the Company’s toll free
telephone-based information service, available 24 hours a day at: 1-888-669-3920 or contact theHalliburton Company homepage on the Internet’s World Wide Web at http://www.halliburton.com
Click here forinnovation.
Go to www.halliburton.com andyou’ll find a wealth of informationabout our innovative company.You can click and find our latest projects, most recent news releases, or even job opportunities.Halliburton.com. It’s an innovativesite, but that’s what you shouldexpect from a leader.
managementand corporateinformation

H A L L I B U R T O N C O M P A N Y 2 0 0 0 A N N U A L R E P O R T
HALLIBURTON COMPANY 2000 ANNUAL REPORT 3
Energy Services Group offers the broadest array of products and services to upstream oil and gas customers worldwide, stretching from
the manufacturing of drill bits and other downhole and completion tools and pressure pumping services to subsea engineering
and fabrication.
Engineering and Construction Group serves the energy industry by designing and building liquefied natural gas plants, refining and
processing plants, production facilities and pipelines both onshore and offshore. The non-energy business of the group meets the engin-
eering and construction needs of governments and civil infrastructure customers. H

L E T T E R T O O U R S H A R E H O L D E R S
4 HALLIBURTON COMPANY 2000 ANNUAL REPORT
A messagefrom David J. Lesar,Chairman ofthe Board,President andChief ExecutiveOfficer of HalliburtonCompany

fellowshareholders
has been slower to accelerate. As
exploration and development increases
overseas in 2001, we are in an excellent
position to continue to grow our revenues
and earnings in the upstream oil and gas
sector. Overall, oil and gas company E&P
spending was up by more than 18
percent in 2000. Early estimates for 2001
are for additional spending growth of
around 20 percent.
The demand for Engineering &
Construction (E&C) projects, however,
did not mirror that for energy services. In
2000, higher prices for oil and gas had not
yet translated to increased spending by
our customers on E &C projects in the
liquefied natural gas (LNG), refining, and
petrochemical industries. This lack of
five years Halliburton has grown from a
$5.7 billion company to its present $11.9
billion size. At the same time, we have
become a more closely knit organization
with a more focused and unified strategy.
We’re grateful for Dick’s service and
commitment to Halliburton and wish him
well in his new role in public life.
In 2000, the demand for energy services
was particularly strong in the U.S., as both
crude oil and natural gas prices rose
substantially, and oil and gas companies
increased their expenditures for
exploration and production (E&P)
projects. However, historically two-thirds
of Halliburton’s energy services business
comes from outside the U.S., and demand
for energy services in international areas
5HALLIBURTON COMPANY 2000 ANNUAL REPORT
alliburton initiated significant
changes during 2000 as we
restructured the Company to profit from
growing opportunities in the worldwide
energy industry. These changes included
the decision to divest the Dresser
Equipment Group, and the formation of
our Energy Services and Engineering and
Construction groups.
Halliburton also experienced a
transition in senior management. Dick
Cheney retired as our chairman in August
to run for vice president of the United
States, and I was elected chairman and
chief executive officer in addition to my
job as president.
Dick’s tenure was marked by a period
of extraordinary growth for Halliburton. In
h
L E T T E R T O O U R S H A R E H O L D E R S

The E&C group’s revenues were $4.0
billion, compared to $5.3 billion in 1999,
and operating income was $14 million,
compared to $203 million in 1999. This
decline was a reflection of the lack of new
downstream projects, and intense compe-
tition for the few available opportunities.
Our third business segment, Dresser
Equipment Group, was reclassified as
discontinued operations after we decided
to sell the business. The group is
performing well, but their lines of
business do not closely fit our core business
and our long-term goals and objectives.
This move will bring a sharper focus on
our core business activities.
The estimated $1.1 billion net proceeds
market opportunities, along with a
consolidating customer base and a fiercely
competitive environment, contributed to
my decision to restructure the E&C
group. This change will help us gain
operating efficiencies and provide a
stronger platform for consistent profitability
with improved operating margins. Current
and projected strength in the energy
services markets in the U.S. and overseas
should be followed by increased
spending in the E&C sector. We expect
this to begin in late 2001 and 2002.
Halliburton’s 2000 revenues from
continuing operations were $11.9 billion.
Net income for the year, including
discontinued operations, was $501 million,
and $188 million from continuing
operations. Earnings per diluted share
were $1.12, compared with $.99 per share
for 1999. Discontinued operations are
those of the Dresser Equipment Group,
which is in the process of being sold.
The Energy Services Group includes
our business units providing services and
products to the upstream oil and gas
business. The group’s 2000 revenues were
$7.9 billion, compared to $7.0 billion in
1999, while operating income more than
doubled to $526 million in 2000,
compared to $222 million in 1999. This
dramatic improvement came from
stronger demand for energy services in
North America.
L E T T E R T O O U R S H A R E H O L D E R S
6 HALLIBURTON COMPANY 2000 ANNUAL REPORT
Our organization andour technology strategy…are designed toposition Halliburton to…continue our worldwideleadership in providingdiscrete energyservices.
“
”

the company, and a flatter, more
responsive, management structure in both
business segments. This organization will
both strengthen our individual discrete
product and service lines, and at the
same time give us a more effective
framework for developing integrated
technology products, and for pursuing
large integrated projects.
The most significant application for
integrated technologies over the next
several years is in deepwater exploration
and production projects. We estimate
there will be about $21 billion committed
annually to deepwater projects by 2004,
up from $8 billion in 2000.
Winning these projects requires
project management skills, the ability to
match the subsurface and surface work,
to perform and integrate services during
the project, and to develop new enabling
technologies – all Halliburton strengths.
And we’ve proven our ability to compete
by winning the engineering, procurement
and construction (EPC) contract for the
$2.5 billion Barracuda/Caratinga offshore
project in Brazil.
Our organization and our technology
strategy – the focus of this annual report
– are designed to position Halliburton to
win large projects and continue our
worldwide leadership in providing
discrete energy services. I would like to
thank all of our employees who are
executing the business strategies which
will drive future success for the Company
and our shareholders. H
Sincerely,
David J. LesarChairman of the Board, President and Chief Executive Officer
will be used for working capital and to
repay debt, which will leave us in an even
stronger financial position to pursue
strategic acquisitions and internal invest-
ment opportunities. We expect a pretax
profit of about $500 million from the sale
and expect it to be completed in the sec-
ond quarter of 2001. Halliburton will retain
a 5 percent equity stake.
The changes in our Energy Services
and E&C groups have been driven by the
same strategic goals: to improve the
competitive position of our product lines,
to bring a new intensity and focus to our
commitment to the energy industry, and
to improve profitability.
In the Energy Services Group, this
means a renewed focus on optimizing the
value of our individual product lines –
turning their brand name capital and
strong market position into higher profit
margins. This will be the focus of the
energy services management in 2001.
At the same time, in order to make our
E&C organization flatter and simpler, I
combined all our engineering and
construction operations into one company.
All engineering, construction, fabrication,
and project management are now part of
Kellogg Brown & Root (KBR).
The restructuring has achieved a
reduction in the number of executives in
7HALLIBURTON COMPANY 2000 ANNUAL REPORT

enerE N E R G Y S E R V I C E S G R O U P
8 HALLIBURTON COMPANY 2000 ANNUAL REPORT

gy2
he Energy Services Group is the real-
time knowledge company serving upstream
petroleum industry customers worldwide.
The Group consists of the Halliburton
Energy Services and Landmark Graphics
Corporation business units, as well as large
integrated projects that include surface,
subsea and subsurface components. It also
includes the following businesses that were
formerly part of Brown & Root Energy
Services: Halliburton Subsea, Wellstream,
Production Services, Granherne, and two joint
ventures: Bredero-Shaw and EMC.
Halliburton Energy Services provides a
broad range of services for the exploration,
development, and production of oil and gas
wells. These services include formation
evaluation, well construction, production
enhancement and well maintenance for
either a single well or an entire field.
Landmark Graphics Corporation supplies
software and services that transform data into
computer models of hydrocarbon reserves
and enable customers to optimize their
exploration, development, and production
decisions as well as integrate their technical-
to-business processes.
This report focuses on the company’s tech-
nology strategy and the technological inno-
vations for 2000. These cut across
business unit boundaries and unify the
diverse product and service lines. They
provide a framework for understanding how
Halliburton is creating value for customers
and shareholders, and how that process will be
enhanced in the future.
Technology is a very broad term that
embraces not only tools, processes, products,
and services, but also the know-how,
experience, and problem-solving ability of
Halliburton’s employees. In a very real sense,
it is this ability to apply specialized
knowledge and advanced techniques to the
E N E R G Y S E R V I C E S G R O U P
9HALLIBURTON COMPANY 2000 ANNUAL REPORT
t

Locator to find the right people for the job –
the ones with the exact knowledge needed
at that moment, anywhere in the world.
On the level of individual products and
services, Baroid Drilling Fluids launched
Wellsight 2000,™ a central database built to
contain all the drilling fluids experience on
all the company’s jobs worldwide. With
Wellsight 2000, engineers can cross-refer-
ence conditions and solutions and call on the
accumulated knowledge of the world’s lead-
ing team of drilling fluids experts.
Knowledge of the best approach
to any situation will be instantly
available to Baroid people on any
rig, anywhere in the world.
Finally, the company’s knowledge
management innovations blend into
our e-business strategy. The most
important use of the Internet, and
the one that will deliver the great-
est competitive advantage, is its use
as a venue for collaboration, knowl-
edge sharing and work sharing.
Practically all the company’s knowl-
edge management innovations use
the Internet.
Taking these ideas one step
farther, helping to bring about the
new world where sharing and inte-
grating knowledge is the main
source of value creation, Halliburton
founded GrandBasin. GrandBasin is a web-
based unit of Landmark that will provide a
virtual, integrated E&P workspace for
upstream companies and professionals. It will
be the Internet site where professionals work-
ing on the same project – customers, contrac-
tors, subcontractors – can work together using
a secure high-performance network, techni-
cal applications and computing power, a com-
munity portal and data integration.
GrandBasin will market to the oil and gas
industry as a whole the kind of integration and
unique needs of customers that is the true
source of value creation, and Halliburton’s
true source of competitive advantage.
Knowledge Management
Many of Halliburton’s most important
innovations are better ways to bring the right
experts and the right experience to bear on
the right problems at the right time. This is
knowledge management, and it multiplies
the value of individual technologies and the
expertise of Halliburton’s people. These
innovations include products,
services, and systems for our
customers as well as processes used
inside Halliburton to deliver
better services and solutions. Both
allow the organization to use
its people and their skills and
knowledge more effectively.
Landmark Graphics is the leader
in helping customers integrate
knowledge within their organiza-
tions. In 2000, two major customers,
Texaco and Petrobras in Colombia,
signed contracts with Landmark to
improve their internal information
systems. Texaco will receive a broad
range of integrated solutions for explo-
ration and production that will create
a new electronic upstream environ-
ment, including development of new
workflows to help Texaco execute
faster and with lower risk. Petrobras will receive
services designed to integrate data, people and
processes, improve risk assessment and speed
up decision-making.
iDims,™ a Landmark knowledge manage-
ment product launched in 2000, gives
customers online intranet access to their
drilling and well services operations data. This
access via a web browser will dramatically
reduce lead time for data acquisition and pro-
vide operators both current well data and
historical data from any location. This is an
important step in putting critical information
at the fingertips of decision makers.
In addition, Halliburton acquired a 15%
share of Petroleum Place, an Internet mar-
ketplace serving the oil and gas property
acquisition and divestiture market. Landmark
will provide online access to its software
through Petroleum Place, and participate in
the development of new software for
Internet-based property evaluations. This
venture capitalizes on the fact that the
majority of the world’s exploration and
production data already resides in Landmark’s
OpenWorks® digital format. Petroleum Place
will allow operators to use Landmark’s
interpretation and analysis tools to improve
their acquisition and divestiture processes.
Landmark has also created an important
knowledge management service for
Halliburton’s internal use – Lattix Locator, a
database of the skills and experience of the
company’s staff for all disciplines and all areas
of the business. Project managers use Lattix
E N E R G Y S E R V I C E S G R O U P
10 HALLIBURTON COMPANY 2000 ANNUAL REPORT
KNOWLEDGE MANAGEMENT gives direction to a non-stop freeflow of innovative ideas.

The flagships are built from excellence
in discrete products and services.
Excellence in advanced well construction is
built on Halliburton’s 80 years of
leadership in pressure pumping.
Excellence in gas monetization is built on
Kellogg Brown & Root’s proprietary process
technologies. Continued excellence in
discrete services is essential to being the
leader in these five areas.
As a result, about 80% of Halliburton’s
2000 investment in research and develop-
ment of $231 million went into
technologies aimed at improving
discrete products and services.
Investment decisions are based on
a combination of the needs of the
product/service line and its
contribution to the success of
the flagship.
It is important to recognize that
individual technologies and
products may have a primary
application to one flagship, but
may also contribute to other flag-
ships as well. For example, many
drilling innovations from Sperry-
Sun contribute to reservoir
evaluation as well as advanced
well construction systems.
There is no simple one-to-one
correspondence between products
and flagships; there are often multiple
beneficial relationships.
Our technology architecture is dynamic.
It will evolve as new technologies lead to
new products, and as the requirements for
success in winning and executing mega-
projects develop over time. It does,
however, provide a conceptual framework
for understanding how Halliburton’s many
facets work together and how they are being
managed to create value for customers and
shareholders. H
opportunity for collaboration that has proven
so effective inside Halliburton.
Technology Architecture
Halliburton’s energy services business can
be viewed as consisting of two complemen-
tary offerings: providing discrete, individual
oilfield services on the one hand, and
combining our technologies in a way to help
customers taking on large integrated field
development projects. The technology
architecture is built on a foundation of discrete
technologies. These are some of Halliburton’s
core competencies – materials sci-
ence, manufacturing, fabrication
and service delivery.
These technologies lead to the
development of new and better
discrete products and services,
from better pressure pumping
equipment to the new Anaconda
drilling system.
Halliburton’s Technology Flagships
These discrete products can be
grouped into flagship areas that
cut across traditional boundaries
and combine elements from
the Energy Services Group and
the Engineering and Construction
Group. A flagship is an integrated
technology area – a bundle of
technologies that meet a certain set
of customer needs.
Halliburton’s technology flagships are the
five areas that are most critical to Halliburton’s
customers, and the areas of excellence that
are needed to succeed in the company’s sec-
ond area of business – the integrated mega-
projects that will take on an increasing
importance in coming years. Halliburton is
pursuing excellence in these five areas in part
because together they provide the breadth of
capability needed to win the multibillion-dol-
lar integrated projects of the future.
Halliburton’s technology flagships are:
1) Real-time reservoir solutions –
building a complete, accurate, “picture” of
the reservoir from real-time data, which
provides the customer with the answers
needed to make the optimum development
decisions on a timely basis.
2) Advanced well construction – services
that allow operators to reduce the cost of
drilling wells in the most challenging envi-
ronments, and to tap reservoirs that were
previously uneconomical.
3) Advanced well production – completion,
intervention, operation and maintenance
technologies that maximize hydro-
carbon flow, increase the percentage
of recoverable reserves, and compress
production time.
4) Deepwater technologies – the key
products, services, and project management
skills needed to develop reservoirs in water
depths greater than 1,500 feet.
5) Gas monetization – the ability to extract
natural gas and convert it into economically
viable products, from LNG to fertilizer.
E N E R G Y S E R V I C E S G R O U P
11HALLIBURTON COMPANY 2000 ANNUAL REPORT
TECHNOLOGY ARCHITECTURE The know-how involved in materialsscience, manufacturing, fabrication and service delivery.

Similarly, Landmark signed a multi-year
deal with 4th Wave Imaging Corporation
to jointly develop 4-D seismic solutions that
support reservoir evaluation. 4-D seismic
technology uses multiple periodic 3-D
seismic surveys to monitor changes of fluid
flow and pressure changes in reservoirs over
time. HES has a complementary agreement
with 4th Wave Imaging for reservoir
monitoring through borehole seismic
services. Reservoir monitoring helps
identify bypassed reserves and increase
hydrocarbon recoveries.
Reservoir monitoring – continuously cap-
turing real-time information and modeling
as the hydrocarbons are being extracted –
saw another significant advance in 2000.
The RMT Elite™ is a pulsed neutron
carbon oxygen logging system that allows
time-lapse performance evaluation of
eservoir evaluation is the business of
providing the customer with in-depth
knowledge of the reservoir’s performance as
early as possible in the development
process. That knowledge is used to create
reservoir solutions – the most economical
reservoir development plan, constantly
updated during development and produc-
tion to maximize hydrocarbon recovery.
Excellence in reservoir solutions depends
on the technology to acquire real-time data
from the field, as well as information sys-
tems to model the reservoir and alternative
development scenarios.
Many groups within Halliburton con-
tribute to real-time reservoir solutions.
Landmark’s DecisionSpace,™ launched in
2000, is the first of a modular suite of
software products that offers web-enabled
project integration capabilities for all the
key decision points in the field life cycle –
from seismic exploration to the refinery
gate. DecisionSpace is the latest in
Landmark’s systems for technical-to-business
(T2B™) integration. It combines reservoir
evaluation with risk assessment to enable
better analysis of alternative development
strategies.
Landmark and Halliburton Energy
Services (HES) have formed alliances with
GeoMechanics International, Inc. (GMI) to
integrate GMI’s geomechanics analysis tools
with Landmark’s simulation models and
HES’s wellsite services to address customers’
wellbore stability problems. This under-
standing of geomechanical forces is critical
to efficient well planning and execution.
Wellbore stability problems are estimated to
cost the industry upwards of $6 billion
annually during drilling operations alone.
T E C H N O L O G Y F L A G S H I P S
12 HALLIBURTON COMPANY 2000 ANNUAL REPORT
r

producing reservoirs without the costly step
of removing the tubing from the well.
Together with Halliburton’s Sperry-Sun,
Landmark released RESolution 3D,™ a
real-time 3-D drilling and reservoir
understanding system that enables
visualization and updating of earth models
in both rig and office settings. Now, drilling
information can be instantly shared,
allowing faster and better decisions both
for drilling the current well and in
planning future wells.
NUMAR, a division of HES, continued
its breakthroughs in the use of magnetic
resonance imaging logging (MRIL®).
NUMAR unveiled MRIL PrimeTime, a
significant enhancement to its MRIL-
Prime logging service. MRIL PrimeTime
delivers answers in real time, as the tool is
being run, providing in minutes the critical
reservoir information that previously took
days to process and interpret.
An even greater advance was the devel-
opment of MRIL-WD™ (MRIL While
Drilling) by NUMAR and Sperry-Sun,
which can provide total porosity, free fluid
and bound fluid indices in the while-
drilling and reconnaissance logging mode,
as well as other MRIL information in the
wiping and evaluation logging mode. Being
able to collect this reservoir description data
while drilling, instead of later via a
wireline run, will allow operators to save
costly rig time in challenging environments
such as deepwater.
Reservoir evaluation and knowledge
management come together in Halliburton’s
Real Time Reservoir Solutions (RTRS).
RTRS combines real-time data collection,
Real Time Operations, reservoir modeling,
and satellite communications to enable
experts in different locations to
participate in controlling jobs in real time.
RTRS brings the people with the right
knowledge to bear at the critical time.
T E C H N O L O G Y F L A G S H I P S
13HALLIBURTON COMPANY 2000 ANNUAL REPORT
REAL TIME RESERVOIR SOLUTIONS teamsand technologies enable Halliburtonexperts and customers to literally “lookbeneath the surface” in real time to makebetter, faster reservoir decisions.
A typical RTRS job may bring together
production enhancement engineers,
completion products experts, log analysts
and customers, all looking at the same
real-time information from different loca-
tions and different perspectives. As the job
unfolds, everyone can see exactly what’s
happening, in real time, and make
recommendations that can be acted upon
instantly. Quick decisions plus access to
Halliburton’s best minds make RTRS a
large contributor to customers’ success in
difficult environments. In 2000, Halliburton
performed 1,675 real-time jobs. H
SHERRI ROGERS
Sherri Rogers coordinates service delivery for Halliburton’s Real Time Operations, the
visualization rooms where specialists and customers monitor and control jobs taking place
anywhere in the world. “We’re bringing the field into the office, erasing the boundaries. We even
have a Webcam, so people in the control rooms can see the actual conditions at the job site. At the
same time, our field people are seeing the interplay between different disciplines, becoming more
empowered to innovate and find new ways to add value. Knowledge sharing and cross-fertilization
is happening at every level. And many workers are drawn to the idea of drilling wells by remote
control, so it’s helping our recruiting. The cultural changes are enormous.”

range of economical wells. Enventure
expands the diameter of steel casings by as
much as 25% after they are placed. This
allows operators to work with smaller
hole sizes, enabling them to drill deeper to
reservoirs that were previously inaccessible.
This capability is becoming increasingly
important in deepwater developments.
A premiere breakthrough in this area
for 2000 is the Anaconda Well
Construction System. Anaconda will
change the way wells are drilled, and pro-
vide operators with a new capability to find
and develop isolated pockets of oil and gas.
Anaconda is an innovative drilling
system using carbon-fiber composite
spoolable tubing, called SmartPipe.™ It
includes conductors for two-way
communication, and a downhole
Advanced Drilling, Evaluation and
Propulsion Tool (ADEPT) assembly.
ADEPT sends enormous amounts of real-
time information up the SmartPipe to the
operators on the surface, who are then able
to remotely direct the path of the well,
allowing precise placement of the well
bore within a given hydrocarbon zone.
Anaconda wells will be guided using
real-time updates of the earth model.
They will bring together formation evalu-
ation experts, drilling engineers, reservoir
engineers, geologists and geophysicists to
make instant drilling decisions. Anaconda
can practically turn on a dime to probe for
additional reserves or to access multiple
reservoirs. The first commercial de-
ployment is in the Gulf of Mexico, to be
followed by work with Statoil in
the North Sea. Statoil has been a
partner in developing Anaconda over the
last three years. H
ADVANCED WELL CONSTRUCTION is comprised of breakthrough technologiesand tools that place the well in preciselythe right location and dramatically cutwell costs.

ell construction is the heart of the
traditional energy services
business. It encompasses drill bits,
drilling, drilling fluids, cementing and
formation evaluation. Advanced well
construction includes the breakthrough
technologies that will enable radically less
expensive and more productive wells in
environments such as deepwater.
Halliburton’s Security DBS revolution-
ized its production process in 2000 for
roller cone bits. Onsite engineers were
empowered to modify standard designs
to meet unique conditions and take the
design directly to prototyping and manu-
facturing. The result is custom-designed
bits in a third the time required by
traditional methods.
Besides the RESolution 3-D system
already mentioned, Sperry-Sun introduced
Geo-Pilot™ rotary steering system,
T E C H N O L O G Y F L A G S H I P S
14 HALLIBURTON COMPANY 2000 ANNUAL REPORT
developed jointly with Japan National Oil
Corporation, as the industry’s first true
point-the-bit rotary steerable drilling tool.
The system produces clean, straight and
smooth wellbores with less vibration.
w
Minimum hole spiraling in turn improves
hole cleaning, logging, and the quality of
the cement jobs. Geo-Pilot enables
precise, economical drilling of difficult
well paths and will help push the limits
of extended-reach drilling.
Cementing and zonal isolation, a
Halliburton strength since its founding,
saw the release of the third version of
OptiCem™ simulation system for design-
ing optimum cementing operations, and
OptiCem RT™ (Real Time), that allows
onsite specialists to monitor a job
in progress and make adjustments
immediately. In addition, two new
advanced pressure pumping units were
introduced: Halliburton Precision,™ a
single pump unit, and Halliburton Elite,™
a twin pump cementing trailer. These
new units feature the RCM® IIE mixing
system that ensures accurate mixing over
a broad range of conditions, and ADC,™
the system that automatically controls
slurry density throughout the job.
Expandable tubing, a product of
Halliburton’s Enventure partnership
with Shell Technology Ventures, is an
important technology that is extending the
DIAMOND HEADEDDRILL BITS areused in a variety of scenarios to achieve a lowercost per foot. Theserevolutionary bitsalso can achievegreater drillingrates than rollercone bits, resultingin fewer trips.

LANDMARKis developing 4-Dseismic technology,which uses multipleperiodic 3-D surveysolutions to continuallymonitor fluid andpressure changes inreservoirs.

adva
nced
wel
lwhen Halliburton received a patent for a
neural network method of controlling
reservoir development. Developed jointly
with BioComp Systems, Inc., of Redmond,
Washington, and using their self-optimiz-
ing neural network technologies, this system
will provide better ways to determine the opti-
mum method of completing a reservoir,
optimizing production with stimulation and
treatment, and predicting the output.
BioComp’s neural networks can learn the
relationships among the variables that affect
future production, such as the geological
formation and drilling, completion, and
stimulation methods. Halliburton’s
engineers can use this information in
conjunction with reservoir understanding to
perform the delicate balancing act involved
in choosing optimum completion strategies.
This technology has been incorporated into
Halliburton’s SigmaSM service. H
T E C H N O L O G Y F L A G S H I P S
17HALLIBURTON COMPANY 2000 ANNUAL REPORT
he goals of well production technolo-
gies are to maximize the rate of hydro-
carbon production, increase the recovery
rate from the reservoir, and reduce produc-
tion costs. Included in this flagship are com-
pletions, multilaterals, stimulation
technologies, and intervention systems.
Some of the new technologies discussed
under reservoir solutions, such as RMT
Elite, also contribute to advancing the art
of well production.
Intelligent completion technologies
provide downhole sensing, communication
and remote control of completion tools. This
allows operators on the surface and in
remote locations to optimize reservoir per-
formance by interpreting downhole data in
real time and operating flow control devices.
Halliburton developed SmartWell™ tech-
nology for intelligent completions with PES
(International). In February 2000,
Halliburton acquired the remaining 74
percent of PES, and it is now a wholly
owned subsidiary. In April, Halliburton
announced plans to form WellDynamics, a
joint venture with Shell International
Exploration and Production B.V., to further
develop and market this technology.
WellDynamics will combine Halliburton’s
SmartWell intelligent completions tech-
nology with Shell’s iWell™ intelligent well
technology. Together, they will be the state
of the art in downhole measurement, inflow
control, downhole processing, and commu-
nications technologies that will enable
operators to reconfigure a well’s architecture
at will using real-time data. The net result
will be maximized fluids production
without intervention, and improved total
recovery – a combination that will have a
dramatic impact on a well’s economics for
Halliburton’s customers.
Another important tool for boosting
reservoir performance debuted in 2000
t
WELLDYNAMICS TECHNOLOGY will enable operators to remotely reconfigure a well’sarchitecture in real time to boost production.
water
T E C H N O L O G Y F L A G S H I P S
18 HALLIBURTON COMPANY 2000 ANNUAL REPORT

T E C H N O L O G Y F L A G S H I P S
19HALLIBURTON COMPANY 2000 ANNUAL REPORT
eep water – depths greater than 1,500
feet – is the arena with the greatest
number of large untapped reservoirs and
greatest revenue growth potential for
Halliburton. As oil and gas companies move
into ever-deeper water to meet the demand
for energy, they are predicted to spend about
$84 billion in deepwater development over
the next five years. Most of this spending
will be on multibillion-dollar projects, where
the preferred contractors will be large
integrated service companies who are able
to supply the necessary combination of key
technologies and project management skills.
Halliburton aims to be the uniquely
qualified contractor for such developments.
Deepwater development has special
challenges. Reservoirs in a field tend to be
widely dispersed, and for cost reasons must
be developed with relatively few wells
requiring minimal intervention. This is why
Halliburton’s deepwater flagship includes
many of the advanced technologies already
mentioned. Real-time reservoir description,
Enventure expandable tubing, Anaconda,
multilaterals, advanced stimulation and
SmartWells are all key enablers for the deep-
water environment. In fact, it is the com-
bined excellence of the other four flagships
that make Halliburton a leader in pursuing
deepwater work.
In addition, the company has introduced
d
vention to restore the flow. Wax Eater,TM
Halliburton’s new system currently being
field tested, is installed at the wellhead and
breaks up the wax, removing it from the
mixture. Wax Eater will eliminate the need
for far more expensive alternative treat-
ments, and enable the extended tie-backs
that are critical to developing fields of
smaller, widely dispersed reservoirs.
In addition to specific technologies,
success in this arena also depends on the
ability to treat deepwater projects with a
total systems approach, matching all the sur-
face and subsurface components, while
reducing cycle times, capital expenditures
and operating expenditures. These
capabilities are based on Halliburton’s
innovative products and services, as well
as its roster of skilled project managers, who
specialized technolo-
gies for deepwater
work in recent years,
such as faster
Remotely Operated
Vehicles (ROVs) with
greater mechanical
abilities; flexible riser
systems made from
carbon fiber compos-
ites that lift the
hydrocarbons to the
surface and reduce the
need for surface
equipment; and smart
tie-backs and smart
control buoys that
can make remote-
controlled adjust-
ments in producing
fields spread over a
wide area. All of these
areas will see further
development in com-
ing years. Together
they are making possible deepwater work
that was out of reach just a few years ago.
The year’s most promising deepwater
breakthrough comes from the field of
flow assurance – technologies that allow
improved uninterrupted flow of hydro-
carbons over time. Specifically, sending
crude oil through long tie-
backs in cold, deep water
creates the danger of wax
and gas hydrates forming
deposits. This in turn
requires expensive inter-
IN THE HOSTILEDEEPWATERenvironment, specialized Halliburtontechnologies like themechanically adeptRemotely OperatedVehicles pictured on this page can performthe most intricate ofmechanical maneuvers.

RICHARD D’SOUZA
Richard D’Souza joined Halliburton with a clear mission: develop a premier engineering team for
deepwater floating production and subsea systems. With his 25 years of experience, his reputation
with customers for technical excellence and his team-building success, Richard was the natural
choice. “Breakthroughs in deep water will come from a focused, elite engineering group creating
technology and execution strategies that will accelerate development. That makes the magic that
brings the customers to us. I’m excited to be working with a wonderful team on these challenging
projects. Ever since I came to the U.S. as a student from India, I’ve lived by the maxim that some-
times you have to go out on a limb, because that’s where the fruit is.”
The first two wells were completed in
January, 2001.
The subsea work will involve the manu-
facture of 28,000 tons of flowlines by
Halliburton’s Wellstream unit. Halliburton
Subsea will install the risers, flowlines, umbil-
icals and seabed fixtures in water depths from
2,500 feet to 4,000 feet.
Halliburton will supply two FPSOs,
which together will produce 300,000
barrels per day. One will be converted
in Brazil’s Rio State Shipyards. Detail
design for the topsides, along with the
fabrication and installation of 100,000 tons
of process and utility modules, will also
be done by Brazilian contractors. This
high degree of local content, under
Halliburton’s project management, will
fulfill one of Rio State’s important
objectives – the growth and revitalization of
key sectors of its economy. Halliburton will
also hook up the wells to the FPSOs, com-
mission both vessels and subsea
systems, and operate the field for the first
three months.
Barracuda/Caratinga is the first deepwater
mega-project to be managed by one compa-
ny under one EPIC contract. It solves a cru-
cial development and energy supply
problem for the customer, Brazil’s national
oil company, and serves as a demonstration
of Halliburton’s end-to-end project
management and execution capability
in deep water. H
have proven their worth in managing huge
development and fabrication jobs all over
the world.
Recent projects include Exxon Diana in
the Gulf of Mexico, which involved fabri-
cating a record-sized production platform
and executing horizontal well completions;
and the $2 billion Terra Nova field offshore
Newfoundland, which included building
one of the largest floating, production, stor-
age and offloading (FPSO) vessels built to
date, plus drilling and completing six
complex subsea wells. This year saw the
start of engineering, procurement, installa-
tion and construction (EPIC) work for a
$300 million offshore oil and gas facility in
Nigeria for Shell, including fabrication of a
mooring facility and the largest FPSO built
in the last five years. All of these projects
require the global resources and innovative
project management that few organizations
besides Halliburton can offer. By far the
biggest and most important deepwater
development in the world today is the $2.5
billion Petrobras Barracuda/Caratinga pro-
ject offshore Brazil. This EPIC contract is
believed to be the largest ever awarded to a
single contractor.
This project began with a breakthrough
in project finance, as foreign banks and
trading companies came together to form a
special purpose company, Barracuda &
Caratinga Leasing Company B.V.
Halliburton is lending its project manage-
ment and project finance expertise as the
EPIC contractor to facilitate the financing
arrangements for Petrobras.
The size and scope of the project are also
precedent-setting. The development of
these two fields, which together have
reserves estimated at 1.2 billion barrels, will
take from late 2000 to the spring of 2004.
Halliburton’s work includes subsurface well
construction and completion, subsea
manufacturing and installation, and float-
ing production.
The subsurface work will be on 51 wells.
Virtually every Halliburton product and
service line will take part, with Sperry-Sun
drilling services and the completions group
performing the lion’s share of the work.
20 HALLIBURTON COMPANY 2000 ANNUAL REPORT
T E C H N O L O G Y F L A G S H I P S
HALLIBURTON SUBSEA places a pre-fabricatedoffshore pipeline bundle with its ControlledDepth Tow Method.

DEEP SEA PLATFORMfabrication is just partof Halliburton’s abilityto treat deepwaterprojects with a totalsystems approach.

22 HALLIBURTON COMPANY 2000 ANNUAL REPORT
T E C H N O L O G Y F L A G S H I P S

value of efficient, low-cost drilling systems,
such as Geo-Pilot and Anaconda, and
efficient production technologies, including
intelligent completions and management of
reservoirs to maximize the recovery rate. In
addition, the floating technologies used in
deep water – FPSOs, mooring and docking
systems, pipeline and terminal design and
construction – play a large role in developing
natural gas reserves.
However, the largest part of the gas
monetization flagship is the proprietary
processing technology, the engineering skill
and the construction infrastructure of
Halliburton’s Kellogg Brown & Root
business unit, which is described in the
following section. H
urning the world’s abundant supply of
natural gas into commercial products will
grow in importance over the next decade.
Clean-burning natural gas is becoming the
fuel of choice for generating electric power
in North America. In other regions, liquefied
natural gas (LNG) offers a way to
commercialize gas without building a
pipeline infrastructure. Demand for natural
gas for downstream products, such as
ammonia, ethylene, and propylene, will
continue to be strong in all regions.
And just over the horizon is the prospect
of gas to liquids (GTL) technology – the
conversion of natural gas into premium
liquid hydrocarbons and other specialty
products – and the continued development
of fuel cell technology. Both of these
emerging industries could further increase
the demand for natural gas.
Increased demand for gas will spur
demand for virtually all of Halliburton’s
services – energy services as well as
engineering and construction. The tech-
nologies described in the other flagships
will be valuable in the gas monetization
business. In addition, the technology lead-
ership of the Engineering and Construction
Group in gas processing plant technology is
a critical part of this flagship.
Natural gas exploration and production
requires drilling many wells, because the
wells often experience rapid rates of
declining production. This points to the
T E C H N O L O G Y F L A G S H I P S
23HALLIBURTON COMPANY 2000 ANNUAL REPORT
tKBR’S LNG CAPABILITIES KBR’s unparalleled proprietary process technology, engineering skills and construction infrastructuremake it the leader in worldwide gas monetization.
MANFRED PRAMMER
Dr. Manfred Prammer is president of NUMAR, the Halliburton division that brought magnetic
resonance (MR) technology to the oilfield. An Austrian by birth, a physicist by training, and a teacher
by disposition, Manfred heads NUMAR’s team of scientists and engineers developing a range of
“disruptive technologies” – paradigm-breaking ideas like MR logging. “NUMAR is unique within
Halliburton. This group is not about making incremental improvements to existing technologies –
the industry already does that very well. We are looking for breakthroughs that will have a
profound, non-linear effect on the energy business. This is exciting, challenging work, and that
helps us attract top people.”

E N G I N E E R I N G & C O N S T R U C T I O N G R O U P
24 HALLIBURTON COMPANY 2000 ANNUAL REPORT

he Engineering and Construction
Group was consolidated into a single busi-
ness unit, Kellogg Brown & Root, at the
end of 2000. Beginning in 2001, the reor-
ganization will be complete, and the com-
pany’s financial statements will reflect this
change.
Energy-related work accounts for the
largest portion of the Group’s business.
This segment principally serves a wide
range of needs in the petroleum industry –
designing and building refining and pro-
cessing plants, surface facilities and
pipelines. This work complements the
business of our Energy Services Group,
forming a unique, integrated end-to-end
capability serving the petroleum industry –
subsurface, surface, facilities, and process-
ing. The non-energy business of the group
uses the same skill set and the same deep
corporate resources to meet the needs of
governments and civil infrastructure cus-
tomers.
With the inclusion of the engineering
and construction business of Brown & Root
Energy Services, KBR has added design,
fabrication and installation of offshore
production facilities and extensive oil and
gas production background to its leadership
position in hydrocarbon processing.
This combination will be particularly
valuable to natural gas customers. KBR
already has a strong position in LNG and
onshore gas production. Now customers
with offshore gas fields have the advantage
of dealing with just one company to help
them develop, process and transport their
gas production, onshore or off.
KBR’s competitive advantages begin
E N G I N E E R I N G & C O N S T R U C T I O N G R O U P
25HALLIBURTON COMPANY 2000 ANNUAL REPORT
t

with the expertise of its people. The depth
and breadth of their experience, and their
ability to marshal that experience to meet
customers’ needs today and in the future are
unmatched in the industry. This pool of
intellectual capital has proven its value by
developing proprietary process technologies
in key areas, and by creating innovations in
the technology of project execution that
help KBR design and build faster and
better. Added to this intellectual capital is
the financial strength and the ability to take
on large lump-sum projects that are beyond
the range of other competitors.
Natural Gas
Monetization of natural gas is a critical
need for the energy industry as a whole, a
flagship technology for Halliburton, and a
particular area of expertise for KBR. Natural
gas development includes liquefied natural
gas (LNG), ammonia, and olefins –
ethylene and propylene.
LNG is particularly important, as it
represents the only current commercially
feasible way of using stranded gas – natural
gas where pipeline infrastructure does not
exist and is not practical. This is the case
liquefaction plants using a new dynamic
simulation program that eliminates the
inherent over-design that is characteristic of
traditional methods.
Another aspect of natural gas use is in
converting natural gas feedstocks into
ammonia for fertilizer. In this area, KBR’s
technologies account for more than half
the worldwide production capacity. Recent
innovations in this area include KAAPplus™
– a complete, state-of-the art process tech-
nology that combines the KBR Advanced
Ammonia Process (KAAP), the KBR
Reforming Exchanger System (KRES™),
and the Braun Purifier.
In olefins, KBR’s Selective Cracking
Optimum Recovery (SCORE™) process,
combining portions of KBR’s and
ExxonMobil Chemical’s ethylene tech-
nologies, will be licensed to Thai Olefins.
This plant, which will be built in partner-
ship with Chiyoda of Japan, will be the first
new ethylene project in Asia since the
recent recession. A letter of intent was
signed in 2000, and project completion is
scheduled for 2004.
This year also saw the mechanical com-
in most of the world, especially Asia, where
there are large natural gas reserves to be
developed.
KBR has built, either alone or in joint
ventures, the majority of the world’s LNG
complexes. It is currently working on
large-scale projects at Bonny Island,
Nigeria, as well as in Malaysia, Algeria,
Qatar, Australia, Egypt and the Americas.
Technological advances in LNG are
typically efficiencies in the engineering of
large plants and equipment rather than
breakthroughs in process technologies. In
this area, KBR’s breadth of experience and
roster of specialists put it in an excellent
position to continue capturing a major
share of future LNG engineering and
construction business.
KBR has established a position as one of
the preferred providers due to its reputation
for helping clients deliver the lowest cost
LNG. In 2000, KBR added to its position
with a series of design firsts for the Ras
Laffan Onshore Facilities Project in Qatar,
including built-in reliability and maintain-
ability in the design. KBR engineers also
developed a new way of designing LNG
E N G I N E E R I N G & C O N S T R U C T I O N G R O U P
26 HALLIBURTON COMPANY 2000 ANNUAL REPORT
EXACTING CRAFTSMANSHIP is never compromised, no matter where in the worldKBR works. For decades, non-stop innovation and quality – coupled with anunrivaled dedication to health, safety and environmental protection – have keptKBR out in front.
UNMATCHED IN THE INDUSTRY, KBR peopleprovide the clear advantage in the mostimportant area: intellectual capital.

were selected by OMV Deutschland
GmbH for production of premium diesel
fuel in its refinery at Burghausen, Germany.
When completed, the plant will process
atmospheric distillate and gas oil feedstocks
to produce high-quality diesel fuel with less
than 10 ppmw sulfur content. KBR per-
formed basic engineering design for the
unit as part of its work with the Alliance.
In 2000, KBR formed an alliance with
Fortrum Oil and Gas Oy of Finland to offer
NExOCTANE, a new process technology
for high-octane gasoline. NExOCTANE
solves the problem of how to eliminate
MTBE in gasoline production. The new
technology allows refiners to convert their
existing MTBE production facilities
to isooctane, a cost-effective replacement
for MTBE. KBR will offer this
technology for license and will provide
engineering and continuing technical sup-
port to licensees.
Innovative Business Processes
KBR is also offering a broader range of
services aimed at creating and structuring
successful engineering and construction
projects. The company has joined
with Mitsubishi Corporation to offer cus-
pletion of the ExxonMobil Olefins Project
in Singapore. KBR and Chiyoda provided
the basic design, engineering, procurement
and construction for this 800,000-ton-a-year
ethylene plant under a lump-sum contract
which, along with ancillary work, was about
half the $2 billion Singapore Chemical
Plant. This project uses the ExxonMobil
low-residence-time cracking technology
that is now part of KBR’s SCORE offering.
In propylene, KBR acquired an exclusive
license in 2000 from Lyondell for its
SuperflexSM technology. Superflex converts
low-value, low-octane light gasoline streams
into propylene and ethylene by a catalytic
process. This new offering responds to
customer needs to find alternative uses for
the feedstocks that are now producing
methyl tertiary butylether (MTBE) for
gasoline. As MTBE is phased out for
environmental reasons, Superflex will
provide customers a valuable option for
upgrading these low-value products. KBR
has made this technology available for license,
with the first contracts expected in 2001.
Clean Fuels The production of clean fuels
is another area of focus
for proprietary tech-
nology. Increasingly
stringent standards in
the U.S., European
Union and elsewhere
require refiners to
continuously improve
particulate and gaseous
emissions.
The MAKfining™
Premium Distillate
Technologies intro-
duced in 1999 by the
MAKfining Alliance
E N G I N E E R I N G & C O N S T R U C T I O N G R O U P
27HALLIBURTON COMPANY 2000 ANNUAL REPORT
CHARLES DURR
Charlie Durr has spent over 30
years helping to make KBR the
leading builder of LNG plants.
From his current position as
Technology Vice President for
LNG, Gas Processing and Gas
to Liquids, he oversees strategy,
technology, and risk manage-
ment. “We’re successful because our people can build complex pro-
jects in challenging locations. We know every part of the business –
designing and building the plants, and dealing with the realities of
s c h e d u l e ,
vendors, and client expectations. We learn how to manage risks, and
how to look for opportunities to innovate. Each project is an occasion
to develop our people. That’s what I learned playing stickball in
KELLOGG BROWN & ROOT

comprehensive, innovative approaches to choosing process
technologies, securing project funding, building plants and
infrastructure, and developing markets.
Project Execution Technology
Project execution technology – finding ways to remove time
and cost from projects through better ways to use the
organization’s intellectual capital – is the extra dimension that
complements KBR’s excellence in process engineering and
creates value in unexpected ways.
In 2000, KBR developed a breakthrough in high-tech work
processes with 3-D Conceptual™ – a collaborative work
environment that enables a multidisciplinary team to visual-
ize front-end engineering designs in 3-D. It is a work process
that uses KBR’s historical database of design experience to
create a 3-D model that enables early collaboration at the start
of the design process. It brings together the knowledge and
experience of KBR engineers in applying low-cost reference
designs. The 3-D visualization gives early and improved feed-
back to determine the cost implications of design decisions,
and allows the process engineer to interact with construction,
maintenance, piping, and other engineering groups at project
conception.
3-D Conceptual has the potential to drastically reduce the
time required for the engineering process, collapsing sequential
steps that traditionally take months into parallel activities that
take weeks. Similarly, it offers a better way to determine and
control project costs, 80% of which are determined in the front-
end phase. H
tomers a range of innovative business relationships through
KBR Development Corporation (KBRDC), which landed its
first project in 2000. KBRDC brings together owners of
feedstocks, funding sources, and potential end users to put
together workable projects. As a facilitator or developer,
KBRDC draws on the global resources of its partners to
support the development of projects in all the industries served
by KBR.
The first fruit of the KBRDC effort was in Trinidad, where
KBR was awarded multiple contracts from Ferrostaal
Aktiegensellschaft of Germany and Caribbean Nitrogen
Company Ldg. of Trinidad and Tobago to provide technology
licenses, basic engineering design and other services for an
ammonia plant using KBR’s KAAP process.
KBRDC is using the same approach in other parts of
the world where feedstocks exist and customers need
E N G I N E E R I N G & C O N S T R U C T I O N G R O U P
28 HALLIBURTON COMPANY 2000 ANNUAL REPORT
THE FARMLAND MISSCHEM LTD. AMMONIA PLANTin Trinidad produces 1,850 metric tons ofammonia per day.
KBR'S PROJECT EXECUTION TECHNOLOGYhelps win EPC contracts in manypetrochemical processing industries.
3-D CONCEPTUAL enables a design team tovisualize front-end engineering designs in 3-D.

E N G I N E E R I N G & C O N S T R U C T I O N G R O U P
29HALLIBURTON COMPANY 2000 ANNUAL REPORT
THE LNG PLANT AT WOODSIDE, Northwestshelf, Australia, designed by a KBR jointventure, uses air instead of water as the primary cooling medium – a first in LNGproduction.

H E A L T H , S A F E T Y & E N V I R O N M E N T
30 HALLIBURTON COMPANY 2000 ANNUAL REPORT

alliburton’s customers, especially
those working in new and remote
areas, need a service company that will help
them reduce their risks, and they are plac-
ing increasing emphasis on environmental
matters when issuing contracts. Customers
also need a service company that will help
them achieve their goals in the areas of the
triple bottom line — financial performance,
social benefit, and environmental protec-
tion. Halliburton is committed to integrat-
ing social equity concerns into its business
decision-making, capturing of the value
through improved stakeholder relations,
and reducing the company’s overall
environmental footprint. Halliburton’s con-
tinuing commitment to being the environ-
mental partner of choice is an asset in
competing for business.
And for investors, environmental
performance can be a source of hidden
value potential. Among other things,
it measures environmental risk exposure,
the ability to manage risk, and the ability
to capitalize on environmentally driven
business opportunities. These in turn have
H A business model that integrates HSE
into the core company business develop-
ment activities.
H Highly regarded HSE Management
System.
H Superior performance on emissions
and spills.
H Taking the lead in setting emission
reduction goals via energy conservation
measures.
H Developing the world’s first biodegradable
invert emulsion drilling fluid system.
H Engaging in R&D for CO2 sequestration
and the reduction of flaring in gas
processing. H
strong implications for stock price
performance. Back-test evidence indicates
that a diversified portfolio of environmen-
tally high-performing companies can be
expected to outperform its less efficient
competitors. It has been estimated that
environmental excellence turns out to be an
extraordinarily good proxy for — and
predictor of — superior corporate manage-
ment, which in turn generates financial
outperformance and shareholder value.
Halliburton’s outstanding environmen-
tal performance is demonstrated by:
H Genuine commitment by Board and
senior management.
H E A L T H , S A F E T Y & E N V I R O N M E N T
31HALLIBURTON COMPANY 2000 ANNUAL REPORT
h
In 2000, Halliburton continued to make improvements in both recordable and lost-time incident rates. Our performance, frequently in harsh and hazardous working conditions, compares very favorably with that of our industry peers. *1999 OSHA data is most recent data available
Lost Time Incident Rates (per 200,000 work hours)Halliburton Company vs. OSHA Industry Sector Averages*
0.881998
1.021997
199
9O
il &
Ga
s
199
9E
ng
. &
Co
ns.
199
9M
an
ufa
ctu
rin
g
0.651999
0.562000
3.8 1.8 4.6
Recordable Incident Rates (per 200,000 work hours)Halliburton Company vs. OSHA Industry Sector Averages*
2.211998
3.121997
HalliburtonHalliburton
199
9O
il &
Ga
s
199
9E
ng
. &
Co
ns.
199
9M
an
ufa
ctu
rin
g
1.771999
1.722000
7.8 3.5 9.2

H A L L I B U R T O N C O M P A N Y F I N A N C I A L I N F O R M A T I O N
HALLIBURTON COMPANY 2000 ANNUAL REPORT
financial information
32

In this section, we discuss the operating results and generalfinancial condition of Halliburton Company and its subsidiaries.We explain:
• factors and risks that impact our business;• why our earnings and expenses for the year 2000 differ from
the years 1999 and 1998;• capital expenditures;• factors that impacted our cash flows; and• other items that materially affect our financial condition or
earnings.
BUSINESS ENVIRONMENT
Our continuing business is organized around two businesssegments:
• Energy Services Group; and• Engineering and Construction Group.
We also report the results of a third business segment, DresserEquipment Group, as discontinued operations.
As the largest provider of products and services to the petroleumand energy industries, the majority of the consolidated revenuesare derived from the sale of services and products to large oil andgas companies. We conduct business in over 120 countries withenergy, industrial and governmental customers. These servicesand products are used in the earliest phases of exploration anddevelopment of oil and gas reserves through the refining anddistribution process. The industries we serve are highlycompetitive with many substantial competitors for each segment.
No country other than the United States or the UnitedKingdom accounts for more than 10% of our operations. Unsettledpolitical conditions, expropriation or other governmental actions,exchange controls and currency devaluations may result inincreased business risk in any one country, including, amongothers, Algeria, Angola, Libya, Nigeria, and Russia. We believethe geographic diversification of our business activities reducesthe risk that loss of business in any one country would bematerial to our consolidated results of operations.
Halliburton Company
The year 2000 showed increased activity in the North Americanenergy services environment. The international recovery from1999 levels is expected to materialize in 2001. The engineeringand construction business remains hampered by lower customercommitments; however, we believe the long-term fundamentalsremain sound. Rising populations in many countries and greaterindustrialization efforts should continue to propel worldwideeconomic expansion, especially in developing nations. We expect
these factors to cause increasing demand for oil and gas neededfor refined products, petrochemicals, fertilizers, power, and otherneeds.
Energy Services Group
During 2000, the demand for the group’s oilfield services andproducts recovered from lower levels in 1999 and late 1998.Consistent with past history, the activity levels in the UnitedStates were the first to rebound with increased demand forproducts and services and an improved pricing environment.International activity began to improve in the second half of2000. Growth in our business was driven primarily by increasedrotary rig count on natural gas wells in North America. The rotaryrig count, which is an indicator of activity, hit near-term recordhighs for the third and fourth quarters after a brief drop in thefirst half of the year. Some experts project that the average rigcount for 2001 will increase over 20% as compared to 2000. Ifforecasts prove to be accurate, this would be the highest level ofactivity in North America since 1985. This growth should have afavorable impact for the Energy Services Group.
Crude oil prices remained at or near record highs throughout2000, with West Texas Intermediate ending the year at over$32 per barrel. Natural gas prices continued to climb as a resultof North America experiencing the coldest weather in recentyears and low volumes of gas in storage. Henry Hub gas pricesaveraged $6.20/MCF in the fourth quarter of 2000 and$8.12/MCF for the month of December with occasional spikesover $10.00/MCF during the month. For the year, Henry Hubgas prices averaged $4.20/MCF compared to $2.27/MCF in1999. We believe the continued high commodity prices bodewell for the industry and should encourage our customers toincrease investments in exploration and production.
Internationally, our business activity levels have notincreased as much as in North America, although customerswho are focused on oil projects are now starting to increasetheir global capital spending. The turnaround in internationalrig activity continued in the fourth quarter, with the highestaverage rig count since 1998 at 710 rigs working compared to576 in 1999. However, we do not expect to see any significantincrease in larger capital-intensive field development projectsoutside North America until the second half of 2001. Themerger and consolidation activities of a number of largecustomers over the past two years have affected the demandfor our products and services. The companies that havemerged continue to evaluate their oil and gas properties,refining and distribution facilities, and organizations. Thisevaluation process has translated into a short-term reluctanceto undertake new investments resulting in a lower demand forsome of our products and services in 2000, especially outsideNorth America.
33HALLIBURTON COMPANY 2000 ANNUAL REPORT
M A N A G E M E N T ’ S D I S C U S S I O N A N D A N A L Y S I S

Engineering and Construction Group
Most of the factors that adversely affected the Energy ServicesGroup in 1999 and 1998 also affected the Engineering andConstruction Group since over half of the group’s revenues comefrom customers in the oil and gas industry. We believe the higherrig counts experienced in the second half of 2000 and expectedfor 2001 should begin to positively impact the Engineering andConstruction Group six to 12 months after the Energy ServicesGroup. Customers of the group are more reluctant to start largecapital projects, including refineries and petrochemical plants,during periods of uncertain oil prices. Merged customers ration-alizing and optimizing their existing capabilities have furtherdelayed project starts. The group has seen a number of largepotential projects deferred because of uncertain prices forpetroleum products. The group is beginning to experience anincrease in inquiries for bids and proposals for potential newprojects, including several large international liquefied natural gasprojects. The Engineering and Construction Group hascontinued to expand its services to the military – both in theUnited States and abroad. The group sees improving opportu-nities to provide additional support services to other UnitedStates agencies and to government agencies of other countries,including the United Kingdom. The demand for these servicesis expected to grow as governments at all levels seek to controlcosts and improve services by outsourcing various functions.
RESULTS OF OPERATIONS IN 2000
COMPARED TO 1999 AND 1998
REVENUES
Millions of dollars 2000 1999 1998Energy Services Group $ 7,916 $ 6,999 $ 9,009Engineering and
Construction Group 4,028 5,314 5,495Total revenues $ 11,944 $12,313 $14,504
Revenues for 2000 were $11,944 million, a decrease of 3%from 1999 revenues of $12,313 million and a decrease of 18%from 1998 revenues of $14,504 million. In regard to 2000 comparedto 1999, lower levels of engineering and construction revenues inboth segments were partially offset by increased oilfield servicesrevenues within the Energy Services Group, particularly in theUnited States. In regard to 2000 compared to 1998, the declinewas experienced in both segments. While our oilfield servicesbusiness recovered substantially during 2000, activity levels werestill about 10% lower than in 1998. The 2000 total engineeringand construction activity within both segments was off almost25% as compared to 1998 as customers continued to postponemost major new investments. International revenues were 66%of our consolidated revenues in 2000, compared with 70% in1999 and 68% in 1998.
Energy Services Group revenues were $7,916 million for2000, an increase of 13% from 1999 revenues of $6,999 millionand a decrease of 12% from 1998 revenues of $9,009 million.International revenues were 66% of total segment revenues in2000 compared with 71% in 1999 and 67% in 1998. Revenues forthe group were positively impacted in late 1999 and throughout2000 by increased rig counts and customer spending, particularlywithin North America, following increases in oil and gas pricesthat began in 1999. Increased demand for natural gas andincreased drilling activity positively benefited our oilfieldservices product service lines. The pressure pumping andlogging product service lines achieved revenue growth of 30%and 27%, respectively, compared to 1999. Drilling fluidsincreased over 20%, while drill bits and completion productsservice lines increased about 14%. Drilling systems service linerevenues increased by 7%. Geographically, strong NorthAmerican activity resulted in revenue growth of 43%, withgrowth experienced across all product service lines in that regioncompared to 1999. North America generated 52% of total oilfieldservice product service line revenues for 2000 compared to 44%in 1999. Pressure pumping accounted for approximately 50% ofthe increase in revenues within North America, reflecting higheractivity levels in all work areas, particularly the Gulf of Mexico,South Texas, Canada, and Rocky Mountains. Revenues in theMiddle East and Latin America regions increased 16% and 12%,respectively, compared to 1999. Europe/Africa revenues were upslightly while revenues in the Asia Pacific region declined by 3%.Activity was slower to increase internationally throughout 2000despite higher oil and gas prices. The turnaround in internationalrig activity, which started late in the second quarter of 2000,continued into the fourth quarter of 2000 when international rigcounts reached the highest levels since late 1998. Revenues alsoincreased across all regions outside North America during thefourth quarter of 2000, as customer spending for exploration andproduction began to increase outside North America.
Revenues from upstream oil and gas engineering andconstruction services declined 2% in 2000 compared to 1999 andabout 20% compared to 1998. The decrease in 2000 reflects thecontinued delay in engineering and construction projectspending by our customers. Upstream engineering andconstruction business revenues benefited in 2000 fromdeepwater projects in Latin America, particularly Mexico, andAfrica, reflecting the continued shift in work out of the NorthSea and into Latin America, Africa and Asia Pacific. In 1998,revenues from upstream oil and gas engineering and constructionservices benefited from large projects and from activities in thesubsea, pipecoating and flexible pipe product service lines.
Revenues for integrated exploration and productioninformation systems reached record high levels in 2000, breakingthe previous high set in 1998. Revenues from integratedexploration and production information systems increased 13%compared to 1999, and increased slightly over 1998. Increases in
34 HALLIBURTON COMPANY 2000 ANNUAL REPORT
M A N A G E M E N T ’ S D I S C U S S I O N A N D A N A L Y S I S

software and professional services revenues were partially offsetby lower hardware revenues, which have been de-emphasized.Software sales contributed just over 19% in revenue growth,while professional services increased over 7% compared to 1999.In 1999 many customers for our information system product linesput off software purchases due to customers’ consolidations,lower activity levels and internal focus on Year 2000 issues.
Engineering and Construction Group revenues were$4,028 million for 2000, down 24% from $5,314 million in 1999and down 27% from 1998 revenues of $5,495 million. Higher oiland gas prices during 2000 did not translate into customersproceeding with new awards of large downstream projects. Manyother large projects, primarily gas and liquefied natural gasprojects, were also delayed, continuing a trend that started in1999. In 1999 the group increased logistics support services tomilitary peacekeeping efforts in the Balkans and increasedactivities at the Devonport Dockyard in the United Kingdom.The logistics support services to military peacekeeping efforts inthe Balkans peaked in the fourth quarter of 1999 as the mainconstruction and procurement phases of the contract werecompleted. These increases partially offset lower revenues fromengineering and construction projects, particularly major projectsin Europe and Africa, which were winding down. Revenues forthe group in 1998 reflect higher liquefied natural gas projectrevenues in Asia and Africa, an enhanced oil recovery project inAfrica, and a major ethylene project in Singapore.
OPERATING INCOME
Millions of dollars 2000 1999 1998Energy Services Group $ 526 $222 $971Engineering and
Construction Group 14 203 237General corporate (78) (71) (79)Special charges and credits Ñ 47 (959)Operating income $ 462 $401 $170
Operating income was $462 million for 2000 compared to $401million for 1999 and $170 million for 1998. Business segmentresults include restructuring charges of $36 million in 2000related to the restructuring of the engineering and constructionbusinesses. See Note 11. Excluding special credits of $47 millionin 1999 and special charges of $959 million during 1998,operating income for 2000 increased by 31% from 1999 anddecreased 59% from 1998. See Note 12.
Energy Services Group operating income in 2000 was$526 million, an increase of 137% from 1999 operating income of$222 million and a decrease of 46% compared to 1998 operatingincome of $971 million. Operating margins were 6.6% in 2000, upfrom 3.2% in 1999 and down from 10.8% in 1998. Approximately33% of the Energy Services Group’s operating income wasderived from international activities for 2000, compared with 54%
in 1999 and 1998. During 2000, strengthening North Americandrilling and oilfield activity resulted in increased equipmentutilization and improved pricing within the oilfield servicesproduct service lines. Pressure pumping operating incomeincreased about 135% compared to 1999 levels, which weredown about 70% compared to 1998, while logging servicesoperating income increased by over 200% compared to 1999.Drilling fluids, drilling systems and completion products wereimpacted by slow recovery in international activity. During thefourth quarter of 2000, oilfield services recorded an $8 millionreversal of bad debts related to claims settled by the UnitedNations against Iraq dating from the invasion of Kuwait in 1990.Geographically, strong oil and gas prices throughout 2000 led tohigher levels of deepwater and onshore gas drilling within NorthAmerica. Activity increases in the Gulf of Mexico, South Texas,Canada, and Rocky Mountain work areas were greater than mostother areas. Operating income outside North America continuedto lag the performance noted within North America, reflectingcontinued delays in international exploration and production foroil and gas. On a positive note, fourth quarter 2000 operatingincome increased across all international geographic regionscompared to the third quarter, reflecting increased internationalspending by our customers.
Operating income in 2000 for upstream oil and gas engineeringand construction activities declined by 5% compared to 1999 and73% compared to 1998. Projects and workloads are increasinglyshifting from the North Sea to Latin America, Africa and AsiaPacific. Operating income benefited in 2000 from a third quarter$88 million gain on sale of two semi-submersible vessels and onemultipurpose support vessel. Lower activity levels in the NorthSea, particularly in the United Kingdom sector, negativelyimpacted operating income in 2000 and 1999 through lowerutilization of engineering staff, as well as under utilization ofmanufacturing and fabricating capacity and subsea equipmentand vessels, which carry large fixed costs. Given the number andtechnical complexity of the engineering and constructionprojects we perform, some project losses are normal occurrences.However, the environment for negotiations with customers onclaims and change orders has become more difficult in the pastfew years. This environment, combined with performance issueson a few large, technically complex jobs, contributed tounusually high job losses on major projects of $82 million in2000, including $48 million in the fourth quarter, $77 million in1999 and $99 million in 1998. In addition, the upstream oil andgas engineering and construction business recorded $11 millionof restructuring charges in 2000.
Operating income from integrated exploration and productioninformation systems in 2000 increased almost 200% compared to1999. Operating income in 2000 and 1999 was lower than 1998due to lower software sales volumes in 1999 and change in thesoftware license product mix from perpetual license sales forwhich income is recognized at the time of sale to annual access
35HALLIBURTON COMPANY 2000 ANNUAL REPORT
M A N A G E M E N T ’ S D I S C U S S I O N A N D A N A L Y S I S

licenses where income is recognized over the license period. Engineering and Construction Group operating income
for 2000 of $14 million decreased $189 million, or 93% from 1999and about $223 million, or 94% from 1998. The operating marginwas just above zero in 2000 down from 3.8% in 1999 and 4.3% for1998. Operating margins in 2000 declined both internationallyand in North America due to losses on projects as a result of higherthan estimated costs on selected jobs and claims negotiations onother jobs not progressing as anticipated. In the fourth quarter of2000, job losses of $109 million were recorded as a result of theseconditions. At the same time, the group recorded $25 million ofrestructuring charges. Lower activity due to the trend in delayednew projects, which continued through the year, also negativelyimpacted operating income. Operating income in 1999 benefitedfrom higher activity levels supporting United States militarypeacekeeping efforts in the Balkans, offset by reducedengineering and construction project profits due to the timing ofproject awards and revenue recognition. Operating income in 1998includes $16 million favorable settlement of a claim on a MiddleEastern construction project.
Special credits in 1999 are the result of a change in estimateon some components of the 1998 special charges. We continuouslymonitor the actual costs incurred and reexamine our estimates offuture costs. In the second quarter of 1999, we concluded thattotal costs, particularly for severance and facility exit costs, werelower than previously estimated. Therefore, we reversed $47million of the $959 million special charge that was originallyrecorded. See Note 12.
General corporate expenses for 2000 were $78 million,an increase of $7 million from 1999 and down $1 millioncompared to 1998. In 2000 general corporate expenses increasedprimarily as a result of costs related to the early retirement of ourprevious chairman and chief executive officer. In 1998 generalcorporate expenses of $79 million included expenses foroperating Dresser’s corporate offices as well as our corporateoffices. As a percent of consolidated revenues, general corporateexpenses were 0.7% in 2000, 0.6% in 1999 and 0.5% in 1998.
NONOPERATING ITEMS
Interest expense was $146 million for 2000 compared to$141 million in 1999 and $134 million in 1998. Interest expensewas up in 2000 due to higher average interest rates on short-termborrowings and additional short-term debt used to repurchase$759 million of our common stock under our share repurchaseprogram, mostly during the fourth quarter. These increasesoffset the benefits from our lower borrowings earlier in 2000 dueto the use of the proceeds from the sale of Ingersoll-DresserPump and Dresser-Rand to repay short-term debt.
Interest income of $25 million declined $49 million from1999 and was about the same as 1998. Interest income in 1999included settlement of income tax issues in the United Statesand United Kingdom and imputed interest income on the notereceivable from the sale of our ownership in M-I L.L.C.
Foreign currency gains (losses) netted to a loss of $5million, down from losses of $8 million in 1999 and $10 millionin 1998. The losses in 2000 were primarily in Asia Pacificcurrencies and the euro. Losses in 1999 occurred primarily inRussian and Latin American currencies. Losses in 1998 occurredprimarily in Asia Pacific currencies.
Other, net in 2000 was a net loss of $1 million compared to anet loss of $19 million in 1999 and a net gain of $3 million in 1998.The net loss in 1999 includes a $26 million charge in the secondquarter relating to an impairment of Kellogg Brown & Root’s netinvestment in Bufete Industriale, S.A. de C.V., a large specialtyengineering, procurement and construction company in Mexico.
Provision for income taxes on continuing operations was$129 million for an effective tax rate of 38.5%, compared to37.8% in 1999 and 281.8% in 1998. Excluding our specialcharges and related taxes, the effective rate was 38.8% in 1999and 37.8% in 1998.
Minority interest in net income of subsidiaries was$18 million in 2000 compared to $17 million in 1999 and $20million in 1998.
Income from continuing operations was $188 million in2000 and $174 million in 1999. In 1998 continuing operations wasa loss of $120 million.
Income from discontinued operations was $98 millionin 2000, $124 million in 1999 and $105 million in 1998.
Gain on disposal of discontinued operations resultingfrom the sale of our 51% interest in Dresser-Rand was $215 millionafter-tax or $0.48 per diluted share in 2000. In 1999 we recordeda gain on the sale of our 49% interest in Ingersoll-Dresser Pumpof $159 million after-tax or $0.36 per diluted share.
Cumulative effect of change in accounting method
in 1999 of $19 million after-tax, or $0.04 per diluted share,reflects our adoption of Statement of Position 98-5, “Reportingon the Costs of Start-Up Activities.” See Note 13.
Net income in 2000 was $501 million or $1.12 per diluted shareand in 1999 was $438 million or $0.99 per diluted share. In 1998the net loss of $15 million resulted in $0.03 loss per diluted share.
LIQUIDITY AND CAPITAL RESOURCES
We ended 2000 with cash and equivalents of $231 millioncompared with $466 million in 1999 and $203 million in 1998.
Cash flows from operating activities used $57 millionfor 2000 compared to $58 million used for 1999 and provided$150 million for 1998. Working capital items, which includereceivables, inventories, accounts payable and other workingcapital, net, used $563 million of cash in 2000 compared to
36 HALLIBURTON COMPANY 2000 ANNUAL REPORT
M A N A G E M E N T ’ S D I S C U S S I O N A N D A N A L Y S I S

providing $2 million in 1999 and using $533 million in 1998.Included in changes to working capital and other net changes arespecial charge usage for personnel reductions, facility closures,merger transaction costs, and integration costs of $54 million in2000 and $202 million in 1999 and $112 million in 1998.
Cash flows used in investing activities were $411million for 2000, $107 million for 1999 and $790 million for 1998.Capital expenditures of $578 million in 2000 were about 11%higher than in 1999 and about 31% lower than in 1998. Capitalspending was mostly for equipment for Halliburton EnergyServices, which included investing in cementing equipmentdesigned to integrate our pumping and mixing systems with newsafety and technological features. Cash flows from investingactivities in 1999 include $254 million collected on the receivablesfrom the sale of our 36% interest in M-I L.L.C. Imputed intereston this receivable of $11 million is included in operating cashflows. In 1998, net cash used for investing activities includesvarious acquisitions of businesses of approximately $40 million.
Cash flows from financing activities used $584 millionin 2000 and provided $189 million in 1999 and $267 million in 1998.We repaid $308 million on our long-term debt in 2000. Net short-term borrowings consisting of commercial paper and bank loansprovided $629 million in 2000. Proceeds from exercises of stockoptions provided cash flows of $105 million in 2000 compared to$49 million in 1999 and 1998. Dividends to shareholders used$221 million of cash in 2000 and 1999. In April 2000 our Board ofDirectors approved a plan to implement a share repurchaseprogram. As of December 31, 2000 we had repurchased over 20million shares at a cost of $759 million. In addition, werepurchased $10 million of common stock both in 2000 and 1999and $20 million in 1998 from employees to settle their income taxliabilities primarily for restricted stock lapses. We may periodicallyrepurchase our common stock as we deem appropriate.
Cash flows from discontinued operations provided$826 million in 2000 as compared to $234 million and $235million in 1999 and 1998, respectively. Cash flows for 2000include proceeds from the sale of Dresser-Rand and Ingersoll-Dresser Pump of approximately $913 million.
Capital resources from internally generated funds andaccess to capital markets are sufficient to fund our workingcapital requirements, share repurchases and investingactivities. Our combined short-term notes payable and long-term debt was 40%, 35% and 32% of total capitalization at theend of 2000, 1999 and 1998, respectively. In 2000, we reducedour short-term debt with proceeds from the sales of Ingersoll-Dresser Pump and Dresser-Rand joint ventures early in theyear and increased short-term debt in the fourth quarter tofund share repurchases. We plan to use proceeds from theDresser Equipment Group sale to pay down debt recentlyincurred for the repurchase of our shares. This should returnthe debt-to-capitalization ratio to the 30% to 35% range by theend of the second quarter of 2001.
FINANCIAL INSTRUMENT MARKET RISK
We are exposed to financial instrument market risk from changesin foreign currency exchange rates, interest rates and to a limitedextent, commodity prices. We selectively hedge these exposuresthrough the use of derivative instruments to mitigate our marketrisk from these exposures. The objective of our hedging is toprotect our cash flows related to sales or purchases of goods orservices from fluctuations in currency rates. Our use of derivativeinstruments includes the following types of market risk:
• volatility of the currency rates;• time horizon of the derivative instruments;• market cycles; and• the type of derivative instruments used.
We do not use derivative instruments for trading purposes. Wedo not consider any of our hedging activities to be material. SeeNote 1 for additional information on our accounting policies onderivative instruments. See Note 17 for additional disclosuresrelated to derivative instruments.
RESTRUCTURING ACTIVITIES
While oil and gas prices have continued to maintain thestrength that provides positive uplift to our oilfield servicesand integrated exploration and production informationsystems businesses, our engineering and constructionbusinesses continue to experience delays in customercommitments for new upstream and downstream projects.With the exception of deepwater projects, short-termprospects for increased engineering and construction activitiesin either the upstream or downstream businesses are notpositive. The continued delays of upstream and downstreamprojects, and the resulting decrease in our backlog and levelsof work, will make it difficult to achieve acceptable margins in2001 in our engineering and construction businesses.Accordingly, in the fourth quarter of 2000 we approved a planto re-combine all of our engineering and constructionbusinesses into one business unit. As a result of the reorgani-zation of the engineering and construction businesses, we tookactions to rationalize our operating structure including write-offs of equipment, engineering reference designs andcapitalized software of $20 million and recorded severancecosts of $16 million.
During the third and fourth quarters of 1998, we incurredspecial charges totaling $980 million related to the Dressermerger and industry downturn, of which $21 million has beenrecorded in discontinued operations. During the secondquarter of 1999, we reversed $47 million of our 1998 specialcharges based on our reassessment of total costs to be incurredto complete the actions covered in the charges.
37HALLIBURTON COMPANY 2000 ANNUAL REPORT
M A N A G E M E N T ’ S D I S C U S S I O N A N D A N A L Y S I S

We have in process a program to exit approximately 500properties, including service, administrative and manufacturingfacilities. We accrued expenses to exit approximately 400 ofthese properties in the 1998 special charges. Most of theseproperties are within the Energy Services Group. ThroughDecember 31, 2000 we have vacated 97% of the approximate 500total facilities. We have sold or returned to the owner 94% of thevacated properties.
ENVIRONMENTAL MATTERS
We are subject to numerous environmental legal and regulatoryrequirements related to our operations worldwide. As a result ofthose obligations, we are involved in specific environmentallitigation and claims, the clean-up of properties we own or haveoperated, and efforts to meet or correct compliance-relatedmatters. See Note 9.
FORWARD-LOOKING INFORMATION
The Private Securities Litigation Reform Act of 1995 providessafe harbor provisions for forward-looking information.Forward-looking information is based on projections andestimates, not historical information. Some statements in thisannual report are forward-looking. We may also provide oral orwritten forward-looking information in other materials werelease to the public. Forward-looking information involvesrisks and uncertainties. Forward-looking information weprovide reflects our best judgement based on currentinformation. Our results of operations can be affected byinaccurate assumptions we make or by known or unknownrisks and uncertainties. In addition, other factors may affectthe accuracy of our forward-looking information. As a result, noforward-looking information can be guaranteed. Actual eventsand the results of operations may vary materially.
While it is not possible to identify all factors, we continue toface many risks and uncertainties that could cause actualresults to differ from our forward-looking statementsincluding:
Geopolitical and legal.
• trade restrictions and economic embargoes imposed by theUnited States and other countries;
• unsettled political conditions, war, civil unrest, currencycontrols and governmental actions in the numerous countriesin which we operate;
• operations in countries with significant amounts of politicalrisk, including, for example, Algeria, Angola, Libya, Nigeria,and Russia;
• changes in foreign exchange rates;• changes in governmental regulations in the numerous countries
in which we operate including, for example, regulations that:
- encourage or mandate hiring local contractors; and- require foreign contractors to employ citizens of, or
purchase supplies from, a particular jurisdiction;• litigation, including, for example, asbestos litigation and
environmental litigation; and• environmental laws, including, for example, those that require
emission performance standards for facilities;
Weather related.
• the effects of severe weather conditions, including, for example,hurricanes and tornadoes, on operations and facilities; and
• the impact of prolonged severe or mild weather conditions onthe demand for and price of oil and natural gas;
Customers and vendors.
• the magnitude of governmental spending and outsourcing formilitary and logistical support of the type that we provide;
• changes in capital spending by customers in the oil and gasindustry for exploration, development, production, processing,refining, and pipeline delivery networks;
• changes in capital spending by governments for infrastructureprojects of the sort that we perform;
• consolidation of customers in the oil and gas industry; and• claim negotiations with engineering and construction customers
on cost variances and change orders on major projects;
Industry.
• technological and structural changes in the industries thatwe serve;
• changes in the price of oil and natural gas, including:- OPEC’s ability to set and maintain production levels and
prices for oil;- the level of oil production by non-OPEC countries;- the policies of governments regarding exploration for and
production and development of their oil and natural gasreserves; and
- the level of demand for oil and natural gas;• changes in the price or the availability of commodities that
we use;• risks that result from entering into fixed fee engineering,
procurement and construction projects of the types that weprovide where failure to meet schedules, cost estimates orperformance targets could result in non-reimbursable costswhich cause the project not to meet our expected profitmargins;
• risks that result from entering into complex businessarrangements for technically demanding projects wherefailure by one or more parties could result in monetarypenalties; and
• the risk inherent in the use of derivative instruments of thesort that we use which could cause a change in value of thederivative instruments as a result of:
38 HALLIBURTON COMPANY 2000 ANNUAL REPORT
M A N A G E M E N T ’ S D I S C U S S I O N A N D A N A L Y S I S

- adverse movements in foreign exchange rates, interestrates, or commodity prices, or
- the value and time period of the derivative beingdifferent than the exposures or cash flows being hedged;
Personnel and mergers/reorganizations/dispositions.
• increased competition in the hiring and retention ofemployees in specific areas, including, for example, energyservices operations, accounting and finance;
• integration of acquired businesses into Halliburton, including:- standardizing information systems or integrating data
from multiple systems;- maintaining uniform standards, controls, procedures and
policies; and- combining operations and personnel of acquired
businesses with ours;• effectively reorganizing operations and personnel within
Halliburton;• replacing discontinued lines of businesses with acquisitions
that add value and complement our core businesses; and• successful completion of planned dispositions.
In addition, future trends for pricing, margins, revenues andprofitability remain difficult to predict in the industries we serve.We do not assume any responsibility to publicly update any ofour forward-looking statements regardless of whether factorschange as a result of new information, future events or for anyother reason. We do advise you to review any additionaldisclosures we make in our 10-Q, 8-K and 10-K reports to theSecurities and Exchange Commission. We also suggest that youlisten to our quarterly earnings release conference calls withfinancial analysts.
OTHER ISSUES
Conversion to the Euro Currency
On January 1, 1999, some member countries of the EuropeanUnion established fixed conversion rates between their existingcurrencies and the European Union’s common currency (euro).This was the first step toward transition from existing nationalcurrencies to the use of the euro as a common currency. Thetransition period for the introduction of the euro ends June 30,2002. Issues resulting from the introduction of the euro includeconverting information technology systems, reassessing currencyrisk, negotiating and amending existing contracts and processingtax and accounting records. We are addressing these issues anddo not expect the euro to have a material effect on our financialcondition or results of operations.
Implementation of SAB 101
The Securities and Exchange Commission (SEC) issued StaffAccounting Bulletin (SAB) 101, “Revenue Recognition inFinancial Statements,” in December 1999. The SAB summarizessome of the SEC staff’s views in applying generally acceptedaccounting principles to revenue recognition in financialstatements. We have completed a thorough review of ourrevenue recognition policies and determined that our policies areconsistent with SAB 101.
Accounting Change
In June 1998, the Financial Accounting Standards Board issuedStatement of Financial Accounting Standards (SFAS) No. 133,“Accounting for Derivative Instruments and for HedgingActivities,” subsequently amended by SFAS No. 137 and SFASNo. 138. This standard requires entities to recognize allderivatives on the statement of financial position as assets orliabilities and to measure the instruments at fair value.Accounting for gains and losses from changes in those fair valuesare specified in the standard depending on the intended use ofthe derivative and other criteria. We have completed our reviewof contracts for embedded derivatives and evaluated ouraccounting policies for derivatives and hedging activities. Weadopted SFAS 133 effective January 2001 and determined theinitial adoption did not have a material effect on our financialcondition or results of operations.
39HALLIBURTON COMPANY 2000 ANNUAL REPORT
M A N A G E M E N T ’ S D I S C U S S I O N A N D A N A L Y S I S

TO THE SHAREHOLDERS AND BOARD OF DIRECTORS
HALLIBURTON COMPANY:
We have audited the accompanying consolidated balance sheetsof Halliburton Company (a Delaware corporation) and subsidiarycompanies as of December 31, 2000 and 1999, and the relatedconsolidated statements of income, cash flows, and shareholders’equity for each of the three years in the period ended December 31,2000. These financial statements are the responsibility of theCompany’s management. Our responsibility is to express anopinion on these financial statements based on our audits.
We conducted our audits in accordance with auditingstandards generally accepted in the United States. Thosestandards require that we plan and perform the audit to obtainreasonable assurance about whether the financial statements arefree of material misstatement. An audit includes examining, on atest basis, evidence supporting the amounts and disclosures inthe financial statements. An audit also includes assessing theaccounting principles used and significant estimates made bymanagement, as well as evaluating the overall financialstatement presentation. We believe that our audits provide areasonable basis for our opinion.
In our opinion, the consolidated financial statements referredto above present fairly, in all material respects, the financialposition of Halliburton Company and subsidiary companies as ofDecember 31, 2000 and 1999, and the results of their operationsand their cash flows for each of the three years in the periodended December 31, 2000, in conformity with accountingprinciples generally accepted in the United States.
ARTHUR ANDERSEN LLP
Dallas, Texas,January 30, 2001 (Except with respect to the matters discussed
in Notes 9 and 19, as to which the date is March 23, 2001.)
40 HALLIBURTON COMPANY 2000 ANNUAL REPORT
R E P O R T O F I N D E P E N D E N T P U B L I C A C C O U N T A N T S
We are responsible for the preparation and integrity of ourpublished financial statements. The financial statements havebeen prepared in accordance with accounting principlesgenerally accepted in the United States and, accordingly, includeamounts based on judgements and estimates made by ourmanagement. We also prepared the other information includedin the annual report and are responsible for its accuracy andconsistency with the financial statements.
The financial statements have been audited by theindependent accounting firm, Arthur Andersen LLP. ArthurAndersen was given unrestricted access to all financial recordsand related data, including minutes of all meetings ofstockholders, the Board of Directors and committees of theBoard. Halliburton’s Audit Committee of the Board of Directorsconsists of directors who, in the business judgement of the Boardof Directors, are independent under the New York Exchangelisting standards. The Board, operating through its AuditCommittee, provides oversight to the financial reporting process.Integral to this process is the Audit Committee’s review anddiscussion with management and the external auditors of thequarterly and annual financial statements prior to theirrespective filing.
We maintain a system of internal control over financialreporting, which is intended to provide reasonable assurance toour management and Board of Directors regarding the reliabilityof our financial statements. The system includes:
• a documented organizational structure and division ofresponsibility;
• established policies and procedures, including a code of conductto foster a strong ethical climate which is communicatedthroughout the company; and
• the careful selection, training and development of our people.
Internal auditors monitor the operation of the internal controlsystem and report findings and recommendations tomanagement and the Board of Directors. Corrective actions aretaken to address control deficiencies and other opportunities forimproving the system as they are identified. In accordance withthe Securities and Exchange Commission’s new rules to improvethe reliability of financial statements, our interim financialstatements are reviewed by Arthur Andersen LLP.
There are inherent limitations in the effectiveness of anysystem of internal control, including the possibility of humanerror and the circumvention or overriding of controls.Accordingly, even an effective internal control system canprovide only reasonable assurance with respect to the reliabilityof our financial statements. Also, the effectiveness of an internalcontrol system may change over time.
We have assessed our internal control system in relation tocriteria for effective internal control over financial reportingdescribed in “Internal Control-Integrated Framework” issued bythe Committee of Sponsoring Organizations of the TreadwayCommission. Based upon that assessment, we believe that, as ofDecember 31, 2000, our system of internal control over financialreporting met those criteria.
HALLIBURTON COMPANY
by
David J. Lesar
Chairman of the Board,President andChief Executive Officer
Gary V. Morris
Executive Vice President andChief Financial Officer
41HALLIBURTON COMPANY 2000 ANNUAL REPORT
R E S P O N S I B I L I T Y F O R F I N A N C I A L R E P O R T I N G
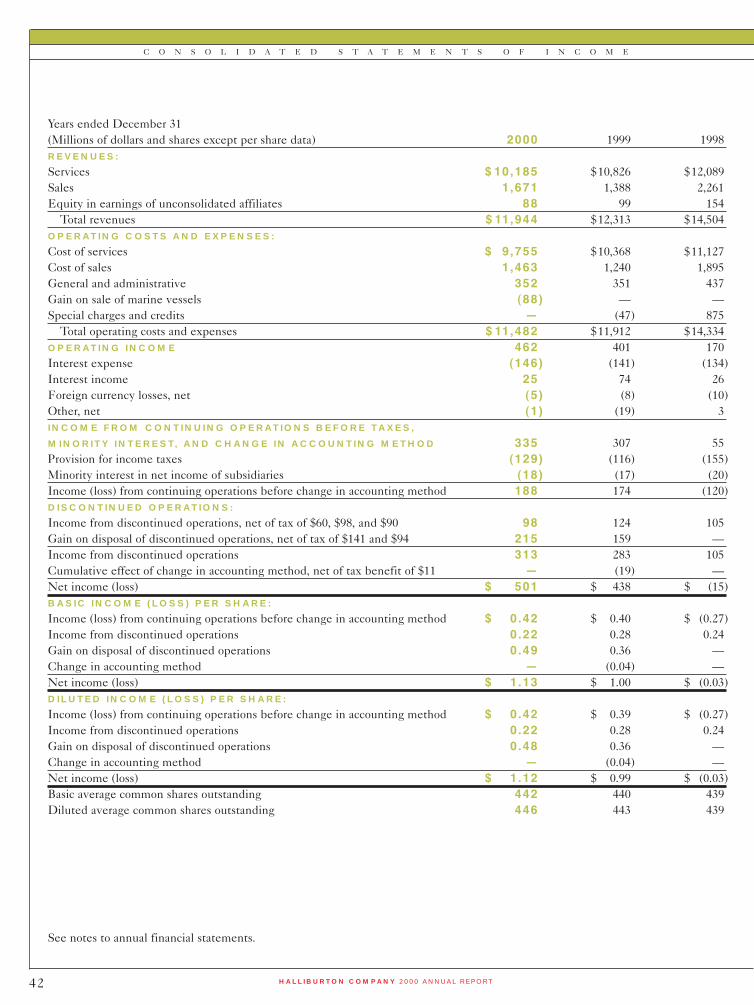
Years ended December 31(Millions of dollars and shares except per share data) 2000 1999 1998REVENUES:
Services $ 10,185 $10,826 $12,089Sales 1,671 1,388 2,261Equity in earnings of unconsolidated affiliates 88 99 154
Total revenues $ 11,944 $12,313 $14,504OPERATING COSTS AND EXPENSES:
Cost of services $ 9,755 $10,368 $11,127Cost of sales 1,463 1,240 1,895General and administrative 352 351 437Gain on sale of marine vessels (88) — —Special charges and credits Ñ (47) 875
Total operating costs and expenses $ 11,482 $11,912 $14,334OPERATING INCOME 462 401 170Interest expense (146) (141) (134)Interest income 25 74 26Foreign currency losses, net (5) (8) (10)Other, net (1) (19) 3INCOME FROM CONTINUING OPERATIONS BEFORE TAXES,
MINORITY INTEREST, AND CHANGE IN ACCOUNTING METHOD 335 307 55Provision for income taxes (129) (116) (155)Minority interest in net income of subsidiaries (18) (17) (20)Income (loss) from continuing operations before change in accounting method 188 174 (120)DISCONTINUED OPERATIONS:
Income from discontinued operations, net of tax of $60, $98, and $90 98 124 105Gain on disposal of discontinued operations, net of tax of $141 and $94 215 159 —Income from discontinued operations 313 283 105Cumulative effect of change in accounting method, net of tax benefit of $11 Ñ (19) —Net income (loss) $ 501 $ 438 $ (15)BASIC INCOME (LOSS) PER SHARE:
Income (loss) from continuing operations before change in accounting method $ 0.42 $ 0.40 $ (0.27)Income from discontinued operations 0.22 0.28 0.24Gain on disposal of discontinued operations 0.49 0.36 —Change in accounting method Ñ (0.04) —Net income (loss) $ 1.13 $ 1.00 $ (0.03)DILUTED INCOME (LOSS) PER SHARE:
Income (loss) from continuing operations before change in accounting method $ 0.42 $ 0.39 $ (0.27)Income from discontinued operations 0.22 0.28 0.24Gain on disposal of discontinued operations 0.48 0.36 —Change in accounting method Ñ (0.04) —Net income (loss) $ 1.12 $ 0.99 $ (0.03)Basic average common shares outstanding 442 440 439Diluted average common shares outstanding 446 443 439
See notes to annual financial statements.
42 HALLIBURTON COMPANY 2000 ANNUAL REPORT
C O N S O L I D A T E D S T A T E M E N T S O F I N C O M E

December 31(Millions of dollars and shares except per share data) 2000 1999
ASSETS
CURRENT ASSETS:
Cash and equivalents $ 231 $ 466Receivables:Notes and accounts receivable (less allowance for bad debts of $125 and $94) 3,029 2,349Unbilled work on uncompleted contracts 816 625
TOTAL RECEIVABLES 3,845 2,974Inventories 723 723Current deferred income taxes 235 171Net current assets of discontinued operations 298 793Other current assets 236 235
TOTAL CURRENT ASSETS 5,568 5,362Net property, plant and equipment 2,410 2,390Equity in and advances to related companies 400 384Excess of cost over net assets acquired (net of accumulated amortization of $231 and $189) 597 505Noncurrent deferred income taxes 340 398Net noncurrent assets of discontinued operations 391 310Other assets 397 290
TOTAL ASSETS $ 10,103 $9,639
LIABILITIES AND SHAREHOLDERS’ EQUITY
CURRENT LIABILITIES:
Short-term notes payable $ 1,570 $ 939Current maturities of long-term debt 8 308Accounts payable 782 665Accrued employee compensation and benefits 267 137Advance billings on uncompleted contracts 288 286Deferred revenues 98 44Income taxes payable 113 120Accrued special charges 6 69Other current liabilities 694 465
TOTAL CURRENT LIABILITIES 3,826 3,033Long-term debt 1,049 1,056Employee compensation and benefits 662 672Other liabilities 600 547Minority interest in consolidated subsidiaries 38 44
TOTAL LIABILITIES 6,175 5,352SHAREHOLDERS’ EQUITY:
Common shares, par value $2.50 per share – authorized 600 shares, issued 453 and 448 shares 1,132 1,120Paid-in capital in excess of par value 259 68Deferred compensation (63) (51)Accumulated other comprehensive income (288) (204)Retained earnings 3,733 3,453
4,773 4,386Less 26 and 6 shares of treasury stock, at cost 845 99
TOTAL SHAREHOLDERS’ EQUITY 3,928 4,287TOTAL LIABILITIES AND SHAREHOLDERS’ EQUITY $ 10,103 $9,639
See notes to annual financial statements.
43HALLIBURTON COMPANY 2000 ANNUAL REPORT
C O N S O L I D A T E D B A L A N C E S H E E T S

Years ended December 31(Millions of dollars and shares) 2000 1999 1998COMMON STOCK (NUMBER OF SHARES)
Balance at beginning of year 448 446 454Shares issued under compensation and incentive
stock plans, net of forfeitures 4 2 1Shares issued for acquisition 1 — —Cancellation of treasury stock Ñ — (9)Balance at end of year 453 448 446
COMMON STOCK (DOLLARS)
Balance at beginning of year $ 1,120 $1,115 $1,134Shares issued under compensation and incentive
stock plans, net of forfeitures 9 5 3Shares issued for acquisition 3 — —Cancellation of treasury stock Ñ — (22)Balance at end of year $ 1,132 $1,120 $1,115
PAID-IN CAPITAL IN EXCESS OF PAR VALUE
Balance at beginning of year $ 68 $ 8 $ 168Shares issued under compensation and incentive
stock plans, net of forfeitures 109 47 37Tax benefit 38 13 12Shares issued for acquisition 44 — —Cancellation of treasury stock Ñ — (209)Balance at end of year $ 259 $ 68 $ 8
DEFERRED COMPENSATION
Balance at beginning of year $ (51) $ (51) $ (45)Current year awards, net (12) — (6)Balance at end of year $ (63) $ (51) $ (51)
ACCUMULATED OTHER COMPREHENSIVE INCOME
Cumulative translation adjustment $ (275) $ (185) $ (142)Pension liability adjustment (12) (19) (7)Unrealized gain (loss) on investments (1) — —Balance at end of year $ (288) $ (204) $ (149)
CUMULATIVE TRANSLATION ADJUSTMENT
Balance at beginning of year $ (185) $ (142) $ (127)Conforming fiscal years Ñ — (15)Sales of subsidiaries 11 (17) 9Current year changes, net of tax (101) (26) (9)Balance at end of year $ (275) $ (185) $ (142)
See notes to annual financial statements.
44 HALLIBURTON COMPANY 2000 ANNUAL REPORT
C O N S O L I D A T E D S T A T E M E N T S O F S H A R E H O L D E R S ’ E Q U I T Y

Years ended December 31(Millions of dollars and shares) 2000 1999 1998PENSION LIABILITY ADJUSTMENT
Balance at beginning of year $ (19) $ (7) $ (4)Sale of subsidiary 7 — —Current year adjustment Ñ (12) (3)Balance at end of year $ (12) $ (19) $ (7)
UNREALIZED GAIN (LOSS) ON INVESTMENTS
Current year unrealized gain (loss) on investments $ (1) $ — $ —Balance at end of year $ (1) $ — $ —
RETAINED EARNINGS
Balance at beginning of year $ 3,453 $3,236 $3,563Net income (loss) 501 438 (15)Cash dividends paid (221) (221) (254)Cancellation of treasury stock Ñ — (61)Conforming fiscal years Ñ — 3Balance at end of year $ 3,733 $3,453 $3,236
TREASURY STOCK (NUMBER OF SHARES)
Beginning of year 6 6 16Shares issued under benefit, dividend reinvestment plan and
incentive stock plans, net Ñ — (1)Shares purchased 20 — —Cancellation of treasury stock Ñ — (9)Balance at end of year 26 6 6
TREASURY STOCK (DOLLARS)
Beginning of year $ 99 $ 98 $ 374Shares issued under benefit, dividend reinvestment plan and
incentive stock plans, net (23) (9) (26)Shares purchased 769 10 20Cancellation of treasury stock Ñ — (270)Balance at end of year $ 845 $ 99 $ 98
COMPREHENSIVE INCOME
Net income (loss) $ 501 $ 438 $ (15)Translation rate changes, net of tax (101) (26) (9)Current year adjustment to minimum pension liability Ñ (12) (3)Unrealized gain (loss) on investments (1) — —Total comprehensive income $ 399 $ 400 $ (27)
See notes to annual financial statements.
45HALLIBURTON COMPANY 2000 ANNUAL REPORT
C O N S O L I D A T E D S T A T E M E N T S O F S H A R E H O L D E R S ’ E Q U I T Y
( C O N T I N U E D )

Years ended December 31(Millions of dollars) 2000 1999 1998CASH FLOWS FROM OPERATING ACTIVITIES:
Net income (loss) $ 501 $ 438 $ (15)Adjustments to reconcile net income to net cash from operations:
Income from discontinued operations (313) (283) (105)Depreciation, depletion and amortization 503 511 500(Benefit) provision for deferred income taxes (6) 187 (297)Change in accounting method, net Ñ 19 —Distributions from (advances to) related companies,
net of equity in (earnings) losses (64) 24 9Accrued special charges (63) (290) 359Other non-cash items (22) 19 5Other changes, net of non-cash items:
Receivables and unbilled work (896) 616 (215)Inventories 8 (3) (38)Accounts payable 170 (179) (25)Other working capital, net 155 (432) (255)Other, net (30) (685) 227
Total cash flows from operating activities (57) (58) 150CASH FLOWS FROM INVESTING ACTIVITIES:
Capital expenditures (578) (520) (841)Sales of property, plant and equipment 209 118 83Acquisitions of businesses, net of cash acquired (10) (7) (40)Dispositions of businesses, net of cash disposed 19 291 7Other investing activities (51) 11 1Total cash flows from investing activities (411) (107) (790)
CASH FLOWS FROM FINANCING ACTIVITIES:
Borrowings of long-term debt Ñ — 150Payments on long-term borrowings (308) (59) (28)Net borrowings of short-term debt 629 436 386Payments of dividends to shareholders (221) (221) (254)Proceeds from exercises of stock options 105 49 49Payments to reacquire common stock (769) (10) (20)Other financing activities (20) (6) (16)Total cash flows from financing activities (584) 189 267
Effect of exchange rate changes on cash (9) 5 (5)Net cash flows from discontinued operations (1) 826 234 235Increase (decrease) in cash and equivalents (235) 263 (143)Cash and equivalents at beginning of year 466 203 346CASH AND EQUIVALENTS AT END OF YEAR $ 231 $ 466 $ 203
SUPPLEMENTAL DISCLOSURE OF CASH FLOW INFORMATION:
Cash payments during the year for:Interest $ 144 $ 145 $ 137Income taxes $ 310 $ 98 $ 535
Non-cash investing and financing activities:Liabilities assumed in acquisitions of businesses $ 95 $ 90 $ 5Liabilities disposed of in dispositions of businesses $ 499 $ 111 $ 24
(1) Net cash flows from discontinued operations in 2000 include proceeds of approximately $913 million from the sales of Dresser-Rand in 2000 and Ingersoll-Dresser Pump in 1999. See Note 2.
See notes to annual financial statements.
46 HALLIBURTON COMPANY 2000 ANNUAL REPORT
C O N S O L I D A T E D S T A T E M E N T S O F C A S H F L O W S

NOTE 1. SIGNIFICANT ACCOUNTING POLICIES
We employ accounting policies that are in accordance withgenerally accepted accounting principles in the United States.The preparation of financial statements in conformity withgenerally accepted accounting principles requires us to makeestimates and assumptions that affect:
• the reported amounts of assets and liabilities and disclosure ofcontingent assets and liabilities at the date of the financialstatements; and
• the reported amounts of revenues and expenses during thereporting period.
Ultimate results could differ from those estimates.Principles of consolidation. The consolidated financial
statements include the accounts of our company and all of ourmajority-owned subsidiaries. All material intercompany accountsand transactions are eliminated. Investments in other companiesin which we own a 20% to 50% interest are accounted for using theequity method. Specific prior year amounts have been reclassifiedto conform to the current year presentation.
Revenues and income recognition. We recognizerevenues as services are rendered or products are shipped. Thedistinction between services and product sales is based upon theoverall activity of the particular business operation. Revenuesfrom engineering and construction contracts are reported on thepercentage of completion method of accounting using measure-ments of progress towards completion appropriate for the workperformed. All known or anticipated losses on contracts areprovided for currently. Claims and change orders which are in theprocess of being negotiated with customers, for extra work orchanges in the scope of work are included in revenue whencollection is deemed probable. Post-contract customer supportagreements are recorded as deferred revenues and recognized asrevenue ratably over the contract period of generally one year’sduration. Training and consulting service revenues arerecognized as the services are performed. Sales of perpetualsoftware licenses, net of deferred maintenance fees, are recordedas revenue upon shipment. Sales of use licenses are recognizedas revenue over the license period.
Research and development. Research and developmentexpenses are charged to income as incurred. See Note 4 forresearch and development expense by business segment.
Software development costs. Costs of developingsoftware for sale are charged to expense when incurred, asresearch and development, until technological feasibility hasbeen established for the product. Once technological feasibility isestablished, software development costs are capitalized until thesoftware is ready for general release to customers. We capitalizedcosts related to software developed for resale of $7 million in2000, $12 million in 1999 and $13 million in 1998. Amortization
expense of software development costs was $12 million for 2000,$15 million for 1999 and $18 million for 1998. Once the softwareis ready for release, amortization of the software developmentcosts begins. Capitalized software development costs areamortized over periods which do not exceed three years.
Income per share. Basic income per share is based on theweighted average number of common shares outstanding duringthe year. Diluted income per share includes additional commonshares that would have been outstanding if potential commonshares with a dilutive effect had been issued. See Note 10 for areconciliation of basic and diluted income per share.
Cash equivalents. We consider all highly liquidinvestments with an original maturity of three months or less tobe cash equivalents.
Receivables. Our receivables are generally not collateralized.With the exception of claims and change orders which are in theprocess of being negotiated with customers, unbilled work onuncompleted contracts generally represents work currentlybillable, and this work is usually billed during normal billingprocesses in the next month. These claims and change orders,included in unbilled receivables, amounted to $113 million and$98 million at December 31, 2000 and 1999, respectively, and aregenerally expected to be collected in the following year.
Included in notes and accounts receivable are notes withvarying interest rates. Notes receivable totaled $38 million atDecember 31, 2000 and $41 million at December 31, 1999.
Inventories. Inventories are stated at the lower of cost ormarket. Cost represents invoice or production cost for new itemsand original cost less allowance for condition for used materialreturned to stock. Production cost includes material, labor andmanufacturing overhead. The cost of most inventories isdetermined using either the first-in, first-out method or theaverage cost method, although the cost of some United Statesmanufacturing and field service inventories is determined usingthe last-in, first-out method. Inventories of sales items owned byforeign subsidiaries and inventories of operating supplies andparts are generally valued at average cost.
Property, plant and equipment. Property, plant andequipment are reported at cost less accumulated depreciation,which is generally provided on the straight-line method over theestimated useful lives of the assets. Some assets are depreciatedon accelerated methods. Accelerated depreciation methods arealso used for tax purposes, wherever permitted. Upon sale orretirement of an asset, the related costs and accumulateddepreciation are removed from the accounts and any gain or lossis recognized. When events or changes in circumstances indicatethat assets may be impaired, an evaluation is performed. Theestimated future undiscounted cash flows associated with theasset are compared to the asset’s carrying amount to determine ifa write-down to market value or discounted cash flow value isrequired. We follow the successful efforts method of accountingfor oil and gas properties.
47HALLIBURTON COMPANY 2000 ANNUAL REPORT
N O T E S T O A N N U A L F I N A N C I A L S T A T E M E N T S

Maintenance and repairs. Expenditures for maintenanceand repairs are generally expensed; expenditures for renewals andimprovements are generally capitalized. We use the accrue-in-advance method of accounting for major maintenance and repaircosts of marine vessel dry docking expense and major aircraftoverhauls and repairs. Under this method we anticipate the needfor major maintenance and repairs and charge the estimatedexpense to operations before the actual work is performed. At thetime the work is performed, the actual cost incurred is chargedagainst the amounts that were previously accrued with anydeficiency or excess charged or credited to operating expense.
Excess of cost over net assets acquired. The excessof cost over net assets acquired is amortized on a straight-linebasis over periods not exceeding 40 years. The excess of costover net assets acquired is continually monitored for potentialimpairment. When negative conditions such as significantcurrent or projected operating losses exist, a review is performedto determine if the projected undiscounted future cash flowsindicate that an impairment exists. If an impairment exists, theexcess of cost over net assets acquired, and, if appropriate, theassociated assets are reduced to reflect the estimated discountedcash flows to be generated by the underlying business. This isconsistent with methodologies in Statement of FinancialAccounting Standards No. 121 “Accounting for the Impairment ofLong-lived Assets and for Long-lived Assets to be Disposed of.”
Income taxes. A valuation allowance is provided fordeferred tax assets if it is more likely than not these items willeither expire before we are able to realize their benefit, or thatfuture deductibility is uncertain. Deferred tax assets and liabilitiesare recognized for the expected future tax consequences of eventsthat have been realized in the financial statements or tax returns.
Derivative instruments. We enter into derivative financialtransactions to hedge existing or projected exposures to changingforeign exchange rates, interest rates and commodity prices. Wedo not enter into derivative transactions for speculative or tradingpurposes. Derivative financial instruments to hedge exposurewith an indeterminable maturity date are generally carried at fairvalue with the resulting gains and losses reflected in the resultsof operations. Gains or losses on hedges of identifiablecommitments are deferred and recognized when the offsettinggains or losses on the related hedged items are recognized.Deferred gains or losses for hedges which are terminated prior tothe transaction date are recognized when the underlying hedgedtransactions are recognized. In the event an identifiablecommitment is no longer expected to be realized, any deferredgains or losses on hedges associated with the commitment arerecognized currently. Costs associated with entering into thesecontracts are presented in other assets, while deferred gains orlosses are included in other liabilities or other assets, respec-tively, on the consolidated balance sheets. Recognized gains orlosses on derivatives entered into to manage foreign exchangerisk are included in foreign currency gains and losses on the
consolidated statements of income. Gains or losses on interestrate derivatives and commodity derivatives are included ininterest expense and operating income, respectively. During theyears ended December 31, 2000, 1999 and 1998, we did not enterinto any significant transactions to hedge interest rates orcommodity prices.
Foreign currency translation. Foreign entities whosefunctional currency is the United States dollar translate monetaryassets and liabilities at year-end exchange rates and non-monetary items are translated at historical rates. Income andexpense accounts are translated at the average rates in effectduring the year, except for depreciation, cost of product sales andrevenues and expenses associated with non-monetary balancesheet accounts which are translated at historical rates. Gains orlosses from changes in exchange rates are recognized in consoli-dated income in the year of occurrence. Foreign entities whosefunctional currency is the local currency translate net assets atyear-end rates and income and expense accounts at averageexchange rates. Adjustments resulting from these translations arereflected in the consolidated statements of shareholders’ equitytitled “cumulative translation adjustment.”
NOTE 2. ACQUISITIONS AND DISPOSITIONS
PES acquisition. In February 2000, our offer to acquire theremaining 74% of the shares of PES (International) Limitedthat we did not already own was accepted by PESshareholders. PES is based in Aberdeen, Scotland, and hasdeveloped technology that complements Halliburton EnergyServices’ real-time reservoir solutions. To acquire theremaining 74% of PES, we issued 1.2 million shares ofHalliburton common stock. We also issued rights that willresult in the issuance of between 850,000 and 2.1 millionadditional shares of Halliburton common stock betweenFebruary 2001 and February 2003. We issued 1 million sharesin February 2001 under the rights. We have preliminarilyrecorded, subject to the final valuation of intangible assets andother costs, $115 million of goodwill which will be amortizedover 20 years. PES is part of the Energy Services Group.
Dresser merger. On September 29, 1998 we completedthe acquisition of Dresser Industries, Inc. by converting theoutstanding Dresser common stock into approximately 176million shares of our common stock. We also reserved approx-imately 7 million shares of common stock for outstandingDresser stock options and other employee and directors plans.The merger qualified as a tax-free exchange to Dresser’sshareholders for United States federal income tax purposesand was accounted for using the pooling of interests method ofaccounting for business combinations. Financial statementshave been restated to include the results of these Dresseroperations for all periods presented.
48 HALLIBURTON COMPANY 2000 ANNUAL REPORT
N O T E S T O A N N U A L F I N A N C I A L S T A T E M E N T S

Combined and separate company results of HalliburtonCompany and Dresser Industries, Inc. for the period precedingthe merger are as follows:
Nine Months ended September 30Millions of dollars 1998REVENUES:
Halliburton Company $ 7,045Dresser Industries, Inc. $ 6,019Amounts reclassified to
discontinued operations (2,070) 3,949Combined continuing operations $10,994INCOME (LOSS):
Halliburton Company $ 359Dresser Industries, Inc. $ 282Amounts reclassified to
discontinued operations (93) 1891998 special charges, net of tax (722)Amounts reclassified to
discontinued operations 15 (707)Combined continuing operations $ (159)
Other acquisitions. We acquired other businesses in 2000,1999 and 1998 for $10 million, $13 million and $42 million,respectively. These businesses did not have a significant effecton revenues or earnings.
Joint venture divestitures. In October 1999, we announcedthe sales of our 49% interest in the Ingersoll-Dresser Pump jointventure and our 51% interest in the Dresser-Rand joint ventureto Ingersoll-Rand. See Note 3. The sales were triggered byIngersoll-Rand’s exercise of its option under the joint ventureagreements to cause us to either buy their interests or sell ours.Both joint ventures were part of the Dresser Equipment Groupsegment. Our Ingersoll-Dresser Pump interest was sold inDecember 1999 for approximately $515 million. We recorded again on disposition of discontinued operations of $253 millionbefore tax, or $159 million after-tax, for a net gain of $0.36 perdiluted share in 1999 from the sale of Ingersoll-Dresser Pump.Proceeds from the sale, after payment of our intercompanybalance, were received in the form of a $377 million promissorynote with an annual interest rate of 3.5%, which was collected onJanuary 14, 2000. On February 2, 2000 we completed the sale ofour 51% interest in Dresser-Rand for a price of approximately$579 million. Proceeds from the sale, net of intercompanyamounts payable to the joint venture, were $536 million,resulting in a gain on disposition of discontinued operations of$356 million before tax, or $215 million after-tax, for a net gainof $0.48 per diluted share in the first quarter of 2000. Theproceeds from these sales were used to repay short-termborrowings and for other general corporate purposes.
LWD divestiture. In March 1999, in connection with theDresser merger, we sold the majority of our pre-mergerworldwide logging-while-drilling business and a portion of thepre-merger measurement-while-drilling business. The sale wasin accordance with a consent decree with the United StatesDepartment of Justice. The financial impact of the sale wasreflected in the third quarter 1998 special charge. See Note 12.This business was previously part of the Energy Services Group.We continue to provide separate logging-while-drilling servicesthrough our Sperry-Sun Drilling Systems business line, whichwas acquired as part of the merger with Dresser and is now partof the Energy Services Group. In addition, we will continue toprovide sonic logging-while-drilling services using technologieswe had before the merger with Dresser.
M-I L.L.C. drilling divestiture. In August 1998, we sold our36% interest in M-I L.L.C. to Smith International, Inc. for $265million. Payment was made in the form of a non-interest-bearingpromissory note which was collected in April 1999. The salecompleted our commitment to the United States Department ofJustice to sell our M-I interest in connection with our mergerwith Dresser. M-I was previously part of the Energy ServicesGroup. We continue to offer drilling fluid products and servicesthrough our Baroid Drilling Fluids business line which wasacquired as part of the merger with Dresser and is now part of theEnergy Services Group.
NOTE 3. DISCONTINUED OPERATIONS
The Dresser Equipment Group in 1999 was comprised of sixoperating divisions and two joint ventures that manufacture andmarket equipment used primarily in the energy, petrochemical,power and transportation industries. In late 1999 we announcedour intentions to sell, and have subsequently sold, our interestsin the two joint ventures within this segment. These jointventures represented nearly half of the group’s revenues andoperating profit in 1999. See Note 2. The sale of our interests inthe segment’s joint ventures prompted a strategic review of theremaining businesses within the Dresser Equipment Groupsegment. As a result of this review, we determined that thesebusinesses do not closely fit with our core businesses, long-termgoals and strategic objectives. In April 2000, our Board ofDirectors approved plans to sell all the remaining businesseswithin our Dresser Equipment Group segment. In January 2001,we signed a definitive agreement and expect to close the sale ofthese businesses in the second quarter of 2001. Total consider-ation under the agreement is $1.55 billion in cash, less assumedliabilities, and is subject to adjustments at closing for changes innet assets. As part of the terms of the transaction, we will retaina 5% equity interest in Dresser Equipment Group after closing.
49HALLIBURTON COMPANY 2000 ANNUAL REPORT
N O T E S T O A N N U A L F I N A N C I A L S T A T E M E N T S

The financial results of the Dresser Equipment Group segmentare presented as discontinued operations in our financialstatements. Prior periods are restated to reflect this presentation.
Income from Operations of Discontinued Businesses
Years ended December 31Millions of dollars 2000 1999 1998Revenues $ 1,400 $2,585 $2,849Operating income $ 158 $ 249 $ 227Other income and expense Ñ (1) (3)Taxes (60) (98) (90)Minority interest Ñ (26) (29)Net income $ 98 $ 124 $ 105
Gain on disposal of discontinued operations reflects the gainon the sale of Dresser-Rand in February 2000 and the gain on thesale of Ingersoll-Dresser Pump in December 1999.
Gain on Disposal of Discontinued Operations
Millions of dollars 2000 1999Proceeds from sale, less
intercompany settlement $ 536 $ 377Net assets disposed (180) (124)Gain before taxes 356 253Income taxes (141) (94)Gain on disposal of
discontinued operations $ 215 $ 159
Net assets of discontinued operations at December 31, 2000and 1999 are composed of the following items:
Millions of dollars 2000 1999Receivables $ 286 $ 904Inventories 255 515Other current assets 22 34Accounts payable (104) (267)Other current liabilities (161) (393)Net current assets of
discontinued operations $ 298 $ 793Net property, plant and equipment $ 219 $ 401Net goodwill 257 263Other assets 30 74Employee compensation and benefits (113) (313)Other liabilities (2) (5)Minority interest in
consolidated subsidiaries Ñ (110)Net noncurrent assets of
discontinued operations $ 391 $ 310
Revenues, assets, and liabilities declined from 1999 primarilydue to the sales of Dresser-Rand and Ingersoll-Dresser Pumpjoint ventures.
NOTE 4. BUSINESS SEGMENT INFORMATION
We have two business segments. These segments are organizedaround the products and services provided to the customers theyserve. See the following tables for information on our businesssegments.
The Energy Services Group segment provides pressurepumping equipment and services, logging and perforating,drilling systems and services, drilling fluids systems, drill bits,specialized completion and production equipment and services,well control, integrated solutions, and reservoir description. Alsoincluded in the Energy Services Group are upstream oil and gasengineering, construction and maintenance services, specialty pipe-coating, insulation, underwater engineering services, integratedexploration and production information systems, and professionalservices to the petroleum industry. The Energy Services Grouphas three business units: Halliburton Energy Services, Brown &Root Energy Services and Landmark Graphics. The long-termperformance for these business units is linked to the long-termdemand for oil and gas. The products and services the groupprovides are designed to help discover, develop and produce oiland gas. The customers for this segment are major oil companies,national oil companies and independent oil and gas companies.
The Engineering and Construction Group segment providesengineering, procurement, construction, project management,and facilities operation and maintenance for hydrocarbonprocessing and other industrial and governmental customers.The Engineering and Construction Group has two businessunits: Kellogg Brown & Root and Brown & Root Services. Bothbusiness units are engaged in the delivery of engineering andconstruction services.
Our equity in pretax income or losses for unconsolidatedrelated companies that are accounted for on the equity method isincluded in revenues and operating income of the applicablesegment. Intersegment revenues included in the revenues of theother business segments and sales between geographic areas areimmaterial. General corporate assets not included in a businesssegment are primarily composed of receivables, deferred taxassets and other shared assets, including the investment in anenterprise-wide information system.
50 HALLIBURTON COMPANY 2000 ANNUAL REPORT
N O T E S T O A N N U A L F I N A N C I A L S T A T E M E N T S

The tables below present information on our continuingoperations business segments.
Operations by Business Segment
Years ended December 31Millions of dollars 2000 1999 1998REVENUES:
Energy Services Group $ 7,916 $ 6,999 $ 9,009Engineering and
Construction Group 4,028 5,314 5,495Total $ 11,944 $12,313 $14,504OPERATING INCOME:
Energy Services Group $ 526 $ 222 $ 971Engineering and
Construction Group 14 203 237Special charges and credits Ñ 47 (959)General corporate (78) (71) (79)Total $ 462 $ 401 $ 170CAPITAL EXPENDITURES:
Energy Services Group $ 495 $ 414 $ 707Engineering and
Construction Group 32 34 34General corporate and
shared assets 51 72 100Total $ 578 $ 520 $ 841DEPRECIATION AND AMORTIZATION:
Energy Services Group $ 420 $ 421 $ 405Engineering and
Construction Group 36 43 49General corporate and
shared assets 47 47 46Total $ 503 $ 511 $ 500TOTAL ASSETS:
Energy Services Group $ 7,148 $ 6,167 $ 6,618Engineering and
Construction Group 1,258 1,282 1,405Net assets of
discontinued operations 689 1,103 950General corporate and
shared assets 1,008 1,087 1,099Total $ 10,103 $ 9,639 $10,072RESEARCH AND DEVELOPMENT:
Energy Services Group $ 224 $ 207 $ 220Engineering and
Construction Group 7 4 4Total $ 231 $ 211 $ 224
Years ended December 31Millions of dollars 2000 1999 1998SPECIAL CHARGES
AND CREDITS:
Energy Services Group $ Ñ $(45) $721Engineering and
Construction Group Ñ — 40General corporate Ñ (2) 198Total $ Ñ $(47) $959
Operations by Geographic Area
Years ended December 31Millions of dollars 2000 1999 1998REVENUES:
United States $ 4,073 $ 3,727 $ 4,642United Kingdom 1,512 1,656 2,153Other areas
(over 120 countries) 6,359 6,930 7,709Total $ 11,944 $12,313 $14,504LONG-LIVED ASSETS:
United States $ 2,068 $ 1,801 $ 1,788United Kingdom 525 684 579Other areas
(numerous countries) 776 643 920Total $ 3,369 $ 3,128 $ 3,287
NOTE 5. INVENTORIES
Inventories to support continuing operations at December 31,2000 and 1999 are composed of the following:
Millions of dollars 2000 1999Finished products and parts $ 486 $619Raw materials and supplies 178 79Work in process 59 25Total $ 723 $723
Inventories on the last-in, first-out method were $66 million atDecember 31, 2000 and 1999. If the average cost method hadbeen used, total inventories would have been about $28 millionhigher than reported at December 31, 2000, and $35 millionhigher than reported at December 31, 1999.
51HALLIBURTON COMPANY 2000 ANNUAL REPORT
N O T E S T O A N N U A L F I N A N C I A L S T A T E M E N T S

NOTE 6. PROPERTY, PLANT AND EQUIPMENT
Property, plant and equipment to support continuing operationsat December 31, 2000 and 1999 are composed of the following:
Millions of dollars 2000 1999Land $ 83 $ 110Buildings and property improvements 968 959Machinery, equipment and other 4,509 4,443Total 5,560 5,512Less accumulated depreciation 3,150 3,122Net property, plant and equipment $ 2,410 $2,390
At December 31, 2000 and 1999, machinery, equipment andother property includes oil and gas investments of approximately$363 million and $309 million, respectively, and softwaredeveloped for an information system of $223 million and $197million, respectively.
NOTE 7. RELATED COMPANIES
We conduct some of our operations through various jointventures which are in partnership, corporate and other businessforms, and are principally accounted for using the equitymethod. Information pertaining to related companies for ourcontinuing operations is set out below.
The larger unconsolidated entities include European MarineContractors, Limited, and Bredero-Shaw which are both part ofthe Energy Services Group. European Marine Contractors,Limited, which is 50%-owned, specializes in engineering,procurement and construction of marine pipelines. Bredero-Shaw,which is 50%-owned, specializes in pipecoating.
We sold our 36% ownership interest in M-I to SmithInternational, Inc. on August 31, 1998. This transaction completedour commitment to the United States Department of Justice tosell our M-I interest in connection with our merger with DresserIndustries, Inc. See Note 2 for further information on the sale ofM-I. Prior to the sale of our interest, we accounted for our interestin M-I on the equity method.
Combined summarized financial information for all jointlyowned operations which are not consolidated is as follows:
Combined Operating Results
Years ended December 31Millions of dollars 2000 1999 1998Revenues $ 3,098 $3,215 $4,262Operating income $ 192 $ 193 $ 398Net income $ 169 $ 127 $ 276
Combined Financial Position
December 31Millions of dollars 2000 1999Current assets $ 1,604 $1,718Noncurrent assets 1,307 1,455Total $ 2,911 $3,173Current liabilities $ 1,238 $1,301Noncurrent liabilities 947 1,135Minority interests 2 4Shareholders’ equity 724 733Total $ 2,911 $3,173
NOTE 8. LINES OF CREDIT, NOTES PAYABLE AND
LONG-TERM DEBT
At December 31, 2000, we had committed short-term lines of credittotaling $1.85 billion. There were no borrowings outstandingunder these lines of credit. Fees for committed lines of creditwere immaterial.
Short-term debt consists primarily of $1.54 billion in commercialpaper with an effective interest rate of 6.6% and $30 million of otherfacilities with varying rates of interest.
Long-term debt at the end of 2000 and 1999 consists of thefollowing:
Millions of dollars 2000 19996.25% notes due June 2000 $ Ñ $ 3007.6% debentures due August 2096 300 3008.75% debentures due February 2021 200 2008% senior notes due April 2003 139 139Medium-term notes due 2002
through 2027 400 400Term loans at LIBOR (GBP) plus 0.75%
payable in semiannual installments through March 2002 11 20
Other notes with varying interest rates 7 5Total long-term debt 1,057 1,364Less current portion 8 308Noncurrent portion of long-term debt $ 1,049 $1,056
We repaid $300 million on our 6.25% notes which came due inJune 2000. The 7.6% debentures due 2096, 8.75% debenturesdue 2021, and 8% senior notes due 2003 may not be redeemedprior to maturity and do not have sinking fund requirements.
52 HALLIBURTON COMPANY 2000 ANNUAL REPORT
N O T E S T O A N N U A L F I N A N C I A L S T A T E M E N T S

At December 31, 2000, we have outstanding notes under ourmedium-term note program as follows:
IssueAmount Due Rate Price
$ 75 million 08/2002 6.30)% Par$150 million 12/2008 5.63)% 99.97)%$ 50 million 05/2017 7.53)% Par$125 million 02/2027 6.75)% 99.78)%
Each holder of the 6.75% medium-term notes has the right torequire us to repay the holder’s notes in whole or in part, onFebruary 1, 2007. We may redeem the 5.63% medium-termnotes in whole or in part at any time. Other notes issued underthe medium-term note program may not be redeemed prior tomaturity. The medium-term notes do not have sinking fundrequirements.
Our debt matures as follows: $8 million in 2001; $84 million in2002; $139 million in 2003; none in 2004 and 2005; and $825million thereafter.
NOTE 9. COMMITMENTS AND CONTINGENCIES
Leases. At year end 2000, we were obligated under noncancelableoperating leases, expiring on various dates through 2021,principally for the use of land, offices, equipment, field facilities,and warehouses. Total rentals charged to continuing operationsfor noncancelable leases in 2000, 1999 and 1998 were as follows:
Millions of dollars 2000 1999 1998Rental expense $ 149 $139 $156
Future total rentals on noncancelable operating leases are asfollows: $94 million in 2001; $80 million in 2002; $66 million in2003; $45 million in 2004; $32 million in 2005; and $84 millionthereafter.
Asbestos litigation. Since 1976, our subsidiary, DresserIndustries, Inc. and its former divisions or subsidiaries have beeninvolved in litigation alleging some products they manufacturedcontained asbestos that injured persons that inhaled the fibers.
Dresser has entered into agreements with insurance carriers,that cover, in whole or in part, indemnity payments, legal feesand expenses for specific categories of claims. Dresser isnegotiating with insurance carriers for coverage for the remainingcategories of claims. Because these agreements are governed byexposure dates, payment type and the product involved, thecovered amount varies by claim. In addition, lawsuits arepending against several carriers seeking to recover additionalamounts related to these claims.
Our Engineering and Construction Group is also involved inasbestos litigation. Third parties allege they sustained injuriesfrom the inhalation of asbestos fibers contained in some of the
materials used in various construction and renovation projectsinvolving our Brown & Root subsidiary, now named KelloggBrown & Root, Inc. The insurance coverage for Kellogg Brown& Root for the applicable periods was written by HighlandsInsurance Company. Highlands was a subsidiary of Halliburtonprior to its spin-off to our shareholders in early 1996. Our negoti-ations with Highlands have not produced an agreement on theamount of insurance coverage for asbestos and defense costs. OnApril 5, 2000, Highlands filed suit in Delaware Chancery Courtalleging that, as part of the spin-off in 1996, Halliburton assumedliability for all asbestos claims filed against Halliburton after thespin-off. Highlands also alleges that Halliburton did notadequately disclose to Highlands the existence of Halliburton’ssubsidiaries’ potential asbestos liability. On August 23, 2000Highlands issued a letter denying coverage under the policiesbased on the claims asserted in the Delaware action. We believethat Highlands is contractually obligated to provide insurancecoverage for the asbestos claims filed against Kellogg Brown &Root and that Highlands’ lawsuit and its denial of coverage arewithout merit. We intend to assert our right to the insurancecoverage vigorously. On April 24, 2000, Halliburton filed suitagainst Highlands in Harris County, Texas, claiming thatHighlands breached its contractual obligation to provideinsurance coverage. We have asked the court to order Highlandsto provide coverage for asbestos claims under the guaranteedcost policies issued by Highlands to Kellogg Brown & Root.
On March 21, 2001 the Delaware Chancery Court ruled thatHighlands is not obligated to provide insurance coverage forasbestos claims filed against Kellogg Brown & Root because,in the court’s opinion, the agreements entered into byHighlands and Halliburton at the time of the spin-offterminated the policies previously written by Highlands thatwould otherwise cover such claims.This ruling, if it is notreversed on appeal, would eliminate our primary insurancecovering asbestos claims against Kellogg Brown & Root forperiods prior to the spin-off. Most claims filed against KelloggBrown & Root allege exposure to asbestos prior to the spin-offand are disposed of for less than the limits of the Highlandspolicies. However, we and our legal counsel, Vinson & ElkinsL.L.P., believe the court’s ruling is wrong. We intend to appealthe ruling to the Delaware Supreme Court as soon as possible.Vinson & Elkins has opined to us that it is very likely that theruling of the Chancery Court will be reversed because theruling clearly contravenes the provisions of the applicableagreements between Highlands and Halliburton. Vinson &Elkins has also opined to us that it is likely that we willultimately prevail in this litigation.
Since 1976, approximately 282,000 claims have been filedagainst various current and former divisions and subsidiaries.About 25,000 of these claims relate to Kellogg Brown & Root andthe balance of these claims relate to Dresser, its former divisionsand subsidiaries. Approximately 165,000 of these claims have
53HALLIBURTON COMPANY 2000 ANNUAL REPORT
N O T E S T O A N N U A L F I N A N C I A L S T A T E M E N T S

been settled or disposed of at a gross cost of approximately $124million, with insurance carriers paying all but approximately $32million. Claims continue to be filed, with about 45,000 claimsfiled in 2000. We have established an accrual estimating ourliability for known asbestos claims. Our estimate is based on ourhistorical litigation experience, settlements and expectedrecoveries from insurance carriers. Our expected insurancerecoveries are based on agreements with carriers or, whereagreements are still under negotiation or litigation, our estimateof recoveries. We believe that the insurance carriers with whichwe have signed agreements will be able to meet their share offuture obligations under the agreements. Prior to the ChanceryCourt’s ruling, Highlands Insurance Group Inc., the parent ofHighlands Insurance Company, stated in its SEC filings that ifit lost the litigation with us and was required to pay the asbestosclaims against Kellogg Brown & Root, there could be a materialadverse impact on Highlands Insurance Group’s financialposition. Highlands Insurance Company reported statutorycapital surplus of $152 million to the Texas InsuranceCommission in its Quarterly Statement as of September 30,2000. On March 12, 2001 Highlands Insurance Group, Inc.announced that it expected to report a significant loss for thefourth quarter of 2000 and for the full year 2000. Although wedo not know the extent of the impact of this loss on HighlandsInsurance Company, we believe that Highlands has the abilityto pay substantially all of these asbestos claims when thislitigation is resolved in our favor.
At December 31, 2000, there were about 117,000 open claims,including about 23,000 associated with recoveries we expectfrom Highlands. Open claims at December 31, 2000 also include9,000 for which settlements are pending. The number of openclaims at the end of 2000 compares with approximately 107,700open claims at the end of the prior year. The accrued liabilitiesfor these claims and corresponding billed and estimatedrecoveries from carriers are as follows:
December 31Millions of dollars 2000 1999Accrued liability $ 80 $ 71Estimated insurance recoveries:
Highlands Insurance Company (39) (28)Other insurance carriers (12) (18)
Net asbestos liability $ 29 $ 25
As of December 31, 2000, we have accounts receivable fromHighlands Insurance Company of $11 million for payments wehave made on asbestos claims. If our appeal of the ChanceryCourt’s ruling in the Highlands litigation is unsuccessful, wewill be unable to collect this account receivable or the $39million estimated recovery from Highlands for asbestos claims.This may have a material adverse impact on the results of ouroperations and our financial position at that time.
Accounts receivable for billings to other insurance carriers forpayments made on claims were $13 million at December 31, 2000and $9 million at December 31, 1999.
We recognize the uncertainties of litigation and the possibilitythat a series of adverse court rulings or new legislation affectingthe claims settlement process could materially impact the expectedresolution of asbestos related claims. However, based upon:
• our historical experience with similar claims;• the time elapsed since Dresser and its former divisions or
subsidiaries discontinued sale of products containing asbestos;• the time elapsed since Kellogg Brown & Root used asbestos in
any construction process; and• our understanding of the facts and circumstances that gave rise
to asbestos claims,
we believe that the pending asbestos claims will be resolvedwithout material effect on our financial position or results ofoperations.
Resolution of dispute with Global Industrial Technologies,
Inc. We previously reported that under an agreement entered intoat the time of the spin-off of Global Industrial Technologies, Inc.,formerly INDRESCO, Inc., from Dresser Industries, Inc., Globalassumed liability for all asbestos related claims filed against Dresserafter July 31, 1992 relating to refractory products manufactured ormarketed by the former Harbison-Walker Refractories division ofDresser. Those business operations were transferred to Global inthe spin-off. These asbestos claims are subject to agreements withDresser’s insurance carriers that cover expense and indemnitypayments. However, the insurance coverage is incomplete andGlobal has to-date paid the uncovered portion of asbestos claimswith its own funds.
54 HALLIBURTON COMPANY 2000 ANNUAL REPORT
N O T E S T O A N N U A L F I N A N C I A L S T A T E M E N T S

We also reported that a dispute arose with Global concerningthose agreements, which led to arbitration and litigation proceedings.We have now resolved the dispute and agreed with Global that:
• the arbitration, and all related litigation, is dismissed;• Global acknowledges its obligation to assume responsibility
for new asbestos claims filed after the date of the spin-off;• Global agrees to continue to cooperate with Dresser on
Dresser’s remaining refractory claims; and,• Dresser continues to make available its direct insurance
program for the Global assumed asbestos liabilities.
Fort Ord litigation. Brown & Root Services is a defendantin civil litigation pending in federal court in Sacramento,California. The lawsuit alleges that Brown & Root Servicesviolated provisions of the False Claims Act while performingwork for the United States Army at Fort Ord in California. Thislawsuit was filed by a former employee in 1997. Brown & RootServices has denied the allegations and is preparing to defenditself at trial. Further proceedings in this civil lawsuit have beenstayed while the investigation referred to in the next paragraphis ongoing. We believe that it is remote that this civil litigationwill result in any material amount of damages being assessedagainst the company, although the cost of our defense could wellexceed $1 million before the matter is brought to a conclusion.
Although in 1998 the United States Department of Justicedeclined to join this litigation, it has advised us that Brown &Root Services is the target of a federal grand jury investigationregarding the contract administration issues raised in the civillitigation. Brown & Root Services has been served with grandjury subpoenas, which required the production of documentsrelating to the Fort Ord contract and similar contracts at otherlocations. We have also been informed that several current andformer employees will be called to testify before the grand jury.We have retained independent counsel for these employees. Weare cooperating in this investigation. The United StatesDepartment of Justice has not made any specific allegationsagainst Brown & Root Services.
Environmental. We are subject to numerous environmentallegal and regulatory requirements related to our operationsworldwide. We take a proactive approach to evaluating andaddressing the environmental impact of our operations. Each yearwe assess and remediate contaminated properties in order to avoidfuture liabilities and comply with legal and regulatory require-ments. On occasion we are involved in specific environmentallitigation and claims, including the clean-up of properties weown or have operated as well as efforts to meet or correctcompliance-related matters.
Some of our subsidiaries and former operating entities areinvolved as a potentially responsible party or PRP in remedialactivities to clean-up several “Superfund” sites under UnitedStates federal law and comparable state laws. Kellogg Brown &
Root, Inc., one of our subsidiaries, is one of nine PRPs named atthe Tri-State Mining District “Superfund” Site, also known asthe Jasper County “Superfund” Site, which we have reported inthe past. Based on our negotiations with federal regulatoryauthorities and our evaluation of our responsibility forremediation at small portions of this site, we do not believe wewill be compelled to make expenditures which will have amaterial adverse effect on our financial position or results ofoperations. However, the United States Department of theInterior and the State of Missouri have indicated that they mightmake a separate claim against Kellog Brown & Root for naturalresource damages. Discussions with them have not beenconcluded and we are unable to make a judgement about theamount of damages they may seek.
We also incur costs related to compliance with ever-changingenvironmental legal and regulatory requirements in the jurisdic-tions where we operate. It is very difficult to quantify the potentialliabilities. We do not expect these expenditures to have amaterial adverse effect on our consolidated financial position orour results of operations.
Our accrued liabilities for environmental matters were $31 million as of December 31, 2000 and $29 million as ofDecember 31, 1999.
Other. We are a party to various other legal proceedings. Weexpense the costs of legal fees related to these proceedings. Webelieve any liabilities we may have arising from theseproceedings will not be material to our consolidated financialposition or our results of operations.
NOTE 10. INCOME PER SHARE
Millions of dollars and sharesexcept per share data 2000 1999 1998Income (loss) from continuing
operations before change inaccounting method $ 188 $ 174 $ (120)
Basic weighted average shares 442 440 439Effect of common
stock equivalents 4 3 —Diluted weighted
average shares 446 443 439Income (loss) per common
share from continuing operations before change in accounting method:
Basic $ 0.42 $0.40 $(0.27)Diluted $ 0.42 $0.39 $(0.27)
Income per common share fromdiscontinued operations:
Basic $ 0.71 $0.64 $ 0.24Diluted $ 0.70 $0.64 $ 0.24
55HALLIBURTON COMPANY 2000 ANNUAL REPORT
N O T E S T O A N N U A L F I N A N C I A L S T A T E M E N T S
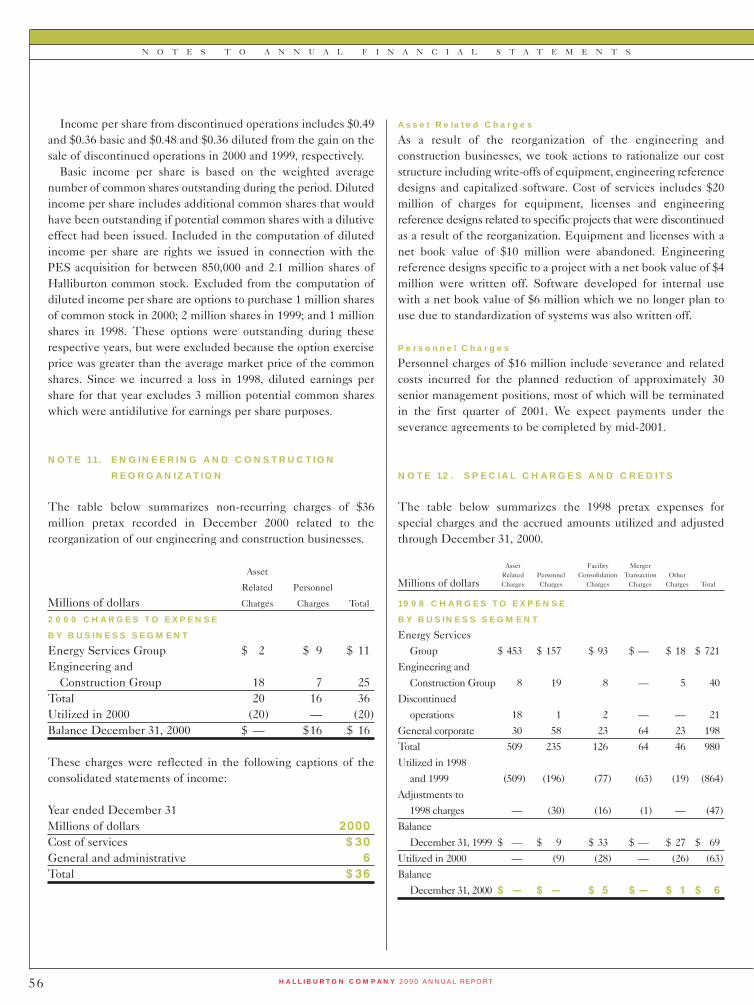
Income per share from discontinued operations includes $0.49and $0.36 basic and $0.48 and $0.36 diluted from the gain on thesale of discontinued operations in 2000 and 1999, respectively.
Basic income per share is based on the weighted averagenumber of common shares outstanding during the period. Dilutedincome per share includes additional common shares that wouldhave been outstanding if potential common shares with a dilutiveeffect had been issued. Included in the computation of dilutedincome per share are rights we issued in connection with thePES acquisition for between 850,000 and 2.1 million shares ofHalliburton common stock. Excluded from the computation ofdiluted income per share are options to purchase 1 million sharesof common stock in 2000; 2 million shares in 1999; and 1 millionshares in 1998. These options were outstanding during theserespective years, but were excluded because the option exerciseprice was greater than the average market price of the commonshares. Since we incurred a loss in 1998, diluted earnings pershare for that year excludes 3 million potential common shareswhich were antidilutive for earnings per share purposes.
NOTE 11. ENGINEERING AND CONSTRUCTION
REORGANIZATION
The table below summarizes non-recurring charges of $36million pretax recorded in December 2000 related to thereorganization of our engineering and construction businesses.
Asset
Related Personnel
Millions of dollars Charges Charges Total
2000 CHARGES TO EXPENSE
BY BUSINESS SEGMENT
Energy Services Group $ 2 $ 9 $ 11Engineering and
Construction Group 18 7 25Total 20 16 36Utilized in 2000 (20) — (20)Balance December 31, 2000 $ — $16 $ 16
These charges were reflected in the following captions of theconsolidated statements of income:
Year ended December 31Millions of dollars 2000Cost of services $ 30General and administrative 6Total $ 36
Asset Related Charges
As a result of the reorganization of the engineering andconstruction businesses, we took actions to rationalize our coststructure including write-offs of equipment, engineering referencedesigns and capitalized software. Cost of services includes $20million of charges for equipment, licenses and engineeringreference designs related to specific projects that were discontinuedas a result of the reorganization. Equipment and licenses with anet book value of $10 million were abandoned. Engineeringreference designs specific to a project with a net book value of $4million were written off. Software developed for internal usewith a net book value of $6 million which we no longer plan touse due to standardization of systems was also written off.
Personnel Charges
Personnel charges of $16 million include severance and relatedcosts incurred for the planned reduction of approximately 30senior management positions, most of which will be terminatedin the first quarter of 2001. We expect payments under theseverance agreements to be completed by mid-2001.
NOTE 12. SPECIAL CHARGES AND CREDITS
The table below summarizes the 1998 pretax expenses forspecial charges and the accrued amounts utilized and adjustedthrough December 31, 2000.
Asset Facility MergerRelated Personnel Consolidation Transaction Other
Millions of dollars Charges Charges Charges Charges Charges Total
1998 CHARGES TO EXPENSE
BY BUSINESS SEGMENT
Energy Services
Group $ 453 $ 157 $ 93 $ — $ 18 $ 721
Engineering and
Construction Group 8 19 8 — 5 40
Discontinued
operations 18 1 2 — — 21
General corporate 30 58 23 64 23 198
Total 509 235 126 64 46 980
Utilized in 1998
and 1999 (509) (196) (77) (63) (19) (864)
Adjustments to
1998 charges — (30) (16) (1) — (47)
Balance
December 31, 1999 $ — $ 9 $ 33 $ — $ 27 $ 69
Utilized in 2000 — (9) (28) — (26) (63)
Balance
December 31, 2000 $ Ñ $ Ñ $ 5 $ Ñ $ 1 $ 6
56 HALLIBURTON COMPANY 2000 ANNUAL REPORT
N O T E S T O A N N U A L F I N A N C I A L S T A T E M E N T S

Our 1998 results of operations reflect special charges totaling$980 million to provide for costs associated with the DresserIndustries, Inc. merger and industry downturn due to decliningoil and gas prices. These charges were reflected in the followingcaptions of the consolidated statements of income:
Year ended December 31Millions of dollars 1998Cost of services $ 68Cost of sales 16Special charges 875Discontinued operations 21Total $980
Most restructuring activities accrued for in the 1998 specialcharges were completed and expended by the end of 1999. Weutilized $63 million in 2000 for sales of facilities and other actionsthat were initiated in 1999 but were concluded in 2000. Frominception through December 31, 2000, we used $368 million incash for items associated with the 1998 special charges. Theunutilized special charge reserve balance at December 31, 2000is expected to result in future cash outlays of $6 million. AtDecember 31, 2000, no adjustments or reversals to the remainingaccrued special charges are planned.
During the second quarter of 1999, we reversed $47 million ofthe 1998 special charge based on our reassessment of total coststo be incurred to complete the actions covered in our specialcharges. The components of the reversal are as follows:
• $30 million in personnel charges primarily due to a reductionin estimated legal costs associated with employee layoffs,lower than anticipated average severance per person and fewerthan expected terminations due to voluntary employeeresignations;
• $16 million in facility consolidation charges due to fewer thaninitially estimated facility exits, resulting in an estimated $7million reduction in facilities consolidation costs, combinedwith other factors including more favorable exit costs thananticipated; and
• $1 million of merger transaction costs primarily as a result of lowerthan previously estimated legal and other professional costs.
Asset Related Charges
Asset related charges include impairments and write-offs ofintangible assets and excess and/or duplicate machinery,equipment, inventory, and capitalized software. Charges alsoinclude write-offs and lease cancellation costs related toacquired information technology equipment replaced with ourstandard common office equipment and exit costs on otherleased assets.
As a result of the merger, Halliburton Company’s and DresserIndustries, Inc.’s completion products operations and formationevaluation businesses have been combined. Excluded isHalliburton’s logging-while-drilling business and a portion of ourmeasurement-while-drilling business which were required to bedisposed of in connection with the United States Department ofJustice consent decree. See Note 2. We recorded impairmentsbased upon anticipated future cash flows in accordance withStatement of Financial Accounting Standards No. 121. This wasbased on the change in strategic direction, the outlook for theindustry, the decision to standardize equipment product offeringsand the expected loss on the disposition of the logging-while-drilling business. The following table summarizes the resultingwrite-downs of excess of cost over net assets acquired and long-lived assets associated with:
• the directional drilling and formation evaluation businessesacquired in 1993 from Smith International, Inc.;
• the formation evaluation business acquired in the 1988acquisition of Gearhart Industries, Inc.; and
• Mono Pumps and AVA acquired in 1990 and 1992.
Excess Relatedof Cost Long-
Over Net LivedMillions of dollars Assets Assets TotalDrilling operations of
pre-merger Halliburton Energy Services $125 $ 96 $221
Logging operations ofpre-merger Halliburton Energy Services 51 54 105
Mono Pump industrial and oilfield pump operations of Dresser 43 — 43
AVA completion products business of Dresser Oil Tools 34 3 37
Abandonment of a trademark 1 — 1Total $254 $153 $407
As discussed below, the merger caused management toreevaluate the realizability of excess cost over net assets acquiredand related long-lived assets of these product service lines. Eachbusiness was considered to be impaired under SFAS No. 121guidance.
The overall market assumptions on which the impairmentcomputations were made assumed that 1999 calendar year drillingactivity as measured by worldwide rig count would be 1,900 rigswhich was up from the 1,700 level in the third quarter of 1998.Rig count for calendar year 2000 and beyond was assumed to
57HALLIBURTON COMPANY 2000 ANNUAL REPORT
N O T E S T O A N N U A L F I N A N C I A L S T A T E M E N T S

increase about 3% per year based upon estimated long-termgrowth in worldwide demand for oil and gas. These assumptionswere based on market data available at the time of the merger.
In addition to these assumptions, management utilized a 10-year timeframe for future projected cash flows, a discount ratethat approximates its average cost of capital, and specificassumptions for the future performance of each product serviceline. The most significant assumptions are discussed below. Ineach case, these analyses represented management’s bestestimate of future results for these product service lines.
Drilling operations of pre-merger Halliburton Energy
Services. Our pre-merger drilling business consisted oflogging-while-drilling, measurement-while-drilling and directionaldrilling services. The majority of the pre-merger logging-while-drilling business and a portion of the pre-merger measurement-while-drilling business were required to be sold under theUnited States Department of Justice consent decree. We haveintegrated the remaining drilling business with the Sperry-Sunoperations of Dresser. Our strategy focuses generally onoperating under the Sperry-Sun name and using Sperry-Sun’ssuperior technology, tools and industry reputation. Ourremaining pre-merger drilling assets and technology are beingde-emphasized as they wear out or become obsolete. These toolswill not be replaced resulting in significant decreases in futurecash flows and an impairment of the excess of cost over net assetsand related long-lived assets.
Significant forecast assumptions included a revenue decline inthe remaining pre-merger drilling business due to themeasurement-while-drilling sale in the first year. Relatedrevenue and operating income over the following 10 years wereprojected to decline due to reduced business opportunitiesresulting from our shift in focus toward Sperry-Sun’s tools andtechnologies. We determined that there was a $125 millionimpairment of excess of cost over net assets acquired. Inaddition, related long-lived asset impairments consisted of $61million of property and equipment and $14 million of relatedspare parts, the value of which was estimated using the “held foruse” model during the forecast period. An impairment of $3million was recorded related to property and equipment and $18million of spare parts using the “held for sale” model sold inaccordance with the consent decree with the United StatesDepartment of Justice. See Note 2.
Logging operations of pre-merger Halliburton Energy
Services. The merger of Halliburton Company and DresserIndustries, Inc. enabled the acceleration of a formation evaluationstrategy. This strategy takes advantage of Sperry-Sun’s logging-while-drilling competitive position and reputation for reliabilitycombined with our Magnetic Resonance Imaging Logging(MRIL®) technology acquired with the NUMAR acquisition in1997. Prior to the merger, we were focused on growing thetraditional logging business while working toward development
of new systems to maximize the MRIL® technology. The mergerallowed us to implement the new strategy and place thetraditional logging business in a sustaining mode. This change infocus and strategy resulted in a shift of operating cash flows awayfrom our traditional logging business. This created an impairmentof the excess of cost over net assets and related long-lived assetsrelated to our logging business.
Significant forecast assumptions included revenuesdecreasing slowly over the 10-year period, reflecting thedecline in the traditional logging markets. Operating incomeinitially was forecasted to increase due to cost cutting activity,and then decline as revenue decreased due to the significantfixed costs in this product service line. We calculated $51million impairment of the excess of cost over net assetsacquired. In addition, related long-lived asset impairmentsconsisted of $22 million of property and equipment and $32million of spare parts which management estimated using the“held for use” model during the forecast period.
Mono Pump operations of pre-merger Dresser.
The amount of the impairment is $43 million, all of whichrepresents excess of cost over net assets acquired associatedwith the business.
Our strategy for Mono Pump is to focus primarily on theoilfield business including manufacturing power sections fordrilling motors. The prior strategy included emphasis on non-oilfield related applications of their pumping technology andthe majority of Mono Pump revenues were related to non-oilfield sales. The change in strategy will result in reducedfuture cash flows resulting in an impairment of the excess ofcosts over net assets acquired.
Significant forecast assumptions included stable revenue forseveral years and then slowly declining due to decreasingemphasis of industrial market applications. Operating incomewas forecasted to initially be even with current levels but thendecline over the period as revenues declined and fixed costsper unit increased.
AVA operations of Dresser Oil Tools. The amount of theimpairment is $37 million of which $34 million relates to excessof costs over net assets acquired.
The plan for Dresser’s AVA business line (which suppliessubsurface safety valves and other completion equipment) wasto rationalize product lines which overlap with our pre-existingcompletion equipment business line. The vast majority of theAVA product lines were de-emphasized except for supportingthe installed base of AVA equipment and specific special orderrequests from customers. AVA products were generally aimed atthe high-end custom completion products market. Our strategywas to focus on standardized high-end products based uponpre-merger Halliburton designs thus reducing future AVA cashflows and impairing its assets and related excess of costs overnet assets acquired.
58 HALLIBURTON COMPANY 2000 ANNUAL REPORT
N O T E S T O A N N U A L F I N A N C I A L S T A T E M E N T S

Additional asset related charges. Additional assetrelated charges include:
• $37 million for various excess fixed assets as a result ofmerging similar product lines. We have no future use for theseassets and they have been scrapped;
• $33 million for other assets related to capitalized software,which became redundant with the merger. Major componentsincluded redundant computer aided design systems andcapitalized costs related to a portion of our enterprise-wideinformation system abandoned due to changed requirementsof the post merger company. The redundant computer aideddesign systems were used in both the Energy Services Groupand the Engineering and Construction Group and wereimmediately abandoned and replaced by superior systemsrequired to meet the needs of the merged company;
• $26 million for the inventory charge relates to excessinventory as a result of merging similar product lines and/orindustry downturn. This included approximately $17 millionrelated to overlapping product lines and excess inventory inthe completion products business and $9 million related tovarious Dresser Equipment Group divisions due to excessinventory related to industry downturn. Inventory that wasoverlapping due to the merger was segregated and has beenscrapped. Inventory reserves were increased to cover theestimated write-down to market for inventory with future usedetermined to be excess as a result of the industry downturn.Any future sales are expected to approximate the new lowercarrying value of the inventory;
• $5 million for the impairment of excess of cost over net assetsacquired related to well construction technology that becameredundant once the merger was complete due to similar butsuperior technology offered by Sperry-Sun. This technologywill no longer be used as part of our integrated service offerings,thus reducing future cash flows. We will, however, continue tomarket this technology individually to third parties. Animpairment based on a “held for use” model was calculatedusing a 10-year discounted cash flow model with a discountrate which approximates our average cost of capital; and
• $1 million write-off of excess of cost over net assets acquiredrelated to the Steamford product line in the DresserEquipment Group valve and control division. Managementmade the strategic decision to exit this product line.
Asset related charges have been reflected as direct reductionsof the associated asset balances.
Personnel Charges
Personnel charges include severance and related costs incurredfor announced employee reductions of 10,850 affecting all businesssegments, corporate and shared service functions. Personnelcharges also include personnel costs related to change of control.In June 1999, management revised the planned employeereductions to 10,100 due in large part to higher than anticipatedvoluntary employee resignations. As of December 31, 2000,terminations of employees, consultants and contract personnelrelated to the 1998 special charge have been completed.
Facility Consolidation Charges
Facility consolidation charges include costs to dispose of ownedproperties or exit leased facilities. As a result of the merger withDresser and the industry downturn, we recorded a charge forcosts to vacate, sell or close excess and redundant service,manufacturing and administrative facilities throughout theworld. The majority of these facilities are within the EnergyServices Group. Expenses of $126 million included:
• $85 million write-down of owned facilities for anticipatedlosses on planned disposals based upon the differencebetween the assets’ net book values and anticipated future netrealizable value based upon the “to be disposed of” method;
• $37 million lease buyout costs or early lease termination costincluding:
- estimated costs to buy out leases;- facility refurbishment/restoration expenses as required by
the lease in order to exit property;- sublease differentials, as applicable; and- related broker/agent fees to negotiate and close buyouts;
• $4 million facility maintenance costs to maintain vacatedfacilities between the abandonment date and the expecteddisposition date. Maintenance costs include lease expense,depreciation, maintenance, utilities, and third-party adminis-trative costs.
As of December 31, 2000, we have substantially completed thework to vacate, sell or close the service, manufacturing andadministrative facilities related to the 1998 special charge. Themajority of the sold, returned or vacated properties are located inNorth America and have been eliminated from the EnergyServices Group. The remaining expenditures will be made as theremaining properties are vacated and sold.
Merger Transaction Charges
Merger transaction costs include investment banking, filing fees,legal and professional fees and other merger related costs. Weestimated our merger transaction costs to be $64 million.
59HALLIBURTON COMPANY 2000 ANNUAL REPORT
N O T E S T O A N N U A L F I N A N C I A L S T A T E M E N T S

Other Charges
Other charges of $46 million include the estimated contract exitcosts associated with the elimination of duplicate agents andsuppliers in various countries throughout the world. ThroughDecember 31, 2000, we have utilized substantially all of theestimated amount of other special charge costs.
NOTE 13. CHANGE IN ACCOUNTING METHOD
In April 1998, the American Institute of Certified PublicAccountants issued Statement of Position 98-5 “Reporting onthe Costs of Start-Up Activities.” This Statement requires costsof start-up activities and organization costs to be expensed asincurred. We adopted Statement of Position 98-5 effectiveJanuary 1, 1999 and recorded expense of $30 million pretax or$19 million after-tax or $0.04 per diluted share. The componentsof the $30 million pretax cost, all contained within the EnergyServices Group, that were previously deferred include:
• $23 million for mobilization costs associated with specificcontracts and for installation of offshore cementing equipmentonto third party marine drilling rigs or vessels; and
• $7 million for costs incurred opening a new manufacturingfacility in the United Kingdom.
NOTE 14. INCOME TAXES
The components of the (provision) benefit for income taxes are:
Years ended December 31Millions of dollars 2000 1999 1998Current income taxes:Federal $ (16) $ 137 $(260)Foreign (114) (64) (185)State (5) (2) (7)Total (135) 71 (452)Deferred income taxes:Federal (20) (175) 293Foreign and state 26 (12) 4Total 6 (187) 297Continuing operations (129) (116) (155)Discontinued operations (60) (98) (90)Disposal of discontinued
operations (141) (94) —Benefit for change in
accounting method Ñ 11 —Total $ (330) $(297) $(245)
Included in federal income taxes for continuing operations areforeign tax credits of $113 million in 2000, $52 million in 1999and $94 million in 1998. The United States and foreigncomponents of income (loss) from continuing operations beforeincome taxes and minority interests are as follows:
Years ended December 31Millions of dollars 2000 1999 1998United States $ 128 $131 $(428)Foreign 207 176 483Total $ 335 $307 $ 55
The primary components of our deferred tax assets andliabilities and the related valuation allowances are as follows:
December 31Millions of dollars 2000 1999Gross deferred tax assets:Employee benefit plans $ 261 $250Accrued liabilities 118 116Construction contract
accounting methods 117 98Insurance accruals 109 98Inventory 43 31Intercompany profit 42 26Net operating loss carryforwards 35 34Basis in joint ventures 33 92Intangibles 20 28Special charges 6 25Alternative minimum tax carryforward Ñ 7All other 60 69Total 844 874Gross deferred tax liabilities:Depreciation and amortization 128 135Unrepatriated foreign earnings 29 29Safe harbor leases 9 10All other 66 99Total 232 273Valuation allowances:Net operating loss carryforwards 29 31All other 8 1Total 37 32Net deferred income tax asset $ 575 $569
We have accrued for the potential repatriation of undistributedearnings of our foreign subsidiaries and consider earnings abovethe amounts on which tax has been provided to be permanentlyreinvested. While these additional earnings could become subjectto additional tax if repatriated, repatriation is not anticipated.Any additional amount of tax is not practicable to estimate.
60 HALLIBURTON COMPANY 2000 ANNUAL REPORT
N O T E S T O A N N U A L F I N A N C I A L S T A T E M E N T S

We have net operating loss carryforwards of $44 million whichexpire in 2001 through 2005. We also have net operating losscarryforwards of $75 million with indefinite expiration dates.Reconciliations between the actual provision for income taxesand that computed by applying the United States statutory rateto income from continuing operations before income taxes andminority interest are as follows:
Years ended December 31Millions of dollars 2000 1999 1998Provision computed at
statutory rate $ (117) $ (99) $ (13)Reductions (increases) in
taxes resulting from:Tax differentials on
foreign earnings (14) (14) (17)State income taxes, net of
federal income tax benefit (3) (1) (7)Special charges Ñ — (109)Nondeductible goodwill (11) (10) (11)Other items, net 16 8 2
Continuing operations (129) (116) (155)Discontinued operations (60) (98) (90)Disposal of discontinued
operations (141) (94) —Benefit for change in
accounting method Ñ 11 —Total $ (330) $(297) $(245)
NOTE 15. COMMON STOCK
On June 25, 1998, our shareholders voted to increase the numberof authorized shares from 400 million to 600 million.
Our 1993 Stock and Long-Term Incentive Plan provides forthe grant of any or all of the following types of awards:
• stock options, including incentive stock options and non-qualified stock options;
• stock appreciation rights, in tandem with stock options orfreestanding;
• restricted stock;• performance share awards; and• stock value equivalent awards.
Under the terms of the 1993 Stock and Long-Term IncentivePlan as amended, 49 million shares of common stock have beenreserved for issuance to key employees. The plan specifies that nomore than 16 million shares can be awarded as restricted stock.At December 31, 2000, 27 million shares were available for futuregrants under the 1993 Stock and Long-Term Incentive Plan with12.7 million shares remaining available for restricted stock awards.
In connection with the acquisition of Dresser in 1998, weassumed the outstanding stock options under the stock optionplans maintained by Dresser. See Note 2. Stock option transac-tions summarized below include amounts for the 1993 Stock andLong-Term Incentive Plan and stock plans of Dresser and otheraquired companies. No further awards are being made under thestock plans of aquired companies.
WeightedAverage
Number Exerciseof Shares Exercise Price
Stock Options (in millions) Price per Share per Share
Outstanding at December 31, 1997 12.4 $ 3.10 – 61.50 $26.55
Granted 4.2 26.19 – 46.50 33.07Exercised (2.4) 3.10 – 37.88 20.84Forfeited (0.4) 5.40 – 54.50 33.64
Outstanding at December 31, 1998 13.8 $ 3.10 – 61.50 $29.37
Granted 5.6 28.50 – 48.31 36.46Exercised (1.7) 3.10 – 54.50 24.51Forfeited (0.6) 8.28 – 54.50 35.61
Outstanding at December 31, 1999 17.1 $ 3.10 – 61.50 $32.03
Granted 1.7 34.75 – 54.00 41.61Exercised (3.6) 3.10 – 45.63 25.89Forfeited (0.5) 12.20 – 54.50 37.13
Outstanding at December 31, 2000 14.7 $ 8.28 – 61.50 $34.54
Options outstanding at December 31, 2000 are composed ofthe following:
Outstanding Exercisable
WeightedAverage Weighted Weighted
Number of Remaining Average Number of AverageRange of Shares Contractual Exercise Shares ExerciseExercise Prices (in millions) Life Price (in millions) Price
$ 8.28 – 28.13 3.8 5.8 $23.60 3.2 $22.76
28.50 – 34.75 3.8 7.5 30.58 1.8 29.50
35.00 – 39.50 5.0 8.0 39.08 2.4 38.77
39.56 – 61.50 2.1 7.6 50.42 1.4 50.87
$ 8.28 – 61.50 14.7 7.2 $34.54 8.8 $32.81
There were 9.5 million options exercisable with a weightedaverage exercise price of $28.96 at December 31, 1999, and 7.8million options exercisable with a weighted average exerciseprice of $25.72 at December 31, 1998.
61HALLIBURTON COMPANY 2000 ANNUAL REPORT
N O T E S T O A N N U A L F I N A N C I A L S T A T E M E N T S

All stock options under the 1993 Stock and Long-TermIncentive Plan, including options granted to employees ofDresser since its acquisition, are granted at the fair market valueof the common stock at the grant date.
The fair value of options at the date of grant was estimatedusing the Black-Scholes option pricing model. The weightedaverage assumptions and resulting fair values of options grantedare as follows:
WeightedAssumptions Average Fair
Expected Value ofRisk-Free Expected Life Expected Options
Interest Rate Dividend Yield (in years) Volatility Granted
2000 5.2% 1.3% 5 54.0% $21.57
1999 5.8% 1.3% 5 56.0% $19.77
1998 4.3–5.3% 1.2–2.7% 5–6.5 20.1–38.0% $11.63
Stock options generally expire 10 years from the grant date.Stock options under the 1993 Stock and Long-Term IncentivePlan vest over a three-year period, with one-third of the sharesbecoming exercisable on each of the first, second and thirdanniversaries of the grant date. Other plans have vesting periodsranging from three to 10 years. Options under the Non-Employee Directors’ Plan vest after six months.
We account for the option plans in accordance withAccounting Principles Board Opinion No. 25, under which nocompensation cost has been recognized for stock option awards.Compensation cost for the stock option programs calculatedconsistent with Statement of Financial Accounting StandardsNo. 123, “Accounting for Stock-Based Compensation,” is set forthon a pro forma basis below:
Years ended December 31Millions of dollarsexcept per share data 2000 1999 1998Net income:
As reported $ 501 $ 438 $ (15)Pro forma 460 406 (43)
Diluted earnings per share:As reported $ 1.12 $0.99 $(0.03)Pro forma 1.03 0.92 (0.10)
Restricted shares awarded under the 1993 Stock and Long-TermIncentive Plan were 695,692 in 2000, 352,267 in 1999 and 414,510in 1998. The shares awarded are net of forfeitures of 69,402 in2000, 72,483 in 1999 and 136,540 in 1998. The weighted averagefair market value per share at the date of grant of shares grantedwas $42.25 in 2000, $43.41 in 1999 and $34.77 in 1998.
Our Restricted Stock Plan for Non-Employee Directors allowsfor each non-employee director to receive an annual award of 400restricted shares of common stock as a part of compensation. Wereserved 100,000 shares of common stock for issuance to non-
employee directors. Under this plan we issued 3,600 restrictedshares in 2000, 4,800 restricted shares in 1999 and 3,200restricted shares in 1998. At December 31, 2000, 28,800 shareshave been issued to non-employee directors under this plan.The weighted average fair market value per share at the date ofgrant of shares granted was $46.81 in 2000, $46.13 in 1999 and$36.31 in 1998.
Our Employees’ Restricted Stock Plan was established foremployees who are not officers, for which 200,000 shares ofcommon stock have been reserved. At December 31, 2000,152,850 shares (net of 42,550 shares forfeited) have been issued.Forfeitures were 7,450 in 2000, 8,400 in 1999 and 1,900 in 1998.No further grants are being made under this plan.
Under the terms of our Career Executive Incentive StockPlan, 15 million shares of our common stock were reserved forissuance to officers and key employees at a purchase price not toexceed par value of $2.50 per share. At December 31, 2000, 11.7million shares (net of 2.2 million shares forfeited) have beenissued under the plan. No further grants will be made under theCareer Executive Incentive Stock Plan.
Restricted shares issued under the 1993 Stock and Long-TermIncentive Plan, Restricted Stock Plan for Non-EmployeeDirectors, Employees’ Restricted Stock Plan and the CareerExecutive Incentive Stock Plan are limited as to sale ordisposition. These restrictions lapse periodically over an extendedperiod of time not exceeding ten years. Restrictions may alsolapse for early retirement and other conditions in accordancewith our established policies. The fair market value of the stock,on the date of issuance, is being amortized and charged toincome (with similar credits to paid-in capital in excess of parvalue) generally over the average period during which the restric-tions lapse. At December 31, 2000, the unamortized amount is$63 million. We recognized compensation costs in income of $18million in 2000, $11 million in 1999 and $8 million in 1998.
NOTE 16. SERIES A JUNIOR PARTICIPATING
PREFERRED STOCK
We previously declared a dividend of one preferred stockpurchase right on each outstanding share of common stock.The dividend is also applicable to each share of our commonstock that was issued subsequent to adoption of the RightsAgreement entered into with Mellon Investor Services LLC.Each preferred stock purchase right entitles its holder to buyone two-hundredth of a share of our Series A JuniorParticipating Preferred Stock, without par value, at an exerciseprice of $75. These preferred stock purchase rights are subjectto antidilution adjustments, which are described in the RightsAgreement entered into with Mellon. The preferred stockpurchase rights do not have any voting rights and are notentitled to dividends.
62 HALLIBURTON COMPANY 2000 ANNUAL REPORT
N O T E S T O A N N U A L F I N A N C I A L S T A T E M E N T S

The preferred stock purchase rights become exercisable inlimited circumstances involving a potential business combination.After the preferred stock purchase rights become exercisable,each preferred stock purchase right will entitle its holder to anamount of our common stock, or in some circumstances, securitiesof the acquirer, having a total market value equal to two timesthe exercise price of the preferred stock purchase right. Thepreferred stock purchase rights are redeemable at our option atany time before they become exercisable. The preferred stockpurchase rights expire on December 15, 2005. No event during2000 made the preferred stock purchase rights exercisable.
NOTE 17. FINANCIAL INSTRUMENTS AND RISK
MANAGEMENT
Foreign exchange risk. Techniques in managing foreignexchange risk include, but are not limited to, foreign currencyborrowing and investing and the use of currency derivativeinstruments. We selectively hedge significant exposures topotential foreign exchange losses considering current marketconditions, future operating activities and the cost of hedging theexposure in relation to the perceived risk of loss. The purpose ofour foreign currency hedging activities is to protect us from therisk that the eventual dollar cash flows resulting from the saleand purchase of products and services in foreign currencies willbe adversely affected by changes in exchange rates. We do nothold or issue derivative financial instruments for trading orspeculative purposes.
We hedge our currency exposure through the use of currencyderivative instruments. These contracts generally have anexpiration date of two years or less. Forward exchange contracts,which are commitments to buy or sell a specified amount of aforeign currency at a specified price and time, are generally usedto hedge identifiable foreign currency commitments. Losses of$1 million for identifiable foreign currency commitments weredeferred at December 31, 2000. Forward exchange contracts andforeign exchange option contracts, which convey the right, butnot the obligation, to sell or buy a specified amount of foreigncurrency at a specified price, are generally used to hedge foreigncurrency commitments with an indeterminable maturity date.None of the forward or option contracts are exchange traded.
While hedging instruments are subject to fluctuations invalue, the fluctuations are generally offset by the value of theunderlying exposures being hedged. The use of some contractsmay limit our ability to benefit from favorable fluctuations inforeign exchange rates. The notional amounts of open forwardcontracts and options for continuing operations were $281million and $297 million at year-end 2000 and 1999, respectively.Amounts related to discontinued operations were $61 millionand $96 million at December 31, 2000 and 1999, respectively.The notional amounts of our foreign exchange contracts do not
generally represent amounts exchanged by the parties, and thus,are not a measure of our exposure or of the cash requirementsrelating to these contracts. The amounts exchanged arecalculated by reference to the notional amounts and by otherterms of the derivatives, such as exchange rates. We activelymonitor our foreign currency exposure and adjust the amountshedged as appropriate.
Exposures to some currencies are generally not hedged dueprimarily to the lack of available markets or cost considerations(non-traded currencies). We attempt to manage our workingcapital position to minimize foreign currency commitments innon-traded currencies and recognize that pricing for the servicesand products offered in these countries should cover the cost ofexchange rate devaluations. We have historically incurredtransaction losses in non-traded currencies.
Credit risk. Financial instruments that potentially subject usto concentrations of credit risk are primarily cash equivalents,investments and trade receivables. It is our practice to place ourcash equivalents and investments in high-quality securities withvarious investment institutions. We derive the majority of ourrevenues from sales and services, including engineering andconstruction, to the energy industry. Within the energy industry,trade receivables are generated from a broad and diverse groupof customers. There are concentrations of receivables in theUnited States and the United Kingdom. We maintain anallowance for losses based upon the expected collectibility of alltrade accounts receivable.
There are no significant concentrations of credit risk withany individual counterparty or groups of counterparties relatedto our derivative contracts. We select counterparties based oncreditworthiness, which we continually monitor, and on thecounterparties’ ability to perform their obligations under theterms of the transactions. We do not expect any counterpartiesto fail to meet their obligations under these contracts giventheir high credit ratings. Therefore, we consider the credit riskassociated with our derivative contracts to be minimal.
Fair market value of financial instruments. Theestimated fair market value of long-term debt at year-end 2000and 1999 was $1,066 million and $1,352 million, respectively,as compared to the carrying amount of $1,057 million at year-end 2000 and $1,364 million at year-end 1999. The fair marketvalue of fixed rate long-term debt is based on quoted marketprices for those or similar instruments. The carrying amount ofvariable rate long-term debt approximates fair market valuebecause these instruments reflect market changes to interestrates. See Note 8. The carrying amount of short-term financialinstruments, cash and equivalents, receivables, short-termnotes payable and accounts payable, as reflected in the consol-idated balance sheets approximates fair market value due tothe short maturities of these instruments. The fair marketvalue of currency derivative instruments generally approxi-mates their carrying amount based upon third-party quotes.
63HALLIBURTON COMPANY 2000 ANNUAL REPORT
N O T E S T O A N N U A L F I N A N C I A L S T A T E M E N T S

The fair market values of derivative instruments used for fairvalue hedging and cash flow hedging were immaterial.
NOTE 18. RETIREMENT PLANS
Our company and subsidiaries have various plans which cover asignificant number of their employees. These plans includedefined contribution plans, which provide retirement contribu-tions in return for services rendered, provide an individualaccount for each participant and have terms that specify howcontributions to the participant’s account are to be determinedrather than the amount of pension benefits the participant is toreceive. Contributions to these plans are based on pretax incomeand/or discretionary amounts determined on an annual basis. Ourexpense for the defined contribution plans for both continuingand discontinued operations totaled $182 million, $146 million,and $152 million in 2000, 1999 and 1998, respectively. Otherretirement plans include defined benefit plans, which define anamount of pension benefit to be provided, usually as a functionof age, years of service or compensation. These plans are fundedto operate on an actuarially sound basis. Plan assets are primarilyinvested in cash, short-term investments, real estate, equity andfixed income securities of entities domiciled in the country ofthe plan’s operation. Plan assets, expenses and obligations forretirement plans in the following tables include both continuingand discontinued operations.
Millions of dollars 2000 1999
U.S. Int’l. U.S. Int’l.
CHANGE IN BENEFIT OBLIGATION
Benefit obligation at beginning of year $ 413 $ 1,747 $430 $1,716
Service cost 4 53 7 66
Interest cost 20 85 30 96
Plan participants’ contributions Ñ 13 — 15
Effect of business combinations Ñ 32 — —
Amendments 5 Ñ 5 11
Divestitures (138) (61) — —
Settlements/curtailments (8) Ñ (3) —
Currency fluctuations Ñ (163) — (44)
Actuarial gain/(loss) 13 (11) (3) (60)
Benefits paid (21) (58) (53) (53)
Benefit obligation at end of year $ 288 $ 1,637 $413 $1,747
Millions of dollars 2000 1999
U.S. Int’l. U.S. Int’l.
CHANGE IN PLAN ASSETS
Fair value of plan assets
at beginning of year $ 466 $ 2,134 $445 $1,817
Actual return on plan assets 18 262 65 376
Employer contribution 17 25 22 26
Settlements (14) Ñ (13) —
Plan participants’ contributions Ñ 13 — 15
Divestitures (153) (47) — —
Currency fluctuations Ñ (199) — (47)
Benefits paid (21) (58) (53) (53)
Fair value of plan assets at end of year $ 313 $ 2,130 $466 $2,134
Funded status $ 25 $ 493 $ 53 $ 387
Unrecognized transition
obligation/(asset) (1) 17 — (6)
Unrecognized actuarial (gain)/loss 4 (378) (31) (275)
Unrecognized prior
service cost/(benefit) 13 (79) 7 (41)
Net amount recognized $ 41 $ 53 $ 29 $ 65
We recognized an additional minimum pension liability for theunderfunded defined benefit plans. The additional minimumliability is equal to the excess of the accumulated benefit obligationover plan assets and accrued liabilities. A corresponding amountis recognized as either an intangible asset or a reduction ofshareholders’ equity.
Millions of dollars 2000 1999
U.S. Int’l. U.S. Int’l.
AMOUNTS RECOGNIZED
IN THE CONSOLIDATED
BALANCE SHEETS
Prepaid benefit cost $ 54 $ 93 $ 43 $ 98
Accrued benefit liability (28) (49) (38) (40)
Intangible asset 10 1 11 1
Deferred tax asset 1 Ñ — —
Accumulated other
comprehensive income 4 8 13 6
Net amount recognized $ 41 $ 53 $ 29 $ 65
64 HALLIBURTON COMPANY 2000 ANNUAL REPORT
N O T E S T O A N N U A L F I N A N C I A L S T A T E M E N T S

Assumed long-term rates of return on plan assets, discountrates for estimating benefit obligations and rates of compensationincreases vary for the different plans according to the localeconomic conditions. The rates used are as follows:
Weighted-average assumptions 2000 1999 1998
Expected return on plan assets:
United States plans 9.0% 9.0% 8.5% to 9.0%
International plans 3.5% to 8.0% 7.25% to 8.0% 7.0% to 11.0%
Discount rate:
United States plans 7.5% 7.5% 7.25% to 8.0%
International plans 4.0% to 5.5% 2.5% to 7.5% 2.0% to 12.5%
Rate of compensation increase:
United States plans 4.5% 4.5% to 5.0% 4.5% to 5.0%
International plans 3.5% to 7.6% 1.0% to 10.5% 2.0% to 11.0%
Millions of dollars 2000 1999 1998
U.S. Int’l. U.S. Int’l. U.S. Int’l.
COMPONENTS OF NET
PERIODIC BENEFIT COST
Service cost $ 4 $ 53 $ 7 $ 66 $ 5 $ 57
Interest cost 20 85 30 96 27 111
Expected return on
plan assets (26) (135) (33) (145) (30) (123)
Transition amount Ñ Ñ 1 (2) 1 (2)
Amortization of prior
service cost (1) (6) (2) (7) (4) (7)
Settlements/curtailments
loss/(gain) 10 Ñ 14 — (4) (2)
Recognized actuarial
(gain)/loss Ñ (10) (1) (11) — —
Net periodic benefit cost $ 7 $ (13) $ 16 $ (3) $ (5) $ 34
The projected benefit obligation, accumulated benefitobligation, and fair value of plan assets for the pension plans withaccumulated benefit obligations in excess of plan assets were$172 million, $154 million, and $82 million, respectively, as ofDecember 31, 2000. They were $205 million, $199 million, and$183 million, respectively, as of December 31, 1999.
Postretirement medical plan. We offer postretirementmedical plans to specific eligible employees. For some plans, ourliability is limited to a fixed contribution amount for eachparticipant or dependent. The plan participants share the totalcost for all benefits provided above our fixed contribution andparticipants’ contributions are adjusted as required to coverbenefit payments. We have made no commitment to adjust theamount of our contributions; therefore, the computedaccumulated postretirement benefit obligation amount is notaffected by the expected future health care cost inflation rate.
Other postretirement medical plans are contributory but wegenerally absorb the majority of the costs. We may elect to adjustthe amount of our contributions for these plans. As a result, the
expected future health care cost inflation rate affects theaccumulated postretirement benefit obligation amount. Theseplans have assumed health care trend rates (weighted based onthe current year benefit obligation) for 2000 of 10.0% which areexpected to decline to 5.0% by 2005.
Obligations and expenses for postretirement medical plans in thefollowing tables include both continuing and discontinued operations.
Millions of dollars 2000 1999CHANGE IN BENEFIT OBLIGATION
Benefit obligation at beginning of year $ 392 $403Service cost 3 5Interest cost 20 28Plan participants’ contributions 11 8Amendments Ñ 1Acquisitions/divestitures, net (110) —Settlements/curtailments Ñ (1)Actuarial gain/(loss) 11 (15)Benefits paid (31) (37)Benefit obligation at end of year $ 296 $392CHANGE IN PLAN ASSETS
Fair value of plan assets at beginning of year $ Ñ $ —
Employer contribution 20 29Plan participants’ contributions 11 8Benefits paid (31) (37)Fair value of plan assets at end of year $ Ñ $ —Funded status $ (296) $(392)Employer contribution 3 1Unrecognized actuarial (gain)/loss (20) (72)Unrecognized prior service cost (78) (98)Net amount recognized $ (391) $(561)
Millions of dollars 2000 1999AMOUNTS RECOGNIZED
IN THE CONSOLIDATED
BALANCE SHEETS
Accrued benefit liability $ (391) $(561)Net amount recognized $ (391) $(561)
Weighted-average assumptions 2000 1999 1998Discount rate 7.50% 7.50% 7.0%to 8.0%
Millions of dollars 2000 1999 1998COMPONENTS OF NET
PERIODIC BENEFIT COST
Service cost $ 3 $ 5 $ 4Interest cost 20 28 28Amortization of prior service cost (7) (9) (10)Settlements/curtailments loss/(gain) Ñ (2) —Recognized actuarial (gain)/loss (1) (5) (8)Net periodic benefit cost $ 15 $17 $ 14
65HALLIBURTON COMPANY 2000 ANNUAL REPORT
N O T E S T O A N N U A L F I N A N C I A L S T A T E M E N T S
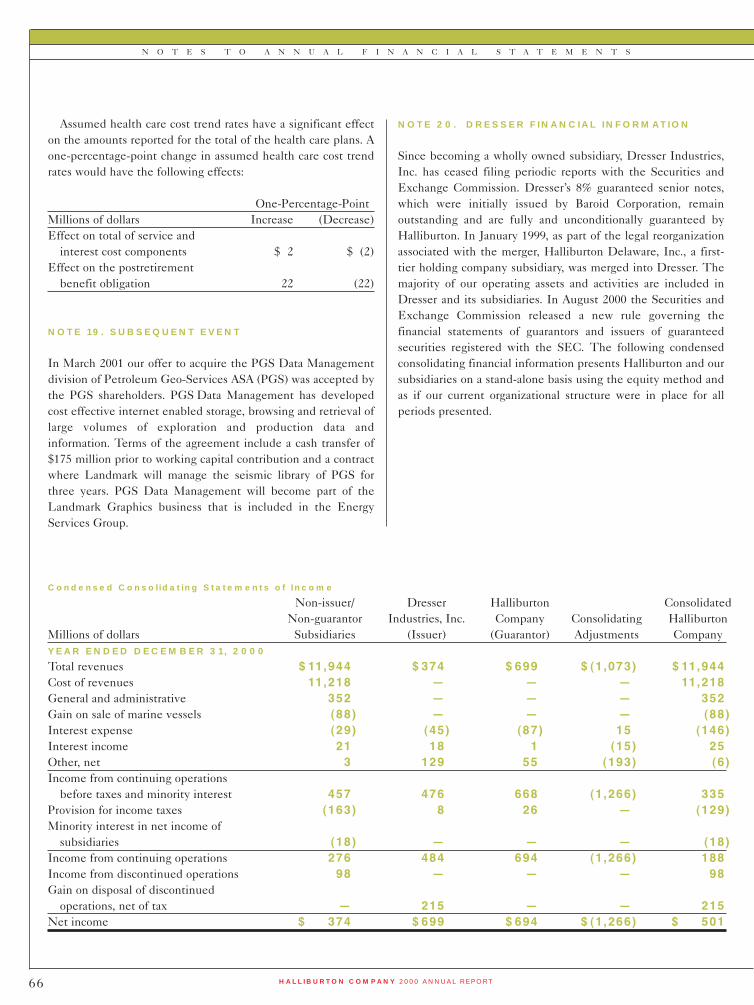
Assumed health care cost trend rates have a significant effecton the amounts reported for the total of the health care plans. Aone-percentage-point change in assumed health care cost trendrates would have the following effects:
One-Percentage-PointMillions of dollars Increase (Decrease)Effect on total of service and
interest cost components $ 2 $ (2)Effect on the postretirement
benefit obligation 22 (22)
NOTE 19. SUBSEQUENT EVENT
In March 2001 our offer to acquire the PGS Data Managementdivision of Petroleum Geo-Services ASA (PGS) was accepted bythe PGS shareholders. PGS Data Management has developedcost effective internet enabled storage, browsing and retrieval oflarge volumes of exploration and production data andinformation. Terms of the agreement include a cash transfer of$175 million prior to working capital contribution and a contractwhere Landmark will manage the seismic library of PGS forthree years. PGS Data Management will become part of theLandmark Graphics business that is included in the EnergyServices Group.
NOTE 20. DRESSER FINANCIAL INFORMATION
Since becoming a wholly owned subsidiary, Dresser Industries,Inc. has ceased filing periodic reports with the Securities andExchange Commission. Dresser’s 8% guaranteed senior notes,which were initially issued by Baroid Corporation, remainoutstanding and are fully and unconditionally guaranteed byHalliburton. In January 1999, as part of the legal reorganizationassociated with the merger, Halliburton Delaware, Inc., a first-tier holding company subsidiary, was merged into Dresser. Themajority of our operating assets and activities are included inDresser and its subsidiaries. In August 2000 the Securities andExchange Commission released a new rule governing thefinancial statements of guarantors and issuers of guaranteedsecurities registered with the SEC. The following condensedconsolidating financial information presents Halliburton and oursubsidiaries on a stand-alone basis using the equity method andas if our current organizational structure were in place for allperiods presented.
66 HALLIBURTON COMPANY 2000 ANNUAL REPORT
N O T E S T O A N N U A L F I N A N C I A L S T A T E M E N T S
Condensed Consolidating Statements of Income
Non-issuer/ Dresser Halliburton ConsolidatedNon-guarantor Industries, Inc. Company Consolidating Halliburton
Millions of dollars Subsidiaries (Issuer) (Guarantor) Adjustments CompanyYEAR ENDED DECEMBER 31, 2000
Total revenues $ 11,944 $ 374 $ 699 $ (1,073) $ 11,944Cost of revenues 11,218 Ñ Ñ Ñ 11,218General and administrative 352 Ñ Ñ Ñ 352Gain on sale of marine vessels (88) Ñ Ñ Ñ (88)Interest expense (29) (45) (87) 15 (146)Interest income 21 18 1 (15) 25Other, net 3 129 55 (193) (6)Income from continuing operations
before taxes and minority interest 457 476 668 (1,266) 335Provision for income taxes (163) 8 26 Ñ (129)Minority interest in net income of
subsidiaries (18) Ñ Ñ Ñ (18)Income from continuing operations 276 484 694 (1,266) 188Income from discontinued operations 98 Ñ Ñ Ñ 98Gain on disposal of discontinued
operations, net of tax Ñ 215 Ñ Ñ 215Net income $ 374 $ 699 $ 694 $ (1,266) $ 501

Condensed Consolidating Statements of Income
Non-issuer/ Dresser Halliburton ConsolidatedNon-guarantor Industries, Inc. Company Consolidating Halliburton
Millions of dollars Subsidiaries (Issuer) (Guarantor) Adjustments CompanyYEAR ENDED DECEMBER 31, 1999
Total revenues $12,313 $571 $654 $(1,225) $12,313Cost of revenues 11,608 — — — 11,608General and administrative 351 — — — 351Special charges and credits (47) — — — (47)Interest expense (33) (50) (87) 29 (141)Interest income 77 26 — (29) 74Other, net (29) 105 183 (286) (27)Income from continuing operations
before taxes, minority interest, andchange in accounting method 416 652 750 (1,511) 307
Provision for income taxes (92) 2 (26) — (116)Minority interest in net income of
subsidiaries (17) — — — (17)Income from continuing operations
before change in accounting method 307 654 724 (1,511) 174Income from discontinued operations 124 — — — 124Gain on disposal of discontinued
operations, net of tax 159 — — — 159Cumulative effect of change in accounting
method, net of tax benefit (19) — — — (19)Net income $ 571 $654 $724 $(1,511) $ 438
Condensed Consolidating Statements of Income
Non-issuer/ Dresser Halliburton ConsolidatedNon-guarantor Industries, Inc. Company Consolidating Halliburton
Millions of dollars Subsidiaries (Issuer) (Guarantor) Adjustments CompanyYEAR ENDED DECEMBER 31, 1998
Total revenues $14,504 $ 158 $ (71) $ (87) $14,504Cost of revenues 13,022 — — — 13,022General and administrative 438 (1) — — 437Special charges and credits 875 — — — 875Interest expense (20) (225) (52) 163 (134)Interest income 52 4 133 (163) 26Other, net (1) (1) (5) — (7)Income from continuing operations
before taxes and minority interest 200 (63) 5 (87) 55Provision for income taxes (127) (8) (20) — (155)Minority interest in net income of
subsidiaries (20) — — — (20)Income from continuing operations 53 (71) (15) (87) (120)Income from discontinued operations 105 — — — 105Net income (loss) $ 158 $ (71) $ (15) $ (87) $ (15)
67HALLIBURTON COMPANY 2000 ANNUAL REPORT
N O T E S T O A N N U A L F I N A N C I A L S T A T E M E N T S

Condensed Consolidating Balance Sheets
Non-issuer/ Dresser Halliburton ConsolidatedNon-guarantor Industries, Inc. Company Consolidating Halliburton
Millions of dollars Subsidiaries (Issuer) (Guarantor) Adjustments CompanyDECEMBER 31, 2000
ASSETS
Current assets:Cash and equivalents $ 216 $ 11 $ 4 $ Ñ $ 231Receivables:Notes and accounts receivable, net 2,966 63 Ñ Ñ 3,029Unbilled work on uncompleted contracts 816 Ñ Ñ Ñ 816Total receivables 3,782 63 Ñ Ñ 3,845Inventories 723 Ñ Ñ Ñ 723Other current assets 753 1 15 Ñ 769Total current assets 5,474 75 19 Ñ 5,568Property, plant and equipment, net 2,410 Ñ Ñ Ñ 2,410Equity in and advances to
unconsolidated affiliates 258 142 Ñ Ñ 400Intercompany receivable from
consolidated affiliates 68 Ñ 2,138 (2,206) ÑEquity in and advances to
consolidated affiliates Ñ 6,558 4,220 (10,778) ÑNet goodwill 510 87 Ñ Ñ 597Other assets 1,109 5 14 Ñ 1,128Total assets $ 9,829 $ 6,867 $ 6,391 $ (12,984) $ 10,103
LIABILITIES AND SHAREHOLDERS’ EQUITY
Current liabilities:Accounts and notes payable $ 756 $ 64 $ 1,540 $ Ñ $ 2,360Other current liabilities 1,374 36 56 Ñ 1,466Total current liabilities 2,130 100 1,596 Ñ 3,826Long-term debt 205 444 400 Ñ 1,049Intercompany payable from
consolidated affiliates Ñ 2,206 Ñ (2,206) ÑOther liabilities 1,118 26 118 Ñ 1,262Minority interest in consolidated
subsidiaries 38 Ñ Ñ Ñ 38Total liabilities 3,491 2,776 2,114 (2,206) 6,175Shareholders’ equity:Common shares 391 Ñ 1,132 (391) 1,132Other shareholders’ equity 5,947 4,091 3,145 (10,387) 2,796Total shareholders’ equity 6,338 4,091 4,277 (10,778) 3,928Total liabilities and shareholders’ equity $ 9,829 $ 6,867 $ 6,391 $ (12,984) $ 10,103
68 HALLIBURTON COMPANY 2000 ANNUAL REPORT
N O T E S T O A N N U A L F I N A N C I A L S T A T E M E N T S

Condensed Consolidating Balance Sheets
Non-issuer/ Dresser Halliburton ConsolidatedNon-guarantor Industries, Inc. Company Consolidating Halliburton
Millions of dollars Subsidiaries (Issuer) (Guarantor) Adjustments CompanyDECEMBER 31, 1999
ASSETS
Current assets:Cash and equivalents $ 315 $ 44 $ 107 $ — $ 466Receivables:Notes and accounts receivable, net 2,282 61 6 — 2,349Unbilled work on uncompleted contracts 625 — — — 625Total receivables 2,907 61 6 — 2,974Inventories 723 — — — 723Other current assets 1,198 — 1 — 1,199Total current assets 5,143 105 114 — 5,362Property, plant and equipment, net 2,390 — — — 2,390Equity in and advances to
unconsolidated affiliates 384 — — — 384Intercompany receivable from
consolidated affiliates — — 2,525 (2,525) —Equity in and advances to
consolidated affiliates — 6,126 3,308 (9,434) —Net goodwill 411 94 — — 505Other assets 993 5 — — 998Total assets $9,321 $6,330 $5,947 $(11,959) $9,639
LIABILITIES AND SHAREHOLDERS’ EQUITY
Current liabilities:Accounts and notes payable $ 758 $ 228 $ 926 $ — $1,912Other current liabilities 671 425 25 — 1,121Total current liabilities 1,429 653 951 — 3,033Long-term debt 213 443 400 — 1,056Intercompany payable from
consolidated affiliates 628 1,897 — (2,525) —Other liabilities 1,136 29 54 — 1,219Minority interest in consolidated
subsidiaries 44 — — — 44Total liabilities 3,450 3,022 1,405 (2,525) 5,352Shareholders’ equity:Common shares 391 — 1,120 (391) 1,120Other shareholders’ equity 5,480 3,308 3,422 (9,043) 3,167Total shareholders’ equity 5,871 3,308 4,542 (9,434) 4,287Total liabilities and shareholders’ equity $9,321 $6,330 $5,947 $(11,959) $9,639
69HALLIBURTON COMPANY 2000 ANNUAL REPORT
N O T E S T O A N N U A L F I N A N C I A L S T A T E M E N T S

Condensed Consolidating Statements of Cash Flows
Non-issuer/ Dresser Halliburton ConsolidatedNon-guarantor Industries, Inc. Company Consolidating Halliburton
Millions of dollars Subsidiaries (Issuer) (Guarantor) Adjustments Company
YEAR ENDED DECEMBER 31, 2000
Net cash flows from operating activities $ (232) $ 114 $ 61 $ Ñ $ (57)Capital expenditures (578) Ñ Ñ Ñ (578)Sales of property, plant and equipment 209 Ñ Ñ Ñ 209Other investing activities (42) Ñ 109 (109) (42)Payments on long-term borrowings (8) (300) Ñ Ñ (308)Net borrowings (repayments) of short-term debt 17 Ñ 612 Ñ 629Payments of dividends to shareholders Ñ Ñ (221) Ñ (221)Proceeds from exercises of stock options Ñ Ñ 105 Ñ 105Payments to reacquire common stock Ñ Ñ (769) Ñ (769)Other financing activities (282) 153 Ñ 109 (20)Effect of exchange rate on cash (9) Ñ Ñ Ñ (9)Net cash flows from discontinued operations 826 Ñ Ñ Ñ 826Increase (decrease) in cash and equivalents $ (99) $ (33) $ (103) $ Ñ $ (235)
YEAR ENDED DECEMBER 31, 1999
Net cash flows from operating activities $ (203) $ 53 $ 92 $ — $ (58)Capital expenditures (520) — — — (520)Sales of property, plant and equipment 118 — — — 118Other investing activities 295 — (231) 231 295Payments on long-term borrowings (9) — (50) — (59)Net borrowings (repayments) of short-term debt (27) — 463 — 436Payments of dividends to shareholders — — (221) — (221)Proceeds from exercises of stock options — — 49 — 49Payments to reacquire common stock — — (10) — (10)Other financing activities 237 (12) — (231) (6)Effect of exchange rate on cash 5 — — — 5Net cash flows from discontinued operations 234 — — — 234Increase (decrease) in cash and equivalents $ 130 $ 41 $ 92 $ — $ 263
YEAR ENDED DECEMBER 31, 1998
Net cash flows from operating activities $ 409 $ (337) $ 78 $ — $ 150Capital expenditures (839) (2) — — (841)Sales of property, plant and equipment 83 — — — 83Other investing activities (23) — (634) 625 (32)Borrowings of long-term debt — — 150 — 150Payments on long-term borrowings (17) (11) — — (28)Net borrowings (repayments) of short-term debt (77) — 463 — 386Payments of dividends to shareholders — (100) (154) — (254)Proceeds from exercises of stock options — — 49 — 49Payments to reacquire common stock — (16) (4) — (20)Other financing activities 143 466 — (625) (16)Effect of exchange rate on cash (5) — — — (5)Net cash flows from discontinued operations 235 — — — 235Increase (decrease) in cash and equivalents $ (91) $ — $ (52) $ — $ (143)
70 HALLIBURTON COMPANY 2000 ANNUAL REPORT
N O T E S T O A N N U A L F I N A N C I A L S T A T E M E N T S

We have restated our prior year information to display Dresser Equipment Group as discontinued operations.
Years ended December 31Millions of dollars and sharesexcept per share and employee data 2000 1999 1998 1997 1996OPERATING RESULTS
Net revenuesEnergy Services Group $ 7,916 $ 6,999 $ 9,009 $ 8,505 $ 6,515Engineering and Construction Group 4,028 5,314 5,495 4,993 4,721
Total revenues $ 11,944 $12,313 $14,504 $13,498 $11,236OPERATING INCOME
Energy Services Group $ 526 $ 222 $ 971 $ 1,019 $ 698Engineering and Construction Group 14 203 237 219 134Special charges and credits (1) Ñ 47 (959) 11 (86)General corporate (78) (71) (79) (71) (72)
Total operating income (1) 462 401 170 1,178 674Nonoperating income (expense), net (2) (127) (94) (115) (82) (70)INCOME FROM CONTINUING
OPERATIONS BEFORE INCOME
TAXES AND MINORITY INTEREST 335 307 55 1,096 604(Provision) benefit for income taxes (3) (129) (116) (155) (406) (158)Minority interest in net income of
consolidated subsidiaries (18) (17) (20) (30) —Income (loss) from continuing operations $ 188 $ 174 $ (120) $ 660 $ 446Income (loss) from discontinued operations $ 313 $ 283 $ 105 $ 112 $ 112Net income (loss) $ 501 $ 438 $ (15) $ 772 $ 558BASIC INCOME (LOSS) PER COMMON SHARE
Continuing operations $ 0.42 $ 0.40 $ (0.27) $ 1.53 $ 1.04Net income (loss) 1.13 1.00 (0.03) 1.79 1.30
DILUTED INCOME (LOSS) PER COMMON SHARE
Continuing operations 0.42 0.39 (0.27) 1.51 1.03Net income (loss) 1.12 0.99 (0.03) 1.77 1.29
Cash dividends per share 0.50 0.50 0.50 0.50 0.50Return on average shareholders’ equity 12.20 )% 10.49)% (0.35)% 19.16)% 15.25)%FINANCIAL POSITION
Net working capital $ 1,742 $ 2,329 $ 2,129 $ 1,985 $ 1,501Total assets 10,103 9,639 10,072 9,657 8,689Property, plant and equipment, net 2,410 2,390 2,442 2,282 2,047Long-term debt (including current maturities) 1,057 1,364 1,426 1,303 957Shareholders’ equity 3,928 4,287 4,061 4,317 3,741Total capitalization 6,555 6,590 5,990 5,647 4,828Shareholders’ equity per share 9.20 9.69 9.23 9.86 8.78Average common shares outstanding (basic) 442 440 439 431 429Average common shares outstanding (diluted) 446 443 439 436 432OTHER FINANCIAL DATA
Capital expenditures $ (578) $ (520) $ (841) $ (804) $ (612)Long-term borrowings (repayments), net (308) (59) 122 285 286Depreciation and amortization expense 503 511 500 465 405Payroll and employee benefits (4) (5 ,260) (5,647) (5,880) (5,479) (4,674)Number of employees (4), (5) 93,000 103,000 107,800 102,000 93,000
continued on next page
71HALLIBURTON COMPANY 2000 ANNUAL REPORT
S E L E C T E D F I N A N C I A L D A T A ( U N A U D I T E D )

We have restated our prior year information to display Dresser Equipment Group as discontinued operations.
Years ended December 31Millions of dollars and sharesexcept per share and employee data 1995 1994 1993 1992 1991OPERATING RESULTS
Net revenuesEnergy Services Group $5,308 $4,978 $5,470 $5,038 $5,156Engineering and Construction Group 3,737 3,562 3,675 4,410 4,721
Total revenues $9,045 $8,540 $9,145 $9,448 $9,877OPERATING INCOME
Energy Services Group $ 544 $ 406 $ 414 $ 303 $ 378Engineering and Construction Group 97 71 76 32 48Special charges and credits (1) (8) (19) (419) (294) (142)General corporate (71) (56) (63) (58) (56)
Total operating income (1) 562 402 8 (17) 228Nonoperating income (expense), net (2) (34) 333 (61) (63) (23)INCOME FROM CONTINUING
OPERATIONS BEFORE INCOME
TAXES AND MINORITY INTEREST 528 735 (53) (80) 205(Provision) benefit for income taxes (3) (167) (275) (18) (30) (117)Minority interest in net income of
consolidated subsidiaries (1) (14) (24) (9) (19)Income (loss) from continuing operations $ 360 $ 446 $ (95) $ (119) $ 69Income (loss) from discontinued operations $ 36 $ 97 $ 81 $ 49 $ 106Net income (loss) $ 381 $ 543 $ (14) $ (483) $ 182BASIC INCOME (LOSS) PER COMMON SHARE
Continuing operations $ 0.83 $ 1.04 $ (0.23) $ (0.29) $ 0.17Net income (loss) 0.88 1.26 (0.04) (1.18) 0.45
DILUTED INCOME (LOSS) PER COMMON SHARE
Continuing operations 0.83 1.03 (0.23) (0.29) 0.17Net income (loss) 0.88 1.26 (0.04) (1.18) 0.45
Cash dividends per share 0.50 0.50 0.50 0.50 0.50Return on average shareholders’ equity 10.44)% 15.47)% (0.43)% (12.72)% 4.16)%FINANCIAL POSITION
Net working capital $1,477 $2,197 $1,563 $1,423 $1,775Total assets 7,723 7,774 8,087 7,480 8,029Property, plant and equipment, net 1,865 1,631 1,747 1,741 1,754Long-term debt (including current maturities) 667 1,119 1,129 872 927Shareholders’ equity 3,577 3,723 3,296 3,277 4,315Total capitalization 4,378 4,905 4,746 4,179 5,266Shareholders’ equity per share 8.29 8.63 7.70 7.99 10.61Average common shares outstanding (basic) 431 431 422 408 405Average common shares outstanding (diluted) 432 432 422 408 406OTHER FINANCIAL DATA
Capital expenditures $ (474) $ (358) $ (373) $ (405) $ (572)Long-term borrowings (repayments), net (481) (120) 192 (187) 460Depreciation and amortization expense 380 387 574 470 396Payroll and employee benefits (4) (4,188) (4,222) (4,429) (4,590) (4,661)Number of employees (4), (5) 89,800 86,500 90,500 96,400 104,500
72 HALLIBURTON COMPANY 2000 ANNUAL REPORT
S E L E C T E D F I N A N C I A L D A T A ( U N A U D I T E D )
( C O N T I N U E D )
(1) Operating income includes the following special charges and credits:1999 – $47 million: reversal of a portion of the 1998 special charges.1998 – $959 million: asset related charges ($491 million), personnel reductions ($234 million), facility consolidations ($124 million),
merger transaction costs ($64 million), and other related costs ($46 million).1997 – $11 million: merger costs ($9 million), write-downs on impaired assets and early retirement incentives ($10 million), losses
from the sale of assets ($12 million), and gain on extension of joint venture ($42 million).1996 – $86 million: merger costs ($13 million), restructuring, merger and severance costs ($62 million), and write-off of acquired
in-process research and development costs ($11 million).1995 – $8 million: restructuring costs ($5 million) and write-off of acquired in-process research and development costs ($3 million).1994 – $19 million: merger costs ($27 million), litigation ($10 million), and litigation and insurance recoveries ($18 million).1993 – $419 million: loss on sale of business ($322 million), merger costs ($31 million), restructuring ($5 million), litigation ($65
million), and gain on curtailment of medical plan ($4 million).1992 – $294 million: merger costs ($273 million) and restructuring and severance ($21 million).1991 – $142 million: restructuring ($121 million) and loss on sale of business ($21 million).
(2) Nonoperating income in 1994 includes a gain of $276 million from the sale of an interest in Western Atlas International, Inc. and a gain of $102 million from the sale of our natural gas compression business.
(3) Provision for income taxes in 1996 includes tax benefits of $44 million due to the recognition of net operating loss carryforwardsand the settlement of various issues with the Internal Revenue Service.
(4) Includes employees of Dresser Equipment Group which is accounted for as discontinued operations.
(5) Does not include employees of 50% or less owned affiliated companies.
73HALLIBURTON COMPANY 2000 ANNUAL REPORT
S E L E C T E D F I N A N C I A L D A T A ( U N A U D I T E D )
( C O N T I N U E D )

QuarterMillions of dollars except per share data First Second Third Fourth Year
2000
Revenues $ 2,859 $ 2,868 $ 3,024 $ 3,193 $ 11,944Operating income (1) 81 126 248 7 462Income (loss) from continuing operations 27 52 130 (21) 188Income from discontinued operations 22 23 27 26 98Gain on disposal of discontinued operations 215 Ñ Ñ Ñ 215Net income 264 75 157 5 501Earnings per share:
Basic income (loss) per common share:Income (loss) from continuing operations 0.06 0.12 0.29 (0.05) 0.42Income from discontinued operations 0.05 0.05 0.06 0.06 0.22Gain on disposal of discontinued operations 0.49 Ñ Ñ Ñ 0.49Net income 0.60 0.17 0.35 0.01 1.13
Diluted income (loss) per common share:Income (loss) from continuing operations 0.06 0.12 0.29 (0.05) 0.42Income from discontinued operations 0.05 0.05 0.06 0.06 0.22Gain on disposal of discontinued operations 0.48 Ñ Ñ Ñ 0.48Net income 0.59 0.17 0.35 0.01 1.12
Cash dividends paid per share 0.125 0.125 0.125 0.125 0.50Common stock prices (2)
High 44.50 51.56 54.69 50.38 54.69Low 33.69 37.75 41.69 33.38 33.38
1999 (3)
Revenues $ 3,261 $ 3,053 $ 2,973 $ 3,026 $ 12,313Operating income (4) 98 143 81 79 401Income from continuing operations before change
in accounting method (4) 53 55 38 28 174Income from discontinued operations 28 28 20 48 124Gain on disposal of discontinued operations — — — 159 159Change in accounting method (19) — — — (19)Net income (4) 62 83 58 235 438Earnings per share:
Basic income per common share:Income from continuing operations before
change in accounting method (4) 0.12 0.13 0.09 0.06 0.40Income from discontinued operations 0.06 0.06 0.04 0.11 0.28Gain on disposal of discontinued operations — — — 0.36 0.36Change in accounting method (0.04) — — — (0.04)Net income 0.14 0.19 0.13 0.53 1.00
Diluted income per common share:Income from continuing operations before
change in accounting method (4) 0.12 0.13 0.09 0.06 0.39Income from discontinued operations 0.06 0.06 0.04 0.11 0.28Gain on disposal of discontinued operations — — — 0.36 0.36Change in accounting method (0.04) — — — (0.04)Net income 0.14 0.19 0.13 0.53 0.99
Cash dividends paid per share 0.125 0.125 0.125 0.125 0.50Common stock prices (2)
High 41.19 47.94 51.44 44.13 51.44Low 28.25 35.00 39.06 33.88 28.25
74 HALLIBURTON COMPANY 2000 ANNUAL REPORT
Q U A R T E R L Y D A T A A N D M A R K E T P R I C E I N F O R M A T I O N ( U N A U D I T E D )

(1) Includes pretax job losses and severance for engineering and construction contracts and related restructuring of $193 million ($118 million after-tax or $0.27 per diluted share) in the fourth quarter of 2000.
(2) New York Stock Exchange – composite transactions high and low closing price.
(3) Amounts for revenues, operating income, net income, and earnings per share have been restated to show Dresser EquipmentGroup as discontinued operations.
(4) Includes pretax special charge credit of $47 million ($32 million after-tax or $0.07 per diluted share) in the second quarter of 1999.
75HALLIBURTON COMPANY 2000 ANNUAL REPORT
Q U A R T E R L Y D A T A A N D M A R K E T P R I C E I N F O R M A T I O N ( U N A U D I T E D )
( C O N T I N U E D )

H A L L I B U R T O NC O M P A N Y
76 HALLIBURTON COMPANY 2000 ANNUAL REPORT
H A L L I B U R T O N C O M P A N Y 2 0 0 0 A N N U A L R E P O R T

H A L L I B U R T O N C O M P A N Y 2 0 0 0 A N N U A L R E P O R T
HALLIBURTON COMPANY 2000 ANNUAL REPORT
(a) Member of the Management Oversight Committee, (b) Member of the Compensation Committee, (c) Member of the Audit Committee,(d) Member of the Health, Safety and Environment Committee, (e) Member of the Nominating and Corporate Governance Committee
77
Lord Clitheroe (1987) (a) (b) (d) (e)Retired Chairman, The Yorkshire Bank, PLC London, England
Lawrence S. Eagleburger(1998) (a) (b) (c) (e)
Senior ForeignPolicy Advisor, Baker, Donelson,Bearman & Caldwell Washington, D.C.
J. Landis Martin(1998) (a) (d) (e)
President and Chief Executive Officer,NL Industries, Inc.Denver, Colorado
Robert L. Crandall(1986) (a) (b) (c) (e)
Chairman Emeritus,AMR Corporation/ American Airlines, Inc.Irving, Texas
Ray L. Hunt(1998) (a) (b) (c)
Chairman of the Board andChief Executive Officer,Hunt Oil CompanyDallas, Texas
Jay A. Precourt(1998) (a) (b) (d)
Chairman of the Board,Hermes Consolidated, Inc. Vail, Colorado
Charles J. DiBona(1997) (a) (b) (d)
Retired President andChief Executive Officer, American PetroleumInstitute Great Falls, Virginia
W. R. Howell(1991) (a) (b) (c)
Chairman Emeritus,J. C. Penny Company, Inc.Dallas, Texas
C. J. Silas(1993) (a) (b) (c)
Retired Chairmanof the Board andChief Executive Officer,Phillips Petroleum Company Bartlesville, Oklahoma
David J. Lesar(2000)Chairman of the Board,President andChief Executive Officer,Halliburton CompanyDallas, Texas
▲
▲
▲
▲
▲
▲
▲
▲
▲
▲

CORPORATE OFFICE: 3600 Lincoln Plaza, 500 North Akard Street, Dallas, Texas 75201-3391 USA www.halliburton.com
H02770