energising commonwealth trade in a digital world paths to
TRANSCRIPT

Energising Commonwealth Trade in a Digital World
Paths to Recovery Post-COVID
Commonwealth Trade Review 2021
5016_Book.indb 1 17-06-2021 08:32:05

Commonwealth SecretariatMarlborough HousePall MallLondon SW1Y 5HXUnited Kingdom© Commonwealth Secretariat 2021
All rights reserved. No part of this publication may be reproduced, stored in a retrieval system, or transmitted in any form or by any means, electronic or mechanical, including photocopying, recording or otherwise without the permission of the publisher.
Published by the Commonwealth Secretariat.Typeset by Nova Techset Private LtdCover design by Rory Seaford Design LtdPrinted by APS Group
Views and opinions expressed in this publication are the responsibility of the author(s) and should in no way be attributed to the institutions to which they are affiliated or to the Commonwealth Secretariat.
Wherever possible, the Commonwealth Secretariat uses paper sourced from sustainable forests or from sources that minimise a destructive impact on the environment.
Copies of this publication may be obtained from:
Publications SectionCommonwealth SecretariatMarlborough HousePall MallLondon SW1Y 5HXUnited KingdomTel: +44 (0)20 7747 6534Email: [email protected]: https://books.thecommonwealth.org/
A catalogue record for this publication is available from the British Library.
ISBN (paperback): 978-1-84929-199-6ISBN (e-book): 978-1-84859-991-8
5016_Book.indb 2 17-06-2021 08:32:05

Introduction
The Commonwealth is an association of 54 independent countries, comprising large and small, developed and developing, landlocked and island economies. As the main intergovernmental body of the association, the Commonwealth Secretariat works with member governments to deliver on priorities agreed by Commonwealth Heads of Government and promotes international consensus building. It provides technical assistance and advisory services to members, helping governments achieve sustainable, inclusive and equitable development. The Secretariat’s work programme encompasses areas such as democracy, rule of law, human rights, governance and social and economic development.
5016_Book.indb 3 17-06-2021 08:32:05

Foreword
5016_Book.indb 4 17-06-2021 08:32:05

Foreword \ v
The world has changed dramatically
since the 2018 Commonwealth
Trade Review. Since its onset in early
2020, the COVID-19 pandemic has
had a devastating impact on the
lives and livelihoods of our 2.4 billion
Commonwealth citizens and others
around the world. There has been tragic
loss of life, with the number of deaths
globally now having exceeded 3 million,
and there are wide-ranging economic,
social and environmental consequences,
which present immense challenges
and will take some time to overcome.
The pandemic has resulted in the
worst economic contraction since
the Great Depression, creating an
unprecedented crisis for world trade
and investment. Lockdown measures,
travel restrictions and social distancing
across the Commonwealth and globally
brought an abrupt halt to many of our
usual economic and social activities.
We have been compelled to rely
even more on digital technologies,
innovations and solutions in a range of
areas, from health care and education
to work, commerce and trade.
Building on the 2015 and 2018
Commonwealth Trade Reviews,
Energising Commonwealth Trade in
a Digital World: Paths to Recovery
Post-COVID provides a timely and
comprehensive analysis of the
impact of the COVID-19 pandemic on
Commonwealth trade and investment
flows. Collectively, Commonwealth
countries are estimated to have lost
as much as US$345 billion worth of
trade in 2020, including $60 billion in
intra-Commonwealth trade. Indeed,
intra-Commonwealth trade flows
have dropped to levels last witnessed
in 2011. In these troubling times for
our member countries, and with less
than a decade remaining until the
target date for achieving the 2030
Agenda for Sustainable Development,
the economic and social fallout
threatens to exacerbate existing
challenges to inclusive growth and
sustainable development in the
Commonwealth, especially given
the disproportionate impacts on
women, informal workers and youth.
A key message of this publication is that
trade can offer positive solutions to
manage the COVID-19 pandemic and
will be an essential tool for economic
recovery and building back better. In
particular, Commonwealth members can
harness the ‘Commonwealth advantage’,
and draw on the mutual support
and benefits offered through the
Commonwealth Connectivity Agenda,
Commonwealth Blue Charter and other
initiatives, to help boost their trade
recovery in a more inclusive, resilient
and sustainable manner. A reassuring
finding is that the Commonwealth trade
cost advantage has remained strong
and resilient, and is now estimated at
21 per cent, on average. Meanwhile,
the investment advantage has almost
tripled since the 2015 Commonwealth
Trade Review was published, to around
27 per cent. Another finding about the
growth of investment in renewable
energy is hugely encouraging as our
members aspire to greener, more
regenerative development paths
beyond the pandemic and achieving
a net zero global economy by 2050.
Revitalising trade and strengthening
connectivity among Commonwealth
countries and their global partners are
indispensable for recovery efforts and
future prosperity. The theme for the
forthcoming Commonwealth Heads
of Government Meeting is ‘Delivering a
Common Future’. This Review highlights
the wealth of innovation, ingenuity, best
practice and human capital across the
Commonwealth that can be leveraged,
shared and exchanged to help achieve
a more prosperous future which
leaves no citizen behind or offline.
In particular, the changes brought
about by COVID-19 have underlined the
centrality of technology in all aspects of
our lives – from the rapid development
of coronavirus vaccines and 3D printing
of medical equipment and devices, to
e-commerce and the online delivery of
certain services. The greater reliance
on digital technologies necessitated
by the pandemic will almost certainly
remain as an enduring factor that
will accelerate growth in the digital
economy, including digital trade, in the
longer term. This must be matched
by proactive efforts to close digital
divides within and among countries,
especially as this disproportionately
affects women and girls.
As the tide begins to turn in the
fight against COVID-19, we have
opportunities to build more diverse
and resilient trade and investment
relationships among the countries,
cities, communities and citizens of our
Commonwealth family. These can form
the richly fertile and solid foundation for
more inclusive and sustainable future
growth and development post-COVID.
The Rt Hon Patricia Scotland QC
Secretary-General of the
Commonwealth
5016_Book.indb 5 17-06-2021 08:32:05

Acknowledgements
5016_Book.indb 6 17-06-2021 08:32:05

Acknowledgements \ vii
The Commonwealth Trade Review
2021 was prepared by Brendan Vickers
(Head of Section), Salamat Ali, Neil
Balchin, Collin Zhuawu, Kim Kampel,
Hilary Enos-Edu and Kimonique Powell
of the Commonwealth Secretariat’s
International Trade Policy Section.
The team are grateful for the support
of Paulo Kautoke, Senior Director of
Trade, Oceans and Natural Resources
at the Commonwealth Secretariat.
This publication benefited from three
background papers funded by the
Government of the United Kingdom
and undertaken by Sangeeta Khorana
and Hubert Escaith; Ben Shepherd and
Anirudh Shinghal; and Karishma Banga
and Sherillyn Raga for the Overseas
Development Institute (ODI).
In addition, substantive background
papers were prepared by Badri
Narayanan Gopalakrishnan and his team;
Geoffrey A. Pigman, who also reviewed
chapters and provided substantive
inputs; and Sangeeta Khorana and
Inmaculada Martínez-Zarzso.
Peer reviewers Deborah Elms,
Mohammad A. Razzaque and
Christopher Stevens provided
insightful and constructive
comments on the draft.
The team thanks the following
colleagues at the Commonwealth
Secretariat for their helpful
contributions: Benjamin Kwasi
Addom, Kirk Haywood, Radika
Kumar, Vashti Maharaj, Tanvi
Sinha and Niels Strazdins.
Nick Ashton-Hart provided valuable
comments and suggestions.
The Commonwealth Secretariat
is extremely grateful to UNCTAD
for sharing data on investment
flows and e-commerce in the
Commonwealth, especially Astrit
Sulstarova and Torbjörn Fredriksson.
The production of this publication
was managed by Sherry Dixon
and Vicky Bates. The copyediting
was undertaken by Roo Griffiths.
Shaneez Hassan provided excellent
administrative support to the project.
The cover, infographics and charts were
designed by Rory Seaford Design Ltd.
5016_Book.indb 7 17-06-2021 08:32:05

Contents
5016_Book.indb 8 17-06-2021 08:32:05

Introduction iii
List of Figures xi
List of Tables xiv
List of Boxes xv
Abbreviations and Acronyms xvi
Overview xx
Executive Summary xxii
Chapter 1: Commonwealth Trade and the Pandemic 2
1.1 Introduction 5
1.2 The Commonwealth’s global trade before the pandemic 6
1.3 Intra-Commonwealth trade before the pandemic 12
1.4 COVID-19 implications for Commonwealth trade 26
1.5 Trade performance of LDCs, IPOA and COVID-19 37
1.6 Common wealth trade prospects towards 2022 39
1.7 Conclusion and way forward 39
Annex 1.1 Commonwealth export profile, 2019 42
Annex 1.2 COVID-19 impact on the GDP of Commonwealth economies, 2019–2022 (constant 2010 US$ million) 45
Annex 1.3 Immediate effect of COVID-19 on economic growth of Commonwealth countries, 2019 vs. 2020 47
Annex 1.4 Orientation of merchandise trade flows towards Commonwealth countries, 2005 vs. 2019 48
Annex 1.5 Commonwealth LDCs global and intra− Commonwealth export profile, 2019 49
Endnotes 50
Chapter 2: Digitalisation and Trade in the Commonwealth 52
2.1 Introduction 55
2.2 Digital trade in the Commonwealth pre-COVID-19 56
2.3 Investment in digital sectors in the Commonwealth 69
2.4 COVID-19 and digital trade 71
2.5 Broadening access to the internet and ICT usage 74
2.6 Conclusion and way forward 78
Endnotes 79
Chapter 3: The Impact of COVID-19 on Commonwealth FDI 80
3.1 Introduction 83
3.2 Common wealth investment trends pre-COVID-19 84
5016_Book.indb 9 17-06-2021 08:32:05

x \ Commonwealth Trade Review 2021
3.3 The Impact of COVID-19 on Commonwealth FDI 95
3.4 Common wealth FDI prospects to 2025 103
3.5 Conclusion and way forward 106
Annex 3.1 Concordance for fDi Markets industries to broad sectors 108
Endnotes 109
Chapter 4: Multilateral and Regional Trade Responses to the Pandemic 110
4.1 Introduction 113
4.2 The Commonwealth and trade multilateralism 114
4.3 COVID-19 and trade multilateralism 116
4.4 The Common wealth and regional co-operation in times of crisis 121
4.5 Conclusion and way forward 127
Annex 4.1 Major trade agreements involving Commonwealth countries, 2018-present 129
Endnotes 131
Chapter 5: Pathways to Post-COVID Trade Recovery and Resilience Building 134
5.1 Introduction 137
5.2 Strengthen and reform the multilateral trading system 138
5.3 Enhance support measures for LDCs and graduates 140
5.4 Utilise new trading opportunities post-Brexit 142
5.5 Revive the tourism and travel sector, especially for small states 148
5.6 Leverage digital technologies for trade, development and competitiveness 149
5.7 Develop effective frameworks for governing digital trade 153
5.8 Develop a newly invigorated Aid for Digital Trade initiative 156
5.9 Digitise trade facilitation and strive for paperless trade 157
5.10 Promote sustainable trade and enable a more circular economy 158
5.11 Conclusion and way forward 160
Endnotes 164
Conclusion 166
References 170
5016_Book.indb 10 17-06-2021 08:32:05

List of Figures \ xi
List of Figures
Figure 1.1 Commonwealth countries’ global exports of goods and services, 2005–2019 6Figure 1.2 Evolution of Commonwealth members’ exports, by development level and
sector, 2005–2019 8Figure 1.3 Trade performance and composition of Commonwealth small states’ exports,
2005–2019 9Figure 1.4 Share of Commonwealth services exports in GDP by region, 2019 10Figure 1.5 Leading services exporters and key services sectors, 2019 11Figure 1.6 Share of average trade costs between Commonwealth trade partners vs.
others, 1995–2018 13Figure 1.7 Trends in intra-Commonwealth exports of goods and services, 2005–2019 15Figure 1.8 Relative significance of intra-Commonwealth merchandise trade in
member countries’ total trade, 2017–2019 average 16Figure 1.9 Relative significance of intra-Commonwealth services exports in member
countries’ total services exports, 2017–2019 average 17Figure 1.10 Regional distribution of intra-Commonwealth trade, 2010 vs. 2019 19Figure 1.11 Share of goods and services exports for leading exporters, by region, 2019 20Figure 1.12 Shares of large intra-Commonwealth merchandise traders, 2019 21Figure 1.13 Intra-Commonwealth merchandise exports by sector and region, 2019 22Figure 1.14 Country shares of intra-Commonwealth services exports and imports, 2019 23Figure 1.15 Regional and sectoral distribution of intra-Commonwealth services
exports, 2019 24Figure 1.16 Growth rate of intra-Commonwealth services exports, 2005–2019 average 25Figure 1.17 Servicification of intra-Commonwealth trade over time 26Figure 1.18 Commonwealth market share and GDP drop for large export markets (%) 27Figure 1.19 Impact of the COVID-19 pandemic on Commonwealth countries’
global exports in 2020 28Figure 1.20 COVID-19 shock and intra-Commonwealth trade flows in goods and
services, 2019 vs. 2020 29Figure 1.21 Impact of the pandemic on Commonwealth merchandise exports,
December 2019 to December 2020 30Figure 1.22 Monthly variation in commodity price indices in 2020 33Figure 1.23 COVID-19 impact on services exports of selected Commonwealth
countries, 2020 vs. 2019 34Figure 1.24 Potential COVID-19 pandemic effects on services trade 36Figure 1.25 Trade performance of LDCs during Istanbul Programme of Action 38Figure 1.26 Commonwealth’s trade prospects in the short to medium term, 2019–2022 40Figure 2.1 Commonwealth trade (exports and imports) in ICT goods, 2010–2019 57Figure 2.2 Distribution of Commonwealth ICT goods trade (exports and imports),
2010–2019 58Figure 2.3 Distribution of intra-Commonwealth trade in ICT goods, 2019 59Figure 2.4 Main intra-Commonwealth exporters and importers of digitisable products,
2017–2019 (cumulative) 60
5016_Book.indb 11 17-06-2021 08:32:05

xii \ Commonwealth Trade Review 2021
Figure 2.5 Commonwealth global trade (exports and imports) in ICT services, 2010–2019 61
Figure 2.6 Commonwealth trade (exports and imports) in digitally deliverable services, 2011–2019 64
Figure 2.7 Regional shares of total Commonwealth trade (exports and imports) in digitally deliverable services, 2011 and 2019 65
Figure 2.8 Top 10 Commonwealth countries by value of trade (exports and imports) in digitally deliverable services, average 2017–2019 66
Figure 2.9 Top 10 Commonwealth countries by value of trade (exports and imports) in digitally deliverable services per 1,000 people, average 2017–2019 66
Figure 2.10 Commonwealth countries’ performance on the 2020 B2C E-Commerce Index 67
Figure 2.11 Online shoppers as a share of internet users and total population in Commonwealth countries, latest available year between 2017 and 2019 68
Figure 2.12 Changes in announced greenfield FDI inflows to communications and software and IT services sectors in the Commonwealth, 2019 vs. 2020 71
Figure 2.13 Trends in India’s exports in ICT services and key export markets 73Figure 2.14 Share of the populations of Commonwealth countries using the
internet, 2019 75Figure 2.15 Affordability and regulation factors affecting access to the internet in
the Commonwealth 77Figure 3.1 FDI inward stock in the Commonwealth, 2010–2019 85Figure 3.2 Distribution of FDI inward stock in the Commonwealth, 2019 86Figure 3.3 Total value of FDI inflows into the Commonwealth, 2010–2019 87Figure 3.4 Top 10 hosts of bilateral FDI inflows into the Commonwealth, 2017–2019
(cumulative) 87Figure 3.5 Intra-Commonwealth FDI instock (US$ billion), 2010–2019 88Figure 3.6 Total value of intra-Commonwealth FDI flows, 2010–2019 89Figure 3.7 Top 10 investors and hosts of intra-Commonwealth FDI inflows by value,
2017–2019 (cumulative) 90Figure 3.8 Aggregate value and share of announced greenfield FDI inflows to the
Commonwealth, 2010–2019 91Figure 3.9 Sectoral composition of announced intra-Commonwealth greenfield FDI
inflows, 2017–2019 (cumulative) 93Figure 3.10 Top 10 sources and destinations for intra-Commonwealth greenfield FDI
in the renewable energy sector, by value of cumulative capital investment 2010–2019 94
Figure 3.11 Number and aggregate value of announced intra-Commonwealth greenfield FDI projects by Commonwealth region and quarter, average 2017–2019 vs. 2020 98
Figure 3.12 Changes in sectoral composition of announced greenfield investment in the Commonwealth, 2017–2019 average vs. 2020 101
Figure 3.13 Changes in sectoral composition of intra-Commonwealth greenfield FDI, by Commonwealth region, 2017–2019 average vs. 2020 102
Figure 3.14 Announced Chinese greenfield FDI in the Commonwealth, 2017–2019 average vs. 2020 (US$ million) 106
5016_Book.indb 12 17-06-2021 08:32:05
List of Figures \ xiii
Figure 4.1 Average Commonwealth export growth to the USA for tariffed and non-tariffed products 116
Figure 4.2 TFA implementation by Commonwealth developing countries as of 19 March 2021 120
Figure 4.3 Share of Commonwealth African members in intra-Africa trade, 2010-2019 122
Figure 5.1 The Commonwealth’s rising trade with China, 2000–2019 141Figure 5.2 Share of Commonwealth merchandise and services exports to the UK,
2017–2019 average 143Figure 5.3 Potential short- and medium-term impacts on Commonwealth countries’
exports, 2021–2025 147Figure 5.4 Contribution of tourism to GDP and employment in Commonwealth small
states, 2019 148Figure 5.5 Commonwealth countries’ performance on the Readiness for Frontier
Technologies Index, by country and region 153
5016_Book.indb 13 17-06-2021 08:32:05

xiv \ Commonwealth Trade Review 2021
List of Tables
Table 1.1 Commonwealth countries’ pre-pandemic export profile, 2019 6Table 1.2 The Commonwealth effect on trade costs 13Table 1.3 Share of goods and services in intra-Commonwealth exports, 2019 14Table 1.4 Regional variation in COVID-19 impact on intra-Commonwealth trade
(US$ million), 2019 vs. 2020 28Table 1.5 Modelling results: COVID-19 effect on Commonwealth countries’
merchandise exports (% decrease) 31Table 2.1 Commonwealth global and intra-Commonwealth trade (exports
and imports) in ICT goods, by level of economic development and region, 2010 and 2019 58
Table 2.2 Commonwealth global trade (exports and imports) in ICT services, by level of economic development and region, 2010 and 2019 62
Table 2.3 Intra-Commonwealth ICT services exports, average 2017-2019 63Table 2.4 B2C e-commerce sales for selected Commonwealth countries, 2017
and 2018 69Table 2.5 Announced greenfield investment in communications and software and IT
services 70Table 2.6 Broadband costs and tariffs on network equipment in the Commonwealth 76Table 3.1 The Commonwealth effect in FDI flows – gravity model results 88Table 3.2 Jobs created through announced greenfield FDI in the Commonwealth,
2010–2019 91Table 3.3 Top 10 sources and hosts of announced intra-Commonwealth greenfield
FDI inflows to Commonwealth members, by cumulative value, 2017-2019 92Table 3.4 COVID-19 shock and FDI inflows to Commonwealth countries, average
for 2017–2019 vs. 2020 96Table 3.5 Job creation and employment intensity of intra-Commonwealth greenfield
FDI, by country group, 2017–2019 average vs. 2020 99Table 3.6 Sectoral implications of COVID-19 for intra-Commonwealth greenfield FDI,
2017–2019 average vs. 2020 103Table 3.7 COVID-19 impacts and future investment prospects for selected sectors 104Table 5.1 The significance of the UK sugar market to Commonwealth ACP countries,
2017–2019 average 144Table 5.2 Nature of the UK’s import regime for Commonwealth countries,
March 2021 145Table 5.3 DEPA key policy areas 155Table 5.4 Policy areas for revitalising Commonwealth trade 160
5016_Book.indb 14 17-06-2021 08:32:05

List of Boxes \ xv
List of Boxes
Box 1.1 Trade costs advantage in intra-Commonwealth trade 12Box 1.2 Rising servicification trends in Commonwealth developing and
developed countries 26Box 1.3 COVID-19 and economic contractions in the Commonwealth’s largest
export markets 27Box 1.4 Linkages between COVID-19 infections and merchandise exports in the
Commonwealth 31Box 1.5 COVID-19 hits garments manufacturing in the Commonwealth 32Box 1.6 Commodities exports and COVID-19 33Box 1.7 Drop in services exports during the COVID-19 pandemic 34Box 1.8 Entrepreneurship, trade and women’s economic empowerment 35Box 1.9 Switching modes? COVID-19 and the education services exports of
Australia and Canada 37Box 2.1 What is cross-border digital trade? 56Box 2.2 Africa and the digital delivery of creative content 61Box 2.3 COVID-19 leads to growth in exports and e-commerce sales 72Box 2.4 India’s ICT services exports and the pandemic 73Box 2.5 Providing internet access in the Commonwealth: what can we learn from
the top performers? 77Box 3.1 Trade and investment linkages, and broader FDI benefits 84Box 3.2 The intra-Commonwealth advantage in investment 88Box 3.3 Investors set their sights on renewables in the Commonwealth 93Box 3.4 COVID-19 has exacerbated gender imbalances in investment 95Box 3.5 China’s growing influence on infrastructure investment in the
Commonwealth 105Box 4.1 Implications of the USA-China trade conflict for Commonwealth
countries 115Box 4.2 The WTO goes virtual: opportunities and challenges for developing
countries 117Box 4.3 Trade responses to the pandemic 117Box 4.4 Examples of Commonwealth trade facilitation measures in response to
COVID-19 118Box 4.5 Doha Declaration on TRIPS and Public Health 121Box 4.6 The AfCFTA: a game changer for Africa’s continental and global trade 122Box 4.7 RCEP and trade and investment implications for the Commonwealth 123Box 4.8 Towards “Factory Southern Africa” 127Box 5.1 Commonwealth trade linkages with China beyond the pandemic 141Box 5.2 The UK sugar market: a sweet or sticky deal for the ACP? 143Box 5.3 Potential implications of future UK FTAs for Commonwealth countries 147Box 5.4 Maldives leads the way in driving tourism recovery and a return to the
“old normal” 149Box 5.5 Rwanda bets big on digitally led development 150Box 5.6 The Digital Economy Partnership Agreement – a model for the future? 155Box 5.7 Commonwealth Connectivity Agenda Initiatives 2021 159
5016_FM.indd 15 17-06-2021 12:33:39

xvi \ Commonwealth Trade Review 2021
Abbreviations and Acronyms
A4AI Alliance for Affordable Internet
AB Appellate Body
ACP African, Caribbean and Pacific
AfCFTA African Continental Free Trade Area
Afreximbank African Export-Import Bank
AfT Aid for Trade
AI Artificial Intelligence
AIIB Asian Infrastructure Investment Bank
AMSP African Medical Supplies Platform
ATQ autonomous tariff rate quota
AU African Union
AUC African Union Commission
B2C business-to-consumer
BaTIS Balanced Trade in Statistics
BRI Belt and Road Initiative
CARICOM Caribbean Community
CARIFORUM Caribbean Forum
CARPHA Caribbean Public Health Agency
CCA Commonwealth Connectivity Agenda
CECPA Comprehensive Economic Co-operation and Partnership Agreement
CHOGM Commonwealth Heads of Government Meeting
COP Conference of the Parties
CPTPP Comprehensive and Progressive Agreement for Trans-Pacific Partnership
CUSMA Canada–USA–Mexico Agreement
DAC Development Assistance Committee
DDS digitally deliverable services
DEPA Digital Economic Partnership Agreement
DFQF duty-free and quota-free
DIT Department for International Trade
5016_Book.indb 16 17-06-2021 08:32:05

Abbreviations and Acronyms \ xvii
DSR Digital Silk Road
DSU Dispute Settlement Understanding
EBA Everything But Arms
EIU Economist Intelligence Unit
EPA economic partnership agreement
ESA Eastern and Southern Africa
ET electronically transmitted
EU European Union
FDI foreign direct investment
FIC Forum Island Country
FOCAC Forum on China-Africa Co-operation
FTA free trade agreement
GATS General Agreement on Trade in Services
GDP gross domestic product
GIZ German Development Corporation
GNI gross national income
GSP Generalised Scheme of Preferences
GTAP Global Trade Analysis Project
GVC global value chain
ICC International Chamber of Commerce
ICT information and communication technology
IFC International Finance Corporation
ILO International Labour Organization
IMF International Monetary Fund
IoT Internet of Things
IPOA Istanbul Programme of Action
IPRs intellectual property rights
IT information technology
ITC International Trade Centre
ITU International Telecommunication Union
IUU illegal, unreported and unregulated
5016_Book.indb 17 17-06-2021 08:32:05

xviii \ Commonwealth Trade Review 2021
LDC least developed country
M&A mergers and acquisitions
MC Ministerial Conference
MNE multinational enterprise
MSMEs micro, small and medium enterprises
NDB New Development Bank
OACPS Organisation of African, Caribbean and Pacific States
OECD Organisation for Economic Co-operation and Development
OECS Organisation of Eastern Caribbean States
OEM original equipment manufacturing
OLS Ordinary Least Squares
PAAS platform-as-a-service
PACER Pacific Agreement on Closer Economic Relations
PHP-C Pacific Humanitarian Pathway for COVID-19
PPML Poisson Pseudo Maximum Likelihood
PSH public stockholding
R&D research and development
RCEP Regional Comprehensive Economic Partnership
RESW Rwanda Electronic Single Window
RoO rules of origin
RoW rest of world
RTA regional trade agreement
SAARC South Asian Association for Regional Co-operation
SAAS software-as-a-service
SACU Southern African Customs Union
SACUM Southern African Customs Union and Mozambique
SDG Sustainable Development Goal
SIDS small island developing state
SMEs small and medium enterprises
SPS sanitary and phyto-sanitary
SSA sub-Saharan Africa
5016_Book.indb 18 17-06-2021 08:32:06

Abbreviations and Acronyms \ xix
TBT technical barrier to trade
TCA Trade and Co-operation Agreement
TFA Trade Facilitation Agreement
TIDCA trade, investment and development co-operation agreement
TiSMoS Trade in Services by Mode of Supply
TRIPS Trade-Related Aspects of Intellectual Property Rights
UK United Kingdom
UKSFTA UK-Singapore Free Trade Agreement
UNCITRAL United Nations Commission on International Trade Law
UNCTAD United Nations Conference on Trade and Development
UNESCAP United Nations Economic and Social Commission for Asia and the Pacific
UNFCCC United Nations Framework Convention on Climate Change
UNWTO United Nations World Tourism Organization
USA United States of America
WDI World Development Indicators
WEF World Economic Forum
WHO World Health Organization
WIPO World Intellectual Property Organization
WITS World Integrated Trade Solution
WTO World Trade Organization
WTTC World Travel & Tourism Council
5016_Book.indb 19 17-06-2021 08:32:06

xx \ Commonwealth Trade Review 2021
OverviewThe COVID-19 pandemic has caused an unprecedented
global economic crisis. It has induced a deep recession in
several Commonwealth countries and in their major export
markets, which has significantly affected Commonwealth
countries’ global and intra-Commonwealth trade. Foreign
direct investment inflows to Commonwealth countries have
also taken a considerable hit. The pandemic’s disproportionate
impact on already vulnerable economies, societies and
health care systems, with particularly severe effects on
women, youth, the poor and the informally employed, could
exacerbate existing challenges to inclusive growth in the
Commonwealth and the pursuit of the 2030 Agenda for
Sustainable Development. Indeed, the devastating economic
consequences of COVID-19, together with other global
exigencies in recent years, mean that 2011–20201 will be a lost
decade in terms of gains from trade for the global community,
especially for small states, least developed countries (LDCs)
and countries in sub-Saharan Africa. This is disheartening
because trade has helped lift millions of people from poverty
to prosperity around the world and will be instrumental for
combating the pandemic, reviving growth and achieving many
of the Sustainable Development Goals (SDGs) and targets.
The 2021 Commonwealth Trade Review examines the impact
of COVID-19 on the performance and prospects for trade and
investment in the Commonwealth. It also identifies possible
pathways to help guide Commonwealth policy-makers and
businesses towards a more inclusive, sustainable and resilient
recovery, especially by harnessing digital trade and digital
technologies. Overall, it is evident that the pandemic has had
a substantial impact on all member countries’ economies,
leading to US$1.15 trillion in foregone gross domestic product
(GDP) in just one year.2 Had there been no disruption to
global trade, the Commonwealth’s global exports of goods
and services in 2020 could have been as much as $345 billion
higher. This includes an estimated export loss of $60 billion
for intra-Commonwealth trade as a result of the pandemic.
Most Commonwealth members have been extremely
exposed to the effects of the pandemic as a consequence
of the structure of their economies, the composition of
their exports, particularly when concentrated in services like
transport, travel and tourism, and their level of integration
in regional and global value chains (GVCs), as well as other
inherent features and vulnerabilities. With the rollout of
vaccines, some Commonwealth members have started
opening their economies and resuming trade and travel;
others confront new waves of infection or lack access to
lifesaving vaccines. A sustainable and inclusive recovery
globally requires enhanced co-operation to contain the
pandemic, mitigate its impact on trade, livelihoods and health,
and ensure open trade, undisrupted supply chains, especially
for medical equipment, and equitable access to essential
vaccines for all. Failure to achieve these goals, especially by
vaccinating only people in wealthy countries, could lead to
a delayed and asynchronous recovery and cost the global
economy around US$9 trillion in lost output (ICC, 2020).
Trade recovery will unfold in tandem with several pre-pandemic
trends — the reconfiguration of supply chains, Industry 4.0 and
digitalisation — which have accelerated and are transforming
global production, trade and GVCs. Many governments and
firms across the world are considering ways to near-shore or
regionalise their supply chains to reduce risks, build resilience
to future shocks and reduce the carbon footprint of production
to achieve a global economy with net zero emissions by
2050. The pandemic has hastened the adoption of digital
technologies and digital trade, especially e-commerce and
the online delivery of certain services, as a means to mitigate
some of the economic and social consequences of COVID-19.
Digitalisation, more broadly, is accelerating and can support
recovery globally, although many Commonwealth developing
countries and LDCs still lag with their digital engagement.
This evolving global trading landscape and the transition
towards the so-called Fourth Industrial Revolution presents
promising opportunities but also many challenges for
governments, businesses, workers and consumers across
the Commonwealth as they adapt to this new environment.
The pandemic has furthermore amplified the nexus between
trade and environment, together with an urgency to build
more resilient, sustainable and circular economies.
5016_Book.indb 20 17-06-2021 08:32:06

Overview \ xxi
Trade can offer positive solutions to manage the COVID-19
pandemic and will be an essential tool for economic recovery
and building back better. Commonwealth countries’ global
exports are expected to rebound and reach US$3.76
trillion in 2021 and $3.94 trillion by 2022. Similarly, intra-
Commonwealth exports are expected to surpass $700
billion by 2022. To support their recovery, Commonwealth
countries, especially small states that depend relatively
more on intra-Commonwealth markets, can harness the
“Commonwealth advantage” in trade and investment.
The Commonwealth is not a formal trading bloc, yet the 54
Commonwealth members enjoy a formidable trade advantage
without any formal collaboration. Historical ties, familiar
administrative and legal systems, the use of largely one
language, English, as the means of communicating with foreign
partners, and large and dynamic diasporas have contributed
to strong trade relationships among its members. Since it was
first examined in the 2015 Commonwealth Trade Review, this
advantage has remained strong and compelling, and means
bilateral trade costs between Commonwealth countries are 21
per cent lower, on average. The 2018 Commonwealth Trade
Review furthermore found that Commonwealth members enjoy
an advantage when it comes to efficient contract enforcement
and strengthened regional integration, and improvements in
trade facilitation are likely to yield disproportionately high gains
for member countries. New opportunities have now arisen to
deepen and broaden Commonwealth trade and investment
flows beyond the pandemic, including implementation of
the African Continental Free Trade Area, finalisation of the
Regional Comprehensive Economic Partnership covering
Asia-Pacific and the UK’s departure from the EU.
This publication examines the impact of the COVID-19
pandemic on trade and investment flows and the possible
pathways for trade recovery. It comprises five chapters.
Chapter 1 examines the impact of the pandemic on the
Commonwealth’s global and intra-Commonwealth trade
flows. Chapter 2 maps the Commonwealth’s broad digital
trade before the pandemic and analyses the implications of
COVID-19. Chapter 3 assesses the impact of COVID-19 on
inward investment flows, both global and intra-Commonwealth.
Chapter 4 examines some of the trade aspects of the
global response to the pandemic, focusing specifically on
multilateral developments at the World Trade Organization
and regional initiatives involving Commonwealth countries.
This provides the overarching global and regional contexts
and frameworks to situate the proposed policy actions
for trade recovery in the next chapter. Chapter 5 thus
sets out some of these possible pathways for recovery
from the pandemic, specifically identifying and examining
10 inter-related policy areas for revitalising trade.
5016_Book.indb 21 17-06-2021 08:32:06

xxii \ Commonwealth Trade Review 2021
Executive SummaryCOVID-19 has caused an unprecedented global economic
crisis, which has significantly affected Commonwealth
countries’ trade and investment flows. The 2021
Commonwealth Trade Review examines the pandemic’s
impact on the performance and prospects of the
Commonwealth’s global and intra-Commonwealth trade and
investment. It also identifies possible pathways to help guide
Commonwealth policy-makers and businesses towards a
more inclusive, sustainable and resilient recovery, especially
by harnessing digital trade and digital technologies.
Commonwealth trade and the pandemic
Intra-Commonwealth trade grew spectacularly, by around 10
per cent, in 2017 and 2018 before being subdued by various
global economic headwinds prior to COVID-19, including
the unresolved trade and technology conflict between
the USA and China, rising protectionism, reconfiguring of
supply chains and uncertainties about the outcome of the
UK-EU negotiations. In 2019, the Commonwealth’s global
exports of goods and services were US$3.725 trillion,
representing around 15 per cent of world trade. Although
the Commonwealth’s global exports grew marginally (at
0.2 per cent) in 2019, this growth still outperformed world
trade, which declined by about 1 per cent in 2019.
Intra-Commonwealth trade in goods and services was US$673
billion in 2019, accounting for around 18 per cent of members’
global exports. Combined, the Commonwealth’s developing
country members are the largest exporters of merchandise
whereas the developed economy members lead on services
trade. Merchandise trade accounts for two-thirds of intra-
Commonwealth exports while services are around one-third.
Intra-Commonwealth trade is evolving as member countries
deepen existing trade linkages or diversify their trading
partners within or outside the Commonwealth. Between
2005 and 2019, 24 member countries, including several
small states, considerably increased their share of intra-
Commonwealth trade. Overall, Commonwealth small
states and least developed countries (LDCs) depend the
most on intra-Commonwealth trade. On average, around
28 per cent of small states’ world trade and 24 per cent
for LDCs are destined for Commonwealth members.
A significant Commonwealth “trade cost advantage”
underpins this trade orientation and has remained strong
and resilient over time. Revised estimates based on
the most recently available data indicate that bilateral
trade costs between Commonwealth country pairs are
21 per cent lower than those with non-Commonwealth
countries, on average. This trade cost differential holds for
both agricultural products and manufactured goods.
Commonwealth developing countries drive intra-
Commonwealth trade flows. Their export share has increased
over time – from 60 per cent in 2005 to 67 per cent in 2019.
This owes largely to the greater expansion of trade by Asian
member countries, which are undergoing a noticeable shift
towards services, enabled by digitalisation, whereas African
member countries still rely largely on commodity exports.
The COVID-19 pandemic has dealt a major blow to
Commonwealth economies, inducing an economic recession
in 45 member countries. Compared with the pre-pandemic
growth trend, the combined gross domestic product (GDP)
of Commonwealth countries shrank by US$1.15 trillion
in 2020. This contributed to a loss of $345 billion in global
exports and $60 billion in foregone intra-Commonwealth
exports in just one year. The labour-intensive nature
of manufacturing activities in most Commonwealth
countries, a large orientation towards services, and existing
structural challenges and vulnerabilities in several LDCs
and small states made them particularly vulnerable to the
demand, supply and policy shocks of the pandemic.
In 2020, intra-Commonwealth trade flows were estimated at
US$641 billion, a drop of $30 billion from the level observed
in 2019. Although all regions and member countries were
affected, the decline in intra-Commonwealth trade was
highest for developing countries. In absolute terms, Asian
economies suffered the largest drop, followed by European
5016_Book.indb 22 17-06-2021 08:32:06

Executive Summary \ xxiii
and African economies. However, in relative terms, the
Caribbean small island developing states (SIDS) saw an even
greater decline in trade flows. COVID-19 damaged the already
fragile economies of LDCs by drastically reducing external
demand for their goods and services and lowering prices of
key exports. This resulted in a major setback to the target of
doubling LDCs’ share of world exports by 2020, as envisaged
by the Istanbul Programme of Action for LDCs for 2011-2020
and adopted by the Sustainable Development Goals (SDGs).
Many Commonwealth countries’ exports have started to
rebound as lockdowns are being lifted and the vaccination
drive is gathering pace in some countries. In absolute
terms, Commonwealth trade flows, both global and intra-
Commonwealth, are estimated to reach 2019 levels by the end
of 2021. Merchandise trade is leading the recovery; however,
recovery of the services sector may take much longer. The
overall trade recovery is likely to be highly uneven as countries
with slower vaccine roll-outs, less fiscal space, lagging rates
of information and communication technology (ICT) adoption
and large dependence on tourism will face greater challenges.
Intra-Commonwealth exports are expected to surpass
US$700 billion by 2022. To reach this threshold, countries
will need to leverage digital technologies, utilise bilateral and
regional trade agreements, promote services co-operation
and improve connectivity to boost their trade, while the
Commonwealth’s youthful population offers another promising
dividend for economic recovery. While the upsurge in using
digital technologies can support recovery globally - and
enables the broader transition towards digitalisation in many
countries - there is still a significant digital divide within and
between Commonwealth members, especially for women.
Digitalisation and trade in the Commonwealth
The Commonwealth’s broad digital trade grew strongly
in the decade preceding the COVID-19 pandemic, with
increasing contributions from developing countries overall
and Asian members in particular. The Commonwealth’s
ICT goods trade flows (exports and imports) expanded by
US$25 billion, reaching $547.7 billion in 2019. Equivalent
trade flows in ICT services increased by nearly $81 billion
to reach $194.5 billion in 2019. Commonwealth exports
and imports of digitally deliverable services grew by 44.8
per cent between 2011 and 2019, reaching $1.2 trillion. By
2018, more than half (54 per cent) of the Commonwealth’s
total services trade was delivered by digital means.
Intra-Commonwealth digital trade was also significant and,
in some cases, expanding prior to the pandemic. This trade
represented almost 13 per cent of the Commonwealth’s
total ICT goods trade flows in 2019. Intra-Commonwealth
trade (exports plus imports) in electronically transmitted
products – such as audio files, video files or video games and
e-books – was worth more than US$4.6 billion in 2019. More
than one-fifth (21.8 per cent) of ICT services exported by
Commonwealth countries went to member countries in 2019.
The Commonwealth’s digital trade flows, both
within and outside the Commonwealth, are highly
concentrated in a few Commonwealth countries, mostly
developed and Asian members. Many Commonwealth
SIDS and LDCs remain marginal players.
E-commerce activity is also generally more prevalent in
developed Commonwealth countries. These countries
recorded sizeable business-to-consumer sales in 2017
and 2018, ranging from 1.5 per cent of GDP in Australia to
9.3 per cent in the UK. Apart from Malaysia, the shares of
e-commerce sales in GDP are generally lower in developing
Commonwealth countries, suggesting there is considerable
scope to grow e-commerce in these economies. This can
be achieved by improving readiness to engage effectively in
e-commerce across a range of Commonwealth countries.
Developed Commonwealth economies and a few developing
members are currently better prepared to support online
commerce. Twelve Commonwealth countries recorded
values above the world average on the E-Commerce Index,
including all six developed members (four of which rank in
the top twenty globally) and some developing members
(Singapore, Malaysia, Mauritius, India, South Africa and
Jamaica). However, a few African and Asian members –
most of which are LDCs – rank lower on this Index.
COVID-19 has accelerated digital engagement, fuelling growth
in digital trade and highlighting the benefits of digitisation and
digital transformation. While the lockdowns and restrictions
introduced to combat the pandemic led to some supply shocks
affecting the manufacturing of ICT goods and the supply of
products in e-commerce value chains, they also generated a
range of positive demand shocks. These included increased
5016_Book.indb 23 17-06-2021 08:32:06

xxiv \ Commonwealth Trade Review 2021
demand for certain categories of consumer electronics and
communication equipment and for digitally deliverable creative
content and local and cross-border e-commerce activity.
Digital technologies have been instrumental in mitigating
some of the economic losses caused by the pandemic,
especially by sustaining some trade in services from education
to health care. This has been enabled through switching
between modes of supply as evident in a shift in favour of the
supply of services through Mode 1 cross-border supply.
At the same time, the rapid acceleration in the adoption of
digital technologies since the outbreak of the pandemic
has the potential to exacerbate existing digital divides
across and within countries. While the share of people in the
Commonwealth using the internet has almost doubled in the
past decade, to over 48 per cent in 2019, there remain stark
differences in internet access, affordability and usage between
developed, developing and LDC members. Higher costs of
broadband, inter alia, are a key deterrent to this uptake.
The impact of COVID-19 on Commonwealth FDI
Despite sluggish growth in international investment,
foreign direct investment (FDI) inflows to Commonwealth
countries were robust in the decade prior to the emergence
of the COVID-19 pandemic. Global FDI inward stock held
by Commonwealth countries expanded by more than US$3
trillion and stood at nearly US$7.5 trillion in 2019. The value
of intra-Commonwealth FDI stock reached $1.2 trillion in
2019, almost double the stock in 2010. Over the same period,
annual global FDI inflows to the Commonwealth grew more
than twice as fast as global inflows, on average; and the
Commonwealth’s share of global FDI inflows expanded by
nearly 3 percentage points to reach 23.3 per cent in 2019.
Intra-Commonwealth FDI inflows grew by nearly US$33
billion and amounted to $75.2 billion in 2019. This was
supported by a strong “Commonwealth advantage” in FDI.
Before the pandemic, estimated investment flows between
Commonwealth countries were 27 per cent higher than
those between other country pairs, on average. Greenfield
FDI between Commonwealth country pairs were around
19 per cent higher overall and 37 per cent higher for African
members. Despite their growth, inward FDI stocks and flows
from global and intra-Commonwealth sources remained highly
concentrated in a relatively small number of member countries.
In 2019, global greenfield FDI inflows to the Commonwealth
amounted to US$150.3 billion, with intra-Commonwealth flows
accounting for $26.6 billion (or 15 per cent) of this total. Around
70 per cent of intra-Commonwealth greenfield investments
were directed into services sectors between 2017 and 2019.
The UK was the largest recipient of greenfield FDI between
2017 and 2019, accounting for nearly one-fifth of total
inflows. It was also the largest outward investor to the
Commonwealth. Collectively, developed country members
were responsible for 57 per cent of announced greenfield
projects in other Commonwealth countries, while Singapore,
India and South Africa were the main developing country
contributors as well as recipients. Four other developing
members - Nigeria, Malaysia, Namibia and Bangladesh –
were also among the top 10 destinations for investment.
The pandemic had a major impact on overall greenfield
FDI to the Commonwealth. There were notably fewer
greenfield project announcements compared with
pre-pandemic averages, significantly lower levels of
capital investment and fewer jobs created. Global
greenfield inflows to manufacturing and primary sectors
experienced a larger decline than the services sectors.
Most Commonwealth countries experienced a significant
decline in overall FDI inflows in 2020. Given the extensive
linkages between trade and investment, and the role of
FDI in supporting cross-border trade, these disruptions
could possibly constrain the trade prospects of some
Commonwealth countries. The drop affected all developed and
developing countries but to a varying degree, with Australia
and Rwanda notably experiencing a 50 per cent decline in
inflows compared with the pre-pandemic (2017-2019) average.
Only eight Commonwealth developing countries recorded
higher overall FDI inflows in 2020 compared with this previous
average. They were The Gambia, Malawi and Sierra Leone in
Africa, India in Asia, Belize, Guyana and Trinidad and Tobago
among Caribbean SIDS and Papua New Guinea in the Pacific.
Intra-Commonwealth greenfield FDI was similarly affected.
In 2020, overall intra-Commonwealth greenfield inflows were
US$1.6 billion lower in Q2, $4.7 billion lower in Q3 and $2.9 billion
lower in Q4 of 2020. The estimated number of jobs created
5016_Book.indb 24 17-06-2021 08:32:06

Executive Summary \ xxv
through these investments in 2020 was only around half the
pre-pandemic average. While intra-Commonwealth greenfield
inflows to manufacturing fared relatively better (11 per cent
lower) in 2020, inflows to the primary (56 per cent lower) and
services (34 per cent lower) sectors were affected significantly.
Overall FDI inflows to the Commonwealth are expected
to decline by 18 per cent in 2021, and a further 7 per cent
in 2022. As a result, the total value of FDI inflows to the
Commonwealth is expected to decline to US$136 billion in
2022, or a loss of around $220 billion compared with 2019.
Looking beyond the pandemic, Commonwealth countries
should aim to attract investors wanting to diversify supply
bases (e.g. China) and strengthen their physical and digital
infrastructure. They can take advantage of tariff preferences
in major developed and developing country markets to attract
investment in new facilities and, where possible, export tariff-
free to these markets. Trade agreements like the African
Continental Free Trade Area (AfCFTA) and the Regional
Comprehensive Economic Partnership (RCEP) create new
mega-regional markets for investors, especially with several
Commonwealth African countries being the major sources
of intra-African investment. At the multilateral level, the Joint
Statement Initiative on investment facilitation by some WTO
members may result in outcomes that boost FDI inflows to
Commonwealth countries. The Commonwealth has a strong
diasporic community with considerable potential for diaspora
investment, although this has yet to be fully realised.
Multilateral and regional trade responses to the pandemic
Despite the WTO’s many accomplishments, trade
multilateralism is at a crossroads. The changing nature
and composition of trade and supply chains, as well as
managing the WTO’s rulebook in the face of the geopolitical
and geo-economic rivalry between the USA and China,
may affect the prospects for trade multilateralism and
have implications for Commonwealth countries.
COVID-19 affected trade multilateralism in multiple ways. The
pandemic disrupted in-person meetings and negotiations
at the WTO, leading to a shift to virtual and hybrid formats.
Some WTO members adopted unilateral measures to manage
the consequences of the pandemic, including restricting
exports from food to medicines and vaccines. Global
logistics and supply chains were interrupted, including the
transit of essential goods, leading several Commonwealth
countries to advocate globally for maintaining open trade and
supply chains. In this situation, Commonwealth developing
countries and LDCs should consider fast-tracking any relevant
provisions of the WTO’s Trade Facilitation Agreement
(TFA) by using the TFA Facility and capacity support for
implementation. Countries that implemented temporary
measures to facilitate trade, like digitising paper processes,
should consider permanently adopting these ad hoc measures.
The pandemic has highlighted the need to strengthen the
multilateral trading system. Reforms should also help the WTO
prepare better for future crises and build global resilience. Given
the rapid adoption of ICTs in response to the pandemic and
the trend towards digitalisation, the WTO will need to adapt
to become more effective at promoting and facilitating digital
trade and building capacity to participate in the digital economy.
Few Commonwealth countries have the capacity to
manufacture vaccines, while 47 are net importers of COVID-
related medical goods. Priority should be accorded to ensuring
increased production and equitable distribution of affordable
vaccines for all. The WTO provides a possible multilateral route
for international co-operation in developing and distributing
affordable COVID-19 vaccines. Several Commonwealth
countries, led by India and South Africa, have requested at the
WTO a general waiver to the Agreement on Trade-Related
Aspects of Intellectual Property Rights (TRIPS) for drugs,
vaccines, diagnostics and other technologies related to
COVID-19 to enable the production of generic vaccines to meet
national and global demand. More recently, the USA announced
support for a waiver of intellectual property protection on
COVID-19 vaccines to help end the pandemic. However,
some countries still argue that the Doha Declaration on TRIPS
and Public Health already provides sufficient flexibilities to
strike the right balance between safeguarding intellectual
property holders’ rights and public health considerations.
COVID-19 has underscored the importance of deepening
regional co-operation and co-ordination to combat the
pandemic, support economic recovery and build resilience
for future shocks. Several regional trade agreements (RTAs)
involving Commonwealth countries have been completed in
recent years. They include the AfCFTA, RCEP and the UK’s
trade agreements with Commonwealth countries, where
5016_Book.indb 25 17-06-2021 08:32:06

xxvi \ Commonwealth Trade Review 2021
there is considerable untapped potential to grow trade. Since
most intra-Commonwealth trade takes place regionally, an
urgent priority should be to tackle implementation gaps in
existing or new trade agreements. Developing countries
can draw on the WTO’s Aid for Trade initiative as well as
bilateral and regional development assistance programmes
to strengthen their productive and supply capacities and
improve competitiveness, while LDCs can do the same through
partnerships with the Enhanced Integrated Framework for
LDCs and the United Nations Technology Bank for LDCs.
Strengthened regional co-operation dealing with behind-
the-border measures (e.g. technical regulations), ensuring
improved connectivity (e.g. transport infrastructure) and
triggering structural transformation (e.g. through regional
value chains) is more likely to lead to increased trade than just
tariff preferences. Developing regional value chains can also
open opportunities for putting in place new manufacturing
capacities to aid recovery from the pandemic. In addition,
Commonwealth countries can leverage RTAs to build back
better, including by developing model provisions to promote
better trade co-operation in times of emergency and
mechanisms supporting women’s economic empowerment.
Multilateralism and regionalism can co-exist and
complement each other, especially if they create new
trading opportunities and deepen liberalisation. RTAs
can innovate with governance arrangements for trade,
such as the digital economy, while the WTO can provide
a platform for inclusive discussion and learning about
regional experiences, including through the Trade Policy
Reviews and the Transparency Mechanism for RTAs.
Pathways to post-COVID trade recovery and resilience building
Each Commonwealth member country has its own unique
pathway and policy options for trade recovery, although
access to vaccines plays an indispensable part for all of
them. The broader outlook for Commonwealth countries’
trade recovery is inextricably linked to global economic
prospects as well as the structure of their economy, the
composition of their exports and their inherent characteristics
and vulnerabilities, especially for LDCs and small states.
Trade recovery must be framed overall by the importance
of ensuring inclusive trade for women and youth and
especially promoting women’s economic empowerment.
Since a rules-based global trading system offers the best
framework to enable trade recovery, WTO members
should work collectively to strengthen and reform trade
multilateralism. In the short term, consideration could be given
to avoiding protectionism and improving vaccine production
and distribution, strengthening the enabling environment for
e-commerce, addressing fisheries subsidies and improving food
security. As part of a broader reform agenda, it is paramount
to find a solution to the dispute settlement impasse and to
identify practical ways for trade multilateralism to support
greater environmental sustainability, especially in light of the
SDGs and global commitments to addressing the climate crisis.
Progress in the next decade will be critical to ensure LDCs
are not left behind. Following the end of the Istanbul
Programme of Action in 2020, the Fifth United Nations
Conference on LDCs, which is scheduled for January
2022, will look to mobilise additional international support
measures and actions for LDCs and foster a renewed
partnership between LDCs and development partners.
Greater focus should be placed on developing productive
capabilities in higher-productivity sectors and higher
value-added activities to structurally transform LDCs’
economies and make them more resilient to future shocks.
The UK is a key destination for intra-Commonwealth exports,
with numerous opportunities to strengthen trade and
investment linkages and economic co-operation beyond
the pandemic. The UK and its Commonwealth partners
could aim to complete and implement bilateral FTAs,
diversify food trade towards Commonwealth partners and
deepen co-operation in services and the digital economy,
including in relation to FinTech and tourism. They can
engage in structured dialogue to further improve the UK’s
development-friendly trade, especially for LDCs, and resolve
some challenges faced by Commonwealth exporters in
triangular supply chains involving the UK and the EU.
The global tourism and travel sector has been the hardest hit
by COVID-19, and the Commonwealth’s tourism-dependent
small states have been severely affected. Many Commonwealth
members have implemented response and recovery plans for
the tourism sector based on industry body guidelines, with two
broad categories of measures discernible: first, short-term,
5016_Book.indb 26 17-06-2021 08:32:06

Executive Summary \ xxvii
immediate crisis management responses that include stimulus
and relief packages; and second, measures that focus on
medium- to long-term recovery, especially to make the industry
more resilient. Embracing digital and technological options will
be a crucial component of a future tourism recovery strategy.
Commonwealth countries can leverage digital technologies to
support recovery, depending on their levels of ICT adoption and
digital connectivity. In the short to medium term, digital trade,
especially e-commerce and delivering certain services online,
can provide a pathway for mitigating several economic losses
from COVID-19 and support the opening and resumption of
many activities, although some online activity may decline
with the roll-out of vaccines and treatments. In the longer
term, growing digital trade, investing in digital capabilities,
upskilling and training the workforce, and harnessing some
of the frontier technologies linked to Industry 4.0 can help
transform economies, build resilience to future shocks
and better integrate sustainability into supply chains.
Digital trade, however, requires developing an appropriate
and enabling regulatory system, including policies and
regulations governing areas like data protection and
privacy, data processing, cyber-security, e-transactions
and digital signatures, and consumer protection. While
Commonwealth developed countries have implemented
most of these, many developing countries, especially African
countries and small states, still lag in terms of legislative
or regulatory progress in this area. Nonetheless, many
Commonwealth countries are engaged in efforts to develop,
co-operate, co-ordinate or harmonise rules and standards
for digital trade through bilateral or regional trade deals
and initiatives at the WTO. The policy landscape for digital
services, especially across borders, is rapidly evolving,
with implications for negotiating commitments on trade in
services under the WTO and other trade agreements.
There is a compelling case for directing more donor support
to enhance developing countries’ participation in digital trade.
A dedicated – and additionally funded - Aid for Digital Trade
agenda provides an opportunity to mainstream support for
enhanced digital connectivity and adoption into AfT as part of
a comprehensive approach to inclusive digital transformation.
This could initially focus on supporting infrastructure, digital
skills, e-government and financial inclusion in developing
countries and LDCs. Commonwealth countries should also
strive to digitise trade facilitation by adopting paperless trade
solutions and consider making permanent any temporary digital
trade facilitating measures introduced during the pandemic.
The post-COVID recovery is an opportunity for Commonwealth
countries to make progress with many of the SDGs, but
especially SDG 12 – namely, ensuring sustainable consumption
and production – including through trade policy and trade
agreements and promoting circular economy principles. The
adoption of digital technologies can support this transition to
sustainable growth and development, the creation of green
jobs and strengthened regional and local supply chains.
Taken together, these inter-related measures provide a set
of pathways towards recovery in Commonwealth trade.
As the world begins to tide over the COVID-19 pandemic,
Commonwealth countries can look to use their global and intra-
Commonwealth trade as essential tools for building back better
and promoting a more inclusive, resilient and sustainable future.
5016_Book.indb 27 17-06-2021 08:32:06

xxviii \ Commonwealth Trade Review 2021
Endnotes
1 In absolute terms, the value of global
trade in goods and services in 2020
(US$23.1 trillion) was around the
same as the value of world trade
in 2011. Moreover, LDCs’ share
in global trade during this period
has remained stagnant, at around
1 per cent, although, in absolute
terms, their exports increased
marginally, from $216 billion in
2011 to $244 billion in 2019.
2 This is based on the International
Monetary Fund’s GDP projection
for Commonwealth countries
in October 2019 (prior to the
outbreak of COVID-19) and April
2021 (during the pandemic).
5016_Book.indb 28 17-06-2021 08:32:06

5016_Book.indb 29 17-06-2021 08:32:06

Chapter 1: Commonwealth Trade and the Pandemic
5016_Book.indb 2 17-06-2021 08:32:06

Intra-Commonwealth exports grew spectacularly, at around 10 per cent, during 2017 and 2018. However, COVID-19, together with various global economic exigencies prior to the pandemic, has subdued trade growth and affected exports from all Commonwealth regions. Many countries have been highly exposed to the effects of COVID-19 because of their large services sectors along with existing structural challenges and vulnerabilities; this is especially the case for least developed countries (LDCs) and small states. With the rollout of vaccines, some Commonwealth countries have started to open their economies and resume trade and travel but many others still face the challenge of combating the pandemic.
This chapter analyses the impact of COVID-19 on Commonwealth countries’ global and intra-Commonwealth goods and services exports and explores the prospects for trade recovery. Some of the key takeaways are:
• In 2020, intra-Commonwealth trade was estimated at US$641 billion and could have been $60 billion higher without the pandemic. All Commonwealth regions experienced adverse effects, although the Caribbean and Pacific island countries were relatively more affected because of their dependence on tourism and travel services.
• Intra-Commonwealth trade continues to evolve as member countries deepen existing linkages or diversify trading partners within or outside the Commonwealth. Between 2005 and 2019, 24 member countries considerably increased their share of intra-Commonwealth trade.
• Commonwealth small states depend the most on intra-Commonwealth trade, which represents 28 per cent of their world trade, on average. LDC members, especially Bangladesh and African countries, also have significant exports to Commonwealth markets.
• The Commonwealth advantage remains strong and resilient and could provide a post-pandemic tailwind to support recovery. Revised estimates mean bilateral trade costs between Commonwealth country pairs are 21 per cent lower, on average, compared with non-Commonwealth countries.
• Intra-Commonwealth exports are expected to rebound and surpass US$700 billion by 2022. Countries can leverage digital technologies, utilise trade agreements, promote services co-operation and improve connectivity to boost their trade, while the Commonwealth’s youthful population offers another promising dividend for economic recovery.
5016_Book.indb 3 17-06-2021 08:32:06

Intra-Commonwealth trade has been affected significantly by COVID-19 but is expected to rebound and surpass US$700 billion by 2022.
2019
2020 2022
Digiti
sation
Comm
onwealth
Advantage
$239BILLION $434
BILLION SERVICES GOO
DS
$345 BILLION
$60 BILLION
Foregone exports
Proj
ecte
d intra-Commonwealth exports
Global exports
Intra-Commonwealth exports Intra-Commonwealth exports
$700 BILLION
$3.725TRILLION
Value of Commonwealth
countries' global goods and services expor
ts
$673 BILLION
Value of intra-Commonwealth
goods and services exports
5016_Book.indb 4 17-06-2021 08:32:06
1.1 Introduction
Commonwealth countries’ trade has been affected
significantly by the global slowdown in economic growth
as a result of COVID-19 and the policy measures used
to contain the spread of the virus, including economic
lockdowns, travel restrictions and social distancing. The
world economy contracted by 3.3 per cent in 2020, with
particularly severe impacts on women, youth, the poor
and the informally employed. Overall, Commonwealth
countries suffered a loss of US$1.15 trillion to their gross
domestic product (GDP) compared with the pre-pandemic
estimate. During this time, 45 Commonwealth countries fell
into recession, while only 9 developing country members
registered positive growth – namely, Bangladesh, Brunei
Darussalam, Ghana, Guyana, Malawi, Nauru, Tanzania, The
Gambia and Tuvalu (see Annex 1.3). By contrast, when the
global financial crisis hit more than a decade ago, less than
half of the Commonwealth membership went into recession.
This chapter examines the impact of COVID-19 on the
performance and prospects of the Commonwealth’s global
trade and trade among the 54 member countries. The demand,
supply and policy shocks of the pandemic have affected
countries’ trade in multiple ways depending on the structure
of their economies, the composition of their exports and
their integration into global value chains (GVCs). For example,
services like transportation, travel and tourism have been hit
hard, and an initial collapse in commodity prices affected the
Commonwealth’s 35 commodity-dependent exporters. With
the easing of lockdowns and restrictions in many countries,
and the (uneven) rollout of vaccinations, merchandise trade
is starting to lead an economic recovery. However, the revival
of the services sector, which is the economic lifeblood of
many Commonwealth small states, may take longer.
The chapter consists of seven sections. The next two
sections analyse the composition and performance of
Commonwealth countries’ global and intra-Commonwealth
trade during the pre-crisis period to establish a baseline
for assessing their vulnerability to the pandemic’s effects.
Section 1.4 examines some of the actual impacts on the
Commonwealth’s goods and services trade; Section
1.5 looks specifically at the Commonwealth’s 14 least
developed countries (LDCs) in this regard.1 Given the focus
on immediate economic recovery, Section 1.6 projects
the Commonwealth’s short-term trade prospects up to
2022. Section 1.7 concludes and offers ways forward.
5016_Book.indb 5 17-06-2021 08:32:06

6 \ Commonwealth Trade Review 2021
1.2 The Commonwealth’s global trade before the pandemic
1.2.1 Volume of trade and trends
Following a dramatic slowdown in world
trade growth in the wake of the global
financial crisis more than a decade
ago, the trade flows of Commonwealth
countries rebounded strongly in 2017
and 2018, with year-on-year growth
of around 10 per cent. However, this
promising recovery was cut short
by economic headwinds, mainly
the trade and technology conflict
between the USA and China (see
Chapter 4), which caused global trade
to contract significantly in 2019.2 This
global contraction contributed to
weak growth in the Commonwealth’s
exports, which increased by only
US$3.5 billion between 2018 and
2019. In 2019, prior to the onset of the
COVID-19 pandemic, the combined
value of the Commonwealth’s global
goods and services exports was $3.73
trillion (Table 1.1). Developing country
members contributed around half
TA B L E 1 . 1CO M M O N W E A LT H CO U N T R I ES ’ P R E- P A N D E M I C E X P O RT P RO F I L E , 2 0 1 9
Value (US$ million) Share (%)
Goods Services Total Goods Services
Commonwealth 2,538,222 1,187,637 3,725,859 68.12 31.88
Of which
Developed 1,226,923 634,385 1,861,307 65.92 34.08
Developing 1,279,272 553,253 1,832,524 69.81 30.19
Of which
Africa 219,463 51,680 271,143 80.94 19.06
Asia 1,033,714 483,121 1,516,835 68.15 31.85
Caribbean SIDS 13,074 15,558 28,632 45.66 54.34
Pacific SIDS 13,021 2,894 15,915 81.81 18.19
Vulnerable groups
Small states 60,602 61,734 122,335 49.54 50.46
SIDS 29,204 25,945 55,149 52.95 47.05
LDCs 62,663 16,528 79,192 79.13 20.87
Source: Commonwealth Secretariat (calculated using UNCTADstat and WTO-OECD BaTIS datasets)
F I G U R E 1 . 1CO M M O N W E A LT H CO U N T R I ES ’ G LO B A L E X P O RTS O F G O O DS A N D S E R V I C ES, 2 0 0 5 – 2 0 1 9
Val
ue (U
S$
trilli
on)
Value of exports Share of Commonwealth in world exports Share of intra-Commonwealth exports
Sha
re (%
)
0.0
0.5
2005 2006 2007 2008 2009 2010 2011 2012 2013 2014 2015 2016 2017 2018 20190
5
10
15
20
25
1.0
1.5
2.0
2.5
3.0
3.5
4.0
Note: The chart presents total global exports of 54 Commonwealth member countries, good and services combined.Source: Commonwealth Secretariat (calculated using UNCTADstat and WTO-OECD BaTIS datasets)
5016_Book.indb 6 17-06-2021 08:32:07
Chapter 1: Commonwealth Trade and the Pandemic \ 7
of these global exports, making up
the greater share of goods trade.
In absolute terms, the
Commonwealth’s total exports to
the world almost doubled from 2005
(US$2.1 trillion) to 2019 ($3.73 trillion).
However, their corresponding share
of global exports declined marginally,
from 16.2 per cent to 15.1 per cent of
world exports ($24.9 trillion) (Figure
1.1). China, which is now the world’s
largest exporter, contributed to this
declining share, as did growth in other
large developing countries outside the
Commonwealth. At the same time,
the share of intra-Commonwealth
trade in member countries’ overall
world trade is rising, having grown
from around 16 per cent in 2005 to
more than 18 per cent in 2019.
In tandem with changes in the
size and relative proportion of the
Commonwealth’s trade with the world,
there have been some significant shifts
in the drivers of Commonwealth trade
since the 2018 Commonwealth Trade
Review. There has been a convergence
in the relative contributions of the
developed countries – namely, Australia,
Canada, Cyprus, Malta, New Zealand and
the UK – and the 48 developing country
members to the Commonwealth’s
world trade.3 The share of developing
countries in the Commonwealth’s total
exports increased steadily from 40
per cent in 2005 to nearly 50 per cent
in 2017 (Figure 1.2).4 Commonwealth
Asian countries, led by India, are driving
this convergence, having more than
doubled their exports to US$1.51 trillion
in 2019 (from $635 billion in 2005). This
has translated into a rising share in
total Commonwealth trade for Asian
countries, from 31 per cent in 2005
to 41 per cent in 2019. The exports of
Pacific small island developing states
(SIDS) increased nearly threefold to
around $15.9 billion in 2019. However,
their share in total trade increased
only marginally, from 0.3 per cent
in 2005 to 0.4 per cent in 2019.
Pre-pandemic headwinds also affected
the trade flows of the Commonwealth’s
32 small states. In 2019, their combined
global exports were US$115 billion while
their intra-Commonwealth exports were
around $33 billion, almost $1 billion less
than the level reached in 2018 (Figure
1.3). In relative terms, small states’
goods and services exports amount
to 0.45 per cent of global exports and
3 per cent of overall Commonwealth
exports. Malta and Cyprus contribute
the largest share – about one-third (or
$37 billion) – of small states’ exports. The
top three exporters from developing
regions were Papua New Guinea ($11.6
billion), Brunei Darussalam ($7.6 billion)
and Jamaica ($6 billion) in 2019.
Most of the trade challenges facing small
states precede COVID-19 and involve
excessively high trade costs as a result of
their small size and remote geography,
diseconomies of scale, inadequate
infrastructure, concentrated production
and export sectors, and vulnerability to
climate change and recurrent natural
disasters. The trade and sustainability
challenges, especially in the fisheries
and tourism sectors, will now have to
be tackled in tandem through devising
post-COVID-19 recovery and resilience
strategies, as discussed in Chapter 5.
1.2.2 Structure and composition of trade
More than two-thirds of the
Commonwealth’s global trade is in
merchandise. In 2019, goods exports
were worth US$2.5 trillion (68 per cent of
overall trade) while services contributed
$1.18 trillion (32 per cent) (Table 1.1).
The UK was the largest exporter of
both goods and services, accounting
for around 24 per cent of total
Commonwealth trade. In 2019, the UK’s
goods exports were about US$468 billion
(19 per cent of total Commonwealth
goods exports) while its services exports
were $416 billion (35 per cent of total
Commonwealth services exports).
Only a few large economies within
each Commonwealth region drive
the Commonwealth’s global exports.
Ten countries accounted for 94 per
cent of total merchandise exports5
and 93 per cent of services exports6
in 2019 (Annex 1.1). Most of these
economies contracted as a result
of the pandemic. This affected their
overall trade flows, as well as intra-
Commonwealth trade, in 2020. The
pace of economic recovery in these
countries will determine the prospects
for trade growth beyond COVID-19.
Commonwealth countries are active
participants in the global services
economy. The contribution of services
exports to GDP varies enormously
across developed and developing
countries and regions (Figure 1.4).
Developed countries have the highest
share, at almost 60 per cent. Among
developing countries, the Caribbean and
Pacific regions have larger proportions
of services exports in their GDP (54
per cent and 39 per cent, respectively).
This owes to the predominance of
tourism and travel services, especially
in the Caribbean. The share of services
exports in the GDP of the Asian (34
per cent) and African (20 per cent)
regions is relatively small but still
higher than the world average.
5016_Book.indb 7 17-06-2021 08:32:07

8 \ Commonwealth Trade Review 2021
F I G U R E 1 . 2E V O LU T I O N O F CO M M O N W E A LT H M E M B E RS ’ E X P O RTS, B Y D E V E LO P M E N T L E V E L A N D S ECTO R , 2 0 0 5 – 2 0 1 9
Sha
re (%
)
35
40
45
50
55
60
65
2005 2006 2007 2008 2009 2010 2011 2012 2013 2014 2015 2016 2017 2018 2019
BY DEVELOPMENT LEVEL
CW developed CW developing
US
$ tr
illio
n
0.0
0.5
1.0
1.5
2.0
2.5
3.0
2005 2006 2007 2008 2009 2010 2011 2012 2013 2014 2015 2016 2017 2018 2019
BY SECTOR
Goods Services
Source: Commonwealth Secretariat (calculated using UNCTADstat and WTO-OECD BaTIS datasets)
5016_Book.indb 8 17-06-2021 08:32:07

Chapter 1: Commonwealth Trade and the Pandemic \ 9
F I G U R E 1 . 3T RA D E P E R F O R M A N C E A N D CO M P O S I T I O N O F CO M M O N W E A LT H S M A L L STAT ES ’ E X P O RTS, 2 0 0 5 – 2 0 1 9
Glo
bal e
xpo
rts
(US
$ bi
llion)
Intr
a-C
W e
xpo
rts
(US
$ bi
llions
)
0
20
40
60
80
100
140
120
0
10
20
30
40
50
60
2005 2006 2007 2008 2009 2010 2011 2012 2013 2014 2015 2016 2017 2018 2019
115
33
EXPORTS TREND OF COMMONWEALTH SMALL STATES
Global exports (left axis) Intra-Commonwealth exports (right axis)
Sha
re (%
)
0
5
10
15
20
25
45
40
35
30
CW Small states(32)
Africa(7)
Asia(2)
Caribbean SIDS(12)
Europe(2)
Pacific SIDS(9)
SIGNIFICANCE OF INTRA-COMMONWEALTH EXPORTS FOR SMALL STATES (2019)
Goods Services CW goods average CW services average
Source: Commonwealth Secretariat (calculated using UNCTADstat and WTO-OECD BaTIS datasets)
5016_Book.indb 9 17-06-2021 08:32:07

10 \ Commonwealth Trade Review 2021
Merchandise exports
Commonwealth developing countries
are the largest merchandise exporters,
at US$1.28 trillion in 2019. However,
there is wide variation within the
Commonwealth’s developing regions,
as the following stylised facts reflect.
Asian members are overwhelmingly
the leading exporters of goods, with
exports valued at US$1.03 trillion in
2019 (68 per cent of their total exports).
Three Asian countries accounted for
around 40 per cent of these exports:
Singapore ($390 billion or 16 per cent),
India ($323 billion or 13 per cent) and
Malaysia ($238 billion or 9 per cent).
For Commonwealth Africa, goods
contributed more than 80 per cent
of their exports in 2019 (Annex 1.1).
Three sub-Saharan African (SSA)
members accounted for almost
80 per cent of the region’s total
merchandise exports: South Africa
($90 billion or 41 per cent), Nigeria
($65 billion or 29 per cent) and
Ghana ($16 billion or 8 per cent).
The Pacific SIDS depend the most
on goods exports (82 per cent) and
the least on services (18 per cent).
In 2019, Papua New Guinea was the
largest exporter (US$11.41 billion),
accounting for more than 87 per
cent of the region’s exports and
almost 10 times the value of the next
ranking country, Fiji ($1.61 billion).
The Caribbean SIDS have narrow
production sectors, such as offshore
oil and gas, fisheries and commodities
like bananas and sugar. In 2019, Trinidad
and Tobago accounted for two-thirds
of the region’s goods exports, valued
at US$8 billion, followed by Guyana
($1.7 billion) and Jamaica ($1.6 billion).
Services exports
Commonwealth developed countries
are the largest exporters of services,
valued at US$634 billion in 2019
(Table 1.1). Among these countries,
the UK supplied almost one-third
of the Commonwealth’s services
exports (see Figure 1.5), of which
around one-third was financial services
(US$80 billion) and travel services
($50 billion). However, their share in
overall services exports is declining –
from 69 per cent in 2005 to 53 per
cent in 2019 – because developing
Tra
de in
ser
vice
s as
a %
of G
DP
0
10
20
30
40
50
70
60
Commonwealth Developed Africa Asia Caribbean SIDS Pacific SIDS
World average Developing regions
47.8
58.9
20.1
33.9
54.3
39.0
Note: Nauru excluded owing to non-availability of data; the dotted line indicates the world average.Source: Commonwealth Secretariat (calculated using WDI data)
F I G U R E 1 . 4S H A R E O F CO M M O N W E A LT H S E R V I C ES E X P O RTS I N G D P B Y R EG I O N , 2 0 1 9
5016_Book.indb 10 17-06-2021 08:32:07

Chapter 1: Commonwealth Trade and the Pandemic \ 11
EXPORTERS
SECTORS
35.1%UK
18.0%India
17.2%Singapore
8.4%Canada
5.9%Australia
15.3%Rest of Commonwealth
21.3%Travel
14.1%Transport
11.64%Financial services
11.51%ICT
3.6%Charges for intellectual property rights
37.84%Other services exports
Source: Commonwealth Secretariat (calculated using WTO-OECD BaTIS dataset)
F I G U R E 1 . 5L E A D I N G S E R V I C ES E X P O RT E RS A N D K EY S E R V I C ES S ECTO RS, 2 0 1 9
5016_Book.indb 11 17-06-2021 08:32:08
12 \ Commonwealth Trade Review 2021
countries, especially Asian members,
are increasingly important players
in this sector. India and Singapore
together accounted for around
one-third of the Commonwealth’s
services exports, comprising mainly
business services and information
technology (IT) support.
Commonwealth African members have
one of the lowest shares of services
exports (19 per cent). South Africa,
Ghana and Kenya are the largest
services suppliers, accounting for
57 per cent of the region’s services
exports; Rwanda is also an important
services player. Among the SSA
membership, only two countries
export more services than goods –
namely, Mauritius (US$2.9 billion in
2019) and Seychelles ($1.1 billion).
More than half of these exports
were travel or tourism-related.
The Caribbean SIDS have the largest
orientation towards trade in services;
around 54 per cent of their exports
comprise services, especially related to
tourism. The COVID-19 pandemic has
affected these sectors significantly.
Travel, an aggregate of tourism and
business travel, is the largest category,
amounting to around one-fifth of total
services exports. The other three big
services categories are transport,
information and communication
technology (ICT) and financial services.
These three groups combined account
for around 40 per cent of services exports
(Figure 1.5). Given the importance of
tourism in Commonwealth services trade,
it is likely that the COVID-19 pandemic,
which has made in-person travel both
more difficult and less appealing to
consumers, has had a major depressive
effect on this trade. ICT and financial
services, by contrast, could see different
dynamics at play: in-person interactions
have become more difficult but there
has also been some shift towards
online service provision (Shepherd
and Shingal, 2021; see Chapter 2). The
same applies to intra-Commonwealth
services trade in these sectors.
1.3 Intra-Commonwealth trade before the pandemic
1.3.1 Volume of trade and trends
Intra-Commonwealth trade is
historically and commercially significant
for many members, especially small
states, LDCs and SSA countries. The
“Commonwealth advantage” has helped
build, strengthen and sustain many of
these trading relationships (Box 1.1).
Factors such as historical ties, familiar
legal and administrative systems, the
use of largely one language, English,
as the means of communicating
with foreign partners, and large
and dynamic diasporas underpin
this advantage, which is particularly
significant for trade in services
(Commonwealth Secretariat, 2015).
B O X 1 .1
T R A D E C O S T S A D VA N TA G E I N I N T R A - C O M M O N W E A LT H T R A D E
The Commonwealth advantage implies that Commonwealth member countries have on average 19 per cent lower trade costs in their bilateral trade than in trade with non-member countries (Commonwealth Secretariat, 2015). The revised estimates calculated with the most up-to-date datasets (1995-2017) indicate that, on average, aggregate bilateral trade costs between Commonwealth country pairs are lower to the tune of around 21 per cent7 compared with the cost of trading with non-Commonwealth countries (Table 1.2). The trade cost advantage holds for both agricultural products and manufactured goods (columns 2 and 3) but the magnitude of the effect varies marginally across sectors, mainly because of data limitations resulting in different sample sizes. A slightly lower coefficient in the manufacturing sector (column 3), besides indicating the variation in sample size, could reflect relatively lesser trade costs owing to lower tariffs in manufacturing sectors.
Many factors, such as distance, language, legal systems and tariffs, influence trade costs, with transport just one of the overall costs of international trade. This means the data for bilateral trade costs is very limited. To circumvent this challenge, Arvis et al. (2016) use an inverse gravity approach to infer bilateral trade costs between countries. This approach has a micro-foundation as it is based on a theoretical model developed in Novy (2013). Following this approach, the United Nations Economic and Social Commission for Asia and the Pacific (UNESCAP) and the World Bank have developed a global database on bilateral trade costs for 180 countries over 1995-2017, including 53 Commonwealth countries (excluding Solomon
5016_Book.indb 12 17-06-2021 08:32:08

Chapter 1: Commonwealth Trade and the Pandemic \ 13
Islands). These bilateral trade costs are interpreted in a similar way to ad valorem equivalents.
The dataset of Arvis et al. (2016) has been used to empirically test whether the Commonwealth is indeed associated with reduced trade costs between its members. A regression of bilateral trade costs on a binary indicator for whether the two countries are Commonwealth members is estimated. The results, shown in columns 1 and 2 of Table 1.2, provide strong evidence that the Commonwealth is associated with lower trade costs. The estimated coefficient for the binary indicator, the Commonwealth membership, is statistically significant at a 1 per cent significance level. Even when distance in combination with time-varying fixed effects for countries is accounted for, bilateral trade costs are 21 per cent lower for Commonwealth partners than for other pairs of countries (i.e. Commonwealth and non-Commonwealth or both countries non-Commonwealth).
An analysis of bilateral trade costs for different sample partners reveals that the trade costs between Commonwealth country pairs have been consistently lower over time (Figure 1.6). For example, in 2000, average bilateral trade costs for intra-Commonwealth partners were 260 per cent as against 293 per cent for Commonwealth and non-Commonwealth bilateral pairs. These results seem to be consistent with the findings of rising intra-Commonwealth trade as a share of the Commonwealth’s global trade over time.
F I G U R E 1 . 6S H A R E O F A V E RAG E T RA D E CO STS B ET W E E N CO M M O N W E A LT H T RA D E P A RT N E RS V S . OT H E RS, 1 9 9 5 – 2 0 1 8
Ave
rage
trad
e co
sts
(ad
valo
rem
)
150
170
190
210
250
230
290
270
330
310
1995 1998 20042001 2007 2010 2013 2016 2018
Commonwealth to non-Commonwealth Intra-Commonwealth
Source: Commonwealth Secretariat (calculated using World Bank Trade Costs dataset)
Overall Agriculture Manufacturing
(1) (2) (3)
Commonwealth membership −0.192*** −0.186*** −0.171***
Distance (km) 0.443*** 0.373*** 0.473***
Origin-year FE Yes Yes Yes
Dest.-year FE Yes Yes Yes
Sample size 333,668 184,824 298,968
CW countries 53 51 52
Period 1995–2017 1995–2017 1995–2017
R-squared 0.71 0.58 0.71
Note: The dependent variable is bilateral trade costs. The estimated coefficients are statistically significant at 1 per cent level, as indicated by ***. Estimated using the OLS panel regression method.Source: Commonwealth Secretariat (estimated using World Bank Trade Costs dataset)
TA B L E 1 . 2T H E CO M M O N W E A LT H E F F ECT O N T RA D E CO STS
5016_Book.indb 13 17-06-2021 08:32:08
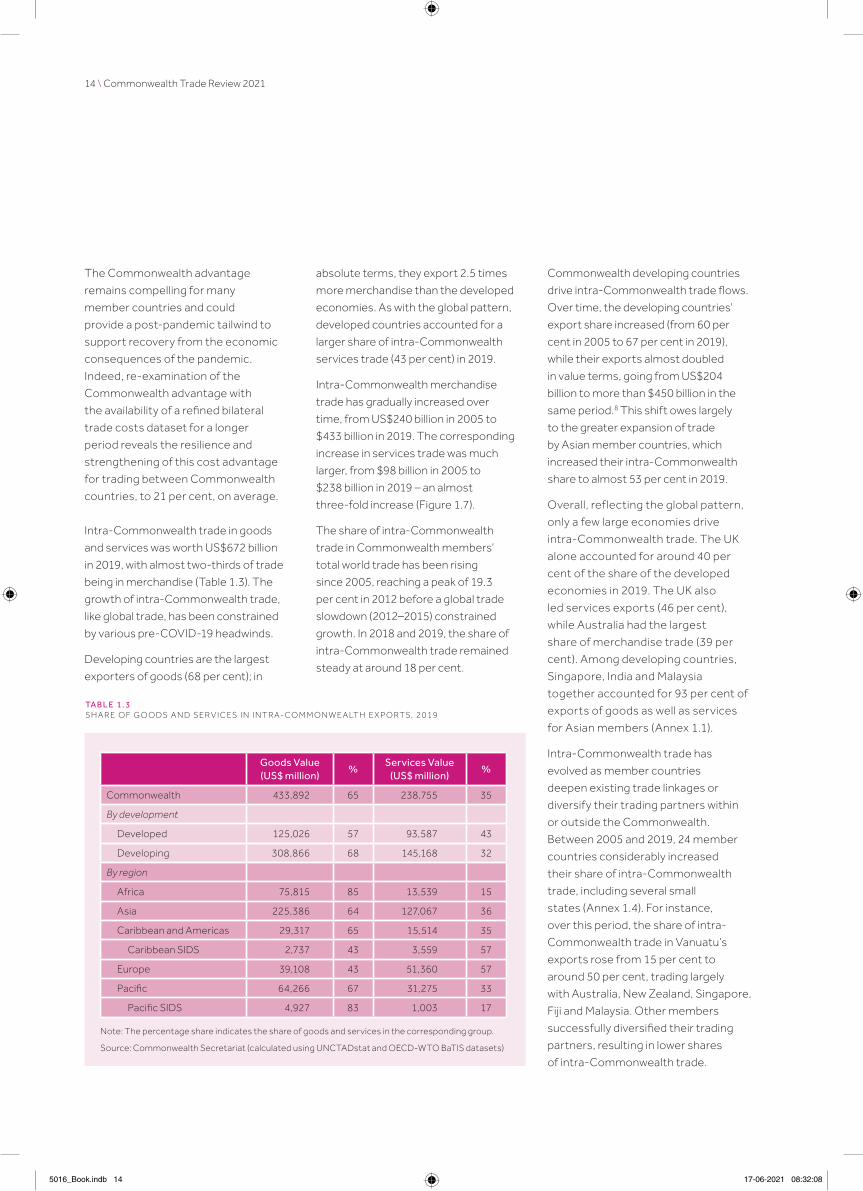
14 \ Commonwealth Trade Review 2021
The Commonwealth advantage
remains compelling for many
member countries and could
provide a post-pandemic tailwind to
support recovery from the economic
consequences of the pandemic.
Indeed, re-examination of the
Commonwealth advantage with
the availability of a refined bilateral
trade costs dataset for a longer
period reveals the resilience and
strengthening of this cost advantage
for trading between Commonwealth
countries, to 21 per cent, on average.
Intra-Commonwealth trade in goods
and services was worth US$672 billion
in 2019, with almost two-thirds of trade
being in merchandise (Table 1.3). The
growth of intra-Commonwealth trade,
like global trade, has been constrained
by various pre-COVID-19 headwinds.
Developing countries are the largest
exporters of goods (68 per cent); in
absolute terms, they export 2.5 times
more merchandise than the developed
economies. As with the global pattern,
developed countries accounted for a
larger share of intra-Commonwealth
services trade (43 per cent) in 2019.
Intra-Commonwealth merchandise
trade has gradually increased over
time, from US$240 billion in 2005 to
$433 billion in 2019. The corresponding
increase in services trade was much
larger, from $98 billion in 2005 to
$238 billion in 2019 – an almost
three-fold increase (Figure 1.7).
The share of intra-Commonwealth
trade in Commonwealth members’
total world trade has been rising
since 2005, reaching a peak of 19.3
per cent in 2012 before a global trade
slowdown (2012–2015) constrained
growth. In 2018 and 2019, the share of
intra-Commonwealth trade remained
steady at around 18 per cent.
Commonwealth developing countries
drive intra-Commonwealth trade flows.
Over time, the developing countries’
export share increased (from 60 per
cent in 2005 to 67 per cent in 2019),
while their exports almost doubled
in value terms, going from US$204
billion to more than $450 billion in the
same period.8 This shift owes largely
to the greater expansion of trade
by Asian member countries, which
increased their intra-Commonwealth
share to almost 53 per cent in 2019.
Overall, reflecting the global pattern,
only a few large economies drive
intra-Commonwealth trade. The UK
alone accounted for around 40 per
cent of the share of the developed
economies in 2019. The UK also
led services exports (46 per cent),
while Australia had the largest
share of merchandise trade (39 per
cent). Among developing countries,
Singapore, India and Malaysia
together accounted for 93 per cent of
exports of goods as well as services
for Asian members (Annex 1.1).
Intra-Commonwealth trade has
evolved as member countries
deepen existing trade linkages or
diversify their trading partners within
or outside the Commonwealth.
Between 2005 and 2019, 24 member
countries considerably increased
their share of intra-Commonwealth
trade, including several small
states (Annex 1.4). For instance,
over this period, the share of intra-
Commonwealth trade in Vanuatu’s
exports rose from 15 per cent to
around 50 per cent, trading largely
with Australia, New Zealand, Singapore,
Fiji and Malaysia. Other members
successfully diversified their trading
partners, resulting in lower shares
of intra-Commonwealth trade.
Goods Value (US$ million)
%Services Value
(US$ million)%
Commonwealth 433,892 65 238,755 35
By development
Developed 125,026 57 93,587 43
Developing 308,866 68 145,168 32
By region
Africa 75,815 85 13,539 15
Asia 225,386 64 127,067 36
Caribbean and Americas 29,317 65 15,514 35
Caribbean SIDS 2,737 43 3,559 57
Europe 39,108 43 51,360 57
Pacific 64,266 67 31,275 33
Pacific SIDS 4,927 83 1,003 17
Note: The percentage share indicates the share of goods and services in the corresponding group.
Source: Commonwealth Secretariat (calculated using UNCTADstat and OECD-WTO BaTIS datasets)
TA B L E 1 . 3S H A R E O F G O O DS A N D S E R V I C ES I N I N T RA- CO M M O N W E A LT H E X P O RTS, 2 0 1 9
5016_Book.indb 14 17-06-2021 08:32:08
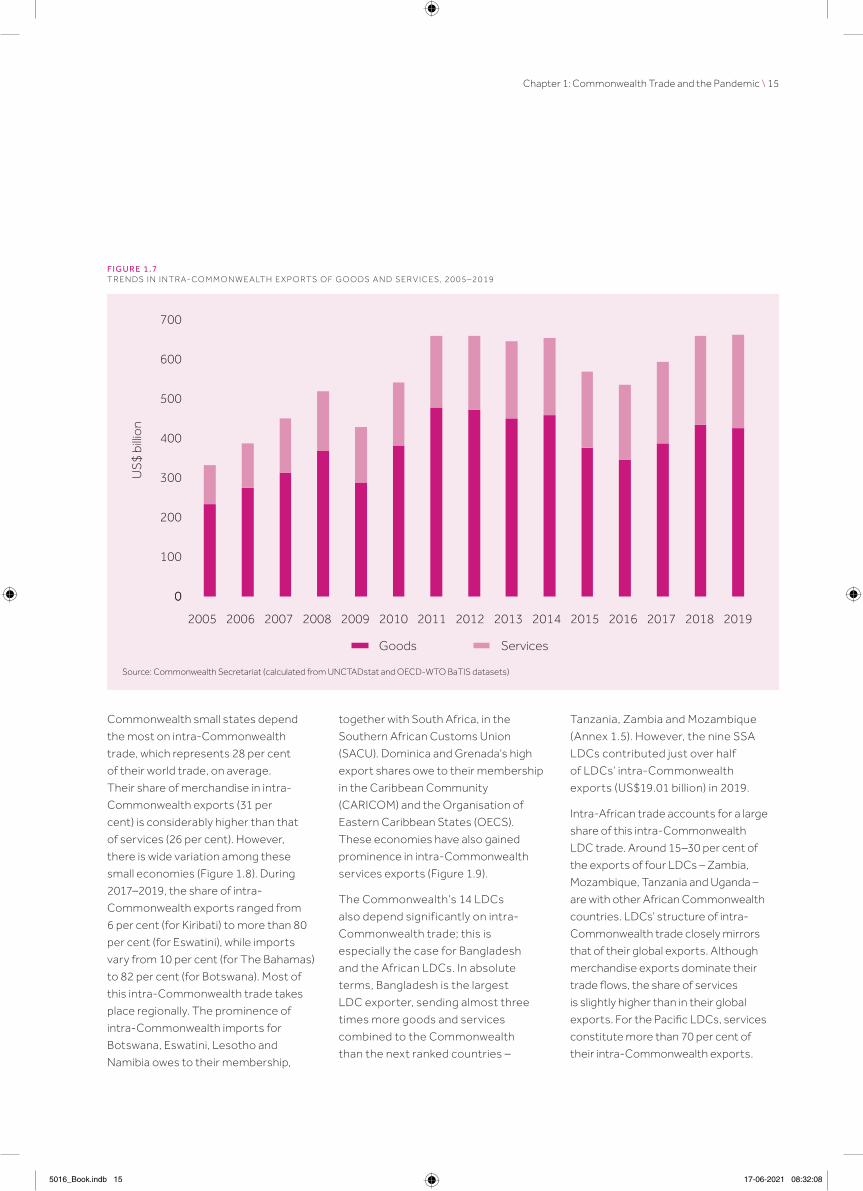
Chapter 1: Commonwealth Trade and the Pandemic \ 15
Commonwealth small states depend
the most on intra-Commonwealth
trade, which represents 28 per cent
of their world trade, on average.
Their share of merchandise in intra-
Commonwealth exports (31 per
cent) is considerably higher than that
of services (26 per cent). However,
there is wide variation among these
small economies (Figure 1.8). During
2017–2019, the share of intra-
Commonwealth exports ranged from
6 per cent (for Kiribati) to more than 80
per cent (for Eswatini), while imports
vary from 10 per cent (for The Bahamas)
to 82 per cent (for Botswana). Most of
this intra-Commonwealth trade takes
place regionally. The prominence of
intra-Commonwealth imports for
Botswana, Eswatini, Lesotho and
Namibia owes to their membership,
together with South Africa, in the
Southern African Customs Union
(SACU). Dominica and Grenada’s high
export shares owe to their membership
in the Caribbean Community
(CARICOM) and the Organisation of
Eastern Caribbean States (OECS).
These economies have also gained
prominence in intra-Commonwealth
services exports (Figure 1.9).
The Commonwealth’s 14 LDCs
also depend significantly on intra-
Commonwealth trade; this is
especially the case for Bangladesh
and the African LDCs. In absolute
terms, Bangladesh is the largest
LDC exporter, sending almost three
times more goods and services
combined to the Commonwealth
than the next ranked countries –
Tanzania, Zambia and Mozambique
(Annex 1.5). However, the nine SSA
LDCs contributed just over half
of LDCs’ intra-Commonwealth
exports (US$19.01 billion) in 2019.
Intra-African trade accounts for a large
share of this intra-Commonwealth
LDC trade. Around 15–30 per cent of
the exports of four LDCs – Zambia,
Mozambique, Tanzania and Uganda –
are with other African Commonwealth
countries. LDCs’ structure of intra-
Commonwealth trade closely mirrors
that of their global exports. Although
merchandise exports dominate their
trade flows, the share of services
is slightly higher than in their global
exports. For the Pacific LDCs, services
constitute more than 70 per cent of
their intra-Commonwealth exports.
US
$ bi
llion
0
100
200
300
400
500
600
2005 2006 2007 2008 2009 2010 2011 2012 2013 2014 2015 2016 2017 2018 2019
Goods Services
700
0
Source: Commonwealth Secretariat (calculated from UNCTADstat and OECD-WTO BaTIS datasets)
F I G U R E 1 . 7T R E N DS I N I N T RA- CO M M O N W E A LT H E X P O RTS O F G O O DS A N D S E R V I C ES, 2 0 0 5 – 2 0 1 9
5016_Book.indb 15 17-06-2021 08:32:08

16 \ Commonwealth Trade Review 2021
Botswana
Eswatini
Lesotho
Namibia
Tonga
Papua New Guinea
Nauru
Fiji
Samoa
Vanuatu
Kiribati
Tuvalu
Solomon Islands
Mozambique
Malawi
Zambia
Maldives
St Vincent*
Rwanda
Brunei Darussalam
Sri Lanka
Grenada
Uganda
Mauritius
Guyana
Barbados
Bangladesh
Tanzania
New Zealand
Dominica
Kenya
Sierra Leone
Seychelles
Saint Lucia
Antigua and Barbuda
South Africa
Ghana
Malaysia
Singapore
Malta
Australia
St Kitts and Nevis
The Gambia
Cameroon
India
Nigeria
Pakistan
Jamaica
Trinidad and Tobago
Belize
Cyprus
United Kingdom
Canada
The Bahamas
Eswatini
Dominica
Grenada
Tonga
Barbados
Mozambique
Guyana
Vanuatu
Fiji
St Kitts and Nevis
Tanzania
Papua New Guinea
Botswana
Namibia
Kenya
Antigua and Barbuda
Lesotho
Maldives
Saint Lucia
Nigeria
South Africa
Belize
Samoa
Brunei Darussalam
Ghana
The Gambia
New Zealand
Mauritius
Nauru
Seychelles
Malaysia
Malawi
Uganda
Sri Lanka
Zambia
St Vincent*
Singapore
Jamaica
India
Pakistan
Bangladesh
Australia
Rwanda
Trinidad and Tobago
The Bahamas
Cameroon
Malta
Cyprus
Solomon Islands
Sierra Leone
United Kingdom
Tuvalu
Kiribati
Canada
0 10 20 30 40 50 60 70 80 90
Imports share (%)
0 10 20 30 40 50 60 70 80 90
Exports share (%)
Source: Commonwealth Secretariat (calculated using UNCTADstat dataset)*St Vincent and the Grenadines due to space constraints
F I G U R E 1 . 8R E L AT I V E S I G N I F I CA N C E O F I N T RA- CO M M O N W E A LT H M E RC H A N D I S E T RA D E I N M E M B E R CO U N T R I ES ’ TOTA L T RA D E , 2 0 1 7 – 2 0 1 9 A V E RAG E
5016_Book.indb 16 17-06-2021 08:32:09

Chapter 1: Commonwealth Trade and the Pandemic \ 17
New Zealand
Fiji
Vanuatu
Samoa
Papua New Guinea
Kiribati
Bangladesh
Solomon Islands
Tuvalu
Tonga
Lesotho
Malaysia
Australia
St Vincent*
Malawi
Zambia
Maldives
Malta
Namibia
Seychelles
Mauritius
Eswatini
Sri Lanka
Grenada
Uganda
Mozambique
Kenya
Guyana
Tanzania
Saint Lucia
Cyprus
Ghana
Dominica
Brunei Darussalam
Botswana
Sierra Leone
St Kitts and Nevis
South Africa
The Gambia
Trinidad and Tobago
Rwanda
Nigeria
Barbados
India
Antigua and Barbuda
Belize
The Bahamas
Cameroon
Jamaica
Singapore
Pakistan
Canada
United Kingdom
New Zealand
Malaysia
Papua New Guinea
Eswatini
Fiji
Samoa
Zambia
Australia
Vanuatu
Seychelles
Mauritius
Saint Lucia
Guyana
Cyprus
Namibia
Bangladesh
Kenya
St Vincent*
Belize
South Africa
Ghana
Botswana
The Gambia
Malawi
Singapore
Brunei Darussalam
Malta
Sri Lanka
Barbados
Grenada
Solomon Islands
Lesotho
Dominica
Nigeria
India
Mozambique
Jamaica
Uganda
Trinidad and Tobago
Rwanda
Tanzania
Tonga
Antigua and Barbuda
Sierra Leone
Maldives
The Bahamas
Cameroon
Tuvalu
St Kitts and Nevis
Kiribati
Canada
Pakistan
United Kingdom
0 10 20 30 40 50
Imports share (%)
0 10 20 30 40 50
Exports share (%)
Source: Commonwealth Secretariat (calculated using WTO-OECD BaTIS dataset)*St Vincent and the Grenadines due to space constraints
F I G U R E 1 . 9R E L AT I V E S I G N I F I CA N C E O F I N T RA- CO M M O N W E A LT H S E R V I C ES E X P O RTS I N M E M B E R CO U N T R I ES ’ TOTA L S E R V I C ES E X P O RTS, 2 0 1 7 – 2 0 1 9 A V E RAG E
5016_Book.indb 17 17-06-2021 08:32:09

18 \ Commonwealth Trade Review 2021
1.3.2 Regional distribution of intra-Commonwealth trade
Intra-Commonwealth trade is highly
regional in nature, especially because of
the operations of regional production
networks and supply chains, which
COVID-19 has brought into greater
focus. Moreover, trade between
Commonwealth countries is found
to be more than three times higher
when they belong to an existing
trade agreement (Commonwealth
Secretariat, 2018a; see Chapter 4).
Five Commonwealth regions are used
to analyse intra-Commonwealth
trade – and investment (see Chapter
3) – flows: Africa, Asia, Caribbean and
Americas (Canada and the Caribbean
SIDS), Europe and the Pacific (Australia,
New Zealand and the Pacific SIDS).
Commonwealth Asia now
contributes more than half of intra-
Commonwealth trade. The share
of the Asian economies had risen
by 4 percentage points to 52.5 per
cent in 2019 (Figure 1.10). During
the same period (between 2010 and
2019), the shares of the African,
Caribbean, Pacific and European
members declined marginally,
although their exports did increase in
absolute terms. In the Pacific region,
Australia and New Zealand drive intra-
Commonwealth trade; Canada is the
leading exporter in the Caribbean
and Americas region. Though
Caribbean SIDS increased their
exports in value terms, their relative
share of intra-Commonwealth trade
declined from 1.1 per cent in 2010
to 0.9 per cent in 2019. The Pacific
SIDS, on the other hand, registered a
marginal increase both in value and in
relative terms. This reflects the large
trade orientation of Pacific islands
towards Australia and New Zealand.
In Commonwealth Africa, more than
75 per cent of exports originated in
three members: South Africa, Nigeria
and Ghana. South Africa is the largest
intra-Commonwealth exporter, for both
goods and services, accounting for 42
per cent of merchandise exports and 30
per cent of services exports. Thereafter,
Nigeria and Ghana are the two largest
merchandise exporters, while Ghana and
Kenya are the largest services exporters,
in that order (Figure 1.11). Rwanda is
also a prominent services exporter,
especially given its attraction as a tourist
destination, mainly for gorilla watching.
Looking specifically at the Caribbean
SIDS, three economies (Trinidad
and Tobago, Jamaica and The
Bahamas) accounted for 57 per
cent of the Caribbean SIDS’ intra-
Commonwealth exports in 2019.
Trinidad and Tobago accounted for
43 per cent of merchandise exports,
followed by Guyana and Jamaica;
Jamaica, The Bahamas and Barbados
are leading services traders.
Among the Pacific SIDS, two
economies (Papua New Guinea and
Fiji) accounted for 93 per cent of the
Pacific islands’ intra-Commonwealth
exports in 2019. The trade distribution
is very much concentrated: Papua
New Guinea alone accounted for 90
per cent of merchandise exports
while Fiji accounted for around 60
per cent of services exports.
1.3.3 Structure and composition of intra-Commonwealth trade
Intra-Commonwealth merchandise trade
Amid a global trade contraction,
the value of intra-Commonwealth
merchandise trade in 2019
dropped to US$433 billion, a loss
of $8 billion on 2018. The abrupt
recessions caused by COVID-19
in several large Commonwealth
traders, including India, Singapore,
South Africa and the UK, further
dampened trade growth in 2020.
Similar to the pattern of Commonwealth
total trade, Asian countries continue
to drive intra-Commonwealth exports
and imports of goods, in absolute
terms (Figure 1.12). Three countries,
Singapore, India and Malaysia, are
the largest merchandise exporters,
accounting for half of total exports in
2019. India and Singapore are also the
largest importers. This pattern has
remained largely consistent over time.
Among Commonwealth developed
countries, the UK was the fifth-largest
exporter and the third-largest importer
while Canada was the seventh-largest
exporter and the sixth-largest importer
in 2019. This owes to the significant
regional trade of these economies –
namely, the UK with the EU and
Canada with the USA and Mexico.
Two sectors contributed almost half
of intra-Commonwealth merchandise
exports: manufactured goods (US$250
billion, or almost 60 per cent) and
commodities comprising minerals
and fuels ($99.5 billion, or 23 per cent)
(Figure 1.13). The preponderance of
manufacturing in the overall goods
exports of Commonwealth Europe (86
per cent) and Asia (67 per cent) suggests
these countries were relatively more
exposed to COVID-19-related demand
and supply disruptions to this sector and
trade. Commonwealth Africa, where
non-manufactured goods comprise
around 60 per cent of merchandise
exports, was more vulnerable to volatility
in commodity prices, which affected
5016_Book.indb 18 17-06-2021 08:32:09

Chapter 1: Commonwealth Trade and the Pandemic \ 19
the revenues of several commodity-
dependent countries (see Box 1.6).
Intra-Commonwealth services trade
Services trade is an important
component of Commonwealth
countries’ exports, as noted earlier in
this chapter. Intra-Commonwealth
services exports are growing
rapidly, having more than doubled
from around US$98 billion in
2005 to $238 billion in 2019.
Developing countries are the leading
services suppliers, accounting for around
60 per cent of intra-Commonwealth
exports in 2019. Services exports
by Asian countries, especially India,
Singapore and Malaysia, have become
more significant in recent years.
In 2019, Singapore was the largest
intra-Commonwealth services exporter
while India was the largest services
importer (Figure 1.14). Almost all the
developed countries are ranked in the
top 10 intra-Commonwealth services
traders. The UK is the second-largest
exporter and the third-largest importer
of services, followed by Australia, which
is the fourth-largest importer and
exporter. Of the African members, only
South Africa and Nigeria rank among
the top 10 services economies.
In 2019, around 53 per cent of intra-
Commonwealth services exports
US
$ bi
llion
0
50
100
150
250
200
350
300
400
Africa PacificEuropeCaribbean and AmericasAsia
2010 2019
13.9%13.3%
7.3%6.7%
14.8%13.4% 15.5%
14.2%
48.5%
52.4%
US
$ m
illio
n
0
2
4
6
8
EXPORTS SHARE OF SIDS
Pacific SIDSCaribbean SIDS
1.07% 0.94%
0.76%
0.88%
Source: Commonwealth Secretariat (calculated using UNCTADstat and WTO-OECD BaTIS datasets)
F I G U R E 1 . 1 0R EG I O N A L D I ST R I B U T I O N O F I N T RA- CO M M O N W E A LT H T RA D E , 2 0 1 0 V S . 2 0 1 9
5016_Book.indb 19 17-06-2021 08:32:09

20 \ Commonwealth Trade Review 2021
GOODS AND SERVICES GOODS SERVICES
37%United Kingdom
33%Australia
18%Canada
12%Rest of Developed Economies
39%Australia
31%United Kingdom
21%Canada
9%Rest of Developed Economies
46%United Kingdom
25%Australia
13%Canada
16%Rest of Developed
Economies
40%South Africa
27%Nigeria
8%Ghana
25%Rest of Africa
39%Singapore
32%India
22%Malaysia
7%Rest of Asia
22%Trinidad and Tobago
21%Jamaica
14%The Bahamas
43%Rest of Caribbean SIDS
76%Papua New Guinea
17%Fiji
3%Vanuatu
4%Rest of Pacific SIDS
37%Singapore
28%India
27%Malaysia
8%Rest of Asia
43%Singapore
39%India
14%Malaysia
4%Rest of Asia
42%South Africa
30%Nigeria
6%Ghana
22%Rest of Africa
30%South Africa
17%Ghana
11%Kenya
42%Rest of Africa
43%Trinidad and Tobago
25%Guyana
12%Jamaica
20%Rest of Caribbean SIDS
28%Jamaica
23%The Bahamas
10%Barbados
39%Rest of Caribbean SIDS
89%Papua New Guinea
9%Solomon Islands
1%Fiji
1%Rest of Pacific SIDS
58%Fiji
15%Vanuatu
11%Papua New Guinea
16%Rest of Pacific SIDS
DEV
ELO
PED
EC
ON
OM
IES
AS
IAC
AR
IBB
EAN
SID
SPA
CIF
IC S
IDS
AFR
ICA
Source: Commonwealth Secretariat (calculated using UNCTADstat and WTO-OECD BaTIS datasets)
F I G U R E 1 . 1 1S H A R E O F G O O DS A N D S E R V I C ES E X P O RTS F O R L E A D I N G E X P O RT E RS, B Y R EG I O N , 2 0 1 9
5016_Book.indb 20 17-06-2021 08:32:09

Chapter 1: Commonwealth Trade and the Pandemic \ 21
0 2 4 6 8 10 12 14 16 18 20
19
15
14
11
9
7
6
5
2
2
EXPORTS
Share (%)
Singapore
India
Malaysia
Australia
United Kingdom
South Africa
Canada
Nigeria
New Zealand
Bangladesh
17
16
15
9
9
6
4
4
3
2
IMPORTS
India
Singapore
United Kingdom
Malaysia
Australia
Canada
South Africa
Bangladesh
New Zealand
Nigeria
Exports Imports
0 2 4 6 8 10 12 14 16 18 20
Share (%)
Source: Commonwealth Secretariat (calculated using UNCTADstat dataset)
F I G U R E 1 . 1 2S H A R ES O F L A RG E I N T RA- CO M M O N W E A LT H M E RC H A N D I S E T RA D E RS, 2 0 1 9
5016_Book.indb 21 17-06-2021 08:32:09

22 \ Commonwealth Trade Review 2021
originated from Asia, followed by 22 per
cent from the three European members.
The share of the Pacific members,
although relatively smaller, is higher
than the combined share of African and
Caribbean members (Figure 1.15).
The sectoral composition of intra-
Commonwealth services trade displays
significant vulnerabilities to a shock
like COVID-19. Travel is the largest
category, accounting for almost 30
per cent of services exports – and
this is larger than the corresponding
global share (21 per cent), as discussed
earlier. The share of transport services
(16 per cent) and ICT services (13
per cent) combined is around 30
per cent. Although many services
sectors, such as education, financial
services and health, have adapted
by delivering more online, communal
services such as events and hospitality
require in-person interaction.
The growth of intra-Commonwealth
services exports has been marginally
higher than the global growth rate
for this sector. During 2005–2019,
intra-Commonwealth services
exports grew at around 6.88 per cent
per annum while the growth rate
of world services trade was around
6.38 per cent (Figure 1.16). The
growth rate of intra-Commonwealth
services exports in this period was
also slightly higher than the same
for Commonwealth countries’
global exports (6.45 per cent). This
is driven partly by the increase in
exports of services by developing
economies, especially Singapore and
Malaysia, as well as the effect of the
Commonwealth advantage in driving
trade in services. This servicification
trend is observed in both developed
and developing countries (Box 1.2).
All Commonwealth
Africa
Asia
Caribbean and Americas
Europe
Pacific
Share (%)
0 10 20 30 40 50 60 70 80 90 100
Agriculture Manufactures Minerals and fuels Other commodities
10
13
8
11
22
8
17
11
57
40
67
42
32
86
32
26
23
42
23
8
28
4
20
19
9
5
2
39
17
2
31
45
Caribbean SIDS
Pacific SIDS
Note: “Other commodities” includes gold and coins (non-monetary).Source: Commonwealth Secretariat (calculated using UNCTADstat dataset)
F I G U R E 1 . 1 3I N T RA- CO M M O N W E A LT H M E RC H A N D I S E E X P O RTS B Y S ECTO R A N D R EG I O N , 2 0 1 9
5016_Book.indb 22 17-06-2021 08:32:10

Chapter 1: Commonwealth Trade and the Pandemic \ 23
0 2 4 6 8 10 12 14 16 18 242220
0 2 4 6 8 10 12 14 16 18 242220
Exports Imports
23.0
20.9
18.0
9.7
7.2
5.0
3.0
1.8
1.7
1.7
EXPORTS
Share (%)
Singapore
India
United Kingdom
Australia
Malaysia
Canada
New Zealand
Malta
South Africa
Cyprus
17.9
17.7
15.8
11.8
7.2
7.1
4.1
3.7
1.9
1.8
IMPORTS
Share (%)
India
United Kingdom
Singapore
Australia
Canada
Maldives
Nigeria
New Zealand
Malta
Bangladesh
Source: Commonwealth Secretariat (calculated using OECD-BaTIS dataset)
F I G U R E 1 . 1 4CO U N T RY S H A R ES O F I N T RA- CO M M O N W E A LT H S E R V I C ES E X P O RTS A N D I M P O RTS, 2 0 1 9
5016_Book.indb 23 17-06-2021 08:32:10

24 \ Commonwealth Trade Review 2021
and information services
and information services
and information services
BY REGION BY SECTOR
53%Asia
22%Europe
13%Pacific SIDS
6%Africa
6%Caribbean and Americas
27%Travel
23%Other business services
16%Transport
13%Telecommunications, computer
9%Financial services
4%Insurance and pension services
8%Others
DEVELOPED ECONOMIES DEVELOPING ECONOMIES
25%Other business services
24%Travel
19%Transport
16%Telecommunications, computer
8%Financial services
3%Insurance and pension services
1%Construction
4%Others
33%Travel
21%Other business services
12%Transport
10%Financial services
7%Telecommunications, computer
5%Insurance and pension services
12%Others
Source: Commonwealth Secretariat (estimated using WTO-OECD BaTIS dataset)
F I G U R E 1 . 1 5R EG I O N A L A N D S ECTO RA L D I ST R I B U T I O N O F I N T RA- CO M M O N W E A LT H S E R V I C ES E X P O RTS, 2 0 1 9
5016_Book.indb 24 17-06-2021 08:32:10

Chapter 1: Commonwealth Trade and the Pandemic \ 25
The sectoral composition of intra-Commonwealth services trade displays significant vulnerabilities to a shock like COVID-19. Travel is the largest category, accounting for almost 30 per cent of services exports.
7.1
6.9
6.7
6.56.45
6.88
6.3
5.9
5.7
5.5
5.3
5.1
Gro
wth
rate
(%)
CW-World
World average
Intra-Commonwealth
Source: Commonwealth Secretariat (estimated using WTO-OECD BaTIS dataset)
F I G U R E 1 . 1 6G RO W T H RAT E O F I N T RA- CO M M O N W E A LT H S E R V I C ES E X P O RTS, 2 0 0 5 – 2 0 1 9 A V E RAG E
5016_Book.indb 25 17-06-2021 08:32:10
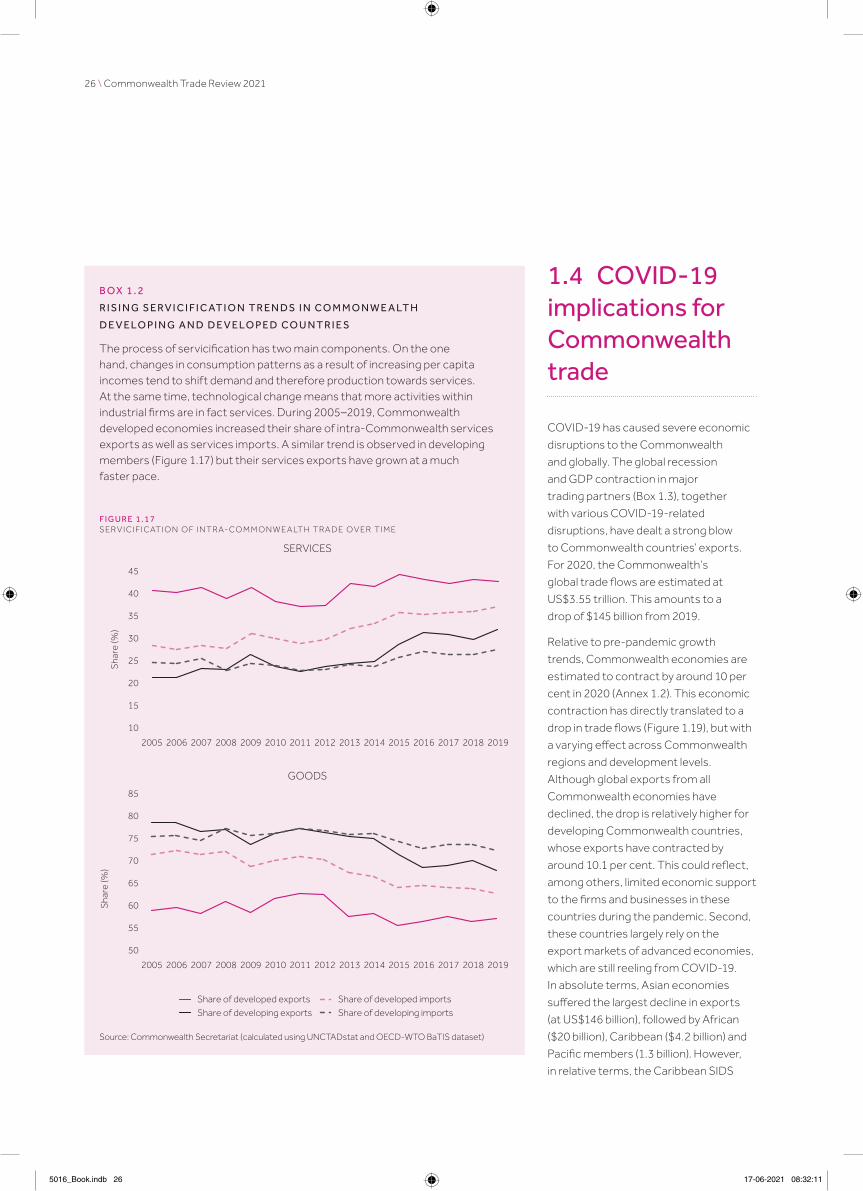
26 \ Commonwealth Trade Review 2021
1.4 COVID-19 implications for Commonwealth trade
COVID-19 has caused severe economic
disruptions to the Commonwealth
and globally. The global recession
and GDP contraction in major
trading partners (Box 1.3), together
with various COVID-19-related
disruptions, have dealt a strong blow
to Commonwealth countries’ exports.
For 2020, the Commonwealth’s
global trade flows are estimated at
US$3.55 trillion. This amounts to a
drop of $145 billion from 2019.
Relative to pre-pandemic growth
trends, Commonwealth economies are
estimated to contract by around 10 per
cent in 2020 (Annex 1.2). This economic
contraction has directly translated to a
drop in trade flows (Figure 1.19), but with
a varying effect across Commonwealth
regions and development levels.
Although global exports from all
Commonwealth economies have
declined, the drop is relatively higher for
developing Commonwealth countries,
whose exports have contracted by
around 10.1 per cent. This could reflect,
among others, limited economic support
to the firms and businesses in these
countries during the pandemic. Second,
these countries largely rely on the
export markets of advanced economies,
which are still reeling from COVID-19.
In absolute terms, Asian economies
suffered the largest decline in exports
(at US$146 billion), followed by African
($20 billion), Caribbean ($4.2 billion) and
Pacific members (1.3 billion). However,
in relative terms, the Caribbean SIDS
B O X 1 . 2
R I S I N G S E R V I C I F I C AT I O N T R E N D S I N C O M M O N W E A LT H
D E V E LO P I N G A N D D E V E LO P E D C O U N T R I E S
The process of servicification has two main components. On the one hand, changes in consumption patterns as a result of increasing per capita incomes tend to shift demand and therefore production towards services. At the same time, technological change means that more activities within industrial firms are in fact services. During 2005–2019, Commonwealth developed economies increased their share of intra-Commonwealth services exports as well as services imports. A similar trend is observed in developing members (Figure 1.17) but their services exports have grown at a much faster pace.
F I G U R E 1 . 1 7S E R V I C I F I CAT I O N O F I N T RA- CO M M O N W E A LT H T RA D E O V E R T I M E
Sha
re (%
)
10
15
20
25
30
35
40
45
2005 2006 2007 2008 2009 2010 2011 2012 2013 2014 2015 2016 2017 2018 2019
SERVICES
GOODS
50
55
60
65
70
75
80
85
2005 2006 2007 2008 2009 2010 2011 2012 2013 2014 2015 2016 2017 2018 2019
Share of developed exports Share of developed importsShare of developing exports Share of developing imports
Sha
re (%
)
Source: Commonwealth Secretariat (calculated using UNCTADstat and OECD-WTO BaTIS dataset)
5016_Book.indb 26 17-06-2021 08:32:11

Chapter 1: Commonwealth Trade and the Pandemic \ 27
underwent a greater slump. Their
global exports shrank by almost 20
per cent. These SIDS largely rely on
the exports of services, particularly
travel and tourism, which were hit hard
in this pandemic (see Chapter 5).
Intra-Commonwealth trade flows
are estimated at around US$641
billion in 2020. Compared with the
pre-pandemic projection ($701
billion), this suggests an export
loss of $60 billion in a single year.
B O X 1 . 3
C O V I D -19 A N D EC O N O M I C C O N T R A C T I O N S I N T H E C O M M O N W E A LT H ’ S L A R G E S T E X P O R T M A R K E T S
International trade is highly responsive to changes in market size. COVID-19 has constrained economic growth in the Commonwealth’s major export markets, adversely affecting demand for goods and services (Figure 1.18). Apart from China, where GDP expanded by 2.3 per cent, the other major destinations for Commonwealth exports recorded significant contractions in GDP in 2020. In India and Singapore, GDP declined by more than 5 per cent. In the USA, which absorbs 31 per cent of developed members’ goods and services exports and 12 per cent of those from developing members, GDP contracted by 3.5 per cent. The EU, which collectively represents the second-largest market for Commonwealth exports, contracted by 6.6 per cent. Within the EU-27, growth in the three top destinations for Commonwealth exports – Germany, France and the Netherlands – fell by 4.9 per cent, 8.2 per cent and 3.7 per cent, respectively. Similarly, the GDP of the UK, a key destination for intra-Commonwealth exports (see Chapter 5), contracted by around 9.9 per cent.
These markets collectively absorb around 75 per cent of Commonwealth developed members’ exports and around half from developing countries. Most of these economies are still under varying degrees of lockdown. The protracted pandemic, coupled with an on-going deep recession, not only has adversely affected short-term export demand but also portends serious challenges for a quick trade recovery in both Commonwealth developed and developing countries in 2021. Aside from these direct implications for trade in goods and services, a reduction in growth in these major economies could have several indirect knock-on effects for Commonwealth developing members, including through reduced Aid for Trade and other official development assistance to LDCs and highly vulnerable small states.
0 10 20 30 5040 60 70 10080 90
PRE-COVID-19 EXPORT SHARE, BY MARKET (%)
Share (%)
-10.0 -5.0 0 10.05.0 15.0
GDP IMPACT FOR LARGE EXPORT MARKETS
GDP growth rate (%)
Dev
elo
ped
eco
nom
ies
Dev
elo
ping
eco
nom
ies
US
A
EU28
Chi
na
Japa
n
Indi
aR
est o
f Wo
rld
31 27 11 4 2 25
US
A
EU28
Chi
na
Japa
n
Sin
gapo
re
Res
t of W
orld
1219 15 4 4 47
USA
UK
Singapore
Japan
India
Euro area
China
2020 – actual 2020 pre-COVID forecast
Note: The left panel reflects combined share of goods and services. EU-28 includes the UK because it was an EU member until 31 January 2020. China and Hong Kong are aggregated in the left panel.Source: Commonwealth Secretariat (calculated using UNCTADstat and WTO-OECD BaTIS datasets and data from the IMF and World Bank Outlook)
F I G U R E 1 . 1 8CO M M O N W E A LT H M A R K ET S H A R E A N D G D P D RO P F O R L A RG E E X P O RT M A R K ETS ( % )
5016_Book.indb 27 17-06-2021 08:32:11

28 \ Commonwealth Trade Review 2021
The pandemic has affected the
intra-Commonwealth exports of
all regions (Table 1.4). However, in
absolute terms, Asian economies
have suffered the biggest decline in
exports (at $36 billion), followed by
African ($6.5 billion), Caribbean ($
4.2 billion) and Pacific members ($5
billion). Among these groupings, the
Caribbean SIDS are the most affected
in relative terms, with their intra-
Commonwealth exports shrinking by
almost 16 per cent in 2020. All leading
intra-Commonwealth exporters
have been affected (Figure 1.20).
By
deve
lopm
ent
By
regi
on
Global eports GDP
0.0
Commonwealth
Developed
Developing
Africa
Asia
Caribbean SIDS
Pacific SIDS
-2.0-4.0-6.0-8.0-10.0-12.0-14.0-16.0-18.0
-9.7 -10.1
-9.3 -10.1
-10.1 -11.3
-7.2 -6.5
-10.5 -12.8
-16.8 -16.4
-9.4 -9.4
Note: Calculated as the difference between pre-COVID (October 2019) and in-COVID (April 2021) estimates of the IMF. The GDP estimates are used to compute trade flows at country and regional levels.Source: Commonwealth Secretariat (calculated using UNCTADstat and WDI datasets and IMF and World Bank data)
F I G U R E 1 . 1 9I M P ACT O F T H E CO V I D - 1 9 P A N D E M I C O N CO M M O N W E A LT H CO U N T R I ES ’ G LO B A L E X P O RTS I N 2 0 2 0
TA B L E 1 . 4R EG I O N A L V A R I AT I O N I N CO V I D - 1 9 I M P ACT O N I N T RA- CO M M O N W E A LT H T RA D E ( U S $ M I L L I O N ) , 2 0 1 9 V S . 2 0 2 0
2019 2020 (Pre- and in-COVID)
Forecast Actual
Commonwealth 672,647 701,248 641,316
By development
Developed 218,613 234,420 216,220
Developing 454,034 466,737 425,096
By region
Africa 89,354 99,395 92,797
Asia 352,452 357,915 321,330
Caribbean and Americas 44,831 50,746 46,594
Caribbean SIDS 6,296 6,715 5,662
Europe 90,468 96,644 86,017
Pacific 95,541 99,548 94,577
Pacific SIDS 5,931 5,803 5,306
Note: Calculated as the difference between pre-COVID (October 2019) and in-COVID (January 2020) estimates of the IMF and World Bank. The GDP estimates for 2020 are used to compute trade flows at country and regional levels.Source: Commonwealth Secretariat (calculated using UNCTADstat and WDI datasets and IMF and World Bank data)
5016_Book.indb 28 17-06-2021 08:32:11
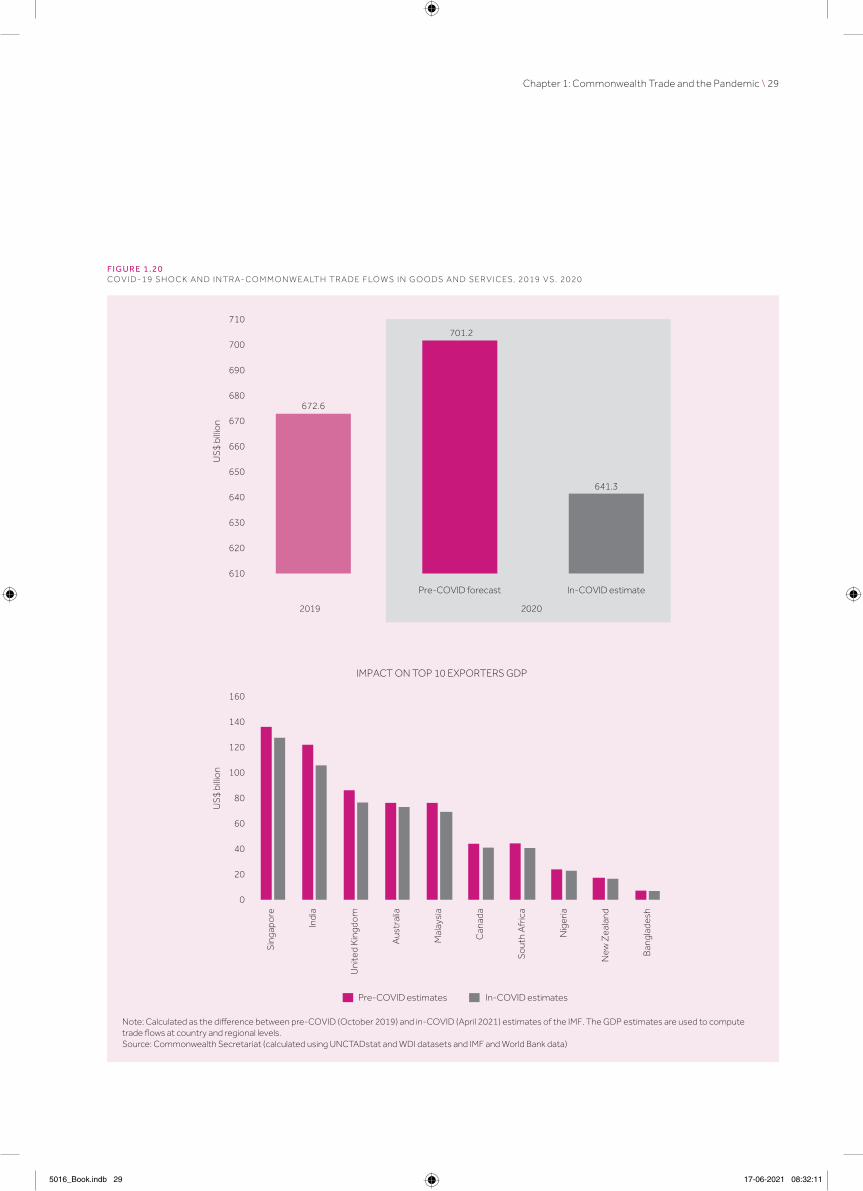
Chapter 1: Commonwealth Trade and the Pandemic \ 29
US
$ bi
llion
610
620
630
640
660
650
680
670
690
700
710
IMPACT ON TOP 10 EXPORTERS GDP
US
$ bi
llion
0
20
40
60
100
80
140
120
160
In-COVID estimatePre-COVID forecast
2019 2020
672.6
701.2
641.3
Sin
gapo
re
Indi
a
Uni
ted
Kin
gdo
m
Aus
tral
ia
Mal
aysi
a
Can
ada
So
uth
Afr
ica
Nig
eria
New
Zea
land
Ban
glad
esh
Pre-COVID estimates In-COVID estimates
Note: Calculated as the difference between pre-COVID (October 2019) and in-COVID (April 2021) estimates of the IMF. The GDP estimates are used to compute trade flows at country and regional levels.Source: Commonwealth Secretariat (calculated using UNCTADstat and WDI datasets and IMF and World Bank data)
F I G U R E 1 . 2 0CO V I D - 1 9 S H O C K A N D I N T RA- CO M M O N W E A LT H T RA D E F LO W S I N G O O DS A N D S E R V I C ES, 2 0 1 9 V S . 2 0 2 0
5016_Book.indb 29 17-06-2021 08:32:11

30 \ Commonwealth Trade Review 2021
1.4.1 COVID-19 and goods trade
With two-thirds of the Commonwealth’s
global and intra-Commonwealth trade
being in manufactured goods and
commodities, many member countries,
especially developing countries, have
been hit hard by the real economy
consequences of COVID-19.
The pandemic has adversely affected
the global and intra-Commonwealth
merchandise exports of member
countries since early January 2020,
immediately after the outbreak of the
coronavirus in China in December 2019.
However, the greatest effect occurred
during April and May 2020, when many
large export markets in Europe and the
USA imposed lockdowns. In these two
months, exports of Commonwealth
members dropped to almost half
compared with the baseline (Figure 1.21).
The impact was relatively higher for
intra-Commonwealth exports compared
with global exports as many of the
large intra-Commonwealth traders –
including India, Singapore, South Africa
and the UK – experienced an economic
contraction, affecting the supply and
demand of their merchandise (see Box
1.4). Exports plateaued in May 2020
but rebounded in June 2020 as firms
sought to adapt to the containment
measures. Merchandise exports are
gradually recovering as lockdowns and
restrictions on economic activities are
lifted in many countries. However, in
December 2020, the Commonwealth’s
exports were still well below the pre-
pandemic level in December 2019.
The drop in Commonwealth countries’
exports has strong linkages with
the incidence of the virus (see Box
1.4). Countries with high numbers of
infections (and deaths) and with strict
lockdowns have also experienced
a large decline in trade flows.
COVID-19 has impacted goods
trade through both supply and
demand shocks. Quarantines,
lockdowns, social distancing and
high levels of uncertainty have led
to a significant drop in demand for
goods and services, with GVCs
transmitting the economic shock to
upstream supplier countries (Escaith
and Khorana, 2021). For example,
reduced consumer demand and
supply shocks have hit garment
manufacturers and workers in
the Commonwealth, especially in
Bangladesh and Lesotho (Box 1.5).
Commodities constitute around one-
third of world merchandise exports
and approximately 20 per cent of these
exports originate from Commonwealth
countries. Commodities are also a key
component of the Commonwealth’s
overall merchandise exports, accounting
for 45 per cent of these exports (higher
than the world average of 33 per
cent). Many developed and developing
Commonwealth countries are heavily
dependent on commodities exports – 31
members derive more than 80 per cent
of their merchandise export earnings
from primary commodities. The shares
of commodities in the exports of New
Zealand and Australia are above 70
per cent; they are even higher for the
Pacific SIDS (97 per cent) and SSA
countries (79 per cent). COVID-related
restrictions have led to a sharp decline in
commodity prices, adversely affecting
the exports of many developed and
developing countries (Box 1.6).
1.4.2 COVID-19 and services trade
Services account for at least half of
total economic activity in terms of GDP
in Commonwealth members. Levels
0.3
0.4
0.5
0.6
0.8
Inde
x (D
ec 2
019
= 1)
0.7
1.0
0.9
1.1
Dec 2019
Jan Feb Mar Apr May Jun Jul Aug Sept Oct Nov Dec 2020
Global Intra-CW
Note: Exports are indexed to 1 in December 2019. As a result of data reporting delays in LDCs and small states, the chart contains information for only 25 Commonwealth countries.Source: Commonwealth Secretariat (calculated using ITC data)
F I G U R E 1 . 2 1I M P ACT O F T H E P A N D E M I C O N CO M M O N W E A LT H M E RC H A N D I S E E X P O RTS, D EC E M B E R 2 0 1 9 TO D EC E M B E R 2 0 2 0
5016_Book.indb 30 17-06-2021 08:32:12

Chapter 1: Commonwealth Trade and the Pandemic \ 31
are particularly high in high-income
countries but also in some SIDS, where
activities like tourism and finance – both
services – are important in the overall
economy (Shepherd and Shingal, 2021).
The pandemic has had significant
impacts on the services sector.
While all Commonwealth countries
have been subject to shocks related
to COVID-19, extents and recovery
paths have varied substantially (Box 1.7).
Services exports contribute 35 per
cent of intra-Commonwealth trade,
which is significantly higher than the
share of services in world trade (25
per cent). Commonwealth members
with large tourism and travel sectors,
especially the 25 SIDS, have been
hard hit, as the global tourist economy
has contracted substantially.
This has adversely affected women
workers (Box 1.8). As employment for
B O X 1 . 4
L I N K A G E S B E T W E E N C O V I D -19 I N F EC T I O N S A N D M E R C H A N D I S E E X P O R T S I N T H E C O M M O N W E A LT H
In a study for the Commonwealth Secretariat, Khorana and Martínez-Zarzoso (2021) estimate a gravity model on monthly trade flow data to explore the effect of incidence of COVID-19 on Commonwealth members’ global and intra-Commonwealth merchandise exports. The results provide strong evidence of a correlation between the Commonwealth’s exports and the number of infections, deaths and stringency of lockdowns9 in source and destination markets. A 10 per cent increase in the number of COVID-19 infections in the exporting country decreases exports by 0.33 per cent. The corresponding effect for the number of deaths is slightly lower (0.028 per cent) but that for the stringency index is higher, at about 0.4 per cent. The drop reflects interruptions in production and exporting activities in the short term at the onset of the pandemic (Table 1.5).
The estimated trade decline for five Commonwealth countries – Canada, India, Pakistan, South Africa and the UK – is very high (above 10 per cent). These five economies account for around 60 per cent of the Commonwealth’s global exports and 40 per cent of intra-Commonwealth exports. The relatively high incidence of COVID-19 in these countries, in terms of numbers of infections and deaths, directly explains a larger decline in the Commonwealth’s trade flows. By contrast, the Pacific SIDS have largely been shielded from the health effects of COVID-19. Moreover, these economies have relatively lesser proportions of merchandise in their exports, which is reflected in a relatively small drop in their goods trade (less than 5 per cent).
These regression results are robust to alternative estimation approaches (Pseudo Poisson Maximum Likelihood, PPML, and Ordinary Least Squares, OLS), using monthly lagged data (to account for simultaneity bias), and to the inclusion of a rigorous set of exporter and importer fixed effects to account for omitted variables and multilateral resistance. They also hold when the gravity variables – namely, distance, free trade agreement (FTA), common language and common border – are replaced by bilateral fixed effects. The projections of trade trends in the short term present a negative change in exports for all countries, raising the need for policy interventions and support to increase the resilience of supply chains.
% decrease in exports Commonwealth members Share of CW trade Share of Intra-CW trade
10+ Canada, India, Pakistan, South Africa, United Kingdom 56.91 40.83
7–10 Australia, Bangladesh, Cameroon, Ghana, Jamaica, Kenya, Nigeria, Singapore, Zambia
29.87 38.44
5–7 The Bahamas, Belize, Botswana, Cyprus, Eswatini, The Gambia, Guyana, Malawi, Malaysia, Malta, Mozambique, Namibia, New Zealand, Rwanda, Sierra Leone, Sri Lanka, Trinidad and Tobago, Uganda
11.87 18.37
0–5 Antigua and Barbuda, Barbados, Brunei Darussalem, Dominica, Fiji, Kiribati, Lesotho, Mauritius, Nauru, Papua New Guinea, Samoa, Seychelles, Tanzania, Tonga, Tuvalu, Vanuatu
1.16 2.12
Source: Commonwealth Secretariat (calculated using data from UNCTADstat dataset and estimates from Khorana and Martínez-Zarzoso (2021))
TA B L E 1 . 5M O D E L L I N G R ES U LTS: CO V I D - 1 9 E F F ECT O N CO M M O N W E A LT H CO U N T R I ES ’ M E RC H A N D I S E E X P O RTS ( % D EC R E AS E )
5016_Book.indb 31 17-06-2021 08:32:12

32 \ Commonwealth Trade Review 2021
women increases globally, there has also
been a corresponding shift into service
sectors. An estimated 43 per cent of
women across the Commonwealth
were employed in the services sector
in 2019, up from 30 per cent in 2000.
In developed countries, over 90 per
cent of women work in the services
sector, an increase of 5 percentage
points from 2000. In developing
countries, 36 per cent of employed
women work in services sectors, an
increase of 16 percentage points since
2000. New trends in global trade,
particularly the rise in services, GVCs
and the digital economy, now offer more
economic opportunities to women.
Transport and travel constitute around
half of intra-Commonwealth services
exports. Air travel has been significantly
affected by border closures and
international travel restrictions. The
International Air Transport Association
has projected US$126 billion in losses
for 2020, marking the worst annual
financial result in aviation history,
with smaller losses of $47.7 billion in
2021 (IATA, 2021). Airlines of several
Commonwealth countries, including
Antigua and Barbuda, Australia, Canada,
India, Namibia, South Africa and the UK,
have entered bankruptcy protection/
administration or been liquidated since
the start of the pandemic. Some of
the bigger airlines are expected to
survive following restructurings and
a rebound in demand. Aside from the
direct effects on intra-Commonwealth
travel and tourism-related services
exports, the collapse in global aviation
also impacted some goods trade,
especially passenger-based air
B O X 1 . 5
C O V I D -19 H I T S G A R M E N T S M A N U FA C T U R I N G I N T H E C O M M O N W E A LT H
Global garment supply chains are highly integrated, making them extremely susceptible to the disruptions to trade and the movement of goods and persons caused by COVID-19. In the early stages of the pandemic, lockdowns in China resulted in severe delays to Chinese exports of raw materials (including fabric), with significant impacts on production for garment manufacturers in Bangladesh and other garment-producing Commonwealth countries that rely heavily on imported inputs. Across the Asia-Pacific region, garment manufactures have faced disruptions to up to 60 per cent of their supplies of imported inputs (ILO, 2020).
Lockdowns and mandatory closures of clothing retail stores in Europe, the USA and the world led to a sharp fall in consumer demand. This had a severe impact on garment manufacturing industries in Bangladesh, Lesotho and other Commonwealth countries that supply large quantities of garments to these markets. In the first half of 2020, garment-producing countries across Asia saw their exports to major buying countries fall by up to 70 per cent (ILO, 2020).
Some suppliers were hit with large-scale cancellation or postponement of production orders, often retrospectively in cases where orders were already in process or on the verge of completion.10 Many manufacturers also suffered delays to payments for completed orders, with buyers invoking “force majeure” clauses in their contracts. The direct health effects of COVID-19 have also impacted the availability of workers, dealing a further blow to production capacity in garment-producing Commonwealth countries.
The adverse impacts on the industry have major implications for garment sector workers, particularly women, who comprise most factory workers in key Commonwealth garment manufacturing countries (including Bangladesh, India, Lesotho, Pakistan and Sri Lanka). Many workers were already paid low wages and had poor job security and weak social safety nets even before the pandemic, and these vulnerabilities have been exacerbated.11 In addition, incomes decreased among many workers who had retained their jobs, falling by 21 per cent, on average, between March and August 2020 compared with pre-pandemic levels (Worker Rights Consortium, 2020).
If these production constraints persist, there is a risk that clothing brands may shift their manufacturing away from some Commonwealth members in favour of other sourcing locations to mitigate supply chain risks (Teodoro and Rodriquez, 2020). This would feed into the wider structural shifts already underway in export-oriented apparel manufacturing GVCs, resulting in shorter value chains (see Chapter 3). As countries continue to battle to contain the spread of COVID-19, a wider garment sector recovery may be some way off, with a lag before garment production and demand for apparel returns to pre-pandemic levels. In the meantime, further support for garment manufacturers and workers will be necessary.
5016_Book.indb 32 17-06-2021 08:32:12

Chapter 1: Commonwealth Trade and the Pandemic \ 33
B O X 1 . 6
C O M M O D I T I E S E X P O R T S A N D C O V I D -19
Commonwealth countries’ main commodity exports are food products, mineral ores, metals and fuels. Among these, fuels are the largest exported item, constituting around 42 per cent of all commodities exports. This is followed by mineral ores (36 per cent) and agri-food products (22 per cent).
Around 55 per cent of these exports are destined for five markets: China, the USA, the EU-27, the UK and Australia. The COVID-19 pandemic has negatively affected demand for commodities in these key markets, leading to a collapse in commodity prices, particularly for fuels. Prices of other key commodities, such as agricultural products and mineral ores, have been relatively less affected. Nevertheless, the reduction in demand, along with challenges associated with production and exporting, led to an aggregate export loss of around US$125 billion for Commonwealth countries in 2020. This represents a decline of 24 per cent compared with the pre-pandemic trend. The Commonwealth’s commodity exports to the USA were hit the hardest (falling by $50 billion) followed by those to the EU-27 ($41 billion) and China ($26 billion); notably, in a diplomatic dispute since Canberra’s call for an international investigation into the origins of COVID-19, Australian imports have encountered difficulties entering the Chinese market, including timber, barley, beef and some types of coal (see Chapter 4). Exports to the UK were $400 million below the estimate for a “business-as-usual” situation.
In value terms, Commonwealth developed countries experienced a large drop in commodities exports, amounting to US$57 billion, driven mainly by a fall in exports from Australia (see above) and Canada. In absolute terms, Asian Commonwealth members were the second most affected group, closely followed by African members. However, in relative terms, Caribbean members were hit more severely. Their commodities exports dropped by 60 per cent compared with the historical average. This owed mainly to sharp declines in exports of crude and refined oil as well as of natural gases from Trinidad and Tobago and, to a lesser extent, exports of sugar and crustaceans from Belize, mainly to the EU-27. Overall, the Pacific region was the least affected.
The prices of most commodities surged in the second half of 2020, offsetting some of the trade losses in commodity-dependent economies (Figure 1.22). Resumption of transport activities is pushing up oil prices, which traded at US$66 per barrel in the first week of March 2021. Similarly, the on-going transition towards electric and hybrid vehicles is incentivising demand for minerals used to manufacture batteries and chips. There is the possibility of a new commodity super cycle, which could support a relatively fast recovery in commodities trade for Commonwealth countries (The Economist, 2021a).
0
20
40
60
100
80
140
120
160
180
Dec 2019
Jan Feb Mar Apr May Jun Jul Aug Sept Oct Nov Dec 2020
Inde
x (2
015
= 10
0)
Agricultural products Agricultural raw materials Minerals, ores and metals Fuels
Source: Commonwealth Secretariat (calulated using data from UNCTADstat dataset)
F I G U R E 1 . 2 2M O N T H LY V A R I AT I O N I N CO M M O D I T Y P R I C E I N D I C ES I N 2 0 2 0
5016_Book.indb 33 17-06-2021 08:32:12

34 \ Commonwealth Trade Review 2021
B O X 1 .7
D R O P I N S E R V I C E S E X P O R T S D U R I N G T H E C O V I D -19 PA N D E M I C
Analysis of monthly services exports for eight Commonwealth countries from January to December 2020 provides some indication of the immediate and direct effects of the COVID-19 pandemic on services trade. Most countries reporting high frequency data have seen major reductions to services exports starting from January 2020 when compared with the corresponding months during 2019. The extent of the decline is striking. Services exports from Tanzania and Uganda have collapsed by over 60 per cent while those of Australia and Kenya have dipped by around 40 per cent (see Figure 1.23).
These economic shocks are massive, and the pace of recovery varies by country. The services exports of India and Malta have rebounded to a great extent, but those of Uganda in December 2020 were almost half the level recorded in December 2019. Similarly, Australia’s services exports were about 60 per cent of December 2019 levels, while those of the UK were about three-quarters of the levels observed in the corresponding months of 2019. Whereas services exported by Uganda and Tanzania have declined significantly and have not yet recovered, by September 2020 Pakistan’s services exports had already rebounded to December 2019 levels (despite falling by 20 per cent in April 2020).
There is no clear pattern according to development level, although sectoral specialisations have influenced the nature of impacts. Economies that are highly dependent on services trade that requires in-person interactions, such as tourism, have seen steep and sustained declines in their exports (Kenya, Uganda), while those exporting ICT-related services have performed better (India, Pakistan). The services exports of Caribbean countries, as well as those of the Pacific islands, which largely rely on travel and tourism-related services, were down by around 70 per cent in 2020 (WTO, 2020a).12
-100
-80
-60
-40
0
-20
40
20
Jan2020
Feb Mar Apr May Jun Jul Aug Sept Oct Nov Dec 2020
% (
mo
nth
on
mo
nth)
Australia India Kenya Malta Pakistan Tanzania Uganda United Kingdom
14.0
-3.0-6.0
-28.0
-37.0
-52.0
-58.0
-41.0
Note: The chart presents percentage change in exports in 2020 compared with the corresponding month in 2019 for selected Commonwealth countries that report monthly services export data to the WTO.Source: Commonwealth Secretariat (calculated using data from the WTO)
F I G U R E 1 . 2 3CO V I D - 1 9 I M P ACT O N S E R V I C ES E X P O RTS O F S E L ECT E D CO M M O N W E A LT H CO U N T R I ES, 2 0 2 0 V S . 2 0 1 9
5016_Book.indb 34 17-06-2021 08:32:12

Chapter 1: Commonwealth Trade and the Pandemic \ 35
B O X 1 . 8
E N T R E P R E N E U R S H I P, T R A D E A N D W O M E N ’ S EC O N O M I C E M P O W E R M E N T
Across the Commonwealth, women make up approximately 50 per cent of the population and 30 per cent of the labour force. However, compared with men, women contribute less to global GDP and significantly less to international trade. Despite 122 World Trade Organization (WTO) members and observers, including 31 Commonwealth countries, endorsing the 2017 Joint Declaration on Trade and Women’s Economic Empowerment, women remain under-represented in trade. In one estimate, only 15 per cent of exporting firms are led by women (ITC, 2015). Factors such as a higher share of unpaid or underpaid work at home and in the informal sector, as well as barriers to entry for entrepreneurship and trade, limit women’s participation.
Women-owned businesses have been disproportionately impacted by the pandemic. This is because they are over-represented in high-risk sectors such as tourism, transport and travel, retail, food services, accommodation, entertainment and recreation, and manufacturing across economies of all income categories. Despite the pandemic’s adverse impact, some women business owners are adjusting to the new reality. According to the 2020 Mastercard Index of Women in Entrepreneurship Report, 42 per cent of women-owned businesses have shifted to a digital business model, 37 per cent are developing an area of business to meet local or global needs and 34 per cent have identified new business opportunities since the pandemic.
As employment for women increases globally, there has also been a corresponding shift into service sectors. An estimated 43 per cent of women across the Commonwealth were employed in the services sector in 2019, up from 30 per cent in 2000. In developed countries, over 90 per cent of women work in the services sector, an increase of 5 percentage points from 2000. In developing countries, 36 per cent of employed women work in services sectors, an increase of 16 percentage points since 2000. New trends in global trade, particularly the rise in services, GVCs and the digital economy, now offer more economic opportunities to women.
However, fewer women are engaged in tradeable services than men. For Commonwealth countries, on average, 5 per cent of women are engaged in tradeable service sectors compared with 18 per cent of men (calculated as the share of total employment). This varies across regions, with women in developed countries engaged in an estimated 16 per cent of tradeable services, followed by Caribbean SIDS with 15 per cent. Asian countries fall short with less than 30 per cent of women represented in overall employment, less than 5 per cent of whom are engaged in tradeable services.
Women face various challenges in taking advantage of the new opportunities for greater inclusion and empowerment. For example, they face greater non-tariff measures such as access to financing to facilitate their participation in trade. For example, female-led formal SMEs face a credit gap of roughly US$300 billion (Gonzalez, 2017). They also face cultural barriers as well as time and skills constraints.
Given these challenges, there is a need for greater effort to advance women’s participation in tradeable services and other areas of international trade. Policy-makers must strive to reduce trade barriers, promote and support women-led businesses and give equal opportunities for them to access credit and trade finance. In addition to mainstreaming gender issues in trade agreements, greater consideration should be given to fully implementing the Trade Facilitation Agreement, training women to access market opportunities and connecting women to these opportunities. The International Trade Centre (ITC) SheTrades initiative, supported by the Commonwealth Secretariat, can be used to provide training for women entrepreneurs and women-owned businesses to increase their competitiveness and participation in trade. The initiative aims to connect 3 million women to market by 2021 and has so far been utilised by four Commonwealth countries, Bangladesh, Kenya, Ghana and Nigeria, under its Commonwealth chapter.
5016_Book.indb 35 17-06-2021 08:32:12
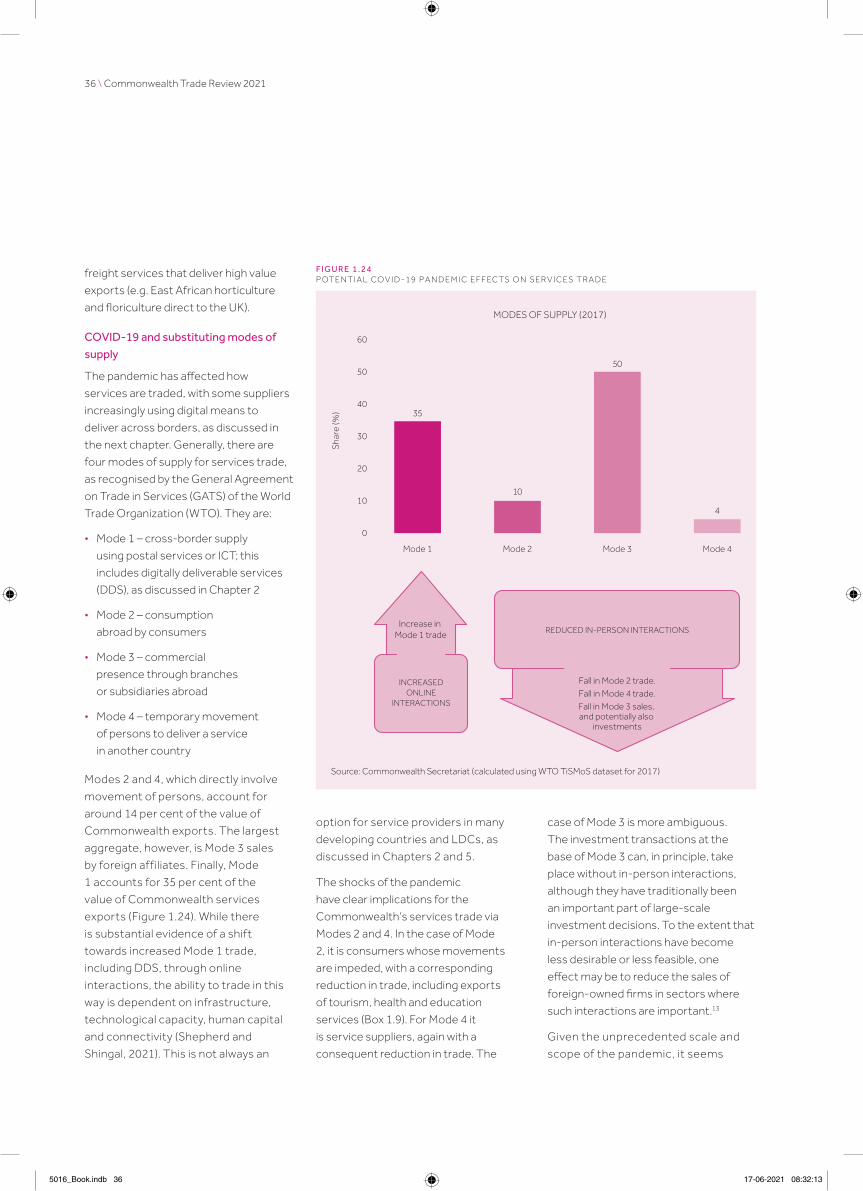
36 \ Commonwealth Trade Review 2021
freight services that deliver high value
exports (e.g. East African horticulture
and floriculture direct to the UK).
COVID-19 and substituting modes of
supply
The pandemic has affected how
services are traded, with some suppliers
increasingly using digital means to
deliver across borders, as discussed in
the next chapter. Generally, there are
four modes of supply for services trade,
as recognised by the General Agreement
on Trade in Services (GATS) of the World
Trade Organization (WTO). They are:
• Mode 1 – cross-border supply
using postal services or ICT; this
includes digitally deliverable services
(DDS), as discussed in Chapter 2
• Mode 2 – consumption
abroad by consumers
• Mode 3 – commercial
presence through branches
or subsidiaries abroad
• Mode 4 – temporary movement
of persons to deliver a service
in another country
Modes 2 and 4, which directly involve
movement of persons, account for
around 14 per cent of the value of
Commonwealth exports. The largest
aggregate, however, is Mode 3 sales
by foreign affiliates. Finally, Mode
1 accounts for 35 per cent of the
value of Commonwealth services
exports (Figure 1.24). While there
is substantial evidence of a shift
towards increased Mode 1 trade,
including DDS, through online
interactions, the ability to trade in this
way is dependent on infrastructure,
technological capacity, human capital
and connectivity (Shepherd and
Shingal, 2021). This is not always an
option for service providers in many
developing countries and LDCs, as
discussed in Chapters 2 and 5.
The shocks of the pandemic
have clear implications for the
Commonwealth’s services trade via
Modes 2 and 4. In the case of Mode
2, it is consumers whose movements
are impeded, with a corresponding
reduction in trade, including exports
of tourism, health and education
services (Box 1.9). For Mode 4 it
is service suppliers, again with a
consequent reduction in trade. The
case of Mode 3 is more ambiguous.
The investment transactions at the
base of Mode 3 can, in principle, take
place without in-person interactions,
although they have traditionally been
an important part of large-scale
investment decisions. To the extent that
in-person interactions have become
less desirable or less feasible, one
effect may be to reduce the sales of
foreign-owned firms in sectors where
such interactions are important.13
Given the unprecedented scale and
scope of the pandemic, it seems
Sha
re (%
)
0
10
20
30
40
50
60
Mode 1 Mode 2 Mode 3 Mode 4
MODES OF SUPPLY (2017)
35
10
50
4
REDUCED IN-PERSON INTERACTIONS
INCREASEDONLINE
INTERACTIONS
Increase in Mode 1 trade
Fall in Mode 2 trade.Fall in Mode 4 trade.Fall in Mode 3 sales, and potentially also
investments
Source: Commonwealth Secretariat (calculated using WTO TiSMoS dataset for 2017)
F I G U R E 1 . 2 4P OT E N T I A L CO V I D - 1 9 P A N D E M I C E F F ECTS O N S E R V I C ES T RA D E
5016_Book.indb 36 17-06-2021 08:32:13

Chapter 1: Commonwealth Trade and the Pandemic \ 37
highly likely that trade has been
reduced for Modes 2 and 4 but also
potentially for Mode 3 (Shepherd
and Shingal, 2021). However, the
case of Mode 1 is quite different.
This involves trade in services taking
place through online means, subject
to having access to the necessary
infrastructure and services. As
such, in some sectors, there is a
countervailing force in the direction
of increased services trade in
Mode 1 specif ically, as substitution
across modes takes place in
response to the pandemic (ibid).
1.5 Trade performance of LDCs, IPOA and COVID-19
The global recession has severely
damaged the already fragile economies
of LDCs by drastically reducing external
demand for their goods and services,
lowering prices of key exports and
constraining inflows of investment and
other resources. These economies
generally lack the resilience to withstand
these multiple economic shocks, owing
to their limited productive capabilities
and lack of diversification. Consequently,
the fallout from the pandemic threatens
to stall, or even reverse, developmental
progress made by Commonwealth
LDCs and may undermine their
prospects for graduating out of the
LDC category (see Chapter 5).
While the pandemic has set back the
trade and development prospects
of LDCs, they were already off track
from the target to double their share
of world exports by 2020, as envisaged
B O X 1 . 9
S W I TC H I N G M O D E S ? C O V I D -19 A N D T H E E D U C AT I O N S E R V I C E S E X P O R T S O F A U S T R A L I A A N D C A N A D A
The international education sector is important for Australia and Canada, and their universities draw students from around the world. In particular, Australia draws students from countries in East and Southeast Asia and Canada from Commonwealth partners, especially India.
Education services are Australia’s third-largest export (AU$18.8 billion in 2014/15) and indirectly support 1.3 per cent of the country’s total employment. In Canada, the sector accounts for just over 1.2 per cent of total services exports, which reflects Canada’s relatively diversified economy. In both countries, especially Australia, Mode 2 accounts almost entirely for the delivery of education services. When the pandemic hit, Australia and Canada adopted extensive travel restrictions, with obvious implications for foreign students seeking entry for study purposes. Given the difficulty of safely ensuring in-person interactions, both countries transitioned to online learning for students inside the country – and via Mode 1 trade for those outside.
A notable difference between the two countries relates to the way in which travel restrictions have affected international students. In Australia, inward movements of non-Australian citizens were reduced to close to zero, with no special exemption for students. Once the extent of the disruption to the sector was clearer, including the possibility of halving the foreign student population, the federal government made changes to student visa rules to facilitate post-study work for students already in Australia, as well as rapidly allowing entry by new and returning students outside the country.
Canada, by contrast, continued to allow entry to registered students provided that their institution had an approved COVID-19 readiness plan. Partly because of this approach, industry estimates suggest that Canada’s universities may see only a modest decline in revenue owing to the pandemic.
In both cases, there is an on-going question as to the level of future international student arrivals, assuming that travel restrictions are eased further. Another open question is whether the sector will transition durably to greater use of online platforms, which could potentially see some shift from a nearly exclusive reliance on Mode 2 trade to increased reliance on Mode 1 trade, especially as consumer and travel preferences change. There is no concrete indication yet that such a shift is taking place in more than a temporary way because of pandemic-related travel restrictions.
Source: Shepherd and Shingal (2021) for Commonwealth Secretariat
5016_Book.indb 37 17-06-2021 08:32:13

38 \ Commonwealth Trade Review 2021
by the Istanbul Programme of Action
(IPOA) for LDCs for 2011–2020 and
adopted through the Sustainable
Development Goals (SDGs) (see
Chapter 5). This implied increasing
the LDC share of global exports to
2 per cent, from one per cent at the
start of IPOA implementation.
LDCs’ global exports of goods and
services rose from US$215 billion in
2011 to just over $243 billion in 2019.
The exports of the 14 Commonwealth
LDCs expanded from $56 billion to
$79 billion (Annex 1.5). Despite some
significant export growth in absolute
terms over this period, the share of
all LDCs in world merchandise trade
stagnated just below 1 per cent, in
both 2011 and 2019, although the
dollar value of their exports in 2019
was the highest since 2000, at just
over $243 billion. External shocks,
including structural and cyclical factors
and natural disasters in the Pacific
and Southern Africa regions, also
contributed to missing the target.
The trade performance of
Commonwealth LDCs during this
period was more robust than that of
the other LDCs, with their exports
growing from US$22 billion in
2005 to around $79 billion in 2019,
almost fourfold. This reflects the
significant contribution of intra-
Commonwealth trade for many
LDCs, especially in Asia and Africa.
The share of Commonwealth LDCs
in intra-Commonwealth trade in
2011 was 1.92 per cent – almost
twice the corresponding share of all
LDCs in world trade (Figure 1.25).
During 2011–2019, the share of
all LDCs in world trade stagnated,
whereas that of the Commonwealth
LDCs in intra-Commonwealth trade
increased to 2.83 per cent over
this period. Similarly, the share of
Commonwealth LDCs in global trade
also increased, from 0.25 per cent
in 2011 to 0.32 per cent in 2019. A
substantial portion of this increase is
attributed to the export performance
of Bangladesh, whose global exports
almost doubled from $26 billion in
2011 to above $45 billion 2019.
A protracted pandemic poses a
significant risk to sustainable graduation
pathways for LDCs. Twelve LDCs
are expected to graduate within the
US
$ bi
llion
0
50
100
150
200
250
2011 2012 2013 2014 2015 2016 2017 2018 2019
EXPORTS TREND (2011-2019)
All LDCs (47) CW LDCs (14)
2011
CW LDCs (excluding Bangladesh)
Sha
re (%
)
0.50
1.00
1.50
2.00
2.50
3.00
All LDCs (47) Commonwealth LDCs (14)
Global exports Global exports Intra-CW exports
0.00
LDCS' SHARE IN GLOBAL AND INTRA-CW EXPORTS (2011 VS. 2019)
0.96 0.99
0.25 0.32
1.92
2.83
2019
Note: The chart compares all LDCs’ export share in world trade and 14 Commonwealth LDCs’ share in world and intra-Commonwealth trade (goods and services combined) in 2011 and 2019.Source: Commonwealth Secretariat (calculated using UNCTADstat and OECD-WTO BaTIS datasets)
F I G U R E 1 . 2 5T RA D E P E R F O R M A N C E O F L D CS D U R I N G I STA N B U L P RO G RA M M E O F ACT I O N
5016_Book.indb 38 17-06-2021 08:32:13

Chapter 1: Commonwealth Trade and the Pandemic \ 39
next four years. Vanuatu graduated
in December 2020 and two more
Commonwealth LDCs – Solomon
Islands and Bangladesh – are set to
follow in 2024 and 2026, respectively.
1.6 Common-wealth trade prospects towards 2022
The 2015 Commonwealth Trade
Review estimated that the value of
intra-Commonwealth exports of
goods and services would exceed
US$700 billion in 2020. However, the
slowdown in the Indian economy,
uncertainty around Brexit negotiations
and the spill-over effects of the USA-
China trade and technology conflict,
among other factors, contributed
to lower growth in global and intra-
Commonwealth trade in 2019.
Nevertheless, intra-Commonwealth
exports are expected to rebound and
reach 2019 levels by the end of 2021, and
surpass US$700 billion by 2022. Similarly,
Commonwealth countries’ global
exports are expected to reach $3.76
trillion in 2021. At this rate, the 2019 level
for global exports ($3.73 trillion) could
be also surpassed by 2021 (Figure 1.26).
The long-term average growth
rate of the Commonwealth’s global
exports of goods and services in the
post-global financial crisis period from
2010 to 2019 was around 5 per cent.
If this trend continues, the value of
the Commonwealth’s global trade
is projected to surpass US$5 trillion
by 2025 and $6 trillion by 2030.14
The slow start and increasing
uncertainties about the rollout
of vaccines globally and in the
Commonwealth means prospects
of economic recovery could vary
significantly across regions and
countries. The entire populations
of several Commonwealth member
countries might not be vaccinated until
2023 or early 2024 (The Economist,
2021b; Vickers et al., 2021). Asian
Commonwealth countries could
rebound quickly and reach very close to
pre-pandemic levels in 2021, while the
recovery in LDCs and small states could
be protracted. The lingering effects of
the pandemic, in terms of slow human
and physical capital formation, reduced
investments and a slow revival of trade
and transport-related services, will
affect the recovery of exports in LDCs
and small states, including SIDS.
The demography of Commonwealth
countries could also influence the
recovery. Prospects are generally
more optimistic in countries with
youthful populations – for example
Asian and African members (Sneader
and Singhal, 2021). Overall, more
than half of the Commonwealth’s
combined population are below the
age of 25. In many countries, the youth
are more tech-savvy and innovative
and the crisis has sparked an upsurge
in innovation and tech start-ups.
It is a promising signal that the sensitivity
of economic activities to COVID-19
restrictions has diminished significantly
since the first lockdowns imposed
in many Commonwealth countries.
Three main factors–less public fear,
better-calibrated government policy and
adaptation by businesses–explain the
greater resilience of economic activities
during the second and third lockdowns.
Improvements in several high-frequency
economic indicators, including domestic
travel, shipping demand, consumer
spending, commodity prices and
purchasing managers index, suggest
trade flows could recover soon.
However, in the short term, any recovery
in trade in goods and services flows
may not be sufficient to return to
pre-pandemic trends, as the knock-on
effects on physical and human capital,
and the direct and indirect effects
of the pandemic on innovation and
investment, could continue to hamper
trade flows for several years. Moreover,
while merchandise trade had gained
momentum by the end of 2020, exports
in services sectors requiring in-person
interaction – for example hospitality,
tourism and education – are still
struggling to adapt to these new realities.
The relatively greater resilience of
intra-Commonwealth trade flows to
the pre-pandemic headwinds, as well
as their quick rebound after the global
financial crisis (2008/09) and the more
recent trade slowdown in 2015/16, offers
another silver lining. Although the growth
of intra-Commonwealth trade (0.5 per
cent) and the Commonwealth’s world
trade (0.2 per cent) in 2019 were limited,
both compared favourably with growth in
world trade, which declined by 1 per cent.
1.7 Conclusion and way forward
This chapter has demonstrated how
COVID-19 has adversely affected
the goods and services exports of all
Commonwealth countries, although
these impacts vary by regions and
sectors. Considering the monetary
and fiscal support measures being
implemented by several countries, and
5016_Book.indb 39 17-06-2021 08:32:13

40 \ Commonwealth Trade Review 2021
progress in rolling out vaccinations,
2021 is likely to be a year of transition,
and there is a cautious optimism about
the Commonwealth’s trade prospects.
World trade is expected to rebound by
8.4 per cent in 2021 and 6.5 per cent in
2022 (IMF, 2021a). Merchandise trade
is leading the recovery; the services
sector, especially transportation, travel
and tourism, may take longer to reach
pre-pandemic levels of activity.
Like previous economic downturns,
a return of consumer confidence
could increase spending as pent-
up demand is unleashed, thereby
incentivising growth in production and
trade (Sneader and Singhal, 2021). It
is reported that consumers in 21 rich
economies have accumulated around
US$3 trillion in excess savings (The
Economist, 2021c). Spending of this
magnitude would create a demand
spill-over to power a strong recovery.
Despite these promising tailwinds
for recovery, the impact of this
unprecedented global crisis, together
with the unresolved USA-China trade
conflict, create a more challenging
outlook for the Commonwealth’s
long-term vision of growing intra-
Commonwealth trade to US$2 trillion by
2030. Commonwealth policy-makers,
parliamentarians and businesses need to
consider more concerted policy actions
to expedite the recovery process and
ensure it is inclusive and sustainable.
Although the Commonwealth is not
a trading bloc, countries can look to
harness the Commonwealth advantage
to boost intra-Commonwealth trade and
help get past the pandemic. As has been
demonstrated, the Commonwealth
advantage remains strong, resilient
and compelling, and leads to lower
bilateral trade costs of 21 per cent, on
average. Members can also strengthen
co-operation and share best practices
and experiences regarding trade policy
and domestic reform through the
Commonwealth Connectivity Agenda.
Members have adopted an Action Plan
to guide discussions and work in five
inclusive clusters concerning physical,
digital, supply side, regulatory and
business-to-business connectivity.
The Commonwealth as a platform for
establishing and strengthening contacts
between traders and investors, as well
as its large and dynamic diaspora, should
be enhanced and effectively utilised.15 In
US
$ bi
llion
580
620
640
600
660
700
740
680
720
760
780
2019 2020 2021 2022
INTRA-COMMONWEALTH EXPORTS
Pre-COVID (Oct. 2019) In-COVID (Apr. 2021)
US
$ tr
illio
n
3.20
3.40
3.50
3.30
3.60
3.80
4.00
3.70
3.90
4.10
4.20
2019 2020 2021 2022
GLOBAL EXPORTS
Pre-COVID (Oct. 2019) In-COVID (Apr. 2021)
3.55
3.76
3.94
3.73
3.90
4.01
4.14
641.3
680.3
711.5
672.2
701.2
727.1
752.5
Source: Commonwealth Secretariat (calculated using UNCTADstat and OECD-WTO BaTIS dataset based on growth forecasts of the World Bank and IMF for individual economies)
F I G U R E 1 . 2 6CO M M O N W E A LT H ’ S T RA D E P RO S P ECTS I N T H E S H O RT TO M E D I U M T E R M , 2 0 1 9 – 2 0 2 2
5016_Book.indb 40 17-06-2021 08:32:13

Chapter 1: Commonwealth Trade and the Pandemic \ 41
future, trade fairs could be linked to the
biennial Heads of Government meetings.
Second, revitalising the services sector
will be a boon for trade recovery and
improved development prospects in
the Commonwealth. Countries should
identify practical ways to benefit from
the rising servicification trend in most
Commonwealth countries and the
relatively large share of services in
intra-Commonwealth exports (around
one-third), including as suppliers of
services tasks, which are increasingly
ICT-enabled, in GVCs. Unlike the
previous trade collapse in 2008/09,
which primarily affected merchandise
trade, this crisis has had a relatively
bigger effect on the services sector,
because of the restrictions on physical
interaction between consumers and
suppliers. Digitalisation has enabled
the online delivery of many services,
although this switching of modes does
not compensate for the pandemic’s
losses. The recovery in key services
sectors, especially the travel and tourism
services that underpin many small
states’ economies, largely depends
on the performance of the health
sector and progress with vaccinations.
Chapter 5 discusses the recovery of
the tourism sector in greater detail.
Third, since most intra-Commonwealth
trade takes place regionally, it is
imperative to strengthen and implement
existing regional trade agreements
(RTAs) and those struck in recent years,
including the African Continental Free
Trade Area and the signed Regional
Comprehensive Economic Partnership
in Asia-Pacific, as discussed in Chapter 4.
In addition, several Commonwealth
developed countries, as well as other
developed and some developing
countries globally, including the USA, the
EU and China, offer tariff preferences
to LDCs. There is scope to extend
these to include services under an
agreed waiver at the WTO. However, as
discussed in Chapter 5, it is necessary
to build institutional mechanisms
and key stakeholder partnerships as
well as supply side capacity in LDCs
to utilise these preferences. Finally,
digital trade and digitalisation also open
new and promising opportunities for
Commonwealth countries to grow their
trade in an expanding range of digitisable
or digitally deliverable products,
services and e-commerce. This digital
transformation of goods and services
trade is explored next, in Chapter 2.
5016_Book.indb 41 17-06-2021 08:32:13
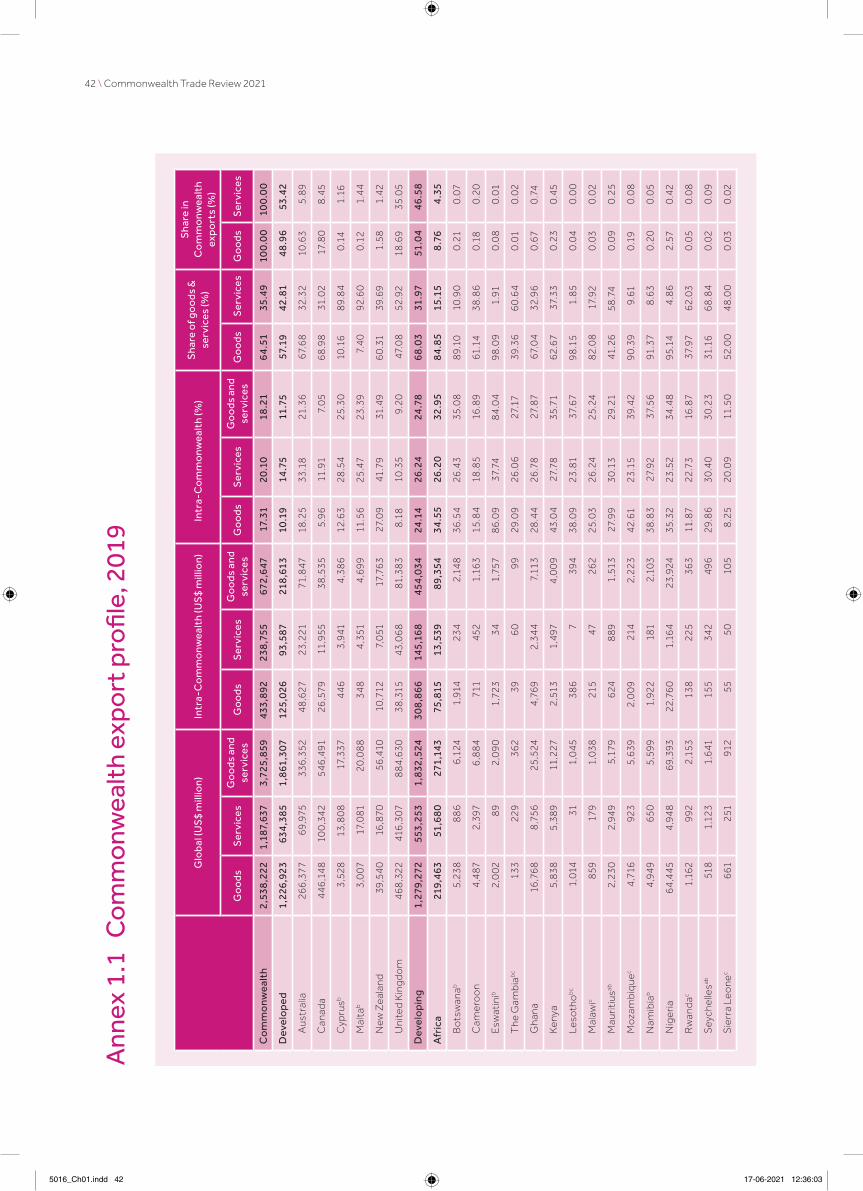
42 \ Commonwealth Trade Review 2021
Ann
ex 1
.1 C
om
mo
nwea
lth
expo
rt p
rofil
e, 2
019
Glo
bal (
US
$ m
illio
n)In
tra-
Co
mm
onw
ealt
h (U
S$
mill
ion)
Intr
a-C
om
mo
nwea
lth
(%)
Sha
re o
f go
ods
&
serv
ices
(%)
Sha
re in
C
om
mo
nwea
lth
exp
ort
s (%
)
Go
ods
Ser
vice
sG
oo
ds a
nd
serv
ices
Go
ods
Ser
vice
sG
oo
ds a
nd
serv
ices
Go
ods
Ser
vice
sG
oo
ds a
nd
serv
ices
Go
ods
Ser
vice
sG
oo
dsS
ervi
ces
Co
mm
onw
ealt
h2,
538
,222
1,18
7,63
73,
725,
859
433,
892
238
,755
672,
647
17.3
120
.10
18.2
164
.51
35.4
910
0.0
010
0.0
0
Dev
elo
ped
1,22
6,92
363
4,38
51,
861,
307
125,
026
93,5
8721
8,6
1310
.19
14.7
511
.75
57.1
942
.81
48.9
653
.42
A
ustr
alia
266
,377
69,9
7533
6,3
524
8,6
2723
,221
71,8
4718
.25
33.1
821
.36
67.6
832
.32
10.6
35
.89
C
anad
a4
46,1
48
100
,342
546
,491
26,5
7911
,955
38,5
355
.96
11.9
17.
056
8.9
831
.02
17.8
08
.45
C
ypru
sb3,
528
13,8
08
17,3
374
463,
941
4,3
8612
.63
28.5
425
.30
10.1
689
.84
0.1
41.
16
M
alta
b3,
007
17,0
8120
,08
834
84
,351
4,6
9911
.56
25.4
723
.39
7.4
092
.60
0.1
21.
44
N
ew Z
eala
nd39
,54
016
,870
56,4
1010
,712
7,05
117
,763
27.0
941
.79
31.4
96
0.3
139
.69
1.58
1.42
U
nite
d K
ingd
om
468
,322
416
,307
88
4,6
3038
,315
43,0
68
81,3
838
.18
10.3
59.
2047
.08
52.9
218
.69
35.0
5
Dev
elo
pin
g1,
279,
272
553,
253
1,83
2,52
430
8,8
6614
5,16
845
4,03
424
.14
26.2
424
.78
68.0
331
.97
51.0
446
.58
Afr
ica
219,
463
51,6
80
271,
143
75,8
1513
,539
89,3
5434
.55
26.2
032
.95
84.8
515
.15
8.7
64.
35
B
ots
wan
ab5,
238
886
6,1
241,
914
234
2,14
836
.54
26.4
335
.08
89.1
010
.90
0.2
10
.07
C
amer
oo
n4
,487
2,39
76
,88
471
145
21,
163
15.8
418
.85
16.8
961
.14
38.8
60
.18
0.2
0
E
swat
inib
2,0
0289
2,0
90
1,72
334
1,75
786
.09
37.7
48
4.0
498
.09
1.91
0.0
80
.01
T
he G
ambi
abc
133
229
362
396
099
29.0
926
.06
27.1
739
.36
60
.64
0.0
10
.02
G
hana
16,7
68
8,7
5625
,524
4,7
692,
344
7,11
328
.44
26.7
827
.87
67.0
432
.96
0.6
70
.74
K
enya
5,83
85,
389
11,2
272,
513
1,49
74
,00
943
.04
27.7
835
.71
62.6
737
.33
0.2
30
.45
Le
soth
ob
c1,
014
311,
045
386
739
438
.09
23.8
137
.67
98.1
51.
850
.04
0.0
0
M
alaw
ic85
917
91,
038
215
4726
225
.03
26.2
425
.24
82.0
817
.92
0.0
30
.02
M
auri
tius
ab2,
230
2,94
95,
179
624
889
1,51
327
.99
30.1
329
.21
41.2
658
.74
0.0
90
.25
M
ozam
biqu
ec4
,716
923
5,63
92,
00
921
42,
223
42.6
123
.15
39.4
29
0.3
99.
610
.19
0.0
8
N
amib
iab
4,9
4965
05,
599
1,92
218
12,
103
38.8
327
.92
37.5
691
.37
8.6
30
.20
0.0
5
N
iger
ia64
,445
4,9
48
69,3
9322
,76
01,
164
23,9
2435
.32
23.5
234
.48
95.1
44
.86
2.57
0.4
2
R
wan
dac
1,16
299
22,
153
138
225
363
11.8
722
.73
16.8
737
.97
62.0
30
.05
0.0
8
S
eych
elle
sab51
81,
123
1,64
115
534
249
629
.86
30.4
030
.23
31.1
66
8.8
40
.02
0.0
9
S
ierr
a Le
one
c66
125
191
255
5010
58
.25
20.0
911
.50
52.0
04
8.0
00
.03
0.0
2
5016_Ch01.indd 42 17-06-2021 12:36:03
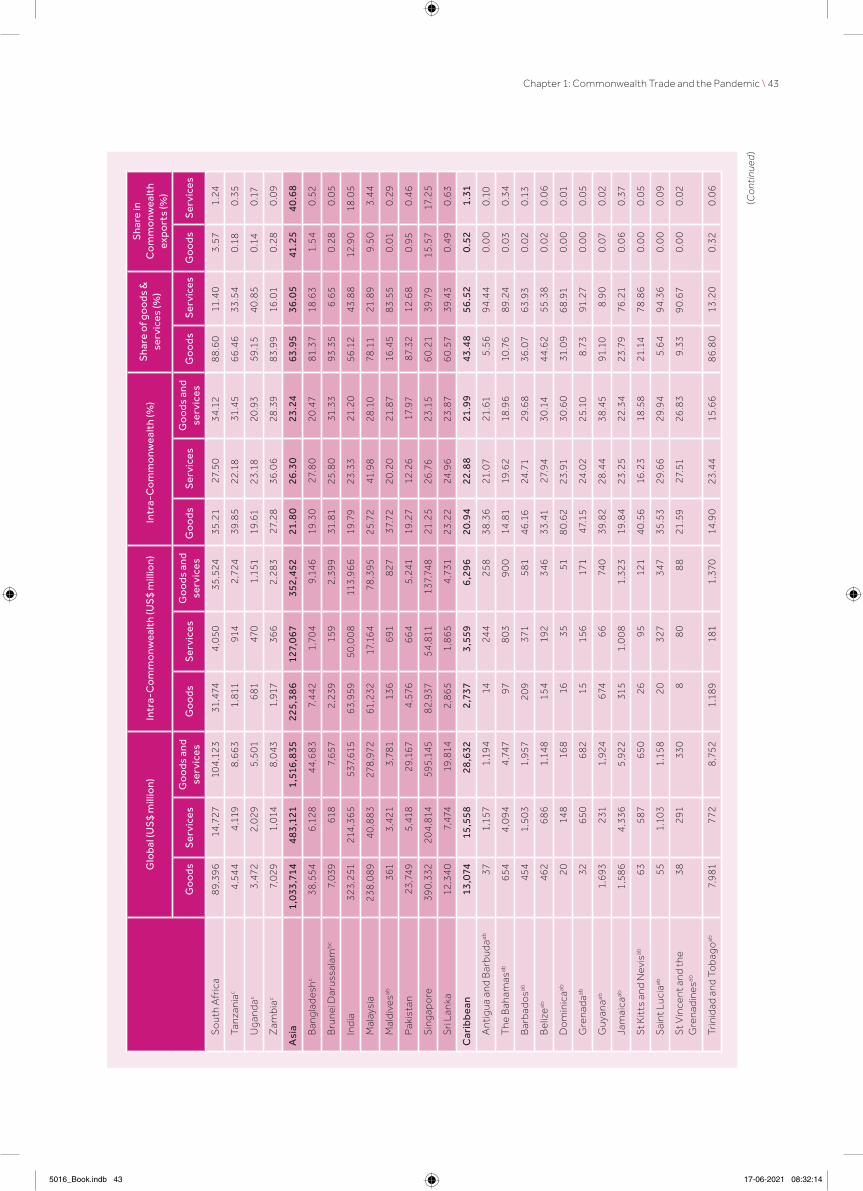
Chapter 1: Commonwealth Trade and the Pandemic \ 43
(Co
ntin
ued
)
Glo
bal (
US
$ m
illio
n)In
tra-
Co
mm
onw
ealt
h (U
S$
mill
ion)
Intr
a-C
om
mo
nwea
lth
(%)
Sha
re o
f go
ods
&
serv
ices
(%)
Sha
re in
C
om
mo
nwea
lth
exp
ort
s (%
)
Go
ods
Ser
vice
sG
oo
ds a
nd
serv
ices
Go
ods
Ser
vice
sG
oo
ds a
nd
serv
ices
Go
ods
Ser
vice
sG
oo
ds a
nd
serv
ices
Go
ods
Ser
vice
sG
oo
dsS
ervi
ces
S
out
h A
fric
a89
,396
14,7
2710
4,1
2331
,474
4,0
5035
,524
35.2
127
.50
34.1
28
8.6
011
.40
3.5
71.
24
Ta
nzan
iac
4,5
44
4,1
198
,663
1,81
191
42,
724
39.8
522
.18
31.4
566
.46
33.5
40
.18
0.3
5
U
gand
ac3,
472
2,02
95,
501
681
470
1,15
119
.61
23.1
820
.93
59.1
54
0.8
50
.14
0.1
7
Z
ambi
ac7,
029
1,01
48
,043
1,91
736
62,
283
27.2
836
.06
28.3
983
.99
16.0
10
.28
0.0
9
Asi
a1,
033,
714
483,
121
1,51
6,83
522
5,38
612
7,0
6735
2,45
221
.80
26.3
023
.24
63.9
536
.05
41.2
540
.68
B
angl
ades
hc38
,554
6,1
284
4,6
837,
442
1,70
49,
146
19.3
027
.80
20.4
781
.37
18.6
31.
540
.52
B
rune
i Dar
ussa
lam
bc
7,03
961
87,
657
2,23
915
92,
399
31.8
125
.80
31.3
393
.35
6.6
50
.28
0.0
5
In
dia
323,
251
214
,365
537,
615
63,9
5950
,00
811
3,96
619
.79
23.3
321
.20
56.1
243
.88
12.9
018
.05
M
alay
sia
238
,089
40
,883
278
,972
61,2
3217
,164
78,3
9525
.72
41.9
828
.10
78.1
121
.89
9.50
3.4
4
M
aldi
vesab
361
3,42
13,
781
136
691
827
37.7
220
.20
21.8
716
.45
83.5
50
.01
0.2
9
P
akis
tan
23,7
495,
418
29,1
674
,576
664
5,24
119
.27
12.2
617
.97
87.3
212
.68
0.9
50
.46
S
inga
pore
390
,332
204
,814
595,
145
82,9
3754
,811
137,
748
21.2
526
.76
23.1
56
0.2
139
.79
15.5
717
.25
S
ri L
anka
12,3
40
7,47
419
,814
2,86
51,
865
4,7
3123
.22
24.9
623
.87
60
.57
39.4
30
.49
0.6
3
Car
ibbe
an13
,074
15,5
5828
,632
2,73
73,
559
6,29
620
.94
22.8
821
.99
43.4
856
.52
0.52
1.31
A
ntig
ua a
nd B
arbu
daab
371,
157
1,19
414
244
258
38.3
621
.07
21.6
15
.56
94.4
40
.00
0.1
0
T
he B
aham
asab
654
4,0
944
,747
978
039
00
14.8
119
.62
18.9
610
.76
89.2
40
.03
0.3
4
B
arba
dosab
454
1,50
31,
957
209
371
581
46.1
624
.71
29.6
836
.07
63.9
30
.02
0.1
3
B
eliz
eab46
26
861,
148
154
192
346
33.4
127
.94
30.1
44
4.6
255
.38
0.0
20
.06
D
om
inic
aab20
148
168
1635
518
0.6
223
.91
30.6
031
.09
68
.91
0.0
00
.01
G
rena
daab
3265
06
8215
156
171
47.1
524
.02
25.1
08
.73
91.2
70
.00
0.0
5
G
uyan
aab1,
693
231
1,92
467
466
740
39.8
228
.44
38.4
591
.10
8.9
00
.07
0.0
2
Ja
mai
caab
1,58
64
,336
5,92
231
51,
00
81,
323
19.8
423
.25
22.3
423
.79
76.2
10
.06
0.3
7
S
t Kit
ts a
nd N
evis
ab63
587
650
2695
121
40
.56
16.2
318
.58
21.1
478
.86
0.0
00
.05
S
aint
Luc
iaab
551,
103
1,15
820
327
347
35.5
329
.66
29.9
45
.64
94.3
60
.00
0.0
9
S
t Vin
cent
and
the
Gre
nadi
nesab
3829
133
08
80
88
21.5
927
.51
26.8
39.
339
0.6
70
.00
0.0
2
Tr
inid
ad a
nd T
oba
goab
7,98
177
28
,752
1,18
918
11,
370
14.9
023
.44
15.6
686
.80
13.2
00
.32
0.0
6
5016_Book.indb 43 17-06-2021 08:32:14

44 \ Commonwealth Trade Review 2021
Glo
bal (
US
$ m
illio
n)In
tra-
Co
mm
onw
ealt
h (U
S$
mill
ion)
Intr
a-C
om
mo
nwea
lth
(%)
Sha
re o
f go
ods
&
serv
ices
(%)
Sha
re in
C
om
mo
nwea
lth
exp
ort
s (%
)
Go
ods
Ser
vice
sG
oo
ds a
nd
serv
ices
Go
ods
Ser
vice
sG
oo
ds a
nd
serv
ices
Go
ods
Ser
vice
sG
oo
ds a
nd
serv
ices
Go
ods
Ser
vice
sG
oo
dsS
ervi
ces
Pac
ific
13,0
212,
894
15,9
154,
927
1,0
035,
931
37.8
434
.67
37.2
783
.08
16.9
20.
520.
24
Fi
jiab1,
031
1,61
32,
644
427
578
1,0
0541
.37
35.8
538
.00
42.4
657
.54
0.0
40
.14
K
irib
atiab
c13
1124
11
26
.46
13.6
69.
68
36.9
263
.08
0.0
00
.00
N
auru
ab34
347
720
.48
20.4
8–
0.0
00
.00
P
apua
New
Gui
neaab
11,3
6926
611
,635
4,3
9710
94
,50
638
.67
41.1
638
.73
97.5
72.
430
.45
0.0
2
S
amo
aab49
294
343
1610
712
333
.18
36.3
935
.93
13.1
986
.81
0.0
00
.02
S
olo
mo
n Is
land
sabc
461
128
589
5032
8210
.87
24.7
213
.88
61.3
538
.65
0.0
20
.01
To
ngaab
208
810
88
1926
38.8
421
.16
24.4
629
.63
70.3
70
.00
0.0
1
Tu
valu
abc
0.1
66
01
17.
3018
.11
17.9
20
.71
99.2
90
.00
0.0
0
V
anua
tuab
c43
489
533
2215
617
850
.42
31.9
233
.43
12.3
187
.69
0.0
00
.04
Vul
nera
ble
gro
ups
S
mal
l sta
tes
60
,602
61,7
3412
2,33
518
,307
15,9
0334
,210
30.2
125
.76
27.9
653
.51
46.4
92.
425
.20
S
IDS
29,2
04
25,9
4555
,149
8,5
80
6,4
84
15,0
6329
.38
24.9
927
.31
56.9
643
.04
1.17
2.18
LD
Cs
62,6
6316
,528
79,1
9214
,766
4,2
4719
,013
23.5
625
.70
24.0
177
.66
22.3
42.
501.
39
No
te: a re
pre
sent
s 24
Co
mm
onw
ealt
h S
mal
l Isl
and
Dev
elo
pin
g S
tate
s (S
IDS
s) a
nd e
xclu
des
Sin
gap
ore
; b rep
rese
nts
32 C
om
mo
nwea
lth
Sm
all s
tate
s; c re
pre
sent
s 1
4 Le
ast D
evel
op
ed C
oun
trie
s (L
DC
s).
So
urce
: Co
mm
onw
ealt
h S
ecre
tari
at (c
alcu
late
d us
ing
UN
CTA
Dst
at a
nd O
ECD
-WT
O B
aTIS
dat
aset
s)
5016_Book.indb 44 17-06-2021 08:32:14

Chapter 1: Commonwealth Trade and the Pandemic \ 45
Pre-COVID In-COVID GDP loss (%)
2019 2020e 2021f 2022f 2020e 2021f 2022f 2020e 2021f 2022f
Commonwealth 12,185,299 12,577,083 13,008,051 13,468,053 11,422,516 12,172,844 12,776,570 −10.11 −6.86 −5.41
Developed 6,546,100 6,662,007 6,787,217 6,914,590 6,107,937 6,414,311 6,693,193 −9.07 −5.81 −3.31
Australia 1,450,499 1,483,324 1,521,623 1,562,692 1,415,136 1,479,355 1,520,067 −4.82 −2.86 −2.80
Canada 1,939,183 1,973,332 2,007,984 2,042,501 1,834,409 1,926,955 2,016,617 −7.57 −4.21 −1.28
Cyprus 28,678 29,506 30,306 31,095 27,214 28,035 29,128 −8.42 −8.10 −6.76
Malta 14,565 15,193 15,762 16,314 13,545 14,177 14,967 −12.17 −11.18 −9.00
New Zealand 191,728 196,903 202,062 207,306 185,994 193,515 199,698 −5.87 −4.42 −3.81
United Kingdom
2,921,446 2,963,749 3,009,479 3,054,682 2,631,639 2,772,273 2,912,717 −12.62 −8.56 −4.87
Developing 5,639,198 5,915,076 6,220,834 6,553,463 5,314,579 5,758,533 6,083,377 −11.30 −8.03 −7.73
Africa 1,298,056 1,333,207 1,370,730 1,411,695 1,252,122 1,293,671 1,332,370 −6.48 −5.96 −5.95
Botswana 18,644 19,430 20,412 21,234 17,106 18,389 19,383 −13.59 −11.00 −9.55
Cameroon 39,288 40,932 42,735 44,757 38,201 39,513 41,214 −7.15 −8.15 −8.60
Eswatini 5,532 5,618 5,706 5,793 5,347 5,423 5,471 −5.07 −5.22 −5.88
The Gambia 1,914 2,035 2,151 2,269 1,914 2,029 2,161 −6.35 −6.05 −5.01
Ghana 57,316 60,871 63,739 66,676 57,820 60,503 64,196 −5.28 −5.35 −3.86
Kenya 65,060 68,979 72,985 77,233 64,978 69,890 73,895 −6.16 −4.43 −4.52
Lesotho 2,875 2,882 2,966 3,073 2,744 2,839 2,960 −5.04 −4.46 −3.82
Malawi 9,754 10,237 10,785 11,394 9,813 10,028 10,680 −4.32 −7.54 −6.68
Mauritius 13,787 14,320 14,887 15,484 11,608 12,375 13,018 −23.36 −20.31 −18.94
Mozambique 17,876 18,747 19,515 20,335 17,786 18,160 19,013 −5.40 −7.46 −6.95
Namibia 14,383 14,560 14,861 15,240 13,342 13,691 14,148 −9.13 −8.54 −7.71
Nigeria 477,162 488,187 499,454 511,518 468,602 480,471 491,556 −4.18 −3.95 −4.06
Rwanda 11,381 12,303 13,299 14,363 11,358 12,004 12,826 −8.32 −10.79 −11.99
Seychelles 1,469 1,518 1,574 1,633 1,273 1,296 1,351 −19.24 −21.48 −20.85
Sierra Leone 3,816 3,999 4,192 4,394 3,731 3,844 3,981 −7.19 −9.06 −10.38
South Africa 430,167 434,423 440,373 447,557 400,227 412,634 420,763 −8.54 −6.72 −6.37
Tanzania 55,482 58,673 62,220 66,107 56,053 57,543 60,199 −4.67 −8.13 −9.81
Uganda 42,611 45,320 48,049 50,946 41,715 44,362 46,576 −8.64 −8.31 −9.38
Zambia 29,539 30,173 30,826 31,690 28,506 28,677 28,979 −5.85 −7.50 −9.36
Asia 4,247,320 4,482,439 4,747,932 5,035,763 3,975,336 4,374,798 4,652,617 −12.76 −8.53 −8.24
Bangladesh 209,974 225,350 241,800 259,452 217,949 228,923 246,012 −3.40 −5.63 −5.46
Brunei Darussalam
14,007 14,666 15,193 15,730 14,175 14,409 14,775 −3.46 −5.44 −6.46
India 2,940,157 3,128,812 3,340,664 3,566,760 2,705,973 3,045,465 3,256,576 −15.63 −9.69 −9.52
Annex 1.2 COVID-19 impact on the GDP of Commonwealth economies, 2019–2022 (constant 2010 US$ million)
(Continued)
5016_Book.indb 45 17-06-2021 08:32:14
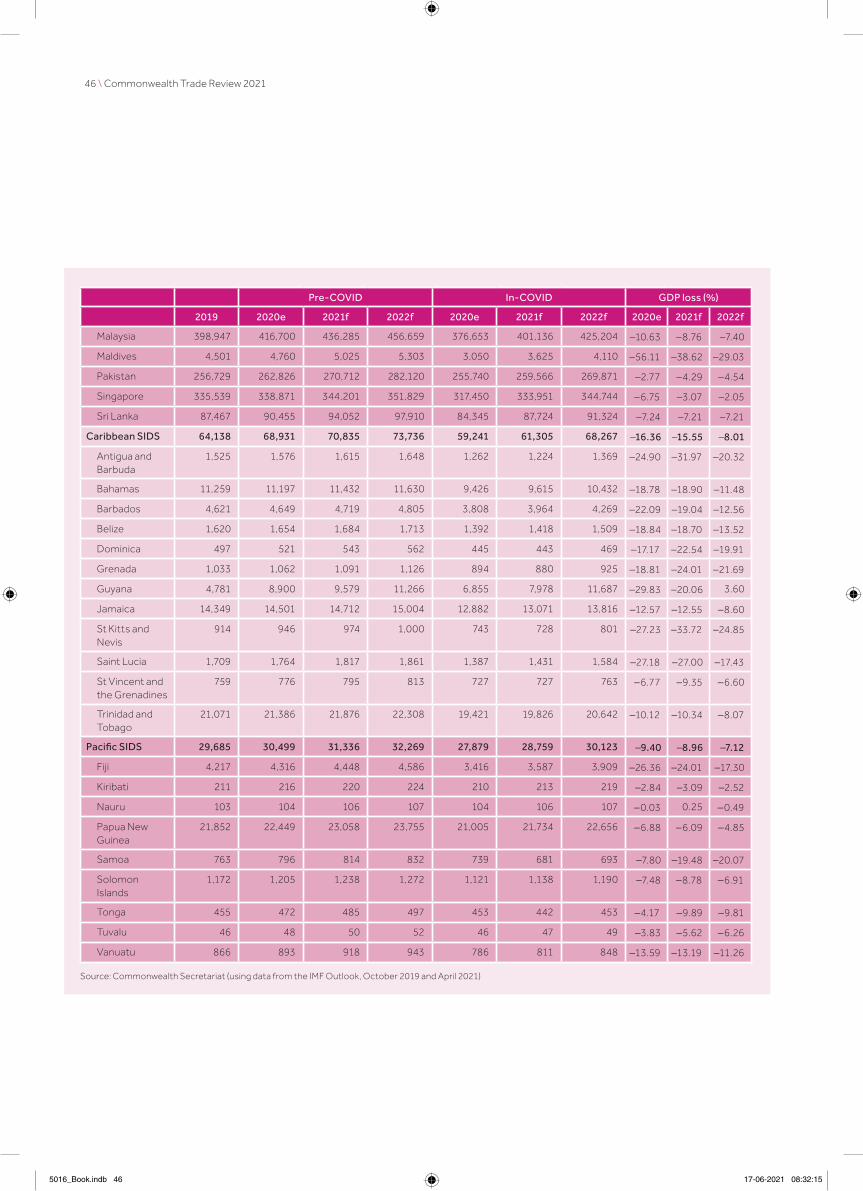
46 \ Commonwealth Trade Review 2021
Pre-COVID In-COVID GDP loss (%)
2019 2020e 2021f 2022f 2020e 2021f 2022f 2020e 2021f 2022f
Malaysia 398,947 416,700 436,285 456,659 376,653 401,136 425,204 −10.63 −8.76 −7.40
Maldives 4,501 4,760 5,025 5,303 3,050 3,625 4,110 −56.11 −38.62 −29.03
Pakistan 256,729 262,826 270,712 282,120 255,740 259,566 269,871 −2.77 −4.29 −4.54
Singapore 335,539 338,871 344,201 351,829 317,450 333,951 344,744 −6.75 −3.07 −2.05
Sri Lanka 87,467 90,455 94,052 97,910 84,345 87,724 91,324 −7.24 −7.21 −7.21
Caribbean SIDS 64,138 68,931 70,835 73,736 59,241 61,305 68,267 −16.36 −15.55 −8.01
Antigua and Barbuda
1,525 1,576 1,615 1,648 1,262 1,224 1,369 −24.90 −31.97 −20.32
Bahamas 11,259 11,197 11,432 11,630 9,426 9,615 10,432 −18.78 −18.90 −11.48
Barbados 4,621 4,649 4,719 4,805 3,808 3,964 4,269 −22.09 −19.04 −12.56
Belize 1,620 1,654 1,684 1,713 1,392 1,418 1,509 −18.84 −18.70 −13.52
Dominica 497 521 543 562 445 443 469 −17.17 −22.54 −19.91
Grenada 1,033 1,062 1,091 1,126 894 880 925 −18.81 −24.01 −21.69
Guyana 4,781 8,900 9,579 11,266 6,855 7,978 11,687 −29.83 −20.06 3.60
Jamaica 14,349 14,501 14,712 15,004 12,882 13,071 13,816 −12.57 −12.55 −8.60
St Kitts and Nevis
914 946 974 1,000 743 728 801 −27.23 −33.72 −24.85
Saint Lucia 1,709 1,764 1,817 1,861 1,387 1,431 1,584 −27.18 −27.00 −17.43
St Vincent and the Grenadines
759 776 795 813 727 727 763 −6.77 −9.35 −6.60
Trinidad and Tobago
21,071 21,386 21,876 22,308 19,421 19,826 20,642 −10.12 −10.34 −8.07
Pacific SIDS 29,685 30,499 31,336 32,269 27,879 28,759 30,123 −9.40 −8.96 −7.12
Fiji 4,217 4,316 4,448 4,586 3,416 3,587 3,909 −26.36 −24.01 −17.30
Kiribati 211 216 220 224 210 213 219 −2.84 −3.09 −2.52
Nauru 103 104 106 107 104 106 107 −0.03 0.25 −0.49
Papua New Guinea
21,852 22,449 23,058 23,755 21,005 21,734 22,656 −6.88 −6.09 −4.85
Samoa 763 796 814 832 739 681 693 −7.80 −19.48 −20.07
Solomon Islands
1,172 1,205 1,238 1,272 1,121 1,138 1,190 −7.48 −8.78 −6.91
Tonga 455 472 485 497 453 442 453 −4.17 −9.89 −9.81
Tuvalu 46 48 50 52 46 47 49 −3.83 −5.62 −6.26
Vanuatu 866 893 918 943 786 811 848 −13.59 −13.19 −11.26
Source: Commonwealth Secretariat (using data from the IMF Outlook, October 2019 and April 2021)
5016_Book.indb 46 17-06-2021 08:32:15
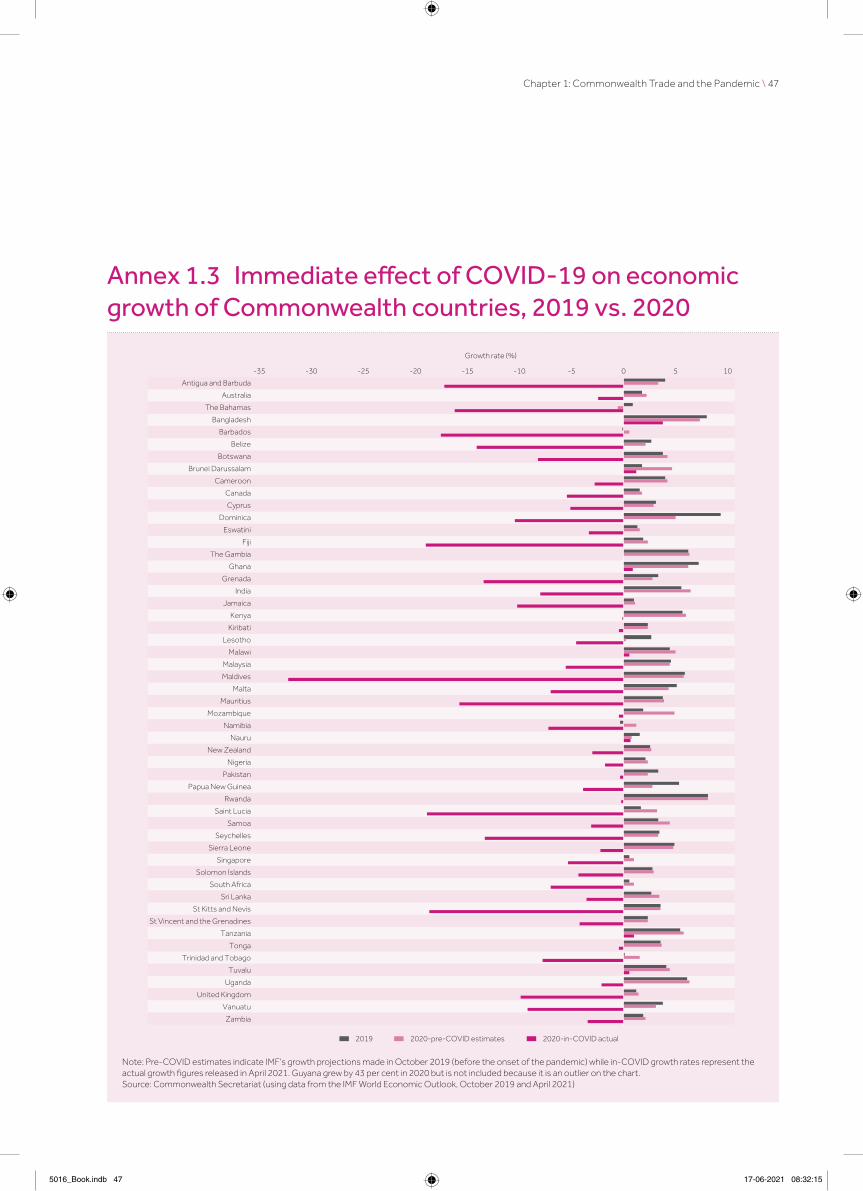
Chapter 1: Commonwealth Trade and the Pandemic \ 47
Annex 1.3 Immediate effect of COVID-19 on economic growth of Commonwealth countries, 2019 vs. 2020
Antigua and Barbuda
Australia
The Bahamas
Bangladesh
Barbados
Belize
Botswana
Brunei Darussalam
Cameroon
Canada
Cyprus
Dominica
Eswatini
Fiji
The Gambia
Ghana
Grenada
India
Jamaica
Kenya
Kiribati
Lesotho
Malawi
Malaysia
Maldives
Malta
Mauritius
Mozambique
Namibia
Nauru
New Zealand
Nigeria
Pakistan
Papua New Guinea
Rwanda
Saint Lucia
Samoa
Seychelles
Sierra Leone
Singapore
Solomon Islands
South Africa
Sri Lanka
St Kitts and Nevis
St Vincent and the Grenadines
Tanzania
Tonga
Trinidad and Tobago
Tuvalu
Uganda
United Kingdom
Vanuatu
Zambia
0 10-5-10-15-20-25-30-35
5
Growth rate (%)
2019 2020-pre-COVID estimates 2020-in-COVID actual
Note: Pre-COVID estimates indicate IMF’s growth projections made in October 2019 (before the onset of the pandemic) while in-COVID growth rates represent the actual growth figures released in April 2021. Guyana grew by 43 per cent in 2020 but is not included because it is an outlier on the chart.Source: Commonwealth Secretariat (using data from the IMF World Economic Outlook, October 2019 and April 2021)
5016_Book.indb 47 17-06-2021 08:32:15

48 \ Commonwealth Trade Review 2021
Annex 1.4 Orientation of merchandise trade flows towards Commonwealth countries, 2005 vs. 2019
Commonwealth
Africa
Botswana
Cameroon
Eswatini
The Gambia
Ghana
Kenya
Lesotho
Malawi
Mauritius
Mozambique
Namibia
Nigeria
Rwanda
Seychelles
Sierra Leone
South Africa
Tanzania
Uganda
Zambia
Asia
Bangladesh
Brunei Darussalam
India
Malaysia
Maldives
Pakistan
Singapore
Sri Lanka
Caribbean and Americas
Antigua and Barbuda
The Bahamas
Barbados
Belize
Canada
Dominica
Grenada
Guyana
Jamaica
Saint Kitts and Nevis
Saint Lucia
Saint Vincent and the Grenadines
Trinidad and Tobago
Europe
Cyprus
Malta
United Kingdom
Pacific
Australia
Fiji
Kiribati
Nauru
New Zealand
Papua New Guinea
Samoa
Solomon Islands
Tonga
Tuvalu
Vanuatu
15.6
25.8
82.2
7.7
65.4
51.9
33.8
47.2
20.1
33.0
34.3
21.9
51.5
13.5
29.4
27.4
6.8
28.2
41.2
22.3
21.6
24.3
19.8
21.0
21.9
26.7
35.1
16.6
24.5
27.3
4.0
14.8
10.6
36.0
34.3
3.3
73.3
40.7
52.8
34.1
17.0
43.6
19.6
18.6
8.4
19.1
24.8
8.3
27.7
25.1
63.5
38.7
46.6
35.2
54.5
65.5
7.7
11.7
23.4
15.7
17.3
34.5
36.5
15.8
86.1
29.1
28.4
43.0
38.1
25.0
28.0
42.6
38.8
35.3
11.9
29.9
8.3
35.2
39.8
19.6
27.3
21.8
19.3
31.8
19.8
25.7
37.7
19.3
21.2
23.2
6.4
38.4
14.8
46.2
33.4
6.0
80.6
47.2
39.8
19.8
40.6
35.5
21.6
14.9
8.2
12.6
11.6
8.2
20.2
18.3
41.4
6.5
20.5
27.1
38.7
33.2
10.9
38.8
7.3
50.4
Source: Commonwealth Secretariat (calculated using UNCTADstat dataset)
5016_Book.indb 48 17-06-2021 08:32:15

Chapter 1: Commonwealth Trade and the Pandemic \ 49
Gro
up/r
egio
n
Glo
bal e
xpo
rts
Intr
a-C
om
mo
nwea
lth
exp
ort
sR
elia
nce
on
Co
mm
onw
ealt
h m
arke
t (%
)V
alue
(US
$ m
illio
n)S
hare
(%)
Val
ue (U
S$
mill
ion)
Sha
re (%
)
Go
ods
Ser
vice
sG
oo
ds a
nd
serv
ices
Go
ods
Ser
vice
sG
oo
dsS
ervi
ces
Go
ods
an
d se
rvic
esG
oo
dsS
ervi
ces
Go
ods
Ser
vice
sG
oo
ds
and
serv
ices
Co
mm
onw
ealt
h to
tal
2,53
8, 2
221,
187,
637
3,72
5,85
967
.331
.943
3,89
223
8,7
5567
2,64
764
.535
.517
.320
118
.1
LDC
s to
tal
62,6
6316
,528
79,1
9279
.120
.914
,766
4,24
719
,013
77.7
22.3
23.6
25.7
24.0
Of w
hich
Afr
ica
23,5
919,
766
33,3
5770
.729
.37,
251
2,35
39,
604
75.5
24.5
30.7
24.1
28.8
T
he G
ambi
a13
322
936
236
.863
.239
60
9939
.46
0.6
29.1
26.1
27.2
Le
soth
o1,
014
311,
045
97.1
2.9
386
739
498
.11.
938
.123
.837
.7
M
alaw
i85
917
91,
038
82.8
17.2
215
4726
282
.117
.925
.026
.225
.2
M
ozam
biqu
e4
,716
923
5,63
983
.616
.42,
00
921
42,
223
90
.49.
642
.623
.139
.4
R
wan
da1,
162
992
2,15
354
.046
.013
822
536
338
.062
.011
.922
.716
.9
S
ierr
a Le
one
661
251
912
72.5
27.5
5550
105
52.0
48
.08
.320
.111
.5
Ta
nzan
ia4
,54
44
,119
8,6
6352
.447
.61,
811
914
2,72
466
.533
.539
.822
.231
.4
U
gand
a3,
472
2,02
95,
501
63.1
36.9
681
470
1,15
159
.24
0.8
19.6
23.2
20.9
Z
ambi
a7,
029
1,01
48
,043
87.4
12.6
1,91
736
62,
283
84
.016
.027
.336
.128
.4
Asi
a (B
angl
ades
h)38
,554
6,12
844
,683
86.3
13.7
7,44
21,
704
9,14
681
.418
.619
.327
.820
.5
Pac
ific
518
634
1,15
145
.055
.073
190
263
27.7
72.3
14.1
30.0
22.9
K
irib
ati
1311
2455
.34
4.7
0.8
1.4
2.3
36.9
63.1
6.5
13.7
9.7
S
olo
mo
n Is
land
s46
112
858
978
.321
.750
.131
.681
.761
.438
.610
.924
.713
.9
Tu
valu
06
61.
798
.30
.01.
11.
10
.799
.37.
318
.117
.9
V
anua
tu43
489
533
8.2
91.8
2215
617
812
.387
.750
.431
.933
.4
So
urce
: Co
mm
onw
ealt
h S
ecre
tari
at (c
alcu
late
d us
ing
UN
CTA
Dst
at a
nd W
TO
−O
ECD
BaT
IS d
atas
ets)
Ann
ex 1
.5 C
om
mo
nwea
lth
LDC
s gl
oba
l and
intr
a−C
om
mo
nwea
lth
expo
rt
pro
file,
201
9
5016_Book.indb 49 17-06-2021 08:32:15

50 \ Commonwealth Trade Review 2021
Endnotes
1 Since January 2021, following the
graduation of Vanuatu in December
2020, the Commonwealth
has 13 LDC members.
2 Even in 2019, when the value
of world merchandise trade
collapsed by 3 per cent, exports of
Commonwealth countries grew by
0.4 per cent. This growth was driven
by Commonwealth developing
countries. Between 2017 and 2019,
the combined goods and services
exports of developing members
grew at 4.5 per cent compared
with 3.4 per cent for developed
Commonwealth countries.
3 The share of developing countries
in the Commonwealth’s goods
exports expanded from 42 per
cent in 2005 to 51 per cent in 2019.
The corresponding increase in the
share of developing members in
services exports has been much
higher, from 31 per cent in 2005 to
47 per cent in 2019. Two developing
countries, India and Singapore,
contributed more than a third of
these services exports in 2019.
4 The inflection point for the
merchandise exports of
Commonwealth developed
and developing countries had
already been reached in 2009,
immediately after the global
financial crisis. In that year, the
value of goods Commonwealth
developing countries exported
exceeded that of the exports of
their developed counterparts.
5 The UK, Canada, Singapore,
India, Australia, Malaysia,
South Africa, Nigeria, New
Zealand and Bangladesh.
6 The UK, India, Singapore, Canada,
Australia, Malaysia, Malta, New
Zealand, South Africa and Cyprus.
7 Computed as: (EXP(0.192)-1)*100
8 By comparison, the share of
developed economies declined
from 40 per cent to 33 per cent,
a 7-percentage-point drop.
9 This is a composite measure based
on nine response indicators including
school closures, workplace closures
and travel bans, rescaled to a value
from 0 to 100 (100 = strictest).
10 In Bangladesh, for example, more
than half of garment manufacturers
in an online survey had orders
cancelled (Anner, 2020). Buyers
in the USA and the EU cancelled
orders to the tune of US$1.5 billion
from Bangladesh alone, affecting
more than 1,000 garment factories
in the country (Devnath, 2020).
11 In Bangladesh, more than 1 million
garment workers lost their jobs or
were furloughed before the end of
March 2020 (Anner, 2020). A survey
by the Worker Rights Consortium
(2020), spanning 396 garment sector
workers (70 per cent of whom were
women) in 158 factories across 9
countries (including Bangladesh, India
and Lesotho), found that 38 per cent
of workers had either lost their jobs
or had them temporarily suspended
as a result of the pandemic.
12 https://www.wto.org/english/res_e/
statis_e/tradeserv_stat_e.htm
13 Examples include hotels and
restaurants, as well as distribution
(although some parts of the retail
sector have been exempted
from restrictions to facilitate the
supply of essential goods).
14 This is estimated using the long-
run average trade growth rate of
5 per cent during 2010–2019.
15 The Commonwealth has a strong
network of institutions, private
sector bodies and trade experts.
There are more than 80 accredited
organisations working to deliver
dedicated work programmes
and facilitate people-to-people
contacts. For example, the Intra-
Commonwealth SME Association,
the Commonwealth Alliance
of Young Entrepreneurs, the
Commonwealth Businesswomen’s
Network and the Commonwealth
Enterprise and Investment
Council, among others, enable
regular interaction, information-
sharing and identification of
commercial opportunities. Two
Intra-Commonwealth SME Trade
Summits have been held in India
(May 2017) and Kenya (May 2019).
5016_Book.indb 50 17-06-2021 08:32:16

5016_Book.indb 51 17-06-2021 08:32:16
Chapter 2: Digitalisation and Trade in the Commonwealth
5016_Book.indb 52 17-06-2021 08:32:16

The Commonwealth’s digital trade in the decade before the COVID-19 pandemic was strong and growing. However, in almost all categories – digital goods, services and e-commerce – trade flows within and outside the Commonwealth are concentrated in a few countries, mostly developed and Asian members, underscoring the need to bridge the digital divide between members. The rapid acceleration in adopting information and communication technologies (ICTs) during the pandemic and the prospect of greater digitalisation in the future could exacerbate this divide.
This chapter maps the Commonwealth’s overall digital trade and assesses the effects of the COVID-19 pandemic on these flows. Some of the key takeaways are:
• The Commonwealth’s ICT goods trade flows expanded by US$25 billion in the decade before COVID-19, reaching $547.7 billion in 2019, of which $70.7 billion is intra-Commonwealth trade.
• There is a higher share of intra-Commonwealth trade in ICT services than there is in goods, and the Commonwealth advantage is likely to encourage these services. Overall, more than one-fifth of ICT services exported by Commonwealth countries went to fellow member countries in 2019.
• More than half of the Commonwealth’s total services trade is now delivered by digital means and these flows were worth US$1.2 trillion in 2019. This creates new trading opportunities for small states, least developed countries and countries in sub-Saharan Africa.
• Access to digital technologies and readiness to engage in digital trade are skewed between and within Commonwealth countries. Twelve Commonwealth countries recorded values above the world average on the E-Commerce Index, including all six developed members (four of which rank in the top twenty globally) and some developing members (Singapore, Malaysia, Mauritius, India, South Africa and Jamaica).
• The overall share of Commonwealth citizens using the internet has almost doubled in the past decade, to nearly half the combined population in 2019, while there has been a three-fold increase for African members to 32 per cent.
• To take advantage of a more digital future and the pursuit of the Sustainable Development Goals, Commonwealth countries must urgently ensure greater access, affordability and usage of the internet, especially for women and youth.
5016_Book.indb 53 17-06-2021 08:32:16

6%
9.3%2.6%
5.5%
Digital technologies have helped mitigate some of the economic and social consequences of the pandemic and will be a key driver of recovery.
Share of e-commerce sales in GDP
D I G I TA L G O O D S
D I G I TA L S E R V I C ES
e - CO M M E R C E
$70.7B I L L I O N
$4.6B I L L I O N
54%
$194B I L L I O N
in intra-Commonwealth ICT goods trade flows in 2019
in intra-CommonwealthICT services trade flows in 2019
in intra-Commonwealth tradein digitisable products in 2019
More than half of theCommonwealth’s services
trade flows are digitally delivered
5016_Book.indb 54 17-06-2021 08:32:16

2.1 Introduction
The COVID-19 pandemic has accelerated existing trends
related to the digitalisation of economies, societies
and work (Sneader and Singhal, 2021). With economic
lockdowns, travel restrictions and social distancing
measures, governments, businesses, workers, students
and consumers across the world have increasingly migrated
online to deliver or obtain goods and services, provide or
receive education and training, stream entertainment,
connect socially and do their jobs. During the initial year of
the pandemic, the number of people worldwide using the
internet increased by 7.3 per cent (316 million), although
this f igure could possibly be higher, given COVID-19-related
reporting constraints.1 Globally, internet access stands at
51.8 per cent (Kemp, 2021). Although the share of people
in the Commonwealth using the internet almost doubled
in the decade to 2019, to over 48 per cent, most citizens
remain offline and risk being left behind by an increasingly
digital future. With these challenges in mind, this chapter
maps the Commonwealth’s broad digital trade before the
pandemic and assesses the implications of COVID-19.
Across the Commonwealth and the world, mobile phone
connectivity, internet expansion and information and
communication technologies (ICTs) have helped mitigate
some of the economic and social consequences of the
pandemic (discussed in Chapter 1). For example, digitally
enabled firms, including micro, small and medium enterprises
(MSMEs), and farmers have adapted or switched to
e-commerce platforms, digital payments, smart contracts
and blockchains to continue trading; remote work is
increasingly feasible, especially through videoconferencing
and cloud computing; e-health and telemedicine services
and e-learning platforms have substituted for in-person
interactions; and digitised trade facilitation has minimised
physical contact between traders and customs officials.
While these developments are promising, the reality noted
earlier is that many Commonwealth developing countries
still lag in their ICT adoption, even though technological
leapfrogging, like mobile telephony, has helped improve
connectivity. Many small states, least developed countries
(LDCs) and countries in sub-Saharan Africa (SSA) were ill-
prepared for the abrupt shift online in various sectors during
the pandemic. The sudden and increased dependence on
ICTs since the outbreak of the pandemic has exacerbated
the existing digital divide across and within countries. A digital
gender divide between women and men in mobile phone
access and usage, digital connectivity and participation in
the digital economy also presents a significant challenge.
This chapter consists of six sections. Section 2.2, which
follows, analyses digital trade flows (representing exports
and imports)2 in the Commonwealth. Section 2.3 examines
investment in the ICT sector in the Commonwealth, which
has strong linkages to broader trade flows. Section 2.4 then
assesses the effects of the COVID-19 pandemic on digital
trade, especially e-commerce. Section 2.5 examines some
of the challenges involved in providing internet access in
Commonwealth countries, even as mobile internet coverage
grows, and highlights the need for greater investment in ICT
and digital infrastructure so countries can take advantage
of digital trade. Section 2.6 concludes the chapter.
5016_Book.indb 55 17-06-2021 08:32:16

56 \ Commonwealth Trade Review 2021
2.2 Digital trade in the Commonwealth pre-COVID-19
Advances in digital technologies,
alongside the emergence of new digital
products and platforms, have facilitated
rapid expansion in cross-border digital
trade flows in recent years (Box 2.1).
This section analyses trends in the
Commonwealth’s digital trade in the
decade preceding the outbreak of
COVID-19.3 Guided by the available
data, it does so for the following
categories: the Commonwealth’s trade
in ICT goods, including electronically
transmitted (ET) products (2.2.1); trade
in digital services, including ICT (2.2.2);
digitally deliverable services (DDS)
trade (2.2.3); and e-commerce sales
in Commonwealth countries (2.2.4).
2.2.1 Commonwealth trade in digital goods
Commonwealth ICT goods trade
Commonwealth countries collectively
accounted for 11.7 per cent of global
trade in ICT goods in 2019. This
share has fallen steadily over the
past decade, from a high of 14.5 per
cent in 2010 (Figure 2.1). Despite the
decline in relative terms, the overall
value of Commonwealth ICT goods
trade expanded from US$522.1 billion
in 2010 to $547.7 billion in 2019.
Commonwealth trade in ICT goods
is dominated by only a few members.
Three developing Commonwealth
countries (Singapore, Malaysia and
India) along with three developed
members (the UK, Canada and
Australia) collectively accounted for
96 per cent of this trade between
2010 and 2019 (Figure 2.2).
At the regional level, Asian member
countries have contributed the bulk
of Commonwealth trade in ICT goods
during the past decade, with their
combined share reaching around 72
per cent in 2019 (Table 2.1). Within
B O X 2 .1
W H AT I S C R O S S - B O R D E R D I G I TA L T R A D E ?
Cross-border digital trade involves all international trade in goods or services that are digitally ordered and/or delivered (OECD et al., 2020). This spans an array of digital goods and digitally ordered goods as well as digitally ordered and digitally deliverable services that are, or can be, traded across borders. The digitally ordered dimension, which encompasses e-commerce activities, comprises the cross-border sale of a good or service via methods that enable orders to be placed and delivered online. In these cases, digital technologies play a critical role in enabling traditional trade in goods and services and form part of the broader category of digital trade. In turn, digitally delivered trade involves the delivery of services internationally in an electronic format through digital means (ibid.). Cross-border flows of data, information and knowledge underpin all these dimensions of digital trade.
In certain instances, the digital aspects of trade are blurring the distinction between goods and services. This is the case, for example, with software-as-a-service (SaaS) and platform-as-a-service (PaaS), which are IT infrastructure services that enable trade in both goods and services. SaaS, for instance, may enable an application that drives sales of a particular good. A PaaS may facilitate the delivery of a service or e-commerce activity online. Embedded digital content (or services) is also increasingly a part of traded goods, as, for example, in the case of exporting a smart refrigerator that requires access to the good as well as the embedded service.
Digital trade functions within a broader digital ecosystem, encompassing digital infrastructure, computer networks, mobile devices, digital intermediation platforms, e-commerce and a host of other elements comprising the digital economy. It is thus broader than purely trade in ICT goods and services and includes digital sales and purchases across a range of sectors. The need to ensure interoperability across these different dimensions, coupled with the rapid acceleration of digitalisation, has brought new attention to the policy and regulatory frameworks required to facilitate cross-border digital trade. In this respect, Commonwealth policy-makers, parliamentarians and regulators must contend with a range of often overlapping issues related to the governance of digital trade (see Chapter 5) in areas such as taxation of digitally delivered goods and services across borders, cybersecurity and data protection, the movement of data across borders, harmonisation of technical standards, online consumer protection and dispute resolution, market concentration and competition on digital platforms, and cross-border digital payments (Elms, 2020).
5016_Book.indb 56 17-06-2021 08:32:16

Chapter 2: Digitalisation and Trade in the Commonwealth \ 57
Commonwealth Asia, trade in these
goods was dominated by Singapore
and Malaysia, accounting for 57 and
32 per cent of the regional total, on
average, between 2010 and 2019.
The six developed Commonwealth
countries collectively accounted for
around one-quarter (26.1 per cent)
of the Commonwealth’s ICT goods
trade in 2019, with their overall share
having declined since 2010. The value
of Commonwealth African countries’
trade in ICT goods was also lower in
2019 compared with 2010, as was
their share in the Commonwealth’s
total ICT goods trade, which had
dropped to 2.2 per cent in 2019. This
owed primarily to notable declines
in both ICT exports and imports by
South Africa, which is responsible for
around 70 per cent of ICT goods trade
in the region (Banga and Raga, 2021).
The shares of Caribbean and Pacific
small island developing states (SIDS)
in Commonwealth trade in ICT goods
remained low across the decade.
Trade in electronic components
(comprising intermediate goods
such as valves, tubes and electrical
apparatus) accounted for around
half of the Commonwealth’s trade in
ICT goods, and their share increased
between 2010 and 2019. Trade in
computers and peripheral equipment
(21.8 per cent) and communication
equipment (18.8 per cent) also
accounted for significant shares, on
average, between 2010 and 2019.
Intra-Commonwealth trade in ICT
goods (final two columns of Table 2.1)
amounted to US$70.7 billion in 2019,
representing almost 13 per cent of
the Commonwealth’s total ICT goods
trade.4 This trade is dominated by
just seven Commonwealth countries
that collectively accounted for 98 per
cent of intra-Commonwealth ICT
goods exports in 2019 (bottom panel
of Figure 2.3). Developing members
contribute around 89 per cent of intra-
Commonwealth trade in ICT goods (top
panel of Figure 2.3), with the bulk of this
trade in Commonwealth Asian members.
Developing small states and SIDS
(excluding Singapore) contributed less
than 1 per cent of intra-Commonwealth
trade in ICT goods in 2019.
Commonwealth trade in digitisable products
Trade in digitisable products that can
be electronically transmitted – such as
audio files, video files or video games
and e-books – is significant in the
US
$ bi
llion
Sha
re (%
)
0
100
200
300
400
500
600
0
2
4
6
8
12
14
10
16
2010 2011 2012 2013 2014 2015 2016 2017 2018 2019
CW ICT goods trade CW share in world ICT goods trade
Notes: ICT goods trade flows represent the sum of exports and imports of ICT goods. The figure includes only 33 Commonwealth countries with data on imports and exports of ICT goods in 2019. World ICT trade is calculated as the sum of ICT trade for 33 Commonwealth and 84 non-Commonwealth countries.Source: Banga and Raga (2021) for Commonwealth Secretariat (calculated using UNCTADstat and WTO-OECD datasets)
F I G U R E 2 . 1CO M M O N W E A LT H T RA D E ( E X P O RTS A N D I M P O RTS ) I N I CT G O O DS, 2 0 1 0 – 2 0 1 9
5016_Book.indb 57 17-06-2021 08:32:16

58 \ Commonwealth Trade Review 2021
Commonwealth’s global trade Intra-Commonwealth trade
2010 2019 2019
Value (US$ million)
Share (%)Value
(US$ million)Share (%)
Value (US$ million)
Intra-CW share in share in global ICT goods trade (%)
Commonwealth total 522,093 – 547,697 – 70,652 12.9
of which
Developed 156,164 29.9 143,073 26.1 7,780 5.4
Developing 365,928 70.1 404,624 73.9 62,872 15.5
of which
Africa 14,214 2.7 12,019 2.2 1,469 12.2
Asia 351,229 67.3 391,968 71.6 61,280 15.6
Caribbean SIDS 405 0.08 424 0.08 23 5.5
Pacific SIDS 79 0.02 212 0.04 100 47.1
Notes: ICT goods trade represents the sum of exports and imports of ICT goods. Total Commonwealth ICT goods trade (US$ million) is calculated as the sum of ICT goods trade for 33 Commonwealth countries. The Commonwealth sample for ICT goods trade covers six developed, thirteen African, five Asian, seven Caribbean and two Pacific countries. The data on ICT services trade covers 53 Commonwealth countries.Source: Banga and Raga (2021) for Commonwealth Secretariat (calculated using UNCTADstat dataset for ICT goods trade and the WTO-OECD BaTIS dataset for ICT services trade; computations for intra-Commonwealth ICT goods trade in 2019 are based on bilateral data from WITS)
TA B L E 2 . 1CO M M O N W E A LT H G LO B A L A N D I N T RA- CO M M O N W E A LT H T RA D E ( E X P O RTS A N D I M P O RTS ) I N I CT G O O DS, B Y L E V E L O F ECO N O M I C D E V E LO P M E N T A N D R EG I O N , 2 0 1 0 A N D 2 0 1 9
40%Singapore
22%Malaysia
14%United Kingdom
8%Canada
7%India
5%Australia
4%All other CW countries
Notes: ICT goods trade flows represent the sum of exports and imports of ICT goods. The figure is based on data for 33 Commonwealth countries with data on imports and exports of ICT goods between 2010 and 2019.Source: Commonwealth Secretariat (calculated using UNCTADstat dataset)
F I G U R E 2 . 2D I ST R I B U T I O N O F CO M M O N W E A LT H I CT G O O DS T RA D E ( E X P O RTS A N D I M P O RTS ) , 2 0 1 0 – 2 0 1 9
5016_Book.indb 58 17-06-2021 08:32:17

Chapter 2: Digitalisation and Trade in the Commonwealth \ 59
Commonwealth, particularly in the
case of intra-Commonwealth trade.
New technologies such as artificial
intelligence, big data applications and
the Internet of Things (IoT) are fuelling
growth in trade in these products by
significantly reducing transaction
costs and facilitating their cross-
border movement (Elms, 2020).
Intra-Commonwealth trade (exports
plus imports) in ET products was worth
more than US$4.6 billion in 2019.5 In
the period immediately preceding the
onset of COVID-19 (2017-2019), the UK,
Singapore, Australia, Malaysia and India
were major exporters of ET products to
other Commonwealth countries, and
two other developing African members
– Zambia and South Africa – also ranked
among the top ten intra-Commonwealth
exporters (Figure 2.4). Around one-third
of intra-Commonwealth exports of ET
products went to South Africa, while
Australia, New Zealand, India, the UK
and Singapore were also significant
importers of these products from other
Commonwealth members. In addition
to South Africa and Zambia, artists in
other Commonwealth African countries
are also increasingly creating digitisable
products and content (Box 2.2).
89%Developing
11%Developed
DEVELOPMENT LEVEL
48%Singapore
31%Malaysia
8%India
4%Australia
3%UK
2%South Africa
2%Canada
2%All other CW countries
BY COUNTRY
Source: Commonwealth Secretariat (calculated using bilateral data from WITS)
F I G U R E 2 . 3D I ST R I B U T I O N O F I N T RA- CO M M O N W E A LT H T RA D E I N I CT G O O DS, 2 0 1 9
5016_Book.indb 59 17-06-2021 08:32:17
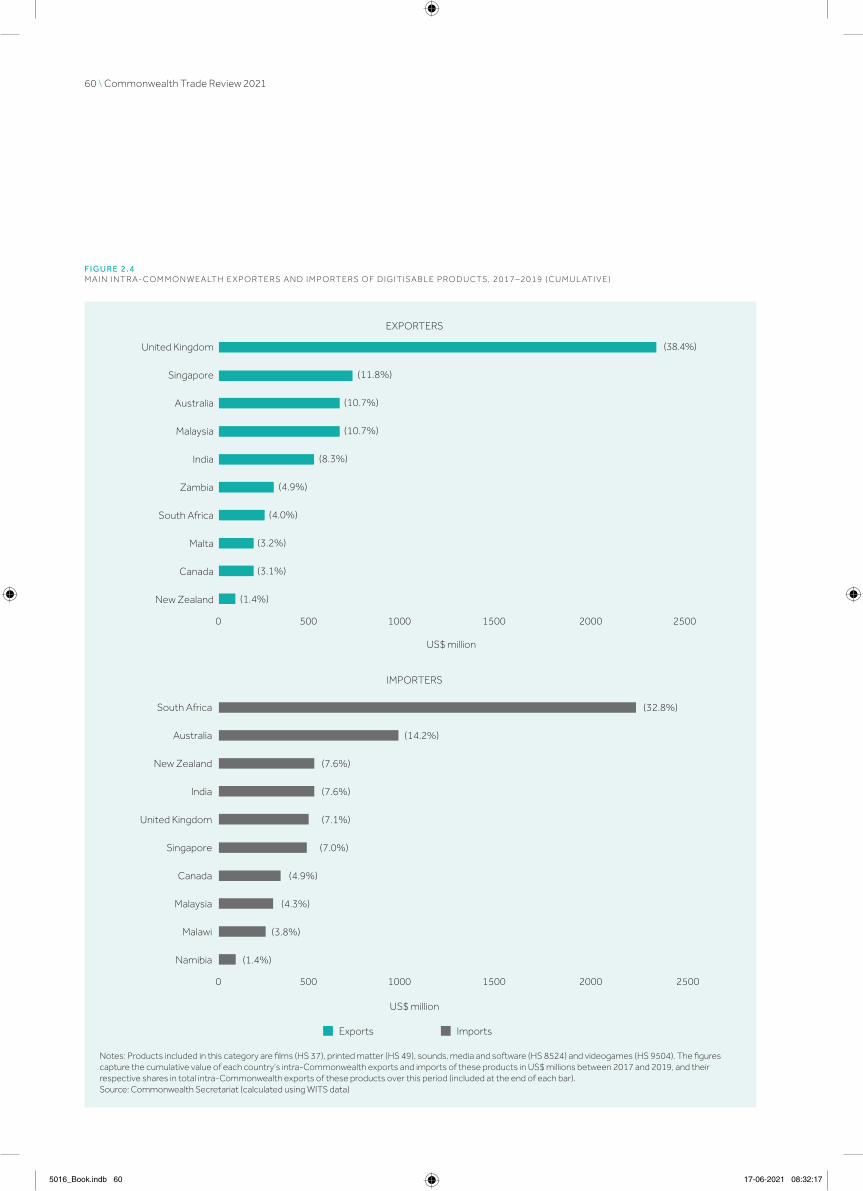
60 \ Commonwealth Trade Review 2021
0 500 1000 1500 2000 2500
EXPORTERS
US$ million
US$ million
United Kingdom
Singapore
Australia
Malaysia
India
Zambia
South Africa
Malta
Canada
New Zealand
IMPORTERS
2500
South Africa
Australia
New Zealand
India
United Kingdom
Singapore
Canada
Malaysia
Malawi
Namibia
(38.4%)
(11.8%)
(10.7%)
(10.7%)
(8.3%)
(4.9%)
(4.0%)
(3.2%)
(3.1%)
(1.4%)
Exports Imports
(32.8%)
(14.2%)
(7.6%)
(7.6%)
(7.1%)
(7.0%)
(4.9%)
(4.3%)
(3.8%)
(1.4%)
0 500 1000 1500 2000
Notes: Products included in this category are films (HS 37), printed matter (HS 49), sounds, media and software (HS 8524) and videogames (HS 9504). The figures capture the cumulative value of each country’s intra-Commonwealth exports and imports of these products in US$ millions between 2017 and 2019, and their respective shares in total intra-Commonwealth exports of these products over this period (included at the end of each bar).Source: Commonwealth Secretariat (calculated using WITS data)
F I G U R E 2 . 4M A I N I N T RA- CO M M O N W E A LT H E X P O RT E RS A N D I M P O RT E RS O F D I G I T I SA B L E P RO D U CTS, 2 0 1 7 – 2 0 1 9 ( C U M U L AT I V E )
5016_Book.indb 60 17-06-2021 08:32:17

Chapter 2: Digitalisation and Trade in the Commonwealth \ 61
2.2.2 Commonwealth trade in digital services
Commonwealth ICT services trade
The Commonwealth has consistently
been a relatively more significant
contributor to global ICT services
trade than it has been to ICT goods
trade over the past decade. Even
so, the Commonwealth’s share in
global ICT services trade declined
between 2010 and 2019, falling by
more than 3 percentage points to
reach 18.1 per cent in 2019 (Figure
2.5). Despite this, ICT services have
become an increasingly important
component of the Commonwealth’s
total services trade, and as a share
of services GDP (Commonwealth
Secretariat, 2020). Total trade in ICT
services across the Commonwealth
expanded from US$113.7 billion in
2010 to $194.5 billion in 2019.
Developing members accounted
for almost two-thirds of the
Commonwealth’s ICT services trade in
2019, a share more than 8 percentage
points higher than in 2010 (Table 2.2).
Commonwealth Asian countries were
responsible for a large portion of this
trade (60.5 per cent in 2019, up by 9
percentage points compared with 2010),
driven mostly by India and Singapore.
The share of African countries in the
Commonwealth’s ICT services trade,
at 2.2 per cent in 2019, was identical
to their share in Commonwealth
ICT goods trade in that year; in both
cases, their share declined after 2010.
Caribbean and Pacific SIDS hold higher
shares of Commonwealth trade in
ICT services relative to their shares in
Commonwealth trade in ICT goods,
although their combined shares still
amount to less than 1 per cent, and
either stagnated (in the case of Pacific
B O X 2 . 2
A F R I C A A N D T H E D I G I TA L D E L I V E R Y O F C R E AT I V E C O N T E N T
Music and audio-visual are creative industries that increasingly deliver their content by digital means or through streaming. In Africa, the internet and smartphones have helped Nigeria’s Nollywood become a fully fledged film industry, with 89.6 per cent of its revenues coming from its online presence. Nollywood ranks second in the world behind Bollywood (India) in terms of the number of films produced and third after Hollywood and Bollywood in terms of revenues. The industry is worth around US$3 billion (or 1.4 per cent of Nigeria’s gross domestic product, GDP) and employs more than a million people directly or indirectly, making it Nigeria’s second-largest source of employment after agriculture (AUC/OECD, 2021).
Africans are consuming more digital content as a result of expanding internet connectivity and the availability of an array of devices. However, high data costs have contributed to rampant piracy and this puts the sustainability of the entertainment industry at risk. Yet African entertainment start-ups had their best funding year on record in 2020, securing 2 per cent of the available funding, compared with 0.15 per cent in 2019. The immensity of the growth reflects the success of a handful of companies – all that funding went to just 10 films – and not of the sector overall. The main funding recipient was Kenya’s Mdundo, a music streaming and downloading platform. Investors are reportedly looking for opportunities beyond congested spaces like fintech, health and e-commerce (Quartz Africa Weekly Brief, 2021).
US
$ bi
llion
Sha
re (%
)
0
50
100
150
200
250
0
5
10
15
20
25
2010 2011 2012 2013 2014 2015 2016 2017 2018 2019
CW ICT services trade (US$ billion) CW share in World ICT services trade (%)
Notes: ICT services trade flows represent the sum of exports and imports of ICT services. The figure includes only countries with data on imports and exports of ICT services in 2019. World ICT trade is calculated as the sum of ICT trade for 33 Commonwealth and 84 non-Commonwealth countries.Source: Banga and Raga (2021) for Commonwealth Secretariat (calculated using UNCTADstat and WTO-OECD datasets)
F I G U R E 2 . 5CO M M O N W E A LT H G LO B A L T RA D E ( E X P O RTS A N D I M P O RTS ) I N I CT S E R V I C ES, 2 0 1 0 – 2 0 1 9
5016_Book.indb 61 17-06-2021 08:32:17
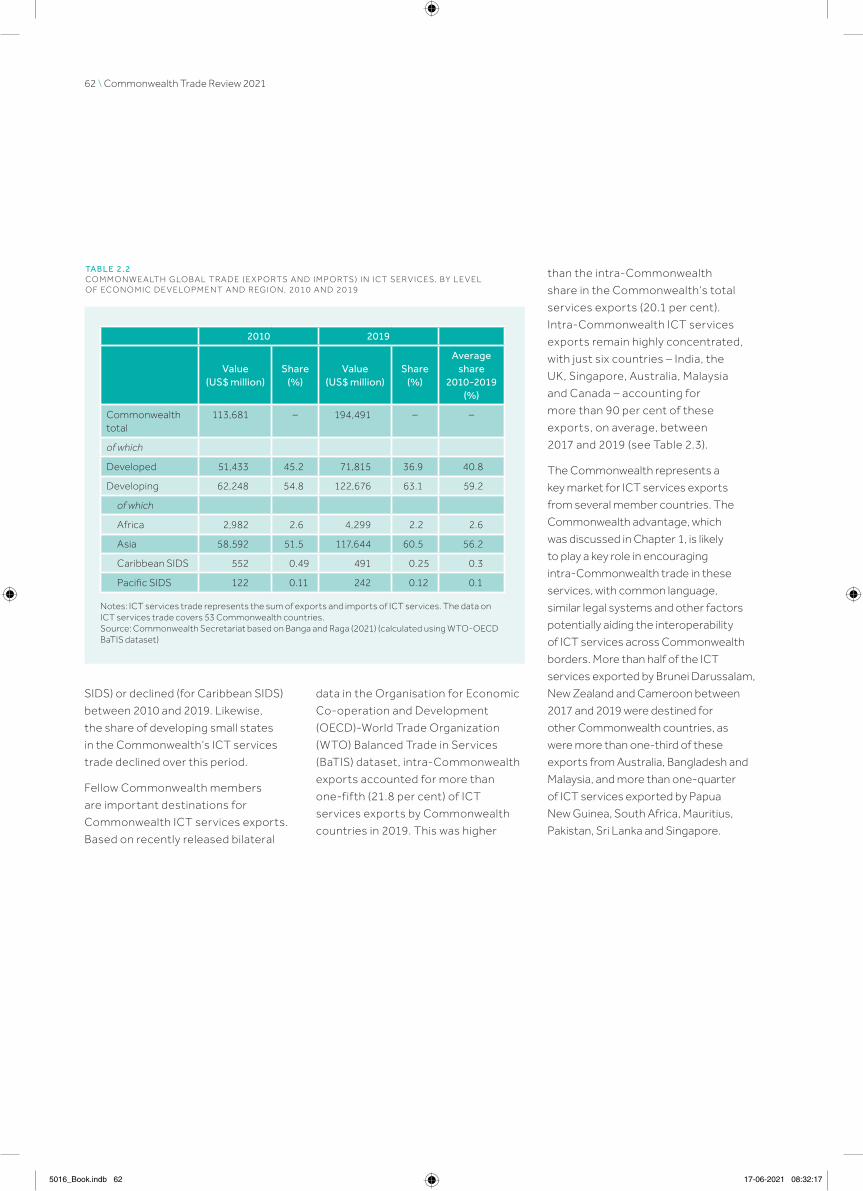
62 \ Commonwealth Trade Review 2021
SIDS) or declined (for Caribbean SIDS)
between 2010 and 2019. Likewise,
the share of developing small states
in the Commonwealth’s ICT services
trade declined over this period.
Fellow Commonwealth members
are important destinations for
Commonwealth ICT services exports.
Based on recently released bilateral
data in the Organisation for Economic
Co-operation and Development
(OECD)-World Trade Organization
(WTO) Balanced Trade in Services
(BaTIS) dataset, intra-Commonwealth
exports accounted for more than
one-fifth (21.8 per cent) of ICT
services exports by Commonwealth
countries in 2019. This was higher
than the intra-Commonwealth
share in the Commonwealth’s total
services exports (20.1 per cent).
Intra-Commonwealth ICT services
exports remain highly concentrated,
with just six countries – India, the
UK, Singapore, Australia, Malaysia
and Canada – accounting for
more than 90 per cent of these
exports, on average, between
2017 and 2019 (see Table 2.3).
The Commonwealth represents a
key market for ICT services exports
from several member countries. The
Commonwealth advantage, which
was discussed in Chapter 1, is likely
to play a key role in encouraging
intra-Commonwealth trade in these
services, with common language,
similar legal systems and other factors
potentially aiding the interoperability
of ICT services across Commonwealth
borders. More than half of the ICT
services exported by Brunei Darussalam,
New Zealand and Cameroon between
2017 and 2019 were destined for
other Commonwealth countries, as
were more than one-third of these
exports from Australia, Bangladesh and
Malaysia, and more than one-quarter
of ICT services exported by Papua
New Guinea, South Africa, Mauritius,
Pakistan, Sri Lanka and Singapore.
2010 2019
Value (US$ million)
Share (%)
Value (US$ million)
Share (%)
Average share
2010-2019 (%)
Commonwealth total
113,681 – 194,491 – –
of which
Developed 51,433 45.2 71,815 36.9 40.8
Developing 62,248 54.8 122,676 63.1 59.2
of which
Africa 2,982 2.6 4,299 2.2 2.6
Asia 58,592 51.5 117,644 60.5 56.2
Caribbean SIDS 552 0.49 491 0.25 0.3
Pacific SIDS 122 0.11 242 0.12 0.1
Notes: ICT services trade represents the sum of exports and imports of ICT services. The data on ICT services trade covers 53 Commonwealth countries.Source: Commonwealth Secretariat based on Banga and Raga (2021) (calculated using WTO-OECD BaTIS dataset)
TA B L E 2 . 2CO M M O N W E A LT H G LO B A L T RA D E ( E X P O RTS A N D I M P O RTS ) I N I CT S E R V I C ES, B Y L E V E L O F ECO N O M I C D E V E LO P M E N T A N D R EG I O N , 2 0 1 0 A N D 2 0 1 9
5016_Book.indb 62 17-06-2021 08:32:17

Chapter 2: Digitalisation and Trade in the Commonwealth \ 63
CountryValue
(US$ million)Country share
(%)Reliance on Commonwealth
(%)
United Kingdom 3,178 16.6 9.5
Singapore 3,109 16.4 26.3
Australia 1,155 6.1 35.9
Malaysia 710 3.8 34.9
Canada 515 2.7 6.2
Cyprus 457 2.4 23.8
Bangladesh 429 2.3 35.4
New Zealand 245 1.3 50.3
South Africa 180 1 28.5
Pakistan 102 0.5 25.7
Mauritius 92 0.5 28.4
Malta 54 0.3 12.1
Maldives 45 0.2 16.5
Nigeria 38 0.2 22.1
Barbados 37 0.2 10.9
Seychelles 26 0.1 20.1
Fiji 17 0.1 20.7
Jamaica 16 0.1 20.1
Sri Lanka 15 0.1 27.6
Papua New Guinea 12 0.1 30.1
Brunei Darussalam 9 0.1 55
Belize 8 0 12.9
Kenya 8 0 23.5
Namibia 3 0 15
Tanzania 2 0 13
The Bahamas 1 0 8.4
Cameroon 1 0 50
Eswatini 0 0 11.1
Note: The last column on reliance indicates the share of intra-Commonwealth exports in each country’s total ICT services exports.Source: Banga and Raga (2021) for Commonwealth Secretariat (calculated using WTO-OECD BaTIS dataset)
TA B L E 2 . 3I N T RA- CO M M O N W E A LT H I CT S E R V I C ES E X P O RTS, A V E RAG E 2 0 1 7 - 2 0 1 9
5016_Book.indb 63 17-06-2021 08:32:18

64 \ Commonwealth Trade Review 2021
2.2.3 Commonwealth trade in digitally deliverable services
ICT services are also a key enabler of
trade in other services, for example
when they facilitate the delivery of
services remotely. Digitally deliverable
services (DDS) include both ICT
services (e.g. SaaS or Infrastructure-
as-a-Service in, for instance, the case
of data processing services) and ICT-
enabled services such as legal services,
financial services, IT consulting services,
education and training, marketing
and sales, health care, intellectual
property charges, management
and other business services (e.g.
engineering, technical, and research and
development services), and audio-visual
and related services (UNCTAD, 2019).
Commonwealth trade in DDS has
increased steadily over the past decade,
both in absolute terms and as a share
of the Commonwealth’s total trade in
services.6 Between 2011 and 2019, the
value of these services grew by 44.8
per cent from US$815 billion to $1.2
trillion.7 By 2018, more than half (54
per cent) of the Commonwealth’s total
services trade flows were delivered
by digital means (Figure 2.6).
Despite this rapid growth in DDS, this
trade is highly concentrated in only
a few Commonwealth members,
reflecting the broader pattern of the
Commonwealth’s global exports (see
Chapter 1). In 2011, the six developed
economies accounted for 62 per
cent of total Commonwealth trade in
these services, although their share
declined by 2019, as shown in Figure
2.7. At the same time, the share of
Commonwealth Asian members
expanded by more than 6 percentage
points to 40.9 per cent in 2019, mostly
driven by Singapore and India. The
share of African member countries
remained stable across the decade,
collectively accounting for 3.1 per cent
of Commonwealth trade in DDS in 2019.
Caribbean and Pacific SIDS made only
marginal contributions over this period,
amounting to less than 1 per cent of
the Commonwealth’s trade in these
services in any given year. This partly
reflects the small populations in these
countries, which translates into lower
numbers of consumers importing DDS
and fewer individuals and firms supplying
DDS across borders (discussed
further at the end of this section).
Likewise, eight Commonwealth
LDCs8 with available data contributed
less than 1 per cent of the
Commonwealth’s annual trade in DDS
across the past decade, although the
absolute value of their exports and
imports of these services more than
doubled from US$3.6 billion in 2011 to
$7.7 billion in 2019. The overall shares
of Commonwealth small states and
SIDS in trade in DDS were equally
small, and declined from 1 per cent
to 0.7 per cent in the case of small
states and from 0.9 per cent to 0.6 per
cent for SIDS between 2011 and 2019.
Despite these small shares, there is
potential for Commonwealth LDCs,
small states and SIDS to leverage
DDS for trade and development,
particularly given the limitations they
face in terms of capital investment and
shortages in physical infrastructure
(Banga and Raga, 2021). Harnessing
digital technologies can help
entrepreneurs and businesses in
these countries overcome geographic
barriers to accessing and delivering
services across borders, enabling
them to be provided remotely at
lower cost and to larger markets.
Among developed Commonwealth
members, trade in DDS is largely
dominated by the UK, Canada and
US
$ bi
llion
Sha
re (%
)
0
200
400
800
1200
1400
600
1000
47
48
49
50
54
52
53
51
55
2011 2012 2013 2014 2015 2016 2017 2018 2019
CW total DDS trade (left-axis, US$ billions)
Share of DDS in total CW trade in services (right-axis, %)
Note: DDS trade flows represent the sum of exports and imports of these services. The period from 2011 to 2019 is used to maintain a consistent sample of Commonwealth countries. The sample covers 37 Commonwealth members with both import and export data on DDS in each of these years.Source: Banga and Raga (2021) for Commonwealth Secretariat (calculated using UNCTADstat dataset)
F I G U R E 2 . 6CO M M O N W E A LT H T RA D E ( E X P O RTS A N D I M P O RTS ) I N D I G I TA L LY D E L I V E RA B L E S E R V I C ES, 2 0 1 1 – 2 0 1 9
5016_Book.indb 64 17-06-2021 08:32:18

Chapter 2: Digitalisation and Trade in the Commonwealth \ 65
Australia. All three of these countries
ranked among the Commonwealth’s
top five by value of trade in these
services during the most recent
period preceding the COVID-19
pandemic (2017–2019) (Figure 2.8). In
Commonwealth Asia, trade in these
services is mostly led by Singapore
and India, and, to a lesser extent,
Malaysia. The annual value of trade
in DDS averaged US$209.7 billion
in Singapore and $200.4 billion in
India between 2017 and 2019. Two
Commonwealth African countries –
Nigeria and Ghana – rank among the
top 10, with, on average, $14.4 billion
and $11.7 billion in annual trade in
DDS, respectively, over this period.
Several other developing members
– South Africa, Pakistan, Sri Lanka,
Kenya, Trinidad and Tobago, Mauritius
and Cameroon along with two LDCs
(Bangladesh and Mozambique) – sat
just outside the top 10 but within the
top 20 Commonwealth countries by
average annual value of trade in these
services between 2017 and 2019.
This aggregate picture masks
important nuances. Several of the
top 10 Commonwealth countries
by absolute value of trade in DDS
are large members with substantial
populations. This translates into
more consumers to consume digitally
imported services and more individuals
and firms to export such services
across borders. When trade in DDS
is considered on a per capita basis
(as in Figure 2.9, which shows top
countries by average value of DDS
exports and imports per 1,000 people
between 2017 and 2019), several
other Commonwealth small states
and Caribbean SIDS (Antigua and
Barbuda, St Kitts and Nevis and The
Bahamas) feature among the top 10,
with others such as Grenada, Dominica
and Saint Lucia falling just outside.
62.1%$506,625mDeveloped 34.2%$278,895m Asia
0.4%$25,056m Caribbean SIDS
3.1%$3,080m Africa
0.2%$1,703m Pacific SIDS
2011
55.6%$656,034m Developed
40.9%$482,246m Asia
3.1%$36,780m Africa
0.3%$3,761m Caribbean SIDS
0.1%$1,443m Pacific SIDS
2019
Note: Trade in DDS represents the sum of exports and imports of these services. The sample covers 37 Commonwealth members with both import and export data on DDS in 2011 and 2019.Source: Banga and Raga (2021) for Commonwealth Secretariat (calculated using UNCTADstat dataset)
F I G U R E 2 . 7R EG I O N A L S H A R ES O F TOTA L CO M M O N W E A LT H T RA D E ( E X P O RTS A N D I M P O RTS ) I N D I G I TA L LY D E L I V E RA B L E S E R V I C ES, 2 0 1 1 A N D 2 0 1 9
5016_Book.indb 65 17-06-2021 08:32:18

66 \ Commonwealth Trade Review 2021
2.2.4 E-commerce in the Commonwealth
E-commerce involves the sale or
purchase of goods and services via
electronic means specifically designed
for the purpose of receiving or placing
orders (OECD et al., 2020). This
may involve business-to-business,
business-to-consumer, business-to-
government or consumer-to-consumer
transactions. The prevailing evidence
based on data for the years preceding
the COVID-19 crisis suggests
levels of e-commerce activity vary
widely across Commonwealth
countries, and readiness to engage
in e-commerce is uneven within and
between member countries. This is
clear from the 2020 edition of the
United Nations Conference on Trade
and Development Business-to-
Consumer (B2C) E-Commerce Index,
which ranks 152 countries across
the world based on one dimension9
of their readiness to support online
commerce (Figure 2.10).10
Twelve Commonwealth countries
recorded values above the world
average on the 2020 B2C E-Commerce
Index, including all six developed
members (four of which rank in
the top twenty globally) and some
developing members (Singapore,
Malaysia, Mauritius, India, South Africa
and Jamaica). However, a few African
and Asian members – most of which
are LDCs – are located on the bottom
half of the Index globally. Moreover,
overall scores on the Index deteriorated
in 2020 compared with 2019 for 22
of the Commonwealth countries
covered, with the largest declines
observed in Mauritius, Cyprus, Sierra
Leone and Bangladesh. This suggests
there is significant scope to improve
levels of preparedness to engage
0 100 200 300 400 500
US$ billion
United Kingdom
Singapore
India
Canada
Australia
Malaysia
Malta
Nigeria
Ghana
Cyprus
Note: DDS trade flows represent the sum of exports and imports of these services. The sample covers 37 Commonwealth members with both import and export data on DDS for 2017, 2018 and 2019.Source: Banga and Raga (2021) for Commonwealth Secretariat (calculated using UNCTADstat dataset)
0 5 10 15 4035302520
US$ value of trade per 1,000 people
Singapore
Malta
Cyprus
Seychelles
United Kingdom
Antigua and Barbuda
St Kitts and Nevis
Canada
The Bahamas
New Zealand
Note: DDS trade flows represented as the annual average of total trade (exports plus imports) in DDS between 2017 and 2019. Each country’s average annual population between 2017 and 2019 is used to calculate the per capita figures.Source: Commonwealth Secretariat (calculated using UNCTADstat dataset for DDS trade and WDI for population data)
F I G U R E 2 . 8TO P 1 0 CO M M O N W E A LT H CO U N T R I ES B Y V A LU E O F T RA D E ( E X P O RTS A N D I M P O RTS ) I N D I G I TA L LY D E L I V E RA B L E S E R V I C ES, A V E RAG E 2 0 1 7 – 2 0 1 9
F I G U R E 2 . 9TO P 1 0 CO M M O N W E A LT H CO U N T R I ES B Y V A LU E O F T RA D E ( E X P O RTS A N D I M P O RTS ) I N D I G I TA L LY D E L I V E RA B L E S E R V I C ES P E R 1 , 0 0 0 P EO P L E , A V E RAG E 2 0 1 7 – 2 0 1 9
5016_Book.indb 66 17-06-2021 08:32:18
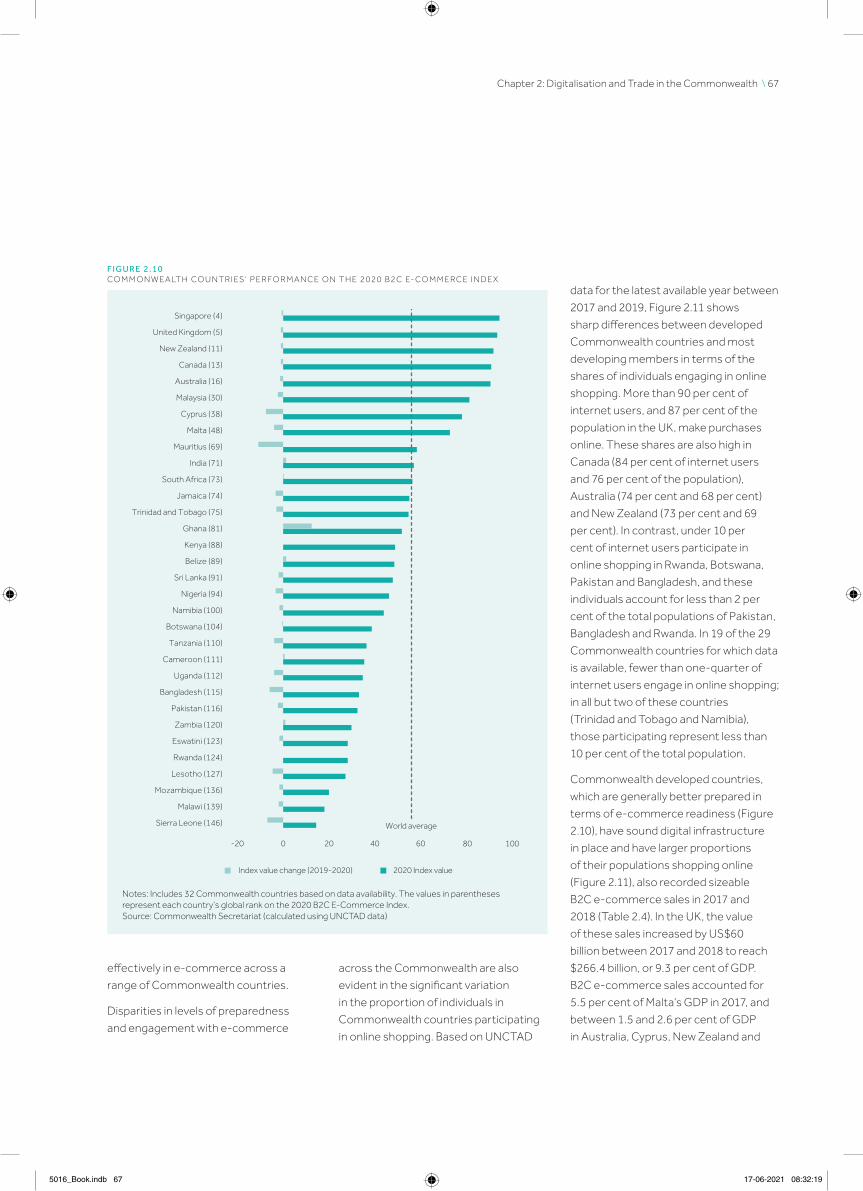
Chapter 2: Digitalisation and Trade in the Commonwealth \ 67
effectively in e-commerce across a
range of Commonwealth countries.
Disparities in levels of preparedness
and engagement with e-commerce
across the Commonwealth are also
evident in the significant variation
in the proportion of individuals in
Commonwealth countries participating
in online shopping. Based on UNCTAD
data for the latest available year between
2017 and 2019, Figure 2.11 shows
sharp differences between developed
Commonwealth countries and most
developing members in terms of the
shares of individuals engaging in online
shopping. More than 90 per cent of
internet users, and 87 per cent of the
population in the UK, make purchases
online. These shares are also high in
Canada (84 per cent of internet users
and 76 per cent of the population),
Australia (74 per cent and 68 per cent)
and New Zealand (73 per cent and 69
per cent). In contrast, under 10 per
cent of internet users participate in
online shopping in Rwanda, Botswana,
Pakistan and Bangladesh, and these
individuals account for less than 2 per
cent of the total populations of Pakistan,
Bangladesh and Rwanda. In 19 of the 29
Commonwealth countries for which data
is available, fewer than one-quarter of
internet users engage in online shopping;
in all but two of these countries
(Trinidad and Tobago and Namibia),
those participating represent less than
10 per cent of the total population.
Commonwealth developed countries,
which are generally better prepared in
terms of e-commerce readiness (Figure
2.10), have sound digital infrastructure
in place and have larger proportions
of their populations shopping online
(Figure 2.11), also recorded sizeable
B2C e-commerce sales in 2017 and
2018 (Table 2.4). In the UK, the value
of these sales increased by US$60
billion between 2017 and 2018 to reach
$266.4 billion, or 9.3 per cent of GDP.
B2C e-commerce sales accounted for
5.5 per cent of Malta’s GDP in 2017, and
between 1.5 and 2.6 per cent of GDP
in Australia, Cyprus, New Zealand and
Singapore (4)
United Kingdom (5)
New Zealand (11)
Canada (13)
Australia (16)
Malaysia (30)
Cyprus (38)
Malta (48)
Mauritius (69)
India (71)
South Africa (73)
Jamaica (74)
Trinidad and Tobago (75)
Ghana (81)
Kenya (88)
Belize (89)
Sri Lanka (91)
Nigeria (94)
Namibia (100)
Botswana (104)
Tanzania (110)
Cameroon (111)
Uganda (112)
Bangladesh (115)
Pakistan (116)
Zambia (120)
Eswatini (123)
Rwanda (124)
Lesotho (127)
Mozambique (136)
Malawi (139)
Sierra Leone (146)
-20 0 20 40 60
World average
Index value change (2019-2020) 2020 Index value
10080
Notes: Includes 32 Commonwealth countries based on data availability. The values in parentheses represent each country’s global rank on the 2020 B2C E-Commerce Index.Source: Commonwealth Secretariat (calculated using UNCTAD data)
F I G U R E 2 . 1 0CO M M O N W E A LT H CO U N T R I ES ’ P E R F O R M A N C E O N T H E 2 0 2 0 B 2 C E- CO M M E RC E I N D E X
5016_Book.indb 67 17-06-2021 08:32:19

68 \ Commonwealth Trade Review 2021
Canada in 2018. Among developing
country members, Malaysia is one of
the Commonwealth’s top performers
in terms of B2C e-commerce readiness
and this is matched by substantial
B2C e-commerce sales, amounting
to $19.2 billion, or 6 per cent of GDP,
in 2017. Malaysia aside, the generally
lower shares of e-commerce sales
in GDP in developing countries
compared with developed members
suggest considerable scope to grow
e-commerce in Commonwealth
developing regions. To do so, these
countries need to improve their enabling
environments for e-commerce and
eliminate obstacles to e-commerce
adoption (see Chapter 5).
United Kingdom
Canada
Australia
New Zealand
Malta
Singapore
Cyprus
Malaysia
Mozambique
United Republic of Tanzania
Namibia
Trinidad and Tobago
Zambia
India
Kenya
South Africa
Nigeria
Ghana
Uganda
Sierra Leone
Malawi
Mauritius
Sri Lanka
Lesotho
Cameroon
Rwanda
Botswana
Pakistan
Bangladesh
0 10 20 40 60
As a share of population (%) As a share of Internet users (%)
1008030 50
% share
70 90
Note: Includes 29 Commonwealth countries based on data availability.Source: Commonwealth Secretariat (calculated using UNCTAD data)
F I G U R E 2 . 1 1O N L I N E S H O P P E RS AS A S H A R E O F I N T E R N ET U S E RS A N D TOTA L P O P U L AT I O N I N CO M M O N W E A LT H CO U N T R I ES, L AT EST A V A I L A B L E Y E A R B ET W E E N 2 0 1 7 A N D 2 0 1 9
5016_Book.indb 68 17-06-2021 08:32:19
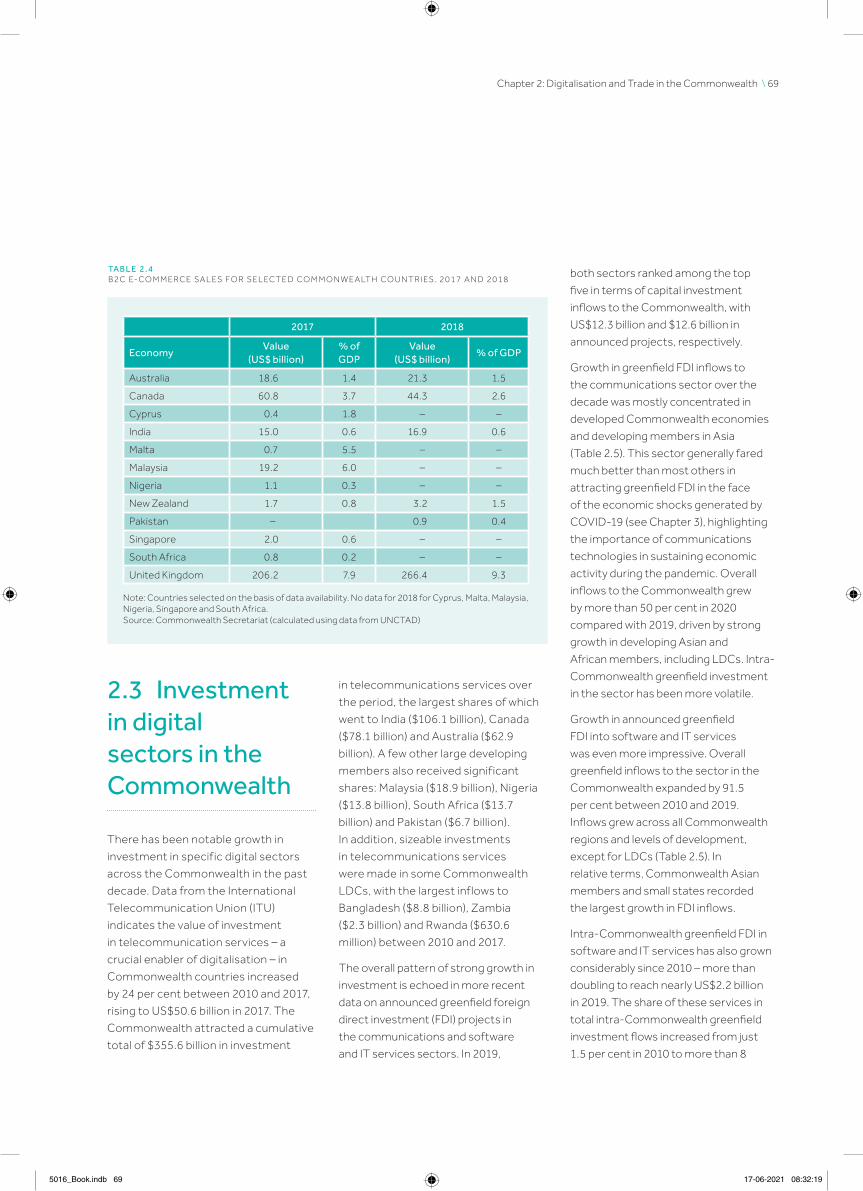
Chapter 2: Digitalisation and Trade in the Commonwealth \ 69
2.3 Investment in digital sectors in the Commonwealth
There has been notable growth in
investment in specific digital sectors
across the Commonwealth in the past
decade. Data from the International
Telecommunication Union (ITU)
indicates the value of investment
in telecommunication services – a
crucial enabler of digitalisation – in
Commonwealth countries increased
by 24 per cent between 2010 and 2017,
rising to US$50.6 billion in 2017. The
Commonwealth attracted a cumulative
total of $355.6 billion in investment
in telecommunications services over
the period, the largest shares of which
went to India ($106.1 billion), Canada
($78.1 billion) and Australia ($62.9
billion). A few other large developing
members also received significant
shares: Malaysia ($18.9 billion), Nigeria
($13.8 billion), South Africa ($13.7
billion) and Pakistan ($6.7 billion).
In addition, sizeable investments
in telecommunications services
were made in some Commonwealth
LDCs, with the largest inflows to
Bangladesh ($8.8 billion), Zambia
($2.3 billion) and Rwanda ($630.6
million) between 2010 and 2017.
The overall pattern of strong growth in
investment is echoed in more recent
data on announced greenfield foreign
direct investment (FDI) projects in
the communications and software
and IT services sectors. In 2019,
both sectors ranked among the top
five in terms of capital investment
inflows to the Commonwealth, with
US$12.3 billion and $12.6 billion in
announced projects, respectively.
Growth in greenfield FDI inflows to
the communications sector over the
decade was mostly concentrated in
developed Commonwealth economies
and developing members in Asia
(Table 2.5). This sector generally fared
much better than most others in
attracting greenfield FDI in the face
of the economic shocks generated by
COVID-19 (see Chapter 3), highlighting
the importance of communications
technologies in sustaining economic
activity during the pandemic. Overall
inflows to the Commonwealth grew
by more than 50 per cent in 2020
compared with 2019, driven by strong
growth in developing Asian and
African members, including LDCs. Intra-
Commonwealth greenfield investment
in the sector has been more volatile.
Growth in announced greenfield
FDI into software and IT services
was even more impressive. Overall
greenfield inflows to the sector in the
Commonwealth expanded by 91.5
per cent between 2010 and 2019.
Inflows grew across all Commonwealth
regions and levels of development,
except for LDCs (Table 2.5). In
relative terms, Commonwealth Asian
members and small states recorded
the largest growth in FDI inflows.
Intra-Commonwealth greenfield FDI in
software and IT services has also grown
considerably since 2010 – more than
doubling to reach nearly US$2.2 billion
in 2019. The share of these services in
total intra-Commonwealth greenfield
investment flows increased from just
1.5 per cent in 2010 to more than 8
2017 2018
EconomyValue
(US$ billion)% of GDP
Value (US$ billion)
% of GDP
Australia 18.6 1.4 21.3 1.5
Canada 60.8 3.7 44.3 2.6
Cyprus 0.4 1.8 – –
India 15.0 0.6 16.9 0.6
Malta 0.7 5.5 – –
Malaysia 19.2 6.0 – –
Nigeria 1.1 0.3 – –
New Zealand 1.7 0.8 3.2 1.5
Pakistan – 0.9 0.4
Singapore 2.0 0.6 – –
South Africa 0.8 0.2 – –
United Kingdom 206.2 7.9 266.4 9.3
Note: Countries selected on the basis of data availability. No data for 2018 for Cyprus, Malta, Malaysia, Nigeria, Singapore and South Africa.Source: Commonwealth Secretariat (calculated using data from UNCTAD)
TA B L E 2 . 4B 2 C E- CO M M E RC E SA L ES F O R S E L ECT E D CO M M O N W E A LT H CO U N T R I ES, 2 0 1 7 A N D 2 0 1 8
5016_Book.indb 69 17-06-2021 08:32:19

70 \ Commonwealth Trade Review 2021
per cent in 2019. However, these flows
remain highly concentrated. Just five
Commonwealth countries – Australia,
Singapore, the UK, India and Canada –
absorbed more than 85 per cent of
intra-Commonwealth inflows to the
sector between 2010 and 2019. Aside
from these five countries, the next
largest recipients were South Africa,
Nigeria and Malaysia. Among LDCs,
Rwanda, where the government has
prioritised the development of digital
capabilities (see Box 5.5 in Chapter
5), was the largest recipient, with a
cumulative $47 billion in announced
intra-Commonwealth greenfield FDI.
The bulk of greenfield investments
in the sector originated from the UK,
India or Canada – these three countries
accounted for nearly three-quarters of
announced intra-Commonwealth flows.
As explained further in Chapter 3,
greenfield investment in key digital
sectors in the Commonwealth has not
been immune to the economic shocks
associated with COVID-19 (Figure
2.12). For instance, global greenfield
FDI inflows to software and IT services
sectors in developing Commonwealth
countries fell by 22 per cent in 2020
compared with the 2019 level, and
overall intra-Commonwealth greenfield
FDI inflows to this sector declined by 8
per cent. Nevertheless, investments
in digital sectors, particularly related
to communications, have generally
been more resilient, in keeping with
the upward trend witnessed prior
to the pandemic. India, for example,
attracted record numbers of new
mergers and acquisitions deals in
digital sectors in the second half of
2020 (UNCTAD, 2021a). Pre-COVID-19
trends, accentuated by the rapid
acceleration in the use of digital
technologies owing to the pandemic,
suggest growth in FDI into digital
sectors in Commonwealth countries is
likely to be sustained in the long run.
Communications Software & IT services
Capital investment
in 2019 (US$ million)
% change 2010-2019
Capital investment
in 2019 (US$ million)
% change 2010–2019
Commonwealth total 12,303 5.5 12,573 91.5
Of which
Developed 4,933 44 7,658 77.6
Developing 7,370 −10.5 4,915 118
Of which
Africa 3,382 −33.2 518 8
Asia 3,831 20.7 4,397 147.7
Caribbean SIDS 157 – – –
Pacific SIDS – – – –
Vulnerable groups
LDCs 99 −89.4 29 −50.8
Small states 195 29.7 83 228.9
SIDS 560 −35.5 1,041 85.1
Source: Commonwealth Secretariat (calculated using fDi Markets data, from the Financial Times Limited 2021)
TA B L E 2 . 5A N N O U N C E D G R E E N F I E L D I N V EST M E N T I N CO M M U N I CAT I O N S A N D S O F T WA R E A N D I T S E R V I C ES
5016_Book.indb 70 17-06-2021 08:32:19

Chapter 2: Digitalisation and Trade in the Commonwealth \ 71
2.4 COVID-19 and digital trade
Digital trade globally and in the
Commonwealth has not escaped the
adverse effects of COVID-19. The
pandemic’s impact has operated
through both supply and demand
channels. On the supply side, for
example, the manufacturing of ICT
goods has been hampered by the
suspension of operations during
lockdowns, slower productivity and
labour shortages resulting from the
need to maintain social distancing
and, in some cases, engage in staff
rotation, shortages of raw materials
and intermediate inputs, and border
restrictions affecting the flow of
goods. More labour-intensive and
less automated ICT manufacturing
segments have been most affected
(Banga and te Velde, 2020). Disruptions
to agricultural and manufacturing
activity and labour shortages have
also affected the supply of products
in e-commerce value chains. Similarly,
disruptions to transport and logistics
services have hampered cross-
border e-commerce activity.
Despite these challenges, lockdowns
and restrictions on physical
movement introduced to contain
COVID-19 heralded a major uptake
of e-commerce, both domestic and
cross-border, to keep goods and
services flowing (Box 2.3). The digital
economy and digital trade have been
central in mitigating some of the
economic losses generated by the
pandemic; and new opportunities in
e-commerce and digital trade arising
from the resulting acceleration in the
adoption of digital technologies are
likely to play a key role in stimulating
post-COVID-19 economic recovery.
However, the growth of e-commerce
also presents new challenges for
ensuring consumer trust and safety
and can fuel illicit trade. For example,
smuggled wildlife, cigarettes,
counterfeit medicines, substandard
personal protective equipment and
even children’s toys that bypass safety
checks are reportedly among the
worrisome goods traded illicitly in some
Southeast Asian markets (Goh, 2021).
Certain types of digital products
and digital and digitally enabled
services have benefited from positive
shocks associated with COVID-19.
For example, demand for certain
categories of consumer electronics
has increased rapidly in response to
-200 -100 4003002001000
% change in value of greenfield FDI inflows
CW TOTAL
Developed
Developing
Africa
Asia
Caribbean SIDS
All SIDS
Small states
LDCs
1.0
329.4
COMMUNICATIONS
39.6
-100.0
130.1
68.8
97.1
-18.0
50.9
-80 -60 -40 6040200-20
% change in value of greenfield FDI inflows
CW TOTAL
Developed
Developing
Africa
Asia
SIDS
Small states
LDCs -19.8
SOFTWARE & IT SERVICES
-71.9
3.3
-30.6
51.4
-22.0
19.3
3.2
Note: There were no announced FDI inflows to the software and IT services sector in Commonwealth Caribbean or Pacific SIDS in 2019 or 2020, or any inflows to the communications sector in Pacific SIDS in either year.Source: Commonwealth Secretariat (calculated using fDi Markets data, from the Financial Times Limited 2021)
F I G U R E 2 . 1 2C H A N G ES I N A N N O U N C E D G R E E N F I E L D F D I I N F LO W S TO CO M M U N I CAT I O N S A N D S O F T WA R E A N D I T S E R V I C ES S ECTO RS I N T H E CO M M O N W E A LT H , 2 0 1 9 V S . 2 0 2 0
5016_Book.indb 71 17-06-2021 08:32:19

72 \ Commonwealth Trade Review 2021
sharp growth in the numbers of people
working from home or engaging in
remote learning. Global shipments
of personal computers grew by 13.1
per cent in 2020 compared with
2019. The UK imported 20 per cent
more laptops between March and
October 2020 compared with the
same period in 2019 (WM REDI and
CITY REDI, 2021). Similarly, demand
for communication equipment and
devices as well as related goods and
services that enable access to the
internet has surged (OECD, 2020b).
At the same time, demand for digitally
deliverable creative content such as
streaming media and digital books,
music and games increased amid
lockdowns and restrictions on other
activities (WTO, 2021). COVID-19 has
forced many artists to expand their
digital footprints, making available
digital content to compensate
for the loss of live audiences.
Digital technologies have been
especially important for sustaining
trade in services. This has mostly
been enabled through switching
between modes of supply, evident
in a substantial shift in favour of the
supply of services through Mode
1, which involves cross-border
supply enabled through online or
digital means (see Chapter 1). For
example, as discussed in Chapter
1, to continue providing university
education to international students
despite government measures
limiting inward travel, universities in
Australia and Canada switched to
online instruction, representing a shift
in the mode of supply of education
services from Mode 2 to Mode 1
(Shepherd and Shingal, 2021). In India,
even prior to the pandemic, a large
share of the country’s information
technology (IT) and IT-enabled
services were exported via Mode 1,
meaning they have been relatively
more insulated from the adverse
effects generated by the pandemic
(Box 2.4). Importantly, however,
successfully switching to supply
services via Mode 1 is contingent
on having in place the requisite
infrastructure, technological capacity,
human capital and connectivity,
meaning the extent to which this
has been possible is inevitably
uneven across Commonwealth
countries (see Chapters 1 and 5).
B O X 2 . 3
C O V I D -19 L E A D S TO G R O W T H I N E X P O R T S A N D E- C O M M E R C E S A L E S
Emerging evidence suggests digital trade and the use of digital technologies have helped offset economic losses incurred in traditional sectors as a result of COVID-19. Jumia, an African e-commerce platform, recorded a 50 per cent increase in transactions in the first half of 2020 (Kituyi, 2021). Estimates suggest e-commerce usage tripled in Kenya (CNBC Africa, 2020). In the UK, the share of e-commerce in total retail sales increased by 31 per cent between the first and second quarters of 2020 (OECD, 2020a).
Banga and te Velde (2020) develop a framework to assess the first- and second-order effects of COVID-19 on the digital economy (both positive and negative),11 and apply this to analyse these effects in 23 countries, mostly LDCs in Africa and the Asia-Pacific region. They find a correlation between the adoption of a digital response by firms (reflected in increased online business activity) and increased exports compared with one year ago and/or growth in their deliveries of goods and services.
Results from a survey by UNCTAD (2020b) offer useful insights into the impacts of the pandemic on e-commerce activity in developing countries and likely future areas of growth. The survey covered 257 businesses located in 23 developing countries, 20 of which were LDCs.12 The results show e-commerce sales increased for 64 per cent of third-party online marketplaces in these countries between March and July 2020, with sales through social media a key driver.13 They also reveal a clear shift in consumption habits towards online purchases of essential goods and services, such as groceries, pharmaceuticals, health and hygiene products, and financial services. Moreover, the survey found evidence of rapid growth in e-payments – 60 per cent of the e-commerce businesses and 70 per cent of the third-party online marketplaces included in the sample reported higher growth rates for mobile money payments and transactions through e-banking and credit cards.
5016_Book.indb 72 17-06-2021 08:32:19

Chapter 2: Digitalisation and Trade in the Commonwealth \ 73
B O X 2 . 4
I N D I A’ S I C T S E R V I C E S E X P O R T S A N D T H E PA N D E M I C
India is a leading exporter of ICT services, both globally and in the Commonwealth. In 2019, it was the second-largest global exporter of ICT services (after Ireland), and the largest ICT exporter in the Commonwealth, with exports of these services totalling US$70 billion. India’s ICT services account for around one-third of its total services exports (US$215 billion). Around 25 per cent of these services are absorbed in Commonwealth countries, with a relatively large share destined for developed members (Figure 2.13). The value of India’s ICT services exports to Commonwealth countries has almost doubled, going from US$9 billion in 2010 to $17 billion in 2019.
In terms of delivery, nearly three-fourths of India’s IT and IT-enabled services exports were delivered by Mode 1 in 2018/19, which suggests that the bulk of India’s exports in this sector may be relatively insulated from the adverse effects generated by the pandemic. With close public and private sector co-operation, India was able to quickly address initial concerns around the pandemic’s potential impacts on service delivery and productivity by setting up virtual private networks, improving bandwidth in the areas where employees are residing and addressing challenges related to virtual environments to support secure remote working. These innovative business solutions and government support enabled over 90 per cent of the country’s IT workforce to continue working from home.
More than a quarter of India’s total IT services exports delivered by Modes 1, 2 and 4 are destined for Commonwealth members and at least a fifth of Mode 3 business by foreign affiliates of Indian firms is estimated to be within the Commonwealth (UK 11 per cent; Canada 5 per cent; Singapore 3.5 per cent). While most of the non-Mode 3 exports are destined for the USA and Canada, a large proportion is sent to Commonwealth countries, including the UK (12 per cent) and Australia and New Zealand (3.3 per cent).
The pandemic has provided India with another opportunity to capitalise on this capacity as more and more services activities have moved online. The preliminary estimates show that the growth rate of the IT sector for 2019/20 has been approximately 10 per cent. Ultimately, the data will likely show some degree of cross-modal substitution in services trade, away from Modes 2 and 4 and towards Mode 1. So far, it remains unclear as to whether or not this type of substitution has compensated for
F I G U R E 2 . 1 3T R E N DS I N I N D I A ’ S E X P O RTS I N I CT S E R V I C ES A N D K EY E X P O RT M A R K ETS
US
$ bi
llion
0
40
50
20
10
30
70
90
60
80
2010 2011 2012 2013 2014 2015 2016 2017 2018 2019
World Commonwealth
To p e x p o r t m a r ke t s i n t h e Co m m o nwe a l t h ( 2 0 1 9 )
Value (US$ million) Share (%)
United Kingdom 6,662.69 41.05
Singpore 2,804.14 17.28
Australia 2,090.74 12.88
Canada 1,091.39 6.72
South Africa 888.12 5.47
Bangladesh 528.72 3.26
Malaysia 487.47 3.00
Nigeria 355.67 2.19
New Zealand 251.84 1.55
Cyprus 196.27 1.21
Rest of the Commonwealth 874.08 5.39
Source: Commonwealth Secretariat (calculated using WTO-OECD BaTIS dataset)
5016_Book.indb 73 17-06-2021 08:32:20

74 \ Commonwealth Trade Review 2021
2.5 Broadening access to the internet and ICT usage
The preceding sections highlighted
the growth in the Commonwealth’s
digital trade and investment in digital
sectors prior to the onset of the
COVID-19 pandemic. However, it is
apparent that these flows, in almost all
digital categories, are concentrated in
a few larger developed and developing
country members, meaning most
Commonwealth countries, especially
LDCs, have yet to fully benefit from
some of the positive transformations
brought about by digitalisation
(Commonwealth Secretariat, 2020).
The capabilities, readiness and skills to
benefit from digital trade and participate
in the wider digital economy are
unevenly distributed within and between
Commonwealth members as well as
between women and men. This is notably
the case with internet access, even as
mobile internet is growing, especially
in Africa (IFC and Google, 2020).
There are stark differences in internet
access and usage between the
Commonwealth’s developed, developing
and LDC members (Figure 2.14). In 2019,
the share of people using the internet in
Commonwealth developed economies
(89 per cent), Caribbean SIDS (62 per
cent) and Asian countries (54 per cent)
was above the world average (51 per
cent), whereas SSA countries and the
Pacific SIDS lagged at about 32 per cent.
However, internet use is growing
rapidly. In simple average terms, the
share of people in the Commonwealth
using the internet has almost doubled
in the past decade, from 27 per
cent in 2010 to above 48 per cent in
2019. The corresponding increase
for African members was threefold,
from 11 per cent to 32 per cent. This
underscores the urgent need to
invest in increasing broadband access
for SSA members and LDCs, where
internet use is even lower, at about
20 per cent. Overall, the Sustainable
Development Goal (SDG) target to
provide universal access to the internet
in LDCs by 2020 has been missed.
Several factors determine access
to the internet, including affordable
broadband, reasonably priced ICT
hardware and services, investment
in infrastructure and regulatory
approaches to telecommunications
to ensure affordability (Ashton-Hart,
2020). For example, in Commonwealth
LDCs, the monthly cost for 1.5GB
of mobile bandwidth in terms of
per-person gross national income
(GNI) is almost nine times higher than
in developed countries, and more
than double the Commonwealth
average (Table 2.6). However, some
countries, like Rwanda, are making
exemplary progress in reducing
costs – from around 25 per cent
in 2014 to 7.15 per cent of GNI in
2018 – while doubling their share of
citizens accessing the internet.
High import tariffs on hardware,
including the equipment used to
develop and implement broadband
networks, create further barriers to
digitalisation. Import tariffs on network
equipment14 in Commonwealth
developing countries and LDCs are
around 8 per cent, compared with
1 per cent in developed countries.
Overall, the Commonwealth average
tariff on these goods is a percentage
point higher than that of the world.
However, for the 11 Commonwealth
members belonging to the WTO’s
Information Technology Agreement,
tariffs like these will already be zero on
most IT products. Although non-ITA
participants have high bound tariffs
on ICT goods, the applied rates are
significantly lower (Ashton-Hart, 2020).
High tariffs on internet devices can
also affect affordability and access. In
Africa, around 60 per cent of internet
users connect using mobile devices,
while the remaining use laptops and
personal computers. The high cost
of smartphones and laptops can
the huge demand shock that services markets have seen, as GDP growth in 2020 turned negative in much of the world as a result of the combined effect of the pandemic and the measures required to contain its spread. The Reserve Bank of India’s provisional estimates show that India has continued to export services worth US$17 billion per month since April 2020 despite the pandemic and restrictive lockdowns, which is only $1 billion less than what the country was exporting, on average, in the first quarter of 2020.
Source: Shepherd and Shingal (2021) for the Commonwealth Secretariat
5016_Book.indb 74 17-06-2021 08:32:20
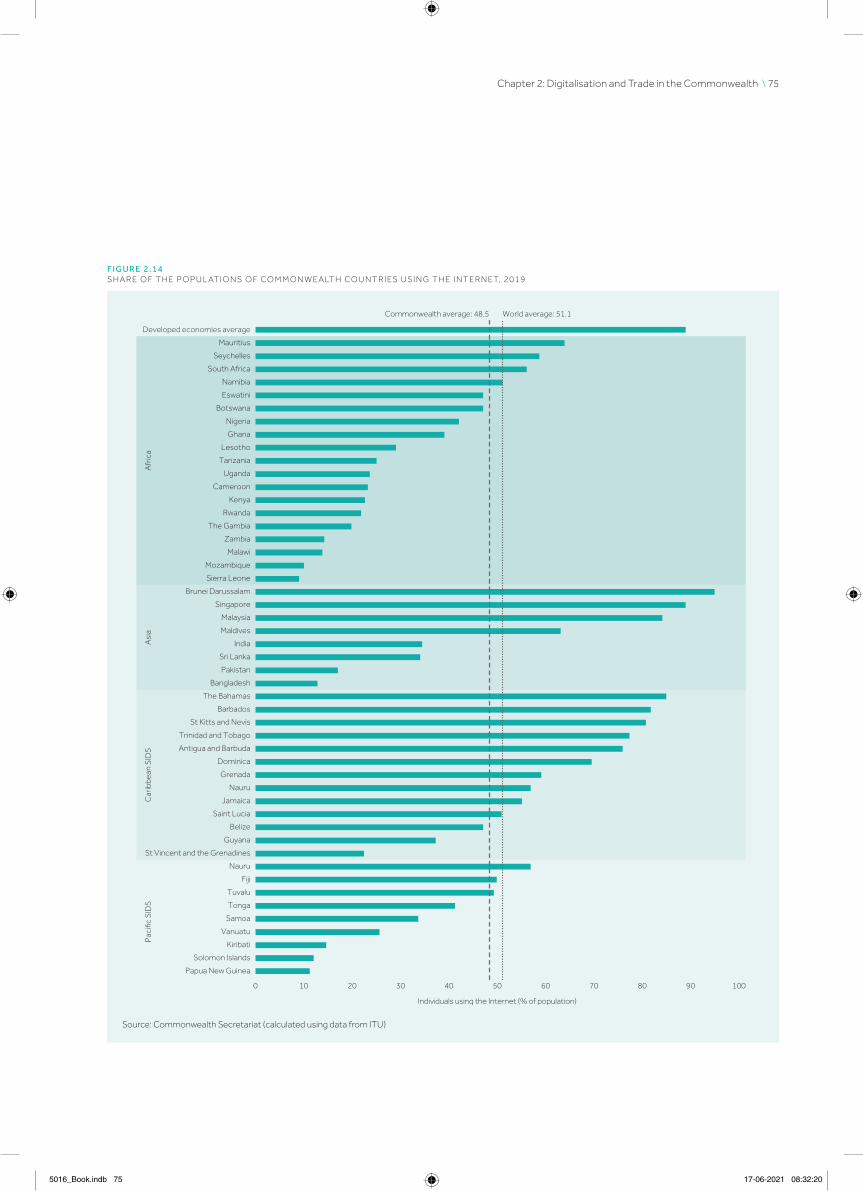
Chapter 2: Digitalisation and Trade in the Commonwealth \ 75
Afr
ica
Asi
aC
arib
bean
SID
SP
acifi
c S
IDS
Commonwealth average: 48.5
Individuals using the Internet (% of population)
World average: 51.1
1009080706050403020100
Developed economies average
Mauritius
Seychelles
South Africa
Namibia
Eswatini
Botswana
Nigeria
Ghana
Lesotho
Tanzania
Uganda
Cameroon
Kenya
Rwanda
The Gambia
Zambia
Malawi
Mozambique
Sierra Leone
Brunei Darussalam
Singapore
Malaysia
Maldives
India
Sri Lanka
Pakistan
Bangladesh
The Bahamas
Barbados
St Kitts and Nevis
Trinidad and Tobago
Antigua and Barbuda
Dominica
Grenada
Nauru
Jamaica
Saint Lucia
Belize
Guyana
St Vincent and the Grenadines
Nauru
Fiji
Tuvalu
Tonga
Samoa
Vanuatu
Kiribati
Solomon Islands
Papua New Guinea
Source: Commonwealth Secretariat (calculated using data from ITU)
F I G U R E 2 . 1 4S H A R E O F T H E P O P U L AT I O N S O F CO M M O N W E A LT H CO U N T R I ES U S I N G T H E I N T E R N ET, 2 0 1 9
5016_Book.indb 75 17-06-2021 08:32:20

76 \ Commonwealth Trade Review 2021
deter widespread internet use. The
prices of entry-level and second-
hand devices range from US$35 to
$45, which is equivalent to almost 80
per cent of monthly wages in some
African countries (IFC and Google,
2020). Asian brands are generally
cheaper and account for 70 per
cent of the African mobile device
market. Reducing import tariffs,
facilitating local manufacturing and
developing structured payment plans
can enable greater access to ICTs.
Speed of connectivity is also
important because there is evidence
it can affect GDP and productivity
(Commonwealth Secretariat, 2018a).
In some Commonwealth developing
countries, the surge in internet demand
as a result of the pandemic caused an
overall decline in broadband speeds.
Average download speeds during
the lockdown period were higher in
developed compared with developing
country members, with significant
differences between them. For example,
the average download speed was above
50 Mbps in Singapore, New Zealand
and Canada but less than 5 Mbps in
Tanzania, Mozambique, Bangladesh
and Pakistan. The decline in mean
speeds during lockdowns was also
higher in developing countries, with
declines of over 30 percentage points
in Malaysia, 23 percentage points in Sri
Lanka, 24 percentage points in Ghana
and 21 percentage points in India
(Banga and Raga, 2021). In response to
the pandemic, data service providers
and operators in both developed
and developing countries reduced
mobile transaction costs, provided
free gigabits or suspended data limits
and boosted capacity at no additional
cost. Some governments offered
additional spectrum to operators
(Bajaj, 2021; Banga and Raga, 2021).
Several private sector initiatives
are underway to expand internet
infrastructure to developing countries
and LDCs. These range from undersea
cable networks, like Google’s
Equiano,15 to satellite broadband
(Estes, 2020) and high-altitude
balloons to deliver mobile internet
services. For example, balloons are
now stationed over rural regions of
Kenya, where they entered service
on a commercial basis in July 2020
(Adegoke, 2020). China’s Digital Silk
Road, which is part of the Belt and
Road Initiative, is also a boon for many
developing countries looking to boost
digital infrastructure capacity. Chinese
assistance and investment through
the initiative covers a range of areas
from telecommunications networks,
artif icial intelligence capabilities,
cloud computing, e-commerce
and mobile payment systems to
surveillance technology and smart
cities (Kurlantzick, 2020). These
benefits aside, Chinese investment in
digital infrastructure has also fuelled
some security-related concerns.
This has led several countries,
including Australia, Japan and the
USA, to ban Chinese tech firms from
building their 5G infrastructure.
Box 2.5 compares the performance
of two clusters of Commonwealth
countries – namely, the 14
Commonwealth countries where
more than 70 per cent of the
population are using the internet
and the 40 countries with lower
access – to illustrate some of
the possible success factors
associated with lower costs for
mobile broadband, higher-quality
ICT infrastructure and regulations,
and lower tariffs applied to
imports of network equipment.
GroupGNI per capita for 1.5GB mobile broadband (%)
Import tariff on network equipment (%)
World 4.33 6.40
Commonwealth 4.26 7.50
Of which
Developed 0.66 1.17
Developing 4.73 8.41
LDCs 9.30 8.45
Source: Commonwealth Secretariat (calculated using ITU ICT Price Baskets and WITS data for tariffs)
TA B L E 2 . 6B ROA D B A N D CO STS A N D TA R I F F S O N N ET W O R K E Q U I P M E N T I N T H E CO M M O N W E A LT H
5016_Book.indb 76 17-06-2021 08:32:21

Chapter 2: Digitalisation and Trade in the Commonwealth \ 77
B O X 2 . 5
P R O V I D I N G I N T E R N E T A C C E S S I N T H E C O M M O N W E A LT H : W H AT C A N W E L E A R N F R O M T H E TO P P E R FO R M E R S ?
There are 14 Commonwealth countries where more than 70 per cent of the population are using the internet. Affordability and regulation have played an important role to ensure this level of access (Figure 2.15).
Affordability and access to the digital economy. One measure of affordability is the monthly cost for 1.5GB of mobile bandwidth in terms of per-person GNI. In 2018, the Broadband Commission for Sustainable Development set the affordability target for entry-level fixed and mobile broadband at 2 per cent of GNI per capita. Seventeen Commonwealth countries met this affordability threshold in 2019. On average, the cost per capita is five times cheaper for Commonwealth members where more than 70 per cent of the population use the internet. This is much higher for LDCs (9.3 per cent), which is 2.2 times higher than the Commonwealth average. The most expensive countries are Malawi, Sierra Leone and Solomon Islands, at over 16 per cent.
The second dimension affecting costs is the import tariffs on ICT hardware and networking equipment. The Commonwealth average for tariffs on networking equipment is 7.5 per cent, ranging from as high as 35 per cent in The Bahamas to zero in seven countries, four of which are SIDS. For Commonwealth countries with less than 70 per cent internet access, the average tariff rate is around 8.2 per cent.
World average Commonwealth average
6.0
1.12
5.40
5.0
4.0
3.0
2.0
1.0
0.0
Pric
e as
a %
of G
NI p
er c
apita
70% or moreCommonwealth by % of population
with internet access
Under 70% access
1A. MOBILE BROADBAND 1.5GB AS A % OF GNI PER CAPITA
Commonwealth by % of population with internet access
Under 70% access
9.0
6.0
7.0
8.0
5.24
8.18
5.0
4.0
3.0
2.0
1.0
0.0
Tar
iffs
(%)
70% or more
1B. AVERAGE IMPORT TARIFFS ON NETWORK EQUIPMENT
Commonwealth by % of population with internet access
80
70
60
67.16
47.6750
40
30
20
10
0Infr
astr
uctu
re in
dex
(max
sco
re =
100
)
70% or more Under 70% access
2A. ICT INFRASTRUCTURE INDEX
Commonwealth by % of population with internet access
80
74
76
78
72
70
68
66
64Reg
ulat
ory
inde
x (m
ax s
core
= 1
00)
70% or more Under 70% access
2B. ITU ICT REGULATORY INDEX
79.11
69.59
Source: Commonwealth Secretariat (calculated using data from A4AI, ITU and WDI)
F I G U R E 2 . 1 5A F F O R DA B I L I T Y A N D R EG U L AT I O N F ACTO RS A F F ECT I N G ACC ESS TO T H E I N T E R N ET I N T H E CO M M O N W E A LT H
5016_Book.indb 77 17-06-2021 08:32:21

78 \ Commonwealth Trade Review 2021
2.6 Conclusion and way forward
In keeping with the increasing
prominence of the digital economy
globally, the Commonwealth’s ICT
goods trade expanded steadily
in the decade preceding the
emergence of COVID-19, as did
Commonwealth trade in digitisable
products, ICT services and DDS.
Intra-Commonwealth flows accounted
for sizeable, and in some instances
growing, shares of this trade.
Commonwealth developing countries
were collectively major contributors
to digital trade. However, in almost all
digital categories, a few developed
and developing members dominated
the Commonwealth’s global and
intra-Commonwealth trade. Many
Commonwealth SIDS and LDCs
remained marginal players.
COVID-19 has accelerated digital
engagement, fuelling growth in
e-commerce and digital trade
in developed and developing
Commonwealth countries, while
also placing greater focus on the
importance of digitalisation and
digital transformation. The digital
economy and digital trade have
been central to mitigating some of
the economic losses generated by
COVID-19, in many instances playing
a critical role in sustaining economic
activity in the face of lockdowns and
restrictions on the movement of
people and goods. Consequently, a
raft of new opportunities has arisen
in e-commerce and digital trade.
At the same time, the rapid
acceleration in the adoption of
digital technologies precipitated
by COVID-19 has the potential to
exacerbate existing digital divides
in the Commonwealth and widen
inequalities between individuals,
firms and countries. In this sense,
the pandemic has only reinforced
the urgent need to address existing
obstacles faced by Commonwealth
countries looking to engage in
e-commerce and participate effectively
in digital trade. As outlined in Chapter
5, this hinges on improving a range of
aspects of the enabling environment
for digital trade and e-commerce
readiness, including in relation to the
governance of the digital economy,
the adoption or adaptation of frontier
technologies for industry and trade,
aid for digital trade to support the
development of digital infrastructure,
digital skills, e-government services
and financial inclusion, and efforts to
digitalise trade facilitation through,
for example, paperless trade.
Moreover, a digital gender divide
between women and men in mobile
phone access and usage, digital
connectivity and participation in
the digital economy continues to
present a significant challenge.
Although solutions to bridge this gap
are being pursued, further actions
are urgently required to ensure
no one is left behind, particularly
because women may become
correspondingly more disadvantaged
as the pace of digitalisation
intensifies beyond COVID-19.
Continued investment in digital
infrastructure supporting
digital connectivity will also be
critically important, particularly in
Commonwealth LDCs, as will investment
Regulation and access to the digital economy. Adopting best regulatory practices to develop ICTs feeds into greater affordability and access for individuals and businesses. The ITU’s ICT Regulatory Tracker is based on four pillars: regulatory authority, regulatory mandates, regulatory regime and competition framework for the ICT sector. Commonwealth countries average 72.06 out of 100, while those with over 70 per cent internet access score 80. For Commonwealth LDCs, this number is much lower than the average, at 68. This varies across the LDC group, with countries such as Rwanda, Uganda and Tanzania scoring above 80, while there is scope for large regulatory improvements in Sierra Leone, which scores 56.
Similarly, the ICT Infrastructure Index calculated by the Alliance for Affordable Internet (A4AI) measures the extent to which internet infrastructure has been deployed, as well as the policy framework in place to encourage future infrastructure expansion. As of September 2020, 51 Commonwealth countries, excluding Dominica, St Kitts and Nevis and Tuvalu, report having a national broadband plan (ITU, 2020). For Commonwealth countries with higher internet access, the communications index is 67, approximately 1.5 times higher than the Commonwealth average and the countries with less access. Most LDCs, with some exceptions like Rwanda, rank lower than the average, indicating a need for greater investment, policies and prioritisation of ICT infrastructure (A4AI, 2020).
5016_Book.indb 78 17-06-2021 08:32:21

Chapter 2: Digitalisation and Trade in the Commonwealth \ 79
in key sectors underpinning the digital
economy. This is especially important
for building more resilient economies
and societies post-COVID-19. The
next chapter examines the impacts
COVID-19 has had on FDI in the
Commonwealth and shows the
pandemic has had a deleterious effect
on investment inflows to most sectors,
even if some digital sectors have been
relatively shielded from the worst
effects. Investment in digitalisation will
be important for economic recovery
and building resilience in many
Commonwealth countries, particularly
given growth in e-commerce and
digital trade is likely to be sustained
in the wake of the pandemic.
Endnotes
1 This increase took place during
the period 1 January 2020 to
1 January 2021. At: https://
datareportal.com/reports/digital-
2021-global-overview-report
2 This chapter examines trends in
the Commonwealth’s digital trade
flows that are, unless otherwise
specified, measured as the sum
of exports plus imports.
3 This draws on analysis by
Banga and Raga (2021)
undertaken specifically for the
Commonwealth Secretariat.
4 Based on bilateral ICT goods trade
data for 26 Commonwealth countries
from the World Integrated Trade
Solution (WITS) database. The intra-
Commonwealth share in overall ICT
goods trade flows is lower than the
intra-Commonwealth share in total
Commonwealth goods trade flows,
which stands at 15.6 per cent.
5 The United Nations Conference on
Trade and Development (UNCTAD)
disaggregates the products into
four categories: films (HS 37),
printed matter (HS 49), sounds,
media and software (HS 8524)
and videogames (HS 9504).
6 These DDS/ICT-enabled
services are similar to General
Agreement on Trade in Services
(GATS) Mode 1 – namely, cross-
border supply, as discussed in
Chapter 1 (Fredriksson, 2020).
7 These figures are based on data
on exports and imports of DDS
for 37 Commonwealth countries.
Data from 2011-2019 is used to
maintain a consistent sample of
countries across the period.
8 Bangladesh, The Gambia, Lesotho,
Malawi, Mozambique, Solomon
Islands, Uganda and Zambia.
9 Readiness to engage in business-
to-consumer e-commerce
transactions does not capture all
aspects of e-commerce activity.
Some businesses, particularly
smaller enterprises, may be better
equipped to engage in business-
to-business e-commerce.
10 A country’s level of preparedness
to engage in e-commerce is
established on the index using the
average across four equally weighted
indicators: (1) Account ownership
at a financial institution or with a
mobile money service provider
(per cent of population aged 15+);
(2) Individuals using the internet
(per cent of population); (3) Postal
Reliability Index; and (4) Secure
internet servers (per 1 million people).
11 The authors consider four segments
of the digital economy in their
analysis: digital infrastructure,
ICT and ICT-enabled services,
e-commerce and online work.
12 This included 10 Commonwealth
countries: Samoa and nine LDCs in
Africa (Rwanda, Tanzania, Uganda
and Zambia), Asia (Bangladesh) and
the Pacific (Kiribati and Tuvalu).
13 Importantly, however, not
all e-commerce businesses
benefited, and much of the growth
in e-commerce was skewed in
favour of third-party marketplaces.
More than half (58 per cent) of
the e-commerce businesses
surveyed experienced lower sales
between March and July 2020.
14 Network equipment is defined
using a list of 12 HS 6 digit codes
from chapters 85 and 90 of the
harmonised system of classification.
It includes telecommunications
equipment as well as some
electronic apparatus.
15 The first phase of Google’s new
submarine cable, Equiano, is
expected to be completed by 2022
and will connect Portugal and South
Africa, bringing unprecedented
bandwidth to the region. The
first branch is planned to land in
Nigeria, with other countries to
follow (IFC and Google, 2020).
5016_Book.indb 79 17-06-2021 08:32:21

Chapter 3: The Impact of COVID-19 on Commonwealth FDI
5016_Book.indb 80 17-06-2021 08:32:21

Despite sluggish growth in international investment, foreign direct investment (FDI) inflows to Commonwealth countries were robust in the decade prior to the emergence of COVID-19. The pandemic disrupted FDI globally and most Commonwealth countries experienced a significant decline in inflows in 2020.
This chapter examines how FDI in the Commonwealth has been affected by the COVID-19 pandemic. Some of the key takeaways are:
• Annual FDI inflows to the Commonwealth grew 2.5 times faster, on average, than global inflows in the decade before the pandemic. The Commonwealth’s share of global inflows expanded by nearly 3 percentage points over this period to reach 23.3 per cent in 2019.
• Globally, investment flows to the renewable energy sector have reached record highs. The renewable energy sector was the second largest recipient of greenfield FDI across the Commonwealth in 2019, with inflows growing by 179 per cent since 2010 to reach US$26 billion.
• Most Commonwealth countries experienced a significant decline in overall FDI inflows in 2020, although the developed countries, Singapore and large African economies – Nigeria and South Africa – had the largest declines in absolute terms.
• The pandemic dealt a blow to global and intra-Commonwealth greenfield FDI. Announced intra-Commonwealth greenfield investments were US$1.6 billion lower in the second quarter of 2020, $4.7 billion lower in the third quarter and $2.9 billion lower in the fourth quarter.
• Before the pandemic, estimated investment flows between Commonwealth countries were 27 per cent higher than those between other country pairs, on average. Greenfield FDI flows between Commonwealth country pairs were around 19 per cent higher overall and 37 per cent higher for African members. The Commonwealth advantage can help revitalise FDI inflows and complement domestic and diaspora investment.
5016_Book.indb 81 17-06-2021 08:32:21
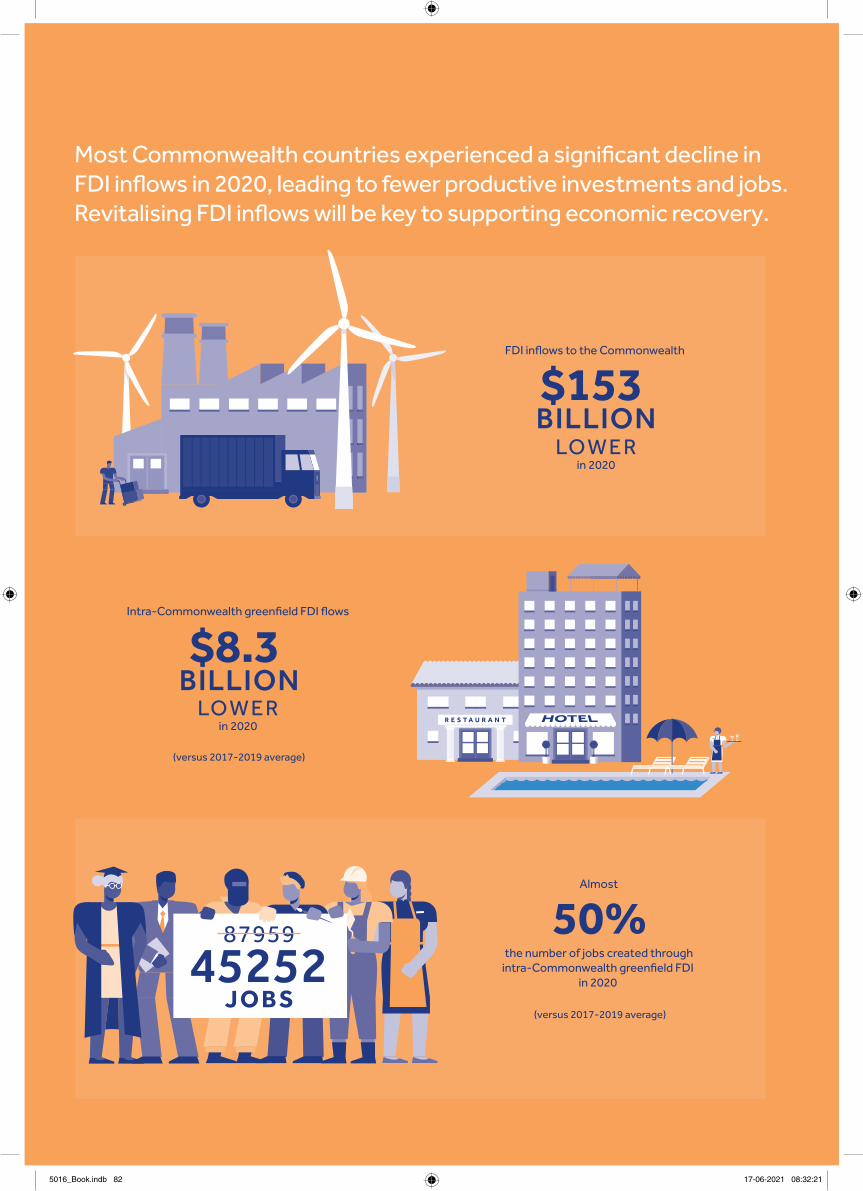
R E S T A U R A N T
Most Commonwealth countries experienced a significant decline in FDI inflows in 2020, leading to fewer productive investments and jobs. Revitalising FDI inflows will be key to supporting economic recovery.
FDI inflows to the Commonwealth
Intra-Commonwealth greenfield FDI flows
(versus 2017-2019 average)
LO W E Rin 2020
LO W E Rin 2020
87959
J O B S45252
$153 BILLION
$8.3 BILLION
Almost
(versus 2017-2019 average)
the number of jobs created throughintra-Commonwealth greenfield FDI
in 2020
50%
5016_Book.indb 82 17-06-2021 08:32:21

3.1 Introduction
Having examined the implications of
COVID-19 for the Commonwealth’s
trade, as well as increased digitalisation
and digital trade by many countries in
response to the pandemic, this chapter
considers how foreign direct investment
(FDI) has been affected. As discussed
in Chapter 1, the pandemic has created
simultaneous supply, demand and
policy shocks affecting all aspects of
trade and FDI. FDI flows have been
disrupted primarily through delays to the
implementation of existing investment
projects, the deferral of decisions on new
investments, reductions in reinvested
earnings and declining equity capital
flows. These disruptions exacerbated
a pre-pandemic trend of sluggish
growth in international investment.1
Global FDI flows fell by 42 per cent in
2020, reaching a level of US$859 billion
by the end of the year (UNCTAD, 2021a).
All forms of FDI were affected, from
cross-border mergers and acquisitions
(M&As) to greenfield investments2
and international project finance
deals. United Nations Conference on
Trade and Development (UNCTAD)
data shows that developed countries
have felt the impact of the pandemic
most severely, where FDI flows had
declined by 69 per cent to $229 billion
in 2020. FDI flows into developing
economies have been comparatively
more resilient, declining by 12 per
cent to $616 billion. This has seen
developing countries grow their
share of global FDI to 72 per cent, the
highest on record. Even so, the impacts
across developing economies have
been uneven, with overall FDI inflows
to Latin America and the Caribbean
(down by 37 per cent) affected to a
greater degree than inflows to Africa
(down by 18 per cent) and developing
Asian countries (down by 4 per cent).
Moreover, while overall FDI flows to
developing economies have been fairly
resilient, greenfield investments have
declined sharply. Greenfield FDI project
announcements fell by 46 per cent in
developing countries in 2020, compared
with an overall decline of 35 per cent
globally and 19 per cent in developed
economies (UNCTAD, 2021a). African
countries were especially affected,
where the number of greenfield
announcements fell by 63 per cent,
compared with 51 per cent in Latin
America and the Caribbean, and 38
per cent in developing Asia. Similarly,
while international project finance
has been more resilient in general,
with flows down by just 2 per cent in
2020, these deals declined by 40 per
cent in Africa. The adverse impact of
COVID-19 in constraining greenfield
FDI and international project finance
is concerning given their importance
for developing productive capacity
and infrastructure, both of which
will be crucial in driving sustainable
post-pandemic economic recovery.
A prolonged decline in greenfield
investments, and FDI inflows more
generally, threatens to undermine
economic growth and transformation
in Commonwealth countries.
The chapter is divided into five
sections. Section 3.2, which
follows, provides an overview
of Commonwealth investment
trends in the decade preceding
the pandemic, focusing on the
aggregate picture of inward FDI into
the Commonwealth, developments
in intra-Commonwealth FDI and
trends in greenfield investment.
Section 3.3 analyses the impact of
COVID-19 on overall FDI inflows and
productive greenfield investment into
Commonwealth countries. Section 3.4
looks ahead to 2025, setting out the
prospects for post-COVID recovery in
Commonwealth FDI inflows. Section
3.5 concludes with the way forward.
5016_Book.indb 83 17-06-2021 08:32:21

84 \ Commonwealth Trade Review 2021
3.2 Common-wealth investment trends pre-COVID-19
Trade and investment are closely
integrated. This is especially true in
the case of FDI, which is a key driver
of international trade and production,
particularly in the context of the
structure and operation of global value
chains (GVCs) (Box 3.1). This section
focuses on broad trends in inward
investment into the Commonwealth in
the decade preceding COVID-19. It does
so by examining the global stock held by
Commonwealth countries (3.2.1) before
looking at intra-Commonwealth FDI
(3.2.2) and the specific contribution of
productive greenfield investment (3.2.3).
3.2.1 FDI into the Commonwealth in global perspective
FDI inward stock held by Commonwealth
countries reached nearly US$7.5
trillion in 2019, up from $4.4 trillion in
2010 (Figure 3.1). Despite absolute
growth during this period, the
Commonwealth’s share in global FDI
stock declined by 1.5 percentage
points to 20.4 per cent in 2019.
Commonwealth developed countries
hosted more than 60 per cent of this
stock (top panel in Figure 3.2). Regionally,
based on the Commonwealth regions
defined in Chapter 1, Europe (namely,
Cyprus, Malta and the UK) accounted
for more than one-third of inward
stock, with a slightly smaller share held
by Commonwealth Asian countries.
The Caribbean and Americas, Pacific
and Africa regions were less significant
in terms of the overall stock (bottom
panel in Figure 3.2). Commonwealth
small states collectively hosted 10.3 per
cent of the total inward stock in 2019,
while just 1.7 per cent was located in
least developed countries (LDCs).
Annual FDI inflows to the
Commonwealth (Figure 3.3) grew
faster – on average – than global
inflows (6.1 per cent versus 2.4 per
cent). The Commonwealth’s share
of global FDI inflows also expanded,
from 20.5 per cent in 2010 to 23.3 per
cent in 2019. Annual inflows averaged
US$356 billion over the decade and
totalled $359.1 billion in 2019.
In the three years immediately
preceding the onset of COVID-19
(2017–2019), more than 80 per cent
of cumulative FDI inflows to the
Commonwealth were directed to just
five countries: Singapore (23.9 per
cent), the UK (21.1 per cent), Australia
(14 per cent), India (12.4 per cent) and
Canada (11.2 per cent) (Figure 3.4).
Malaysia (2.3 per cent), Nigeria (1.3 per
cent) and South Africa (1.1 per cent)
were other important developing
country destinations for FDI inflows.
B O X 3 . 1
T R A D E A N D I N V E S T M E N T L I N K A G E S , A N D B R O A D E R F D I B E N E F I T S
FDI can help domestic firms participate in international production networks and access foreign markets, in part by aiding their integration into cross-border supply chains (Alfaro, 2016; Gonzalez, 2017). FDI may also support export sophistication and upgrading, potentially enabling greater export diversification on both the intensive and the extensive margins (Echandi et al., 2015). Trends and factors influencing Commonwealth FDI stocks and flows thus have an important bearing on both intra- and extra-Commonwealth trade.
The potential benefits of FDI extend beyond these trade dimensions. FDI can make a significant contribution to growth, development and prosperity in Commonwealth countries by transferring technology and skills, creating jobs and building productive capacity, especially where stocks of domestic capital and savings are insufficient to finance productive investments. The transfer of technology, skills and modern management techniques from foreign to domestic firms can support upgrading to higher-value-added production and potentially enhance firm-level productivity (Farole and Winkler, 2014; Alfaro and Chen, 2015; Godart et al., 2020). FDI often also creates higher-skilled and better-paid jobs (Hijzen et al., 2013; Echandi et al., 2015), sometimes accompanied by improved working environments and standards relative to local firms. While such benefits are not guaranteed and may be spread unevenly across and within countries, in the presence of appropriate policies in host countries FDI can serve as an important driver of structural economic transformation (OECD, 2002).
5016_Book.indb 84 17-06-2021 08:32:21

Chapter 3: The Impact of COVID-19 on Commonwealth FDI \ 85
US
$ bi
llion
% S
hare
0
1000
2000
4000
6000
8000
7000
3000
5000
0
5
10
15
20
25
2010 2011 2012 2013 2014 2015 2016 2017 2018 2019
CW FDI inward stock CW share of global FDI inward stock (%)
Source: Commonwealth Secretariat (calculated using UNCTAD data)
F I G U R E 3 . 1F D I I N WA R D STO C K I N T H E CO M M O N W E A LT H , 2 0 1 0 – 2 0 1 9
5016_Book.indb 85 17-06-2021 08:32:22

86 \ Commonwealth Trade Review 2021
61%Developing
39%Developed
BY DEVELOPMENT
37%Europe
32%Asia
15%Caribbean and Americas
11%Pacific
6%Africa
BY REGION
Source: Commonwealth Secretariat (calculated using UNCTAD data)
F I G U R E 3 . 2D I ST R I B U T I O N O F F D I I N WA R D STO C K I N T H E CO M M O N W E A LT H , 2 0 1 9
5016_Book.indb 86 17-06-2021 08:32:22

Chapter 3: The Impact of COVID-19 on Commonwealth FDI \ 87
3.2.2 Intra-Commonwealth FDI trends
The cumulative value of intra-
Commonwealth FDI stock reached
US$1.2 trillion in 2019, up from $693.7
billion in 2010 (Figure 3.5). Despite this
absolute growth, the relative share
of the Commonwealth in member
countries’ overall FDI stock declined
marginally from 19.6 per cent in
2010 to 18.2 per cent in 2019.
Intra-Commonwealth FDI inward stock
is highly concentrated. In 2019, just
three countries held half of the overall
stock – Singapore (20.3 per cent), India
(16.6 per cent) and Australia (13.3 per
cent). Four other developing members
ranked among top ten FDI hosts –
Mauritius (9.4 per cent), South Africa
(4.5 per cent), Barbados (3.8 per cent)
and Malaysia (3.5 per cent), along with
three developed economies – the UK
(6.5 per cent), Canada (5.1 per cent)
and New Zealand (4.1 per cent).
Intra-Commonwealth investments
represent an important component of
overall FDI inflows to Commonwealth
countries. A significant “Commonwealth
advantage” is at play, with bilateral
investment flows generally larger
between Commonwealth countries
compared with flows in which at
least one of the parties is not a
Commonwealth member (Box 3.2).
Intra-Commonwealth FDI inflows
have grown over the past decade,
buoyed by the Commonwealth
advantage. The aggregate value
of these inflows reached US$75.2
billion in 2019, up from $42.6 billion
in 2010 (Figure 3.6).3 The total value
of bilateral intra-Commonwealth
US
$ bi
llion
0
100
200
400
600
300
500
2010 2011 2012 2013 2014 2015 2016 2017 2018 2019
CW total Average 2010-2019
Source: Commonwealth Secretariat (calculated using UNCTAD data)
F I G U R E 3 . 3TOTA L V A LU E O F F D I I N F LO W S I N TO T H E CO M M O N W E A LT H , 2 0 1 0 – 2 0 1 9
0 5 10 15 20 25 30
Share of total Commonwealth FDI inflows (%)
Singapore
United Kingdom
Australia
India
Canada
Cyprus
Malaysia
Nigeria
South Africa
Malta
Source: Commonwealth Secretariat (calculated using UNCTAD data)
F I G U R E 3 . 4TO P 1 0 H O STS O F B I L AT E RA L F D I I N F LO W S I N TO T H E CO M M O N W E A LT H , 2 0 1 7 – 2 0 1 9 ( C U M U L AT I V E )
5016_Book.indb 87 17-06-2021 08:32:22

88 \ Commonwealth Trade Review 2021
FDI inflows rose consecutively in
each year between 2015 and 2019.
In the three years preceding the
onset of COVID-19, investors from
the UK, Singapore, Canada and
Mauritius contributed almost 90
per cent of overall FDI flows within
the Commonwealth (Figure 3.7).
Over the same period, just five
countries attracted 86 per cent of
intra-Commonwealth FDI inflows –
namely, India, Australia, Singapore,
Canada and the UK. Four other
Commonwealth developing countries
– Barbados, Malaysia, South Africa and
Bangladesh (a LDC) – ranked among
the top ten recipients of inflows.
B O X 3 . 2
T H E I N T R A - C O M M O N W E A LT H
A D VA N TA G E I N I N V E S T M E N T
The 2015 Commonwealth Trade Review found that, on average, Commonwealth country pairs attract 10 per cent more FDI compared with Commonwealth and non-Commonwealth country pairs as well as country pairs in which neither partner is a Commonwealth member.
Revised gravity estimates based on more recent data spanning the period from 2000 to 2018 indicate the persistence of a large and statistically significant “Commonwealth effect” on FDI flows (Table 3.1). This means, on average, the investment flows between Commonwealth country pairs (when both host and investor are members of the Commonwealth) are about 27 per cent5 higher than those between the other country pairs (column 1). As expected, common language, membership of the same free trade agreement (FTA) (in some cases), geographical contiguity in various regions and similar legal systems strengthen these flows. Among all these FDI facilitating factors, existence of a common language has a leading role: having English as one of the official languages in both investor and host countries is associated with 9 per cent more FDI flows.
US
$ bi
llion
0
200
400
800
1,400
1,200
600
1,000
2010 2011 2012 2013 2014 2015 2016 2017 2018 2019
Notes: Based on data on bilateral FDI instocks in 42 Commonwealth countries from 50 source countries between 2010 and 2019. Mirror data is used in instances where no data is available for the host country in a particular year or across all years. The mirror data is based on information reported by the source country from which the investment originates.Source: Commonwealth Secretariat (calculated using UNCTAD data)
Aggregate FDI Greenfield FDI
(1) (2)
Commonwealth membership 0.244*** 0.183***
FTA 0.364*** 0.112***
Contiguity 0.448*** 0.081***
Common language 0.876*** 0.418***
Distance (km) −1.132*** −0.446***
Colony 0.879*** 0.321***
Legal 0.107*** 0.095***
Origin-year FE Yes Yes
Dest-year FE Yes Yes
Sample size 42,158 27,436
Period 2000–18 2003–18
R-squared 0.610 0.657
Notes: The dependent variables in the model are bilateral FDI flows. All bilateral pairs of countries have been considered, including both Commonwealth and non-Commonwealth members. ***, **, and * denote the statistical significance of the estimated coefficients respectively at 1 per cent, 5 per cent and 10 per cent levels. These estimations include time-varying fixed effects for countries to account for omitted variables. The Pseudo Poisson Maximum Likelihood (PPML) method with fixed effects was employed for estimation of the Commonwealth effect in greenfield FDI, while Ordinary Least Squares (OLS) was used for overall FDI because of negative values for some country pairs.Source: Commonwealth Secretariat (estimated using data from UNCTADstat (column 1) and fDi Markets (column 2))
F I G U R E 3 . 5I N T RA- CO M M O N W E A LT H F D I I N STO C K ( U S $ B I L L I O N ) , 2 0 1 0 – 2 0 1 9
TA B L E 3 . 1T H E CO M M O N W E A LT H E F F ECT I N F D I F LO W S – G RA V I T Y M O D E L R ES U LTS
5016_Book.indb 88 17-06-2021 08:32:23

Chapter 3: The Impact of COVID-19 on Commonwealth FDI \ 89
This aggregate data masks the combined effects of brownfield as well as greenfield investments.6 Since greenfield investments are relatively more important for job creation and technological upgrading, the estimations are replicated in column 2 specifically for greenfield investment using data from the fDi Markets database. The results indicate that, on average, greenfield investment flows between Commonwealth country pairs are around 19 per cent higher than those between other pairs. The Commonwealth effect is relatively stronger for African members: they are found to attract 37 per cent more in intra-Commonwealth greenfield investments than other Commonwealth countries (18 percentage points above the Commonwealth average).
US
$ bi
llion
0
10
20
40
90
80
30
50
60
70
2010 2011 2012 2013 2014 2015 2016 2017 2018 2019
Intra-CW flows Average 2010-2019
Notes: Based on bilateral FDI flows for 42 Commonwealth countries between 2010 and 2019. Mirror data is used in instances where no data is available for the host country. The mirror data is based on information reported by the source country from which the investment originates.Source: Commonwealth Secretariat (calculated using UNCTAD data)
F I G U R E 3 . 6TOTA L V A LU E O F I N T RA- CO M M O N W E A LT H F D I F LO W S, 2 0 1 0 - 2 0 1 9
5016_Book.indb 89 17-06-2021 08:32:23

90 \ Commonwealth Trade Review 2021
3.2.3 Trends in productive greenfield investment in the Commonwealth
Annual greenfield FDI inflows to the
Commonwealth averaged US$145.3
billion between 2010 and 2019. These
mostly involved investments from
outside the Commonwealth. The
intra-Commonwealth share generally
declined over the decade, reaching 15
per cent in 2019 (Figure 3.8). Greenfield
FDI inflows to the Commonwealth
amounted to $150.3 billion in 2019,
with intra-Commonwealth flows
accounting for $26.6 billion of this total.
These figures should not be equated
directly with the magnitude of the
Commonwealth FDI advantage (Box
3.2) because there are greater numbers
of global investors compared with
Commonwealth investors, capital and
savings; and they have more diversified
interests, leading to greater FDI in the
Commonwealth.4 Nevertheless, this
illustrates the relative importance
of Commonwealth partners as
sources of greenfield investment.
Commonwealth Asian countries hosted
around one-third of cumulative intra-
Commonwealth greenfield investment
between 2010 and 2019. African (28
per cent) and Pacific (20 per cent)
Commonwealth countries were also
key destinations for these investments,
with smaller shares directed to Europe
(13 per cent) and the Caribbean and
Americas region (5 per cent).
Greenfield investments have been a
major source of new jobs in the past
decade, with 4,839,341 created across
the Commonwealth. Around one-fifth
of these jobs were created through
intra-Commonwealth investments,
predominantly in Asian countries
(Table 3.2). On average, 2.3 jobs
were created for every US$1 million
in intra-Commonwealth greenfield
FDI between 2010 and 2019.
In the three years preceding COVID-19,
investors in Commonwealth developed
countries were responsible for 57 per
cent of announced greenfield projects
in other Commonwealth members
(Table 3.3). The UK led the way, with
US$24.1 billion in outward investment
creating 79,414 jobs (nearly one-third
of the total generated through intra-
Commonwealth investment). Among
developing members, Singapore,
India and South Africa were key
0 5 10 15 20 25 30 35
INVESTORS
Share of total intra-Commonwealth flows (%)
United Kingdom
Singapore
Canada
Mauritius
Australia
Malaysia
India
Cyprus
Barbados
Nigeria
0 5 10 15 20 25 30 35
HOSTS
Share of total intra-Commonwealth flows (%)
India
Australia
Singapore
United Kingdom
Canada
Barbados
South Africa
Malaysia
New Zealand
Bangladesh
Notes: Based on bilateral FDI flows for 34 source and 36 host Commonwealth countries between 2017 and 2019. Mirror data is used in instances where no data is available for the host country. The mirror data is based on information reported by the source country from which the investment originates.Source: Commonwealth Secretariat (calculated using UNCTAD data)
F I G U R E 3 . 7TO P 1 0 I N V ESTO RS A N D H O STS O F I N T RA- CO M M O N W E A LT H F D I I N F LO W S B Y V A LU E , 2 0 1 7 – 2 0 1 9 ( C U M U L AT I V E )
5016_Book.indb 90 17-06-2021 08:32:23

Chapter 3: The Impact of COVID-19 on Commonwealth FDI \ 91
Cap
ital in
vest
men
t (U
S$
billio
n)
Sha
re o
f to
tal F
DI i
nflo
ws
(%)
0
50
150
250
200
100
0
5
10
15
20
40
25
30
35
2010 2011 2012 2013 2014 2015 2016 2017 2018 2019
Inflows from ROW Intra-CW inflows Intra-CW share (%)
Notes: Greenfield FDI value represented as the total value of capital investment. No data for inflows into Kiribati, Nauru, Tonga and Tuvalu. The data covers 145 source countries (including 37 Commonwealth members) investing in 50 destination Commonwealth countries.Source: Commonwealth Secretariat (calculated using fDi Markets data, from the Financial Times Limited 2021)
Source of investmentEmployment intensity by source of
investment
Rest of worldIntra-
CommonwealthIntra-Commonwealth
share (%)Rest of world
Intra-Commonwealth
Commonwealth total 3,870,316 969,025 20.0 2.7 2.3
Of which
Developed 968,412 241,151 19.9 1.7 1.6
Developing 2,901,904 727,874 20.1 3.3 2.7
Of which
Africa 408,551 207,557 33.7 1.9 1.8
Asia 2,418,772 500,061 17.1 3.8 3.5
Caribbean and Americas 257,969 45,218 14.9 1.5 2.1
Of which
Caribbean SIDS 69,777 13,822 16.5 6.0 2.8
Europe 562,692 98,044 14.8 1.9 1.8
Pacific 222,332 118,145 34.7 1.6 1.4
Of which
Pacific SIDS 4,804 6,434 57.3 1.0 1.0
Vulnerable groups
LDCs 144,505 86,915 37.6 1.9 1.5
Small states 113,457 52,957 31.8 3.4 2.2
SIDS 271,888 92,172 25.3 2.3 2.3
Notes: The data covers 145 source countries (including 37 Commonwealth members) investing in 50 destination Commonwealth countries (no data for investments in Kiribati, Nauru, Tonga and Tuvalu). Employment intensity is measured as the number of jobs created per US$1 million in greenfield investment.Source: Commonwealth Secretariat (calculated using fDi Markets data, from the Financial Times Limited 2021)
F I G U R E 3 . 8AG G R EG AT E V A LU E A N D S H A R E O F A N N O U N C E D G R E E N F I E L D F D I I N F LO W S TO T H E CO M M O N W E A LT H , 2 0 1 0 – 2 0 1 9
TA B L E 3 . 2J O B S C R E AT E D T H RO U G H A N N O U N C E D G R E E N F I E L D F D I I N T H E CO M M O N W E A LT H , 2 0 1 0 – 2 0 1 9
5016_Book.indb 91 17-06-2021 08:32:23

92 \ Commonwealth Trade Review 2021
sources of intra-Commonwealth
investment and jobs, as were Malaysia
and Bangladesh to a lesser extent.
Bangladesh is an interesting example
of intra-Commonwealth greenfield
investment originating from a LDC.
Between 2017 and 2019, the bulk
of outward greenfield FDI from
Bangladesh went to India (totalling
US$1.1 billion), around 90 per cent of
which was in coal, oil and gas projects,
with much smaller capital investments
in financial services, plastics, and
transportation and warehousing. Over
this period, Kenya benefited from
$140 million in announced greenfield
FDI from Bangladesh into projects
in the metals and pharmaceuticals
sectors; there was also outward
investment from Bangladesh into the
pharmaceuticals sector in Malaysia
($56.1 million) and financial services
in South Africa ($9.5 million).
The UK was the largest recipient of
announced intra-Commonwealth
greenfield FDI between 2017 and
2019, accounting for nearly one-fifth
of total inflows. Several developing
country members – India, Singapore,
Nigeria, Malaysia, South Africa,
Namibia and Bangladesh – featured
among the top 10 destinations (Table
3.3). Of these, India welcomed the
largest share (nearly US$13.8 billion),
creating a total of 91,698 new jobs.
Over the same period, 70 per cent of
intra-Commonwealth greenfield FDI
was directed into services (Figure 3.9).
More than one-third of this went into
real estate, while communications,
software and IT services, financial
services and renewable energy (Box
3.3) were also significant destinations.
The manufacturing sector attracted
nearly a quarter (23 per cent) of
intra-Commonwealth inflows, with
the metals, food and beverages,
and chemicals industries receiving
the greatest shares. Inflows to the
primary sector were notably smaller,
accounting for just 7 per cent of total
intra-Commonwealth greenfield FDI
in 2017–2019, with 96 per cent of
this investment in coal, oil and gas.
Services also dominated intra-
Commonwealth greenfield inflows at
the regional level, although to varying
degrees. They accounted for 90 per
cent of inflows to Commonwealth
Europe and 82 per cent in Pacific
member countries between 2017
and 2019, compared with 67 per cent
in Asia, 63 per cent in the Caribbean
and Americas region, and 45 per
cent in Africa. Real estate was the
top sector for intra-Commonwealth
inflows to European and Asian member
countries; whereas this was renewable
energy (Pacific), software and IT
Sources Hosts
Value of outward investment
(US$ million)
Share of intra-Commonwealth
total (%)
Value of inflows (US$ million)
Share of intra-Commonwealth
total (%)
United Kingdom 24,121 29.6 United Kingdom 15,810.8 19.4
Singapore 18,964 23.3 Australia 15,064.7 18.5
Australia 10,930 13.4 India 13,765.5 16.9
Canada 7,080 8.7 Singapore 4,646.4 5.7
India 6,261 7.7 Nigeria 4,590.4 5.6
South Africa 3,601 4.4 Malaysia 4,392.5 5.4
New Zealand 2,530 3.1 Canada 4,049.7 5.0
Malaysia 2,026 2.5 South Africa 3,029.0 3.7
Cyprus 1,691 2.1 Namibia 2,267.0 2.8
Bangladesh 1,305 1.6 Bangladesh 1,904.5 2.3
Source: Commonwealth Secretariat (calculated using fDi Markets data, from the Financial Times Ltd 2020)
TA B L E 3 . 3TO P 1 0 S O U RC ES A N D H O STS O F A N N O U N C E D I N T RA- CO M M O N W E A LT H G R E E N F I E L D F D I I N F LO W S TO CO M M O N W E A LT H M E M B E RS, B Y C U M U L AT I V E V A LU E , 2 0 1 7 - 2 0 1 9
5016_Book.indb 92 17-06-2021 08:32:23

Chapter 3: The Impact of COVID-19 on Commonwealth FDI \ 93
services (Caribbean and Americas)
and communications (Africa) in
other Commonwealth regions.
Manufacturing was a relatively
more important sector for intra-
Commonwealth greenfield FDI in the
Caribbean and Americas region (36.7
per cent of total inflows, mostly to
Canada, with very limited inflows to
Antigua and Barbuda, and Barbados),
Africa (35 per cent) and Asia (23.4 per
cent). In the Caribbean and Americas,
the largest manufacturing inflows went
to electronic components and metals;
compared with metals, chemicals
and food and beverages in Africa; and
metals, aerospace, and paper, printing
and packaging in Asia. Primary sectors
attracted 20 per cent and 9.4 per cent of
inflows in Africa and Asia, respectively.
B O X 3 . 3
I N V E S TO R S S E T T H E I R S I G H T S O N R E N E WA B L E S I N T H E C O M M O N W E A LT H
The profile of global investment is shifting amid increasing emphasis on reorienting the world towards a more sustainable development path. In the energy sector, investors are rapidly adapting their portfolios to focus on clean energy. This is evident in the increasing share of international project finance earmarked for the renewable energy sector, aided by improved availability of multinational financing for solar and wind projects (EIU, 2020; UNCTAD, 2020a).
70%Services
23%Manufacturing
7%Primary
BY SECTOR
BY REGION
US
$ m
illio
n
0
5000
15000
30000
25000
20000
10000
Africa Asia
Primary Manufacturing Services
Caribbean & Americas Europe Pacific
Note: Industries are grouped into primary, manufacturing and services sectors as per Annex 3.1.Source: Commonwealth Secretariat (calculated using fDi Markets data, from the Financial Times Ltd 2020)
F I G U R E 3 . 9S ECTO RA L CO M P O S I T I O N O F A N N O U N C E D I N T RA- CO M M O N W E A LT H G R E E N F I E L D F D I I N F LO W S, 2 0 1 7 – 2 0 1 9 ( C U M U L AT I V E )
5016_Book.indb 93 17-06-2021 08:32:24

94 \ Commonwealth Trade Review 2021
Globally, investment flows to the renewable energy sector have reached record highs. In 2019, renewable energy companies initiated 516 projects in foreign countries (38 per cent more than in 2018), with a combined value of US$92.1 billion (Shehadi, 2020).
In the Commonwealth, these trends are reflected in expanding productive greenfield investments in renewables. The renewable energy sector was the second largest recipient of greenfield FDI across the Commonwealth in 2019, with announced inflows growing by 179 per cent since 2010 to reach US$26 billion. The sector’s share in the Commonwealth’s total greenfield inflows has also expanded in relative terms – from 4.4 per cent in 2010 to 14.8 per cent in 2019.
Intra-Commonwealth greenfield investments in renewables are also on the rise. The renewable energy sector was the fourth-largest recipient of intra-Commonwealth flows in 2019, with US$2.9 billion in capital investment through announced projects. This represented a 152 per cent increase over the figure in 2010. As a result, the share of renewable energy projects in total intra-Commonwealth greenfield FDI increased from just 1.6 per cent in 2010 to 11 per cent in 2019.
These intra-Commonwealth investments remain highly concentrated, in terms of both major investors and hosts (Figure 3.10). More than 70 per cent of the investments in renewables over the past decade have originated from three Commonwealth countries: Canada, the UK and India. In turn, just four Commonwealth members - Australia (32 per cent), Nigeria (21.4 per cent), India (19.2 per cent) and the UK (11 per cent) – absorbed more than 80 per cent of the inflows. Aside from these countries, a few developing members, including Pakistan, South Africa and Kenya, are increasingly popular destinations for intra-Commonwealth greenfield FDI in renewables. Some Commonwealth LDCs have also received sizeable inflows into the sector over the past decade, including Zambia (US$231.7 million), Bangladesh ($215.4 million) and Tanzania ($194.9 million).
Continued growth in investments in renewable energy will likely generate considerable economic and environmental benefits for Commonwealth countries. Productive greenfield investments
0 2 4 6 8 10 12
SOURCES
US$ billion
Canada
United Kingdom
India
Singapore
Malaysia
New Zealand
Australia
Cyprus
Mauritius
Nigeria
0 2 4 6 8 10 12
HOSTS
US$ billion
Australia
Nigeria
India
United Kingdom
Pakistan
South Africa
Kenya
Canada
Namibia
Barbados
Source: Commonwealth Secretariat (calculated using fDi Markets data, from the Financial Times Ltd 2020)
F I G U R E 3 . 1 0TO P 1 0 S O U RC ES A N D D EST I N AT I O N S F O R I N T RA- CO M M O N W E A LT H G R E E N F I E L D F D I I N T H E R E N E WA B L E E N E RGY S ECTO R , B Y V A LU E O F C U M U L AT I V E CA P I TA L I N V EST M E N T 2 0 1 0 – 2 0 1 9
5016_Book.indb 94 17-06-2021 08:32:24

Chapter 3: The Impact of COVID-19 on Commonwealth FDI \ 95
3.3 The Impact of COVID-19 on Commonwealth FDI
COVID-19 affected all types of FDI in
2020, and its multi-faceted impacts
on investment flows are likely to
persist for some time amid the
on-going uncertainty surrounding the
pandemic’s endpoint. The effects of
COVID-19 in constraining investment
have important implications for
Commonwealth trade (through the
channels outlined in Box 3.1) and
threaten to exacerbate existing
challenges to inclusive growth (as
explained in Box 3.4). This section
examines the available evidence on
the performance of Commonwealth
FDI inflows since the onset of
COVID-19, illustrating where, and
how, the pandemic has up-ended
the key trends outlined above.
3.3.1 Impacts of COVID-19 on overall FDI inflows into Commonwealth countries
Most Commonwealth countries
experienced a significant decline
in overall FDI inflows in 2020 as the
crippling social and economic effects
of COVID-19 took hold. This is evident
from Table 3.4, which reports UNCTAD’s
full-year estimates of FDI inflows in 2020
based on available partial-year data
for 36 Commonwealth members and
compares them against average annual
in this area can help lessen reliance on fossil fuels, thereby lowering greenhouse gas emissions and reducing some types of air pollution. This is important for strengthening the health and well-being of Commonwealth citizens. Similarly, investments in renewables help diversify the energy supply and lower dependence on imported fuels. They can also generate new jobs and create opportunities for micro, small and medium enterprises (MSMEs), particularly when activities related to the transition to green energy are factored in. While investment in renewable energy has inevitably slowed on the back of the wide-ranging economic impacts of COVID-19 (see Section 3.3.2), it should form an important part of efforts to build more sustainable and resilient economies in the post-COVID-19 era.
Source: Data reported here is extracted from the fDi Markets database, from the Financial Times Ltd 2020
B O X 3 . 4
C O V I D -19 H A S E X A C E R B AT E D G E N D E R I M B A L A N C E S I N I N V E S T M E N T
Women are more vulnerable to the economic shocks generated by COVID-19. Female-dominated sectors such as textiles and garments, food, hospitality and tourism rank among those most affected, and a larger share of the job losses resulting from the pandemic have been among women (Durant and Coke-Hamilton, 2020; Madgavkar et al., 2020). Some estimates suggest women are almost twice as likely as men to lose their job during the pandemic (Madgavkar et al., 2020). COVID-19 is also exacerbating gender-differentiated challenges in accessing finance for productive investment. This threatens to widen the existing financing gap for women-owned MSMEs, which was already estimated at US$1.5 trillion prior to the onset of the pandemic.7 Mindful of these multiple and interrelated challenges, the International Monetary Fund has warned that COVID-19 threatens to unravel the past three decades of economic progress made by women (Georgieva et al., 2020).
Addressing these gender imbalances should be a priority in policy responses supporting post-COVID economic recovery. New financing channels and innovative financial instruments are required to streamline access to investment for women entrepreneurs. This could be achieved, for example, through the provision of tax incentives to encourage investment in women-led enterprises (UN Women, 2020). Promoting greater competition in digital financial products and services, while supporting the digital empowerment of women, can also help boost availability and access. In addition, efforts to promote diversity among investors and support women angel and venture capital investors can unlock new sources of private capital (ibid.).
5016_Book.indb 95 17-06-2021 08:32:24
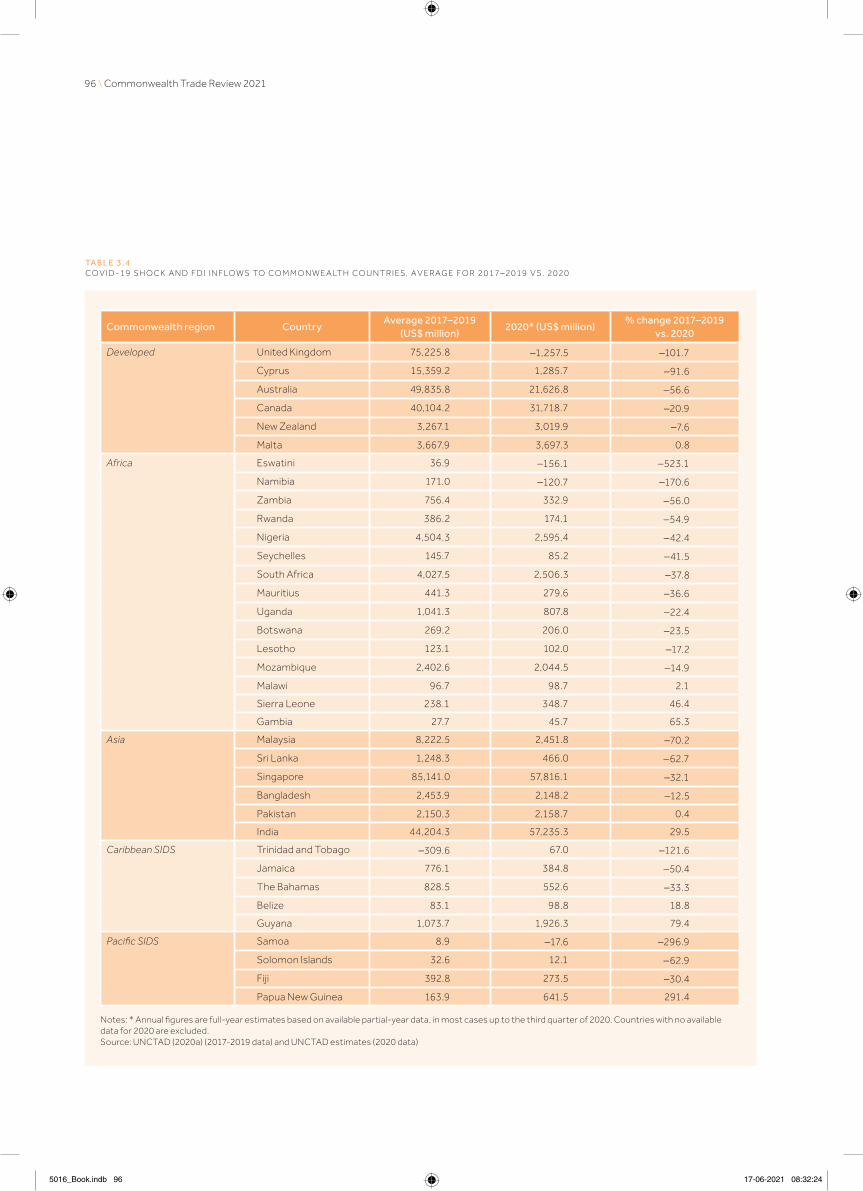
96 \ Commonwealth Trade Review 2021
Commonwealth region CountryAverage 2017–2019
(US$ million)2020* (US$ million)
% change 2017–2019 vs. 2020
Developed United Kingdom 75,225.8 −1,257.5 −101.7
Cyprus 15,359.2 1,285.7 −91.6
Australia 49,835.8 21,626.8 −56.6
Canada 40,104.2 31,718.7 −20.9
New Zealand 3,267.1 3,019.9 −7.6
Malta 3,667.9 3,697.3 0.8
Africa Eswatini 36.9 −156.1 −523.1
Namibia 171.0 −120.7 −170.6
Zambia 756.4 332.9 −56.0
Rwanda 386.2 174.1 −54.9
Nigeria 4,504.3 2,595.4 −42.4
Seychelles 145.7 85.2 −41.5
South Africa 4,027.5 2,506.3 −37.8
Mauritius 441.3 279.6 −36.6
Uganda 1,041.3 807.8 −22.4
Botswana 269.2 206.0 −23.5
Lesotho 123.1 102.0 −17.2
Mozambique 2,402.6 2,044.5 −14.9
Malawi 96.7 98.7 2.1
Sierra Leone 238.1 348.7 46.4
Gambia 27.7 45.7 65.3
Asia Malaysia 8,222.5 2,451.8 −70.2
Sri Lanka 1,248.3 466.0 −62.7
Singapore 85,141.0 57,816.1 −32.1
Bangladesh 2,453.9 2,148.2 −12.5
Pakistan 2,150.3 2,158.7 0.4
India 44,204.3 57,235.3 29.5
Caribbean SIDS Trinidad and Tobago −309.6 67.0 −121.6
Jamaica 776.1 384.8 −50.4
The Bahamas 828.5 552.6 −33.3
Belize 83.1 98.8 18.8
Guyana 1,073.7 1,926.3 79.4
Pacific SIDS Samoa 8.9 −17.6 −296.9
Solomon Islands 32.6 12.1 −62.9
Fiji 392.8 273.5 −30.4
Papua New Guinea 163.9 641.5 291.4
Notes: * Annual figures are full-year estimates based on available partial-year data, in most cases up to the third quarter of 2020. Countries with no available data for 2020 are excluded.Source: UNCTAD (2020a) (2017-2019 data) and UNCTAD estimates (2020 data)
TA B L E 3 . 4CO V I D - 1 9 S H O C K A N D F D I I N F LO W S TO CO M M O N W E A LT H CO U N T R I ES, A V E RAG E F O R 2 0 1 7 – 2 0 1 9 V S . 2 0 2 0
5016_Book.indb 96 17-06-2021 08:32:24

Chapter 3: The Impact of COVID-19 on Commonwealth FDI \ 97
inflows over the period from 2017 to
2019. The adverse effects on inflows are
clear across Commonwealth regions.
Commonwealth developed countries,
which collectively account for a
large share of all FDI inflows to the
Commonwealth, have been hit
particularly hard. This mirrors the
global pattern wherein much of the
decline in global FDI inflows in 2020 was
registered in developed economies.
The UK was hit by divestments by
foreign investors totalling nearly US$1.3
billion, primarily because of negative
intra-company loans and some equity
divestments (UNCTAD, 2021a). Inflows
to Cyprus were $14 billion lower than
the 2017–2019 average, falling to $1.3
billion; and inflows to Australia were less
than half the average for the preceding
three years. Canada’s FDI inflows were
more than $8 billion lower in 2020,
owing in part to a 50 per cent reduction
in new investments from multinational
enterprises (MNEs) headquartered in the
USA (ibid.). Malta was the only developed
Commonwealth economy to register
positive growth – albeit marginal – with
FDI inflows $29 million higher in 2020
compared with the 2017–2019 average.
In Africa, the impacts of COVID-19 on
FDI inflows were exacerbated by a slump
in prices and demand for commodities
in the first half of 2020. Project finance
deals in Africa also took a significant hit
in the second half of the year. Certain
African LDCs were among the worst
affected. Inflows to Rwanda were less
than half the pre-pandemic (2017–2019)
average, while those to Uganda and
Zambia were US$423 million and $234
million lower, respectively. FDI inflows to
the two largest African economies also
saw significant impacts. Inflows to South
Africa were more than $1.5 billion lower.
In Nigeria, on the back of low crude oil
prices and pandemic-induced closures of
oil development sites, FDI inflows were
$1.9 billion shy of the 2017–2019 average.
Two African SIDS were also among the
worst affected, with inflows to Mauritius
and Seychelles markedly lower in 2020.
The relative impact of COVID-19 on
FDI inflows to Botswana, Lesotho and
Mozambique was more muted, with
the latter benefiting from the on-going
implementation of a $2 billion LNG
project (UNCTAD, 2021a). Among
Commonwealth African members, only
The Gambia, Malawi and Sierra Leone
– all LDCs – registered growth in FDI
inflows in 2020 compared with 2017-
2019 averages, albeit off small bases.
In Commonwealth Asia, India bucked
the trend, with FDI inflows expanding
by more than US$13 billion in 2020. This
growth was spurred by investments in
consulting and digital sectors (including
significant greenfield investment) and
M&A deals in energy and infrastructure
(UNCTAD, 2021a). However, other Asian
members did not fare so well. Singapore,
a key conduit for FDI inflows in Southeast
Asia, and the largest Commonwealth
Asian recipient of FDI in 2019, saw
inflows decline by $27.3 billion in 2020
against the average for the preceding
three years, in part because of a sharp
fall in cross-border M&As (ibid.). Sri
Lanka and Bangladesh saw inflows
reduced by $782 million and $306 million,
respectively. This owed in a large part
to collapsing demand in the apparel
sector: both economies have significant
linkages to export-oriented apparel
manufacturing GVCs (ibid.). A prolonged
shock to trade and investment in
GVC-dominated manufacturing
sectors may severely constrain
exports from Sri Lanka, Bangladesh
and other Asian economies reliant on
labour-intensive manufacturing. This
is especially significant given that it
is occurring against the backdrop of
broader structural shifts – including
greater emphasis on re-shoring,
regionalisation and replication and
a pivot in focus to regional market-
seeking FDI and shorter value chains
– that were already occurring in global
manufacturing GVCs even prior to
the emergence of the pandemic
(discussed further in Section 3.4).
Among the Caribbean SIDS for which
full-year estimates are available for 2020,
FDI inflows to Jamaica (US$391 million
lower) and The Bahamas ($276 million
lower) were most affected relative to
pre-pandemic averages. In contrast,
Belize, Guyana, and Trinidad and
Tobago fared much better, registering
positive growth in FDI inflows in 2020.
In the Pacific, FDI inflows into Papua New
Guinea expanded from a relatively low
pre-pandemic level to reach US$641.5
million in 2020. Pacific SIDS elsewhere in
the region fared less favourably, despite
being relatively shielded from the spread
of COVID-19. FDI inflows to Fiji, Solomon
Islands and Samoa were lower in 2020
compared with pre-pandemic averages.
3.3.2 Impacts on productive greenfield investment in the Commonwealth
Greenfield projects are a key component
of FDI, particularly in Commonwealth
developing countries. They can be
instrumental in enhancing productive
capacity, transferring skills and
technology, and creating jobs. Greenfield
investments thus have the potential
to play an important role in driving the
long-term structural transformation
of Commonwealth economies
and in supporting post-COVID
economic recovery. It is therefore
concerning, as this section shows,
5016_Book.indb 97 17-06-2021 08:32:24

98 \ Commonwealth Trade Review 2021
that the COVID-19 pandemic has hit
greenfield project announcements
hard across the Commonwealth.
The analysis assesses the impact of
COVID-19 on intra-Commonwealth
greenfield FDI8 by comparing trends
in greenfield project announcements
between 2017 and 2019 (hereafter
“the pre-pandemic period”) and
2020. This covers much of the first
wave of the pandemic, which hit most
Commonwealth countries at the end
of the first quarter (Q1) or early in the
second quarter (Q2) of 2020, and, in the
case of some members, the emergence
of second waves of COVID-19
infections in the latter half of 2020.
Aggregate numbers of announced
intra-Commonwealth greenfield FDI
projects were notably lower in all four
quarters of 2020 compared with the
averages over the pre-pandemic period
(top panel in Figure 3.11). The effects
were most pronounced in Q2 and Q3.
All Commonwealth regions registered
fewer intra-Commonwealth greenfield
announcements in these two quarters,
with the largest relative declines in Africa
and Europe. Across all four quarters,
251 fewer intra-Commonwealth
greenfield FDI project announcements
were made in Commonwealth
countries in 2020 compared with
the pre-pandemic average (745 in
2017-2019 versus 494 in 2020).
This translated into significantly
lower levels of announced intra-
Commonwealth greenfield investments
in the second, third and fourth quarters
of 2020 compared to pre-pandemic
averages (bottom panel in Figure 3.11).
In 2020, overall intra-Commonwealth
inflows were US$1.6 billion lower in Q2,
$4.7 billion lower in Q3 and $2.9 billion
lower in Q4. The pattern of COVID-19
impacts on greenfield investment
values varied across Commonwealth
regions. Intra-Commonwealth inflows
to member countries in Africa (down
by 60 per cent and 91 per cent) and
the Caribbean and Americas region
(down by 35 per cent and 80 per cent)
were most severely affected in Q2
and Q3 of 2020. European member
countries registered sharp reversals
in greenfield FDI inflows in Q3 2020
(falling by 93 per cent), alongside steep
declines in Commonwealth Asia (60
per cent) and the Pacific (47 per cent).
Greenfield investment inflows began
to recover in Q4 of 2020 compared
with pre-pandemic averages in
Commonwealth African (just 3 per
2017-19 2020 2017-19 2020
Q1 Q2 Q3 Q4
2017-19 2020 2017-19 2020
Africa Asia Caribbean & Americas Europe Pacific
NUMBER OF PROJECT ANNOUNCEMENTS
AGGREGATE VALUE OF INVESTMENTS (US$ MILLION)
US
$ m
illio
n
0
1000
3000
10000
9000
8000
7000
6000
5000
4000
2000
Num
ber o
f pro
ject
s
0
50
150
250
200
100
2017-19 2020 2017-19 2020
Q1 Q2 Q3 Q4
2017-19 2020 2017-19 2020
Africa Asia Caribbean & Americas Europe Pacific
Note: Figures for 2017–2019 represent annual averages over the three-year period.Source: Commonwealth Secretariat (calculated using fDi Markets data, from the Financial Times Ltd 2020)
F I G U R E 3 . 1 1N U M B E R A N D AG G R EG AT E V A LU E O F A N N O U N C E D I N T RA- CO M M O N W E A LT H G R E E N F I E L D F D I P ROJ ECTS B Y CO M M O N W E A LT H R EG I O N A N D Q UA RT E R , A V E RAG E 2 0 1 7 – 2 0 1 9 V S . 2 0 2 0
5016_Book.indb 98 17-06-2021 08:32:24

Chapter 3: The Impact of COVID-19 on Commonwealth FDI \ 99
cent lower) and Pacific countries (up
by 55 per cent) but were still severely
constrained in member countries
in Asia (69 per cent lower), Europe
(96 per cent lower) and Caribbean
and Americas (24 per cent lower).
Impacts on jobs created through greenfield investments
The estimated number of jobs
created through announced
greenfield investment in the
Commonwealth declined steeply in
2020 compared with pre-pandemic
levels.9 Overall, an estimated 297,098
jobs were created through these
announced investments across
the Commonwealth, 212,682 fewer
than the annual average between
2017 and 2019, representing
a decline of 42 per cent. The
estimated number of jobs created
through intra-Commonwealth
greenfield FDI declined even
more steeply, halving from an
annual average of 87,959 in the
pre-pandemic period to 45,252
in 2020 (Table 3.5). This saw the
intra-Commonwealth share in total
estimated jobs created through
announced greenfield investments
fall by more than 2 percentage
points to 15.2 per cent in 2020.
Average 2017–2019
2020% change
2017–2019 vs. 2020
Intra-Commonwealth share of total jobs created in region (%)
Employment intensity
Average 2017–2019 2020 Average 2017–2019 2020
Commonwealth total 87,959 45,252 −48.6 17.3 15.2 3.2 2.4
Of which
Developed 25,957 14,859 −42.8 20.2 13.5 2.1 2.2
Developing 62,002 30,393 −51.0 16.3 16.3 4.2 2.5
Of which
Africa 15,273 6,698 −56.1 22.7 24.4 3.0 1.4
Asia 44,917 23,648 −47.4 14.8 15.1 5.0 3.3
Caribbean and Americas
4,522 2,478 −45.2 11.9 7.9 2.7 2.0
Of which
Caribbean SIDS 1,761 47 −97.3 16.9 1.6 11.2 3.7
Europe 11,027 3,069 −72.2 16.4 5.7 2.1 2.3
Pacific 12,219 9,359 −23.4 35.6 33.6 2.2 2.2
Of which
Pacific SIDS 76 – −100.0 14.4 – 1.9 –
Vulnerable groups
LDCs 5,843 841 −85.6 23.9 14.4 3.1 1.2
Small states 3,975 857 −78.4 23.1 10.5 2.9 3.0
SIDS 6,454 1,856 −71.2 17.3 9.8 3.1 2.1
Note: Employment intensity is measured as the number of jobs created per US$1 million in greenfield investment. Figures for 2017–2019 represent annual averages over the three-year period.Source: Commonwealth Secretariat (calculated using fDi Markets data, from the Financial Times Ltd 2020)
TA B L E 3 . 5J O B C R E AT I O N A N D E M P LOY M E N T I N T E N S I T Y O F I N T RA- CO M M O N W E A LT H G R E E N F I E L D F D I , B Y CO U N T RY G RO U P , 2 0 1 7 – 2 0 1 9 A V E RAG E V S . 2 0 2 0
5016_Book.indb 99 17-06-2021 08:32:25

100 \ Commonwealth Trade Review 2021
The pandemic’s adverse impact
on the job-creating potential of
intra-Commonwealth greenfield FDI
was felt across all Commonwealth
regions in 2020. In aggregate, the
relative impact on jobs was greater
in developing members compared
with their developed counterparts,
and Commonwealth LDCs and small
states, including SIDS (especially
Caribbean SIDS), registered large
declines off relatively small bases.
Sectoral impacts
Global greenfield FDI inflows to the
primary, manufacturing and services
sectors in the Commonwealth declined
in 2020. Inflows to the primary sector
were US$7.1 billion lower in 2020, a
drop of 19 per cent compared with
the pre-pandemic average. Inflows
into manufacturing were less than half
their pre-pandemic level ($53.3 billion
versus $22.5 billion). Greenfield inflows
to services were the least affected in
relative terms at 11.5 per cent lower
than the pre-pandemic average ($93.7
billion compared with $82.2 billion).
Intra-Commonwealth greenfield FDI
inflows to the primary and services
sectors were affected significantly in
2020, declining by 56 per cent (US$2
billion compared with $861.1 million)
and 34 per cent ($19 billion versus $12.5
billion) relative to the pre-pandemic
averages. Contrary to the steep drop
in global FDI to manufacturing, this
sector fared relatively better overall,
with intra-Commonwealth greenfield
investment in 2020 just 11 per cent
(or $666 million) lower than the pre-
pandemic average. The more muted
impact was mainly driven by a very
large investment of $3.4 billion in the
chemicals industry in Malaysia in 2020
as well as substantial investments in the
metals and non-automotive transport
original equipment manufacturing
(OEM) industries in Malaysia, and the
pharmaceutical industry in the UK.
Overall, across the Commonwealth,
only one primary industry (minerals),
three services sectors (transportation
and warehousing, renewable energy
and communications) and five
manufacturing industries (business
machines and equipment, chemicals,
medical devices, non-automotive
transport OEM and wood products)
registered higher greenfield inflows
in 2020 compared with pre-pandemic
averages. Many of these sectors were
less exposed to the demand, supply
and policy shocks affecting other
investment sectors. In some of the
primary and manufacturing industries,
production methods tend to use highly
automated assembly lines and employ
more industrial robots (compared with
the garments industry, for example,
as discussed in Chapter 1). They also
tend to be more capital-intensive, and
some are linked to GVCs originating
in the Asian region, which was quick
to rebound from the pandemic.
The relatively less severe impact on
greenfield investment in manufacturing
resulted in changes to the sectoral
composition of intra-Commonwealth
greenfield FDI compared with pre-
pandemic levels (Figure 3.12), with
the share of manufacturing in total
inflows increasing by 6 percentage
points amid declining shares for the
primary and services sectors. Services
remained the dominant sector by
value, accounting for two-thirds of
announced intra-Commonwealth
greenfield FDI flows in 2020.
The broad picture in relation to the
pandemic’s sectoral impacts is largely
replicated across Commonwealth
regions. Aside from one additional
greenfield project in the primary sector
in Asia, and three more manufacturing
projects in the Caribbean and Americas
region, numbers of greenfield
announcements were lower in 2020
compared with pre-pandemic averages
in the primary, manufacturing and
services sectors in all other regions (top
panel in Figure 3.13). This translated
into generally lower levels of intra-
Commonwealth capital investment, with
the notable exceptions of investments in
services in Africa, manufacturing in Asia
and the primary sector in Caribbean and
Americas (bottom panel in Figure 3.13).
Table 3.6 shows the primary,
manufacturing and services industries
most affected by falling greenfield
investment inflows since the start of the
pandemic, highlighting some variation
across Commonwealth regions. For
manufacturing in the Commonwealth
as a whole, metals, food and beverages,
and electronic components were most
affected. Real estate, financial services,
and hotels and tourism experienced the
largest declines in greenfield FDI relative
to pre-pandemic averages among
services across the Commonwealth.
5016_Book.indb 100 17-06-2021 08:32:25
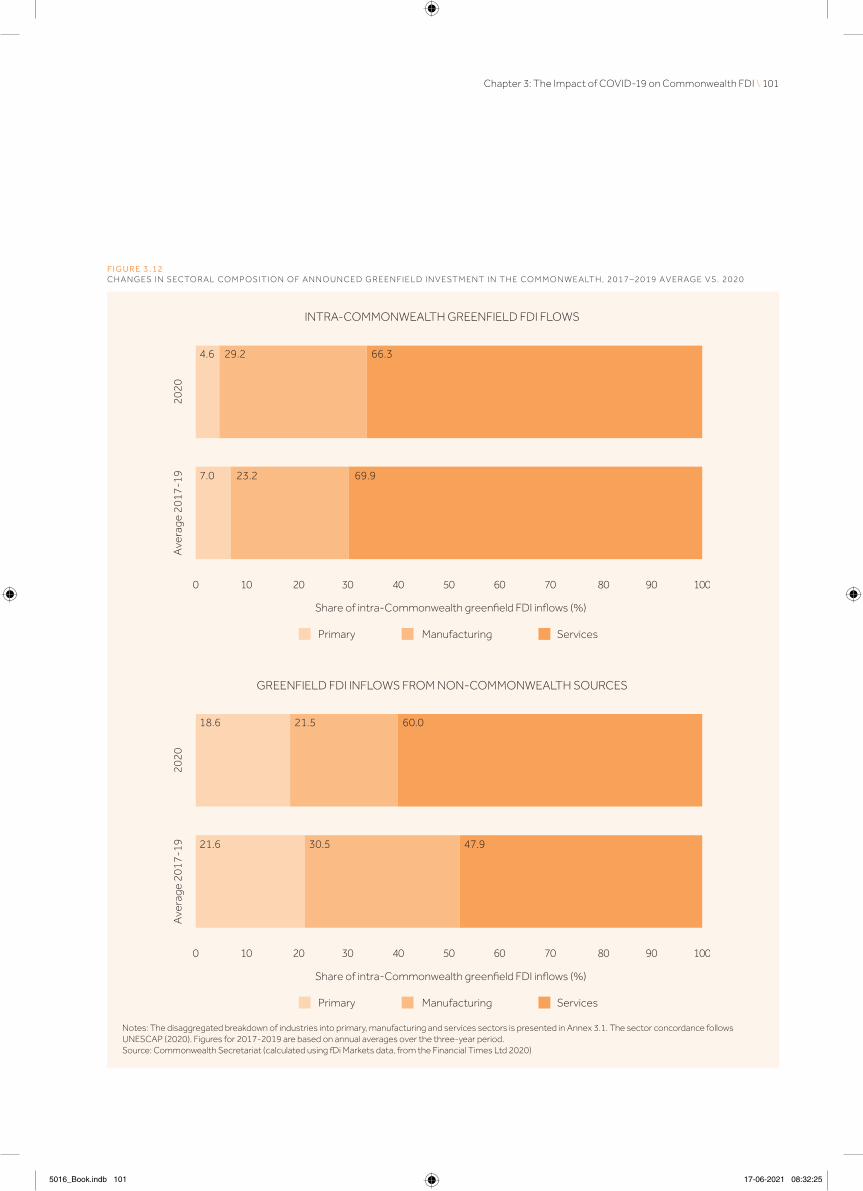
Chapter 3: The Impact of COVID-19 on Commonwealth FDI \ 101
GREENFIELD FDI INFLOWS FROM NON-COMMONWEALTH SOURCES
0 10 20 30 5040 60 70 10080 90
INTRA-COMMONWEALTH GREENFIELD FDI FLOWS
Share of intra-Commonwealth greenfield FDI inflows (%)
2020
Ave
rage
201
7-19
0 10 20 30 5040 60 70 10080 90
2020
Ave
rage
201
7-19
60.0
47.921.6 30.5
18.6 21.5
66.3
69.923.2
4.6 29.2
Primary Manufacturing Services
Share of intra-Commonwealth greenfield FDI inflows (%)
Primary Manufacturing Services
7.0
Notes: The disaggregated breakdown of industries into primary, manufacturing and services sectors is presented in Annex 3.1. The sector concordance follows UNESCAP (2020). Figures for 2017-2019 are based on annual averages over the three-year period.Source: Commonwealth Secretariat (calculated using fDi Markets data, from the Financial Times Ltd 2020)
F I G U R E 3 . 1 2C H A N G ES I N S ECTO RA L CO M P O S I T I O N O F A N N O U N C E D G R E E N F I E L D I N V EST M E N T I N T H E CO M M O N W E A LT H , 2 0 1 7 – 2 0 1 9 A V E RAG E V S . 2 0 2 0
5016_Book.indb 101 17-06-2021 08:32:25

102 \ Commonwealth Trade Review 2021
NUMBER OF PROJECT ANNOUNCEMENTS
AGGREGATE VALUE OF INVESTMENTS (US$ MILLION)
Cap
ital in
vest
men
t (U
S$
milli
ons
)
0
1000
3000
10000
9000
8000
7000
6000
5000
4000
2000
Num
ber o
f pro
ject
s
0
50
150
300
250
200
100
2017-19 2020
Africa Asia Caribbean& Americas
Europe Pacific
Primary Manufacturing Services
2017-19 2020 2017-19 2020 2017-19 2020 2017-19 2020
2017-19 2020
Africa Asia Caribbean& Americas
Europe Pacific
Primary Manufacturing Services
2017-19 2020 2017-19 2020 2017-19 2020 2017-19 2020
Note: Figures for 2017–2019 are based on annual averages over the three-year period.Source: Commonwealth Secretariat (calculated using fDi Markets data, from the Financial Times Ltd 2020)
F I G U R E 3 . 1 3C H A N G ES I N S ECTO RA L CO M P O S I T I O N O F I N T RA- CO M M O N W E A LT H G R E E N F I E L D F D I , B Y CO M M O N W E A LT H R EG I O N , 2 0 1 7 – 2 0 1 9 A V E RAG E V S . 2 0 2 0
5016_Book.indb 102 17-06-2021 08:32:25

Chapter 3: The Impact of COVID-19 on Commonwealth FDI \ 103
3.4 Common-wealth FDI prospects to 2025
In the short to medium term, FDI
prospects will continue to be determined
largely by the trajectory of the COVID-19
pandemic and its eventual endpoint,
with which the prospects for economic
and trade recovery globally and in the
Commonwealth are closely inter-twined.
The outlook for global FDI flows remains
challenging, with significant uncertainty.
This may lead to further delays in the
implementation of existing investment
projects and cause investors to continue
to defer investment decisions as they
exercise caution before committing
capital to new investment projects. This
will continue to act as a break on global
FDI flows in the short to medium term.
Against this backdrop, the decline in
FDI inflows to the Commonwealth is
set to persist, at least up to 2022. That
said, after the steep decline observed in
2020 (see Section 3.2.1), FDI inflows into
Commonwealth countries are expected
Primary Manufacturing Services
IndustryDecline in investment (US$ million)
IndustryDecline in investment (US$ million)
IndustryDecline in investment (US$ million)
Commonwealth total
Coal, oil and gas −1,442.0 Metals −1,457.0 Real estate −5,992.5
Food and beverages −355.8 Financial services −1,367.0
Electronic components −311.3 Hotels and tourism −734.1
Commonwealth region
Africa Coal, oil and gas −1,030.5 Chemicals −752.0 Transportation and warehousing
−357.9
Minerals −34.6 Metals −743.4 Financial services −191.1
Building materials −276.6 Hotels and tourism −183.6
Asia Coal, oil and gas −384.8 Paper, printing and packaging
−648.9 Real estate −2,276.5
Metals −285.1 Financial services −817.7
Automotive OEM −227.8 Communications −227.8
Caribbean and Americas
- - Electronic components −381.4 Renewable energy −320.4
Metals −177.3 Software and IT services
−128.4
Medical devices −100.0 Hotels and tourism −84.7
Europe Coal, oil and gas −21.9 Food and beverages −73.9 Real estate −3,431.0
Minerals −0.7 Automotive OEM −72.3 Hotels and tourism −221.9
Wood products −31.4 Financial services −206.0
Pacific Coal, oil and gas −7.4 Metals −386.9 Real estate −230.1
Automotive OEM −121.1 Hotels and tourism −189.6
Food and beverages −91.7 Communications −189.4
Note: Figures for 2017–2019 are based on annual averages over the three-year period.Source: Commonwealth Secretariat (calculated using fDi Markets data, from the Financial Times Ltd 2020)
TA B L E 3 . 6S ECTO RA L I M P L I CAT I O N S O F CO V I D - 1 9 F O R I N T RA- CO M M O N W E A LT H G R E E N F I E L D F D I , 2 0 1 7 – 2 0 1 9 A V E RAG E V S . 2 0 2 0
5016_Book.indb 103 17-06-2021 08:32:25

104 \ Commonwealth Trade Review 2021
to fall more moderately in 2021 and
2022. UNCTAD projections indicate that
these inflows will decline by 18 per cent
across the whole of 2021, followed by a
further drop of 7 per cent in 2022. This
would see the total value of FDI inflows to
the Commonwealth decline to US$136
billion in 2022, or a loss of around $220
billion compared with 2019. Thereafter,
a U-shaped recovery is expected as
global FDI flows begin to pick up.
The pace of recovery and future
investment prospects for
Commonwealth members is likely to
vary significantly by their economic size
and geography, the structure of their
economies and the composition of
their exports (see Chapter 1). Table 3.7
summarises the implications for
investment in specific industries and
sectors. Overall, greenfield investment in
industrial sectors may be constrained for
some time if investors remain hesitant
to commit capital to new productive
investments in an environment of
significant uncertainty (UNCTAD,
2021a). This has major implications
Sector COVID-19 impacts Post-COVID-19 prospects to 2025Commonwealth countries most affected/advantaged
Oil and gas – Suppressed demand
– Sharp fall in oil prices
– FDI inflows constrained
Demand boost expected as global economy rebounds
Canada, Trinidad and Tobago, Nigeria, Ghana
Other commodities – Low commodity prices in 2020:H1
– Rebound in prices for some commodities in 2020:H2
– Possible commodity supercycle on the way with rising commodity prices
– Potentially improved prospects for resource-seeking FDI
Commodity-dependent African members
Manufacturing – Acceleration of pre-COVID headwinds: re-shoring constraining efficiency-seeking FDI, shift to regional market-seeking FDI and shortening of value chains
– Investors hesitant to commit capital to new investments in industrial sectors owing to COVID-related uncertainty
– Further structural shifts likely in manufacturing value chains, focusing on de-risking
– Shortening of supply chains may benefit Commonwealth manufacturers located close to international production centres
Commonwealth Asia and Africa members engaged in GVC-intensive manufacturing and exporting (e.g. Bangladesh, Sri Lanka)
Tourism Restrictions on travel and social distancing measures severely affecting tourism activity
– Recovery contingent on policy developments (e.g. travel corridors, testing and quarantine)
– Rollout of vaccines offers hope for wider reopening of international travel
– Possibility of rapid growth and new investment owing to pent-up demand if COVID-19 induced restrictions on travel subside
Commonwealth SIDS
Information and communication technology (ICT)/digital sectors (see Chapter 2)
– Significantly less affected
– Accelerated reliance on digital technologies, leading to rising demand for ICT equipment, internet and broadband solutions, digitally deliverable services, etc.
– Demand for digital technologies and services likely to continue to grow
– Growth in knowledge-seeking FDI into digital sectors should be sustained in the longer term
Commonwealth countries with strong digital capabilities (e.g. India, Singapore, UK)
Health – Massive pressure on health care resources
– Amplified demand for medical solutions to combat COVID-19
Growth in investment likely to be sustained
All
TA B L E 3 . 7CO V I D - 1 9 I M P ACTS A N D F U T U R E I N V EST M E N T P RO S P ECTS F O R S E L ECT E D S ECTO RS
5016_Book.indb 104 17-06-2021 08:32:25

Chapter 3: The Impact of COVID-19 on Commonwealth FDI \ 105
for the Commonwealth’s developing
members that rely heavily on greenfield
FDI to provide the capital investment
necessary to develop productive
capacity for industrialisation, trade,
economic transformation and new jobs.
In the aftermath of COVID-19 there are
also likely to be further structural shifts in
production and value chains, centring on
the restructuring of GVCs to de-risk and
build resilience to future crises. This may
lead to shorter supply chains, resulting
in some re-shoring that could benefit
Commonwealth members located close
to international production centres
(East and Kaspar, 2020; UNCTAD,
2020a). This will have implications for
producers in Commonwealth Asia
and Africa engaged in GVC-intensive
manufacturing and export industries.
When the COVID-19 pandemic
eventually ends and the world begins
a transition towards normalcy, FDI
can serve as an integral component
of wider economic recovery in the
Commonwealth and help build greater
resilience to future crises, particularly in
Commonwealth developing countries.
There remains hope for a recovery in
long-term investment flows by 2022
(UNCTAD, 2020a). This, in tandem with
the other developments discussed in
the concluding section, may create
opportunities for Commonwealth
member countries to attract higher
levels of FDI. For example, the rapid
recovery in economic growth in China
is likely to create early opportunities to
further leverage Chinese infrastructure
investment in the Commonwealth
(Box 3.5) as part of broader efforts to
build back better after the pandemic.
B O X 3 . 5
C H I N A’ S G R O W I N G I N F R A S T R U C T U R E I N V E S T M E N T I N T H E C O M M O N W E A LT H
Chinese investment in the Commonwealth, especially in developing African and Asian members, has accelerated over the past two decades. Overall, Chinese FDI flows into Commonwealth countries averaged US$13.7 billion annually between 2017 and 2019.10
In African member countries, China is a major source of investment through commercial loans and FDI in transport, power and telecommunications infrastructure projects. Chinese investments have also been directed into infrastructure supporting productive capacity, including through export-oriented industrial parks and/or special economic zones in Kenya, Malawi, Mauritius, Mozambique, Nigeria, South Africa and Tanzania.
Much of China’s recent investment has been channelled through the Belt and Road Initiative (BRI). Announced in 2013, the BRI aims to promote regional integration and economic growth through enhanced connectivity generated by means of investments in infrastructure and other areas. There is widespread involvement in the BRI among Commonwealth countries in Africa, Asia, the Caribbean and the Pacific.
In Africa, several on-going or recently completed port development projects have targeted improvements in port performance and connecting infrastructure. These include BRI-linked finance and construction projects in Cameroon, Ghana, Kenya and Nigeria (EIU, 2021). In South Asia, the corridor economies of Bangladesh and Pakistan have benefited from the bulk of BRI-related investments. In the Pacific, significant BRI projects to strengthen both hard and soft infrastructure are underway in Tonga.
The Digital Silk Road (DSR), a component of the BRI launched in 2015, is a growing conduit for Chinese investment in telecommunications in Commonwealth countries. The DSR is helping develop China’s own technological independence while also positioning the country at the centre of global technology networks (Hillman, 2021). This has contributed to the intensification of USA-China competition in technology-related sectors, spurred by China’s growing digital investments globally and its expanding influence in the realm of telecommunications infrastructure and digital technologies.
China also plays a lead role in the New Development Bank (NDB) and Asian Infrastructure Investment Bank (AIIB), which have a core focus on infrastructure development. While these development banks still account for a relatively small share – estimated at 5 per cent in 2020 – of new lending disbursed by international financial institutions (Bird, 2020), they are well
5016_Book.indb 105 17-06-2021 08:32:26
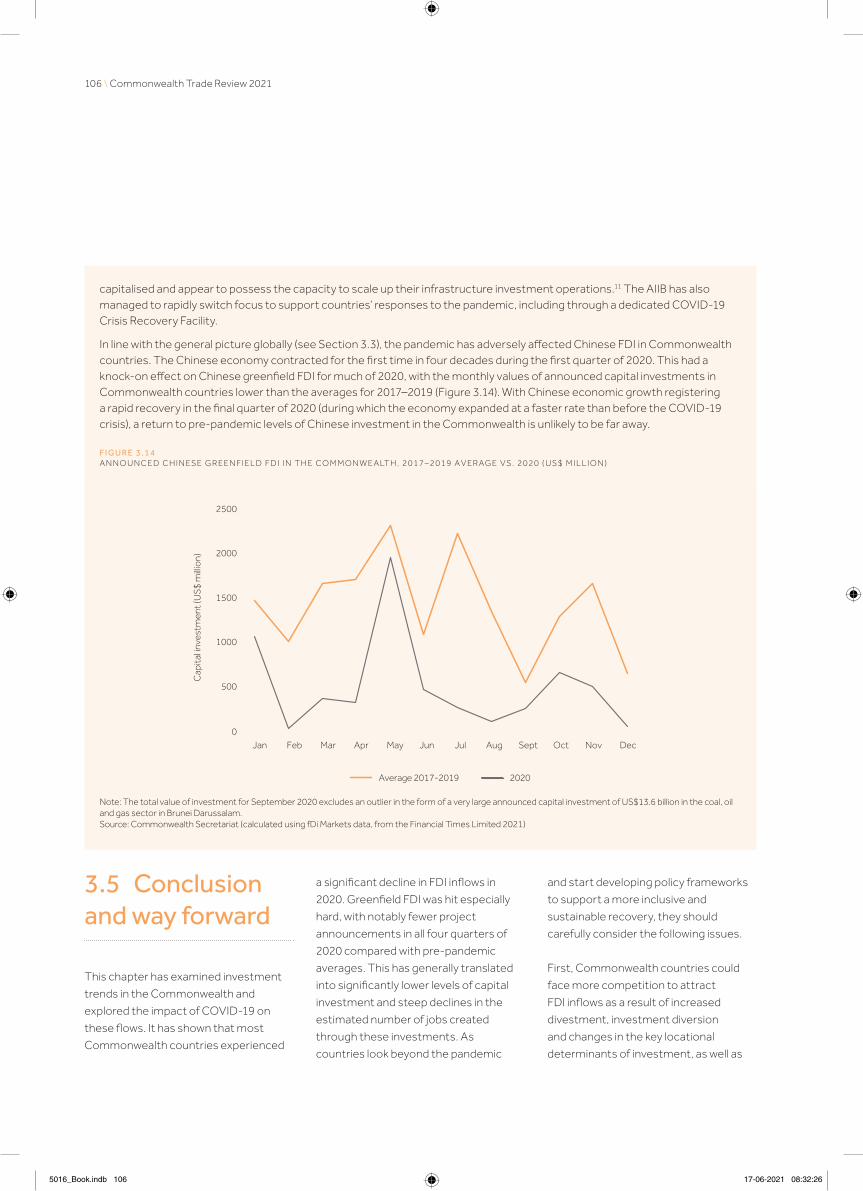
106 \ Commonwealth Trade Review 2021
3.5 Conclusion and way forward
This chapter has examined investment
trends in the Commonwealth and
explored the impact of COVID-19 on
these flows. It has shown that most
Commonwealth countries experienced
a significant decline in FDI inflows in
2020. Greenfield FDI was hit especially
hard, with notably fewer project
announcements in all four quarters of
2020 compared with pre-pandemic
averages. This has generally translated
into significantly lower levels of capital
investment and steep declines in the
estimated number of jobs created
through these investments. As
countries look beyond the pandemic
and start developing policy frameworks
to support a more inclusive and
sustainable recovery, they should
carefully consider the following issues.
First, Commonwealth countries could
face more competition to attract
FDI inflows as a result of increased
divestment, investment diversion
and changes in the key locational
determinants of investment, as well as
capitalised and appear to possess the capacity to scale up their infrastructure investment operations.11 The AIIB has also managed to rapidly switch focus to support countries’ responses to the pandemic, including through a dedicated COVID-19 Crisis Recovery Facility.
In line with the general picture globally (see Section 3.3), the pandemic has adversely affected Chinese FDI in Commonwealth countries. The Chinese economy contracted for the first time in four decades during the first quarter of 2020. This had a knock-on effect on Chinese greenfield FDI for much of 2020, with the monthly values of announced capital investments in Commonwealth countries lower than the averages for 2017–2019 (Figure 3.14). With Chinese economic growth registering a rapid recovery in the final quarter of 2020 (during which the economy expanded at a faster rate than before the COVID-19 crisis), a return to pre-pandemic levels of Chinese investment in the Commonwealth is unlikely to be far away.
Jan Feb Mar Apr May Jun Jul Aug Sept Oct Nov Dec
Cap
ital in
vest
men
t (U
S$
milli
on)
0
500
1000
1500
2000
2500
Average 2017-2019 2020
Note: The total value of investment for September 2020 excludes an outlier in the form of a very large announced capital investment of US$13.6 billion in the coal, oil and gas sector in Brunei Darussalam.Source: Commonwealth Secretariat (calculated using fDi Markets data, from the Financial Times Limited 2021)
F I G U R E 3 . 1 4A N N O U N C E D C H I N ES E G R E E N F I E L D F D I I N T H E CO M M O N W E A LT H , 2 0 1 7 – 2 0 1 9 A V E RAG E V S . 2 0 2 0 ( U S $ M I L L I O N )
5016_Book.indb 106 17-06-2021 08:32:26

Chapter 3: The Impact of COVID-19 on Commonwealth FDI \ 107
a generally shrinking pool of efficiency-
seeking investment (UNCTAD, 2020a).
However, they could also benefit from
opportunities to attract investors
looking to diversify supply bases and
increasingly prioritising market-seeking
FDI (East and Kaspar, 2020; UNCTAD,
2020a). For example, MNEs are
reportedly considering diversifying out
of China because of rising operating
costs, supply chain restructuring and
the effects of the USA-China trade
and technology conflict (see Chapter
4). Although some Commonwealth
Asian economies could possibly benefit
from this shift of light manufacturing
investment, Africa’s low costs and
attractive market also make it a
logical geographic choice, although
this is not without many challenges
(Xu at al., 2017; Altenburg, 2019).
Second, Commonwealth developing
countries and LDCs must create
incentives to mobilise domestic savings
and FDI inflows into investments in
productive capital, including new
technologies to upgrade existing
sectors or in pursuit of future diversified
opportunities, including ICT-enabled
digitally deliverable services (see
Chapter 2). FDI can be targeted to
develop exporting capacities, but this
will require trade promotion policies to
attract investment into these sectors
and generate a supply response. For
example, LDCs could take advantage of
favourable tariff preferences and rules
of origin in developed economies and
some developing countries, like China,
to attract investment in new facilities
and, where possible, export tariff-free to
these markets. It is not uncommon for
China to impose tariffs of 25–30 per cent
on imports, so this is a huge advantage.
Third, regional trade and integration
developments will continue to shape FDI
prospects for Commonwealth countries,
especially the African Continental Free
Trade Area (AfCFTA) and the Regional
Comprehensive Economic Partnership
(RCEP) in Asia-Pacific (see Chapter
4). The AfCFTA will enable greater
intra-African investment, especially
by Commonwealth African countries,
which contributed over 70 per cent of
announced intra-African greenfield FDI
from 2010 to 2020, on average, and 85
per cent in 2020.12 These countries may
also benefit from greater investment
inflows as a result of this new continental
trade deal, particularly if agreement
is reached on an AfCFTA Investment
Protocol. Negotiations on investment
provisions in the AfCFTA are seeking to
establish a framework and commitments
around investment governance to boost
intra-African investment, while also
creating a platform for African countries
to undertake investment negotiations
with third parties.13 This will support
efforts to attract market- and efficiency-
seeking FDI into African countries
(Chidede, 2020). Similarly, RCEP, which
represents one of the world’s largest
trade and investment agreements
and includes five Commonwealth
countries (Australia, Brunei Darussalam,
Malaysia, New Zealand and Singapore),
is likely to boost investment flows to
the Commonwealth’s Asia-Pacific
members. The signing of the RCEP
is a positive signal to investors of the
region’s commitment to investment
integration and liberalisation around a
rules-based regional investment regime.
Fourth, the Commonwealth
advantage in investment (outlined
in Box 3.2) means investments from
Commonwealth partners should
remain a key source of FDI inflows into
Commonwealth economies up to 2025
and beyond. Intra-Commonwealth
FDI can play a key role in supporting
economic recovery and building
greater resilience in Commonwealth
countries post-COVID-19. Moreover,
the Commonwealth has a strong
diasporic community with considerable
potential for diaspora investment,
although this has yet to be realised
(Commonwealth Secretariat, 2018b).14
Mobilising diaspora savings, including
through bonds or crowdfunding
investment platforms, can lead to
new business opportunities, connect
investors and innovators and build a
strong foundation of investment that
can potentially jumpstart FDI in these
countries (Manlan and Ojomo, 2020). In
some countries, diaspora investment
has had greater developmental
benefits than other FDI by being more
stable, creating local employment
and having more significant spill-over
effects (Riddle and Nielsen, 2011).
Finally, at the multilateral level, the
discussions in the Joint Statement
Initiative on investment facilitation by
some World Trade Organization (WTO)
members may result in outcomes that
boost FDI inflows to Commonwealth
countries. These discussions have
focused on ways to streamline
investment procedures, the role of
the WTO in investment facilitation
and possible multilateral rules in this
area.15 They are expected to serve
as a basis for formal negotiations
towards a multilateral agreement
on investment facilitation. However,
trade multilateralism remains at a
crossroads and there is widespread
recognition that the WTO needs
strengthening and reform to remain
credible and relevant for tackling
new and emerging trade and trade-
related issues beyond the pandemic,
as discussed in the next chapter.
5016_Book.indb 107 17-06-2021 08:32:26

108 \ Commonwealth Trade Review 2021
fDi Markets industry Broad sector
Coal, oil and gas Primary
Minerals Primary
Aerospace Manufacturing
Automotive components Manufacturing
Automotive OEM Manufacturing
Biotechnology Manufacturing
Building materials Manufacturing
Business machines and equipment Manufacturing
Food and beverages Manufacturing
Ceramics and glass Manufacturing
Chemicals Manufacturing
Consumer electronics Manufacturing
Consumer products Manufacturing
Electronic components Manufacturing
Engines and turbines Manufacturing
Industrial equipment Manufacturing
Medical devices Manufacturing
Metals Manufacturing
Non-automotive transport OEM Manufacturing
Paper, printing and packaging Manufacturing
Pharmaceuticals Manufacturing
Plastics Manufacturing
Rubber Manufacturing
Semiconductors Manufacturing
Space and defence Manufacturing
Textiles Manufacturing
Wood products Manufacturing
Business services Services
Communications Services
Financial services Services
Health care Services
Hotels and tourism Services
Leisure and entertainment Services
Real estate Services
Renewable energy Services
Software and IT services Services
Transportation and warehousing Services
Note: The sector concordance follows UNESCAP (2020).
Annex 3.1 Concordance for fDi Markets industries to broad sectors
5016_Ch03.indd 108 17-06-2021 12:37:58

Chapter 3: The Impact of COVID-19 on Commonwealth FDI \ 109
Endnotes
1 Global FDI inflows were US$1.5
trillion in 2019, only marginally above
their level ($1.2 trillion) immediately
after the global financial crisis in
2009, and down from $2 trillion
in 2015 (UNCTAD, 2020a).
2 A greenfield investment involves the
initiation of a new venture in which a
parent company builds its operations
in a foreign country from the ground
up (Commonwealth Secretariat,
2018a). This may involve constructing
production and processing facilities,
building new distribution hubs
and offices, or developing project
sites. Such investments can have
significant economic impacts in
Commonwealth countries – often
greater than those of other forms of
FDI – because they involve injections
of new capital supporting the
development of productive capacity
and creating new jobs in the host
economy. Greenfield investments
typically play a more important role
in FDI in emerging and developing
economies (OECD, 2020c).
3 Based on the latest available
UNCTAD data capturing
bilateral FDI inflows between 42
Commonwealth countries.
4 The dominant global investors in
the Commonwealth include several
of the world’s largest and most
powerful economies. Between 2010
and 2019, 61 per cent of greenfield
FDI inflows to the Commonwealth
from non-Commonwealth partners
originated in five countries: the
USA (27 per cent of inflows from
the rest of the world), China (12 per
cent), Japan (8 per cent), Germany
(8 per cent) and The Netherlands (6
per cent). Greenfield investments
from these countries were mostly
concentrated in a small number of
Commonwealth members, with
India, Malaysia, the UK, Australia
and Canada featuring prominently.
5 Computed as (EXP(0.244)-
1)*100=27.4%
6 A greenfield investment involves a
company building its operations in a
foreign country from the ground up.
In contrast, a brownfield investment
involves a company purchasing
or leasing an existing facility.
7 https://www.smefinanceforum.org/
data-sites/msme-finance-gap
8 See Balchin (2020) for a broader
analysis of COVID-19 impacts
on overall greenfield FDI in
the Commonwealth.
9 These estimates are drawn from fDi
Markets data tracking the number of
jobs planned to be created through
greenfield investment projects.
10 Calculations based on UNCTAD’s
bilateral investment data.
11 The AIIB’s estimated US$100 billion
capitalisation represents around
two-thirds of the capitalisation
of the Asian Development Bank
and half of that of the World
Bank (Campbell, 2021).
12 Calculated using fDi Markets
data, from the Financial
Times Limited 2021.
13 A rules-based continental
framework covering issues
such as investment facilitation,
investment protection and investor
obligations can help promote,
facilitate and protect investors
while also lowering investment
transaction costs in Africa.
14 A survey of diaspora communities
in the UK from six Commonwealth
countries – Bangladesh, Fiji, Ghana,
Jamaica, Kenya, and Nigeria –
found that over 80 per cent of
business owners and over 60 per
cent of professionals expressed an
interest in saving or investing in the
Commonwealth country with which
they had a connection. Moreover,
potential diaspora investors are
frequently entrepreneurial, with
more interested in setting up a
business than any other form
of investment (Commonwealth
Secretariat, 2018b).
15 Discussions have focused on issues
such as streamlining and speeding
up administrative procedures,
domestic co-ordination, cross-
border co-operation, provisions
for temporary entry for investment
persons and the facilitation of
movement of businesspersons
for investment purposes.
5016_Book.indb 109 17-06-2021 08:32:26

Chapter 4: Multilateral and Regional Trade Responses to the Pandemic
5016_Book.indb 110 17-06-2021 08:32:26

The Commonwealth and its members are committed to free trade in a transparent, inclusive, fair and open rules-based multilateral trading system, which takes into account the special requirements of least developed countries and small and vulnerable economies. However, COVID-19 has affected trade multilateralism in several ways. Some World Trade Organization (WTO) members have adopted unilateral measures to restrict exports, from food to medicines and vaccines, while global logistics and supply chains have been disrupted. At the same time, global trade rules can help with ensuring access to vaccines. Regional co-operation has also enabled Commonwealth countries to sustain markets, pool resources and pursue regional responses to combat the pandemic.
This chapter examines some of the trade aspects of the global response to the pandemic, focusing specifically on multilateral developments and regional initiatives. Some of the key takeaways are:
• Several Commonwealth countries have been at the forefront of global advocacy to maintain open trade and supply chains. Countries that have implemented temporary measures to facilitate trade, like digitising paper processes, should permanently adopt these ad hoc measures.
• The pandemic has highlighted the need to strengthen the multilateral trading system to support recovery and preparedness for future crises and enhance global resilience. WTO reform initiatives should consider all members’ views and voices.
• The WTO membership should strive to reconcile intellectual property rules and public health to help ensure affordable and equitable access to vaccines to help combat the pandemic and revitalise global trade.
• Regional co-operation has been critical for tackling the pandemic. Commonwealth countries can leverage regional trade agreements to build back better from the pandemic, including by developing regional value chains or developing model provisions for immediate co-operation in future crises.
• Commonwealth countries should urgently address implementation gaps in existing or new bilateral and regional trade agreements, including by adopting a whole-of-government approach and improving awareness of domestic stakeholders to benefit from the favourable preferences.
5016_Book.indb 111 17-06-2021 08:32:26
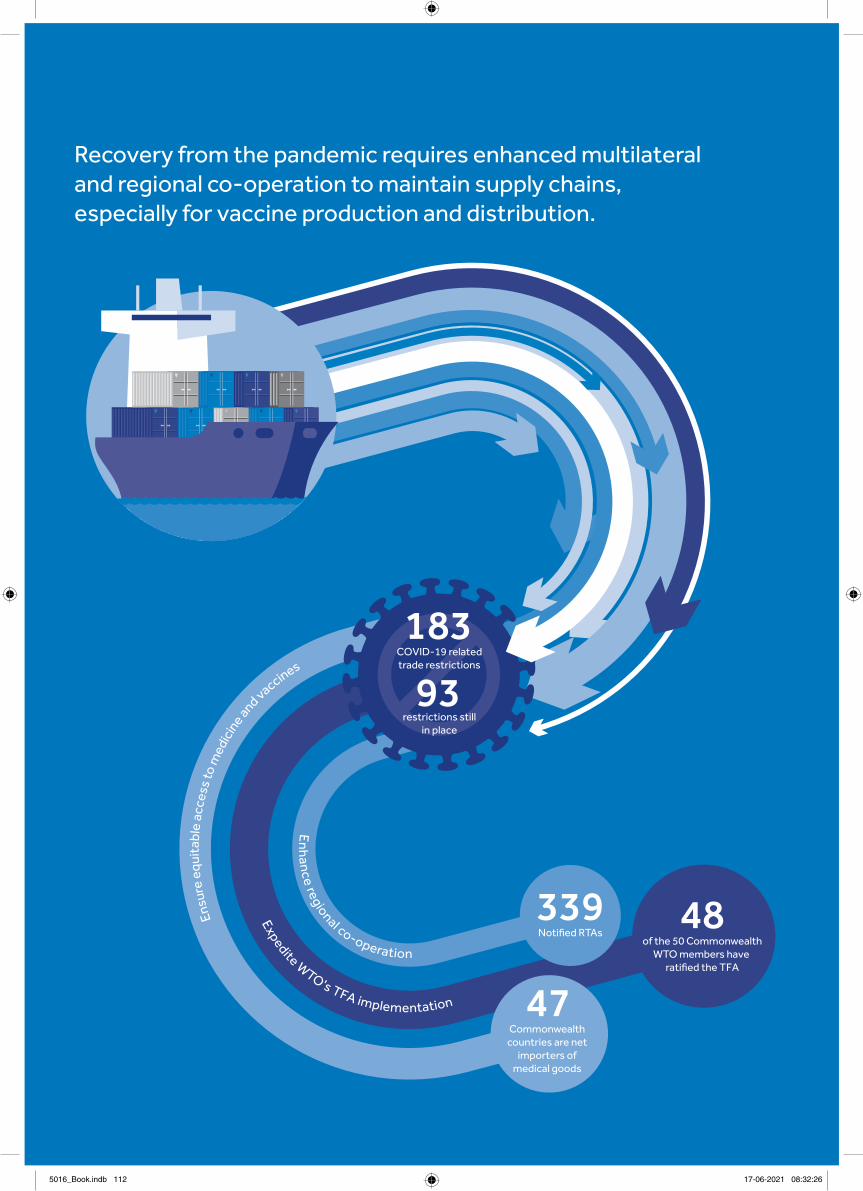
Recovery from the pandemic requires enhanced multilateral and regional co-operation to maintain supply chains, especially for vaccine production and distribution.
183
93COVID-19 relatedtrade restrictions
339Notified RTAs
47Commonwealth
countries are net importers of
medical goods
48of the 50 Commonwealth
WTO members have ratified the TFA
restrictions stillin place
En
hance regional co-operation
Ensu
re e
quit
able
acc
ess
to m
edic
ine and vaccines
Expedite WTO's TFA implementation
5016_Book.indb 112 17-06-2021 08:32:26

4.1 Introduction
The COVID-19 pandemic has significantly affected
trade, investment and development prospects for most
Commonwealth countries, as the previous chapters have
demonstrated. A sustainable recovery hinges on successfully
opening up economies, ending lockdowns and loosening
restrictions on the movement of goods and people. This
requires enhanced global and regional co-operation to
contain the pandemic, mitigate its impact on trade, livelihoods
and health, and ensure open trade and undisrupted supply
chains, especially for medical equipment and for the
equitable access to essential vaccines for all. Indeed, the
global economic cost of an unco-ordinated approach to
vaccine distribution, including not vaccinating developing
countries from the pandemic, has been placed at US$9
trillion (ICC, 2020). This is greater than the combined
gross domestic product (GDP) of Germany and Japan.
This chapter examines some of the trade aspects of the
global response to the pandemic, focusing specifically on
multilateral developments at the World Trade Organization
(WTO) and regional initiatives involving Commonwealth
countries. This provides the overarching global and
regional contexts and frameworks to situate the proposed
policy actions for trade recovery in the next chapter.
The chapter is divided into five sections. Section 4.2, which
follows, highlights some of the accomplishments of the
multilateral trading system amid emerging challenges,
including greater multipolarity and the changing composition
of trade and supply chains, and the role of the Commonwealth
in supporting trade multilateralism. Section 4.3 provides
an overview of some ways COVID-19 has affected the
multilateral trading system, including the importance of
vaccine multilateralism to ensure affordable and equitable
access to these lifesaving tools. Section 4.4 discusses
recent regional trade and integration initiatives amid the
pandemic and the scope for regional co-operation to
support recovery. Section 4.5 concludes the chapter.
5016_Book.indb 113 17-06-2021 08:32:26

114 \ Commonwealth Trade Review 2021
4.2 The Commonwealth and trade multilateralism
Trade is widely recognised as an
indispensable tool for economic
growth and sustainable development.
Creating better trade opportunities
has helped lift millions of people from
poverty to prosperity in many regions
and countries around the world (World
Bank, 2018). The importance of trade-
driven development is demonstrated by
the growth in the WTO’s membership
over the past 25 years to 164 member
states today, representing over 96
per cent of world trade and GDP.1
This near-universality signifies the
importance ascribed to stable and
predictable rules-based trade by
countries around the world, including
the 50 Commonwealth members of
the WTO, with The Bahamas in the
process of acceding to the global body.
Global co-operation in the WTO and its
predecessor, the General Agreement on
Tariffs and Trade (GATT), have helped
reduce global tariffs to historically low
levels. Moreover, the WTO’s binding
rules on trade have largely prevailed
in times of crisis and contributed to
increased global trade and greater
prosperity: the real volume of world
trade has grown 2.7 times over since
its formation in 1995 (WTO, 2020c).
The amendment of the Agreement on
Trade-Related Aspects of Intellectual
Property Rights (TRIPS) provides
developing countries with legal policy
space to access affordable medicine
under WTO rules, and this has gained
greater attention in response to the
COVID-19 pandemic. The entry into
force in 2017 of the Trade Facilitation
Agreement (TFA), together with its
innovative approach to capacity-
building and implementation support,
have helped many developing countries
streamline border procedures to
expedite the flow of goods, which
could increase global trade by up to
US$1 trillion per year (WTO, 2015). The
broader WTO-led Aid for Trade initiative
has assisted developing countries to
address their trade-related capacity
constraints. Notably, the WTO has
handled 600 trade disputes since its
formation, underscoring the cardinal
importance of the dispute settlement
function for the rules-based multilateral
trading system. In another historic
milestone for the organisation, in 2021,
the first woman and representative of
the African continent was appointed as
the WTO’s seventh Director-General.2
Despite these accomplishments, trade
multilateralism is today at a crossroads
at a time when certainty and stability
in world trade are most needed, to
tackle the COVID-19 pandemic and
support recovery. The growth in WTO
membership has been accompanied
by greater diversity of interests and
expectations for the role of the body
in governing world trade. This has
resulted in many challenges for the
organisation and its membership,
notably an incomplete Doha Round of
negotiations3 and the paralysis of the
Dispute Settlement Understanding once
the Appellate Body ceased functioning
in December 2019 (Remy, 2020). The
lack of progress in multilateral rule-
making has contributed to an impetus
for deeper economic integration
through bilateral or regional trade
deals. Many of the new and emerging
issues and challenges for this century’s
global trading system were not on the
horizon when the previous Uruguay
Round was completed in 1994, be they
health pandemics, climate change
or the rapid digitalisation of trade,
economies and work. In recent times,
some WTO members have therefore
launched initiatives from e-commerce
to trade and health to address these
shortcomings (see Chapter 5).
The changing nature and composition
of trade and supply chains may
also affect the prospects for trade
multilateralism and have implications
for Commonwealth countries. The
reorganisation of global trade towards
complex supply chains that began
in earnest in the 1990s has already
slowed or stopped over the past decade
(UNCTAD, 2020a). Combined with
the effects of near-shoring initiatives
by governments and multinational
enterprises, in future cross-border trade
of intermediate parts and components
of finished goods, especially over long
distances, will become somewhat less
important than today (Pigman, 2020).
The overall mix of global trade will
continue to shift towards digital goods
and services, although there is the risk
of a widening digital divide between and
within countries, with many developing
countries and least developed
countries (LDCs) still largely offline, as
was discussed in Chapter 2. Modes of
manufacturing in many countries will
accelerate their transition towards 3D
printing and other frontier technologies
(UNCTAD, 2021b), which can take place
close to the point of goods’ consumption
or their assembly into higher value-
added goods. On balance, increased use
of 3D printing is likely to reduce the need
to import intermediate and final goods
from low-wage countries (ING, 2017). In
5016_Book.indb 114 17-06-2021 08:32:26

Chapter 4: Multilateral and Regional Trade Responses to the Pandemic \ 115
such an evolving environment, traditional
sources of significant comparative
advantage, such as low labour costs
and concentrations of skills, are likely to
decline in significance, at least in relative
terms. Costs of transport will rise,
particularly for heavy and bulky goods, as
many governments and firms worldwide
accelerate their efforts to achieve a
global economy with net zero carbon
emissions by 2050 (Pigman, 2020).
These transformations could leave
some governments potentially less
dependent on open trade rules, at
least for physical goods, and more
inclined to adopt unilateral re-shoring
policies. In this context, and following
the disruptions caused by the COVID-19
pandemic, the WTO will need to
adapt to become more effective at
promoting and facilitating trade in
data, knowledge and information, so
that WTO membership, with all its
obligations, remains indispensable
to every country (see Chapter 5).
A loss of confidence in multilateralism
more broadly has led many WTO
members to pursue unilateral
measures, including in response to
the pandemic, as discussed in the
next section. However, the primary
challenge for the multilateral trading
system going forward is managing the
WTO’s rulebook for global trade in the
face of the increasing geopolitical and
geo-economic rivalry between the USA
and China. The unresolved USA-China
trade and technology conflict caused
a significant contraction in global trade
in 2019, including substantial effects
on Commonwealth countries’ trade
flows (Box 4.1), and could hamper
economic recovery post-COVID-19.
Against this backdrop, Commonwealth
Heads of Government have regularly
declared their collective commitment
to free trade in a transparent, inclusive,
fair and open rules-based multilateral
trading system, which takes into account
the special requirements of LDCs
and small and vulnerable economies.4
They have also raised concerns about
the risks of protectionism to the
global economy and underlined the
importance of resisting all forms of
this. Prior to the pandemic, in October
2019, Commonwealth Trade Ministers
met and adopted a Commonwealth
Statement on the Multilateral Trading
System. For the first time, a caucus of all
Commonwealth members of the WTO
was convened in Geneva, chaired by New
Zealand, to provide a forum for Geneva-
based representatives to undertake
an informal exchange of views.5
For most Commonwealth members,
especially small states, LDCs and
sub-Saharan African (SSA) countries,
the multilateral trading system offers
the best hope for creating a more level
playing field in world trade and providing
a global platform to articulate and
advance their trade and development
interests, especially in times of global
crisis like under COVID-19 as they battle
the pathogen and protectionism. The
next section examines how COVID-19
has affected trade multilateralism
and the implications for these
capacity-constrained countries.
B O X 4 .1
I M P L I C AT I O N S O F T H E U S A - C H I N A T R A D E C O N F L I C T
FO R C O M M O N W E A LT H C O U N T R I E S
In a study for the Commonwealth Secretariat, Ambaw and Draper (2020) use empirical and regression analysis techniques to assess the impact of the USA-China trade conflict on Commonwealth members’ exports and examine the implications for their supply chain trade.
It is found that the USA-China conflict led to trade diversion in several Commonwealth countries. In normal times, US imports from China and Commonwealth members are positively correlated. Following the tariff hikes imposed by the US government, the growth of Commonwealth countries’ exports to the USA declined sharply, reversing the upward trajectory witnessed before the onset of the tariff increases. The various rounds of tariff increases affected both tariffed and non-tariffed products alike (Figure 4.1). However, some Commonwealth Asian countries did marginally expand their exports to the USA. Alongside the drop in the Commonwealth’s exports to the USA, the imports of Chinese products by Commonwealth countries increased, reflecting diversion of Chinese trade from the USA towards Commonwealth members.
The trade conflict also disrupted Commonwealth countries’ supply chain trade. There was modest growth in exports of parts and components from the Asian region, reflecting the deeper integration of these economies in global value chains (GVCs). While the direct trade effect on supply chain trade was negligible for the other Commonwealth regions, the indirect spill-over effects on economic growth and investment flows could be substantial.
5016_Book.indb 115 17-06-2021 08:32:27

116 \ Commonwealth Trade Review 2021
4.3 COVID-19 and trade multilateralism
The outbreak of the COVID-19 pandemic
has affected trade multilateralism
in multiple ways. Four areas are
highlighted and discussed below: the
disruptions to in-person meetings
and negotiations at the WTO (4.3.1);
the unilateral use of trade measures
to manage the health and economic
consequences of the pandemic (4.3.2);
the disruptions to global logistics and
supply chains, including the transit of
medicines, food and other essential
goods (4.3.3); and the use of trade
rules to support affordable and
equitable access to vaccines (4.3.4).
4.3.1 The shift to virtual and hybrid negotiations
The worsening of the pandemic in
March 2020 triggered a sudden shift
from in-person to virtual and hybrid
forms of diplomatic communication
and negotiation, including at the WTO
(Pigman, 2021). The WTO’s 12th
Ministerial Conference (MC12) was
postponed on two occasions, while
lockdown measures upended the WTO’s
regular committee work and negotiations.
This shift to online has created both
technical challenges and innovative
opportunities for developing countries’
participation in the WTO (Box 4.2).
The gains already reaped by beneficiaries
of virtual and hybrid meetings suggest
that new digital modes of operation are
not likely to disappear after the pandemic.
Greater virtual participation by officials
in capitals will stay popular in developed
and developing countries alike. Enhancing
transparency around the WTO in capitals
has increased its perceived legitimacy in an
age of public diplomacy. Notwithstanding
issues relating to digital connectivity,
virtual meetings and negotiations also
permit more participation by small states,
LDCs and SSA countries on an on-going
basis without increasing Geneva capacity
and costs. Whether major WTO objectives
are achieved going forward depends,
in part, on how well current provisional
arrangements for virtual and hybrid
meetings and negotiations continue
to operate ahead of WTO MC12.
4.3.2 Trade measures in response to COVID-19
Since the start of the pandemic, many
WTO members, including the G20, have
unilaterally used a range of trade policy
F I G U R E 4 . 1A V E RAG E CO M M O N W E A LT H E X P O RT G RO W T H TO T H E U SA F O R TA R I F F E D A N D N O N -TA R I F F E D P RO D U CTS
Ave
rage
exp
ort
gro
wth
(rel
ativ
e to
the
2015
Q2-
18Q
2 av
erag
e)
-0.15
-0.1
-0.05
0
0.05
0.1
0.15
0.2
2018 Q3 2018 Q4 2019 Q1 2019 Q2 2019 Q3 2019 Q4 2020 Q1
Non-tariffed products Tariffed products
Per
cent
age
chan
ge v
s th
e av
erag
e o
f 201
5Q2-
2018
Q2
-0.15
-0.1
-0.05
0
0.05
0.1
0.15
0.2
0.25
2018 Q3 2018 Q4 2019 Q1 2019 Q2 2019 Q3 2019 Q4 2020 Q1
Non-tariffed products Phase one tariffed products
Phase two tariffed products Phase three tariffed products
N o te : Th e c h a r t s i n d i c a te e x p o r t g row t h re l a t i v e to t h e a v e ra g e o v e r t h e t h re e -ye a r p e r i o d f ro m Q 2 2 0 1 5 to Q 2 2 0 1 8 .So u rce : A m b aw a n d D ra p e r ( 2 0 2 0 )
5016_Book.indb 116 17-06-2021 08:32:27

Chapter 4: Multilateral and Regional Trade Responses to the Pandemic \ 117
tools to manage the economic, health
and social consequences of COVID-19
(Box 4.3). Some of these measures
aimed to ease imports by reducing or
exempting tariffs temporarily; others
controlled or restricted exports in
the face of global shortages. In both
cases, the affected goods included
medical equipment (e.g. ventilators),
personal protective equipment (e.g.
surgical masks and gloves) and some
food products (Vickers et al., 2020).
B O X 4 . 2
T H E W TO G O E S V I R T U A L : O P P O R T U N I T I E S A N D C H A L L E N G E S FO R D E V E LO P I N G C O U N T R I E S
In a study for the Commonwealth Secretariat, Pigman (2021) conducted online interviews with several ambassadors and officials of Commonwealth countries in Geneva to better understand their experience with the shift to virtual and hybrid meetings and negotiating sessions at the WTO. Some of the issues and challenges that have arisen are:
• Technical barriers to online negotiating, including lack of digital connectivity in developing country capitals, online privacy and security concerns, communication logistics problems (e.g. time zones) and gaps in digital knowledge and skills;
• Negotiating format and design issues, including loss of the ability to communicate in person, increased participation in meetings by capital-based officials, the practicalities of organising virtual and hybrid meetings and training for virtual and hybrid meeting and negotiating; and
• Geopolitical and power issues.
Pigman provides four clusters of recommendations to maximise the opportunities and minimise the disadvantages that the shift has created, particularly for small states, LDCs and SSA countries:
1. Optimise the balance between in-person and virtual communication and negotiation after the pandemic;
2. Improve virtual and hybrid meeting practicalities (e.g. through technical upgrades to meeting rooms and software, or greater
use of an asynchronous, online process for drafting and editing texts);
3. Survey and prepare to adopt new technologies to facilitate online/hybrid negotiating (e.g. gesture recognition software that
may help decode body language cues, more sophisticated integrated chat apps or telepresence technology); and
4. Upgrade and expand training and capacity-building.
B O X 4 . 3
T R A D E R E S P O N S E S TO T H E PA N D E M I C
From the outbreak of the pandemic to the most recent period of reporting at mid-October 2020, G20 economies introduced 133 COVID-19 trade and trade-related measures, 37 per cent of which were trade-restrictive – mainly export controls covering trade worth US$111 billion. Although these measures restricted trade in the early stages of the pandemic, about 27 per cent had been rescinded by mid-October 2020. These trade-restrictive measures were on top of the existing stock of import-restrictive measures introduced since 2009 and still in force, affecting an estimated 10.4 per cent of G20 imports (WTO, 2020d).
Overall, many WTO members, including some Commonwealth countries, introduced 183 COVID-related trade-restricting measures. These measures span different time durations. By 19 March 2021, 93 trade-restricting measures with no specified end date were still in place, raising questions about their compatibility with WTO rules.6 The product coverage of these measures varies considerably, and mainly involves medical supplies and some foodstuff. Some of these measures were not immediately notified to the WTO as required by WTO rules to ensure transparency, making it difficult for other countries to make purchasing adjustments. In addition, export restrictions, although applied temporarily, have a long-lasting price effect on importing countries until former trade relations are restored (Deuss, 2017). Furthermore, governments may find it challenging to withdraw support previously given to sectors (OECD, 2020d).
5016_Book.indb 117 17-06-2021 08:32:27

118 \ Commonwealth Trade Review 2021
Besides affecting trade, these measures
also had an indirect impact on some
of the Sustainable Development
Goals (SDGs), and this could hinder
the achievement of these by the most
vulnerable countries (Lee and Prabhakar,
2021). For example, non-tariff measures
imposed in response to the pandemic,
such as export licence requirements on
food, had a direct and indirect bearing
on SDG 2 related to hunger and food
security by adversely affecting net
food-importing countries, which include
34 Commonwealth countries. Similarly,
the certification requirements for
medicines for technical barrier to trade
(TBT) reasons affected SDG 8, which
concerns economic growth. Businesses
involved in the export of medicines have
had to absorb this increased compliance
cost, which has reduced their earnings.
However, this has positively affected
the health and well-being of citizens
(SDG 3) by ensuring medicines are
safe and of the highest quality (ibid.).
By July 2020, all temporary trade
restricting measures used by
Commonwealth countries had lapsed.
However, there is another risk – that
the limited production of vaccines and
complex supply chains may lead some
countries to impose export restrictions
or stockpile to ensure they retain
adequate supplies for reasons of public
policy. This could have major implications
for the ability of all Commonwealth
countries – developed, developing and
least-developed – to secure doses
in sufficient quantity. Responding to
COVID-19 and building back better
necessitates lifting trade-restricting
measures and enabling supply chains,
which can help revamp production
and the movement of goods across
borders. This requires international
co-operation to ensure the maintenance
of open trade, as discussed next.
4.3.3 Facilitating trade and enabling supply chains
The COVID-19 pandemic has
underscored the importance of well-
functioning trade facilitation systems.
Disruptions to transport and logistics
services, as well as additional checks
and requirements owing to quarantine
and sanitary measures, have affected
cross-border trade, including the
transit of medicines, food and other
essential goods. In response to the
pandemic, many Commonwealth
countries temporarily implemented
a range of digital trade-facilitating
measures to streamline processes for
clearing goods through borders (Box
4.4). Significant gains can be made,
and sustained, if these temporary
measures are made permanent
post-COVID (see Chapter 5).
Several Commonwealth countries
have also been strong advocates
for maintaining open trade and
functioning supply chains. In April 2020,
New Zealand and Singapore issued
a Declaration on Trade in Essential
Goods for Combating the COVID-19
Pandemic. They committed to maintain
open trade and supply chains by
removing tariffs and export restrictions
on several medical and agricultural
and food products and to refrain
B O X 4 . 4
E X A M P L E S O F C O M M O N W E A LT H T R A D E FA C I L I TAT I O N M E A S U R E S I N R E S P O N S E TO C O V I D -19
• The Commonwealth Secretariat joined other multilateral organisations to develop an online COVID-19 Trade Facilitation Repository.7 This platform consolidates information on trade facilitation measures and provides institutional guidance material on responses to the pandemic.
• The UK government introduced temporary changes to its customs border processes, including transit and export procedures, which allowed traders, agents and Border Force staff to exchange documents electronically by email, fax and digital photographs (HM Revenues & Customs, 2020).
• The South African government adopted measures to permit the submission of electronic veterinary health certificates for importers of live animals and animal products in lieu of hard copies, subject to further verification of the documents directly with the veterinarian authorities of the exporting countries (WTO, 2020i).
• In the Asia-Pacific region, several trade facilitation measures were introduced in areas such as transparency and institutional co-ordination, simplification of customs procedures and import easing, digital trade, and transport and transit (UNESCAP, 2021).
• Grenada, St Vincent and the Grenadines, and Trinidad and Tobago expedited the introduction of ePhyto certificates to avoid delays and disruptions in the movement of fresh produce between them (Government of Trinidad and Tobago, 2020).
5016_Book.indb 118 17-06-2021 08:32:27

Chapter 4: Multilateral and Regional Trade Responses to the Pandemic \ 119
from imposing export restrictions.
Other countries were invited to join
this initiative (WTO, 2020e). At the
WTO, a joint Ministerial Statement
was issued by 47 countries, including
15 Commonwealth members,8 which,
among other things, stressed the
need for the international community
to maintain supply chain connectivity
and avoid adopting unjustified trade
restrictions on products in response
to the pandemic (WTO, 2020f).
In May 2020, Australia, Canada, Malawi,
Malaysia, New Zealand, Singapore
and the UK jointly issued a statement
with other WTO members stating
the importance of adopting trade
measures that did not adversely
affect trade in agriculture and agri-
food products (WTO, 2020g). They
furthermore encouraged WTO
members to implement temporary
trade facilitation measures, including
digital trade-facilitating interventions
such as allowing scanned or electronic
copies of certificates of origin, to
facilitate trade in agriculture and
food products (see Chapter 5). The
Ottawa Group, which includes five
Commonwealth countries – Australia,
Canada, Kenya, New Zealand and
Singapore - took the lead to rescind any
emergency measures, including trade
restrictions, introduced in response
to the pandemic (WTO, 2020h).
Commonwealth developing countries
and LDCs could consider using these
pandemic responses – namely,
temporary trade-facilitating measures
and global advocacy for enabling
trade – as the basis for a proactive
policy agenda to permanently adopt
these ad hoc measures. This could
include fast-tracking any relevant
provisions of the WTO’s TFA and
using the TFA Facility and capacity
support to do so. So far, 48 of the 50
Commonwealth WTO members have
ratified the TFA, demonstrating their
commitment to domestic reforms to
facilitate trade. However, the degree
and speed of implementing the TFA
by developing countries is uneven,
with Singapore being the only member
to fully implement commitments
(Figure 4.2). As highlighted in Chapter
5, Singapore has consistently been
the world-class performer among
Commonwealth members when it
comes to logistics performance and
offers valuable experiences and best
practices in trade facilitation, especially
paperless and digitalised trade, for
fellow Commonwealth members.
Seventeen Commonwealth countries
are implementing more than 50 per cent
of the Category A commitments, while
only two countries are implementing
more than 50 percent of the Category
B commitments (i.e. those that require
a transition period).9 The low rate
of implementation of Category C
commitments is partly explained by
a transition period and conditioned
upon receipt of technical assistance, as
stipulated in TFA Article 14. Only two
Commonwealth LDCs, Bangladesh and
Rwanda, had on-going projects under
Category C by the end of March 2021.
Through the TFA Facility, developing
countries and LDCs can access the
technical assistance and capacity-
building needed to implement the
Agreement, although several countries
have raised concerns about increasing
difficulties securing the required
support (WTO, 2019). Since many
Commonwealth African, Caribbean
and Pacific countries are already
engaged in trade facilitation initiatives
at the bilateral and regional levels, in
many cases the implementation of
these regional deals will help anchor
and achieve the WTO’s TFA.
4.3.4 Ensuring affordable and equitable access to vaccines
Only a few Commonwealth countries
have the capacity to manufacture
vaccines, while 47 of the 54
Commonwealth members are net
importers of COVID-related medical
goods10 (Vickers et al., 2020). The WTO
TRIPS Agreement, and specifically the
Doha Declaration on TRIPS and Public
Health (Box 4.5), which was noted earlier
in the chapter as one of the WTO’s
achievements, provides a possible
multilateral route for international
co-operation in the development and
distribution of affordable COVID-19
vaccines. Within academic and policy
debates, there are innovative proposals,
such as for a COVID-19 vaccine trade
and investment agreement and fund,
although this would require the leadership
of vaccine-manufacturing countries,
notably the USA (Bown and Bollyky, 2021).
To draw on the WTO rules, several
Commonwealth countries, led by India
and South Africa, with growing support
from other WTO members, have
requested at the WTO a general waiver
to TRIPS for drugs, vaccines, diagnostics
and other technologies related to
COVID-19 (WTO, 2020j). The submission
proposed a suspension of rights related to
copyrights, industrial designs, patents and
undisclosed information (trade secrets)
for the duration of the pandemic (i.e. “until
the majority of the world’s population has
developed immunity”). More recently,
the USA announced support for a waiver
of intellectual property protection on
COVID-19 vaccines to help end the
pandemic. However, some countries
still argue that the Doha Declaration
on TRIPS and Public Health already
provides sufficient flexibilities to strike
the right balance between safeguarding
intellectual property holders’ rights
and public health considerations.11
5016_Book.indb 119 17-06-2021 08:32:27

120 \ Commonwealth Trade Review 2021
F I G U R E 4 . 2T F A I M P L E M E N TAT I O N B Y CO M M O N W E A LT H D E V E LO P I N G CO U N T R I ES AS O F 1 9 M A RC H 2 0 2 1
Current rate of implemetation (%)
25908070605040302050
Botswana
Cameroon
Eswatini
The Gambia
Ghana
Kenya
Lesotho
Malawi
Mauritius
Mozambique
Namibia
Nigeria
Rwanda
Seychelles
Sierra Leone
South Africa
Tanzania
Uganda
Zambia
Bangladesh
Brunei Darussalam
Fiji
India
Malaysia
Maldives
Pakistan
Papua New Guinea
Samoa
Singapore
Solomon Islands
Sri Lanka
Tonga
Vanuatu
Antigua and Barbuda
Barbados
Belize
Dominica
Grenada
Guyana
Jamaica
St Kitts and Nevis
Saint Lucia
St Vincent and the Grenadines
Trinidad and Tobago
Current rate Cat. A Cat. B Cat.C
Car
ibbe
an S
IDS
Asi
a an
d P
acifi
c S
IDS
Afr
ica
So u rce : Co m m o nwe a l t h Se c re t a r i a t ( c a l c u l a te d u s i n g W TO T F A d a t a )
5016_Book.indb 120 17-06-2021 08:32:27
Chapter 4: Multilateral and Regional Trade Responses to the Pandemic \ 121
If granted, the waiver would enable
capable WTO members to produce,
develop and export generic vaccines to
meet national and global demand. This
will contribute to reducing disparities in
vaccine rollouts and help in eliminating
the virus before the mutating variants –
some of which are more transmittable,
deadly and even vaccine-resistant
– become widespread. The granting
of a waiver could also set a healthy
precedent to combat such future global
emergencies and human biosecurity
challenges, and thus increase confidence
in the multilateral trading system.
4.4 The Common wealth and regional co-operation in times of crisis
Regional trade agreements (RTAs)
continue to flourish, both in response
to limited progress at the multilateral
level and based on aspirations to deepen
trade and investment relations – and, in
some cases, expand digital economies
(see Chapter 2) – between regional
neighbours or significant global partners.
By February 2021, there were 339
RTAs notified to the WTO and there
are on-going negotiations for new
agreements.12 This section examines
the participation of Commonwealth
countries in RTAs and the continuing
importance of regional co-operation
in times of crisis like COVID-19. It first
highlights some of the recent positive
RTA developments since 2018 (4.4.1).
It then demonstrates how regional
co-operation has been helpful in
addressing COVID-19 (4.4.2) but argues
that post-COVID recovery offers an
even more valuable role for RTAs (4.4.3).
4.4.1 Regional developments in trade
In recent years, several RTAs involving
Commonwealth countries have been
completed or have entered into force
(see Annex 4.1). They include the African
Continental Free Trade Area (AfCFTA), the
Pacific Agreement on Closer Economic
Relations (PACER)-Plus, the Regional
Comprehensive Economic Partnership
(RCEP) covering the Asia-Pacific region
and the UK’s raft of trade agreements
with Commonwealth countries to ensure
trade continuity and enhance trading
opportunities post-Brexit, which are
discussed in greater detail in Chapter 5.
Since RTAs seek to deepen economic
relations, most are designed to go
beyond the WTO in depth and coverage
of policy areas, such as e-commerce,
investment, competition and digital
trade policies, while others span policy
areas such as labour standards and
the environment (WTO, 2011). New
agreements are also taking shape, such
as the Digital Economy Partnership
Agreement involving New Zealand and
Singapore, which some regard as a
model for next generation agreements
in this area (Box 5.6 in Chapter 5).
Commonwealth African members
are also leading the way in developing
reciprocal trade with the world’s two
largest economies: China signed its
first free trade agreement (FTA) with
an African country, Mauritius, in 2019,
while Kenya could be the first SSA
country to successfully negotiate an
FTA with the USA after negotiations
B O X 4 . 5
D O H A D EC L A R AT I O N O N T R I P S A N D P U B L I C H E A LT H
The 2001 Doha Declaration on TRIPS and Public Health clarified specific flexibilities in the TRIPS Agreement for practical policy reasons aimed at protecting public health. It confirms the right of WTO members to use the flexibilities in the TRIPS Agreement for this purpose, including to grant compulsory licences and to determine the grounds on which such licences may be granted (WTO, 2001). Article 31bis of TRIPS, which came into force in January 2017, provides a mechanism to allow low-cost generic medicines, as well as drugs (and their active ingredients), vaccines, diagnostic tests and other supporting devices, to be produced and exported under a compulsory licence exclusively to serve the needs of those countries that cannot manufacture those products themselves.
However, most developing countries continue to face constraints and are unable to take full advantage of flexibilities such as compulsory licensing. The constraints include political and economic pressure from some industrialised countries, the complexity of implementing the licences in practice, inadequate institutional capacity and a lack of co-ordination between patent offices, government ministries and regulatory authorities (WTO et al., 2020). For example, there has been only a single example of the use of the special compulsory licensing system so far (under the waiver) and the slow pace of achieving a satisfactory result has been strongly criticised. Furthermore, finding countries with the required scale of approved facilities and capacity to manufacture and export medicines on a global scale, let alone for their own population, poses a huge challenge.
5016_Book.indb 121 17-06-2021 08:32:27

122 \ Commonwealth Trade Review 2021
with the Southern African Customs
Union (SACU) ended indefinitely.13 In
addition, there are notable inter-regional
developments. In December 2020,
Commonwealth countries belonging to
the Organisation of African, Caribbean
and Pacific States (OACPS)14 and the
EU, including Cyprus and Malta as
the two Commonwealth EU member
states, announced a successor deal to
the Cotonou Partnership Agreement,
which expired the same year.
Most intra-Commonwealth trade takes
place regionally, as discussed in Chapter
1, and this is enabled by multiple RTAs
that are found to have a more significant
impact on countries’ exports than
WTO membership, although the latter
is also important (Commonwealth
Secretariat, 2018a). Indeed, trade
between Commonwealth countries is
more than three times higher when they
belong to an existing trade agreement.15
Even with many new agreements being
notified to the WTO, Commonwealth
countries have no shortage of RTAs to
grow their trade beyond the pandemic.
For example, Africa has the most RTAs
in the world, with some countries
simultaneously belonging to two or
three such arrangements (Vickers,
2017), while the growth of RTAs in
Asia-Pacific has also created a complex
situation with numerous overlapping
agreements. Membership of multiple
RTAs create a “spaghetti bowl” effect of
B O X 4 . 6
T H E A FC F TA : A G A M E C H A N G E R FO R A F R I C A’ S C O N T I N E N TA L A N D G LO B A L T R A D E
The AfCFTA brings together 54 of the 55 African Union (AU) member states to create a single market for goods and services, with free movement of businesspersons and investments. Following a delay caused by COVID-19, trading started on 1 January 2021, and Commonwealth countries, including Ghana, Kenya and South Africa, are among the first to trade on the basis of the new preferences. The AfCFTA creates considerable opportunities for greater trade expansion in Africa, especially in food products, basic manufactures and services. Most importantly, the AfCFTA is expected to benefit small and medium enterprises (SMEs), which are responsible for more than 80 per cent of Africa’s employment and 50 per cent of its GDP.
However, many African countries have historically found it easier to export outside the continent. In 2018, intra-Africa trade averaged 15 per cent, which is much lower than intra-regional trade in Asia (60 per cent) and Europe (80 per cent). The 19 Commonwealth SSA countries are significant traders, contributing almost two-thirds of intra-African trade (Figure 4.3). They are set to benefit significantly from the agreement, while LDCs have longer implementation periods and greater carveouts for sensitive products.16
Trade liberalisation under the AfCFTA has the potential to boost intra-Africa trade to over 25 per cent in the next decade. However, tariffs are not the biggest hindrance to intra-African trade and improvements in trade facilitation and logistics, and the elimination of other non-tariff barriers is likely to be of even greater importance in boosting trade further. It is also necessary to focus on building productive capacity, including regional value chains, and investing in infrastructure to connect, power and digitalise the world’s second-largest continent. Yet, according to the AU Commission, the continent has an estimated annual infrastructure financing gap of US$60–90 billion. This creates a major hurdle for building the single market.
Val
ues
in U
S$
billio
n
% S
hare
0
20
40
80
120
60
100
20
25
30
35
40
45
50
55
60
65
70
2010 2011 2012 2013 2014 2015 2016 2017 2018 2019
Intra-African exports Share of CW Africa
N o te : Th e l e f t v e r t i c a l a x i s co n t a i n s v a l u e s o f e x p o r t s w h i l e t h e r i g h t v e r t i c a l a x i s co n t a i n s t h e s h a re o f 1 9 Co m m o nwe a l t h co u n t r i e s i n i n t ra -A f r i c a t ra d e o f g o o d s a n d s e r v i ce s .So u rce : Co m m o nwe a l t h Se c re t a r i a t ( c a l c u l a te d u s i n g U N CTA D s t a t a n d O EC D -W TO B a T I S d a t a s e t s )
F I G U R E 4 . 3S H A R E O F CO M M O N W E A LT H A F R I CA N M E M B E RS I N I N T RA-A F R I CA T RA D E , 2 0 1 0 - 2 0 1 9
5016_Book.indb 122 17-06-2021 08:32:28
Chapter 4: Multilateral and Regional Trade Responses to the Pandemic \ 123
overlapping trade rules and regulations,
which may be confusing and costly for
business (Baldwin, 2006). This is notably
the case when businesses, especially
micro, small and medium enterprises
(MSMEs), must comply with different
rules of origin (RoO) to benefit from a
tariff preference. The implementation
of mega-regionals like AfCFTA and
RCEP could potentially rationalise some
of these RTAs, harmonise some rules
and standards and enable countries to
better participate in regional or global
production networks, especially once
trade recovers from the pandemic.
AfCFTA and RCEP are the world’s
largest trade agreements when
measured, respectively, by number
of members or economic size (Box
4.6 and 4.7). Once fully implemented,
these agreements, together with other
mega-regionals like the Comprehensive
and Progressive Agreement for
Trans-Pacific Partnership (CPTPP), will
significantly reshape the global trading
landscape. Their implementation could
provide an impetus for global growth
and spur trade expansion elsewhere,
also benefiting non-members. There
will, however, be implementation
costs. For members, these include
any adjustment costs related to the
removal of tariffs and the introduction
of new trade rules and standards.
For non-participating countries,
although the changing circumstances
present opportunities, there may be
new challenges as well, ranging from
B O X 4 .7
R C E P A N D T R A D E A N D I N V E S T M E N T I M P L I C AT I O N S FO R T H E C O M M O N W E A LT H
RCEP creates the world’s largest trading bloc, representing one-third of the global population and around 30 per cent of global GDP. Fifteen Pacific countries have signed the agreement, including Commonwealth members Australia, Brunei Darussalam, Malaysia, New Zealand and Singapore. India participated in the negotiations until 2019 but did not pursue this further.17 The agreement was signed on 15 November 2020 and is anticipated to take effect by 1 January 2022.18
RCEP is expected to provide a modest boost for trade because around 83 per cent of existing trade between the members (US$2.3 trillion) is already preferential in nature under existing trade deals. The remaining tariff reductions have a long transition period, up to 20 years in some cases. Moreover, three key features of new generation FTAs – namely, environmental regulations, labour standards and intellectual property rights (IPRs) – are absent from RCEP.
The main strength of RCEP is the harmonisation of RoO in the existing FTAs between these economies, which effectively creates a single market for intermediary goods. This harmonised set of RoO and simple regional content rules are likely to boost trade in intermediate products, leading to further integration and diversification of regional supply chains. Two Commonwealth GVC hubs in this region, Malaysia and Singapore, could possibly benefit. In addition, RCEP members with relatively lower wages and production costs could attract new investment from multinational enterprises seeking to establish supply chains within the bloc and/or shift production out of higher-cost locations in the region.
Combined, RCEP members absorb around 30 per cent of Commonwealth countries’ global merchandise exports. South Asian Commonwealth members - India, Bangladesh, Maldives, Pakistan and Sri Lanka – have notably strong trade relations with RCEP signatories. The limited proposed tariff reductions and the long transition period will alleviate concerns about preference erosion for many of these countries. Similarly, the trade flows of Commonwealth small states and LDCs in the Pacific region are less likely to be affected because of their pre-existing trade agreements with Australia and New Zealand and the relatively lesser focus of RCEP on tariff reductions.
There is also scope for investment diversion away from Commonwealth countries that are not members of the agreement, especially India, particularly if China pivots more investment towards RCEP signatories. Similarly, RCEP may result in even greater flows of intra-regional investment to China, to the detriment of countries outside the bloc.
Notwithstanding RCEP’s potential to support growth in trade and investment, geopolitical issues and the future security relationships between the members could constrain the outlook. China’s recent trade tension with Australia is a case in point. Beijing has restricted or banned various Australian imports, from beef and wines to timber and coal, for reasons that appear to be largely political. It is possible – but unlikely – that RCEP will be able to ease this mounting tension, especially since its dispute settlement mechanism is untested and limited in scope (Chuah, 2020).
5016_Book.indb 123 17-06-2021 08:32:28
124 \ Commonwealth Trade Review 2021
trade and investment diversion to
more elaborate and encompassing
standards and regulations, especially
in the case of CPTPP. Commonwealth
developing countries and LDCs,
drawing on multilateral and bilateral
development assistance, including
Aid for Trade, should proactively
strengthen their capacity to comply
with such new requirements
and standards in world trade
(Commonwealth Secretariat, 2015).
To tide over during the COVID-19
pandemic, Commonwealth policy-
makers should give the highest
consideration to boosting regional
trade and implementing existing RTAs,
including with global partners. This
could provide an important stimulus
for economic recovery, especially for
developing countries and LDCs with
limited fiscal space. It can also help
facilitate cross-border trade in medical,
pharmaceutical, food and other essential
goods. Rather than focusing only on
tariff preferences to build regional
markets, deeper integration involving
behind-the-border measures is likely
to result in more trade and investment.
Effective regional co-operation and
integration allow free movement
of goods, services, investment and
people – and, in some cases, data flows
across borders – to enable competitive
production of exports, and participation
and upgrading in regional and GVCs.
This requires enhanced co-operation
on non-tariff measures (e.g. technical
regulations and standards), improving
connectivity (e.g. transport and logistics
infrastructure), reducing trade costs (e.g.
digitalised trade facilitation, one-stop
borders in Africa and sectoral initiatives
such as the Bangladesh-Bhutan-India-
Nepal Motor Vehicles Agreement)
and developing regional value chains
to trigger structural transformation.
Strengthening regional integration is
especially important for small states
to address the constraints of small
domestic markets and to enable them
to benefit from economies of scale
to augment their competitiveness
(Commonwealth Secretariat, 2015).
While new trade deals have recently
been signed, there are also many
existing bilateral and regional trade
agreements that are not being
effectively implemented or utilised.
Implementation of trade agreements
generally takes a very long time,
often decades, which implies that the
negotiated outcomes often do not
materialise immediately. For example,
the Caribbean Forum (CARIFORUM)
Economic Partnership Agreement (EPA)
with the EU is its only EPA that includes
services, and these provisions are
generally more attractive than anything
available at the multilateral level.19
However, Caribbean service suppliers,
especially cultural services, artists
and performers, have not been able to
take full advantage of the agreement
because they face barriers related to
the mutual recognition of standards and
difficulties in obtaining visas (European
Commission, 2021). Post-Brexit UK
trade relations with CARIFORUM could
work to deliver real and meaningful
market access in this area, especially
given the large Caribbean diaspora in the
UK, as discussed in the next chapter.
There are also costs associated with
implementing trade deals, whether
to generate supply responses or
adjust domestically. Investments
in “hard” infrastructure should be
accompanied by improvements
in “soft” infrastructure, including
building key stakeholder awareness
and capacity, especially targeting
women-led businesses and MSMEs.
For such purposes, Commonwealth
developing countries can draw on
the WTO’s Aid for Trade initiative,
while LDCs can develop productive
partnerships with its Enhanced
Integrated Framework for LDCs and
the United Nations Technology Bank
for LDCs. In addition, governments
should consider adopting a multi-
faceted work programme, backed
by dedicated institutions with
adequate f inancial resources and
technical capacities, to guide the
implementation of trade agreements
and strategies (Commonwealth
Secretariat, 2015). In times of crisis,
like COVID-19, broader regional
co-operation has also been effective
in supporting emergency responses,
from pooling resources to acquiring
vaccines to ensuring undisrupted
supply chains, as discussed next.
4.4.2 Regional co-operation during COVID-19
The pandemic has underscored
the importance of greater regional
co-operation and co-ordination to
contain the virus and eliminate the
pandemic. The following examples
illustrate how regional co-operation,
which is broader than trade-focused
RTAs, has been helpful for this pandemic.
Africa
African countries, supported by the AU
Commission and the Africa Centres
for Disease Control and Prevention,
have mounted a commendable
collective effort to combat the
COVID-19 pandemic, address the
acute shortage of medical supplies
on the continent and, more recently,
enable the procurement of vaccines.
5016_Book.indb 124 17-06-2021 08:32:28

Chapter 4: Multilateral and Regional Trade Responses to the Pandemic \ 125
The African Medical Supplies Platform
(AMSP)20 was established in June 2020
to pool Africa’s demand for medical
supplies and maximise the continent’s
purchasing power (Crone, 2020).
In mid-January 2021, the ASMP
commenced the COVID-19 Vaccine Pre-
Order Programme and launched a new
product category, “vaccine accessories”,
to enable members to procure ultra-
low temperature freezers, syringes,
needles and other equipment needed
to store and administer vaccines.
Additionally, to ensure the procurement
of sufficient vaccines to achieve a
target of immunisation of 60 per cent
on the continent, the AU also set up the
Africa Vaccine Acquisition TaskTeam
to help acquire vaccines (Afreximbank,
2021). Several Commonwealth
African countries also introduced
measures to repurpose manufacturing
capacity to support national and
continental health care responses, as
discussed in the next section about
the potential for developing regional
production and supply chains.
The African Export-Import Bank
(Afreximbank) has a history of providing
support to African economies in
times of economic crisis. It has played
a broader developmental role in
the continent than simply providing
concessionary export financing. In
response to the pandemic, the Bank
extended its facilities to finance the
import of medical goods and vaccines.
For example, it initially provided US$100
million in financing to the ASMP. Later,
it guaranteed combined loans of up
to $2 billion for AU member states to
procure vaccines through the ASMP
single-source platform (APO Group,
2021). Other Commonwealth regions
could consider this innovative use of
trade financing in times of crisis.
Asia
The South Asian countries have
cooperated in unprecedented ways to
tackle COVID-19. In March 2020, leaders
of the South Asian Association for
Regional Co-operation (SAARC) hosted
their first high-level meeting since 2014
to determine a regional response to
the pandemic. This meeting resulted
in the creation of an emergency fund
of over US$18 million, to which three
Commonwealth members – Bangladesh,
India and Sri Lanka – pledged a combined
$16.5 million. India contributed
$10 million of that total. India also
committed to providing online training
for emergency responders, setting
up a surveillance platform to manage
the outbreak and providing masks and
other medical equipment to the worst-
affected countries. SAARC also set up
a website to track the development of
COVID-19 cases across the region.
Importantly, India is one of the few
Commonwealth developing countries
with the capacity to develop, or even
manufacture, their own vaccines.
The Serum Institute of India is the
world’s largest vaccine manufacturer
by volume. The company is scheduled
to reach production of 100 million
doses of COVID-19 vaccine a month
by March 2021. Bangladesh also
has a significant pharmaceutical
industry (Vickers et al., 2021).
Caribbean
The Caribbean Public Health Agency
(CARPHA) activated its Incident
Management Team-Emergency
Response in January 2020 to prepare
for and respond to the threat of the
pandemic. The organisation has since
provided guidelines to governments in
managing and controlling the spread of
the virus, trained health care workers
and procured test kits and masks.
It has also partnered with the Pan-
American Health Organization and other
international public health bodies to
deliver maximum impact. Additionally,
CARPHA has prepared guidelines for
the safe reopening of borders to assist
with resumption of economic activities,
especially tourism (CARPHA, 2020).
In April 2020, the Caribbean Community
(CARICOM) Heads of Government
established a regional pandemic
response. They agreed to collectively
approach international financial
institutions to seek financial resources
to meet the fiscal challenges brought
about by the pandemic. CARICOM
has also continued its campaign for
donors to consider additional criteria
in determining eligibility for aid, such
as the vulnerability of each country
(CARICOM, 2020). The Caribbean
Economic Recovery and Transformation
Plan has been set up to address these
and other concerns (Comissiong, 2021).
Pacific
The Pacific Humanitarian Pathway for
COVID-19 (PHP-C) was established
in April 2020 to bolster the regional
response to the pandemic. It addresses
five areas affected by border restrictions:
the deployment of technical personnel
to and between Forum Island Countries
(FICs); immigration, customs and
biosecurity; repatriation of FIC nationals
to their homes; and clearance of planes
and ships transporting medical and
humanitarian aid, technical personnel
and FIC nationals. Its aim is to expedite
assistance and co-operation between
FICs by enabling the provision of
medical and humanitarian assistance
from regional and international
development partners (Pacific
Co-operation Foundation, 2020).
5016_Book.indb 125 17-06-2021 08:32:28

126 \ Commonwealth Trade Review 2021
Australia has funded the
operationalisation of the PHP-C, providing
US$5.5 million to the World Food
Programme to support efforts to manage
COVID-19 in the region. Of this amount,
$4 million was dedicated to air transport
and logistic services for the PHP-C, the
delivery of humanitarian and critical
medical supplies and the assessment of
the impact of COVID-19 on food security
in the Pacific (Payne et al., 2020). Australia
has also pledged to procure COVID-19
vaccines for the Pacific through its
Partnership for Recovery strategy,
committing $80 million to the COVAX
Facility Advance Market Commitment to
improve vaccine access for the Pacific
and Southeast Asia countries. In addition,
Australia intends to establish a $304.7
million COVID-19 Recovery Fund over two
years as part of a Pacific-Step-up to assist
in addressing the social and economic
costs of the pandemic in the region.
These developments signify the
importance of continued regional
co-operation to support health
care responses and recovery from
the pandemic in Commonwealth
countries in Africa, Asia, the Caribbean
and the Pacific. However, RTAs can
also be used to build back better,
as discussed in the next section.
4.4.3 Leveraging RTAs for recovery and resilience
Commonwealth countries can
leverage RTAs to build back better
from the pandemic by strengthening
existing agreements and their
provisions or when negotiating future
ones. Policy-makers could focus
on three issues, among others.
Strengthen provisions in RTAs to enable co-operation in times of crisis
Trade agreements can facilitate regional
trade in times of emergency, especially
the flow of essential products such as
food and medicine, by reducing tariffs,
internal taxes and administrative fees,
and digitising trade facilitation systems
to reduce paper-based trade (see
Chapter 5). Governments should also
adhere to their WTO transparency
obligations, publishing details about their
response measures (Tan and Zhang,
2020). There may be an opportunity
to improve certain norms and rules in
RTAs to ensure that trade is disrupted
to the least extent possible in case
of emergencies, and to facilitate
recovery from crises. This could
involve developing model provisions
for RTAs and other trade agreements
to promote better trade co-operation
and co-ordination in times of economic
crisis and health pandemics (Bajit and
Duval, 2020). For example, appropriate
treaty provisions could be developed
for medical goods, health care, sanitary
and phytosanitary standards, TBT,
conformity assessment in emergencies
and food security (Muchopa, 2020).
Harness trade agreements as a tool for inclusive recovery
An inclusive recovery from the
pandemic means that consideration
of the impact of trade on women as
workers, traders and consumers needs
to be mainstreamed. COVID-19 has
severely affected sectors that employ
primarily women, including garments,
tourism and hospitality, especially in
small states, LDCs and SIDS (Kampel,
2020a). Women also constitute the
largest share of informal cross-border
traders, but in most cases RTAs do
not cover these activities. RTAs could
include provisions to better support
women entrepreneurs who have been
disadvantaged by the consequences
of the pandemic and connect more
women to the global economy
(Bahri, 2020). This could involve
crafting gender-specific provisions
in RTAs and creating mechanisms for
countries to cooperate to address
the challenges faced by women.
For example, in the case of the
AfCFTA, the on-going negotiations of
schedules for goods and services – and
e-commerce in the future – provide an
opportunity to address issues of interest
to women. Flexibilities in scheduling
countries’ commitments creates some
policy space to support emerging or
infant sectors that are gender-sensitive
by implementing longer liberalisation
periods, while opening others to
enhance competitiveness or attract
investment. Lessons to improve
women’s economic empowerment
through appropriate domestic
regulation can also be gleaned from
ongoing plurilateral discussions at the
WTO (Kampel and Anuradha, 2021).
Build regional production and supply chains
COVID-19 has elevated existing policy
debates about building greater resilience
and self-sufficiency to tackle future
crises and pandemics. This comes in
the wake of scarcity of medical goods,
export controls, over-dependence
on single suppliers for specific goods
and vaccine nationalism. There are
proposals and initiatives related to
re-shoring supply chains, reducing the
length of supply chains and producing
key medical devices and medicine
at home, at least in some advanced
economies with the technological
capabilities (Baldwin and Evenett, 2020).
Since autarky is neither economically
optimal, practical nor feasible for most
Commonwealth countries, regional
approaches could play a pivotal role,
especially in Africa, Asia and the
Caribbean, as already highlighted earlier
in this section. This could take the form
5016_Book.indb 126 17-06-2021 08:32:28

Chapter 4: Multilateral and Regional Trade Responses to the Pandemic \ 127
of regional stockpiling of essential
medical goods for global shortages
or ramping up regional production by
adding value to available inputs and
cooperating with regional and global
partners. Developing regional value
chains can help reduce vulnerability,
increase resilience and foster industrial
development (Cordon, 2020). The
experience of Africa has demonstrated
the potential for Commonwealth
countries to fast-track the development
of regional value chains in health and
possibly other areas. Developing
regional value chains can also help
Commonwealth African countries
recommit to industrial development
(Box 4.8), reduce trade dependence
on non-African partners and further
position themselves to combat future
global shocks (Banga et al., 2020).
4.5 Conclusion and way forward
This chapter has examined some of the
trade aspects of the global response
to the pandemic, focusing specifically
on the WTO and RTAs involving
Commonwealth countries. With trade
multilateralism under greater scrutiny and
pressure, strengthening the rules-based
multilateral trading system remains an
important priority for the Commonwealth
and for tackling the COVID-19 pandemic,
in supporting recovery and pursuing
the SDGs. Following the consensus
appointment of a new Director-General
and MC12 scheduled for November
2021, there will be an opportunity for
the WTO membership to consider
the measures needed to restore
confidence in the rules-based trading
system and help revitalise world trade,
as discussed in the next chapter.
The proliferation of RTAs in recent years
is partly ascribed to, among others, the
very slow progress in the multilateral
trade negotiations, as manifested
in the incomplete Doha Round and
the rise of plurilateral initiatives,
especially on digital trade (see Chapter
2). However, there is also a view that
multilateralism and regionalism can
co-exist and complement each other,
especially if they create new trading
opportunities and deepen liberalisation
(WTO, 2011). RTAs can innovate with
governance arrangements for trade,
such as the digital economy, while
the WTO can provide a platform for
inclusive discussion and learning
B O X 4 . 8
TO WA R D S “ FA C TO R Y S O U T H E R N A F R I C A”
In Southern African countries, developing regional value chains offers an opportunity to broaden the manufacturing base and expand productive capacity. South Africa holds a unique position among countries in the region in terms of its scale of participation in GVCs, which cuts across a range of sectors, from agriculture and mining to automobiles and finance. This means South Africa is well placed to drive the formation of cross-country value chains within Southern Africa. In turn, South Africa’s regional neighbours have complementary capabilities that can support the development of these value chains built around South Africa’s existing linkages into GVCs (Farole, 2016).
Banga and Balchin (2019) identify “lead products” exported by South Africa in GVCs and the intermediate products that can enable other Southern African countries to link into South Africa’s GVCs by supplying inputs more competitively than existing sources. Botswana, Namibia, Zambia and, to a lesser extent, Mozambique repeatedly emerge as potentially competitive suppliers of intermediate inputs in the production of the top lead products exported by South Africa, including capital goods, machinery, pharmaceuticals, consumer goods and agro-processing products. Attention will need to be directed to enhancing productivity and competitiveness in the countries that are not currently capable of serving as competitive suppliers of intermediates into value chains for South African lead products, to ensure they are not excluded entirely from the development of regional value chains in Southern Africa. There is scope to leverage digital technologies to boost productivity and enhance the scale and sophistication of production in these countries. Supplier development or linkage programmes facilitated by South African lead firms mentoring regional suppliers can also help develop the latter’s productive capacity and enable them to meet quality and technical requirements.
More generally, the promotion of deeper regional integration in Southern Africa will aid the development of regional value chains. This should focus on eliminating remaining non-tariff barriers hindering trade flows in the region (which include customs inefficiencies, restrictive RoO, import bans, quotas and levies, and a range of TBT) as well as harmonisation of standards and licensing requirements.
5016_Book.indb 127 17-06-2021 08:32:28

128 \ Commonwealth Trade Review 2021
about regional experiences, including
through the Trade Policy Reviews and
the Transparency Mechanism for RTAs,
as well as designing RTAs that better
prepare members for future crises.
Whether to multilateralise these rules
is a matter for the WTO membership
while taking into consideration
the capacity constraints of small
states, LDCs and SSA countries.
Multilateral and regional responses to
the COVID-19 pandemic have been
complementary and have reinforced
each other, especially by facilitating
supply chains, ensuring access to food
supplies and pooling resources to
acquire medical products and vaccines.
In pursuit of the speedy delivery of
vaccines, governments should consider
fast-tracking relevant provisions of
the WTO’s TFA, as appropriate, while
drawing on the TFA Facility and available
technical assistance and capacity
support for developing countries and
LDCs. Furthermore, government
procurement rules at the international
level that promote efficient trade and
best practices in public procurement
can help improve the accessibility
and availability of affordable vaccines
(WTO, 2020k; WTO et al., 2020).
Many Commonwealth countries
are increasingly exploring trading
opportunities through bilateral and
regional trade deals, although the
biggest challenge is implementation
of these agreements to realise the
intended benefits, especially for
women-led businesses and MSMEs.
Deeper integration rather than tariff
preferences is more likely to result in
increased trade within the regions of
Commonwealth members. Developing
regional value chains can also open
opportunities for putting in place
new manufacturing capacities to
aid recovery from the pandemic and
in preparation for future crises.
The significance of the RTA effect for
intra-Commonwealth trade deserves
further policy attention. It would suggest
that intra-Commonwealth initiatives
to rationalise tariffs, strengthen trade
facilitation and further reduce the
costs of intra-Commonwealth trade,
particularly among Commonwealth
members that are members of RTAs,
are likely to yield significant gains to
Commonwealth trade. Moreover, it
would also suggest that growth in intra-
Commonwealth trade could possibly
take place at a much faster pace now
that the UK has established bilateral
trade deals with many Commonwealth
members, while there is the possibility
of future agreements with Australia,
Canada and New Zealand, as discussed
in the next chapter. There is considerable
scope to increase the UK’s trade
engagement with Commonwealth
countries given its current low share of
intra-Commonwealth trade (see Chapter
1). Having provided this overarching
global and regional context, the next
chapter examines 10 inter-related
policy areas to support trade recovery
in the Commonwealth and globally.
5016_Book.indb 128 17-06-2021 08:32:28

Chapter 4: Multilateral and Regional Trade Responses to the Pandemic \ 129
Agreement Commonwealth members Other parties Entry into force Policy areas
African Continental FTA (AfCFTA)
Botswana, Cameroon, Eswatini, The Gambia, Ghana, Kenya, Lesotho, Malawi, Mauritius, Mozambique, Namibia, Nigeria, Rwanda, Seychelles, Sierra Leone, South Africa, Uganda, Tanzania, Zambia
35 African countries; Eritrea has not signed the AfCFTA
30 May 2019 Goods, services, investment, competition policy, e-commerce
Canada–USA–Mexico Agreement (CUSMA)
Canada USA, Mexico 1 July 2020 Goods, services, government procurement, investment, IPRs, labour, environment
EU-Japan EPA Cyprus, Malta EU25, Japan 1 February 2019 Goods, services, environment, labour, public procurement
EU-Singapore Trade and Investment Agreement
Cyprus, Malta, Singapore EU25 21 November 2019 Goods, services, investment, environment
Pacific Agreement on Closer Economic Relations (PACER)-Plus
Australia, New Zealand, Kiribati, Nauru, Samoa, Solomon Islands, Tonga, Tuvalu, Vanuatu
Cook Islands, Niue
13 December 2020 Goods, services, investment
Regional Comprehensive Economic Partnership Agreement (RCEP)
Australia, Brunei Darussalam, Malaysia, New Zealand, Singapore
Cambodia, China, Indonesia, Japan, Laos, Myanmar, Philippines, South Korea, Thailand, Viet Nam
15 November 2020 Goods, services, investment, IPRs, e-commerce, competition, SMEs and technical co-operation, government procurement
UK-EU Trade and Co-operation Agreement
Cyprus, Malta, UK EU25 1 January 2021 Goods, services, investment, competition, data protection, digital trade
UK-CARIFORUM EPA Antigua and Barbuda, Barbados, Belize, The Bahamas, Dominica, Grenada, Guyana, Jamaica, St Kitts and Nevis, Saint Lucia, UK (provisional application)*
Bridging mechanism for St Vincent and the Grenadines and Trinidad and Tobago**
Dominican Republic, Suriname
1 January 2021 Goods, services, IPRs, government procurement and competition
UK-Pacific EPA Fiji, Papua New Guinea, UK (provisional application)*
Bridging mechanism for Samoa, Solomon Islands**
- 1 January 2021 Goods, services, IPRs, government procurement, competition
Annex 4.1 Major trade agreements involving Commonwealth countries, 2018-present
(Continued)
5016_Ch04.indd 129 17-06-2021 12:38:58

130 \ Commonwealth Trade Review 2021
Agreement Commonwealth members Other parties Entry into force Policy areas
Southern African Customs Union and Mozambique (SACUM)-UK EPA
Botswana, Eswatini, Lesotho, Namibia, South Africa, UK
– 1 January 2021 Goods, services, IPRs, government procurement, competition
Eastern and Southern Africa (ESA)-UK EPA
Mauritius, Seychelles, Zimbabwe, UK
– 1 January 2021 Goods, services, IPRs, government procurement, competition
UK-Kenya EPA Kenya, UK – Not yet ratified (bridging mechanism)
Goods, services, IPRs, government procurement, competition
UK-Singapore Free Trade Agreement (UKSFTA)
Singapore, UK – 1 January 2021 Goods, services, IPRs, non-trade barriers in key sectors, such as electronics and pharmaceuticals
Comprehensive Economic Co-operation and Partnership Agreement (CECPA)
India, Mauritius – Awaiting signature Goods, services, movement of natural persons, telecommunication, financial services
Digital Economy Partnership Agreement (DEPA)
New Zealand, Singapore; Canada has announced it will seek to join
Chile Digital identities, e-invoicing, paperless trade, FinTech and E-Payments, personal data protection, cross-border data flows, open government data, data innovation and regulatory sandboxes, artificial intelligence, SMEs co-operation, digital inclusivity, online consumer protection
Notes: * Provisional application: a practice in international treaties to bring agreements into effect ahead of entry into force. ** Bridging mechanism: alternative means to ensure continuity of trade, where the UK or treaty partners are unable to fully ratify or provisionally apply an agreement. These non-binding mechanisms include memoranda of understanding or the exchange of diplomatic notes. As reported by the UK on 9 March 2021.Source: Commonwealth Secretariat
5016_Book.indb 130 17-06-2021 08:32:28

Chapter 4: Multilateral and Regional Trade Responses to the Pandemic \ 131
Endnotes
1 There were 123 signatories to
the 1994 Marrakesh Agreement,
which established the WTO.
2 The new WTO Director-General
is Ngozi Okonjo-Iweala of Nigeria.
Furthermore, it is remarkable and
celebratory that, for the first time
in history, all three global trade
bodies - the WTO, the United
Nations Conference on Trade
and Development (UNCTAD) and
the International Trade Centre
(ITC) - are led by women, two
of whom are Commonwealth
citizens. Pamela Coke-Hamilton
is Executive Director of the ITC
and Isabelle Durant is Acting
Secretary-General of UNCTAD.
3 Paragraph 30 of the 2015 Nairobi
Ministerial Declaration (WT/MIN(15)/
DEC) notes that many members
reaffirmed the Doha Development
Agenda and their commitment
to conclude this and that other
members did not reaffirm the Doha
mandate as they believed new
approaches were required in order
to achieve meaningful outcomes in
the multilateral trade negotiations.
This contributed to the stalling
of Doha Round trade talks.
4 Paragraph 16 of the 2018
Commonwealth Heads of
Government Meeting Communiqué
“Towards a Common Future”.
5 As of January 2021, the caucus
has met twice to discuss topical
multilateral trade issues, notably
on WTO reform; this has included
consultation and outreach by the
Canada-led Ottawa Group.
6 Article XI of the GATT 1994 broadly
prohibits export bans and restrictions
but also provides a broad range of
carve-outs, which allow members
to impose such prohibitions and
restrictions temporarily (2a, b
and c). Article XI (2a), for example,
allows members to impose export
restrictions to prevent or relieve
critical shortages temporarily. Article
XX also allows countries to impose
export restrictions under certain
conditions that must be met. Such
measures should also not constitute
a means of imposing arbitrary or
unjustified discrimination between
countries, or disguised restrictions
on international trade. If members
impose restrictions on foodstuff
temporarily, Article 12 of the WTO
Agreement on Agriculture requires
them to give due consideration
to the food security of others.
7 https://www.tfafacility.org/
covid19-trade-facilitation
8 Australia, Barbados, Canada, Guyana,
Jamaica, Kenya, Mauritius, New
Zealand, Nigeria, Papua New Guinea,
Saint Lucia, Seychelles, Singapore,
Solomon Islands and the UK.
9 The TFA sets a timeframe for
developing countries and LDCs to
implement measures designated
into Categories A, B and C.
Category A commitments were
required to be implemented by
22 February 2017 for developing
countries and 22 February 2018
in the case of LDCs. Category
B recognises that developing
countries and LDCs need more
time to implement these measures.
For Category C, developing
countries and LDCs need additional
time and capacity-building to
implement the measures.
10 With the exception of Malta, the
six net exporters are all located in
Asia: Bangladesh, India, Malaysia,
Pakistan, Singapore and Sri Lanka.
11 Some developing countries have
countered that implementing
such flexibilities under the TRIPS
Agreement (Doha Declaration)
is complex because the actions
involved in obtaining a compulsory
licence are cumbersome and
time-consuming at a time-critical
point in the effort to halt the
pandemic. Lengthy negotiations
with the IPR holder(s), including
over remuneration, can also
deter from the pursuit of more
expeditious solutions.
12 https://www.wto.org/english/
tratop_e/region_e/region_e.htm
13 In April 2008, SACU and the
USA signed a trade, investment
and development co-operation
agreement (TIDCA) in lieu of an FTA.
14 The OACPS was formerly known
as the African, Caribbean and
Pacific (ACP) Group of States.
15 There is a strong positive effect on
trade creation for all countries that
belong to RTAs. A country’s exports
are found to be 115 per cent higher
when trading with another RTA
partner compared with a partner
outside such an arrangement.
However, Commonwealth exporters
trade more than twice as much
(230 per cent) because of the
RTA effect. The effect is most
significant for intra-Commonwealth
trade, where exports are boosted
by more than three times (356
per cent) (Commonwealth
Secretariat, 2018a).
16 Under the AfCFTA, LDCs have
10 years to achieve 90 per cent
liberalisation compared with five
years for non-LDCs. Likewise, for
the remaining 10 per cent of tariff
lines, 7 per cent can be designated
to sensitive products and 3 per cent
can be excluded from liberalisation
5016_Book.indb 131 17-06-2021 08:32:28

132 \ Commonwealth Trade Review 2021
entirely to safeguard domestic
industries. LDCs also have 13 years
to eliminate tariffs on sensitive
products compared with 10 years
for non-LDCs (Hartzenberg, n.d).
17 Reportedly because the negotiations
failed to address its core concerns
including demands for greater
service access and mechanisms to
address the potential adverse effects
of lower tariffs on local producers.
18 RCEP will enter into force once six
of 10 ASEAN members and three
of five Dialogue Partners ratify it.
19 The CARIFORUM EPA secured
major gains relative to General
Agreement on Trade in Services
(GATS) commitments, including
in relation to Mode 4 and the
temporary movement of people
(among them graduate trainees).
The Protocol on Cultural
Co-operation is innovative,
and commitments undertaken
in the entertainment services
sector are viewed positively in
relation to the emergence of the
animation industry (Keane, 2016).
20 The ASMP comprises all
AU member states and the
15 Caribbean Community
(CARICOM) countries that are also
Commonwealth member states.
5016_Book.indb 132 17-06-2021 08:32:28

5016_Book.indb 133 17-06-2021 08:32:28
Chapter 5: Pathways to Post- COVID Trade Recovery and Resilience Building
5016_Book.indb 134 17-06-2021 08:32:28

Trade can offer positive solutions to manage the COVID-19 pandemic, support economic recovery and spur the transition towards more inclusive and sustainable economies. The Commonwealth’s diverse members will face varied opportunities and challenges and follow multiple recovery tracks based on the structure of their economies, the composition of their exports and their inherent features and vulnerabilities. Commonwealth countries can look to use their global and intra-Commonwealth trade as essential tools for building back better and promoting a more inclusive, resilient and sustainable future.
Chapter 5 identifies and examines 10 inter-related policy areas for revitalising trade. Some of the key takeaways are:
• Global economic prospects over the next few years will determine trade recovery, although strengthened multilateral and regional co-operation will enable and enhance developing countries’ participation in world trade, especially least developed countries and graduates.
• The UK’s new trade agreements with Commonwealth countries offer untapped opportunities to expand trade and investment and deepen economic co-operation, including in services, digital trade and FinTech.
• Tourism-dependent countries need to implement recovery plans that address demand and supply factors, support domestic and regional travel, and make the industry more resilient, including by adopting digital technologies.
• Commonwealth countries can harness digital technologies to boost their trade recovery and improve competitiveness, adopt paperless trade, and promote more sustainable and circular trade, especially for agriculture and fisheries.
• Recovery efforts should be framed overall by the importance of ensuring inclusive trade for women and youth and especially promoting women’s economic empowerment.
5016_Book.indb 135 17-06-2021 08:32:28

Stren
gthe
n an
d re
form
the
multi
lateral trading system
Boost
regio
nal trade and co-operation
Uti
lise
new
trad
ing o
pportuniti
es post-Brexit
Revive the tourism and travel sector
Prom
ote
sust
aina
ble
trad
e an
d gr
een
grow
th
Enhance support measures for LDCs and graduates
Leverage digital technologies
Har
ness
Com
mon
wea
lth ad
vantage in
trade and in
vestment
Commonwealth countries can follow multiple tracks to trade recovery and building resilience.
5016_Book.indb 136 17-06-2021 08:32:29

5.1 Introduction
Trade can offer positive solutions to manage the COVID-19
pandemic and will be an essential tool for economic recovery.
With vaccines being distributed globally, many countries are
starting to lift national restrictions, open economies and
resume trade and travel. Each Commonwealth member
country has its own unique pathway and policy options for
recovery, although access to vaccines plays an indispensable
part for all of them. Digital technologies can enable this
economic recovery process, while vaccination programmes
are likely to fare better in countries where supply chains and
public health services are digitised. Overall, the outlook for
Commonwealth countries’ trade recovery is inextricably
linked to global economic prospects (IMF, 2021b) as well as
the structure of their economy, the composition of their
exports and their inherent characteristics and vulnerabilities,
especially for least developed countries (LDCs) and small
states. Commonwealth countries can also leverage
regional trade agreements and regional co-operation
mechanisms, discussed in the previous chapter, to grow
their exports and build back better from the pandemic.
This chapter sets out some of the possible pathways for trade
recovery from the pandemic. It identifies and examines 10
inter-related policy areas for revitalising trade, while ensuring
inclusiveness, especially for women and youth, and promoting
more sustainable trade and circular economy principles.
5016_Book.indb 137 17-06-2021 08:32:29

138 \ Commonwealth Trade Review 2021
5.2 Strengthen and reform the multilateral trading system
An effective rules-based global trading
system offers the best framework to enable
an inclusive and sustainable recovery
in world trade. This requires members
of the World Trade Organization (WTO)
to work collectively to strengthen and
reform trade multilateralism to tackle this
century’s new and emerging trade issues
and challenges (Soobramanien et al., 2019).
However, the certainty and stability of the
rules-based multilateral trading system is
increasingly at risk from the geopolitical
and geo-economic rivalry between the
USA and China, the growing backlash
against globalisation in many countries
and the use of unilateral trade measures
by some WTO members. More recently,
complaints by the USA of “overreach” by
the WTO’s Appellate Body (AB), leading to
its refusal to agree to new appointments as
the terms of appointees expired, thereby
rendering the AB dysfunctional (Remy,
2020), and China’s attempts to advantage
state-owned enterprises have aggravated
existing tensions. There are also concerns
that some parts of the WTO rulebook for
managing world trade may be out-dated.
These rules need to take into consideration
the growth of trade in digital goods and
services, changing modes of manufacturing
and the challenges of climate change,
natural disasters, environmental
sustainability and biodiversity loss.
With a new WTO Director-General
at the helm, the need to undertake
some reform and strengthen the WTO
system is widely recognised. For this
purpose, there are various proposals
by WTO members and groups, for
example the Canada-led Ottawa
Group and the Africa Group. In October
2019, Commonwealth Trade Ministers
reaffirmed their commitment to work
constructively together and with other
WTO members on the necessary
reform of the organisation and urged
that any reform in the WTO take into
account the views of all members.
It could be useful to situate these
discussions on reforming the WTO in
the context of its founding purpose. The
Preamble to the Marrakesh Agreement
highlights the WTO’s objectives as
increasing incomes, helping create
employment, supporting sustainable
development and raising living standards
(WTO, 1995). Moreover, the 2030
Agenda for Sustainable Development
recognises the role of international trade
– both directly and through its indirect
influences in other areas – in achieving
many specific Sustainable Development
Goals (SDGs) and targets. For example,
trade directly appears under seven
goals concerning hunger, health and
well-being, employment, infrastructure,
inequality, conservative use of oceans and
strengthening partnerships (UN, 2015).
Bearing this in mind, the WTO should
strive to respond to the needs of its more
disadvantaged members by ensuring
a level playing field in world trade and
providing a platform for them to articulate
and advance their trade and development-
related interests. WTO members
could consider several immediate and
prospective actions to build a more
robust rules-based trading system.
5.2.1 Immediate actions
In the short term, consideration could
be given to avoiding protectionism
and improving vaccine production
and distribution, strengthening the
enabling environment for e-commerce,
addressing fisheries subsidies
and improving food security.
One of the WTO’s key functions
is promoting transparency and
predictability in world trade by
requiring members to notify their
domestic measures affecting trade
and submitting their trade policies for
regular review. To enhance certainty
in times of crisis, WTO members
should work to strengthen disciplines
on export restrictions. They can also
improve the functioning of the regular
working bodies to monitor trade policy
responses to the pandemic, especially
vaccine distribution, and ensure any
measures are “temporary, targeted,
proportional and transparent” (WTO,
2020l). The WTO membership should
also strive to reconcile intellectual
property rules and public health to help
ensure affordable and equitable access
to vaccines to help revitalise global trade,
the movement of goods and people
and the opening of economies. Easing
domestic regulations to ensure a ready
supply of service providers in essential
sectors like health care could also
facilitate post-pandemic preparation
(Kampel and Anuradha, 2021).
COVID-19 has underscored the
importance of digital trade, especially
e-commerce and the online delivery
of certain services, for mitigating
some of the consequences of the
pandemic, as discussed in Chapter
2. With this in mind, WTO members
should consider ways to accelerate
e-commerce discussions in an inclusive
manner to support the development
of this digital trade sector. They
could start by identifying any areas
where convergence is possible. As
these discussions progress, and
5016_Book.indb 138 17-06-2021 08:32:29

Chapter 5: Pathways to Post-COVID Trade Recovery and Resilience Building \ 139
given the digital divide between WTO
members, it is imperative to prioritise
the development dimension to build
digital trade capacity in developing
countries and LDCs. It is also important
to explore practical solutions to address
many legitimate concerns of these
countries, for example through a new
and invigorated Aid for Digital Trade
initiative (see Section 5.8) or drawing
on the Trade Facilitation Agreement’s
innovative approach to implementation
linked to capacity support.
A negotiated agreement on fisheries
is long overdue and should be adopted
at the 12th Ministerial Conference
of the WTO (MC12).1 Fish stocks
are being depleted at unsustainable
rates, affecting economic growth,
food security and livelihoods in many
coastal countries and communities,
especially small states and small
island developing states (SIDS). WTO
members are seeking comprehensive
and practical disciplines to prohibit
specific forms of f isheries subsidies
that contribute to overcapacity and
overfishing, while also eliminating
subsidies that contribute to illegal,
unreported and unregulated (IUU)
f ishing, and considering effective and
appropriate special and differential
treatment for developing countries
and LDCs. Since all major economies
have an interest in the fisheries
negotiations – and delivering the
SDGs – there is a strong possibility
of reaching an outcome.
The pandemic has also fuelled
discussions on the need to maintain and
enhance food security. In response to
COVID-19, several producing countries
adopted measures that restricted
trade in food (see Chapter 4), while
others resorted to stockholding to
ensure sufficient domestic supplies.
This jeopardised the security of
food supplies for many developing
countries and LDCs, which rely on
global markets to meet their food and
nutritional needs. Some WTO members
have stressed the need to reach an
outcome on a permanent solution
to public stockholding (PSH) to help
ensure food availability, especially for
the poor and the most vulnerable,
during times of crisis. However, other
developed and developing country
members are cautious that some of
these programmes may cause trade
distortions and that products benefiting
from PSH should not be exported.
5.2.2 Prospective actions
As part of a broader reform
agenda, it is paramount to find a
solution to the dispute settlement
impasse and to identify practical
ways for trade multilateralism to
support greater environmental
sustainability, especially in light of
the SDGs and global commitments
to addressing the climate crisis.
An urgent priority is to ensure a
functional Dispute Settlement
Understanding (DSU) and AB, which
is critical to preserve the rules-based
multilateral trading system. As alluded
earlier, on 10 December 2019, the AB
was rendered dysfunctional, leaving the
WTO without a credible enforcement
mechanism and allowing losing parties to
lodge appeals “into the void”. Although
WTO members have recourse to
other dispute settlement alternatives,
they are regarded as second best and
some WTO members may not accept
them. A sub-group of WTO members,
including several Commonwealth
countries, has proposed the Multiparty
Interim Appeal Arbitration Agreement
to imitate the defunct two-tier appeal
process, although this does not enjoy
widespread legitimacy (Remy, 2020).
A green recovery from the pandemic
will require WTO members to
consider urgent actions to address
the increased risks and challenges
of climate change, natural disasters,
environmental sustainability and
biodiversity loss. This requires
the global community to pursue
greater coherence and “mutual
supportiveness” between the
multilateral trade and environment
regimes, especially regarding climate
change, where the WTO has no specific
provisions. This has manifested
itself in a growing number of WTO
disputes that involve energy, especially
renewable energy (Rutherford, 2020).
More recently, several countries,
including Canada, EU members and
the USA, have shown an interest
in using border carbon adjustment
mechanisms to tackle climate change
(OECD, 2020e), which could be subject
to WTO rules and procedures. These
measures could also have significant
implications for international trade
and present smaller developing
countries with a new set of challenges.
They may also affect the investment
landscape and require developing
countries to design more integrated
climate change investment plans.
There is an opportunity for the UK, which
in 2021 chairs the G7 of industrialised
nations and the 26th Conference of
the Parties (COP26) of the United
Nations Framework Convention on
Climate Change (UNFCCC), to provide
leadership and advocate globally for a
greener trade-led recovery as well as
additional support for the smallest and
most vulnerable countries. Furthermore,
it is salutary that 53 WTO members,
including several Commonwealth
5016_Book.indb 139 17-06-2021 08:32:29

140 \ Commonwealth Trade Review 2021
countries, have indicated their
willingness to start structured
discussions on trade and environmental
sustainability. These discussions seek
to work on “deliverables” at MC12 and
beyond on environmental sustainability
in various areas of the WTO (WTO,
2020m). WTO members are considering
advancing multilateral co-operation
on trade in environmental goods
and services as well as investment
in green infrastructure, removing
fossil fuel subsidies and investment
in environmentally sustainable
technologies. Plastics pollution and
plastics trade that is environmentally
sustainable are now also receiving
much-needed attention. An informal
dialogue, which involves several
Commonwealth members, aims
to start multilateral discussions on
trade as a solution to the detrimental
effects of plastic pollution on the
environment, health and economy.
Efforts to strengthen and reform
the multilateral trading system can
underpin a broader framework for
recovery. In particular, an enabling
global trading environment will support
and enhance the participation of
developing countries, especially LDCs,
in world trade, as discussed next.
5.3 Enhance support measures for LDCs and graduates
COVID-19 has significantly affected the
trade prospects of the Commonwealth’s
LDC members and those graduating
from this category. After Vanuatu’s
graduation in December 2020,
Solomon Islands is set to follow in 2024.
Bangladesh was also due to graduate
in that year but its transition period has
been extended by two years on the
back of the pandemic (Centre for Policy
Dialogue, 2021). For these and other
Commonwealth LDCs, a protracted
pandemic poses significant risks to
sustainable graduation pathways.
LDC governments and their
development partners will need to
redouble efforts to tackle existing
vulnerabilities and bridge the “resilience
gap” if they are to effectively confront
the heightened challenges emanating
from COVID-19. Such factors should
focus on developing productive
capabilities in higher-productivity
sectors and higher value-added
activities to structurally transform
their economies and make them
more resilient to future shocks.
Chapter 2 highlighted the digital divide
that Commonwealth LDCs face. It
is imperative to bridge this gap by
enhancing digital literacy, promoting
digital connectivity, investing in
digital infrastructure and ensuring
access to digital technologies.
Multilateral support can play a key role.
The multilateral trading system must
take into consideration the special
requirements of LDCs (see Chapter 4). In
turn, much can be done to enhance debt
sustainability and to de-risk, incentivise
and improve access to finance for LDCs
to help provide the resources necessary
to build back better in the wake of the
pandemic. Progress in the next decade
will be critical to ensure LDCs are not left
behind. The end of the 10-year Istanbul
Programme of Action (IPoA) in 2020
provides pause for critical reflection as
well as an opportunity to develop a newly
invigorated agenda of support for LDCs
considering the heightened challenges
resulting from COVID-19. The Fifth
United Nations Conference on LDCs,
which is scheduled for January 2022, will
look to mobilise additional international
support measures and actions for
LDCs and foster a renewed partnership
between LDCs and development
partners (Gay, 2020). At the WTO,
the LDC group of countries has also
requested a comprehensive “smooth
transition” process for graduating LDCs
under the WTO system, enabling them
to continue benefiting from some
WTO flexibilities for a period of 12 years
after graduating (WTO, 2020n).
Another area for support in terms of
trade recovery for LDCs relates to
building their capacity to take advantage
of duty-free market access for a
range of their exports in developed
economies, including Australia, Canada,
the EU, the UK and the USA, as well as
some developing countries like China
and India; the latter two countries will
be key drivers of global recovery in 2021
(IMF, 2021b). Furthermore, developed
countries can offer commercially
meaningful preferences to LDCs to
help them take advantage of the WTO
services waiver to increase and diversify
services exports. However, preference
utilisation by many LDCs is low owing
to their lack of productive capacity
and trade-enabling infrastructure
(Commonwealth Secretariat, 2015).
LDCs can draw on the WTO’s Enhanced
Integrated Framework for LDCs, the
United Nations Technology Bank for
LDCs and other bilateral and regional
Aid for Trade (AfT) programmes to
strengthen their trading capacities,
including for digital trade. This will
be important to take advantage of
existing and new trading opportunities
in other countries, like the UK post-
Brexit as well as to deepen the trade
relationships with emerging economies,
particularly China (Box 5.1).
5016_Book.indb 140 17-06-2021 08:32:29

Chapter 5: Pathways to Post-COVID Trade Recovery and Resilience Building \ 141
B O X 5 .1
C O M M O N W E A LT H T R A D E L I N K A G E S W I T H C H I N A B E YO N D T H E PA N D E M I C
Commonwealth countries’ trade linkages with China are strong and growing and have been resilient to the impacts of the COVID-19 crisis. Overall, China was the third-largest trading partner for Commonwealth countries (after the USA and the EU-28) in 2019, accounting for 12 per cent of the Commonwealth’s exports and 15 per cent of imports. During the past two decades, the share of the Commonwealth’s exports to China has risen six-fold, to 12 per cent in 2019, while the share of imports sourced from China has expanded four-fold, to 15 per cent (Figure 5.1). Given their geographical proximity, Asia-Pacific and South Asian Commonwealth countries are much more reliant on China for trade.
China is the only major economy to have registered positive growth in 2020, and its economy is projected to grow by 8.4 per cent in 2021. The spill-over effects of this growth offer numerous opportunities for Commonwealth countries to revive their trade flows. First, Commonwealth LDCs can benefit from duty-free access for a range of their exports. Second, China has ratified the Regional Comprehensive Economic Partnership three months ahead of schedule, indicating the significance it attaches to this trade agreement, which includes five Commonwealth countries. Third, China already has free trade agreements with several Commonwealth countries, and their focus should be on fully implementing these.2 Recently, the UK also expressed an interest in strengthening economic and trade links with China. For Africa, the year 2020 marked the 20th anniversary of the founding of the Forum on China-Africa Co-operation (FOCAC). The Beijing Action Plan 2019-2021 provides for considerable economic, industry, trade and investment co-operation, including establishing the China-Africa Private Sector Forum and a US$5 billion special fund to finance imports from Africa, as well as support to develop the continent’s infrastructure, including through the Belt and Road Initiative (see Box 3.5 in Chapter 3).3 Finally, Commonwealth countries from Africa to the Caribbean could also benefit from pent-up demand for tourism once international travel resumes, especially since many Chinese travellers are affluent, with considerable spending potential. Spending by Chinese travellers makes up 21 per cent of all tourism spending worldwide. In addition, Chinese travellers spend on average more per trip than tourists from any other country (UNWTO, 2017).
F I G U R E 5 . 1T H E CO M M O N W E A LT H ’ S R I S I N G T RA D E W I T H C H I N A , 2 0 0 0 – 2 0 1 9
0 100 200 300 500400
0 100 200 300 500400
11.71
8.35
5.38
1.91
EXPORTS TO CHINA (VALUE AND % OF TOTAL)
US $ billion
2019
2010
2008
2000
15.22
11.97
10.42
4.23
US $ billion
2019
2010
2008
2000
IMPORTS TO CHINA (VALUE AND % OF TOTAL)
N o te : Th e d a t a i l l u s t ra te s t h e p a tte r n o f t ra d e i n g o o d s . I t co v e rs e x p o r t s to a n d i m p o r t s f ro m m a i n l a n d C h i n a o n ly a n d e x c l u d e s H o n g Ko n g . Th e n u m b e rs o n t h e b a r i n d i c a te t ra d e s h a re .So u rce : Co m m o nwe a l t h Se c re t a r i a t ( c a l c u l a te d u s i n g d a t a f ro m U N CTA D s t a t d a t a s e t )
5016_Book.indb 141 17-06-2021 08:32:29

142 \ Commonwealth Trade Review 2021
5.4 Utilise new trading opportunities post-Brexit
The UK is a key destination for
intra-Commonwealth exports, with
considerable potential for further
expansion beyond the pandemic. On 31
January 2020, the UK formally ceased
to be a member of the EU and entered
a transition period until December of
that year. During this period, the existing
rules on trade, travel and business
between the UK and the EU continued
to apply. Trade between the UK and the
27 members of the EU is now governed
by the UK-EU Trade and Co-operation
Agreement (TCA).4 The TCA,
implemented on 1 January 2021, is a free
trade agreement (FTA) covering all goods
and limited services that leaves scope for
regulatory regimes to diverge over time.5
5.4.1 UK-Commonwealth trading relations
In 2019, Commonwealth countries’
exports to the UK were worth US$116
billion. The UK market absorbed around
13 per cent of intra-Commonwealth
goods exports and 25 per cent of
services exports. Dependence on
the UK differs significantly among
Commonwealth regions and member
countries and by sectors (Figure 5.2). For
example, many African, Caribbean and
Pacific (ACP) countries rely heavily on the
UK market for specific exports, including
beef, bananas, fresh vegetables, fish,
sugar, rum, textile and apparel products.
Collectively, the 19 sub-Saharan African
(SSA) countries rely the most on the UK
for both goods and services exports.
Belize sends one-fifth of its total goods
exports to the UK, while another eight
countries send more than 5 per cent.
More striking is the significance of the UK
market for intra-Commonwealth services
exports. Six countries trade more than
15 per cent of their total services with
the UK. Another 12 send around 10–15
per cent. Overall, small states have the
highest share for services (at around 16
per cent), which comes for the main part
through the travel and tourism sector.
Although the UK accounts for only a
small share of most Commonwealth
LDCs’ exports, its share is as high as 9
per cent for Bangladesh (mostly apparel
products), almost 4 per cent for Malawi
and over 2 per cent for Rwanda and
Tanzania. On average, 6 per cent of LDC
services exports are destined for the UK.
The UK’s trade regimes and Commonwealth imports
The UK-EU TCA provides greater clarity
for Commonwealth governments and
business on how their trade might be
affected both immediately and in the
future. There may also be opportunities
to deepen and enhance their broader
economic relationship with the UK.
The UK’s trade regimes are directly
modelled on those of the EU (Table 5.2).
Most countries with which the EU has an
economic partnership agreement (EPA)
or a FTA are covered by a UK FTA or
Bridging Mechanism. For the rest, the UK
has established a Generalised Scheme
of Preferences (GSP), which, like its EU
counterpart, has three segments that
offer better market access terms than
the WTO. These are the LDC Framework
GSP, which offers market access
equivalent to the EU’s Everything But
Arms (EBA), the Enhanced GSP regime,
modelled on the EU’s GSP+ and the
General Framework GSP for other low-
and lower-middle-income countries.
Like its EU model, the UK GSP (except
the LDC Framework) excludes many
goods, especially agricultural products.6
Countries deemed to be too competitive
for certain products are also “graduated
out” of the GSP for those products. For
example, India is graduated out of the
GSP for 2,652 tariff lines (Stevens, 2021).
The UK’s new trade agreements with
ACP countries continue to provide
duty-free and quota-free (DFQF)
market access for their exports.
However, the UK’s pursuit of future
trade deals globally could create
greater competition for ACP suppliers.
Moreover, some ACP exporters that
depend heavily on the UK market for
certain sensitive products, including
bananas and sugar (Box 5.2), have raised
concerns about the implications of
the UK’s tariff regime for their trade.
Importantly, the UK has made some
improvements to the EU regime
and there may be scope for further
reforms, including reviewing certain
standards or adopting simple and less
restrictive rules of origin. For example,
a longstanding concern of many ACP
exporters relates to the high standards
and regulations required for access to
the EU market. Many argue that some
of these regulations are unnecessarily
onerous, even protectionist (Vickers,
2018). For instance, citrus exports
from South Africa have faced more
stringent sanitary and phyto-sanitary
(SPS) conditions as a result of citrus
black spot, a harmless fungal disease.
However, from 1 April 2021, imported
citrus into Britain (not Northern Ireland)
will no longer require a SPS certificate,
while other fruits, such as guavas, kiwis
and passion fruit, are also exempt. More
broadly, the UK’s narrower range of
climatic conditions and production than
the whole of the EU provides scope to
relax onerous health checks on a wider
set of Commonwealth exports without
5016_Book.indb 142 17-06-2021 08:32:29

Chapter 5: Pathways to Post-COVID Trade Recovery and Resilience Building \ 143
B O X 5 . 2
T H E U K S U G A R M A R K E T: A S W E E T O R S T I C K Y D E A L FO R T H E A C P ?
Sugar is a major export for several Commonwealth developing countries. For example, sugar makes up just over 30 per cent of Belize’s total merchandise exports, about 20 per cent for Eswatini, 10 per cent for Mauritius and 9 percent for Fiji (Table 5.1). The UK is a traditional market for these sugar-producing countries, especially for raw sugar, which is then refined by Tate
Share (%)
2520151050
Belize
Seychelles
Mauritius
Saint Lucia
Bangladesh
Sri Lanka
Pakistan
Kenya
Cyprus
South Africa
Maldives
Malawi
Nigeria
Canada
Jamaica
Dominica
Guyana
India
Grenada
Fiji
New Zealand
Ghana
Australia
Barbados
Malta
Samoa
The Gambia
Namibia
Rwanda
Antigua and Barbuda
Mozambique
Papua New Guinea
Zambia
Trinidad and Tobago
Cameroon
Singapore
Vanuatu
Tuvalu
Malaysia
Solomon Islands
Sierra Leone
Eswatini
Botswana
Brunei Darussalam
St Kitts and Nevis
Tanzania
The Bahamas
Nauru
Uganda
St Vincent and the Grenadines
Tonga
Lesotho
Kiribati
Goods Services
N o te : Th e s h a re s re p re s e n t t h e p ro p o r t i o n o f m e rc h a n d i s e a n d s e r v i ce s e x p o r t s d e s t i n e d fo r t h e U K m a r ke t d u r i n g 2 0 1 7 - 2 0 1 9So u rce : Co m m o nwe a l t h Se c re t a r i a t ( c a l c u l a te d u s i n g U N CTA D s t a t a n d W TO - O EC D B a T I S d a t a s e t s )
F I G U R E 5 . 2S H A R E O F CO M M O N W E A LT H M E RC H A N D I S E A N D S E R V I C ES E X P O RTS TO T H E U K , 2 0 1 7 – 2 0 1 9 A V E RAG E
5016_Book.indb 143 17-06-2021 08:32:30

144 \ Commonwealth Trade Review 2021
and Lyle. Barbados sends all its raw sugar to the UK, Belize around 83 per cent and Fiji approximately 48 per cent. This is an extremely sensitive sector for these countries. It earns foreign exchange, creates jobs and sustains many livelihoods. In 2017, the EU, including the UK as a member, reformed its restricted, high-priced sugar market in line with world prices. This reduced the value of ACP sugar exports.7
The UK’s trade agreements with ACP countries continue to provide duty-free and quota-free (DFQF) market access for sugar. From 1 January 2021, the UK also implemented an annual autonomous tariff rate quota (ATQ) of 260,000 metric tonnes of raw sugar at zero tariffs (ACP-LDC Sugar Industry Group, 2020; also DIT, 2020). This raises the competitive stakes in the UK market for ACP producers because of their higher production costs compared with other producers, such as Brazil, while some global producers are also subsidised (DIT, 2020).
The UK and the EU both grant DFQF access to the ACP. However, their bilateral TCA does not provide “diagonal cumulation” provisions for ACP countries, which could affect demand for raw sugar imports from the ACP. More than 70 per cent of sugar consumption in the UK and the EU is in the form of processed food and drink, with considerable trade in these products between the UK and the EU (EPA Monitoring, 2021). Without diagonal cumulation, raw sugar imported from the ACP and refined locally will not be considered as UK-originating when contained in processed products traded between the UK and the EU. Since these products would not benefit from the preferential rules of origin, UK companies might consider using UK or EU beet sugar instead.
These developments will continue to present a challenging outlook for ACP sugar-exporting countries in maintaining sustainable sugar agriculture and agro-industry as part of their economic mix for recovery and building back better.8 It will significantly affect smallholder producers, mainly in rural areas, and create unemployment as well as having impacts on export earnings, retarding progress towards achievement of the SDGs.
Consideration should be given to finding ways of preserving the value of preferential market access to the UK sugar market for ACP sugar-producing countries. Simultaneously, these countries need to devise ways to reduce their costs and improve their efficiency, including through multilateral and bilateral AfT initiatives.
TA B L E 5 . 1T H E S I G N I F I CA N C E O F T H E U K S U G A R M A R K ET TO CO M M O N W E A LT H AC P CO U N T R I ES, 2 0 1 7 – 2 0 1 9 A V E RAG E
ACP sugar exports to the UK*
Top ACP exporters to the UK, by value
Share of sugar in total merchandise
exports (%)
Value of sugar exports to the UK
(US$ million)
Share of total sugar exports to the UK (%)
Value of raw sugar exports to the UK
(US$ million)
Share of raw sugar exports to the UK (%)
All ACP countries 0.75 164.3 8.86 128.6 11.43
Of which
1 Belize 30.91 51.8 83.21 51.8 83.21
2 South Africa 0.43 29.0 7.60 18.2 8.35
3 Fiji 8.17 28.7 48.26 28.7 48.28
4 Mauritius 9.91 20.5 10.40 14.1 17.38
5 Mozambique 3.41 20.1 11.35 9.5 20.63
6 Jamaica 0.79 5.1 37.81 1.9 30.27
7 Guyana 0.36 4.7 33.89 0.0 0.00
8 Eswatini 18.28 4.2 1.21 4.2 1.36
9 Barbados 0.07 0.2 78.28 0.1 100.00
10 Zambia 1.42 0.0 0.02 0.0 0.02
Note: * Sugar is classified as HS code 1701; raw sugar is calculated as HS 170113 and 170114.Source: Commonwealth Secretariat (calculated using WITS data)
5016_Book.indb 144 17-06-2021 08:32:30
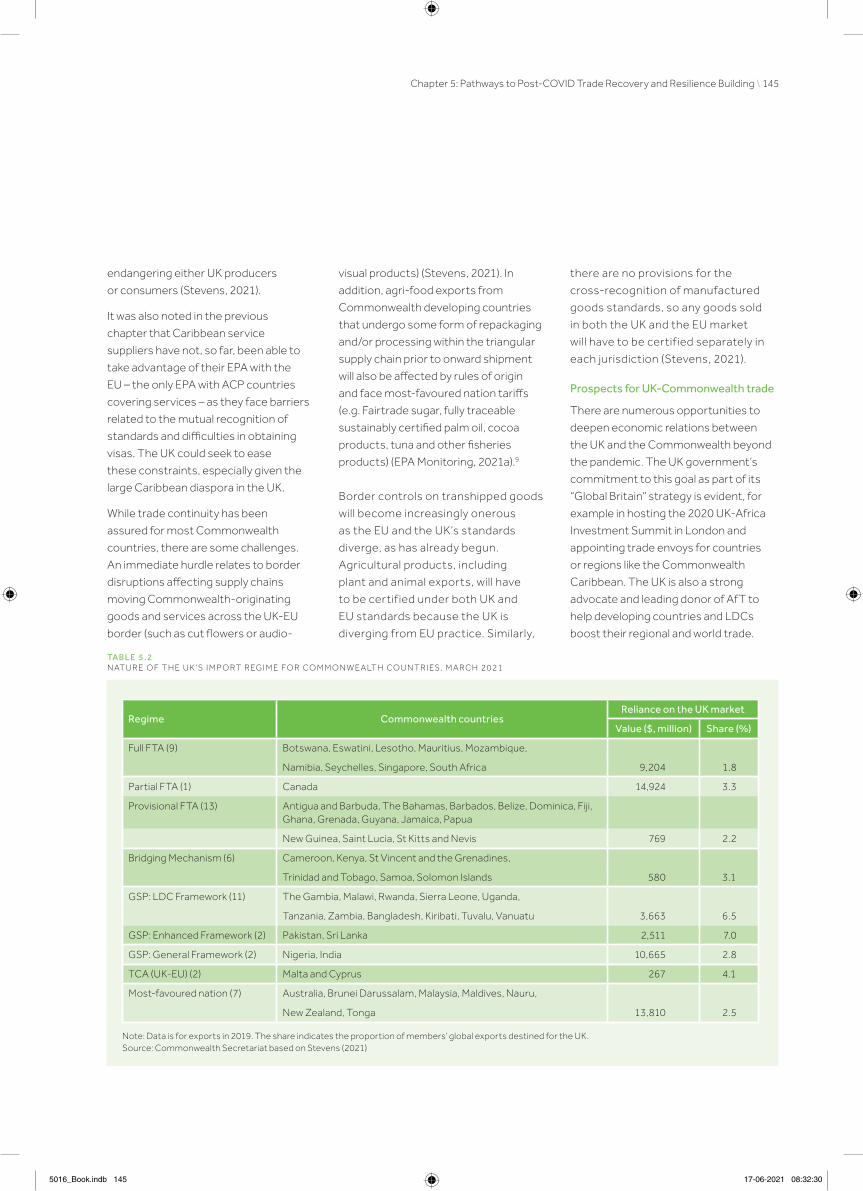
Chapter 5: Pathways to Post-COVID Trade Recovery and Resilience Building \ 145
endangering either UK producers
or consumers (Stevens, 2021).
It was also noted in the previous
chapter that Caribbean service
suppliers have not, so far, been able to
take advantage of their EPA with the
EU – the only EPA with ACP countries
covering services – as they face barriers
related to the mutual recognition of
standards and difficulties in obtaining
visas. The UK could seek to ease
these constraints, especially given the
large Caribbean diaspora in the UK.
While trade continuity has been
assured for most Commonwealth
countries, there are some challenges.
An immediate hurdle relates to border
disruptions affecting supply chains
moving Commonwealth-originating
goods and services across the UK-EU
border (such as cut flowers or audio-
visual products) (Stevens, 2021). In
addition, agri-food exports from
Commonwealth developing countries
that undergo some form of repackaging
and/or processing within the triangular
supply chain prior to onward shipment
will also be affected by rules of origin
and face most-favoured nation tariffs
(e.g. Fairtrade sugar, fully traceable
sustainably certified palm oil, cocoa
products, tuna and other fisheries
products) (EPA Monitoring, 2021a).9
Border controls on transhipped goods
will become increasingly onerous
as the EU and the UK’s standards
diverge, as has already begun.
Agricultural products, including
plant and animal exports, will have
to be certif ied under both UK and
EU standards because the UK is
diverging from EU practice. Similarly,
there are no provisions for the
cross-recognition of manufactured
goods standards, so any goods sold
in both the UK and the EU market
will have to be certif ied separately in
each jurisdiction (Stevens, 2021).
Prospects for UK-Commonwealth trade
There are numerous opportunities to
deepen economic relations between
the UK and the Commonwealth beyond
the pandemic. The UK government’s
commitment to this goal as part of its
“Global Britain” strategy is evident, for
example in hosting the 2020 UK-Africa
Investment Summit in London and
appointing trade envoys for countries
or regions like the Commonwealth
Caribbean. The UK is also a strong
advocate and leading donor of AfT to
help developing countries and LDCs
boost their regional and world trade.
Regime Commonwealth countriesReliance on the UK market
Value ($, million) Share (%)
Full FTA (9) Botswana, Eswatini, Lesotho, Mauritius, Mozambique,
Namibia, Seychelles, Singapore, South Africa 9,204 1.8
Partial FTA (1) Canada 14,924 3.3
Provisional FTA (13) Antigua and Barbuda, The Bahamas, Barbados, Belize, Dominica, Fiji, Ghana, Grenada, Guyana, Jamaica, Papua
New Guinea, Saint Lucia, St Kitts and Nevis 769 2.2
Bridging Mechanism (6) Cameroon, Kenya, St Vincent and the Grenadines,
Trinidad and Tobago, Samoa, Solomon Islands 580 3.1
GSP: LDC Framework (11) The Gambia, Malawi, Rwanda, Sierra Leone, Uganda,
Tanzania, Zambia, Bangladesh, Kiribati, Tuvalu, Vanuatu 3,663 6.5
GSP: Enhanced Framework (2) Pakistan, Sri Lanka 2,511 7.0
GSP: General Framework (2) Nigeria, India 10,665 2.8
TCA (UK-EU) (2) Malta and Cyprus 267 4.1
Most-favoured nation (7) Australia, Brunei Darussalam, Malaysia, Maldives, Nauru,
New Zealand, Tonga 13,810 2.5
Note: Data is for exports in 2019. The share indicates the proportion of members’ global exports destined for the UK.Source: Commonwealth Secretariat based on Stevens (2021)
TA B L E 5 . 2N AT U R E O F T H E U K ’ S I M P O RT R EG I M E F O R CO M M O N W E A LT H CO U N T R I ES, M A RC H 2 0 2 1
5016_Book.indb 145 17-06-2021 08:32:30
146 \ Commonwealth Trade Review 2021
Meanwhile, the creation of the Foreign,
Commonwealth & Development Office
provides a springboard to integrate all
of the UK’s diplomacy and development
efforts (HM Government, 2021). There
are further initiatives or opportunities
to boost intra-Commonwealth trade
with the UK, as introduced below.
First, the UK government aims to
complete bilateral FTAs covering 80
per cent of UK trade by 2022, which
would probably include tariff-free trade
with three Commonwealth members
– Australia, Canada and New Zealand
– as well as the EU, Japan and the USA.
Furthermore, the UK plans to accede
to the mega-regional Comprehensive
and Progressive Agreement for
Trans-Pacific Partnership (CPTPP),
discussed in Chapter 4, which includes
six Commonwealth members: Australia,
Brunei Darussalam, Canada, Malaysia,
New Zealand and Singapore. These
new trade deals have implications for
Commonwealth countries and may
require adjustment support (Box 5.3).
Other FTAs with Commonwealth
member countries are also possible.
Modelling a UK–India FTA, for example,
suggests that trade could increase
substantially (Banga, 2017).10
Second, and related to the above, the
UK can diversify some of its food trade
towards the Commonwealth. Annually,
the UK imports food worth US$65
billion and around 70 per cent of this is
sourced from the EU. FTAs with major
agricultural producers such as Australia,
Canada and New Zealand could offer
substantial scope for an increase in
Commonwealth trade (Stevens, 2021).
Third, there is an opportunity to
develop new and deeper forms of
economic co-operation across the
Commonwealth. There are already
examples like the Commonwealth
Standards Network. The UK Government
has also identified digital trade as one of
the main sources of economic growth
to recover from the pandemic. The
digital sector accounted for around 7.6
per cent of the UK economy in 2019 and
UK trade flows are increasingly digital:
an estimated two-thirds of UK services
exports and a half of UK services imports
were digitally delivered in 2018 (Sands
et al., 2021; see Chapter 2). There is the
possibility for UK agreements with other
Commonwealth countries around digital
trade, such as the planned negotiations
for a separate UK-Singapore Digital
Economy Agreement (Ciofu, 2020).
Fourth, there is considerable scope
for further co-operation in services,
where the UK is already relatively open
in trade terms but where regulatory
requirements are complex. A renewed
partnership in areas like financial
services technology could help further
develop mutually beneficial trade.
The increasing servicification of
several Commonwealth economies,
coupled with greater digitalisation,
also provides opportunities for
increasing bilateral services trade.
The UK could consider offering
commercially meaningful preferences
to LDCs in line with the WTO LDC
services waiver (Primack, 2017).
Finally, the UK is an important driver
of services exports for many tourism-
dependent ACP countries. For example,
UK arrivals are most important for
Barbados; second most important for
Saint Lucia; and third most important
for St Kitts and Nevis (Commonwealth
Secretariat, 2016). These countries
should already engage in branding and
marketing to benefit from pent-up
demand and excess savings once
international travel resumes. This
is especially important given that
UK travellers are reported to spend
seven times more than the average
tourist in the Caribbean (Global News
Matters Caribbean Research, 2016).
However, this requires setting in
place demand and supply measures
to benefit, as discussed next.
5016_Book.indb 146 17-06-2021 08:32:30

Chapter 5: Pathways to Post-COVID Trade Recovery and Resilience Building \ 147
B O X 5 . 3
P OT E N T I A L I M P L I C AT I O N S O F F U T U R E U K F TA S FO R C O M M O N W E A LT H C O U N T R I E S
Dynamic Global Trade Analysis Project (GTAP) modelling of tariff-free trade between the UK and Australia, Canada, the EU-27, Japan, New Zealand and the USA suggests these FTAs could affect many Commonwealth countries, although the effect is more pronounced for LDCs like Bangladesh, Lesotho, Malawi, Rwanda, Tanzania and Uganda (Annex 5.1).
The standard theory on the effects of any form of preferential trading agreement suggests they increase trade between members and reduce flows with third countries, leading to welfare effects for non-member countries (WTO, 2011). The UK’s FTAs, like any other trading arrangements discussed in Chapter 4, could result in a loss of preferences for non-members and expose them to competition from more efficient suppliers. Overall, countries with high export dependence on the UK – for example Bangladesh (apparel), Botswana (beef), Belize (sugar) and Kenya (tea and vegetables) – could experience a modest decline in exports and overall trade. This is because competitors among the UK’s FTA partners may displace their clothing, textiles and agricultural products and shrink their market share. There are some potential beneficiaries, like Brunei Darussalam, Malta, Nigeria, Pakistan and Zambia, which could gain marginally because their input costs are reduced as a result of the trade deals between the UK and its partners mentioned above. These trade adjustments would be gradual and could span around five years (Figure 5.3).
Looking at overall sectors, the exports of meat, textiles, leather, processed food, rubber, plastics and vehicles from the USA, Japan, New Zealand and Australia would increase significantly, with a commensurate decline in the export of commodities under heavy manufacturing, textiles, processed food, meat, chemicals, and grains and crops from Commonwealth countries into the UK. Aside from the direct effects on exports, the modelling forecasts that countries reliant on the UK market for exports, such as Belize, Botswana, Kenya, Malaysia, Namibia, Sri Lanka and Trinidad and Tobago, may be affected through reductions to their gross domestic product (GDP), output, employment and investment, although the effects are relatively small and will diminish over time.
F I G U R E 5 . 3P OT E N T I A L S H O RT- A N D M E D I U M -T E R M I M P ACTS O N CO M M O N W E A LT H CO U N T R I ES ’ E X P O RTS, 2 0 2 1 – 2 0 2 5
0.30
-0.20
-0.10
0.00
0.10
0.20
Ken
ya
Mau
ritiu
s
Bo
tsw
ana
Uga
nda
Cyp
rus
Mal
aysi
a
Pac
ific
Mal
ta
Sin
gapo
re
Trin
idad
Bel
ize
Sril
anka
So
uthA
fric
a
Indi
a
CW
SS
A
Mal
awi
Cam
ero
on
Can
ada
Mo
zam
biqu
e
Ban
glad
esh
Gha
na
Jam
aica
Nig
eria
Rw
anda
Tan
zani
a
Zam
bia
Bru
nei
Nam
ibia
Pak
ista
n
Cha
nge
(%)
2021 2022 2023 2024 2025
So u rce : G o p a l a k r i s h n a n ( 2 0 2 1 ) fo r Co m m o nwe a l t h Se c re t a r i a t
5016_Book.indb 147 17-06-2021 08:32:30
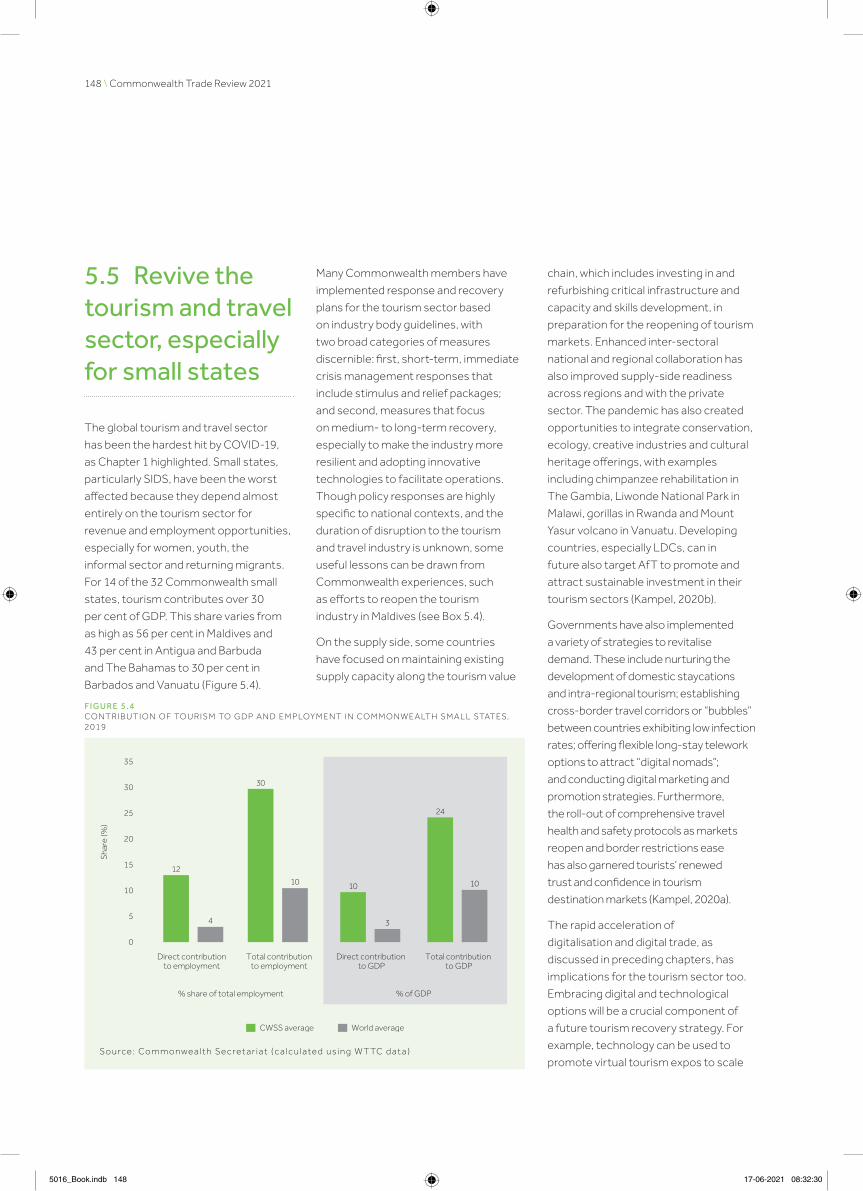
148 \ Commonwealth Trade Review 2021
5.5 Revive the tourism and travel sector, especially for small states
The global tourism and travel sector
has been the hardest hit by COVID-19,
as Chapter 1 highlighted. Small states,
particularly SIDS, have been the worst
affected because they depend almost
entirely on the tourism sector for
revenue and employment opportunities,
especially for women, youth, the
informal sector and returning migrants.
For 14 of the 32 Commonwealth small
states, tourism contributes over 30
per cent of GDP. This share varies from
as high as 56 per cent in Maldives and
43 per cent in Antigua and Barbuda
and The Bahamas to 30 per cent in
Barbados and Vanuatu (Figure 5.4).
Many Commonwealth members have
implemented response and recovery
plans for the tourism sector based
on industry body guidelines, with
two broad categories of measures
discernible: first, short-term, immediate
crisis management responses that
include stimulus and relief packages;
and second, measures that focus
on medium- to long-term recovery,
especially to make the industry more
resilient and adopting innovative
technologies to facilitate operations.
Though policy responses are highly
specific to national contexts, and the
duration of disruption to the tourism
and travel industry is unknown, some
useful lessons can be drawn from
Commonwealth experiences, such
as efforts to reopen the tourism
industry in Maldives (see Box 5.4).
On the supply side, some countries
have focused on maintaining existing
supply capacity along the tourism value
chain, which includes investing in and
refurbishing critical infrastructure and
capacity and skills development, in
preparation for the reopening of tourism
markets. Enhanced inter-sectoral
national and regional collaboration has
also improved supply-side readiness
across regions and with the private
sector. The pandemic has also created
opportunities to integrate conservation,
ecology, creative industries and cultural
heritage offerings, with examples
including chimpanzee rehabilitation in
The Gambia, Liwonde National Park in
Malawi, gorillas in Rwanda and Mount
Yasur volcano in Vanuatu. Developing
countries, especially LDCs, can in
future also target AfT to promote and
attract sustainable investment in their
tourism sectors (Kampel, 2020b).
Governments have also implemented
a variety of strategies to revitalise
demand. These include nurturing the
development of domestic staycations
and intra-regional tourism; establishing
cross-border travel corridors or “bubbles”
between countries exhibiting low infection
rates; offering flexible long-stay telework
options to attract “digital nomads”;
and conducting digital marketing and
promotion strategies. Furthermore,
the roll-out of comprehensive travel
health and safety protocols as markets
reopen and border restrictions ease
has also garnered tourists’ renewed
trust and confidence in tourism
destination markets (Kampel, 2020a).
The rapid acceleration of
digitalisation and digital trade, as
discussed in preceding chapters, has
implications for the tourism sector too.
Embracing digital and technological
options will be a crucial component of
a future tourism recovery strategy. For
example, technology can be used to
promote virtual tourism expos to scale
Sha
re (%
)
5
10
15
20
25
35
30
% share of total employment % of GDP
Direct contributionto employment
Total contributionto employment
Direct contribution to GDP
Total contribution to GDP
0
12
4
CWSS average World average
30
10 10
3
24
10
So u rce : Co m m o nwe a l t h Se c re t a r i a t ( c a l c u l a te d u s i n g W T TC d a t a )
F I G U R E 5 . 4CO N T R I B U T I O N O F TO U R I S M TO G D P A N D E M P LOY M E N T I N CO M M O N W E A LT H S M A L L STAT ES, 2 0 1 9
5016_Book.indb 148 17-06-2021 08:32:30

Chapter 5: Pathways to Post-COVID Trade Recovery and Resilience Building \ 149
up marketing, while e-commerce can
create opportunities for local tourism
suppliers accessing global customers.
More advanced robotics and Artificial
Intelligence (AI) can help streamline
travel and accommodation booking and
security processes at airports and at
other border crossings. This will enable
travel to be safer and more secure
in the event of future epidemics and
pandemics. Investing in augmented
realities can also transport individuals to
far-away escapes from their own homes,
while paying for the experience at a
fraction of the cost. Technology enabling
digital versions of vaccine passports
are already available or being
developed, although not without
controversy.11 Beyond tourism, there is
considerable scope for Commonwealth
countries to use information and
communication technologies
(ICTs) and more advanced frontier
technologies to support recovery from
the pandemic, as discussed next.
5.6 Leverage digital technologies for trade, development and competitiveness
Digitalisation and digital trade have
helped some Commonwealth countries
mitigate certain consequences of the
pandemic, as observed in the previous
chapters. While these technologies
have accelerated globally, the reality is
that many Commonwealth countries,
especially LDCs, lag behind in digital
engagement. Factors such as the
quality of digital infrastructure and
access to ICTs are increasingly driving
international competitiveness and
investment decisions, thus exerting
a growing influence on economic
performance and providing a means
to support recovery from the
pandemic. For these reasons, the
highest consideration should be
given to ensuring greater access,
affordability and usage of ICTs.
For example, the internet economy
has the potential to contribute close
B O X 5 . 4
M A L D I V E S L E A D S T H E WAY I N D R I V I N G TO U R I S M R EC O V E R Y A N D A R E T U R N TO T H E “ O L D N O R M A L”
When Maldives shut its borders in late March 2020, the impact was immediate and severe. The abrupt halt to international tourist arrivals struck to the heart of the economy, blighting the country’s largest sector. To mitigate the damage and revive the economy, the Maldivian government adopted a sequenced approach to reopening the tourism sector. This capitalised on the advantage afforded by the country’s geographically scattered islands, some of which are inhabited only by resort staff and tourists, allowing natural segregation from major towns and cities.
The reopening of the country’s borders to international travellers in July 2020 was initially confined to those visiting resorts, hotels or liveaboard boats located on otherwise uninhabited islands. Thereafter, local tourism providers and guesthouses meeting stipulated health standards were permitted to reopen on 15 October 2020. To facilitate movement between islands, special permits were provided for guesthouses and hotels situated on locally inhabited islands to accommodate transiting passengers awaiting domestic transfers.
International tourists are obliged to present a negative PCR test for COVID-19 on arrival, which must have been taken within 96 hours of departure for Maldives. Incoming travellers are also required to complete an online health declaration form within 24 hours of departure. All travellers undergo thermal screening on arrival and those not exhibiting any symptoms are exempt from quarantine restrictions and free to begin their holiday.
Some resorts on private islands are offering PCR tests to guests upon arrival, who are then required to remain in their rooms or villas until the test results are received. Tourists testing positive for COVID-19 must go into isolation and receive compensation from the resort via a refund voucher (O’Ceallaigh, 2021). Those found to be free of COVID-19 can enjoy a normal, “mask-less”, stay and move around the island as they wish.
These additional safety interventions have helped attract tourists by building confidence in the public health measures in place to prevent the spread of COVID-19. The Maldivian government introduced an app – TraceEkee – to facilitate detailed, community-driven contract tracing (Mohamed, 2020). To provide an additional layer of protection, the Ministry of Tourism has also launched a vaccination initiative to vaccinate tourism workers.
5016_Book.indb 149 17-06-2021 08:32:30

150 \ Commonwealth Trade Review 2021
to US$180 billion to Africa’s GDP by
2025, while improving productivity and
efficiencies in various sectors, including
agriculture, education, financial services,
health care and supply chains (IFC and
Google, 2020). Nine Commonwealth
SSA countries could add around $100
billion to their combined GDP by 2025 if
they intensively harness the internet.12
However, this requires extending
mobile internet and integrating digital
innovations beyond large urban cities,
helping informal workers become
more productive and empowering
micro, small and medium enterprises
(MSMEs), especially women and youth
entrepreneurs, for digital competition
(AUC and OECD, 2021). Rwanda’s
digitally led development agenda
offers much promise and provides an
inspiring example of how digitalisation
can connect and transform a country
and overcome the constraints
of being landlocked (Box 5.5).
Countries can harness digital
technology to support their economic
recovery, depending on their levels of
ICT adoption and digital engagement. In
the short to medium term, digital trade,
especially e-commerce and delivering
some services online, can provide a
pathway for mitigating several economic
B O X 5 . 5
R WA N D A E M B A R K S O N D I G I TA L LY L E D D E V E LO P M E N T
Rwanda, a landlocked LDC, is spearheading an ambitious digital agenda and, in the process, emerging as a champion for digitally led development in Africa. Since 2000, four consecutive five-year strategies have targeted different elements of digital development, beginning with the establishment of enabling institutional, legal and regulatory frameworks, along with liberalisation of the telecommunications market, to lay the groundwork for an effective ICT sector. Subsequent strategies have looked to build ICT infrastructure, improve digital service delivery and accessibility, and develop digital skills, e-government services and cyber-security capabilities. Infrastructure development is key, with considerable progress in establishing a country-wide fibre optic network, and cross-border terrestrial links to undersea cables via Kenya and Tanzania have been crucial in improving internet capacity. This has helped achieve a 10-fold increase in access to international bandwidth since 2015 (World Bank, 2020c). Significant government investments in the 4G network, coupled with rapid adoption of mobile technologies, have further improved internet access. Estimates indicate that 4G services cover at least 95 per cent of the country.13 This is significantly higher than the regional average.
Developing digital skills are being prioritised through a series of innovative partnerships and initiatives. These provide training in coding, software development and programming skills aimed at both youth and working-age Rwandan women. More broadly, the government has embedded basic digital skills into national curricula at the primary and secondary levels (World Bank, 2020c).
There are many examples of innovative uses of digital technologies to advance economic and social development priorities in Rwanda. The government is at the forefront, embracing digitalisation to provide e-government services, including through IremboGov, a one-stop online portal for digital government services, while allowing payment using mobile money.14
Digital technologies are helping facilitate trade in Rwanda. Since its introduction in 2012, the Rwanda Electronic Single Window (RESW) has reduced customs clearance times and lowered both direct and indirect trade costs.15 These are crucial improvements, given the trade-related challenges Rwanda faces as a landlocked country. Most recently, the RESW has played a vital role in keeping trade flowing during the COVID-19 pandemic, helping avoid physical contact and enabling more officials and traders to work from home (Uwamariya et al., 2020). Another digital trade-facilitating measure, the Rwanda Trade Portal, provides an online platform to access step-by-step information on transit and import and export procedures.16
Aside from trade, some of the clearest examples of the power of digitalisation can be found in Rwanda’s health care sector. Rwanda is on track to become the first country in the world with a digital-first universal primary care service, through a 10-year government collaboration with Babalyon Healthcare, a remote health care provider (Suarez, 2021).
Some initiatives in Rwanda’s health care sector employ cutting-edge digital technologies. For example, a private company, Zipline, uses drones to deliver blood and other vital medical supplies to remote areas of Rwanda. This means local hospitals do not need expensive machinery to maintain supplies of refrigerated blood and other related products.
5016_Book.indb 150 17-06-2021 08:32:30

Chapter 5: Pathways to Post-COVID Trade Recovery and Resilience Building \ 151
losses from COVID-19 and support
the opening and resumption of many
activities, although some online activity
may decline with the roll-out of vaccines
and treatments. In the longer term,
growing digital trade, investing in digital
capabilities, upskilling and training the
workforce, and harnessing some of the
frontier technologies linked to Industry
4.0 can help transform economies,
build resilience to future shocks and
better integrate sustainability into
supply chains. This section sets
out three areas – e-commerce,
financial technology (FinTech) and
frontier technologies – as potential
tools to support trade recovery.
5.6.1 E-commerce
E-commerce, simply put, refers to digitally
ordered, digitally delivered or digital
platform-enabled transactions. The
pandemic has accelerated growth of local
and cross-border e-commerce, especially
in developed countries. E-commerce in
the USA is approaching a major milestone:
in 2022, it will record its first trillion-dollar
year (Adobe Analytics, 2020). However,
as discussed in Chapter 2, readiness to
engage in e-commerce is uneven within
and between Commonwealth countries.
The experience of the pandemic
provides a strong incentive for
Commonwealth countries to invest
in developing this digital trade sector
for the domestic market as well as
international trade. E-commerce
marketplaces can potentially lower
barriers to entry, reduce transaction
costs, link informal and formal actors
across sectors and geographies, and
create new opportunities to access
markets for MSMEs and women-owned
businesses. Indeed, it is found that most
of the benefits from digitalisation flow
to traditional businesses, reinforcing
the importance for “brick and mortar”
companies of embracing digitalisation
to improve competitiveness and build
recovery and resilience (Ashton-Hart,
2020). Prior to the pandemic, the
International Trade Centre (ITC) (in
Al-Saleh, 2020) reported that four out
of five small businesses involved in
e-commerce were owned by women
compared with just one of five businesses
engaged in offline trade, suggesting
e-commerce can serve as a key vehicle
for women’s economic empowerment.
E-commerce is also important for
regional and international trade. It is
especially beneficial for businesses
and entrepreneurs in landlocked small
states and SIDS in the Commonwealth
because it can make it easier for them
to reach customers in distant markets
without incurring sunk costs to establish
a presence in other markets or use
intermediaries (Broome, 2016). There is
also evidence to suggest e-commerce
may support export diversification,17
thus potentially playing an important role
in driving productivity growth through
strengthened business-to-business and
business-to-consumer connections,
providing greater opportunities for
buyers and sellers and supporting
export diversification and economic
transformation in developing countries,
particularly LDCs. E-commerce will
increase the demand for logistic
supply chain services, thus creating
jobs for information technology,
postal and delivery services.
Leveraging e-commerce activity is thus
likely to be important for post-COVID
economic recovery. Doing so hinges
on overcoming a range of existing
barriers to e-commerce in some
countries, including lack of appropriate
regulatory frameworks and policies,
cultural barriers to e-commerce
adoption, low levels of digital skills, poor
digital connectivity, the absence of
suitable payment platforms and online
dispute resolution, inefficient customs
procedures, and costly and unreliable
last-mile postage, transportation and
logistics services (see Chapter 2).
5.6.2 Financial technology and innovation
Technology-enabled financial services
(FinTech) evolved rapidly following
the global financial crisis more than
a decade ago (MacGregor, 2019). On
the advanced side of FinTech there are
virtual currencies, blockchains, digital
wallets and tech start-ups providing a
range of innovative financial services
and solutions beyond traditional
banking. However, mobile money
and related lending and insurance
services have arguably had the greatest
transformational effect on lives and
livelihoods in developing countries and
LDCs by fostering financial inclusion,
especially for women, and extending
financial services to unbanked –
especially rural – communities. This is
especially important because the most
frequently mentioned services sector in
the SDGs is financial services (Nordås,
2021). The pandemic has underscored
the importance of FinTech solutions
for economies in lockdown. In many
countries, mobile money solutions have
made it possible to complete cashless
transactions and have facilitated
cross-border supply of services while
maintaining social distancing.
Several Commonwealth member
countries, both developed and
developing, are global leaders,
pioneers and innovators in the FinTech
sector. Four members – the UK (2nd),
Singapore (3rd), Australia (8th) and
Canada (9th) – are ranked in the top
5016_Book.indb 151 17-06-2021 08:32:31

152 \ Commonwealth Trade Review 2021
10 countries for FinTech on the 2020
Global Fintech Index City Rankings
(Findexable, 2019). Two SSA countries,
South Africa (37th) and Kenya (42nd),
where M-Pesa has led the mobile money
revolution, are ranked in the top 50,
with Nigeria (52nd) a major player too.
Faced with the prospect of
an increasingly digital future,
Commonwealth countries need to
develop and strengthen partnerships
with the private sector, including
young entrepreneurs and tech start-
ups, to accelerate the provision of
financial services in new and inclusive
ways, including agritech and trade
finance to help economic recovery.
Commonwealth countries can consider
“regulatory sandbox” approaches to
experiment with innovative financial
products or services, while pan-
Commonwealth collaboration through
“innovation hubs” could deliver great
gains (Rutherford and Zaman, 2017).
The Commonwealth Secretariat’s
FinTech Toolkit also provides a useful
resource for countries to draw on as
they look to build FinTech capabilities.
5.6.3 Frontier technologies
The rapid development and deployment
of new “frontier technologies”,
sometimes called Industry 4.0, hold
considerable promise and potential
to help drive economic recovery
and pursue the SDGs (UNCTAD,
2021b). However, there is also a risk
that these technologies could leave
most developing countries and
LDCs behind, further widening the
digital divide discussed in Chapter 2.
UNCTAD (2021b) identifies 11 frontier
technologies – namely, AI, the Internet
of Things, big data, blockchain, 5G, 3D
printing, robotics, drones, gene editing,
nanotechnology and solar photovoltaic
– which represent an estimated
US$350 billion market, potentially
growing to over $3.2 trillion by 2025.
The changing nature and composition of
global trade and supply chains, and the
implications for countries’ comparative
advantage, were highlighted in the
previous chapter. For example,
intensification and massification of 3D
printing could by some estimates reduce
world trade as much as 40 per cent
by 2040 (ING, 2017). Many developing
countries and LDCs have therefore
raised legitimate concerns about the
implications of automation, robotics
and 3D printing for manufacturing
capacity, labour markets and livelihoods.
Generally, technological progress could
affect jobs in the Commonwealth and
globally in at least three ways. First, it
induces both increased and decreased
demand for labour. There are small
– and possibly positive – effects of
enabling technologies on aggregate
labour demand and employment, but
also evidence of negative effects of
replacing technologies, with costs often
disproportionately borne by certain
groups or communities in the forms
of declining incomes or job losses,
especially for low-skilled occupations
that can be “automated” away (WTO,
2017). Second, it is positively correlated
with labour productivity, meaning jobs
that leverage digitisation generate more
productivity, and these same jobs can
readily be performed remotely, which
has been essential as a result of the
pandemic (Ashton-Hart, 2020). Third,
its gains for developing countries – from
jobs to trade – will be more pronounced
the faster they catch up technologically.
Bekkers et al. (2021) present evidence
that technological change could
boost developing countries’ trade
growth by 2.5 percentage points
per annum by 2030, owing to falling
trade costs and more intensive use
of ICT services. The implications
are unclear for more technologically
constrained countries, especially
LDCs, many of which still aspire to
the traditional path to development
of low-cost manufacturing
exports to global markets.
Many Commonwealth members have
made good progress harnessing
some of these frontier technologies
to develop their agriculture, energy,
ocean and tourism sectors, among
others (Commonwealth Secretariat,
2018a). However, most lack the
digital infrastructure, capabilities and
workforce skills to use, adopt and adapt
frontier technologies, suggesting
the need for significant investment in
digitalisation. Overall, Commonwealth
countries score lower than the global
average on the new United Nations
Conference on Trade and Development
(UNCTAD) Readiness for Frontier
Technologies Index for 2019 (see
Figure 5.5).18 Only two members, the
UK (0.96) and Singapore (0.95), are
ranked in the top five places on the
Index, together with the USA (1.00),
Switzerland (0.97) and Sweden (0.96).
Asian Commonwealth members score
the highest, on average, with Singapore,
Malaysia, India and Brunei Darussalam
above both the Commonwealth and the
global averages. India over-performs
relative to its GDP, largely because of
its research and development (R&D)
capabilities and abundance of skilled
human resources (UNCTAD, 2021b).
5016_Book.indb 152 17-06-2021 08:32:31

Chapter 5: Pathways to Post-COVID Trade Recovery and Resilience Building \ 153
Two SSA members, South Africa and
Mauritius, score higher than both the
global and Commonwealth averages,
and this corresponds with their
relatively more developed ICT services
sectors. Overall, the Caribbean SIDS
score higher than Africa, with Barbados,
Trinidad and Tobago and The Bahamas
above the global and Commonwealth
averages. The Index starkly highlights
that this new technology revolution
risks leaving behind LDCs. These
countries need urgent investment
to bridge their digital infrastructural
gaps and support to develop
forward-looking science, technology
and innovation policy frameworks
(UNCTAD, 2020d; see Chapter 2). For
developing countries more broadly,
the highest consideration should
be given to the continued pursuit of
structural economic transformation
and better alignment of science,
technology and innovation policies with
industrial policies (UNCTAD, 2021b).
These frontier technologies and other
ICTs are fuelled by the flow and transfer
of data, both within and across national
borders, and would require open digital
markets to thrive (Elms, 2020). The next
section examines some of the regulatory
frameworks for digital trade at the
national, regional and multilateral levels.
5.7 Develop effective frameworks for governing digital trade
While the digital economy, including
digital trade, presents many
opportunities for Commonwealth
countries, as discussed above and
in earlier chapters, this requires an
appropriate and enabling regulatory
1
0.8
0.7
0.6
0.5
0
0.1
0.2
0.3
0.4
UK
Aus
tral
ia
Can
ada
New
Zea
land
Cyp
rus
Mal
ta
So
uth
Afr
ica
Mau
ritiu
s
Nam
ibia
Gha
na
Ken
ya
Esw
atin
i
Bo
tsw
ana
Nig
eria
Uga
nda
Cam
ero
on
Rw
anda
Zam
bia
Mal
awi
Tan
zani
a
Mo
zam
biqu
e
Sie
rra
Leo
ne
The
Gam
bia
Sin
gapo
re
Mal
aysi
a
Indi
a
Bru
nei D
arus
sala
m
Sri
Lank
a
Ban
glad
esh
Mal
dive
s
Pak
ista
n
Bar
bado
s
Trin
idad
and
To
bago
The
Bah
amas
Sai
nt L
ucia
Bel
ize
Jam
aica
Guy
ana
St V
ince
nt a
nd th
e G
rena
dine
s
Fiji
Pap
ua N
ew G
uine
a
Commonwealth average Global average
Fro
ntie
r tec
hno
logi
es in
dex
(Inde
x =
1)
Developed Africa Asia CaribbeanSIDS
PacificSIDS
0.9
N o te s : I n c l u d e s 4 1 Co m m o nwe a l t h co u n t r i e s b a s e d o n d a t a a v a i l a b i l i ty .So u rce : Co m m o nwe a l t h Se c re t a r i a t ( c a l c u l a te d u s i n g U N CTA D d a t a )
F I G U R E 5 . 5CO M M O N W E A LT H CO U N T R I ES ’ P E R F O R M A N C E O N T H E R E A D I N ESS F O R F RO N T I E R T EC H N O LO G I ES I N D E X , B Y CO U N T RY A N D R EG I O N
5016_Book.indb 153 17-06-2021 08:32:31

154 \ Commonwealth Trade Review 2021
system to operate, evolve and
flourish. At the heart of the digital
economy are the internet and data,
which is stored and processed and
flows across national borders. This
requires a clear set of policies and
regulations governing areas like data
protection and privacy, data processing
and localisation, cyber-security,
e-transactions and digital signatures,
and consumer protection (Banga and
Raga, 2021). While Commonwealth
developed countries have implemented
most of these, many developing
countries, especially SSA countries
and small states, still lag in terms of
legislative or regulatory progress
in this area (Ashton-Hart, 2020).
Many Commonwealth countries
are engaged in efforts to develop,
co-operate, co-ordinate or harmonise
rules and standards for digital trade
through bilateral or regional trade deals
and initiatives at the WTO. Around 60
per cent of all regional trade agreements
(RTAs) concluded between 2010
and 2018 now contain digital trade
provisions (Willemyns, 2020). The USA
and China, together with the EU, have
also developed different regulatory
models in this area, given their large
digital firms and interests (Gao, 2020).
Of the recent mega-RTAs discussed in
Chapter 4, the CPTPP and the Regional
Comprehensive Economic Partnership
include digital trade chapters, albeit
with different levels of ambition, while
the African Continental Free Trade
Area is scheduled to include a protocol
on e-commerce in subsequent
negotiations. This presents a unique
opportunity for the Commonwealth’s
19 SSA members and other African
countries to develop common rules
on e-commerce and harmonise digital
economy regulations. The Digital
Economy Partnership Agreement
involving Commonwealth members
New Zealand and Singapore is regarded
by some as a model for next generation
agreements in this area (Box 5.6).
There has been less progress on
rule-making at the multilateral level, as
noted earlier in this chapter. The WTO
Work Programme on E-Commerce,
established in 1998, allows for structured
discussions on all trade-related issues
linked to e-commerce and aspects
concerning the moratorium on
imposing customs duties on electronic
transmissions.19 In December 2017,
71 WTO members announced a
Joint Statement Initiative on trade-
related aspects of e-commerce and
subsequently launched plurilateral
negotiations, which have been open to
all WTO members. In December 2020,
the now-86 participants agreed on a
consolidated negotiating text addressing
five broad issues: enabling e-commerce,
openness, trust, telecommunications
and market access, as well as cross-
cutting issues (Nordås, 2021). They
aspire to achieve a multilateral outcome
around these issues at MC12. Many
other WTO members are focusing
their efforts on the existing WTO
Work Programme and developing
their domestic capacity for digital
trade and tackling the digital divide.
The broader digital economy is
anticipated to accelerate beyond the
pandemic, bringing together a range
of issues in cross-border settings,
including digital trade, services,
competition and taxation (customs
duties on e-commerce and digital
services taxes) (Elms, 2020; Sands
et al., 2021). This will require greater
regional and global coherence in
rules and regulations for goods and
services. The policy landscape for digital
services, especially across borders, is
rapidly evolving, with implications for
negotiating commitments on trade in
services under the WTO and other trade
agreements (Anuradha, 2019; Nordås,
2021). For example, Chapter 1 examined
switching of modes for delivering
services during the pandemic owing
to social distancing rules. However,
digitalisation also enables services
like road transport, construction
and engineering, distribution and
retail and possibly even tourism to
be supplied abroad through Mode 1,
which involves cross-border supply
enabled through online or digital
means. With these developments
in mind, governments may consider
ways of improving co-operation and
co-ordination to reduce regulatory
fragmentation, initially as part of
deeper regional integration processes,
discussed in the previous chapter. For
example, regional online payments
systems and harmonised rules for
data and privacy can facilitate cross-
border trade through e-commerce
platforms. To strengthen developing
countries’ capacity for digital trade, the
international community could consider
allocating additional AfT specifically to
the digital sector, as discussed next.
5016_Book.indb 154 17-06-2021 08:32:31

Chapter 5: Pathways to Post-COVID Trade Recovery and Resilience Building \ 155
B O X 5 . 6
T H E D I G I TA L EC O N O M Y PA R T N E R S H I P A G R E E M E N T – A M O D E L FO R T H E F U T U R E ?
The Digital Economy Partnership Agreement (DEPA) between Chile, New Zealand and Singapore entered into force for New Zealand and Singapore on 7 January 2021 (see Chapter 4). It seeks to address barriers to digital trade between these countries and, potentially, other like-minded partners. It recognises the importance of the digital economy in promoting inclusive economic growth and focuses on the potential for digital technologies to enhance productivity, support innovation and new product creation, and improve market access (Kumar et al., 2020). As the most ambitious agreement of its kind, it provides a possible template to facilitate the growth of digital trade among like-minded Commonwealth developed and developing countries.
TA B L E 5 . 3D E P A K EY P O L I C Y A R E AS
Issue Highlights and key areas of mutual consideration or collaboration
Business and consumer trust • Laws and regulations relating to unsolicited commercial electronic messages• Online consumer protection laws or regulations• Principles on access to and use of the internet
Business and trade facilitation • Paperless trading, e-invoicing across borders and e-payments• Mutual recognition of electronic documents• Consistency between legal frameworks governing electronic transactions
and internationally developed model frameworks• Streamlined customs procedures for parcels and express shipments• Secure interconnection of single windows in line with WTO trade facilitation agreements• Open standards in the governance and exchange of data
Co-operation and small and medium enterprises (SMEs)
• Enhancing trade and investment opportunities for SMEs in the digital economy• Country websites with DEPA information for SMEs• Annual digital SME dialogue
Data issues • Legal frameworks to protect personal information• Compatible and interoperable systems for cross-border transfer of information by electronic means
Digital identities • Aligning approaches and standards for digital identities to foster technical interoperability and increase connectivity
• Sharing best practices on digital identity policies and regulations, technical implementation, security standards and user adoption
Digital inclusion • Sharing experiences and best practices to promote inclusive and sustainable development and address barriers to accessing opportunities in the digital economy
• Methods and procedures for the collection of disaggregated data on inclusion
Emerging trends and technologies
• Promoting FinTech• Developing governance frameworks to support ethical, safe and responsible use of AI technologies• Digitisation of government procurement processes• Competition policy in digital markets
Infrastructure • Internet access• Ensuring content is freely available through different devices
Innovation and the digital economy
• Framework for future work on data-sharing projects• Promotion of open government data
Intellectual property • Protection and enforcement of intellectual property to promote technological innovation
Treatment of digital products and related issues
• Customs duties on digital products and ICT products that use cryptography
• Equal regulatory treatment for digital products created domestically and offshore
Wider trust environment • Considerations relating to cyber-security
• Building capabilities of national entities responsible for computer security incident response
5016_Book.indb 155 17-06-2021 08:32:31

156 \ Commonwealth Trade Review 2021
5.8 Develop a newly invigorated Aid for Digital Trade initiative
Commonwealth developed countries
such as Australia, Canada, New Zealand
and the UK have been strong advocates
and leading donors of AfT to help
developing countries with production
and supply-side capacity-building. Over
the past decade and a half, AfT has made
an important contribution to addressing
some of the constraints in these areas
that have prevented developing countries
from participating in and benefiting from
international trade. Within the realm of
the digital economy, early attention in
AfT initiatives was confined mostly to
developing network communications
infrastructure or digitising import and
export procedures as part of efforts
to modernise customs (Lacey, 2021).
By 2017, however, issues of digital
connectivity, e-commerce and readiness
to engage in the digital economy were
more firmly on the agenda of the AfT
community, as evident in an increasing
array of AfT interventions promoting
online connectivity and aspects of digital
inclusiveness. This coincided with efforts
by some countries to launch negotiations
on e-commerce ahead of WTO MC11, as
well as greater attention to e-commerce
and digital trade in bilateral, regional
and mega-regional FTAs (ibid.).
Data in the Organisation for Economic
Co-operation and Development (OECD)
Credit Reporting System reveals
significant AfT disbursements benefiting
ICT. In 2018, African Commonwealth
countries received more than US$36
million in AfT resources for ICT,
and seven Asian members accrued
about $40 million, mostly through
contributions from International
Development Association donors and
Development Assistance Committee
(DAC) members (Lacey, 2021). Beyond
this, however, it is difficult to disentangle
disbursements specifically supporting
digitalisation and digital trade from
those benefiting other unrelated
aspects in available data on AfT flows.
More disaggregated data is needed
to better understand the extent to
which AfT currently supports firms and
countries to engage in e-commerce
and participate in digital trade (ibid.).
There is a compelling case for
directing more donor support to
enhance developing countries’
participation in digital trade. AfT
mechanisms are well suited to a
digital focus and likely to produce
large impacts in a short period of time
and through an efficient allocation of
development resources. In a study
for the Commonwealth Secretariat,
Lacey (2021) suggests that a newly
invigorated Aid for Digital Trade agenda
could initially focus on four areas:
1. Infrastructure. As with broader
infrastructure development projects
under AfT, interventions to develop
digital infrastructure are well suited
to Aid for Digital Trade programmes
targeting capacity-building and
technical assistance.
2. Digital skills and adoption. Empowering
individuals, consumers, entrepreneurs
and businesses with digital skills
is key to ensuring inclusive digital
transformation, as is facilitating access
to and uptake of digital technologies.
Aid for Digital Trade can help
Commonwealth governments develop
supportive policy and regulatory
environments that empower citizens
and firms to benefit from the digital
economy and digital trade.
3. E-government. Aid for Digital Trade
can help fund the costs incurred
The Agreement provides a platform for the parties to discuss emerging digital trade-related issues and seek ways to support interoperability between digital systems within the broader digital economy. While emphasising mutual collaboration, it also recognises the importance of domestic policies and regulations and retains flexibility for the parties to adapt the rules to their local conditions (Elms, 2020). The DEPA covers several policy areas spanning an array of issues related to digital trade and the digital economy (summarised in Table 5.3).
The DEPA is expected to evolve over time as new technologies emerge and new challenges arise in the digital economy. This creates scope to emulate and refine the agreement when considering the expansion of the digital economy in other Commonwealth countries. Canada has expressed an interest in potentially joining the agreement and recently launched public consultations on the matter (Global Affairs Canada, 2021). It is anticipated that membership in the DEPA will grow as countries look to collaborate to help their citizens and businesses benefit from digital trade and adapt to emerging technologies.
5016_Book.indb 156 17-06-2021 08:32:31

Chapter 5: Pathways to Post-COVID Trade Recovery and Resilience Building \ 157
when developing and rolling out
digital government services that
improve the ease of doing business in
Commonwealth countries, while also
supporting the adoption of digital and
online systems.
4. Financial inclusion. Digital technologies
and platforms play an increasingly
important role in enabling access to
financial services and broadening
financial inclusion. FinTech and digital
financial services (e.g. mobile money)
are well suited to supporting cross-
border e-commerce and digital trade
transactions, and assistance for the
development and adoption of such
innovations could be mainstreamed
into Aid for Digital Trade activities.
A dedicated Aid for Digital Trade
agenda provides an opportunity to
mainstream support for enhanced
digital connectivity and adoption
into AfT as part of a comprehensive
approach to inclusive digital
transformation. This can play a
central role in helping developing
Commonwealth countries harness
the manifold development gains from
digital trade. However, to maximise
the impact of this support, donors
must ensure that any Aid for Digital
Trade is provided on top of existing
official development assistance and
AfT flows. Such additionality will ensure
any new Aid for Digital Trade agenda
does not simply invoke a reallocation of
existing aid resources from non-digital
to digital sectors, which would only
serve to weaken much-needed existing
support for developing countries’ trade.
This new initiative could also be used
to assist developing countries and
LDCs with digitalising their customs
and border processes and building
capacity in adopting more paperless
trade solutions, as discussed next.
5.9 Digitise trade facilitation and strive for paperless trade
International trade still relies on
heavily paper-based processes, with
an estimated four billion documents
circulating in the trade system. This
imposes time, cost and handling
inefficiencies for all exporters, but
especially MSMEs in Commonwealth
developing regions. For example, it is
reported that each shipment of roses
from Kenya to Rotterdam involves a
stack of paper 25 cm high (MacGregor,
2019). Even with some automation, out-
dated laws and absence of standards
create challenges for business.20
As countries strive to build back
better and support trade recovery,
an important lesson lies in the
advantages afforded by digitising
customs and border procedures
and moving significantly towards
paperless trade. This would result
in minimal physical proximity and
interaction between customs officials
and traders, fewer paper document
exchanges and savings of time and
cost. For example, it was previously
estimated that a 10 per cent reduction
in the costs incurred for a good
to exit a Commonwealth member
country was associated with 7.4 per
cent increase in their world exports,
which is higher than the global gain of
6.8 per cent, on average. The same
reduction in red tape corresponds
with a 5 per cent increase in intra-
Commonwealth exports, on average
(Commonwealth Secretariat, 2018a).
It was highlighted in Chapter 4 that
48 of the Commonwealth’s 50 WTO
members have ratified the WTO’s
Trade Facilitation Agreement (TFA). The
agreement obliges members to deploy
a national single window and to use ICT
to the “extent practicable” to realise
this, drawing on the TFA Facility and
other capacity support to develop this
infrastructure.21 Many Commonwealth
developing countries, including some
LDCs, are already implementing such
facilities. However, countries can
strive to go further by exploring or
adopting paperless trade solutions
that leverage digitalisation, including
blockchains and AI, and ultimately “Rules
as Code”, which translates regulations
to simple, business-friendly language
that is readable by both humans
and machines (Atkinson, 2020).
In response to COVID-19, many
governments temporarily implemented
a range of digital trade facilitating
measures to streamline processes for
clearing goods through borders (see
Chapter 4). These included accepting
digital trade-related documents
over physical copies, provisions for
electronically lodging documents in
advance, enabling electronic payment
of taxes and duties, allowing the use
of digital certificates and signatures,
introducing automated processing
of trade declarations, and deploying
electronic pre-arrival processing (OECD,
2020f). Significant gains can be made,
and sustained, if these temporary
digital trade facilitating measures
are made permanent post-COVID.
Based on a 2019 United Nations
survey,22 most Commonwealth
countries are making good progress
with implementing paperless trade,
with developed country members (77
per cent) and Asian members (68.5
5016_Book.indb 157 17-06-2021 08:32:31

158 \ Commonwealth Trade Review 2021
per cent) well above the world average
implementation rate of 61 per cent,
while the nine African members (57.2
per cent)23 included in the survey are not
far off. Their progress is likely to have
accelerated in 2020 with the measures
introduced in response to the pandemic.
By region, the Pacific islands, including
Commonwealth member countries,
have the most potential to transform
their trade facilitation measures
using digital technology. For example,
Australia recently partnered with
Vanuatu to automate SPS certificates,
reducing the application process
average time to as little as 10 minutes.
A so-called TFA-Plus approach involves
more advanced cross-border paperless
trade measures such as specific legal
frameworks for electronic transactions
(e.g. e-commerce law) and the use of
electronic SPS certificates (e-phyto)
to support agricultural trade between
countries (Atkinson and Stevens, 2020).
While implementing cross-border
paperless trade is extremely challenging
– the average global implementation
rate is 36 per cent – there is scope to
start building capacity, investing in
modern ICT systems and digitalising
supply chains. Improvements to
digital infrastructure, connectivity and
skills, alongside greater international
co-operation and more integrated
legal and institutional frameworks,
are required in many Commonwealth
countries in order to realise the
gains from successfully expanding
cross-border paperless trade.
For example, the Framework Agreement
on Facilitation of Cross-Border Paperless
Trade in Asia and the Pacific entered into
force in February 2021. It is estimated
that Bangladesh, having ratified this
agreement, could reduce trade costs
by 33 per cent, amounting to a potential
annual saving of more than US$700
million, if it implements the WTO TFA
together with cross-border paperless
trade (Hyun Kim, 2019). In the same
region, Singapore (72 per cent), Malaysia
(56 per cent) and India (55.6 per cent)
score high for cross-border paperless
trade, far above the global average.
Singapore stands out for digitising trade,
including adopting the United Nations
Commission on International Trade Law
(UNCITRAL) Model Law on Electronic
Transferable Records and spearheading
implementation of the blockchain-based
maritime trade platform TradeTrust.
5.10 Promote sustainable trade and enable a more circular economy
The post-COVID recovery is an
opportunity for Commonwealth
countries to make progress on the
SDGs, but especially SDG 12 – namely,
ensuring sustainable consumption
and production – including through
trade policy and trade agreements
and promoting circular economy
principles, where economies are less
resource-intensive, lower-carbon and
less wasteful (Yamaguchi, 2021).
Linked to this, there is an opportunity to
instil greater resilience in industries and
supply chains to enable them to bounce
back better. Without such measures,
the recovery period could be longer,
more polluting and less beneficial to
economies, society and the natural
environment. There is a risk of locking
the future into unsustainable models
that are less resilient and more exposed
to future shocks, whether economic,
epidemiologic or environmental (Escaith
et al., 2020). This requires partnerships
between governments, businesses
and civil society to develop policy
frameworks and strategies nationally,
regionally and pan-Commonwealth
to promote a more inclusive, resilient
and sustainable recovery, including by
harnessing digitalisation (Box 5.7).
The adoption of digital technologies
can support this transition to
sustainable growth and development,
the creation of green jobs, the
generation of renewable energy and
strengthened regional and local supply
chains. For example, blockchains
can be used to seamlessly integrate
sustainability attributes of products,
such as CO2 footprints and plastic
content, leading to lower waste,
better value realisation and higher
investment in compliance (MacGregor,
2019). Amid the COVID-19 accelerated
push towards digitalisation, countries
should also look to harness digital
technologies to enhance agricultural
and fisheries productivity and boost
yields during and after the COVID-19
recovery phase.24 This can help
improve the long-term sustainability
of agriculture and fisheries sectors
5016_Book.indb 158 17-06-2021 08:32:31

Chapter 5: Pathways to Post-COVID Trade Recovery and Resilience Building \ 159
B O X 5 .7
C O M M O N W E A LT H C O N N EC T I V I T Y A G E N D A I N I T I AT I V E S 2 0 21
Commonwealth Leaders adopted the Commonwealth Connectivity Agenda (CCA) at the Commonwealth Heads of Government Meeting (CHOGM) in April 2018, with a view to boosting trade and investment links across the Commonwealth and raising intra-Commonwealth trade to US$2 trillion by 2030. The CCA is structured around five clusters/working groups, each of which is chaired by a member country and based on voluntary, opt-in participation by members.
The Digital Connectivity Cluster focuses on digital transformation and the digital economy. Forthcoming specialised deep dive sessions will focus on digitising trade facilitation as well as ICT infrastructure development policy, which aims to support data innovation and digital trade. These sessions will analyse critical issues and promote dialogue on creating an enabling environment for digital trade facilitation.
The CCA is also developing several tools to facilitate national policy-making and economic development. Recognising the need to foster digital industrial development, the CCA is developing a policy-maker’s guide to Manufacturing 4.0. This practical tool will assist policy-makers to better understand the implications of Manufacturing 4.0 for their economies, and how to develop appropriate digital industrial policy to capitalise on new opportunities. To address digital skills gaps, the CCA is also producing a series of Youth Digital Skills Strategies to assist Commonwealth governments and policy-makers in implementing or upgrading their institutional capacity to deliver youth digital skills training.
The affordability, access and provision of infrastructure (hard and soft) are critical for economic development. The Physical Connectivity Cluster has been working with members to address these issues. Since the pilot phase of the CCA programme, members have shared knowledge and experience on critical infrastructure needs. The members of the cluster have also developed the Agreed Principles on Sustainable Investment in digital infrastructure, which identifies six critical areas for action. With the acceleration of digitalisation as a result of the pandemic, issues in relation to digital infrastructure and the digital divide, as discussed in this chapter, remain priorities for the cluster. Elements of sustainable and inclusive development are further mainstreamed into the work of the cluster and knowledge products have been developed. During 2020, members of the cluster, in collaboration with the World Bank and the Commonwealth Secretariat, provided training on the Infrastructure Prioritisation Framework. As the CCA moves into the implementation phase post-2021 CHOGM, these initiatives will be extended through online modes of training along with other technical areas of training in relation to digital infrastructure.
The Supply Side Cluster provides critical foundational support for connectivity within sectors. While digitalisation is seen as a game changer for transforming smallholder agriculture and fisheries, in many cases a common understanding of digital agriculture/fisheries is lacking. The Supply Side Cluster is facilitating the framing of digital agriculture and fisheries in the Commonwealth and has launched a Business Development Service Capacity Building activity for Agricultural, Fisheries, and Digital MSMEs with the goal of supporting the uptake of digitalisation within the sectors.
All the above initiatives serve to advance knowledge-sharing and capacity-building among the Commonwealth’s member countries. They also aim to foster greater resilience in the wake of the COVID-19 pandemic, which, as this chapter has demonstrated, underscores the urgency for members to develop their digital economies.
5016_Book.indb 159 17-06-2021 08:32:31

160 \ Commonwealth Trade Review 2021
in Commonwealth countries but will
require targeted interventions to
ensure farmers and other participants
along the value chain are adequately
prepared to deal with the pace of
change and harness technological and
digital farming solutions effectively.
There are already some excellent
examples of Commonwealth countries
successfully using digital technologies
to move towards more sustainable use
of ocean resources (Commonwealth
Secretariat, 2020). Many fisheries
have turned to technology to ensure
sustainability. Increased reporting and
sharing of information, data-driven
subsidies and tariff policies, more
accurate tracking and regulation
of all fishing (especially IUU fishing)
through satellites and drones, and
increased national and international
collaboration have all contributed
to the optimisation of the current
global fleet (Christiani et al., 2019).
5.11 Conclusion and way forward
This chapter has proposed 10 inter-
related policy areas as possible pathways
towards recovery in Commonwealth
trade. The Commonwealth’s diverse
members will face varied opportunities
and challenges and follow multiple
tracks based on the structure of
their economies, the composition
of their exports and their inherent
features and vulnerabilities, from
small states to LDCs, and determined
by global economic prospects over
the next few years (see Chapter 1).
Trade is the economic lifeblood of
the Commonwealth, and revitalising
and expanding these flows of goods,
services and people is indispensable
for economic recovery and achieving
the SDGs. Table 5.4 summarises
the main policy actions, which are
framed overall by the importance of
ensuring inclusive trade for women
and youth and especially promoting
women’s economic empowerment.
Taken together, these inter-related
measures provide a set of pathways
towards recovery in Commonwealth
trade in a more digital world. As
the world begins to tide over the
COVID-19 pandemic, Commonwealth
countries can look to use their global
and intra-Commonwealth trade as
essential tools for building back better
and promoting a more inclusive,
resilient and sustainable future.
Policy area Actions
Strengthen and reform the multilateral trading system
• Improve monitoring of trade responses to COVID-19, especially vaccine distribution, and strengthen disciplines on export restrictions
• Achieve a multilateral outcome at WTO MC12 on fisheries subsidies and advance multilateral co-operation on PSH and e-commerce
• Resolve the WTO AB impasse to ensure a functional DSU• Pursue multilateral initiatives and adopt concrete measures for mutual supportiveness between
trade and environment, especially for plastics
Boost regional trade and co-operation
• Implement existing and new trade agreements, including by adopting a whole-of-government approach and improving awareness of domestic stakeholders, especially MSMEs
• Examine scope for rationalising tariffs and rules of origin and facilitating trade, especially for medical equipment, food products and other essential goods
• Enhance co-operation on non-tariff measures• Improve trade-enabling cross-border transport infrastructure• Develop regional value chains in goods and services• Strengthen regional mechanisms and provisions in RTAs to enable co-operation in future crises
TA B L E 5 . 4P O L I C Y A R E AS F O R R E V I TA L I S I N G CO M M O N W E A LT H T RA D E
(Continued)
5016_Book.indb 160 17-06-2021 08:32:31
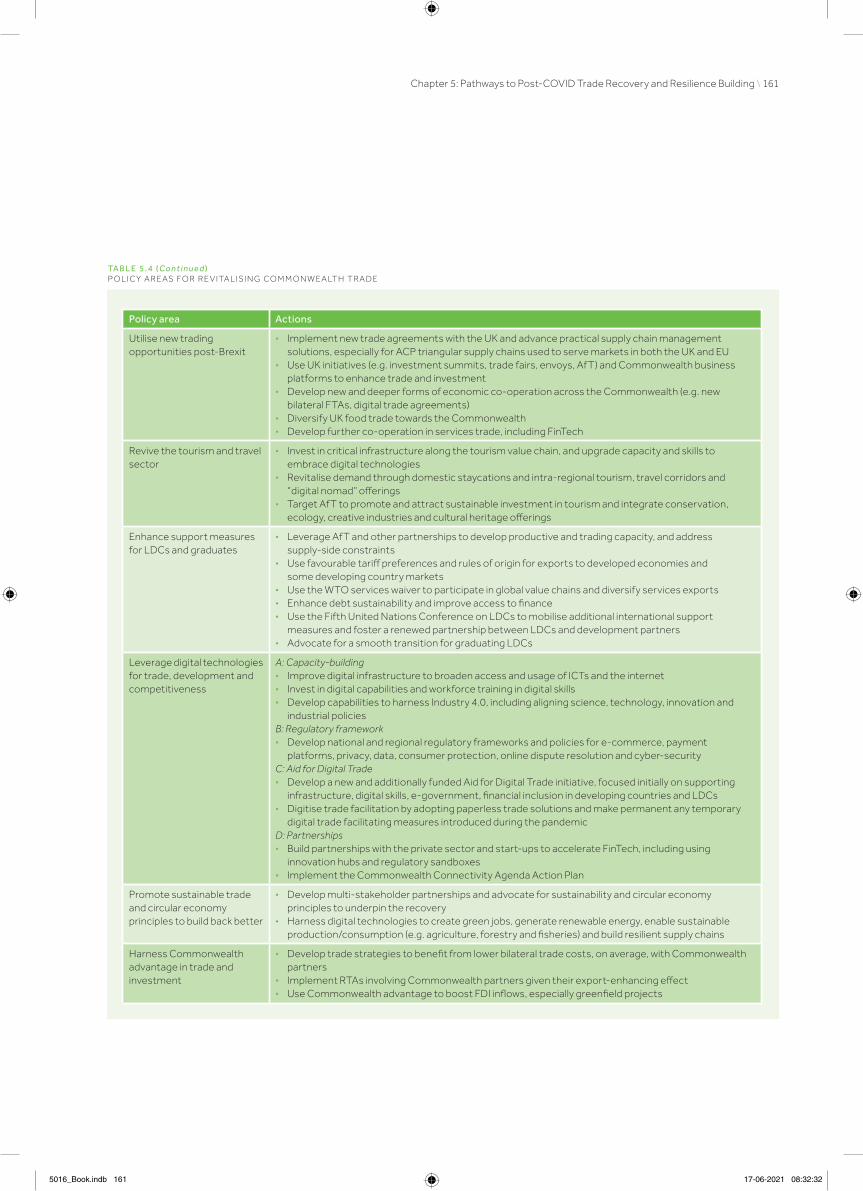
Chapter 5: Pathways to Post-COVID Trade Recovery and Resilience Building \ 161
Policy area Actions
Utilise new trading opportunities post-Brexit
• Implement new trade agreements with the UK and advance practical supply chain management solutions, especially for ACP triangular supply chains used to serve markets in both the UK and EU
• Use UK initiatives (e.g. investment summits, trade fairs, envoys, AfT) and Commonwealth business platforms to enhance trade and investment
• Develop new and deeper forms of economic co-operation across the Commonwealth (e.g. new bilateral FTAs, digital trade agreements)
• Diversify UK food trade towards the Commonwealth• Develop further co-operation in services trade, including FinTech
Revive the tourism and travel sector
• Invest in critical infrastructure along the tourism value chain, and upgrade capacity and skills to embrace digital technologies
• Revitalise demand through domestic staycations and intra-regional tourism, travel corridors and “digital nomad” offerings
• Target AfT to promote and attract sustainable investment in tourism and integrate conservation, ecology, creative industries and cultural heritage offerings
Enhance support measures for LDCs and graduates
• Leverage AfT and other partnerships to develop productive and trading capacity, and address supply-side constraints
• Use favourable tariff preferences and rules of origin for exports to developed economies and some developing country markets
• Use the WTO services waiver to participate in global value chains and diversify services exports• Enhance debt sustainability and improve access to finance• Use the Fifth United Nations Conference on LDCs to mobilise additional international support
measures and foster a renewed partnership between LDCs and development partners• Advocate for a smooth transition for graduating LDCs
Leverage digital technologies for trade, development and competitiveness
A: Capacity-building• Improve digital infrastructure to broaden access and usage of ICTs and the internet• Invest in digital capabilities and workforce training in digital skills• Develop capabilities to harness Industry 4.0, including aligning science, technology, innovation and
industrial policiesB: Regulatory framework• Develop national and regional regulatory frameworks and policies for e-commerce, payment
platforms, privacy, data, consumer protection, online dispute resolution and cyber-securityC: Aid for Digital Trade• Develop a new and additionally funded Aid for Digital Trade initiative, focused initially on supporting
infrastructure, digital skills, e-government, financial inclusion in developing countries and LDCs• Digitise trade facilitation by adopting paperless trade solutions and make permanent any temporary
digital trade facilitating measures introduced during the pandemicD: Partnerships• Build partnerships with the private sector and start-ups to accelerate FinTech, including using
innovation hubs and regulatory sandboxes• Implement the Commonwealth Connectivity Agenda Action Plan
Promote sustainable trade and circular economy principles to build back better
• Develop multi-stakeholder partnerships and advocate for sustainability and circular economy principles to underpin the recovery
• Harness digital technologies to create green jobs, generate renewable energy, enable sustainable production/consumption (e.g. agriculture, forestry and fisheries) and build resilient supply chains
Harness Commonwealth advantage in trade and investment
• Develop trade strategies to benefit from lower bilateral trade costs, on average, with Commonwealth partners
• Implement RTAs involving Commonwealth partners given their export-enhancing effect• Use Commonwealth advantage to boost FDI inflows, especially greenfield projects
TA B L E 5 . 4 ( C o n t i n u e d )P O L I C Y A R E AS F O R R E V I TA L I S I N G CO M M O N W E A LT H T RA D E
5016_Book.indb 161 17-06-2021 08:32:32

162 \ Commonwealth Trade Review 2021
A N N E X 5 . 1 .GTA P M O D E L L I N G R ES U LTS: P OT E N T I A L S H O RT- A N D M E D I U M -T E R M I M P ACTS O N CO M M O N W E A LT H CO U N T R I ES ’ E X P O RTS
Change in exports (US$ millions) Change in exports (%)
2021 2022 2023 2024 2025 2021 2022 2023 2024 2025
Developed
Australia 33.51 193.43 197.76 227.62 249.73 0.01 0.056 0.057 0.066 0.073
Canada 72.45 49.11 21.77 −13.2 −52.57 0.012 0.008 0.004 −0.002 −0.009
Cyprus −1.37 −1.87 −2.01 −2.2 −2.4 −0.014 −0.02 −0.022 −0.024 −0.026
Malta −1.84 −2.21 −2.04 −2.03 −1.98 −0.013 −0.014 −0.012 −0.011 −0.01
New Zealand 6.4 2.75 −40.98 −74.7 −85.42 0.013 0.005 −0.08 −0.144 −0.162
Developing
Of which
Africa
Botswana −1.68 −2.81 −3.41 −3.35 −2.91 −0.017 −0.028 −0.033 −0.032 −0.027
Cameroon 0.66 0.59 0.21 −0.09 −0.45 0.008 0.007 0.002 −0.001 −0.005
Eswatini 0.039 −0.019 −0.032 −0.051 −0.083 0.002 −0.001 −0.001 −0.002 −0.004
The Gambia 0.063 0.091 0.135 0.155 0.156 0.015 0.021 0.032 0.036 0.036
Ghana 1.49 2 2.68 2.75 2.5 0.006 0.007 0.009 0.009 0.008
Kenya −3.44 −6.98 −8.91 −11.56 −14.3 −0.019 −0.035 −0.039 −0.045 −0.05
Lesotho 0.021 −0.011 −0.018 −0.029 −0.047 0.002 −0.001 −0.001 −0.002 −0.004
Malawi 0.4 0.24 0.06 −0.25 −0.56 0.018 0.011 0.003 −0.011 −0.025
Mauritius −1.14 −1.65 −2.5 −2.54 −2.65 −0.021 −0.028 −0.042 −0.041 −0.041
Mozambique 0.52 0.58 0.45 0.14 −0.35 0.007 0.007 0.005 0.001 −0.003
Namibia 0.87 1.73 2.79 2 0.97 0.016 0.029 0.045 0.031 0.015
Nigeria 6.8 9.57 12.1 13.24 13.65 0.008 0.011 0.014 0.015 0.016
Rwanda 0.22 0.27 0.38 0.36 0.27 0.011 0.013 0.018 0.016 0.012
Seychelles 0.061 0.087 0.13 0.149 0.15 0.015 0.021 0.032 0.036 0.036
Sierra Leone 0.141 0.203 0.301 0.345 0.348 0.015 0.021 0.032 0.036 0.036
South Africa 3.79 −0.26 −3.59 −9.02 −15.64 0.003 0 −0.003 −0.008 −0.013
Tanzania 1.77 2.38 3.12 3.13 2.71 0.014 0.017 0.02 0.019 0.016
Uganda −0.58 −1.41 −1.97 −2.64 −3.58 −0.007 −0.017 −0.024 −0.031 −0.04
Zambia −0.17 0.48 1.91 3.37 4.72 −0.002 0.006 0.021 0.035 0.046
Asia
Bangladesh 8.38 10.41 5.05 −3.43 −13.89 0.024 0.03 0.014 −0.009 −0.033
Brunei Darussalam 0.91 0.84 1.54 2.47 3.3 0.012 0.011 0.019 0.031 0.041
India 63.05 59.17 −30.48 −117.91 −167.73 0.009 0.008 −0.004 −0.014 −0.018
Malaysia −10.54 −30.71 −52.71 −70.47 −88.04 −0.004 −0.01 −0.017 −0.022 −0.027
Maldives 0.137 0.263 0.279 0.12 −0.093 0.012 0.02 0.018 0.007 −0.005
Pakistan 12 21.52 27.66 30.66 31.64 0.042 0.066 0.07 0.064 0.054
Singapore −24.93 −35.27 −31.79 −30.03 −26.84 −0.006 −0.008 −0.007 −0.007 −0.006
Sri Lanka 4.79 2.47 −2.83 −6.25 −10.11 0.028 0.012 −0.012 −0.023 −0.032
(Continued)
5016_Book.indb 162 17-06-2021 08:32:32

Chapter 5: Pathways to Post-COVID Trade Recovery and Resilience Building \ 163
A N N E X 5 . 1 ( C o n t i n u e d )GTA P M O D E L L I N G R ES U LTS: P OT E N T I A L S H O RT- A N D M E D I U M -T E R M I M P ACTS O N CO M M O N W E A LT H CO U N T R I ES ’ E X P O RTS
Change in exports (US$ millions) Change in exports (%)
2021 2022 2023 2024 2025 2021 2022 2023 2024 2025
Caribbean SIDS
Antigua and Barbuda 0.032 −0.029 −0.111 −0.2 −0.226 0.007 −0.007 −0.025 −0.041 −0.043
The Bahamas 0.238 −0.217 −0.825 −1.483 −1.675 0.007 −0.007 −0.025 −0.041 −0.043
Barbados 0.097 −0.088 −0.335 −0.602 −0.68 0.007 −0.007 −0.025 −0.041 −0.043
Belize 0.01 −0.01 −0.03 −0.1 −0.18 0.001 −0.001 −0.003 −0.01 −0.017
Dominica 0.011 −0.01 −0.038 −0.069 −0.078 0.007 −0.007 −0.025 −0.041 −0.043
Grenada 0.023 −0.021 −0.079 −0.142 −0.16 0.007 −0.007 −0.025 −0.041 −0.043
Guyana −0.103 1.392 1.805 2.494 3.305 −0.002 0.024 0.026 0.035 0.046
Jamaica 1.3 1.18 0.83 0.23 −0.47 0.022 0.018 0.012 0.003 −0.006
St Kitts and Nevis 0.02 −0.018 −0.068 −0.122 −0.137 0.007 −0.007 −0.025 −0.041 −0.043
Saint Lucia 0.039 −0.036 −0.137 −0.245 −0.277 0.007 −0.007 −0.025 −0.041 −0.043
St Vincent and the Grenadines
0.015 −0.014 −0.053 −0.095 −0.108 0.007 −0.007 −0.025 −0.041 −0.043
Trinidad and Tobago 0.88 0.1 −0.88 −1.58 −2.13 0.007 0.001 −0.008 −0.014 −0.019
Pacific SIDS
Fiji 0.227 0.082 −0.165 −0.516 −0.91 0.013 0.005 −0.01 −0.029 −0.05
Kiribati 0.008 0.003 −0.006 −0.018 −0.032 0.013 0.005 −0.01 −0.029 −0.05
Nauru 0.005 0.002 −0.004 −0.011 −0.019 0.013 0.005 −0.01 −0.029 −0.05
Papua New Guinea 1.026 0.369 −0.746 −2.325 −4.105 0.013 0.005 −0.01 −0.029 −0.05
Samoa 0.035 0.013 −0.025 −0.079 −0.14 0.013 0.005 −0.01 −0.029 −0.05
Solomon Islands 0.059 0.021 −0.043 −0.133 −0.234 0.013 0.005 −0.01 −0.029 −0.05
Tonga 0.02 0.007 −0.015 −0.045 −0.08 0.013 0.005 −0.01 −0.029 −0.05
Tuvalu 0.002 0.001 −0.001 −0.004 −0.008 0.013 0.005 −0.01 −0.029 −0.05
Vanuatu 0.038 0.014 −0.027 −0.085 −0.151 0.013 0.005 −0.01 −0.029 −0.05
Source: Gopalakrishnan (2021) for Commonwealth Secretariat
5016_Book.indb 163 17-06-2021 08:32:32

164 \ Commonwealth Trade Review 2021
Endnotes
1 Launched in 2001 at the WTO’s
Doha Ministerial Conference, the
negotiations on fisheries have already
missed two deadlines: WTO MC11 in
2017 sought an outcome by the end
of 2019, while SDG target 14.6 aimed
to end these subsidies by 2020.
2 China has FTAs with Australia
and New Zealand in the Pacific,
Maldives, Pakistan and Singapore
in Asia and Mauritius in Africa and
with two Association of Southeast
Asian Nations members, Malaysia
and Brunei. http://fta.mofcom.gov.
cn/english/fta_qianshu.shtml
3 http://focacsummit.mfa.gov.cn/
eng/hyqk_1/t1594297.htm
4 In 2019, merchandise accounted for
58 per cent of the UK’s trade with
the EU while services accounted
for the remaining 42 per cent.
5 In Northern Ireland, market
conditions may differ in some
cases from those described, as
a result of implementation of
the Northern Ireland Protocol
to the Withdrawal Agreement
under which the UK left the EU.
6 One-fifth of the UK’s 10,000 or so
tariff lines are excluded from the Main
Framework and also, mostly, from
the Enhanced GSP (Stevens, 2021).
7 The alignment of EU sugar prices
with world market prices reduced
the value of ACP sugar exports
as they could no longer benefit
from guaranteed preferential
sugar prices that were higher
than world market prices.
8 For example, sugar cane accounts
for more than 50 per cent of the
total agriculture value-added
in Eswatini and Mauritius.
9 ACP goods shipped along triangular
supply chains via the UK to the EU
or via the EU to the UK now lose
their duty-free access and face
most-favoured nation tariffs if
this trade takes place outside of
customs supervision. Such customs
supervision under Common Transit
Convention procedures is extremely
difficult to activate along ACP supply
chains given the infrastructure,
information technology and
staffing challenges currently
faced (EPA Monitoring, 2021b).
10 Changes in merchandise exports
would be greater for the UK
(forecast to increase annually by
33 per cent) than for India (up by
12 per cent annually), probably
because Indian tariffs are higher,
but this ignores services, which
would be the priority for India.
11 There are concerns that vaccine
passports may be politically divisive
and discriminatory. Those unwilling
or unable to access COVID-19
vaccines and hence without vaccine
passports may face additional
conditions or restrictions on their
movement or their ability to obtain
secure employment (The Economist,
2021d). Existing digital divides within
and between Commonwealth
countries could exacerbate these
issues. Moreover, the policy of
prioritising the vaccination of
older people in most countries
may create a generational divide,
with older individuals enjoying
more freedoms than younger
people not yet vaccinated.
12 These nine SSA countries are Nigeria
(US$36.53 billion), South Africa
($31.45 billion), Kenya ($12.84 billion),
Ghana ($5.01 billion), Tanzania ($4.28
billion), Cameroon ($3.27 billion),
Uganda ($2.26 billion), Rwanda ($0.97
billion) and Mozambique ($0.67
billion) (IFC and Google, 2020).
13 See, for instance, GIZ (2019)
and Fichers and Naji (2020).
14 Mobile money is increasingly the
payment method of choice for
e-government services. The number
of payments for service applications
using mobile money increased
from 1 million in 2017 to 8 million
in 2020 (Fichers and Naji, 2020).
15 In the first two years following
the introduction of the RESW,
average customs clearance times
for imports fell by 40 per cent and
those for exports by 55 per cent
(Nizeyimana and de Wulf, 2015).
16 The portal currently
hosts information on 128
procedures and 203 laws and
regulations (Taarifa, 2021).
17 See, for example, the
International Trade Centre
(ITC) (2018) on the impacts of
e-commerce in Bangladesh.
18 The index ranks 158 countries
and is composed of 9 indicators to
illustrate the following five “building
blocks” for a country’s readiness
to innovate and adopt frontier
technologies: ICT deployment;
skills; research and development
(R&D) activity; industry activity; and
access to finance. The index scores
countries from 0 (low) to 1 (high) for
each building block and overall.
19 The second WTO MC, in 1998,
established the Work Programme on
E-Commerce to examine all trade-
related issues concerning global
electronic commerce, and mandated
members to continue examining
the current practice of not imposing
customs duties on electronic
transmissions. This Moratorium on
E-Transmissions has been renewed
since 1998. In December 2019, WTO
5016_Book.indb 164 17-06-2021 08:32:32
Chapter 5: Pathways to Post-COVID Trade Recovery and Resilience Building \ 165
members again agreed to extend the
E-Commerce Moratorium until MC12,
which has been postponed twice as a
result of COVID-19 (see Chapter 4).
20 https://iccwbo.org/content/
uploads/sites/3/2020/05/2020-
icc-digital-roadmap.pdf
21 Establishing a national single
window is an obligation under
Article 10.4 of the WTO TFA.
22 2019 UN Trade Facilitation Survey,
available at https://untfsurvey.org/
23 Botswana, Cameroon, Malawi,
Mauritius, Mozambique, Namibia,
Sierra Leone, Tanzania and Zambia.
24 For example, this can include digitally
enabled climate smart advisory
services on drought resistance
and short season seed varieties;
precision farming to reduce the
negative impact of agro-chemicals
on soils/land; index-based insurance
services to cushion farmers and
fisherfolks against flood, drought,
pest and diseases; alternative credit
scoring solutions based on big data
and analytics that are facilitating
access to financial services; and
smart tools to enable fisherfolks to
respond to SOS alerts at sea when
traditional storm models fail.
5016_Book.indb 165 17-06-2021 08:32:32

ConclusionThe COVID-19 pandemic has caused an unprecedented global
crisis, sparking the most severe economic contraction since
the Great Depression. As a result of the deep recession in
several Commonwealth countries and in their major export
markets, Commonwealth members are estimated to have lost
as much as US$345 billion worth of trade in 2020, including $60
billion in trade among the 54 member countries. The impact
has been particularly severe and disproportionate on women,
youth, the poor and the informally employed. However, the
rapid development of coronavirus vaccines and their roll-out
globally, albeit with uneven distribution among countries,
suggests 2021 could be a year of transition for global trade
and broader economic growth. As discussed in this Review,
trade will be an essential tool for economic recovery and
can be harnessed to build back better from the pandemic.
Each Commonwealth member country has its own
unique pathway and policy options for trade recovery in a
more digital world, although access to vaccines plays an
indispensable part for all of them. The broader outlook for
Commonwealth countries’ trade recovery is inextricably
linked to global economic prospects as well as the structure
of their economy, the composition of their exports and their
inherent characteristics and vulnerabilities. For example,
some least developed countries (LDCs) earn more than
80 per cent of their export earnings from commodities,1
while a few are graduating from this category and require
additional support measures for a smooth transition.
Other members, like small states, face inherent structural
challenges related to small size and geography. They depend
greatly on imports – from food to fuels – and are extremely
vulnerable to climate change and natural disasters, including
extreme weather events like cyclones and hurricanes,
prolonged drought and even volcanic eruptions. Among
the small states, most small island developing states (SIDS)
have a large share of tourism in their gross domestic product
(GDP) – around 50 per cent - but recovery in this sector
depends on resumption of travel, which in turn depends
upon addressing the health and safety concerns of tourists.
Many Commonwealth members have high levels of debt,
exacerbated by the crisis, and have limited means to finance
a sustainable recovery or do not qualify for international
support measures despite their high levels of vulnerability.
International co-operation and engagement in finding ways
to ensure the production and distribution of affordable
medical products, including vaccines and medicines, remains
essential if the entire world is to be vaccinated in a timely
manner to combat the pandemic. As Commonwealth
policy-makers and businesses look towards recovery from
the pandemic and building resilience to future shocks,
they should carefully consider the following issues.
The role of trade in economic recovery
Trade can also offer positive solutions to manage the crisis
and act again as an engine of growth. Maintaining open trade
and supply chains is essential to meet the increasing demand
for health supplies and vaccines, given the concentration
of manufacturing in a few countries. COVID-19 has shown
just how vulnerable medical supply chains are when they
rely on a small number of manufacturers for raw materials
and final products.2 Any sort of protectionism and barriers
to trade could undermine and delay the global recovery.
Commonwealth countries should also leverage trade to
boost economic growth. While the trade-growth nexus has
weakened during the past decade, recent studies show that
1 per cent growth in trade leads to an increase of 1-1.5 per
cent in GDP growth, raising income by 10-20 percentage
points over a decade. Trade is forecast to grow by 8.5 per
cent in 2021 and 6.5 per cent in 2022 (IMF, 2021b). This
growth will help Commonwealth countries’ global exports
to rebound and reach US$3.76 trillion in 2021 and $3.94
trillion by 2022. Similarly, intra-Commonwealth exports are
expected to surpass $700 billion by 2022. To support their
trade recovery, Commonwealth countries can harness
the “Commonwealth advantage”, which enables member
countries to trade up to 20 per cent more with each other,
while bilateral trade costs are 21 per cent lower, on average.
5016_Book.indb 166 17-06-2021 08:32:32

Conclusion \ 167
Given the dynamic nature of global value chain (GVC) networks,
it is possible that a transformation of GVC activities in goods
and services will lead to both greater opportunities and
increased resilience for many Commonwealth countries.
Discussions are ongoing on the possibility of re-shoring
and diversifying supply chains as well as re-industrialising to
reduce the risk of “supply chain contagion”. While this is likely
to be a key post-COVID strategy, it may also lead countries to
diversify the sources of supplies closer to home. On the one
hand, this may offer new opportunities to Commonwealth
developing countries as multinational enterprises reduce
their dependence on “Factory Asia”; on the other, there is
a risk that the pandemic could lead to policies that restrict
the international flow of goods, services and people.
Digitalisation, digital trade and recovery
Various estimates suggest that more than 50 per cent of
global GDP will be digitised by 2022/23, although there is a risk
that this will leave behind many Commonwealth developing
countries and LDCs with limited digital infrastructure and
connectivity (Ashton-Hart, 2020). As discussed in Chapter
2, digitalisation is driving growth and value creation across
all industries, and reshaping markets, business models
and value drivers for business. Growing digital trade and
expanding the digital economy can help support economic
recovery post-COVID and, at the same time, build resilience
in Commonwealth countries, ensuring they are better
positioned to address future economic shocks and crises.
Digital trade can open up new avenues for many businesses,
large and small, in Commonwealth developing countries,
especially small states, LDCs and countries in sub-Saharan
Africa, to provide services through Mode 1 while also
supporting export diversification. With the pandemic likely
to accelerate trends in Industry 4.0, leveraging digital and
other frontier technologies in sectors such as manufacturing
will help in transitioning to higher-productivity and more
advanced production processes, thereby supporting the
structural transformation of Commonwealth economies.
The increase in the uptake of e-commerce and the online
delivery of certain services is likely to continue throughout
the recovery period and beyond. Countries that are less
digitally enabled need to identify their challenges and lessons
learnt and take steps to overcome some of the hurdles to
shifting to a more digital world. International co-operation
is critical to address issues of connectivity, to close digital
divides and to tackle barriers to digital trade, particularly
e-commerce. Individual countries can work on building
capacities and removing the barriers to digital opportunities at
the domestic and regional levels. In this regard, it is necessary
for governments to strengthen the enabling environment,
including updating legal and regulatory frameworks and putting
in place digital systems required for digital trade to thrive.
With the ever-increasing adoption of digital technologies
in global production and trade, the focus of multilateral,
regional and bilateral Aid for Trade initiatives inevitably
needs to shift to addressing impediments to their uptake in
developing countries in order to provide a level playing field.
Failure to do so is only likely to exacerbate inequalities across
countries, adversely affecting the process of economic
convergence between developing and developed countries.
Building a more sustainable green and blue economy
As many countries start easing their lockdowns, it is imperative
that they strengthen their frameworks for sustainable
economic development during the recovery phase and not
simply revert to business-as-usual “brown” practices to
grow the economy out of recession. The pause in economic
activity could be used to re-engineer, strategise and plan
towards objectives that are truly sustainable, and determine
what role trade policy can play (Escaith et al., 2020). For
example, many governments and firms in the Commonwealth
and worldwide are accelerating their efforts to achieve a
global economy with net zero carbon emissions by 2050.
Moreover, countries need to risk-proof their future prosperity
by focusing on resilience to build back better, including by
drawing on and harnessing sustainable approaches and
circular economy principles. The post-COVID recovery is
indeed an opportunity to make progress on many of the
Sustainable Development Goals (SDGs), but especially SDG
12 to ensure sustainable production and consumption. There
is considerable evidence that investments in sustainable
industries improve economies and businesses. So-called
greener industries provide over three times more jobs than
do traditional fossil fuel-based industries (Vetter, 2020).
5016_Book.indb 167 17-06-2021 08:32:33

168 \ Commonwealth Trade Review 2021
However, this requires a whole new set of partnerships
to address the challenges and harness new collaborative
solutions and innovative approaches and financial products.3
Investors will increasingly contemplate a range of new
determinants when making investment decisions
beyond the pandemic, especially sustainability, with
environmental, social and governance issues increasingly
informing business choices. Other factors include the
possibilities for reconfiguring or regionalising supply chains
and diversifying investment destinations to minimise
exposure to location-specif ic shocks and future crises.
Moreover, levels of digitalisation and connectivity in host
countries will become increasingly important as modes
of manufacturing shift towards Industry 4.0. Re-shoring,
regionalisation and replication mean that factors such
as geographic proximity, quality of infrastructure and
participation in bilateral and regional trade agreements
are likely to exert even greater inf luence on locational
decisions for manufacturing foreign direct investment.
To compete in this emerging investment landscape,
Commonwealth countries need to realistically identify
their comparative strengths over the medium to long
term and pursue domestic reforms, where appropriate, to
take advantage of these new investment opportunities.
The international community can help tackle some of the
challenges to ensure a more sustainable and resilient economic
recovery. Development assistance will almost certainly be
needed from the major international financial institutions to
assist Commonwealth developing countries to recalibrate
their economies. There may also be a case for conditioning
support for recovery on some sustainability. Building local value
chains in agriculture, forestry and fisheries should be targeted
as priority sectors for lending. African, Caribbean and Pacific
SIDS should use this opportunity to identify and implement
actions to derive greater benefits from the sustainable use of
their ocean economies, including through enhanced regional
co-operation and co-ordination around the blue economy.
Several Commonwealth countries will need assistance to
recover and revive their economies and trade in the post-
pandemic period. These economic support and stimulus
packages should aim to align with the SDGs, boost climate
action and social equity, and make global and local economies
more resilient in the long run. As the world begins to tide
over the COVID-19 headwinds, Commonwealth countries
can look to use their global and intra-Commonwealth trade
as essential tools for building back better and promoting a
more inclusive, resilient and sustainable future, including
by harnessing the “Commonwealth advantage”.
5016_Book.indb 168 17-06-2021 08:32:33

Conclusion \ 169
Endnotes
1 For example, all the Commonwealth African LDCs, except
Lesotho, are commodity-dependent. The Gambia,
Malawi and Uganda rely on agricultural exports, while
Mozambique, Rwanda, Sierra Leone, Tanzania and Zambia
are heavily dependent on mineral, ore and metal exports.
2 The global value chains (GVCs) for manufacturing
and distributing vaccines involve around 1,800
suppliers across 19 countries providing 280
ingredients used in the manufacturing process.
3 For example, blue bonds, climate bonds and
impact bonds, as well as debt swaps for nature.
Such debt instruments can be tied to sustainability
targets, helping countries build back better.
5016_Book.indb 169 17-06-2021 08:32:33
ReferencesA4A1 (Alliance for Affordable Internet)
(2020) “2020 Affordability Report.”
https://a4ai.org/affordability-report/
report/2020/#what_is_the_state_
of_internet_affordability_and_policy
ACP-LDC Sugar Industry Group
(2020) “Statement in Relation to
the Negotiations Concluding a UK/
EU27 Free Trade Agreement”. 9 June.
https://static1.squarespace.com/
static/590079852994caf88939c23f/
t/5edf563b4d8ef51fb
0b57667/1591694908470/
ACP_Sugar_Statement_on_UK_
EU_FTA_9_June_2020.pdf
Adegoke, Y. (2020) “How Google’s
Balloons Are Bringing Internet to New
Parts of Kenya”. Quartz Africa, 14 July.
Adobe Analytics (2020) Adobe Digital
Economy Index: COVID-19 Report.
https://business.adobe.com/resources/
digital-economy-index.html
Afreximbank (African Export-Import
Bank) (2021) “African Union Member
States Accelerates Online Pre-Orders
as AMSP Adds 300 Million Sputnik
V Doses to Its COVID-19 Vaccine
Portfolio”. Press Release, 19 February.
https://www.afreximbank.com/african-
union-member-states-accelerates-
online-pre-orders-as-amsp-adds-
300-million-sputnik-v-doses-to-
its-covid-19-vaccine-portfolio/
Alfaro, L. and M. Chen (2012) “Surviving
the Global Financial Crisis: Foreign
Ownership and Establishment
Performance”. American Economic
Journal: Economic Policy 4(3): 30–55.
Alfaro, L., A. Chanda, S. Kalemli-
Ozcan and S. Sayek (2004) “FDI
and Economic Growth: The Role of
Local Financial Markets”. Journal of
International Economics 64(1): 89–112.
Ali, S., M. Fugazza and B. Vickers (2020)
“Assessing the Impact of the COVID-19
Pandemic on Commodities Exports from
Commonwealth Countries”. International
Trade Working Paper 2020/14. London:
Commonwealth Secretariat.
Al-Saleh (2020) “E-commerce Is
Globalization’s Shot at Equality”.
World Economic Forum, 19 January.
https://www.weforum.org/
agenda/2020/01/e-commerce-sme-
globalization-equality-women/
Altenburg, T. (2019) “Migration of
Chinese Manufacturing Jobs to
Africa: Myth or Reality?” Brookings
Foresight Africa, 5 March.
Ambaw, D. and P. Draper (2020) “The
Commonwealth’s Trade Landscape
in a Post-COVID World”. International
Trade Working Paper 2020/13. London:
Commonwealth Secretariat.
Anner, M. (2020) “Abandoned? The
Impact of Covid-19 on Workers
and Businesses at the Bottom of
Global Garment Supply Chains”.
Research Report, 27 March.
University Park, PA: Penn State
Center for Global Workers’ Rights.
Anuradha, R.V. (2019) “Emerging
New Technologies: Implications
for Services Commitments”.
Trade Hot Topic 152. London:
Commonwealth Secretariat.
APO Group (2021) “African Medical
Supplies Platform (AMSP) Opens
COVID-19 Vaccines Pre-Orders for
55 African Union Member States”.
Africa News, 19 January. https://
www.africanews.com/2021/01/19/
africa-medical-supplies-platform-amsp-
opens-covid-19-vaccines-pre-orders-
for-55-african-union-member-states//
Arvis, J., Y. Duval, B. Shepherd, C.
Utoktham and A. Raj (2016) “Trade Costs
in the Developing World: 1996–2010”.
World Trade Review 15(3): 451–474.
Ashton-Hart, N. (2020) “Leveraging
Digital Connectivity for Post-COVID
Competitiveness and Recovery”.
Trade Hot Topic 162. London:
Commonwealth Secretariat.
Atkinson, C. (2020) “‘Rules as Data’:
The 21st Century Answer for Trade
Facilitation?” Trade for Development
News by EIF, 24 August. https://
trade4devnews.enhancedif.org/en/
op-ed/rules-data-21st-century-
answer-trade-facilitation
Atkinson, C. and B. Stevens (2020)
“Digitalising Trade Facilitation
Implementation: Opportunities and
Challenges for the Commonwealth”.
Trade Hot Topics 160. London:
Commonwealth Secretariat.
AUC (African Union Commission) and
OECD (Organisation for Economic
Co-operation and Development)
(2021) Africa’s Development
Dynamics 2021: Digital Transformation
for Quality Jobs. Addis Ababa/
Paris: ACU/OECD Publishing.
5016_Book.indb 170 17-06-2021 08:32:33

References \ 171
Bahri, A. (2020) “Mainstreaming
Gender Considerations in Free Trade
Agreements. ‘Building Back Better’ in
Post-COVID-19 World”. Contribution
to the UNESCAP Policy Hackathon
on Model Provisions for Trade
in Times of Crisis and Pandemic
in Regional and other Trade
Agreements. https://www.unescap.
org/sites/default/f iles/92Final-
Amrita Bahri-Mexico.pdf
Bajaj, P. (2021) “Trade × Technology
beyond COVID-19: Leveraging
Digital Technologies for Economic
Co-operation”. Trade Hot Topics 173.
London: Commonwealth Secretariat.
Bajt, D. and Y. Duval (2020) “Policy
Hackathon on Model Provisions
for Trade in Times of Crisis and
Pandemic in Regional and other
Trade Agreements: Results at a
Glance”. https://www.unescap.
org/sites/default/d8files/UN%20
Policy%20Hackathon%20-%20
Results%20at%20a%20glance.pdf
Balchin, N. (2020) “Four Key Priorities
for Revisiting LDC Vulnerabilities”.
Trade for Development News by EIF, 26
November. https://trade4devnews.
enhancedif.org/en/op-ed/four-key-
priorities-revisiting-ldc-vulnerabilities
Baldwin, R. (2006) “Multilateralising
Regionalism: Spaghetti Bowls
as Building Blocs on the Path
to Global Free Trade”. World
Economy 29(11): 1451–1518.
Baldwin, R. and S.J. Evenett (eds) (2020)
COVID-19 and Trade Policy: Why Turning
Inward Won’t Work. London: Centre
for Economic Policy Research Press.
Banga, R. (2017) “Brexit: Opportunities
for India”. Trade Competitiveness
Briefing Paper 2017/01. London:
Commonwealth Secretariat.
Banga, K. and N. Balchin (2019)
“Linking Southern Africa into South
Africa’s global Value Chains”. Working
Paper 2019/62. Helsinki: United
Nations University World Institute for
Development Economics Research.
Banga, K. and S. Raga (2021)
“Digital Trade for Post-COVID
Recovery and Resilience in the
Commonwealth”. International
Trade Working Paper. London:
Commonwealth Secretariat.
Banga, K. and D.W. te Velde (2020)
“Covid-19 and Disruption of the
Digital Economy: Evidence from
Low and Middle-Income Countries”.
Digital Pathways at Oxford Paper 7.
Banga, K., J. Keane, M. Mendez-Parra,
L Pettinotti and L. Sommer (2020)
“Boosting African Regional Value
Chain in Development Response to
COVID-19”. Trade for Development
News by EIF, 14 September. https://
trade4devnews.enhancedif.org/en/
op-ed/boosting-african-regional-
value-chain-development-response-
covid-19-catalysing-role-afcfta
Barrowclough, D. and D. Vivas Eugui
(2021) “Plastic Production and Trade in
Small States and SIDS: The Shift Towards
a Circular Economy”. International
Trade Working Paper 2021/01. London:
Commonwealth Secretariat.
Bekkers, E., R. Koopman, G. Sabbadini
and R. The (2021) “The Impact of Digital
Technologies on Developing Countries’
Trade” in Smeets, M. (ed.) Adapting
to the Digital Trade Era: Challenges
and Opportunities. Geneva: WTO.
Bird, M. (2020) “Five Years On, China’s
World Bank Challenger Has Fallen Short
of Lofty Predictions”. The Wall Street
Journal, 18 December. https://www.wsj.
com/articles/five-years-on-chinas-
world-bank-challenger-has-fallen-short-
of-lofty-predictions-11608285438
Bollyky, T.J. and C.P. Bown (2020) “The
Tragedy of Vaccine Nationalism. Only
Cooperation Can End the Pandemic”.
Foreign Affairs, September/October.
https://www.foreignaffairs.com/
articles/united-states/2020-07-27/
vaccine-nationalism-pandemic
Broome, P.A. (2016) “Conceptualizing
the Foundations of a Regional
E-Commerce Strategy: Open
Networks or Closed Regimes? The
Case of CARICOM”. Cogent Business
& Management 3(1): 1139441.
Campbell, C. (2021) “How Jin Liqun
Charted an Independent Course
for China’s Asian Infrastructure
Investment Bank”. Time, 19 February.
https://time.com/5938669/
aiib-jin-liqun-china-covid19/
CARICOM (Caribbean Community)
(2020) “Ninth Special Emergency
Meeting of the Conference of Heads
of Government of the Caribbean
Community”. Press Release, 15 April.
CARPHA (Caribbean Public Health
Agency) (2020) “CARPHA COVID-19
Pandemic Response”. 100th Situation
Report. Port of Spain: CARPHA.
Centre for Policy Dialogue (2021)
“Bangladesh Qualifies for LDC
Graduation: What Next?” Interview
with Debapriya Bhattacharya, 11
March. https://cpd.org.bd/bangladesh-
qualifies-for-ldc-graduation-what-next/
Chidede, T. (2020) “Substantive
Issues the AfCFTA Investment
Protocol Should Address”. Tralac
Blog, 27 March. https://www.tralac.
org/blog/article/14468-substantive-
issues-the-afcfta-investment-
protocol-should-address.html
5016_Book.indb 171 17-06-2021 08:32:33
172 \ Commonwealth Trade Review 2021
Christiani, P., J. Claes, E. Sandnes
and A. Stevens (2019) “Precision
Fisheries: Navigating a Sea of
Troubles with Advanced Analytics”.
McKinsey, 20 December. https://
www.mckinsey.com/ industries/
agriculture/ our-insights/precision
-fisheries-navigating -a-sea-of-
troubles -with-advanced-analytics
Chuah, D. (2020) “The RCEP: A
Big Deal Unlikely to Resolve Sino-
Australian Disputes”. The China Guys,
17 December. https://thechinaguys.
com/the-rcep-a-big-deal-unlikely-to-
resolve-sino-australian-disputes/
Ciofu, S. (2020) “A UK-Singapore Digital
Economy Agreement is a great idea.”
TechUK News and Views, 10 December.
https://www.techuk.org/resource/a-
uk-singapore-digital-economy-
agreement-is-a-great-idea.html
Comissiong, G. (2021) “CARICOM’s
Great Fight-Back in 2021”. Statement
from Barbados’ Ambassador to
CARICOM, 25 January. https://
today.caricom.org/2021/01/20/
caricoms-great-fight-back-in-2021/
Commonwealth Secretariat
(2015) The Commonwealth in the
Unfolding Global Trade Landscape.
Commonwealth Trade Review 2015.
London: Commonwealth Secretariat.
Commonwealth Secretariat
(2016) “Brexit: Its Implications and
Potential for the Commonwealth”.
Discussion Note. London:
Commonwealth Secretariat.
Commonwealth Secretariat (2018a)
Strengthening the Commonwealth
Advantage. Trade, Technology,
Governance. Commonwealth
Trade Review 2018. London:
Commonwealth Secretariat.
Commonwealth Secretariat (2018b)
“Understanding the Investment
Potential of the Commonwealth
Diaspora Results of the Commonwealth
Diaspora Investor Survey April 2018”.
London: Commonwealth Secretariat.
Commonwealth Secretariat (2020)
The State of the Digital Economy
in the Commonwealth. London:
Commonwealth Secretariat.
Cordon, C. (2020) “A Post Covid-19
Outlook: The Future of the Supply
Chain”. IMD, May. https://www.
imd.org/research-knowledge/
articles/A-post-COVID-19-outlook-
The-future-of-the-supply-chain/
Crone, D. (2020) Insights from
Africa’s Covid-19 Response: The
Africa CDC. London: Tony Blair
Institute for Global Change.
Dessie, A. and D. Peter (2020) “The
Commonwealth’s Trade Landscape
in a Post-COVID World”. International
Trade Working Paper 2020/13. London:
Commonwealth Secretariat.
Deuss, A. (2017) “Impact of
Agriculture Export Restrictions
on Prices in Importing Countries”.
Food and Agriculture and Fisheries
Papers 105. Paris: OECD.
Devnath, A. (2020) “European
Retailers Scrap $1.5 Billion of
Bangladesh Orders”. Bloomberg,
23 March. https://www.bloomberg.
com/news/articles/2020-03-23/
europe-retailers-cancel-1-billion-
of-bangladesh-garment-orders
DIT (Department for International Trade)
(2020) “Sugar ATQ Consultation (2020)”
Information Pack, updated 16 December.
London: HM Government. https://www.
gov.uk/government/consultations/
autonomous-tariff-rate-quota-atq-
raw-cane-sugar-consultation-2020/
information-pack
Durant, I. and P. Coke-Hamilton (2020)
“COVID-19 Requires Gender-Equal
Responses to Save Economies”.
UNCTAD News, 1 April. https://unctad.
org/news/covid-19-requires-gender-
equal-responses-save-economies.
East, D. and M.G. Kaspar (2020) “The
Impact of COVID-19 on Manufacturing
Investments”. UNIDO Industrial
Analytics Platform, August.
Echandi, R., J. Krajcovicova and C.Z.
Qiang (2015) “The Impact of Investment
Policy in a Changing Global Economy”.
Policy Research Working Paper 7437.
Washington, DC: World Bank.
EPA Monitoring (2021a) “The Case of
Fresh Horticultural Products: What
Does the New EU UK Trade Agreement
Mean for ACP Triangular Supply Chains?”
19 January. https://epamonitoring.
net/the-case-of-fresh-horticultural-
products-what-does-the-new-eu-
uk-trade-agreement-mean-for-
acp-triangular-supply-chains/
EPA Monitoring (2021b) “The UK Trade
and Business Commission Offers
Opportunities for Highlighting ACP
Triangular Supply Chain Concerns”, 23
April. https://epamonitoring.net/the-
uk-trade-and-business-commission-
offers-opportunities-for-highlighting-
acp-triangular-supply-chain-concerns/
EIU (Economist Intelligence Unit) (2020)
Covid-19 Threatens Investment Drought
in Sub-Saharan Africa. London: EIU.
EIU (2021) Africa-China Relations –
Taming the Dragon: New Frontiers
of Co-operation? London: EIU.
Elms, D. (2020) “Digital Trade in the Asia-
Pacific: Issues for 2021 and Beyond”.
5016_Book.indb 172 17-06-2021 08:32:33

References \ 173
Asian Trade Centre, with support from
the Hinrich Foundation, December.
Escaith, H. and S. Khorana (2021) “The
Impact of the COVID-19 Pandemic on
Merchandise Trade in Commonwealth
Countries”. International Trade
Working Paper 2021/02. London:
Commonwealth Secretariat.
Escaith, H., S. Khorana, J. MacGregor,
B. Vickers and S. Ali (2020) “The
Potential Impact of COVID-19 on
Commonwealth Trade, Recovery
and Resilience”. Trade Hot Topic 161.
London: Commonwealth Secretariat.
Estes, A.C. (2020) “The Pandemic Is
Speeding up the Space Internet Race”.
Vox, 26 September. https://www.vox.
com/recode/2020/9/26/21457530/
elon-musk-s
European Commission (2021) “Ex-Post
Evaluation of the EPA between
the EU and Its Member States and
the CARIFORUM Member States
Implementation Report”. Brussels:
Directorate-General for Trade.
Evenett, S. (2020) “Exports at Risk from
Non-Tariff Measures: The Experience of
Commonwealth Countries”. International
Trade Working Paper 2020/03. London:
Commonwealth Secretariat.
Farole, T. (2016) Factory Southern Africa?
SACU in Global Value Chains: Summary
Report. Washington, DC: World Bank.
Farole, T. and D. Winkler (2012) “Foreign
Firm Characteristics, Absorptive
Capacity and the Institutional
Framework: The Role of Mediating
Factors for FDI Spillovers in Low-
and Middle-Income Countries”.
Policy Research Working Paper 6265.
Washington, DC: World Bank.
Fichers, N. and L. Naji, (2020) “Digitalising
Person-to-Government Payments:
Leveraging Mobile to Improve
Government Revenue and Access
to Public Services”. GSMA, October.
https://www.gsma.com/publicpolicy/
wp-content/uploads/2020/09/
GSMA-Digitalising-person-to-
government-payments.pdf
Fredriksson, T. (2020) “Digital Trade
in Services”. Joint ECLAC and UNSD
Workshop in Cooperation with WTO on
Trade in Services, 9-11 December.
Gao, H. (2020) “Data Regulation
in Trade Agreements: Different
Models and Options Ahead” in
Smeets, M. (ed.) Adapting to the
Digital Trade Era: Challenges and
Opportunities. Geneva: WTO.
Gay, D. (2020) “A Critical Reflection
on International Support for Least
Developed Countries”. International
Trade Working Paper. London:
Commonwealth Secretariat.
Georgieva, K., S. Fabrizio, C.H. Lim and
M.M. Tavares (2020) “The COVID-19
Gender Gap”. IMF Blog, 21 July.
https://blogs.imf.org/2020/07/21/
the-covid-19-gender-gap/
GIZ (German Development Corporation)
(2019) “Partnership Ready Rwanda:
Digitalization”. Global Business Network
Programme. Bonn: GIZ. https://www.
giz.de/en/downloads/GBN_Sector%20
Brief_Ruanda_Digitalization_E_WEB.pdf
Global Affairs Canada (2021) “Canada
Begins Public Consultations on Joining
the Digital Economy Partnership
Agreement”. 19 March. https://
www.canada.ca/en/global-affairs/
news/2021/03/canada-begins-public-
consultations-on-joining-the-digital-
economy-partnership-agreement.html
Global News Matters Caribbean
Research (2016) “Brexit Implications
for the Caribbean”. Interview with Marla
Durkharan, 30 June. http://caricom.
org/brexit-implications-for-the-
caribbean-an-interview-with-leading-
caribbean-economist-marla-dukharan
Godart, O., H. Görg and A. Hanley (2020)
“Harnessing the Benefits of FDI in
African Countries”. CESifo Forum, 21 July.
Gonzalez, A. (2017) “Global Investment
Competitiveness: New Insights on FDI”.
World Bank Private Sector Development
Blog, 26 October. https://blogs.
worldbank.org/psd/global-investment-
competitiveness-new-insights-fdi
Gopalakrishnan, B.N. (2021)
“Analysing UK-Commonwealth
trade in the Post-Transition Period:
Implications for Commonwealth
Countries”. International
Trade Working Paper. London:
Commonwealth Secretariat.
Government of Trinidad and Tobago
(2020) “Innovative Approaches to
Managing Risks and Facilitating Intra-
Regional Trade during COVID-19
Pandemic in the Caribbean Region”.
https://repositorio.iica.int/bitstream/
handle/11324/12196/BVE20098553i.
pdf?sequence=1&isAllowed=y
Hartzenberg, T. (n.d). “The African
Continental Free Trade Area Agreement
– What Is Expected of LDCs in Terms
of Trade Liberalisation?” https://www.
un.org/ldcportal/afcfta-what-is-
expected-of-ldcs-in-terms-of-trade-
liberalisation-by-trudi-hartzenberg/
Hijzen, A., P.S. Martins, T. Schank and
R. Upward (2013) “Foreign-Owned
Firms around the World: A Comparative
Analysis of Wages and Employment
at the Micro-level”. European
Economic Review 60(C): 170–188.
Hillman, J.E. (2021) “Competing
with China’s Digital Silk Road”. CSIS
Global Forecast Essay, 9 February.
5016_Book.indb 173 17-06-2021 08:32:33
174 \ Commonwealth Trade Review 2021
https://www.csis.org/analysis/
competing-chinas-digital-silk-road
HM Government (2021) Global
Britain in a Competitive Age: The
Integrated Review of Security,
Defence, Development and Foreign
Policy. London: HM Government.
HM Revenues & Customs (2020)
“Moving Goods through Customs
during the Coronavirus (COVID-19)”.
1 April. https://www.gov.uk/guidance/
moving-goods-through-customs-
during-the-coronavirus-covid-19
Hyun Kim, S. (2019) “How Trade
Facilitation Could Support
Bangladesh: Beyond LDC
Graduation”. Workshop on Challenges
in Graduating from LDCs for
Bangladesh, Bangkok, 24 June.
IATA (International Air Transport
Association) (2021) “Outlook for
the global airline industry”. April
2021 Update. https://www.iata.org/
en/iata-repository/publications/
economic-reports/airline-industry-
economic-performance—
april-2021—report
ICC (International Chamber of
Commerce) (2020) “The Economic
Case for Global Vaccination”. https://
iccwbo.org/publication/the-economic-
case-for-global-vaccinations/
IFC (International Finance Corporation)
and Google (2020) e-Conomy Africa
2020. Washington, DC: IFC and Google.
ILO (International Labour Organization)
(2020) “The Supply Chain Ripple
Effect: How COVID-19 Is Affecting
Garment Workers and Factories
in Asia and the Pacific”. Research
Brief, October. Geneva: ILO.
IMF (International Monetary Fund)
(2020) A Long and Difficult Ascent.
World Economic Outlook Update,
October. Washington, DC: IMF.
IMF (2021a) Policy Support and
Vaccines Expected the Lift Activity.
World Economic Outlook Update,
January. Washington, DC: IMF.
IMF (2021b) Managing Divergent
Recoveries. World Economic Outlook
Update, April. Washington, DC: IMF.
ING (2017) 3D Printing: A Threat to
Global Trade. Amsterdam: ING.
ITC (International Trade Centre)
(2015) Unlocking Markets for
Women to Trade. Geneva: ITC.
ITC (2018) “What Sells in
E-commerce: New Evidence from
Asian LDCs”. Geneva: ITC.
ITU (International Telecommunication
Union) (2020) The State of
Broadband 2020: Tackling Digital
Inequalities. Geneva: ITU and United
Nations Educational, Scientific
and Cultural Organization.
Kampel, K. (2020a) “COVID-19 and
Tourism. Charting a Sustainable
Resilient Recovery for Small States”.
Trade Hot Topic 163. London:
Commonwealth Secretariat.
Kampel, K. (2020b) “LDC Tourism:
Making Strides towards Sustainable,
Resilient Recovery from COVID-19”.
Trade for Development News by EIF,
29 October. https://trade4devnews.
enhancedif.org/en/op-ed/
ldc-tourism-making-strides-towards-
sustainable-resilient-recovery-covid-19
Kampel, K. and R.V. Anuradha (2021)
“Tracing the Evolution of WTO
Plurilateral Negotiations on Domestic
Regulation: Considerations for
Commonwealth Small States Amidst
a COVID-19 Reality”. International
Trade Working Paper. London:
Commonwealth Secretariat.
Keane, J. (2016) “Brexit and Trade in
Services: Securing Future Gains”, in
Mendez-Parra, M., D.W. te Velde and
L. Alan Winters (eds) The Impact of
the UK’s Post-Brexit Trade Policy on
Development. An Essay Series. London:
Overseas Developmet Institute.
Kearney, (2020) “Trade War Sends
Kearney US Reshoring Index to Record
High, Foreshadowing Test of Supply
Chain Resilience during COVID-19
Pandemic”. 7 April. https://www.
prnewswire.com/news-releases/
trade-war-sends-kearney-us-reshoring-
index-to-record-high-foreshadowing-
test-of-supply-chain-resilience-during-
covid-19-pandemic-301036521.html
Kemp, S. (2021) “Digital 2021: Global
Overview Report”. DataReportal,
27 January. https://datareportal.
com/reports/digital-2021-
global-overview-report
Ketels, C., A. Bhattacharya and L.
Satar (2019) “Global Trade Goes
Digital”. Boston Consulting Group
Henderson Institute, 12 August. https://
www.bcg.com/publications/2019/
global-trade-goes-digital.
Khorana, S. and I. Martínez-Zarzoso
(2021, forthcoming) “COVID-19 Impact
on Global and Intra-Commonwealth
Goods Trade”. Working Paper. London:
Commonwealth Secretariat.
Kituyi, M. (2020) “The Intricacies, Impact
and Opportunities of E-commerce for
Trade and Development”. UNCTAD
News, 22 June. https://unctad.org/news/
intricacies-impact-and-opportunities-
e-commerce-trade-and-development
Kituyi, M. (2021) “‘Going Digital’: How
to Build an Inclusive Digital Economy
5016_Book.indb 174 17-06-2021 08:32:33

References \ 175
in the Wake of COVID-19”. UNCTAD
News, 29 January. https://unctad.org/
news/going-digital-how-build-inclusive-
digital-economy-wake-covid-19
Kumar, R., J. Chakradhar and N. Balchin
(2020) “Unpacking the Possible
Elements of a Future Digital Trade
Agreement on Digitalization and
Economic Growth: Insights from Panel
Data Analysis”. Contribution to the
United Nations Policy Hackathon on
Model Provisions for Trade in Times of
Crisis and Pandemic in Regional and
other Trade Agreements. www.unescap.
org/sites/default/files/4%20Final-
Team%20Radika%20Kumar-UK.pdf
Lacey, S. (2021) “The Digital Dimension
of Aid for Trade”. Report prepared for
the Commonwealth Secretariat.
Lee, S. and D. Prabhakar (2021)
“COVID-19 Non-Tariff Measures:
The Good and the Bad through a
Sustainable Development Lens”.
Research Paper 60. Geneva: UNCTAD.
MacGregor, J. (2019) “Blockchain – A
New Opportunity for Strengthening
Trade in the Commonwealth”.
Trade Hot Topics 154. London:
Commonwealth Secretariat.
Madgavkar, A., O. White, M. Krishnan
and D. Mahajan (2020) “COVID-19
and Gender Equality: Countering the
Regressive Effects”. McKinsey Global
Institute, 15 July. https://www.mckinsey.
com/featured-insights/future-of-work/
covid-19-and-gender-equality-
countering-the-regressive-effects
Manlan, C. and E. Ojomo (2020)
“Kick-Starting FDI in Africa’” Project
Syndicate, 15 December. https://
www.project-syndicate.org/
commentary/african-diaspora-
foreign-direct-investment-by-carl-
manlan-and-efosa-ojomo-2020-12
Mohamed, S. (2020) “COVID-19:
HPA Launches Online Application
for ‘Contact Tracing’”. The Edition, 30
April. https://edition.mv/news/16453
Muchopa, C.L. (2020) “Improving
Africa’s Crisis and Pandemic Responses
through Provisions in Regional
Trade Agreements – Does a “Crisis/
Pandemic Lens” Matter for Trade in
Food?” Contribution to the Policy
Hackathon on Model Provisions for
Trade in Times of Crisis and Pandemic in
Regional and other Trade Agreements.
https://www.unescap.org/sites/
default/files/30%20Final-LC%20
Muchopa-South%20Africa.pdf
Nizeyimana, C. and L. de Wulf (2015)
“Rwanda Electronic Single Window
Supports Trade Facilitation”. World
Customs Journal 9(2): 73–84.
Nordås, H.K. (2021) “Services Trade
Governance in the Digital Economy”.
Council on Economic Policies Policy
Brief, March. https://www.cepweb.
org/wp-content/uploads/2021/03/
Kyvik-Nordas-2021.-Services-Trade-
Governance-in-the-Digital-Economy.
Novy, D. (2013) “Gravity Redux:
Measuring International Trade
Costs with Panel Data”. Economic
Inquiry 51(1): 101–121.
Nurse, K. (2021) “The Digital Creative
Economy and Trade: Strategic
Options for Developing Countries”,
in Smeets, M. (ed.) Adapting to the
Digital Trade Era: Challenges and
Opportunities. Geneva: WTO.
O’Ceallaigh, J. (2021) “In the Maldives,
Tourism Recovers as the Wealthy
Take a Break from the Pandemic”.
Financial Times, 9 February. https://
www.ft.com/content/5bf0678a-
398f-4b3c-a374-b954c944df58
OECD (Organisation for Economic
Cooperation and Development) (1997)
Measuring Electronic Commerce.
Paris: Committee for Information,
Computer and Communications
Policy, OECD. http://www.oecd.org/
digital/ieconomy/2093249.pdf
OECD (2002) Foreign Direct Investment
for Development: Maximising Benefits,
Minimising Costs. Paris: OECD.
OECD (2020a) “E-commerce
in the Times of COVID-19”.
Brief, 7 October. https://read.
oecd-ilibrary.org/view/?ref=137_137212-
t0fjgnerdb&title=E-commerce-
in-the-time-of-COVID-19
OECD (2020b) “Leveraging Digital
Trade to Fight the Consequences
of COVID-19”. Brief, 7 July. https://
www.oecd-ilibrary.org/trade/
leveraging-digital-trade-to-fight-the-
consequences-of-covid-19_f712f404-en
OECD (2020c) “Foreign Direct
Investment Flows in the Time of
COVID-19”. 4 May. https://read.
oecd-ilibrary.org/view/?ref=132_132646-
g8as4msdp9&title=Foreign-
direct-investment-flows-in-
the-time-of-COVID-19
OECD (2020d) “COVID-19 and
International Trade: Issues and
Actions”. 10 April. https://read.
oecd-ilibrary.org/view/?ref=128_128542-
3ijg8kfswh&title=COVID-19-and-
international-trade-issues-and-actions
OECD (2020e) Climate Policy
Leadership in an Interconnected
World: What Role for Border Carbon
Adjustments? Paris: OECD.
OECD (2020f) Trade Facilitation
and the COVID-19 Pandemic: OECD
Policy Responses to Coronavirus
(COVID-19). Paris: OECD.
5016_Book.indb 175 17-06-2021 08:32:33
176 \ Commonwealth Trade Review 2021
OECD (Organisation for Economic
Co-operation and Development),
WTO (World Trade Organization)
and IMF (International Monetary
Fund) (2020) Handbook on Measuring
Digital Trade. https://www.oecd.org/
sdd/its/Handbook-on-Measuring-
Digital-Trade-Version-1.pdf
Pacific Cooperation Foundation (2020)
“COVID-19 Pacific Humanitarian
Pathway Protocols Approved”. 26 June.
https://pcf.org.nz/news/2020-06-26/
covid-19-pacific-humanitarian-pathway-
protocols-approved
Paterson, S. (2020) “Manufacturers
Pulling out of China Should Consider
Africa to Diversify Their Supply Chain”.
Opinion. South China Morning Post,
24 May. https://www.scmp.com/
comment/opinion/article/3085690/
manufacturers-pulling-out-china-
should-consider-africa-diversify
Payne, M., A. Hawke and S. Kofe
(2020) “Working Together to Combat
COVID-19 in the Pacific”. Joint
Government of Australia Media
Release, 20 June. https://www.
foreignminister.gov.au/minister/
marise-payne/media-release/working-
together-combat-covid-19-pacific
Perreve, E. (2020) “E-Commerce in
the Post-COVID-19 Era”. International
Briefing Paper, December. Geneva: CUTS.
Pigman, G.A. (2020) Negotiating
Our Economic Future. Trade,
Technology and Diplomacy.
Newcastle: Agenda Publishing.
Pigman, G.A. (2021) “Influencing
Outcomes in a Changing
Environment at the WTO: A
Commonwealth Developing
Country Perspective”. International
Trade Working Paper. London:
Commonwealth Secretariat.
Primack, D. (2017) “Enhancing Access
for LDC Services to the UK-Post-
Brexit”. Trade Hot Topics 145. London:
Commonwealth Secretariat.
Quartz Africa Weekly Brief
(2021) 21 February.
Remy, J.Y. (2020) “Dispute Settlement
at the WTO: How Did We Get Here
and What’s Next for Commonwealth
Countries?” Trade Hot Topic 66.
London: Commonwealth Secretariat.
Riddle, L. and T.M. Nielsen (2011)
“Policies to Strengthen Diaspora
Investment and Entrepreneurship:
Cross-National Perspectives”, in
Sharma, K, A. Kashyap, M. Montes
and P. Ladd (eds) Realizing the
Development Potential of Diasporas.
Tokyo: UN University Press.
Rutherford, A (2020) “The Application
of the Law of the WTO to Green
Energy Security”. https://link.
springer.com/content/pdf/10.100
7%2F978-3-030-45555-2_4.pdf
Rutherford, L. and S. Zaman (2017)
“Unleashing the Potential of Fintech:
Developing Effective Working
Relationships with the Private Sector”.
Discussion Note for Commonwealth
Central Bank Governors Meeting 2017.
London: Commonwealth Secretariat.
Sands, A., B. Kira, E. Jones and D.
Garrido-Alves (2021) “The UK and Digital
Trade: Which Way Forward?” Working
Paper BSG-WP-2021/038. https://doi.
org/10.35489/BSG-WP-2021/038
Scott, J. and R. Wilkinson (2013) “China
Threat? Evidence from the WTO”.
Journal of World Trade 47(4): 761-782.
Shehadi, S. (2020) “Renewables
FDI Boom Hit by Covid-19”. fDi
Intelligence, 16 April. https://www.
fdiintelligence.com/article/77285
Shepherd, B. and A. Shingal (2021)
“Services Trade of Commonwealth
Member Countries: Response to the
COVID-19 Pandemic”. International
Trade Working Paper 2021/02. London:
Commonwealth Secretariat.
Shingal, A. and A. Aggarwal (2020)
“Commonwealth Greenfield
Investment: Stylised Facts and
the Effect of Commonwealth
Membership”. International Trade
Working Paper 2020/06. London:
Commonwealth Secretariat.
Sneader, K. and S. Singhal (2021)
“The New Normal Arrives: Trends
That Will Define 2021 – and
Beyond”. McKinsey and Company,
4 January. https://www.mckinsey.
com/featured-insights/leadership/
the-next-normal-arrives-trends-
that-will-define-2021-and-beyond
Soobramanien, T., B. Vickers and H. Enos-
Edu (eds) (2019) WTO Reform: Reshaping
Global Trade Governance for 21st Century
Challenges. London: Commonwealth
Secretariat.
Stevens, C. (2021) “After Brexit: A Guide
and Roadmap for the Commonwealth”.
Commonwealth Trade Hot Topics 173.
London: Commonwealth Secretariat.
Suarez, I. (2021) “Health-Tech: The
Road to Universal Health Coverage in
Africa”. Access Partnership, 8 March.
https://www.accesspartnership.com/
health-tech-the-road-to-universal-
health-coverage-in-africa/
Taarifa (2021) “Cross Border Trade
Made Easy Courtesy of Rwanda Trade
Portal”. 12 March. https://taarifa.rw/
cross-border-trade-made-easy-
courtesy-of-rwanda-trade-portal/
Tan, X. and L. Zhang (2020) “Import
Restrictions: The Roadblock to
5016_Book.indb 176 17-06-2021 08:32:33

References \ 177
Sufficient Essential Medical Supplies”.
Contribution to the Policy Hackathon
on Model Provisions for Trade in Times
of Crisis and Pandemic in Regional and
other Trade Agreements. https://www.
unescap.org/sites/default/files/27%20
Final-Team%20Lei%20Zhang-China.pdf
Teodoro, A. and L. Rodriguez (2020)
“Textile and Garment Supply Chains
in Times of COVID-19: Challenges
for Developing Countries”. UNCTAD
Transport and Trade Facilitation
Newsletter 86, Second Quarter 2020,
Article 53, 29 May. https://unctad.
org/news/textile-and-garment-
supply-chains-times-covid-19-
challenges-developing-countries
The Economist (2021a) “Commodity
Prices Are Surging”. 16 January.
https://www.economist.com/
finance-and-economics/2021/01/12/
commodity-prices-are-surging
The Economist (2021b) “What Is
the Economic Cost of Covid-19”. 9
January. https://www.economist.com/
finance-and-economics/2021/01/09/
what-is-the-economic-cost-of-
covid-19
The Economist (2021c) “The World’s
Consumers Are Sitting on Piles of
Cash; Will They Spend It?” 9 March.
https://www.economist.com/
finance-and-economics/2021/03/09/
the-worlds-consumers-are-sitting-
on-piles-of-cash-will-they-spend-it
The Economist (2021d) “The Promise
and Perils of Vaccine Passports”. 26
January. https://www.economist.com/
science-and-technology/2021/01/26/
the-promise-and-perils-
of-vaccine-passports
The Economist (2021e) “The
Mountaineers: Commodity Prices
Are Surging”. 16 January. https://
www.economist.com/finance-
and-economics/2021/01/12/
commodity-prices-are-surging
UN (United Nations) (2015)
“Transforming Our World: The 2030
Agenda for Sustainable Development”.
Resolution Adopted by the General
Assembly on 25 September 2015.
A/RES/70/1, 21 October 2015.
UNCTAD (United Nations Conference
on Trade and Development)
(2017) World Investment Report
2017. Geneva: UNCTAD.
UNCTAD (2019) Digital Economy
Report 2019. Geneva: UNCTAD.
UNCTAD (United Nations Conference
on Trade and Development) (2020a)
World Investment Report 2020:
International Production Beyond the
Pandemic. Geneva: UNCTAD.
UNCTAD (2020b) COVID-19 and
E-Commerce: Impact on Businesses and
Policy Responses. Geneva: UNCTAD.
UNCTAD (2020c) Impact of the
COVID-19 Pandemic on Trade and
Development: Transitioning to a
New Normal. Geneva: UNCTAD.
UNCTAD (2020d) The Least
Developed Countries Report 2020.
Productive Capacity for a New
Decade. Geneva: United UNCTAD.
UNCTAD (2021a) “Global FDI Flows
Down 42% in 2020”. Investment
Trends Monitor 38, January.
UNCTAD (2021b) Technology and
Innovation Report 2021. Catching
Technological Waves. Innovation
with Equity. Geneva: UNCTAD.
UNESCAP (United Nations Economic
and Social Commission for Asia and the
Pacific) (2020) Asia-Pacific Trade and
Investment Trends 2019/2020: Foreign
Direct Investment Trends and Outlook in
Asia and the Pacific. Bangkok: UNESCAP.
UNESCAP (2021) Trade Facilitation in
times of Crisis and Pandemic: Practices
and Lessons from the Asia-Pacific
Region. Bangkok: UNESCAP.
UN Women (2020) “Strengthening
Support for Women Entrepreneurs in
COVID-19 Response and Recovery”.
Guidance Note. New York: UN Women.
UNWTO (United Nations World
Tourism Organization) (2017)
Penetrating the Chinese Outbound
Tourism Market – Successful Practices
and Solutions. Madrid: UNWTO.
UNWTO (2020) “Maldives’ Tourism
Looking Up After Reopening”. https://
www.unwto.org/node/11812
Uwamariya, R., P. Mukamurenzi
and V. Safari (2020) “Managing
Trade Facilitation in Pandemic
Times: The Experience of Rwanda
at the Kiyanzi Dry Port”. UNCTAD
Transport and Trade Facilitation
Newsletter N87, Third Quarter.
Vetter, (2020) “How Do You Make
Covid Recovery Cash Count?
McKinsey Has A Plan”. Forbes, 10
June. https://www.forbes.com/sites/
davidrvetter/2020/06/10/how-do-
you-makecovid-recovery-cash-count-
mckinsey-has-aplan/#4c2fe80b6d60
Vickers, B. (2017) A Handbook
on Regional Integration in Africa:
Towards Agenda 2063. London:
Commonwealth Secretariat.
Vickers, B. (2018) “‘Global Britain’,
Trade and Development: Issues and
Priorities Post-Brexit,” in Khorana,
S. and B. Vickers (eds) Navigating
Uncertainty: Towards a Post-Brexit
Trade and Development Agenda.
London: Commonwealth Secretariat.
Vickers, B., S. Ali and C. Zhuawu
(2020) “Trade in COVID-19-Related
Medical Goods: Issues and Challenges
5016_Book.indb 177 17-06-2021 08:32:33

178 \ Commonwealth Trade Review 2021
for Commonwealth Countries”.
Trade Hot Topics 159. London:
Commonwealth Secretariat.
Vickers, B., S. Ali, N. Balchin, C.
Zhuawu, H. Enos-Edu and K. Powell
(2021) “The Great Race: Ensuring
Equitable Access to COVID-19
Vaccines”. Trade Hot Topic 172. London:
Commonwealth Secretariat.
WEF (World Economic Forum)
(2020) Global Gender Gap
Report 2020. Geneva: WEF.
Willemyns, I. (2020) “Addressing
Digital Services in PTAs: Only
Convergence in the 11th Hour?”
in Hoffmann, R.T. and M. Krajewski
(eds) Coherence and Divergence in
Services Trade Law. Berlin: Springer
WM REDI and CITY REDI (2021)
Weekly Economic Impact Monitor
42, 22 January. https://blog.bham.
ac.uk/cityredi/wp-content/uploads/
sites/15/2021/01/WK-42-v2.pdf
Worker Rights Consortium (2020)
“Hunger in the Apparel Supply Chain:
Survey Findings on Workers’ Access to
Nutrition during COVID-19”. Washington,
DC: Worker Rights Consortium.
World Bank (2018) “Stronger Open Trade
Policies Enable Economic Growth for
All”. Results Brief, 3 April. https://www.
worldbank.org/en/results/2018/04/03/
stronger-open-trade-policies-
enables-economic-growth-for-all
World Bank (2020a) “Global Economic
Prospects, January 2020”. Washington,
DC: World Bank. https://openknowledge.
worldbank.org/handle/10986/33044
World Bank (2020b) “Gender
Dimensions of the COVID-19
Pandemic”. Policy Note, 16 April.
Washington, DC: World Bank.
World Bank (2020c) The African
Continental Free Trade Area:
Economic and Distributional Effects.
Washington, DC: World Bank.
World Bank (2021a) “Global Economic
Prospects, January 2021”. Washington,
DC: World Bank. https://www.
worldbank.org/en/publication/
global-economic-prospects
World Bank (2021b) “Global Economy
to Expand by 4% in 2021; Vaccine
Deployment and Investment Key to
Sustaining the Recovery”. Press Release,
5 January. https://www.worldbank.org/
en/news/press-release/2021/01/05/
global-economy-to-expand-
by-4-percent-in-2021-vaccine-
deployment-and-investment-key-
to-sustaining-the-recovery
WTO (World Trade Organization) (1995)
The Legal Text: The Results of the Uruguay
Round of Multilateral Trade Negotiations.
Cambridge. Cambridge University Press.
WTO (2001) “Declaration on TRIPS
and Public Health”, WTO Document
WT/MIN(01)/DEC/2, 20 November.
WTO (2011) The WTO and Preferential
Trade Agreements: From Co-existence
to Coherence. Geneva: WTO.
WTO (2015) World Trade Report
2015: Speeding up Trade Benefits
and Challenges of Implementing
the WTO Trade Facilitation
Agreement. Geneva: WTO.
WTO (2019) “WTO Members Mark
Milestone in Implementation of Trade
Facilitation Agreement”. 16 October.
https://www.wto.org/english/news_e/
news19_e/fac_24oct19_e.htm
WTO (2017) World Trade Report
2017: Trade, Technology and
Jobs. Geneva: WTO.
WTO (World Trade Organization)
(2020a) World Trade Statistical Review
2020. Geneva: WTO. https://www.
wto.org/english/res_e/statis_e/
wts2020_e/wts2020_e.pdf
WTO (2020b) Trade in Services in the
Context of COVID-19. Geneva: WTO.
WTO (2020c) “The WTO’s 25 Years of
Achievement and Challenges”. Message
from the Director-General, 1 January.
https://www.wto.org/english/news_e/
news20_e/dgra_01jan20_e.htm
WTO (2020d) “Report of G20
Trade Measures (Mid-May 2020
to Mid-October 2020)”. WTO
Secretariat, 18 November.
WTO (2020e) “Response to the
COVID-19 Pandemic: Ensuring the Free
Flow of Trade in Essential Goods for
Combating the COVID-19 Pandemic”.
WTO Document G/C/W/777, 16 April.
WTO (2020f) “Statement on
COVID-19 and the Multilateral Trading
System by Ministers Responsible
for the WTO”. WTO Document
WT/GC/212/Rev.1, 29 May.
WTO (2020g) “Response to the
COVID-19 Pandemic with Open and
Predictable Trade in Agriculture and
Food Products”. WTO Document
WT/GC/208/Rev.2, 29 May.
WTO (2020h) “June 2020
Statement of the Ottawa Group:
Focusing Action on COVID-19”.
Communication from Canada, WTO
Document WT/GC/217, 16 June.
WTO (2020i) “Notification”. WTO
Document G/SPS/N/ZAF/67, 16 April.
WTO (2020j) “Waiver from Certain
Provisions of the TRIPS Agreement
for the Prevention, Containment
5016_Book.indb 178 17-06-2021 08:32:33

References \ 179
and Treatment of COVID-19:
Communication from India and
South Africa”. WTO Document
IP/C/W/669, 2 October.
WTO (2020k) “Developing and
Delivering COVID-19 Vaccines around
the World: An Information Note
about Issues with Trade Impact”.
Geneva: WTO Secretariat.
WTO (2020l) “Export Prohibitions
and Restrictions”. Information Note.
Geneva: WTO Secretariat.
WTO (2020m) “Communication
on Trade and Environmental
Sustainability”. WTO Document
WT/CTE/W/249, 17 November.
WTO (2020n) “Trade Related
Challenges of the Least Developed
Countries and Way Forward: A Draft
for MC Decision”. WTO Document
WT/GC/W/807, 17 November.
WTO (2021a) ‘Services trade
recovery not yet in sight’. Available
at: https://www.wto.org/english/
news_e/news21_e/serv_26jan21_
e.htm
WTO (2021b) Adapting to the
Digital Trade Era: Challenges and
Opportunities. Geneva: WTO.
WTO (World Trade Organization),
WIPO (World Intellectual Property
Organization) and WHO (World
Health Organization) (2020) Promoting
Access to Medical Technologies
and Innovations: Intersections
between Public Health, Intellectual
Property Rights and Trade.
Geneva: WTO.
Xu, J., S. Gelb, J. Li and Z. Zhao
(2017) “Adjusting to Rising Costs
in Chinese Light Manufacturing.
What Opportunities for Developing
Countries?” Beijing and London:
CNSE, Peking University, and ODI.
Yamaguchi, S. (2021) “International
Trade and Circular Economy - Policy
Alignment”. Trade and Environment
Working Paper 2021/02. Paris: OECD.
5016_Book.indb 179 17-06-2021 08:32:33