employment-based health benefits: trends in … rate (the ent in ... employment-based health...
TRANSCRIPT
A
A
ECB
A monthly resear
April 2012 • No
EmploymCoveragBy Paul Fro
Since 20have ac
Both thebased hoffered of work
The tak86 perc
Between70.1 pecent to
Two-thiup from
In 2010not offeeligible chose n
Between23.2 pecoverag
In 2010cent in 8.1 percprogram
Among and 41.
Eligible likely touninsure
rch report from th
o. 370
ment-Bge, 1997onstin, Ph.D
002 the perceccess to covera
e offer rate (thhealth benefitshealth benefit
kers covered by
ke-up rate (theent in 1997 to
n 1997 and 20rcent to 67.5 56.5 percent.
rds of workersm one-half in 1
0, 46.7 percenter health benefor those bene
not to participa
n 1997 and 20rcent to 29.1
ge, down from
0, one-half of w1997. In contrcent purchasems.
workers who 1 percent had
workers with o be covered bed in 2010, w
he EBRI Educatio
Based He7−2010
D., Employee
ntage of workage.
he percentages declined betwts from their ey those plans
e percentage oo 83.6 percent
010, the percepercent, and t
s not eligible f997.
t of wage andfits. Another 1efits. One-quaate.
010, the percepercent. In 20 78.9 percent
workers whoserast, 29.7 percd health insur
were not eligid employment-
access to heaby employmenthereas 62.8 p
on and Research
ealth Be0 ee Benefit R
A T A
kers with healt
e of workers ofween 1997 andemployers decdecreased fro
of workers takt in 2010.
entage of workthe percentage
for their emplo
salary worker14.7 percent warter of worker
entage of work010, two-thirdsin 1997.
e employers dcent of those wance directly f
ble for their em-based health
lth benefits tht-based healthercent had em
h Fund © 2012 E
enefits:
Research Ins
G L A N
th coverage ha
ffered a healthd 2010. Betwreased from 7
om 60.3 percen
ing coverage w
kers offered hee of workers c
oyers’ health p
rs ages 18–64worked for emrs reported tha
kers who declis reported tha
id not offer heworkers had efrom insurers,
mployers’ heabenefits as de
hrough their owh benefits as dmployment-bas
Employee Benefit
Trends
nstitute
C E
as been declin
h benefit) andween 1997 and70.1 percent tont to 56.5 perc
when offered
ealth benefits covered by tho
plans reported
4 reported thatployers that pat they were o
ned coverage at they decline
ealth benefits employment-b and 11.7 perc
lth plans, 38.7ependents.
wn jobs were dependents. Ssed health ben
t Research Instit
s in Acce
ning, mostly be
d the coveraged 2010, the peo 67.5 percentcent.
by their emplo
from their emose plans decr
that they wor
t they worked provided healthoffered health
because of coed coverage be
were uninsureased health becent were cov
7 percent were
less likely to bpecifically, 24nefits as depe
tute
ess and
ecause fewer w
e rate for empercentage of wt, and the perc
oyers) decline
mployers decrereased from 60
rked part time
for employersh benefits but benefits but t
ost increased fecause they h
ed, up from 44enefits as depvered by public
e uninsured in
be uninsured a.8 percent wendents.
d
workers
loyment-workers centage
ed from
eased from 0.3 per-
e in 2010,
s that did were not
they
from ad other
4.1 per-pendents, c
n 2010,
and more re

ebri.org Issue Brief • April 2012 • No. 370 2
Paul Fronstin is director of the Health Research and Education Program at the Employee Benefit Research Institute (EBRI). This Issue Brief was written with assistance from the Institute’s research and editorial staffs. Any views expressed in this report are those of the author and should not be ascribed to the officers, trustees, or other sponsors of EBRI, EBRI-ERF, or their staffs. Neither EBRI nor EBRI-ERF lobbies or takes positions on specific policy proposals. EBRI invites comment on this research.
Copyright Information: This report is copyrighted by the Employee Benefit Research Institute (EBRI). It may be used without permission but citation of the source is required.
Recommended Citation: Paul Fronstin, “Employment-Based Health Benefits: Trends in Access and Coverage, 1997−2010,” EBRI Issue Brief, no. 370 (April 2012).
Report availability: This report is available on the Internet at www.ebri.org
Table of Contents
Introduction .......................................................................................................................................................... 4
Offer Rates and Take-Up Rates .............................................................................................................................. 4
Reasons Why Workers Do Not Have Coverage ......................................................................................................... 4
Sources of Coverage Among Workers Without Own-Name Coverage ......................................................................... 6
Why Workers Are Uninsured ................................................................................................................................... 6
Offer Rates, Take-Up Rates, and Job Characteristics .............................................................................................. 10
Firm Size ......................................................................................................................................................... 10
Hours of Work ................................................................................................................................................. 10
Sector of Employment ...................................................................................................................................... 14
Unionization .................................................................................................................................................... 14
Offer Rates, Take-Up Rates, and Demographics ..................................................................................................... 14
Gender and Age .............................................................................................................................................. 14
Race/Ethnicity ................................................................................................................................................. 19
Education ........................................................................................................................................................ 19
Why Workers Are Not Covered, by Job Characteristics ............................................................................................ 19
Firm Size ......................................................................................................................................................... 19
Hours of Work ................................................................................................................................................. 23
Sector of Employment ...................................................................................................................................... 23
Unionization .................................................................................................................................................... 24
Why Workers Are Not Covered, by Demographics .................................................................................................. 24
Gender and Age .............................................................................................................................................. 24
Race/Ethnicity ................................................................................................................................................. 24
Education ........................................................................................................................................................ 24
Data and Methods Appendix ................................................................................................................................. 28
References .......................................................................................................................................................... 34
Figures Figure 1, Sponsorship Rates, Offer Rates, Participation Rates, and Take-Up Rates, Select Years .................................. 5
Figure 2, Sources of Health Insurance, Wage and Salary Workers, Select Years ......................................................... 5
Figure 3, Reasons Why Employee Is Not Covered by Own Employer’s Health Plan, Select Years .................................. 7
Figure 4, Reasons for Being Ineligible Among Workers Not Participating for Own Employer’s Health Plan, Select Years .................................................................................................................................................... 7

ebri.org Issue Brief • April 2012 • No. 370 3
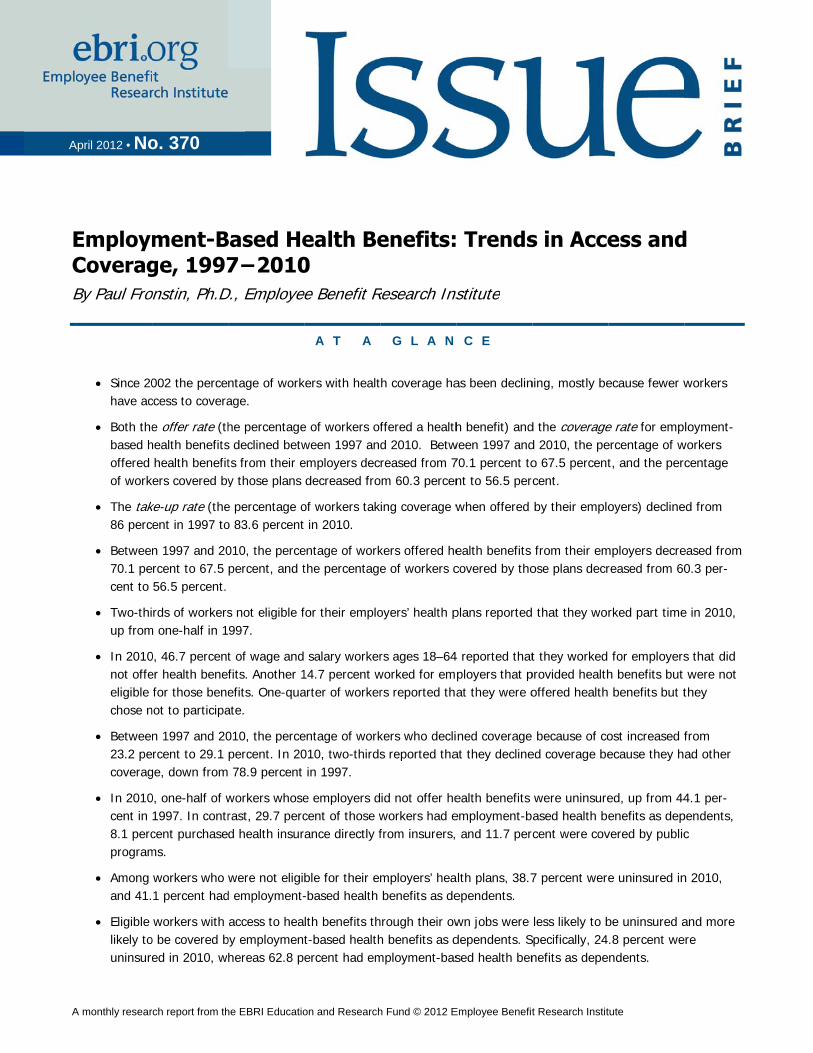
Figure 5, Reasons for Workers Choosing Not to Participate in Own Employer's Health Plan, Select Years ...................... 8
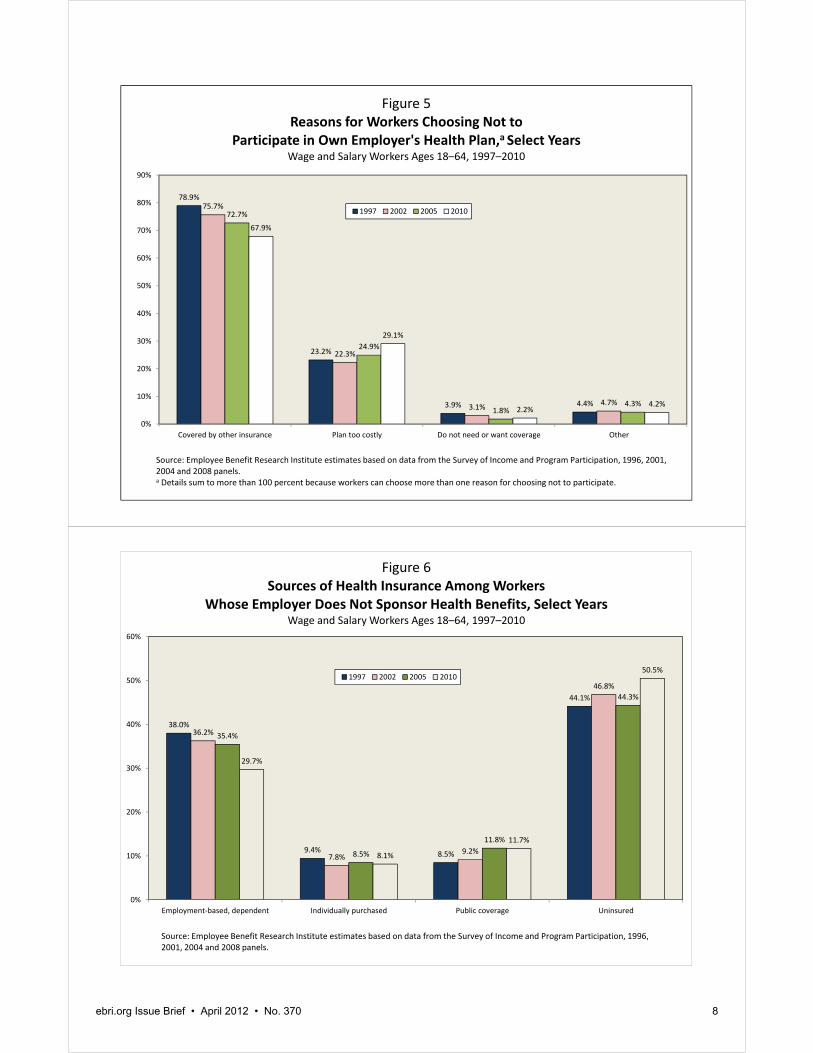
Figure 6, Sources of Health Insurance Among Workers Whose Employer Does Not Sponsor Health Benefits, Select Years .................................................................................................................................................... 8
Figure 7, Sources of Health Insurance Among Workers Who Are Not Eligible for Their Employer's Health Plan, Select Years .................................................................................................................................................... 9
Figure 8, Sources of Health Insurance Among Workers Who Choose Not to Participate in Their Employer's Health Plan, Select Years ................................................................................................................................. 9
Figure 9, Reasons Why Uninsured Employee Is Not Covered by Own Employer's Health Plan, Select Years ................ 11
Figure 10, Reasons for Being Ineligible Among Uninsured Workers Not Participating for Own Employer's Health Plan, Select Years ............................................................................................................................... 11
Figure 11, Reasons for Uninsured Workers Choosing Not to Participate in Own Employer’s Health Plan, Select Years .................................................................................................................................................. 12
Figure 12, Offer Rates, by Firm Size, Select Years .................................................................................................. 12
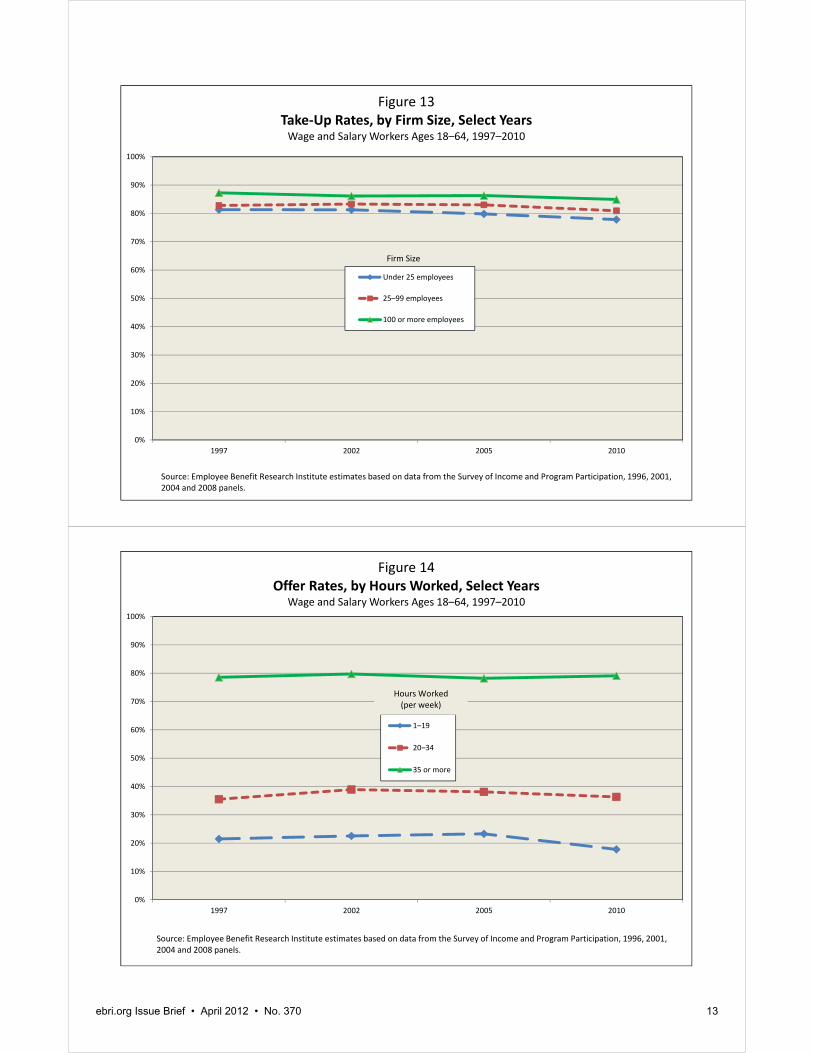
Figure 13, Take-Up Rates, by Firm Size, Select Years ............................................................................................. 13
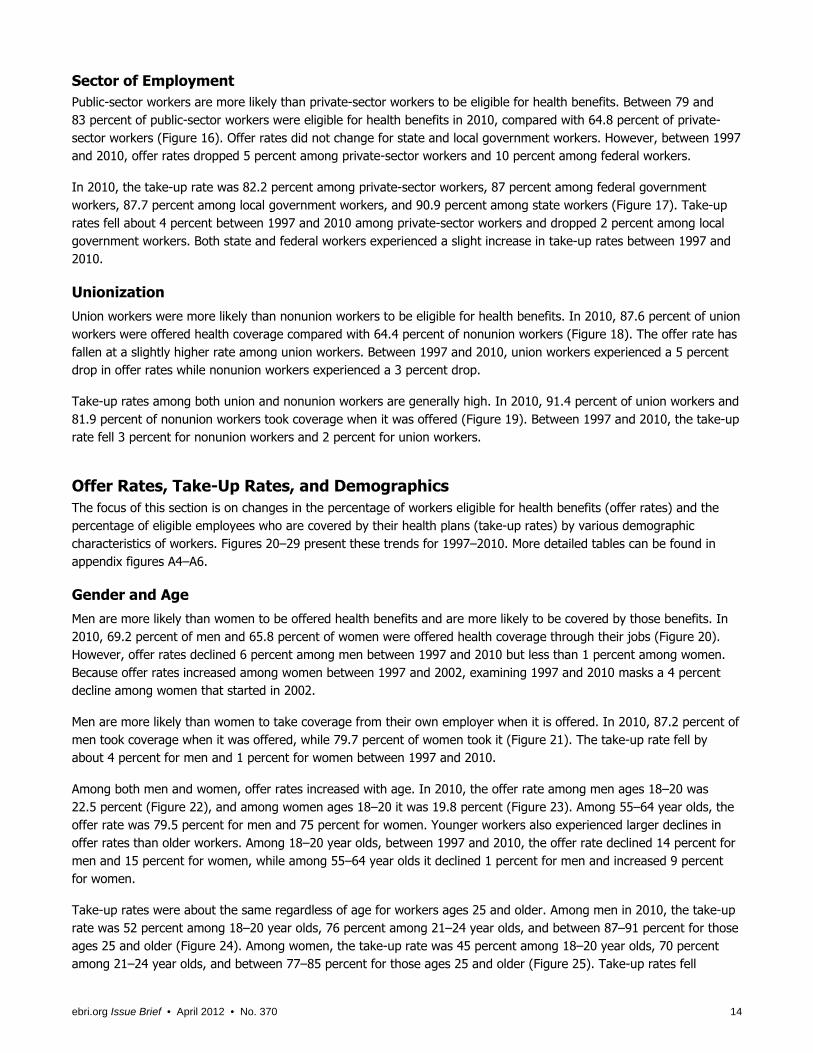
Figure 14, Offer Rates, by Hours Worked, Select Years ........................................................................................... 13
Figure 15, Take-Up Rates, by Hours Worked, Select Years ...................................................................................... 15
Figure 16, Offer Rates, by Sector of Employment, Select Years ............................................................................... 15
Figure 17, Take-Up Rates, by Sector of Employment, Select Years .......................................................................... 16
Figure 18, Offer Rates, by Union Status, Select Years ............................................................................................. 16
Figure 19 Take-Up Rates, by Union Status, Select Years ......................................................................................... 17
Figure 20, Offer Rates, by Gender, Select Years ..................................................................................................... 17
Figure 21, Take-Up Rates, by Gender, Select Years ................................................................................................ 18
Figure 22, Offer Rates, by Age, Male Wage and Salary Workers, Select Years .......................................................... 18
Figure 23, Offer Rates, by Age, Female Wage and Salary Workers, Select Years ....................................................... 20
Figure 24, Take-Up Rates, by Age, Male Wage and Salary Workers, Select Years ..................................................... 20
Figure 25, Take-Up Rates, by Age, Female Wage and Salary Workers, Select Years .................................................. 21
Figure 26, Offer Rates, by Race, Select Years ........................................................................................................ 21
Figure 27, Take-Up Rates, by Race, Select Years ................................................................................................... 22
Figure 28, Offer Rates, by Education, Select Years ................................................................................................. 22
Figure 29, Take-Up Rates, by Education, Select Years ............................................................................................ 23
Figure 30, Reasons Why Employee Is Not Covered by Own Employer’s Health Plan, by Firm Size, Select Years .......... 25
Figure 31, Reasons Why Employee Is Not Covered by Own Employer’s Health Plan, by Hours of Work, Select Years .................................................................................................................................................. 25
Figure 32, Reasons Why Employee Is Not Covered by Own Employer’s Health Plan, by Class of Worker and Unionization, Select Years .............................................................................................................................. 26
Figure 33, Reasons Why Employee Is Not Covered by Own Employer’s Health Plan, by Age and Gender, Select Years .................................................................................................................................................. 27
Figure 34, Reasons Why Employee Is Not Covered by Own Employer’s Health Plan, by Race/Ethnicity, Select Years ... 29
Figure 35, Reasons Why Employee Is Not Covered by Own Employer’s Health Plan, by Education, Select Years.......... 29
Figure A1, Sponsorship Rates, Offer Rates, Participation Rates, and Take-Up Rates, by Firm Size, Select Years .......... 30
Figure A2, Sponsorship Rates, Offer Rates, Participation Rates, and Take-Up Rates, by Hours of Work, Select Years .. 30
Figure A3, Sponsorship Rates, Offer Rates, Participation Rates, and Take-Up Rates, by Class of Worker and Unionization, Select Years .............................................................................................................................. 31
Figure A4, Sponsorship Rates, Offer Rates, Participation Rates, and Take-Up Rates, by Age and Gender, Select Years .................................................................................................................................................. 32
Figure A5, Sponsorship Rates, Offer Rates, Participation Rates, and Take-Up Rates, by Race/Ethnicity, Select Years .................................................................................................................................................. 33
Figure A6, Sponsorship Rates, Offer Rates, Participation Rates, and Take-Up Rates, by Education, Select Years ......... 33

ebri.org Issue Brief • April 2012 • No. 370 4
Employment-Based Health Benefits: Trends in Access and Coverage, 1997−2010 By Paul Fronstin, Ph.D., Employee Benefit Research Institute
Introduction Employment-based health benefits are the most common form of health insurance in the United States. In 2010, 58.7 percent of nonelderly individuals were covered by employment-based health plans, with 68.6 percent of working adults covered, 35.3 percent of non-working adults covered, and 54.8 percent of children covered (Fronstin, 2011).
The percentage of the population with employment-based health benefits has been declining, most recently due to the 2007–2009 recession. The percentage of individuals under age 65 with employment-based health benefits fell from 62.4 percent in 2008 to 58.7 percent in 2010, and the percentage of workers with coverage through their own employers fell from 54.2 percent in 2007 to 51.5 percent in 2010, its lowest level since 1994 (Fronstin, 2011).
The purpose of this Issue Brief is to examine the state of employment-based health benefits among workers with respect to offer rates, coverage rates, and take-up rates. It also examines how the state of employment-based health benefits has changed since the mid-1990s, reasons why workers do not have employment-based health benefits from their own employers, and how these reasons have changed since the 1990s. The estimates presented in this paper can also serve as a baseline against which to measure the impact of the Patient Protection and Affordable Care Act of 2010 (PPACA) on employment-based health benefits in the future.
Offer Rates and Take-Up Rates Overall, the percentage of individuals working for employers that sponsor a health plan increased between 1997 and 2002. In 1997, 79.8 percent of workers were employed by firms that sponsored health plans (Figure 1), and by 2002 that had increased to 81.1 percent. During that same period, the percentage of workers offered health benefits (the offer rate) increased from 70.1 percent to 71.6 percent, and the percentage of workers covered by health plans increased from 60.3 percent to 61 percent.
However, since 2002, the percentage of individuals working for employers that sponsor health plans has been declining, as has the percentage of workers offered coverage and the percentage of workers covered by their own employers’ health plans. The decline in take-up rates experienced between 1997 and 2002 has continued as well. The percentage of workers eligible for coverage fell from 71.6 percent to 67.5 percent between 2002 and 2010; the percentage with coverage fell from 61 percent to 56.5 percent.
Despite the fact that offer and coverage rates increased during the 1997–2002 period, the percentage of workers taking coverage when it was offered (the take-up rate) declined from 86 percent to 85.2 percent—a decline that continued after 2002, with the take-up rate falling to 83.6 percent by 2010.
During the decline in eligibility and coverage, the percentage of workers with health benefits as dependents declined as well. In 1997, 20.4 percent of workers had employment-based coverage as dependents (Figure 2). By 2010, 18.2 per-cent had coverage as dependents. The likelihood that a worker was uninsured was in large part unchanged between 1997 and 2005, but then jumped to 17.8 percent in 2010.
Reasons Why Workers Do Not Have Coverage There are a number of reasons why workers may not be covered by their employer’s health plans. In 2010, 46.7 per-cent of wage and salary workers ages 18–64 reported that they worked for employers that did not offer health

79.8%
70.1%
60.3%
86.0%
81.1%
71.6%
61.0%
85.2%
79.0%
69.4%
59.0%
85.1%
77.2%
67.5%
56.5%
83.6%
0%
10%
20%
30%
40%
50%
60%
70%
80%
90%
100%
Sponsorship rate Offer rate Participation rate Take‐up rate
Figure 1Sponsorship Rates, Offer Rates, Participation
Rates, and Take‐Up Rates, Select YearsWage and Salary Workers, Ages 18−64, Select Years, 1997−2010
1997 2002 2005 2010
Source: Employee Benefit Research Institute estimates based on data from the Survey of Income and Program Participation, 1996, 2001, 2004 and 2008 panels.
60.3%
20.4%
3.0% 2.9%
13.9%
61.0%
19.2%
2.5% 3.4%
14.2%
59.0%
19.3%
3.1%4.7%
14.1%
56.5%
18.2%
2.9%4.9%
17.8%
0%
10%
20%
30%
40%
50%
60%
70%
Employment‐based, own name Employment‐based,dependent
Individually purchased Public coverage Uninsured
Figure 2Sources of Health Insurance, Select Years Wage and Salary Workers, Ages 18–64, 1997–2010
1997 2002 2005 2010
Source: Employee Benefit Research Institute estimates based on data from the Survey of Income and Program Participation, 1996, 2001, 2004 and 2008 panels.
ebri.org Issue Brief • April 2012 • No. 370 5

ebri.org Issue Brief • April 2012 • No. 370 6
benefits (Figure 3). Another 14.7 percent worked for employers that provided health benefits but were not eligible for those benefits. One-quarter (25.2 percent) reported that they were offered health benefits but chose not to participate.
Between 1997 and 2010, the percentage of workers reporting that their employers did not offer a plan increased from 41.6 percent to 46.7 percent. There were slight declines in the percentage reporting that they were not eligible for the plans, and a generally stable rate (at about 25 percent) of those saying they chose not to be covered. At the same time, the percentage reporting “don’t know” decreased from 16.9 percent in 1997 to 13.4 percent in 2010.
Workers were much more likely to report that they were not eligible for health benefits because they worked part time. Specifically, 67.2 percent of workers reported that they were ineligible because of their part-time status in 2010. Workers not eligible for their employers’ health plans provided a number of reasons. As shown in Figure 4, in 2010, nearly one-fifth (19.4 percent) reported that they had not completed the required waiting period, while 9.1 percent reported that they were not eligible because they were employed either on a contract or temporary basis. Between 1997 and 2010, the percentage of workers reporting that they were not eligible for health coverage because they worked part time increased from 51 percent to 67.2 percent, while the percentage reporting that they had not completed the waiting period dropped from 34.8 percent to 19.4 percent. The percentage reporting that they were contract or temporary employees was little changed.
Among the reasons given by those who chose not to participate in their employer’s health plan, two-thirds (67.9 per-cent) stated that they were covered by other health insurance in 2010 (Figure 5). Nearly 3 in 10 (29.1 percent) reported that their employer’s plan was too costly, and another 2.2 percent reported either that they did not need insurance or that they did not want insurance. Since 1997, the percentage reporting that they declined coverage because they were covered by other insurance fell from 78.9 percent to 67.9 percent, while the percentage reporting that their employers’ plans were too costly increased from 23.2 percent to 29.1 percent.
Sources of Coverage Among Workers Without Own-Name Coverage As mentioned above, there are three main reasons why workers would not have coverage from their own employers: The employer does not offer coverage, the employee is not eligible for coverage, or the employee declined coverage that he or she was eligible for. Workers whose employers do not offer health benefits are more likely to be uninsured than to have employment-based health benefits as dependents. In addition, the percentage uninsured has been generally increasing, while the percentage with coverage as dependents has been decreasing. In 2010, 50.5 percent of workers whose employers did not offer health benefits were uninsured, up from 44.1 percent in 1997 (Figure 6), while contrast, 29.7 percent of those workers had employment-based health benefits as dependents in 2010, down from 38 percent in 1997.
Among workers who were not eligible for their employers’ health plans, 38.7 percent were uninsured in 2010, 41.1 per-cent had employment-based health benefits as dependents, 7.8 percent purchased health insurance directly from insurers, and 12.4 percent were covered by public programs (Figure 7).
Workers with access to health benefits through their own job were much less likely to be uninsured and much more likely to be covered by employment-based health benefits as dependents. Specifically, 24.8 percent were uninsured in 2010, while 62.8 percent had employment-based health benefits as dependents (Figure 8). However, the percentage uninsured has been trending higher while the percentage with employment-based coverage as dependents has been trending lower. Between 1997 and 2002, the percentage of workers declining coverage as dependents fell from 74.3 percent to 62.8 percent, while the uninsured rate increased from 17.7 percent to 24.8 percent among workers declining coverage.
Why Workers Are Uninsured The majority of uninsured workers report that they are not covered by health benefits because their employers did not offer coverage. In 2010, 58.2 percent of uninsured workers reported that they worked for employers that did not offer

41.6%
17.2%
24.3%
16.9%
40.8%
15.7%
27.0%
16.5%
43.9%
14.9%
25.0%
16.2%
46.7%
14.7%
25.2%
13.4%
0%
5%
10%
15%
20%
25%
30%
35%
40%
45%
50%
Employer does not offer coverage Employee is ineligible for plan Employee chose not to be covered Don't know
Figure 3Reasons Why Employees Are Not Covered by Own Employer's Health Plan, Select YearsWage and Salary Workers Ages 18–64, 1997–2010
1997 2002 2005 2010
Source: Employee Benefit Research Institute estimates based on data from the Survey of Income and Program Participation, 1996, 2001, 2004 and 2008 panels.
34.8%
11.7%
51.0%
6.1%
28.2%
9.3%
58.4%
7.2%
28.6%
9.9%
56.5%
7.0%
19.4%
9.1%
67.2%
6.7%
0%
10%
20%
30%
40%
50%
60%
70%
80%
Waiting period not completed Contract or temporary employee Part‐time employee Other
Figure 4Reasons for Being Ineligible Among Workers Not
Participating in Own Employer's Health Plan,a Select YearsWage and Salary Workers Ages 18–64, 1997–2010
1997 2002 2005 2010
Source: Employee Benefit Research Institute estimates based on data from the Survey of Income and Program Participation, 1996, 2001, 2004 and 2008 panels.a Details sum to more than 100 percent because workers can choose more than one reason for being ineligible.
ebri.org Issue Brief • April 2012 • No. 370 7
78.9%
23.2%
3.9% 4.4%
75.7%
22.3%
3.1%4.7%
72.7%
24.9%
1.8%4.3%
67.9%
29.1%
2.2%4.2%
0%
10%
20%
30%
40%
50%
60%
70%
80%
90%
Covered by other insurance Plan too costly Do not need or want coverage Other
Figure 5Reasons for Workers Choosing Not to
Participate in Own Employer's Health Plan,a Select YearsWage and Salary Workers Ages 18–64, 1997–2010
1997 2002 2005 2010
Source: Employee Benefit Research Institute estimates based on data from the Survey of Income and Program Participation, 1996, 2001, 2004 and 2008 panels.a Details sum to more than 100 percent because workers can choose more than one reason for choosing not to participate.
38.0%
9.4%8.5%
44.1%
36.2%
7.8%9.2%
46.8%
35.4%
8.5%
11.8%
44.3%
29.7%
8.1%
11.7%
50.5%
0%
10%
20%
30%
40%
50%
60%
Employment‐based, dependent Individually purchased Public coverage Uninsured
Figure 6Sources of Health Insurance Among Workers
Whose Employer Does Not Sponsor Health Benefits, Select YearsWage and Salary Workers Ages 18–64, 1997–2010
1997 2002 2005 2010
Source: Employee Benefit Research Institute estimates based on data from the Survey of Income and Program Participation, 1996, 2001, 2004 and 2008 panels.
ebri.org Issue Brief • April 2012 • No. 370 8

43.0%
8.0% 8.7%
40.3%
46.1%
6.2%7.4%
40.3%
46.7%
7.3%
11.3%
34.7%
41.1%
7.8%
12.4%
38.7%
0%
5%
10%
15%
20%
25%
30%
35%
40%
45%
50%
Employment‐based, dependent Individually purchased Public coverage Uninsured
Figure 7Sources of Health Insurance Among Workers Who
Are Not Eligible for Their Employer's Health Plan, Select YearsWage and Salary Workers Ages 18–64, 1997–2010
1997 2002 2005 2010
Source: Employee Benefit Research Institute estimates based on data from the Survey of Income and Program Participation, 1996, 2001, 2004 and 2008 panels.
74.3%
3.7% 4.4%
17.7%
70.7%
2.9%
6.7%
19.7%
68.2%
3.4%
8.8%
19.5%
62.8%
3.5%
8.9%
24.8%
0%
10%
20%
30%
40%
50%
60%
70%
80%
Employment‐based, dependent Individually purchased Public coverage Uninsured
Figure 8Sources of Health Insurance Among Workers Who
Choose Not to Participate in Their Employer's Health Plan, Select YearsWage and Salary Workers Ages 18–64, 1997–2010
1997 2002 2005 2010
Source: Employee Benefit Research Institute estimates based on data from the Survey of Income and Program Participation, 1996, 2001, 2004 and 2008 panels.
ebri.org Issue Brief • April 2012 • No. 370 9

ebri.org Issue Brief • April 2012 • No. 370 10
health benefits to any employees (Figure 9). This is up from 53.1 percent in 1997. Fourteen percent of uninsured workers were not eligible for their employers’ plans in 2010, down from 20 percent in 1997. And 15.4 percent of uninsured workers chose not to be covered, up from 12.4 percent in 1997.
Uninsured workers were not eligible for health benefits offered by their employers for a number of reasons. In 2010, 54.3 percent of workers reported that they were not eligible because they were employed part time, up from 36.4 per-cent in 1997 (Figure 10). Nearly 29 percent reported that they had not completed the required waiting period in 2010, down from 49.1 percent in 1997. And 10.5 percent reported that they were employed either on a contract or temporary basis, down slightly from 12.3 percent in 1997, though this figure has been trending upward since 2002.
When uninsured workers were eligible for health benefits, most reported that they had declined coverage because the plans were too costly. In 2010, 77.2 percent declined coverage on that basis, up from 64 percent in 2002 (Figure 11). Almost 6 percent reported that they had declined coverage because they did not need or want coverage in 2010, down from 9.2 percent in 2002. More than 17 percent reported that they declined coverage for some other reason in 2010.
Offer Rates, Take-Up Rates, and Job Characteristics While overall offer and take-up rates both fell between 1997 and 2010, these variables also fell for various subgroups of workers, often at different rates. In addition, the level of offer rates varies across different subgroups. There is often little or no variation in take-up rates across different subgroups.
In the remainder of this section, trends in offer rates and take-up rates are examined by worker job characteristics. Figures 12–19 present these trends for various job characteristics for 1997–2010. More detailed information on the total number of workers employed by firms that sponsor health benefits, the total number offered health benefits, and the total number covered by health benefits are presented in the appendix.
Firm Size Offer rates increase with firm size. In 2010, 39.4 percent of workers in firms with fewer than 25 employees were offered health benefits, compared with 76.5 percent in firms with 100 or more employees (Figure 12). The offer rate among workers in firms with fewer than 25 employees fell about 8 percent since 1997. It was unchanged for workers in firms with 25–99 employees, and it fell about 4 percent among workers in firms with 100 or more employees.
Take-up rates, while they vary with firm size, do so much less than offer rates. For instance, in 2010, 77.8 percent of workers in firms with fewer than 25 employees took coverage when it was offered, compared with 84.9 percent of workers in firms with 100 or more employees (Figure 13). Take-up rates have declined about 4 percent since 1997 among workers in firms with fewer than 25 workers; 2 percent among workers in firms with 25–99 workers; and 3 per-cent among workers in firms with 100 or more employees.
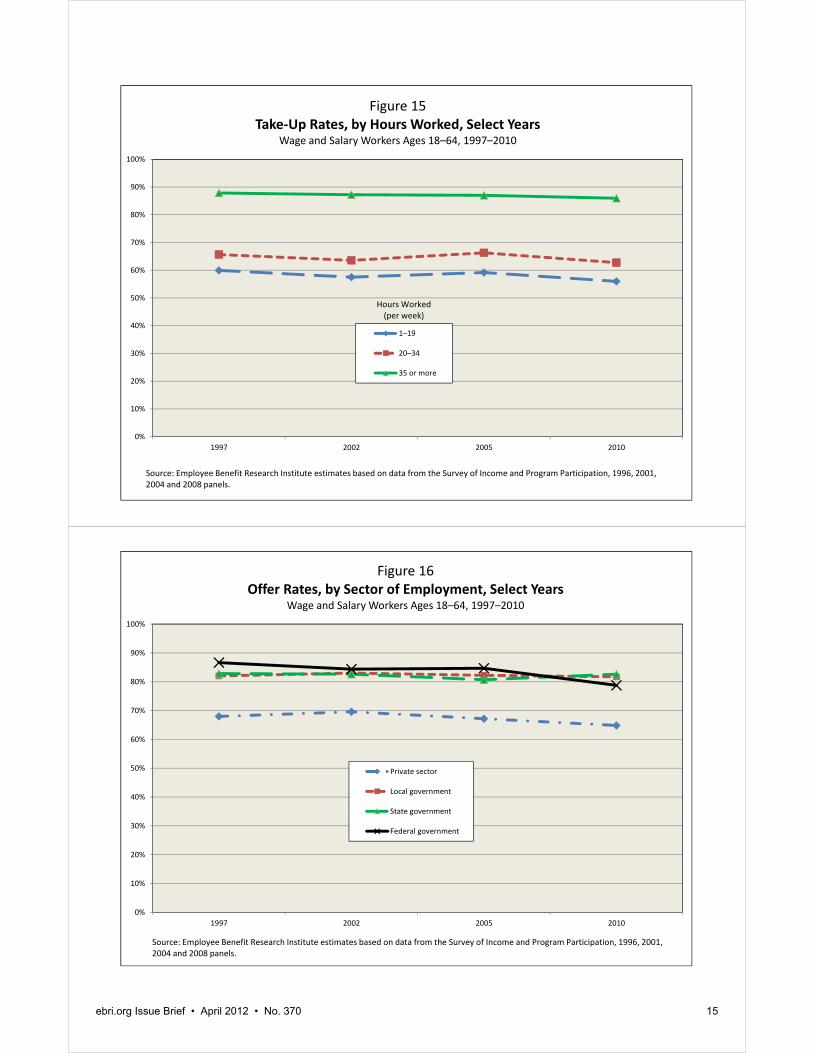
Hours of Work Offer rates increase with hours of work. Nearly 80 percent of full-time workers were eligible for health benefits in 2010, compared with 36.3 percent of workers employed 20–34 hours per week, and 17.8 percent of workers employed 1–19 hours per week (Figure 14). Between 1997 and 2010, offer rates increased slightly for full-time workers and for workers employed 20–34 hours per week. While the offer rate fell from 21.5 percent to 17.8 percent among workers employed 1–19 hours per week, a 3.7 percentage point drop (from 21.5 percent) is a 21 percent drop in the likelihood that a worker was offered coverage.
Take-up rates for workers eligible for health benefits were highest among full-time workers: 85.9 percent of them took coverage when it was offered, compared with 62.7 percent among workers employed 20–34 hours per week and 56 percent among those employed less than 20 hours per week (Figure 15). Take up rates are little changed for full-time workers but have dropped 7 percent among those employed less than 20 hours per week.

53.1%
20.0%
12.4%14.4%
53.0%
17.5%14.8% 14.7%
56.8%
15.1% 14.3% 13.9%
58.2%
14.0%15.4%
12.4%
0%
10%
20%
30%
40%
50%
60%
70%
Employer does not offer coverage Employee is ineligible for plan Employee chose not to be covered Don't know
Figure 9Reasons Why Uninsured Employee Is Not
Covered by Own Employer's Health Plan, Select YearsWage and Salary Workers Ages 18–64, 1997–2010
1997 2002 2005 2010
Source: Employee Benefit Research Institute estimates based on data from the Survey of Income and Program Participation, 1996, 2001, 2004 and 2008 panels.
49.1%
12.3%
36.4%
6.1%
38.2%
8.6%
46.5%
9.3%
43.7%
10.0%
41.6%
7.1%
28.9%
10.5%
54.3%
7.9%
0%
10%
20%
30%
40%
50%
60%
Waiting period not completed Contract or temporary employee Part‐time employee Other
Figure 10Reasons for Being Ineligible Among Uninsured Workers
Not Participating in Own Employer's Health Plan,a Select YearsWage and Salary Workers Ages 18–64, 1997–2010
1997 2002 2005 2010
Source: Employee Benefit Research Institute estimates based on data from the Survey of Income and Program Participation, 1996, 2001, 2004 and 2008 panels.a Details sum to more than 100 percent because workers can choose more than one reason for being ineligible.
ebri.org Issue Brief • April 2012 • No. 370 11

73.0%
7.0%
20.0%
64.0%
9.2%
26.7%
72.1%
6.0%
21.9%
77.2%
5.6%
17.3%
0%
10%
20%
30%
40%
50%
60%
70%
80%
90%
Plan too costly Does not need or want coverage Other
Figure 11Reasons for Uninsured Workers Choosing Not
to Participate in Own Employer's Health Plan, Select YearsWage and Salary Workers Ages 18–64, 1997–2010
1997 2002 2005 2010
Source: Employee Benefit Research Institute estimates based on data from the Survey of Income and Program Participation, 1996, 2001, 2004 and 2008 panels.
0%
10%
20%
30%
40%
50%
60%
70%
80%
90%
100%
1997 2002 2005 2010
Figure 12Offer Rates, by Firm Size, Select YearsWage and Salary Workers Ages 18–64, 1997–2010
Under 25 employees
25–99 employees
100 or more employees
Source: Employee Benefit Research Institute estimates based on data from the Survey of Income and Program Participation, 1996, 2001, 2004 and 2008 panels.
Firm Size
ebri.org Issue Brief • April 2012 • No. 370 12
0%
10%
20%
30%
40%
50%
60%
70%
80%
90%
100%
1997 2002 2005 2010
Figure 13Take‐Up Rates, by Firm Size, Select YearsWage and Salary Workers Ages 18–64, 1997–2010
Under 25 employees
25–99 employees
100 or more employees
Source: Employee Benefit Research Institute estimates based on data from the Survey of Income and Program Participation, 1996, 2001, 2004 and 2008 panels.
Firm Size
0%
10%
20%
30%
40%
50%
60%
70%
80%
90%
100%
1997 2002 2005 2010
Figure 14Offer Rates, by Hours Worked, Select Years
Wage and Salary Workers Ages 18–64, 1997–2010
1–19
20–34
35 or more
Source: Employee Benefit Research Institute estimates based on data from the Survey of Income and Program Participation, 1996, 2001, 2004 and 2008 panels.
Hours Worked (per week)
ebri.org Issue Brief • April 2012 • No. 370 13
ebri.org Issue Brief • April 2012 • No. 370 14
Sector of Employment Public-sector workers are more likely than private-sector workers to be eligible for health benefits. Between 79 and 83 percent of public-sector workers were eligible for health benefits in 2010, compared with 64.8 percent of private-sector workers (Figure 16). Offer rates did not change for state and local government workers. However, between 1997 and 2010, offer rates dropped 5 percent among private-sector workers and 10 percent among federal workers.
In 2010, the take-up rate was 82.2 percent among private-sector workers, 87 percent among federal government workers, 87.7 percent among local government workers, and 90.9 percent among state workers (Figure 17). Take-up rates fell about 4 percent between 1997 and 2010 among private-sector workers and dropped 2 percent among local government workers. Both state and federal workers experienced a slight increase in take-up rates between 1997 and 2010.
Unionization Union workers were more likely than nonunion workers to be eligible for health benefits. In 2010, 87.6 percent of union workers were offered health coverage compared with 64.4 percent of nonunion workers (Figure 18). The offer rate has fallen at a slightly higher rate among union workers. Between 1997 and 2010, union workers experienced a 5 percent drop in offer rates while nonunion workers experienced a 3 percent drop.
Take-up rates among both union and nonunion workers are generally high. In 2010, 91.4 percent of union workers and 81.9 percent of nonunion workers took coverage when it was offered (Figure 19). Between 1997 and 2010, the take-up rate fell 3 percent for nonunion workers and 2 percent for union workers.
Offer Rates, Take-Up Rates, and Demographics The focus of this section is on changes in the percentage of workers eligible for health benefits (offer rates) and the percentage of eligible employees who are covered by their health plans (take-up rates) by various demographic characteristics of workers. Figures 20–29 present these trends for 1997–2010. More detailed tables can be found in appendix figures A4–A6.
Gender and Age Men are more likely than women to be offered health benefits and are more likely to be covered by those benefits. In 2010, 69.2 percent of men and 65.8 percent of women were offered health coverage through their jobs (Figure 20). However, offer rates declined 6 percent among men between 1997 and 2010 but less than 1 percent among women. Because offer rates increased among women between 1997 and 2002, examining 1997 and 2010 masks a 4 percent decline among women that started in 2002.
Men are more likely than women to take coverage from their own employer when it is offered. In 2010, 87.2 percent of men took coverage when it was offered, while 79.7 percent of women took it (Figure 21). The take-up rate fell by about 4 percent for men and 1 percent for women between 1997 and 2010.
Among both men and women, offer rates increased with age. In 2010, the offer rate among men ages 18–20 was 22.5 percent (Figure 22), and among women ages 18–20 it was 19.8 percent (Figure 23). Among 55–64 year olds, the offer rate was 79.5 percent for men and 75 percent for women. Younger workers also experienced larger declines in offer rates than older workers. Among 18–20 year olds, between 1997 and 2010, the offer rate declined 14 percent for men and 15 percent for women, while among 55–64 year olds it declined 1 percent for men and increased 9 percent for women.
Take-up rates were about the same regardless of age for workers ages 25 and older. Among men in 2010, the take-up rate was 52 percent among 18–20 year olds, 76 percent among 21–24 year olds, and between 87–91 percent for those ages 25 and older (Figure 24). Among women, the take-up rate was 45 percent among 18–20 year olds, 70 percent among 21–24 year olds, and between 77–85 percent for those ages 25 and older (Figure 25). Take-up rates fell
0%
10%
20%
30%
40%
50%
60%
70%
80%
90%
100%
1997 2002 2005 2010
Figure 15Take‐Up Rates, by Hours Worked, Select Years
Wage and Salary Workers Ages 18–64, 1997–2010
1–19
20–34
35 or more
Source: Employee Benefit Research Institute estimates based on data from the Survey of Income and Program Participation, 1996, 2001, 2004 and 2008 panels.
Hours Worked (per week)
0%
10%
20%
30%
40%
50%
60%
70%
80%
90%
100%
1997 2002 2005 2010
Figure 16Offer Rates, by Sector of Employment, Select Years
Wage and Salary Workers Ages 18–64, 1997–2010
Private sector
Local government
State government
Federal government
Source: Employee Benefit Research Institute estimates based on data from the Survey of Income and Program Participation, 1996, 2001, 2004 and 2008 panels.
ebri.org Issue Brief • April 2012 • No. 370 15

0%
10%
20%
30%
40%
50%
60%
70%
80%
90%
100%
1997 2002 2005 2010
Figure 17Take‐Up Rates, by Sector of Employment, Select Years
Wage and Salary Workers Ages 18–64, 1997–2010
Private sector
Local government
State government
Federal government
Source: Employee Benefit Research Institute estimates based on data from the Survey of Income and Program Participation, 1996, 2001, 2004 and 2008 panels.
0%
10%
20%
30%
40%
50%
60%
70%
80%
90%
100%
1997 2002 2005 2010
Figure 18Offer Rates, by Union Status, Select YearsWage and Salary Workers Ages 18–64, 1997–2010
Unionized
Nonunionized
Source: Employee Benefit Research Institute estimates based on data from the Survey of Income and Program Participation, 1996, 2001, 2004 and 2008 panels.
ebri.org Issue Brief • April 2012 • No. 370 16

0%
10%
20%
30%
40%
50%
60%
70%
80%
90%
100%
1997 2002 2005 2010
Figure 19Take‐Up Rates, by Union Status, Select Years
Wage and Salary Workers Ages 18–64, 1997–2010
Unionized
Nonunionized
Source: Employee Benefit Research Institute estimates based on data from the Survey of Income and Program Participation, 1996, 2001, 2004 and 2008 panels.
0%
10%
20%
30%
40%
50%
60%
70%
80%
90%
100%
1997 2002 2005 2010
Figure 20Offer Rates, by Gender, Select Years
Wage and Salary Workers Ages 18–64, 1997–2010
Men
Women
Source: Employee Benefit Research Institute estimates based on data from the Survey of Income and Program Participation, 1996, 2001, 2004 and 2008 panels.
ebri.org Issue Brief • April 2012 • No. 370 17

0%
10%
20%
30%
40%
50%
60%
70%
80%
90%
100%
1997 2002 2005 2010
Figure 21Take‐Up Rates, by Gender, Select YearsWage and Salary Workers Ages 18–64, 1997–2010
Men
Women
Source: Employee Benefit Research Institute estimates based on data from the Survey of Income and Program Participation, 1996, 2001, 2004 and 2008 panels.
0%
10%
20%
30%
40%
50%
60%
70%
80%
90%
100%
1997 2002 2005 2010
Figure 22Offer Rates, by Age, Male Wage and Salary Workers, Select Years
Wage and Salary Workers Ages 18–64, 1997–2010
18–20 21–24 25–34 35–44 45–54 55–64
Source: Employee Benefit Research Institute estimates based on data from the Survey of Income and Program Participation, 1996, 2001, 2004 and 2008 panels.
ebri.org Issue Brief • April 2012 • No. 370 18
ebri.org Issue Brief • April 2012 • No. 370 19
40 percent for men ages 18–20 and 47 percent for women ages 18–20 between 1997 and 2010. They fell 17 percent for men ages 21–24 and 15 percent for women ages 21–24. However, among those ages 25 and older, men experienced declines of between 2 percent and 5 percent, while women experienced next to no decline.
Race/Ethnicity
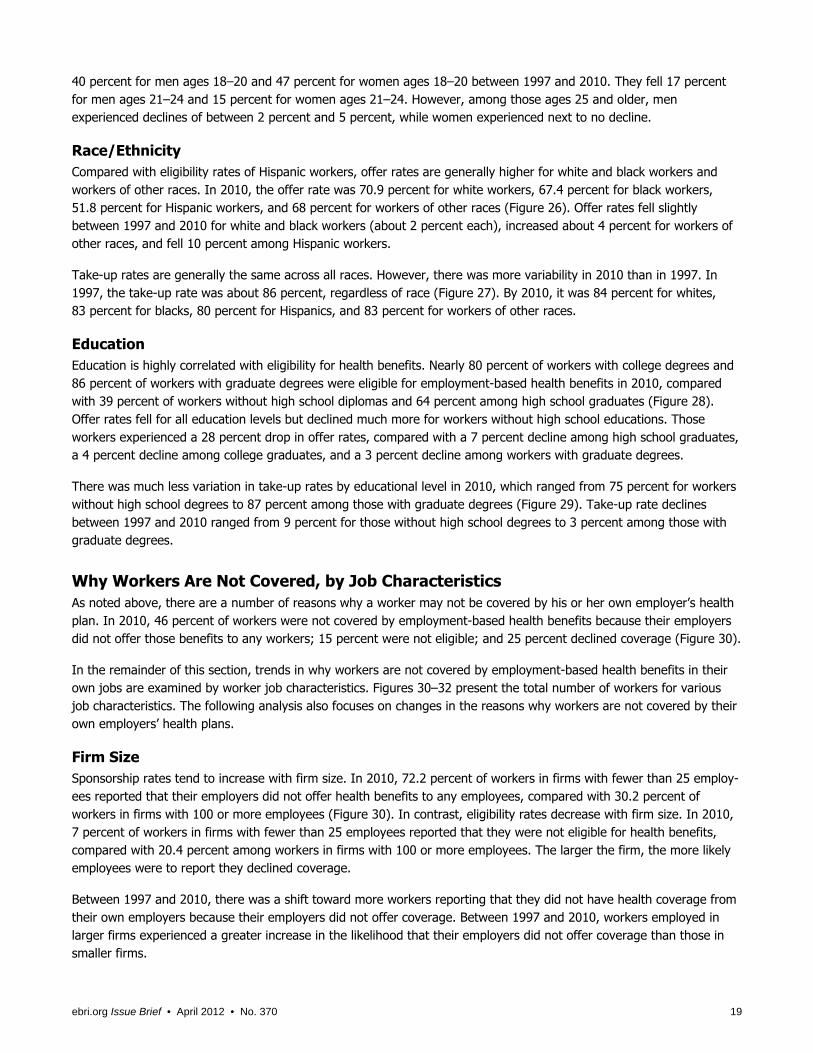
Compared with eligibility rates of Hispanic workers, offer rates are generally higher for white and black workers and workers of other races. In 2010, the offer rate was 70.9 percent for white workers, 67.4 percent for black workers, 51.8 percent for Hispanic workers, and 68 percent for workers of other races (Figure 26). Offer rates fell slightly between 1997 and 2010 for white and black workers (about 2 percent each), increased about 4 percent for workers of other races, and fell 10 percent among Hispanic workers.
Take-up rates are generally the same across all races. However, there was more variability in 2010 than in 1997. In 1997, the take-up rate was about 86 percent, regardless of race (Figure 27). By 2010, it was 84 percent for whites, 83 percent for blacks, 80 percent for Hispanics, and 83 percent for workers of other races.
Education Education is highly correlated with eligibility for health benefits. Nearly 80 percent of workers with college degrees and 86 percent of workers with graduate degrees were eligible for employment-based health benefits in 2010, compared with 39 percent of workers without high school diplomas and 64 percent among high school graduates (Figure 28). Offer rates fell for all education levels but declined much more for workers without high school educations. Those workers experienced a 28 percent drop in offer rates, compared with a 7 percent decline among high school graduates, a 4 percent decline among college graduates, and a 3 percent decline among workers with graduate degrees.
There was much less variation in take-up rates by educational level in 2010, which ranged from 75 percent for workers without high school degrees to 87 percent among those with graduate degrees (Figure 29). Take-up rate declines between 1997 and 2010 ranged from 9 percent for those without high school degrees to 3 percent among those with graduate degrees.
Why Workers Are Not Covered, by Job Characteristics As noted above, there are a number of reasons why a worker may not be covered by his or her own employer’s health plan. In 2010, 46 percent of workers were not covered by employment-based health benefits because their employers did not offer those benefits to any workers; 15 percent were not eligible; and 25 percent declined coverage (Figure 30).
In the remainder of this section, trends in why workers are not covered by employment-based health benefits in their own jobs are examined by worker job characteristics. Figures 30–32 present the total number of workers for various job characteristics. The following analysis also focuses on changes in the reasons why workers are not covered by their own employers’ health plans.
Firm Size Sponsorship rates tend to increase with firm size. In 2010, 72.2 percent of workers in firms with fewer than 25 employ-ees reported that their employers did not offer health benefits to any employees, compared with 30.2 percent of workers in firms with 100 or more employees (Figure 30). In contrast, eligibility rates decrease with firm size. In 2010, 7 percent of workers in firms with fewer than 25 employees reported that they were not eligible for health benefits, compared with 20.4 percent among workers in firms with 100 or more employees. The larger the firm, the more likely employees were to report they declined coverage.
Between 1997 and 2010, there was a shift toward more workers reporting that they did not have health coverage from their own employers because their employers did not offer coverage. Between 1997 and 2010, workers employed in larger firms experienced a greater increase in the likelihood that their employers did not offer coverage than those in smaller firms.

0%
10%
20%
30%
40%
50%
60%
70%
80%
90%
100%
1997 2002 2005 2010
Figure 23Offer Rates, by Age, Female Wage and Salary Workers, Select Years
Wage and Salary Workers Ages 18–64, 1997–2010
18–20 21–24 25–34 35–44 45–54 55–64
Source: Employee Benefit Research Institute estimates based on data from the Survey of Income and Program Participation, 1996, 2001, 2004 and 2008 panels.
0%
10%
20%
30%
40%
50%
60%
70%
80%
90%
100%
1997 2002 2005 2010
Figure 24Take‐Up Rates, by Age, Male Wage and Salary Workers, Select Years
Wage and Salary Workers Ages 18–64, 1997–2010
18–20 21–24 25–34 35–44 45–54 55–64
Source: Employee Benefit Research Institute estimates based on data from the Survey of Income and Program Participation, 1996, 2001, 2004 and 2008 panels.
ebri.org Issue Brief • April 2012 • No. 370 20

0%
10%
20%
30%
40%
50%
60%
70%
80%
90%
100%
1997 2002 2005 2010
Figure 25Take‐Up Rates, by Age, Female Wage and Salary Workers, Select Years
Wage and Salary Workers Ages 18–64, 1997–2010
18–20 21–24 25–34 35–44 45–54 55–64
Source: Employee Benefit Research Institute estimates based on data from the Survey of Income and Program Participation, 1996, 2001, 2004 and 2008 panels.
0%
10%
20%
30%
40%
50%
60%
70%
80%
90%
100%
1997 2002 2005 2010
Figure 26Offer Rates, by Race, Select Years
Wage and Salary Workers Ages 18–64, 1997–2010
White
Black
Hispanic
Other
Source: Employee Benefit Research Institute estimates based on data from the Survey of Income and Program Participation, 1996, 2001, 2004 and 2008 panels.
ebri.org Issue Brief • April 2012 • No. 370 21

0%
10%
20%
30%
40%
50%
60%
70%
80%
90%
100%
1997 2002 2005 2010
Figure 27Take‐Up Rates, by Race, Select Years
Wage and Salary Workers Ages 18–64, 1997–2010
White
Black
Hispanic
Other
Source: Employee Benefit Research Institute estimates based on data from the Survey of Income and Program Participation, 1996, 2001, 2004 and 2008 panels.
0%
10%
20%
30%
40%
50%
60%
70%
80%
90%
100%
1997 2002 2005 2010
Figure 28Offer Rates, by Education, Select YearsWage and Salary Workers Ages 18–64, 1997–2010
Less than high school
High school diploma and/or some college
College degree
Graduate degree
Source: Employee Benefit Research Institute estimates based on data from the Survey of Income and Program Participation, 1996, 2001, 2004 and 2008 panels.
ebri.org Issue Brief • April 2012 • No. 370 22

ebri.org Issue Brief • April 2012 • No. 370 23
0%
10%
20%
30%
40%
50%
60%
70%
80%
90%
100%
1997 2002 2005 2010
Figure 29Take‐Up Rates, by Education, Select YearsWage and Salary Workers Ages 18–64, 1997–2010
Less than high school
High school diploma and/or some college
College degree
Graduate degree
Source: Employee Benefit Research Institute estimates based on data from the Survey of Income and Program Participation, 1996, 2001, 2004 and 2008 panels.
Hours of Work
Whether a worker reports that his or her employer offers a health plan varies little with the number of hours that the employee works. In 2010, 43.8 percent of workers employed full time said their employer did not sponsor a health plan, compared with 48.7 percent for those working fewer than 20 hours per week (Figure 31). Rather, part-time workers were about four times as likely as full-time workers to report that they did not have health coverage because they were not eligible.
Between 1997 and 2010, workers employed fewer than 20 hours per week were more likely to report that their employers did not offer coverage or they were not eligible, and were less likely to report that they declined coverage. Those working 20–34 hours per week were more likely than full-time workers to report that their employers did not offer coverage or they declined it. Those employed full-time were less likely over time to report that they were not eligible for coverage and more likely to report that either their employers did not offer it or they declined it.
Sector of Employment Between 1997 and 2010, the percentage of private-sector workers reporting that they were not covered by employment-based health benefits because their employers did not offer coverage increased from 43.4 percent to 49.3 percent (Figure 32). They were less likely in 2010 than in 1997 to report that they were ineligible for the plans that were offered. A similar pattern was seen for state government workers.
Among local government workers, the percentage reporting that their employer did not sponsor a health plan was essentially unchanged from 1997 to 2010. Fewer workers reported not being eligible for coverage in 2010 than in 1997, and more reported declining it when it was offered.
Federal government workers were less likely in 2010 than in 1997 to report that they were not covered by employment-based health benefits because they declined coverage. They were more likely to report that coverage was not offered.

ebri.org Issue Brief • April 2012 • No. 370 24
Unionization Both union workers and nonunion workers were more likely in 2010 than in 1997 to report that they did not have coverage because their employer did not offer a plan and were less likely to report that they did not have coverage because they were not eligible. While union members were less likely than nonunion workers to report not having coverage because their employer did not offer a plan, the decline in the percentage of union workers reporting that their employers did not offer plans was greater than the decline reported by nonunion workers.
Why Workers Are Not Covered, by Demographics
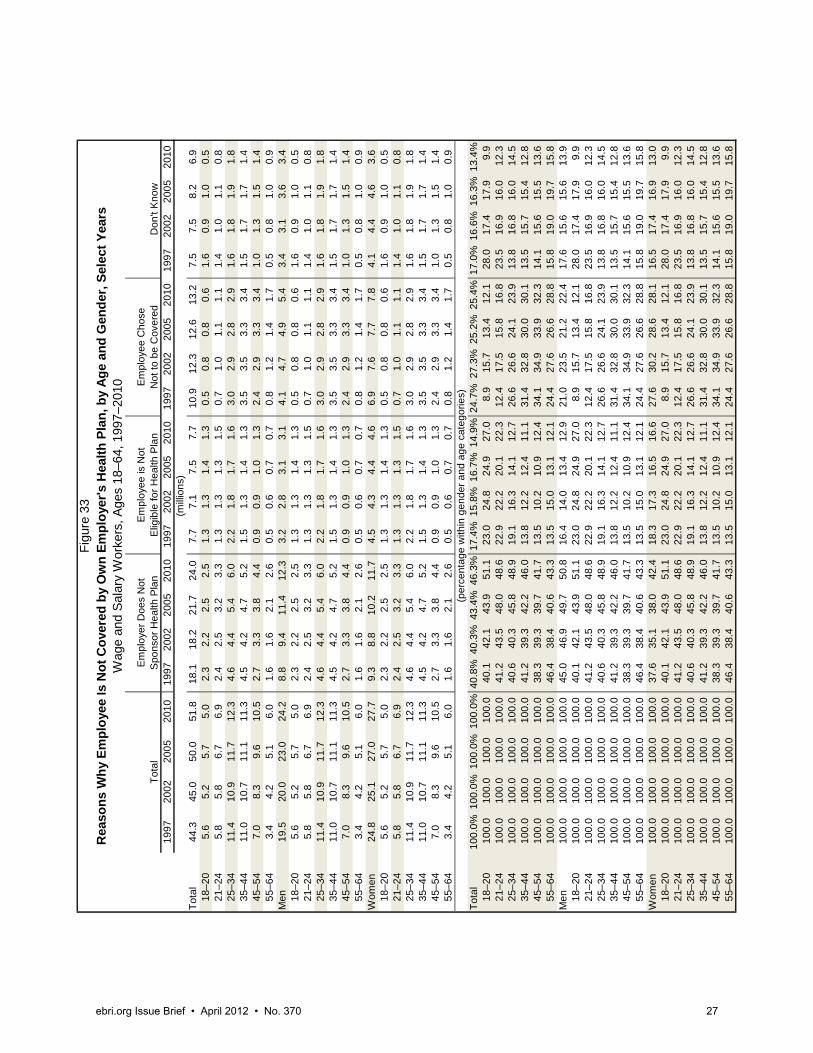
Gender and Age In 2010, men not covered by their own employers’ health plans were more likely than women to report that they were not covered because their employer did not offer a health plan (Figure 33). Women were more likely than men to report that they were either not eligible for coverage or that they declined coverage. Between 1997 and 2010, both men and women experienced an increase in the likelihood that they were not covered because their employers did not offer health plans. During that period, both experienced a decline in reporting being ineligible, and both had a slight increase in the percentage reporting that they chose not to be covered.
With respect to age, younger workers were more likely than older workers to lack coverage, either because their employers did not sponsor health plans or because the workers were not eligible. For example, among 18–20 year olds, 51.1 percent reported their employers did not offer coverage and 27 percent reported that they were not eligible for the plan, compared with 43.3 percent and 12.1 percent, respectively, among 55–64 year olds.
All age groups, except 55–64 year olds, experienced an increase between 1997 and 2010 in the percentage reporting that they did not have coverage because their employers did not offer plans. The 55–64 year olds experienced an increase in the percentage reporting that they declined coverage.
Race/Ethnicity Hispanics were more likely than whites, blacks, or other races to report that they were not covered by their employers’ health plans because the employers did not offer plans in 2010. Nearly 63 percent of Hispanics reported that their employers did not offer plans, compared with 42.1 percent of whites and 41.1 percent of blacks in 2010 (Figure 34). Hispanics were least likely to report that they were ineligible for their employers’ plans or that they declined coverage.
Between 1997 and 2010, across all races the percentage reporting that they were not covered by their employers’ health plans because one was not offered or because the workers declined coverage increased, and the percentage of workers reporting that they were not eligible for coverage decreased.
Education There is a strong correlation between educational level and reasons for not having health coverage. Low education is correlated with a higher percentage of workers reporting that their employers did not offer health coverage, and a lower percentage reporting either they were not eligible for coverage or they chose not to be covered (Figure 35).
Between 1997 and 2010, workers across all educational levels experienced an increase in the percentage reporting that their employers did not offer plans and a decline in the percentage reporting that they were ineligible for the plans.

1997
2002
2005
2010
1997
2002
2005
2010
1997
2002
2005
2010
1997
2002
2005
2010
1997
2002
2005
2010
Tota
l44
.345
.050
.051
.818
.118
.221
.724
.07.
77.
17.
57.
710
.912
.312
.613
.27.
57.
58.
26.
9U
nder
25
empl
oyee
s14
.714
.916
.216
.59.
710
.011
.211
.91.
11.
21.
21.
11.
81.
92.
22.
12.
01.
81.
71.
425
–99
empl
oyee
s6.
56.
16.
46.
62.
72.
62.
93.
21.
00.
90.
90.
71.
71.
71.
71.
81.
10.
91.
00.
810
0 or
mor
e em
ploy
ees
22.3
23.4
26.6
28.1
5.2
5.3
7.3
8.5
5.5
4.9
5.4
5.7
7.5
8.7
8.7
9.2
4.1
4.5
5.3
4.6
Don
't kn
ow0.
90.
70.
70.
70.
40.
30.
30.
40.
10.
10.
10.
10.
00.
10.
00.
00.
30.
30.
30.
2
Tota
l10
0.0%
100.
0%10
0.0%
100.
0%40
.8%
40.3
%43
.4%
46.3
%17
.4%
15.8
%16
.7%
14.9
%24
.7%
27.3
%25
.2%
25.4
%17
.0%
16.6
%16
.3%
13.4
%U
nder
25
empl
oyee
s10
0.0
10
0.0
10
0.0
10
0.0
66
.4
67.2
69
.0
72.2
7.
7
8.
0
7.
4
6.
9
12
.2
12.5
13
.4
12.6
13
.7
12.3
10
.2
8.3
25–9
9 em
ploy
ees
100.
0
100.
0
100.
0
100.
0
42.3
42
.4
45.2
49
.1
15.2
15
.4
13.9
11
.3
25.7
27
.7
25.7
27
.9
16.8
14
.5
15.2
11
.7
100
or m
ore
empl
oyee
s10
0.0
10
0.0
10
0.0
10
0.0
23
.4
22.8
27
.3
30.2
24
.5
21.0
20
.1
20.4
33
.5
37.0
32
.8
32.9
18
.5
19.2
19
.7
16.5
D
on't
know
100.
0
100.
0
100.
0
100.
0
44.5
37
.1
46.7
54
.3
15.7
11
.5
9.6
15.3
5.
1
10
.0
4.2
5.3
34.8
41
.4
39.5
25
.1
Figu
re 3
0
Tota
l
(mill
ions
)
(per
cent
age
with
in fi
rm s
ize
cate
gorie
s)
Sou
rce:
Em
ploy
ee B
enef
it R
esea
rch
Inst
itute
est
imat
es b
ased
on
data
from
the
Sur
vey
of In
com
e an
d P
rogr
am P
artic
ipat
ion,
199
6, 2
001,
200
4, a
nd 2
008
pane
ls.
Em
ploy
er D
oes
Not
Spo
nsor
Hea
lth P
lan
Em
ploy
ee is
Not
E
ligib
le fo
r Hea
lth P
lan
Em
ploy
ee C
hose
Not
to b
e C
over
edD
on't
Kno
w
Rea
son
s W
hy
Em
plo
yee
Is N
ot
Co
ver
ed b
y O
wn
Em
plo
yer'
s H
ealt
h P
lan
, by
Fir
m S
ize,
Sel
ect
Yea
rsW
age
and
Sal
ary
Wor
kers
, Age
s 18
–64,
199
7–20
10
1997
2002
2005
2010
1997
2002
2005
2010
1997
2002
2005
2010
1997
2002
2005
2010
1997
2002
2005
2010
Tota
l44
.144
.944
.043
.118
.018
.118
.619
.47.
77.
16.
66.
310
.912
.311
.711
.87.
47.
37.
15.
61–
195.
15.
14.
35.
02.
42.
11.
92.
41.
41.
51.
21.
40.
50.
60.
50.
40.
81.
00.
70.
720
–34
10.6
10.8
9.8
11.0
4.5
4.6
4.2
5.1
2.7
2.6
2.4
2.7
1.7
2.0
1.7
1.9
1.8
1.6
1.4
1.2
35 o
r m
ore
28.4
28.9
29.9
27.2
11.2
11.4
12.6
11.9
3.6
3.0
3.0
2.1
8.7
9.7
9.5
9.4
4.8
4.8
4.9
3.7
Tota
l10
0.0%
100.
0%10
0.0%
100.
0%40
.9%
40.4
%42
.4%
45.1
%17
.5%
15.9
%14
.7%
14.5
%24
.8%
27.4
%26
.6%
27.3
%16
.9%
16.3
%16
.1%
13.1
%1–
1910
0.0
10
0.0
10
0.0
10
0.0
46
.4
40.4
44
.0
48.7
27
.7
29.8
28
.1
29.2
9.
9
11
.0
11.0
8.
7
16
.0
18.8
16
.8
13.4
20
–34
100.
0
100.
0
100.
0
100.
0
42.1
42
.8
43.1
46
.6
25.0
23
.9
24.9
24
.6
15.9
18
.8
17.2
17
.5
17.0
14
.4
14.8
11
.2
35 o
r m
ore
100.
0
100.
0
100.
0
100.
0
39.4
39
.5
41.9
43
.8
12.8
10
.4
9.9
7.7
30.8
33
.5
31.8
34
.7
16.9
16
.6
16.4
13
.8
Sour
ce: E
mpl
oyee
Ben
efit
Res
earc
h In
stitu
te e
stim
ates
bas
ed o
n da
ta fr
om th
e Su
rvey
of I
ncom
e an
d P
rogr
am P
artic
ipat
ion,
1 99
6, 2
001 ,
200
4, a
nd 2
008
pane
ls.
Re
as
on
s W
hy
Em
plo
yee
Is
No
t C
ov
ere
d b
y O
wn
Em
plo
yer'
s H
ea
lth
Pla
n,
by
Ho
urs
of
Wo
rk,
Se
lec
t Y
ea
rsW
age
and
Sal
ary
Wor
kers
, A
ges
18–6
4, 1
997–
2010
Fig
ure
31
Tota
l
(per
cent
age
with
in h
ours
of
wor
k ca
tego
ries)
(milli
ons)
Empl
oyer
Doe
s N
ot
Spo
nsor
Hea
lth P
lan
Empl
oyee
is N
ot
Elig
ible
for
Hea
lth P
lan
Empl
oyee
Cho
se N
ot
to
be
Cov
ered
Don
't K
now
ebri.org Issue Brief • April 2012 • No. 370 25

1997
2002
2005
2010
1997
2002
2005
2010
1997
2002
2005
2010
1997
2002
2005
2010
1997
2002
2005
2010
Tot
al44
.345
.050
.051
.818
.118
.221
.724
.07.
77.
17.
57.
710
.912
.312
.613
.27.
57.
58.
26.
9P
rivat
e se
ctor
38.7
39.1
43.8
45.2
16.8
16.9
20.4
22.3
6.3
5.8
6.1
6.2
9.2
10.3
10.7
11.2
6.4
6.1
6.6
5.6
Loca
l gov
ernm
ent
2.4
2.8
2.9
3.0
0.5
0.5
0.5
0.6
0.8
0.7
0.7
0.8
0.8
1.1
1.1
1.1
0.4
0.6
0.6
0.5
Sta
te g
over
nmen
t1.
51.
61.
71.
70.
30.
40.
30.
50.
40.
40.
50.
30.
50.
50.
40.
50.
30.
30.
40.
4F
eder
al g
over
nmen
t0.
90.
90.
91.
30.
10.
20.
20.
30.
20.
20.
10.
30.
40.
40.
40.
40.
20.
20.
30.
3D
on't
Kno
w0.
80.
70.
70.
70.
40.
30.
30.
40.
10.
10.
10.
10.
00.
10.
00.
00.
30.
30.
30.
2
Uni
oniz
ed2.
32.
63.
03.
30.
40.
40.
70.
80.
50.
50.
40.
61.
01.
01.
21.
20.
40.
70.
70.
6N
onun
ioni
zed
41.8
42.3
46.7
48.4
17.6
17.7
20.9
23.1
7.2
6.7
7.1
7.1
9.9
11.3
11.4
11.9
7.0
6.7
7.3
6.2
Tot
al10
0.0%
100.
0%10
0.0%
100.
0%40
.8%
40.3
%43
.4%
46.3
%17
.4%
15.8
%16
.7%
14.9
%24
.7%
27.3
%25
.2%
25.4
%17
.0%
16.6
%16
.3%
13.4
%P
rivat
e se
ctor
100.
0
100.
0
100.
0
100.
0
43.4
43.2
46.6
49.3
16.2
14.8
14.0
13.7
23.9
26.3
24.4
24.7
16.5
15.6
15.1
12.3
Loca
l gov
ernm
ent
100.
0
100.
0
100.
0
100.
0
18.7
16.1
16.5
19.0
31.7
25.1
25.0
27.8
32.6
38.0
37.0
35.6
17.0
20.8
21.5
17.7
Sta
te g
over
nmen
t10
0.0
10
0.0
10
0.0
10
0.0
23
.0
24
.7
19
.6
28
.0
26
.1
23
.6
28
.0
20
.1
32
.6
31
.0
26
.8
30
.1
18
.3
20
.7
25
.6
21
.7
F
eder
al g
over
nmen
t10
0.0
10
0.0
10
0.0
10
0.0
14
.7
19
.8
17
.9
24
.7
19
.4
18
.9
14
.3
19
.6
46
.9
41
.2
41
.1
32
.5
19
.0
20
.1
26
.7
23
.1
D
on't
Kno
w10
0.0
10
0.0
10
0.0
10
0.0
43
.5
37
.3
46
.8
53
.7
15
.7
10
.9
9.
1
15
.5
5.
0
10
.1
4.
2
5.
4
35
.8
41
.6
39
.9
25
.4
Uni
oniz
ed10
0.0
10
0.0
10
0.0
10
0.0
18
.0
16
.3
22
.7
24
.6
20
.4
17
.6
14
.9
18
.7
43
.1
40
.3
40
.4
37
.6
18
.5
25
.9
22
.0
19
.0
N
onun
ioni
zed
100.
0
100.
0
100.
0
100.
0
42.1
41.9
44.8
47.9
17.3
15.8
15.1
14.6
23.8
26.6
24.4
24.7
16.8
15.8
15.7
12.8
Fig
ure
32
Tot
al
(mill
ions
)
(per
cent
age
with
in c
lass
and
uni
on c
ateg
orie
s)
Sou
rce:
Em
ploy
ee B
enef
it R
esea
rch
Inst
itute
est
imat
es b
ased
on
data
from
the
Sur
vey
of In
com
e an
d P
rogr
am P
artic
ipat
ion,
199
6, 2
001,
200
4, a
nd 2
008
pane
ls.
Em
ploy
er D
oes
Not
Spo
nsor
Hea
lth P
lan
Em
ploy
ee is
Not
Elig
ible
fo
r H
ealth
Pla
nE
mpl
oyee
Cho
se
Not
to b
e C
over
edD
on't
Kno
w
Rea
sons
Why
Em
ploy
ee Is
Not
Cov
ered
by
Ow
n Em
ploy
er's
Hea
lth P
lan,
by
Cla
ss o
f Wor
ker a
nd U
nion
izat
ion,
Sel
ect Y
ears
Wag
e an
d S
alar
y W
orke
rs, A
ges
18–6
4, 1
997–
2010
ebri.org Issue Brief • April 2012 • No. 370 26
19
97
20
02
20
05
20
10
19
97
20
02
20
05
20
10
19
97
20
02
20
05
20
10
19
97
20
02
20
05
20
10
19
97
20
02
20
05
20
10
To
tal
44
.34
5.0
50
.05
1.8
18
.11
8.2
21
.72
4.0
7.7
7.1
7.5
7.7
10
.91
2.3
12
.61
3.2
7.5
7.5
8.2
6.9
18
–2
05
.65
.25
.75
.02
.32
.22
.52
.51
.31
.31
.41
.30
.50
.80
.80
.61
.60
.91
.00
.52
1–
24
5.8
5.8
6.7
6.9
2.4
2.5
3.2
3.3
1.3
1.3
1.3
1.5
0.7
1.0
1.1
1.1
1.4
1.0
1.1
0.8
25
–3
41
1.4
10
.91
1.7
12
.34
.64
.45
.46
.02
.21
.81
.71
.63
.02
.92
.82
.91
.61
.81
.91
.83
5–
44
11
.01
0.7
11
.11
1.3
4.5
4.2
4.7
5.2
1.5
1.3
1.4
1.3
3.5
3.5
3.3
3.4
1.5
1.7
1.7
1.4
45
–5
47
.08
.39
.61
0.5
2.7
3.3
3.8
4.4
0.9
0.9
1.0
1.3
2.4
2.9
3.3
3.4
1.0
1.3
1.5
1.4
55
–6
43
.44
.25
.16
.01
.61
.62
.12
.60
.50
.60
.70
.70
.81
.21
.41
.70
.50
.81
.00
.9M
en
19
.52
0.0
23
.02
4.2
8.8
9.4
11
.41
2.3
3.2
2.8
3.1
3.1
4.1
4.7
4.9
5.4
3.4
3.1
3.6
3.4
18
–2
05
.65
.25
.75
.02
.32
.22
.52
.51
.31
.31
.41
.30
.50
.80
.80
.61
.60
.91
.00
.52
1–
24
5.8
5.8
6.7
6.9
2.4
2.5
3.2
3.3
1.3
1.3
1.3
1.5
0.7
1.0
1.1
1.1
1.4
1.0
1.1
0.8
25
–3
41
1.4
10
.91
1.7
12
.34
.64
.45
.46
.02
.21
.81
.71
.63
.02
.92
.82
.91
.61
.81
.91
.83
5–
44
11
.01
0.7
11
.11
1.3
4.5
4.2
4.7
5.2
1.5
1.3
1.4
1.3
3.5
3.5
3.3
3.4
1.5
1.7
1.7
1.4
45
–5
47
.08
.39
.61
0.5
2.7
3.3
3.8
4.4
0.9
0.9
1.0
1.3
2.4
2.9
3.3
3.4
1.0
1.3
1.5
1.4
55
–6
43
.44
.25
.16
.01
.61
.62
.12
.60
.50
.60
.70
.70
.81
.21
.41
.70
.50
.81
.00
.9W
om
en
24
.82
5.1
27
.02
7.7
9.3
8.8
10
.21
1.7
4.5
4.3
4.4
4.6
6.9
7.6
7.7
7.8
4.1
4.4
4.6
3.6
18
–2
05
.65
.25
.75
.02
.32
.22
.52
.51
.31
.31
.41
.30
.50
.80
.80
.61
.60
.91
.00
.52
1–
24
5.8
5.8
6.7
6.9
2.4
2.5
3.2
3.3
1.3
1.3
1.3
1.5
0.7
1.0
1.1
1.1
1.4
1.0
1.1
0.8
25
–3
41
1.4
10
.91
1.7
12
.34
.64
.45
.46
.02
.21
.81
.71
.63
.02
.92
.82
.91
.61
.81
.91
.83
5–
44
11
.01
0.7
11
.11
1.3
4.5
4.2
4.7
5.2
1.5
1.3
1.4
1.3
3.5
3.5
3.3
3.4
1.5
1.7
1.7
1.4
45
–5
47
.08
.39
.61
0.5
2.7
3.3
3.8
4.4
0.9
0.9
1.0
1.3
2.4
2.9
3.3
3.4
1.0
1.3
1.5
1.4
55
–6
43
.44
.25
.16
.01
.61
.62
.12
.60
.50
.60
.70
.70
.81
.21
.41
.70
.50
.81
.00
.9
To
tal
10
0.0
%1
00
.0%
10
0.0
%1
00
.0%
40
.8%
40
.3%
43
.4%
46
.3%
17
.4%
15
.8%
16
.7%
14
.9%
24
.7%
27
.3%
25
.2%
25
.4%
17
.0%
16
.6%
16
.3%
13
.4%
18
–2
01
00
.0
10
0.0
1
00
.0
10
0.0
4
0.1
42
.14
3.9
51
.12
3.0
24
.82
4.9
27
.0
8.9
15
.71
3.4
12
.12
8.0
17
.41
7.9
9.9
2
1–
24
10
0.0
1
00
.0
10
0.0
1
00
.0
41
.24
3.5
48
.04
8.6
22
.92
2.2
20
.12
2.3
1
2.4
1
7.5
15
.81
6.8
23
.51
6.9
16
.01
2.3
25
–3
41
00
.0
10
0.0
1
00
.0
10
0.0
4
0.6
40
.34
5.8
48
.91
9.1
16
.31
4.1
12
.7
26
.6
26
.62
4.1
23
.91
3.8
16
.81
6.0
14
.53
5–
44
10
0.0
1
00
.0
10
0.0
1
00
.0
41
.23
9.3
42
.24
6.0
13
.81
2.2
12
.41
1.1
3
1.4
3
2.8
30
.03
0.1
13
.51
5.7
15
.41
2.8
45
–5
41
00
.0
10
0.0
1
00
.0
10
0.0
3
8.3
39
.33
9.7
41
.71
3.5
10
.21
0.9
12
.4
34
.1
34
.93
3.9
32
.31
4.1
15
.61
5.5
13
.65
5–
64
10
0.0
1
00
.0
10
0.0
1
00
.0
46
.43
8.4
40
.64
3.3
13
.51
5.0
13
.11
2.1
2
4.4
2
7.6
26
.62
8.8
15
.81
9.0
19
.71
5.8
Me
n1
00
.0
10
0.0
1
00
.0
10
0.0
4
5.0
46
.94
9.7
50
.81
6.4
14
.01
3.4
12
.9
21
.0
23
.52
1.2
22
.41
7.6
15
.61
5.6
13
.91
8–
20
10
0.0
1
00
.0
10
0.0
1
00
.0
40
.14
2.1
43
.95
1.1
23
.02
4.8
24
.92
7.0
8
.9
1
5.7
13
.41
2.1
28
.01
7.4
17
.99
.9
21
–2
41
00
.0
10
0.0
1
00
.0
10
0.0
4
1.2
43
.54
8.0
48
.62
2.9
22
.22
0.1
22
.3
12
.4
17
.51
5.8
16
.82
3.5
16
.91
6.0
12
.32
5–
34
10
0.0
1
00
.0
10
0.0
1
00
.0
40
.64
0.3
45
.84
8.9
19
.11
6.3
14
.11
2.7
2
6.6
2
6.6
24
.12
3.9
13
.81
6.8
16
.01
4.5
35
–4
41
00
.0
10
0.0
1
00
.0
10
0.0
4
1.2
39
.34
2.2
46
.01
3.8
12
.21
2.4
11
.1
31
.4
32
.83
0.0
30
.11
3.5
15
.71
5.4
12
.84
5–
54
10
0.0
1
00
.0
10
0.0
1
00
.0
38
.33
9.3
39
.74
1.7
13
.51
0.2
10
.91
2.4
3
4.1
3
4.9
33
.93
2.3
14
.11
5.6
15
.51
3.6
55
–6
41
00
.0
10
0.0
1
00
.0
10
0.0
4
6.4
38
.44
0.6
43
.31
3.5
15
.01
3.1
12
.1
24
.4
27
.62
6.6
28
.81
5.8
19
.01
9.7
15
.8W
om
en
10
0.0
1
00
.0
10
0.0
1
00
.0
37
.63
5.1
38
.04
2.4
18
.31
7.3
16
.51
6.6
2
7.6
3
0.2
28
.62
8.1
16
.51
7.4
16
.91
3.0
18
–2
01
00
.0
10
0.0
1
00
.0
10
0.0
4
0.1
42
.14
3.9
51
.12
3.0
24
.82
4.9
27
.0
8.9
15
.71
3.4
12
.12
8.0
17
.41
7.9
9.9
2
1–
24
10
0.0
1
00
.0
10
0.0
1
00
.0
41
.24
3.5
48
.04
8.6
22
.92
2.2
20
.12
2.3
1
2.4
1
7.5
15
.81
6.8
23
.51
6.9
16
.01
2.3
25
–3
41
00
.0
10
0.0
1
00
.0
10
0.0
4
0.6
40
.34
5.8
48
.91
9.1
16
.31
4.1
12
.7
26
.6
26
.62
4.1
23
.91
3.8
16
.81
6.0
14
.53
5–
44
10
0.0
1
00
.0
10
0.0
1
00
.0
41
.23
9.3
42
.24
6.0
13
.81
2.2
12
.41
1.1
3
1.4
3
2.8
30
.03
0.1
13
.51
5.7
15
.41
2.8
45
–5
41
00
.0
10
0.0
1
00
.0
10
0.0
3
8.3
39
.33
9.7
41
.71
3.5
10
.21
0.9
12
.4
34
.1
34
.93
3.9
32
.31
4.1
15
.61
5.5
13
.65
5–
64
10
0.0
1
00
.0
10
0.0
1
00
.0
46
.43
8.4
40
.64
3.3
13
.51
5.0
13
.11
2.1
2
4.4
2
7.6
26
.62
8.8
15
.81
9.0
19
.71
5.8
Fig
ure
33R
easo
ns
Wh
y E
mp
loye
e Is
No
t C
ove
red
by
Ow
n E
mp
loye
r's
Hea
lth
Pla
n, b
y A
ge
and
Gen
der
, Sel
ect
Yea
rsW
age
and
Sal
ary
Wor
kers
, Age
s 18
–64,
199
7–20
10
To
tal
(pe
rce
nta
ge
with
in g
en
de
r a
nd
ag
e c
ate
go
ries)
(mill
ion
s)
Em
plo
yer
Do
es
No
t
S
po
nso
r H
ea
lth P
lan
Em
plo
yee
is N
ot
E
ligib
le f
or
He
alth
Pla
nE
mp
loye
e C
ho
se
N
ot
to b
e C
ove
red
Do
n't
Kn
ow
ebri.org Issue Brief • April 2012 • No. 370 27

ebri.org Issue Brief • April 2012 • No. 370 28
Conclusion
Employment-based health benefits are the most common form of health insurance in the United States, but since 2002 the percentage of workers with coverage has been declining, mostly because fewer workers have access to coverage.
Among workers not covered by their own employer, an increasing percentage report that their employer does not offer coverage. While the percentage reporting that they were not eligible for coverage was in large part unchanged, among workers not eligible, an increasing percentage report being employed on a part-time basis. Among those reporting that they declined coverage, an increasing number reported that the plan was too costly.
While it is possible that these trends will change with a rebound in employment rates, even when the unemployment rate fell between 2002 and 2005, it did not appear to have an impact on employer sponsorship of health plans. It is also possible that these trends will change as a result of PPACA, thus, the estimates presented in this paper can also serve as a baseline against which to measure the impact of PPACA on employment-based health benefits in the future.
Data and Methods Appendix Data for this study come from a series of supplements to the Survey of Income and Program Participation (SIPP) conducted by the U.S. Census Bureau. SIPP is a nationally representative longitudinal survey of the civilian noninstitutionalized U.S. population. SIPP provides comprehensive information about the income of individuals and households in the United States. It also provides information on participation in public programs. Individuals selected into the SIPP sample are interviewed once every four months over the life of the panel. In addition to a core set of questions asked of participants each four months, a rotating set of topical questions supplements the core questions.
In the 1996, 2001, 2004, and 2008 panels, the topical module added to Wave 5 or Wave 6 of each panel included questions regarding health benefits in the work place and in retirement. These topical questions were fielded in Fall 1997, Summer 2002, Summer 2005, and Summer 2010, for July 1997, May 2002, May 2005 and April 2010. From these questions, users of the survey can determine whether workers’ employers sponsor health plans; whether workers are offered coverage; if they take coverage; why they are not eligible for coverage; why they turn down coverage; other sources of coverage they may have; and whether they are uninsured.
The data in this report are for wage and salary workers ages 18–64. Self-employed workers are not included in the analysis because they were not asked questions about employer sponsorship of health benefits.

1997
2002
2005
2010
1997
2002
2005
2010
1997
2002
2005
2010
1997
2002
2005
2010
1997
2002
2005
2010
Tot
al44
.345
.050
.051
.818
.118
.221
.724
.07.
77.
17.
57.
710
.912
.312
.613
.27.
57.
58.
26.
9W
hite
31.4
30.3
32.5
32.6
12.0
10.9
12.9
13.7
5.6
5.2
5.0
5.3
8.4
9.1
9.1
9.0
5.4
5.2
5.5
4.5
Bla
ck5.
14.
95.
65.
71.
91.
82.
12.
31.
10.
81.
01.
01.
21.
41.
41.
50.
90.
91.
10.
8H
ispa
nic
5.8
7.6
8.9
10.3
3.3
4.4
5.3
6.5
0.7
0.9
1.0
0.9
0.9
1.2
1.5
1.8
0.9
1.1
1.1
1.1
Oth
er2.
02.
33.
03.
30.
91.
11.
31.
50.
30.
30.
50.
40.
40.
60.
60.
90.
30.
40.
50.
5
Tot
al10
0.0%
100.
0%10
0.0%
100.
0%40
.8%
40.3
%43
.4%
46.3
%17
.4%
15.8
%16
.7%
14.9
%24
.7%
27.3
%25
.2%
25.4
%17
.0%
16.6
%16
.3%
13.4
%W
hite
100.
0
100.
0
100.
0
100.
0
38.1
36.0
39.7
42.1
17.7
17.0
15.5
16.4
26.9
30.0
28.0
27.7
17.3
17.1
16.8
13.8
Bla
ck10
0.0
10
0.0
10
0.0
10
0.0
38
.1
37
.5
38
.0
41
.1
21
.1
15
.8
17
.6
18
.4
23
.0
29
.1
25
.2
25
.7
17
.7
17
.6
19
.1
14
.9
H
ispa
nic
100.
0
100.
0
100.
0
100.
0
56.2
57.8
59.9
62.7
12.8
11.9
11.4
8.7
15
.6
15
.9
16
.4
17
.9
15
.3
14
.3
12
.2
10
.7
O
ther
100.
0
100.
0
100.
0
100.
0
46.8
46.3
44.8
45.9
16.8
12.9
16.1
12.9
21.2
25.1
21.0
26.3
15.2
15.6
18.1
14.9
Fig
ure
34R
easo
ns
Wh
y E
mp
loye
e Is
No
t C
ov
ered
by
Ow
n E
mp
loye
r's
Hea
lth
Pla
n, b
y R
ace/
Eth
nic
ity,
Sel
ect
Yea
rsW
age
and
Sal
ary
Wor
kers
, Age
s 18
–64,
199
7–20
10
Tot
al
(per
cent
age
with
in r
ace/
ethn
icity
cat
egor
ies)
(mill
ions
)
Sou
rce:
Em
ploy
ee B
enef
it R
esea
rch
Inst
itute
est
imat
es b
ased
on
data
from
the
Sur
vey
of In
com
e an
d P
rogr
am P
artic
ipat
ion,
199
6, 2
001,
200
4, a
nd 2
008
pane
ls.
Em
ploy
er D
oes
Not
Spo
nsor
Hea
lth P
lan
Em
ploy
ee is
Not
E
ligib
le f
or H
ealth
Pla
nE
mpl
oyee
Cho
se
Not
to
be C
over
edD
on't
Kno
w
1997
2002
2005
2010
1997
2002
2005
2010
1997
2002
2005
2010
1997
2002
2005
2010
1997
2002
2005
20
10
Tota
l44.3
45.0
50.0
51.8
18.1
18.2
21.7
24
.07.7
7.1
7.5
7.7
10.9
12.3
12.6
13.2
7.5
7.5
8.2
6.9
Less than h
igh s
chool
7.2
7.1
5.4
6.3
4.1
4.1
3.4
4.3
1.0
0.8
0.6
0.5
1.1
1.3
0.7
0.9
1.0
0.9
0.7
0.6
Hig
h s
chool d
iplo
ma a
nd/o
r s
om
e c
olle
ge
29.8
29.8
34.9
34.2
12.0
11.8
15.3
15
.95.4
5.0
5.4
5.6
7.0
8.1
8.4
8.2
5.3
5.0
5.7
4.6
Colle
ge d
egre
e5.4
5.9
7.0
7.9
1.5
1.7
2.2
2.9
1.0
1.0
1.1
1.1
2.0
2.0
2.4
2.7
0.9
1.2
1.2
1.1
Gra
duate
degre
e1.9
2.2
2.7
3.4
0.5
0.6
0.7
0.9
0.3
0.4
0.4
0.5
0.8
0.9
1.1
1.5
0.3
0.4
0.5
0.6
Tota
l100.0
%100.0
%100.0
%100.0
%40.8
%40.3
%43.4
%46.3
%17.4
%15.8
%16
.7%
14.9
%24.7
%27.3
%25.2
%25.4
%17.0
%16.6
%16.3
%13.4
%Less than h
igh s
chool
100.0
100.0
100.0
100.0
56.9
58.0
63.9
67.9
13.3
11.0
10.7
8.3
15.5
18.1
13.3
13.8
14
.3
12.8
12.1
10.0
Hig
h s
chool d
iplo
ma a
nd/o
rsom
e c
olle
ge
100.0
100.0
100.0
100.0
40.3
39.5
43.9
46.4
18.2
16.7
15.5
16.3
23.5
27.1
24.2
23.9
17
.9
16.7
16.4
13.4
Colle
ge d
egre
e100.0
100.0
100.0
100.0
27.9
29.1
31.6
37.1
18.8
16.3
16.4
14.5
36.8
34.5
34.2
33.9
16
.5
20.1
17.8
14.6
Gra
duate
degre
e100.0
100.0
100.0
100.0
24.9
25.1
26.0
26.5
17.2
17.1
14.5
13.5
43.9
39.1
39.3
43.3
14
.0
18.7
20.2
16.7
Fig
ure
35
To
tal
(millio
ns)
(perc
enta
ge w
ithin
educatio
n c
ate
gories)
So
urce
: Em
plo
yee
Ben
efit
Res
earc
h In
stitu
te e
stim
ates
bas
ed o
n da
ta fr
om
the
Sur
vey
of I
nco
me
and
Pro
gram
Par
ticip
atio
n, 19
96, 2
001,
2004
, and
200
8 pa
nels
.
Em
plo
yer
Do
es
No
t
Sp
on
so
r H
ea
lth P
lan
Em
plo
yee
is N
ot
Elig
ible
for
He
alth
Pla
nE
mp
loye
e C
ho
se
No
t
to
be
Co
vere
dD
on
't K
no
w
Re
as
on
s W
hy
Em
plo
yee
Is
No
t C
ov
ere
d b
y O
wn
Em
plo
yer'
s H
ea
lth
Pla
n,
by
Ed
uc
ati
on
, S
ele
ct
Ye
ars
Wa
ge
an
d S
ala
ry W
ork
ers
, A
ge
s 1
8–
64
, 1
99
7–
20
10
ebri.org Issue Brief • April 2012 • No. 370 29

1997
2002
2005
2010
1997
2002
2005
2010
1997
2002
2005
2010
1997
2002
2005
2010
1997
2002
2005
2010
Tot
al11
1.4
115.
512
2.0
119.
188
.993
.796
.492
.078
.182
.784
.680
.467
.170
.472
.067
.2U
nder
25
empl
oyee
s22
.422
.924
.823
.811
.311
.912
.611
.19.
59.
910
.89.
47.
78.
18.
67.
325
–99
empl
oyee
s14
.514
.614
.514
.411
.111
.511
.110
.89.
710
.29.
79.
68.
08.
58.
17.
810
0 or
mor
e em
ploy
ees
73.3
77.1
81.7
80.0
65.9
69.9
72.2
69.7
58.5
62.4
63.8
61.2
51.1
53.7
55.1
52.0
Don
't kn
ow1.
10.
90.
90.
80.
50.
40.
40.
30.
30.
30.
30.
20.
30.
20.
20.
2
Tot
al10
0.0%
100.
0%10
0.0%
100.
0%79
.8%
81.1
%79
.0%
77.2
%70
.1%
71.6
%69
.4%
67.5
%60
.3%
61.0
%59
.0%
56.5
%86
.0%
85.2
%85
.1%
83.6
%U
nder
25
empl
oyee
s10
0.0
10
0.0
10
0.0
10
0.0
50
.7
52
.0
51
.0
46
.7
42
.5
43
.3
43
.4
39
.4
34
.6
35
.2
34
.7
30
.6
81
.3
81
.2
79
.8
77
.8
25
–99
empl
oyee
s10
0.0
10
0.0
10
0.0
10
0.0
76
.6
79
.0
76
.8
74
.8
66
.7
69
.6
67
.1
66
.9
55
.2
58
.0
55
.7
54
.2
82
.8
83
.3
83
.0
80
.9
10
0 or
mor
e em
ploy
ees
100.
0
100.
0
100.
0
100.
0
89.9
90.7
88.3
87.1
79.8
80.9
78.1
76.5
69.7
69.7
67.4
65.0
87.3
86.1
86.3
84.9
Don
't kn
ow10
0.0
10
0.0
10
0.0
10
0.0
45
.8
43
.1
40
.8
38
.1
28
.2
32
.1
29
.6
23
.4
24
.4
24
.5
26
.5
19
.1
86
.4
76
.4
89
.6
81
.7
a T
ake-
up r
ate
is th
e pe
rcen
tage
of w
orke
rs e
ligib
le fo
r co
vera
ge w
ho p
artic
ipat
e.
1997
2002
2005
2010
1997
2002
2005
2010
1997
2002
2005
2010
1997
2002
2005
2010
1997
2002
2005
2010
Tot
al11
1.4
115.
512
2.0
119.
188
.993
.796
.492
.078
.182
.784
.680
.467
.170
.472
.067
.21–
195.
95.
84.
95.
52.
93.
22.
62.
61.
31.
31.
21.
00.
80.
80.
70.
520
–34
13.9
14.4
13.1
14.2
8.1
8.8
8.0
8.4
4.9
5.6
5.0
5.2
3.2
3.6
3.3
3.2
35 o
r m
ore
91.5
95.1
93.6
84.8
77.9
81.7
79.2
71.7
71.8
75.8
73.2
67.1
63.1
66.1
63.7
57.6
Don
't kn
ow0.
20.
210
.414
.50.
00.
06.
69.
20.
00.
05.
37.
20.
00.
04.
45.
8
Tot
al10
0.0%
100.
0%10
0.0%
100.
0%79
.8%
81.1
%79
.0%
77.2
%70
.1%
71.6
%69
.4%
67.5
%60
.3%
61.0
%59
.0%
56.5
%86
.0%
85.2
%85
.1%
83.6
%1–
1910
0.0
10
0.0
10
0.0
10
0.0
49
.3
54
.7
52
.5
47
.3
21
.5
22
.5
23
.3
17
.8
12
.9
12
.9
13
.8
9.
9
59
.9
57
.5
59
.1
56
.0
20
–34
100.
0
100.
0
100.
0
100.
0
58.3
61.2
60.9
59.2
35.5
38.9
38.1
36.3
23.3
24.7
25.2
22.8
65.7
63.5
66.3
62.7
35 o
r m
ore
100.
0
100.
0
100.
0
100.
0
85.2
85.9
84.6
84.6
78.5
79.7
78.2
79.1
69.0
69.5
68.0
68.0
87.8
87.2
87.0
85.9
Don
't kn
ow10
0.0
10
0.0
10
0.0
10
0.0
18
.7
10
.7
63
.8
63
.3
15
.4
9.
4
51
.2
49
.6
13
.4
9.
4
42
.3
40
.0
86
.6
10
0.0
82
.6
80
.6
b T
ake-
up r
ate
is th
e pe
rcen
tage
of w
orke
rs e
ligib
le fo
r co
vera
ge w
ho p
artic
ipat
e.
(mill
ions
)
(per
cent
age
with
in h
ours
of w
ork
cate
gorie
s)
Sou
rce:
Em
ploy
ee B
enef
it R
esea
rch
Inst
itute
est
imat
es b
ased
on
data
from
the
Sur
vey
of In
com
e an
d P
rogr
am P
artic
ipat
ion,
199
6, 2
001,
200
4, a
nd 2
008
pane
ls.
a D
efin
ition
of h
ours
wor
ked
chan
ged
to in
clud
e a
cate
gory
for
"hou
rs v
ary.
"
Fig
ure
A2
Sp
on
sors
hip
Rat
es, O
ffer
Rat
es, P
arti
cip
atio
n R
ates
, an
d T
ake-
Up
Rat
es, b
y H
ou
rs o
f W
ork
,a S
elec
t Y
ears
Wag
e an
d S
alar
y W
orke
rs, A
ges
18–6
4, 1
997–
2010
Tot
alE
mpl
oyer
Spo
nsor
s
H
ealth
Pla
nE
mpl
oyee
Elig
ible
fo
r H
ealth
Pla
nE
mpl
oyee
Par
ticip
ates
in
Hea
lth P
lan
Tak
e-U
p R
ateb
Fig
ure
A1
Sp
on
sors
hip
Rat
es, O
ffer
Rat
es, P
arti
cip
atio
n R
ates
, an
d T
ake-
Up
Rat
es, b
y F
irm
Siz
e, S
elec
t Y
ears
Wag
e an
d S
alar
y W
orke
rs, A
ges
18–6
4, 1
997–
2010
Em
ploy
ee P
artic
ipat
es
in H
ealth
Pla
n
Sou
rce:
Em
ploy
ee B
enef
it R
esea
rch
Inst
itute
est
imat
es b
ased
on
data
from
the
Sur
vey
of In
com
e an
d P
rogr
am P
artic
ipat
ion,
199
6, 2
001,
200
4, a
nd 2
008
pane
ls.
(mill
ions
)
Tot
alE
mpl
oyer
Spo
nsor
s
H
ealth
Pla
nE
mpl
oyee
Elig
ible
fo
r H
ealth
Pla
nT
ake-
Up
Rat
ea
(per
cent
age
with
in fi
rm s
ize
cate
gorie
s)
ebri.org Issue Brief • April 2012 • No. 370 30
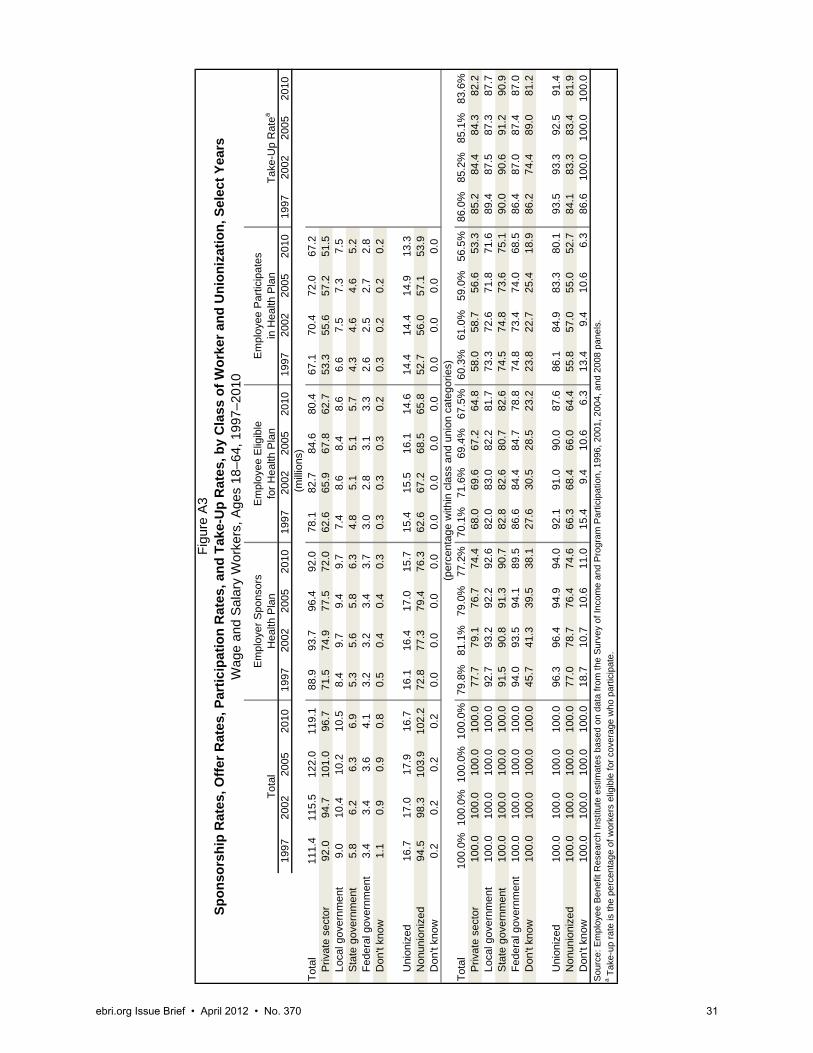
1997
2002
2005
2010
1997
2002
2005
2010
1997
2002
2005
2010
1997
2002
2005
2010
1997
2002
2005
2010
Tot
al11
1.4
115.
512
2.0
119.
188
.993
.796
.492
.078
.182
.784
.680
.467
.170
.472
.067
.2P
rivat
e se
ctor
92.0
94.7
101.
096
.771
.574
.977
.572
.062
.665
.967
.862
.753
.355
.657
.251
.5Lo
cal g
over
nmen
t9.
010
.410
.210
.58.
49.
79.
49.
77.
48.
68.
48.
66.
67.
57.
37.
5S
tate
gov
ernm
ent
5.8
6.2
6.3
6.9
5.3
5.6
5.8
6.3
4.8
5.1
5.1
5.7
4.3
4.6
4.6
5.2
Fed
eral
gov
ernm
ent
3.4
3.4
3.6
4.1
3.2
3.2
3.4
3.7
3.0
2.8
3.1
3.3
2.6
2.5
2.7
2.8
Don
't kn
ow1.
10.
90.
90.
80.
50.
40.
40.
30.
30.
30.
30.
20.
30.
20.
20.
2
Uni
oniz
ed16
.717
.017
.916
.716
.116
.417
.015
.715
.415
.516
.114
.614
.414
.414
.913
.3N
onun
ioni
zed
94.5
98.3
103.
910
2.2
72.8
77.3
79.4
76.3
62.6
67.2
68.5
65.8
52.7
56.0
57.1
53.9
Don
't kn
ow0.
20.
20.
20.
20.
00.
00.
00.
00.
00.
00.
00.
00.
00.
00.
00.
0
Tot
al10
0.0%
100.
0%10
0.0%
100.
0%79
.8%
81.1
%79
.0%
77.2
%70
.1%
71.6
%69
.4%
67.5
%60
.3%
61.0
%59
.0%
56.5
%86
.0%
85.2
%85
.1%
83.6
%P
rivat
e se
ctor
100.
0
100.
0
100.
0
100.
0
77.7
79.1
76.7
74.4
68.0
69.6
67.2
64.8
58.0
58.7
56.6
53.3
85.2
84.4
84.3
82.2
Loca
l gov
ernm
ent
100.
0
100.
0
100.
0
100.
0
92.7
93.2
92.2
92.6
82.0
83.0
82.2
81.7
73.3
72.6
71.8
71.6
89.4
87.5
87.3
87.7
Sta
te g
over
nmen
t10
0.0
10
0.0
10
0.0
10
0.0
91
.5
90
.8
91
.3
90
.7
82
.8
82
.6
80
.7
82
.6
74
.5
74
.8
73
.6
75
.1
90
.0
90
.6
91
.2
90
.9
F
eder
al g
over
nmen
t10
0.0
10
0.0
10
0.0
10
0.0
94
.0
93
.5
94
.1
89
.5
86
.6
84
.4
84
.7
78
.8
74
.8
73
.4
74
.0
68
.5
86
.4
87
.0
87
.4
87
.0
D
on't
know
100.
0
100.
0
100.
0
100.
0
45.7
41.3
39.5
38.1
27.6
30.5
28.5
23.2
23.8
22.7
25.4
18.9
86.2
74.4
89.0
81.2
Uni
oniz
ed10
0.0
10
0.0
10
0.0
10
0.0
96
.3
96
.4
94
.9
94
.0
92
.1
91
.0
90
.0
87
.6
86
.1
84
.9
83
.3
80
.1
93
.5
93
.3
92
.5
91
.4
N
onun
ioni
zed
100.
0
100.
0
100.
0
100.
0
77.0
78.7
76.4
74.6
66.3
68.4
66.0
64.4
55.8
57.0
55.0
52.7
84.1
83.3
83.4
81.9
Don
't kn
ow10
0.0
10
0.0
10
0.0
10
0.0
18
.7
10
.7
10
.6
11
.0
15
.4
9.
4
10
.6
6.
3
13
.4
9.
4
10
.6
6.
3
86
.6
10
0.0
10
0.0
10
0.0
a T
ake-
up r
ate
is th
e pe
rcen
tage
of w
orke
rs e
ligib
le fo
r co
vera
ge w
ho p
artic
ipat
e.
Em
ploy
ee P
artic
ipat
es
in H
ealth
Pla
n
Sp
on
sors
hip
Rat
es, O
ffer
Rat
es, P
arti
cip
atio
n R
ates
, an
d T
ake-
Up
Rat
es, b
y C
lass
of
Wo
rker
an
d U
nio
niz
atio
n, S
elec
t Y
ears
Wag
e an
d S
alar
y W
orke
rs, A
ges
18–6
4, 1
997–
2010
Fig
ure
A3
Sou
rce:
Em
ploy
ee B
enef
it R
esea
rch
Inst
itute
est
imat
es b
ased
on
data
from
the
Sur
vey
of In
com
e an
d P
rogr
am P
artic
ipat
ion,
199
6, 2
001,
200
4, a
nd 2
008
pane
ls.
Tot
alE
mpl
oyer
Spo
nsor
s
H
ealth
Pla
nE
mpl
oyee
Elig
ible
fo
r H
ealth
Pla
nT
ake-
Up
Rat
ea
(mill
ions
)
(per
cent
age
with
in c
lass
and
uni
on c
ateg
orie
s)
ebri.org Issue Brief • April 2012 • No. 370 31

1997
2002
2005
2010
1997
2002
2005
2010
1997
2002
2005
2010
1997
2002
2005
2010
1997
2002
2005
2010
Tota
l11
1.4
115.
512
2.0
119.
188
.993
.796
.492
.078
.182
.784
.680
.467
.170
.472
.067
.218
–20
6.8
6.3
6.6
5.5
3.2
3.5
3.4
2.6
1.6
1.9
1.6
1.2
1.1
1.1
0.9
0.6
21–2
49.
710
.110
.79.
96.
37.
06.
96.
14.
75.
35.
14.
24.
04.
34.
03.
125
–34
29.8
28.2
29.1
28.0
24.3
22.9
22.9
21.2
21.4
20.2
20.2
18.7
18.4
17.3
17.4
15.8
35–4
431
.730
.930
.727
.826
.526
.025
.322
.024
.123
.722
.919
.920
.720
.219
.516
.545
–54
23.2
27.1
29.3
29.2
20.1
23.3
24.9
24.3
18.6
21.6
22.9
22.1
16.2
18.7
19.7
18.7
55–6
410
.213
.015
.618
.68.
411
.013
.015
.77.
69.
911
.914
.46.
88.
710
.512
.7M
en58
.259
.963
.660
.947
.449
.150
.647
.142
.844
.645
.542
.138
.739
.940
.636
.718
–20
3.5
3.3
3.5
2.8
1.7
1.8
1.7
1.4
0.9
1.0
0.9
0.6
0.7
0.6
0.5
0.3
21–2
45.
15.
35.
44.
93.
33.
53.
42.
92.
42.
82.
52.
12.
22.
32.
11.
625
–34
16.0
15.1
15.8
14.9
13.2
12.3
12.3
11.1
11.9
11.2
11.0
9.8
10.7
10.0
9.9
8.5
35–4
416
.716
.116
.214
.614
.213
.913
.611
.713
.413
.112
.711
.012
.211
.911
.59.
645
–54
11.7
13.7
14.7
14.6
10.5
12.0
12.7
12.3
10.0
11.4
12.0
11.4
9.1
10.4
10.9
10.1
55–6
45.
26.
57.
99.
14.
55.
66.
87.
84.
25.
26.
37.
23.
94.
85.
76.
6W
omen
53.2
55.6
58.4
58.2
41.5
44.6
45.8
44.8
35.3
38.1
39.2
38.3
28.4
30.5
31.4
30.5
18–2
03.
23.
03.
12.
71.
51.
71.
71.
20.
70.
90.
70.
50.
50.
50.
40.
221
–24
4.7
4.9
5.3
5.0
3.1
3.5
3.5
3.2
2.2
2.6
2.5
2.1
1.8
2.0
1.9
1.5
25–3
413
.713
.113
.313
.111
.110
.610
.610
.29.
59.
19.
28.
97.
77.
37.
47.
235
–44
15.0
14.7
14.5
13.2
12.3
12.1
11.6
10.2
10.8
10.6
10.2
8.9
8.5
8.3
8.1
6.9
45–5
411
.513
.414
.614
.69.
611
.312
.212
.18.
610
.211
.010
.67.
18.
48.
88.
555
–64
5.0
6.5
7.7
9.5
3.9
5.4
6.3
7.9
3.4
4.7
5.6
7.2
2.9
4.0
4.8
6.1
Tota
l10
0.0%
100.
0%10
0.0%
100.
0%79
.8%
81.1
%79
.0%
77.2
%70
.1%
71.6
%69
.4%
67.5
%60
.3%
61.0
%59
.0%
56.5
%86
.0%
85.2
%85
.1%
83.6
%18
–20
100.
0
100.
0
100.
0
100.
0
47.7
55
.9
51.6
47
.8
24.2
30
.5
24.8
21
.2
16.8
17
.5
13.2
10
.3
69.5
57
.5
53.2
48
.6
21–2
410
0.0
10
0.0
10
0.0
10
0.0
64
.9
69.5
64
.5
61.2
47
.9
52.7
47
.4
42.4
40
.6
42.7
37
.5
30.8
84
.6
81.0
79
.1
72.7
25
–34
100.
0
100.
0
100.
0
100.
0
81.7
81
.4
78.6
75
.8
71.9
71
.7
69.4
66
.6
61.8
61
.4
59.7
56
.2
85.9
85
.7
86.0
84
.3
35–4
410
0.0
10
0.0
10
0.0
10
0.0
83
.6
84.1
82
.4
79.1
76
.1
76.8
74
.6
71.6
65
.2
65.5
63
.7
59.4
85
.6
85.3
85
.4
82.9
45
–54
100.
0
100.
0
100.
0
100.
0
86.8
86
.0
84.9
83
.4
80.0
80
.0
78.3
75
.7
69.7
69
.3
67.2
64
.1
87.1
86
.6
85.8
84
.7
55–6
410
0.0
10
0.0
10
0.0
10
0.0
82
.2
84.7
83
.7
84.3
74
.6
76.4
76
.1
77.2
66
.4
67.4
67
.4
68.0
89
.0
88.3
88
.6
88.1
M
en10
0.0
10
0.0
10
0.0
10
0.0
81
.5
82.0
79
.5
77.4
73
.6
74.5
71
.5
69.2
66
.5
66.7
63
.8
60.3
90
.4
89.5
89
.3
87.2
18
–20
100.
0
100.
0
100.
0
100.
0
49.5
55
.7
49.8
50
.4
25.5
30
.0
26.6
22
.5
18.6
18
.6
14.2
11
.7
72.8
62
.0
53.3
52
.1
21–2
410
0.0
10
0.0
10
0.0
10
0.0
64
.4
66.6
63
.0
59.3
48
.5
52.6
46
.6
42.1
43
.0
44.2
38
.6
31.9
88
.7
84.1
82
.8
75.8
25
–34
100.
0
100.
0
100.
0
100.
0
82.3
81
.5
77.7
74
.2
74.1
73
.8
69.7
65
.7
66.5
66
.1
62.7
57
.3
89.7
89
.6
90.0
87
.2
35–4
410
0.0
10
0.0
10
0.0
10
0.0
85
.2
86.1
84
.0
80.3
80
.2
81.4
78
.5
75.3
73
.4
73.7
70
.9
65.6
91
.4
90.6
90
.3
87.1
45
–54
100.
0
100.
0
100.
0
100.
0
90.0
87
.6
86.1
84
.0
85.5
83
.4
81.4
78
.3
77.8
75
.7
73.8
69
.5
91.0
90
.8
90.6
88
.8
55–6
410
0.0
10
0.0
10
0.0
10
0.0
86
.2
87.1
86
.0
85.6
80
.5
80.5
79
.3
79.5
74
.8
73.8
72
.3
72.4
92
.9
91.7
91
.2
91.0
W
omen
100.
0
100.
0
100.
0
100.
0
78.0
80
.2
78.5
77
.0
66.3
68
.5
67.0
65
.8
53.4
54
.9
53.8
52
.4
80.6
80
.1
80.3
79
.7
18–2
010
0.0
10
0.0
10
0.0
10
0.0
45
.6
56.1
53
.8
45.2
22
.8
31.0
22
.8
19.8
14
.9
16.3
12
.1
8.8
65.5
52
.7
53.1
44
.6
21–2
410
0.0
10
0.0
10
0.0
10
0.0
65
.6
72.6
65
.9
63.1
47
.4
52.9
48
.2
42.7
38
.0
41.1
36
.4
29.7
80
.2
77.7
75
.4
69.7
25
–34
100.
0
100.
0
100.
0
100.
0
81.0
81
.3
79.7
77
.6
69.4
69
.2
69.0
67
.7
56.3
56
.0
56.0
54
.9
81.1
80
.9
81.2
81
.1
35–4
410
0.0
10
0.0
10
0.0
10
0.0
81
.8
82.0
80
.5
77.8
71
.6
71.8
70
.2
67.6
56
.2
56.5
55
.7
52.5
78
.5
78.6
79
.3
77.7
45
–54
100.
0
100.
0
100.
0
100.
0
83.5
84
.4
83.6
82
.7
74.5
76
.5
75.2
73
.0
61.5
62
.6
60.6
58
.6
82.5
81
.9
80.6
80
.3
55–6
410
0.0
10
0.0
10
0.0
10
0.0
78
.0
82.2
81
.4
83.0
68
.4
72.3
72
.8
75.0
57
.7
61.1
62
.4
63.8
84
.3
84.5
85
.7
85.1
a Tak
e-up
rate
is th
e pe
rcen
tage
of w
orke
rs e
ligib
le fo
r cov
erag
e w
ho p
artic
ipat
e.
Em
ploy
ee P
artic
ipat
es
in H
ealth
Pla
n
Sou
rce:
Em
ploy
ee B
enef
it R
esea
rch
Inst
itute
est
imat
es b
ased
on
data
from
the
Sur
vey
of In
com
e an
d P
rogr
am P
artic
ipat
ion,
199
6, 2
001,
200
4, a
nd 2
008
pane
ls.
Sp
on
sors
hip
Rat
es, O
ffer
Rat
es, P
arti
cip
atio
n R
ates
, an
d T
ake-
Up
Rat
es, b
y A
ge
and
Gen
der
, Sel
ect
Yea
rsW
age
and
Sal
ary
Wor
kers
, Age
s 18
–64,
199
7–20
10
Figu
re A
4
Tota
lE
mpl
oyer
Spo
nsor
s
H
ealth
Pla
nE
mpl
oyee
Elig
ible
for H
ealth
Pla
nTa
ke-U
p R
atea
(mill
ions
)
(per
cent
age
with
in a
ge a
nd g
ende
r cat
egor
ies)
ebri.org Issue Brief • April 2012 • No. 370 32
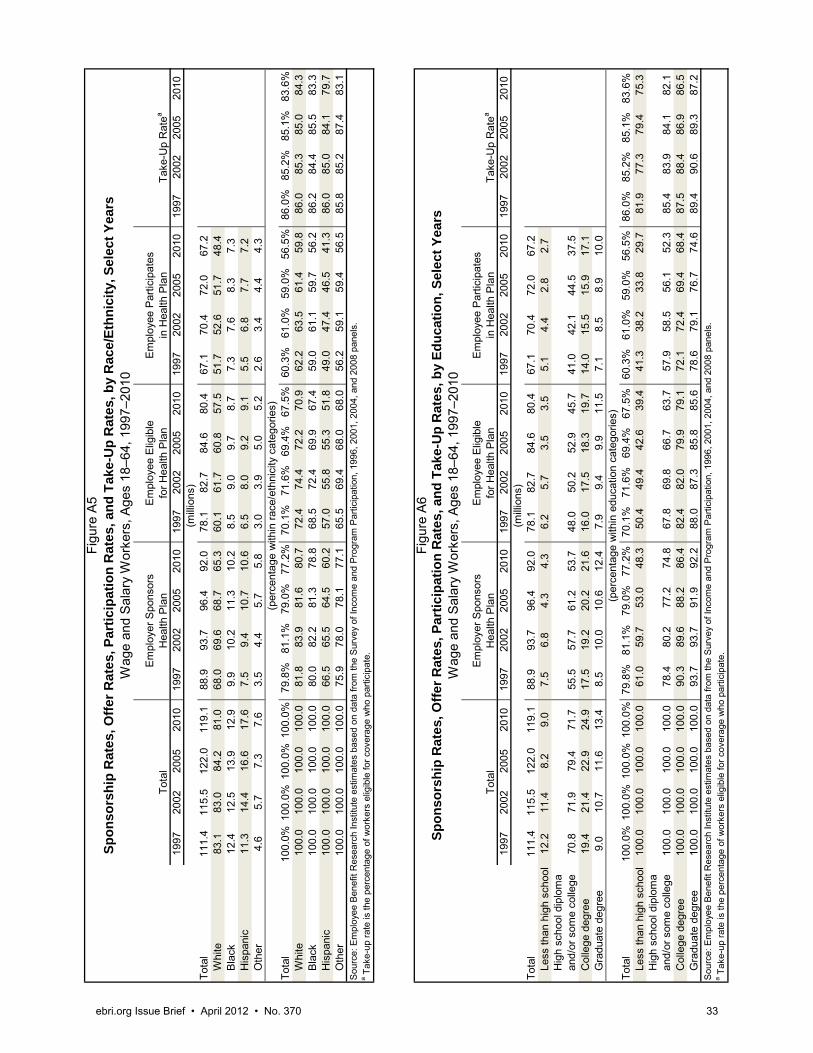
1997
2002
2005
2010
1997
2002
2005
2010
1997
2002
2005
2010
1997
2002
2005
2010
1997
2002
2005
2010
Tota
l11
1.4
115.
512
2.0
119.
188
.993
.796
.492
.078
.182
.784
.680
.467
.170
.472
.067
.2W
hite
83.1
83.0
84.2
81.0
68.0
69.6
68.7
65.3
60.1
61.7
60.8
57.5
51.7
52.6
51.7
48.4
Bla
ck12
.412
.513
.912
.99.
910
.211
.310
.28.
59.
09.
78.
77.
37.
68.
37.
3H
ispa
nic
11.3
14.4
16.6
17.6
7.5
9.4
10.7
10.6
6.5
8.0
9.2
9.1
5.5
6.8
7.7
7.2
Oth
er4.
65.
77.
37.
63.
54.
45.
75.
83.
03.
95.
05.
22.
63.
44.
44.
3
Tota
l10
0.0%
100.
0%10
0.0%
100.
0%79
.8%
81.1
%79
.0%
77.2
%70
.1%
71.6
%69
.4%
67.5
%60
.3%
61.0
%59
.0%
56.5
%86
.0%
85.2
%85
.1%
83.6
%W
hite
100.
0
100.
0
100.
0
100.
0
81.8
83
.9
81.6
80
.7
72.4
74
.4
72.2
70
.9
62.2
63
.5
61.4
59
.8
86.0
85
.3
85.0
84
.3
Bla
ck10
0.0
10
0.0
10
0.0
10
0.0
80
.0
82.2
81
.3
78.8
68
.5
72.4
69
.9
67.4
59
.0
61.1
59
.7
56.2
86
.2
84.4
85
.5
83.3
H
ispa
nic
100.
0
100.
0
100.
0
100.
0
66.5
65
.5
64.5
60
.2
57.0
55
.8
55.3
51
.8
49.0
47
.4
46.5
41
.3
86.0
85
.0
84.1
79
.7
Oth
er10
0.0
10
0.0
10
0.0
10
0.0
75
.9
78.0
78
.1
77.1
65
.5
69.4
68
.0
68.0
56
.2
59.1
59
.4
56.5
85
.8
85.2
87
.4
83.1
a Tak
e-up
rate
is th
e pe
rcen
tage
of w
orke
rs e
ligib
le fo
r cov
erag
e w
ho p
artic
ipat
e.
1997
2002
2005
2010
1997
2002
2005
2010
1997
2002
2005
2010
1997
2002
2005
2010
1997
2002
2005
2010
Tota
l11
1.4
115.
512
2.0
119.
188
.993
.796
.492
.078
.182
.784
.680
.467
.170
.472
.067
.2Le
ss th
an h
igh
scho
ol12
.211
.48.
29.
07.
56.
84.
34.
36.
25.
73.
53.
55.
14.
42.
82.
7H
igh
scho
ol d
iplo
ma
an
d/or
som
e co
llege
70.8
71.9
79.4
71.7
55.5
57.7
61.2
53.7
48.0
50.2
52.9
45.7
41.0
42.1
44.5
37.5
Col
lege
deg
ree
19.4
21.4
22.9
24.9
17.5
19.2
20.2
21.6
16.0
17.5
18.3
19.7
14.0
15.5
15.9
17.1
Gra
duat
e de
gree
9.0
10.7
11.6
13.4
8.5
10.0
10.6
12.4
7.9
9.4
9.9
11.5
7.1
8.5
8.9
10.0
Tota
l10
0.0%
100.
0%10
0.0%
100.
0%79
.8%
81.1
%79
.0%
77.2
%70
.1%
71.6
%69
.4%
67.5
%60
.3%
61.0
%59
.0%
56.5
%86
.0%
85.2
%85
.1%
83.6
%Le
ss th
an h
igh
scho
ol10
0.0
10
0.0
10
0.0
10
0.0
61
.0
59.7
53
.0
48.3
50
.4
49.4
42
.6
39.4
41
.3
38.2
33
.8
29.7
81
.9
77.3
79
.4
75.3
H
igh
scho
ol d
iplo
ma
an
d/or
som
e co
llege
100.
0
100.
0
100.
0
100.
0
78.4
80
.2
77.2
74
.8
67.8
69
.8
66.7
63
.7
57.9
58
.5
56.1
52
.3
85.4
83
.9
84.1
82
.1
Col
lege
deg
ree
100.
0
100.
0
100.
0
100.
0
90.3
89
.6
88.2
86
.4
82.4
82
.0
79.9
79
.1
72.1
72
.4
69.4
68
.4
87.5
88
.4
86.9
86
.5
Gra
duat
e de
gree
100.
0
100.
0
100.
0
100.
0
93.7
93
.7
91.9
92
.2
88.0
87
.3
85.8
85
.6
78.6
79
.1
76.7
74
.6
89.4
90
.6
89.3
87
.2
a Tak
e-up
rate
is th
e pe
rcen
tage
of w
orke
rs e
ligib
le fo
r cov
erag
e w
ho p
artic
ipat
e.
(mill
ions
)
(per
cent
age
with
in e
duca
tion
cate
gorie
s)
Sou
rce:
Em
ploy
ee B
enef
it R
esea
rch
Inst
itute
est
imat
es b
ased
on
data
from
the
Sur
vey
of In
com
e an
d P
rogr
am P
artic
ipat
ion,
199
6, 2
001,
200
4, a
nd 2
008
pane
ls.
Figu
re A
6S
po
nso
rsh
ip R
ates
, Off
er R
ates
, Pa
rtic
ipat
ion
Rat
es, a
nd
Tak
e-U
p R
ates
, by
Ed
uca
tio
n, S
elec
t Y
ears
Wag
e an
d Sa
lary
Wor
kers
, Age
s 18
–64,
199
7–20
10
Tota
lE
mpl
oyer
Spo
nsor
s
H
ealth
Pla
nE
mpl
oyee
Elig
ible
for H
ealth
Pla
nE
mpl
oyee
Par
ticip
ates
in
Hea
lth P
lan
Take
-Up
Rat
ea
(per
cent
age
with
in ra
ce/e
thni
city
cat
egor
ies)
Em
ploy
ee P
artic
ipat
es
in H
ealth
Pla
n
Figu
re A
5S
po
nso
rsh
ip R
ates
, Off
er R
ates
, Pa
rtic
ipat
ion
Rat
es, a
nd
Tak
e-U
p R
ates
, by
Rac
e/E
thn
icit
y, S
elec
t Y
ears
Wag
e an
d Sa
lary
Wor
kers
, Age
s 18
–64,
199
7–20
10
Sou
rce:
Em
ploy
ee B
enef
it R
esea
rch
Inst
itute
est
imat
es b
ased
on
data
from
the
Sur
vey
of In
com
e an
d P
rogr
am P
artic
ipat
ion,
199
6, 2
001,
200
4, a
nd 2
008
pane
ls.
Tota
lE
mpl
oyer
Spo
nsor
s
H
ealth
Pla
nE
mpl
oyee
Elig
ible
for H
ealth
Pla
nTa
ke-U
p R
atea
(mill
ions
)
ebri.org Issue Brief • April 2012 • No. 370 33

ebri.org Issue Brief • April 2012 • No. 370 34
References Fronstin, Paul. “Trends in Health Insurance Coverage: A Look at Early 2001 Data.” Health Affairs. Vol. 21, no. 1
(January/February 2002).
_ ___. “Sources of Health Insurance and Characteristics of the Uninsured: Analysis of the March 2011 Current Population Survey.” EBRI Issue Brief no. 362 (Employee Benefit Research Institute, September 2011).
1100 13th Street NW · Suite 878 Washington, DC 20005
(202) 659-0670 www.ebri.org
www.choosetosave.org
Where the world turns for the facts on U.S. employee benefits. Retirement and health benefits are at the heart of workers’, employers’, and our nation’s economic security. Founded in 1978, EBRI is the most authoritative and objective source of information on these critical, complex issues. EBRI focuses solely on employee benefits research — no lobbying or advocacy.
EBRI stands alone in employee benefits research as an independent, nonprofit, and nonpartisan organization. It analyzes and reports research data without spin or underlying agenda. All findings, whether on financial data, options, or trends, are revealing and reliable — the reason EBRI information is the gold standard for private analysts and decision makers, government policymakers, the media, and the public.
EBRI explores the breadth of employee benefits and related issues.
EBRI studies the world of health and retirement benefits — issues such as 401(k)s, IRAs, retirement income adequacy, consumer-driven benefits, Social Security, tax treatment of both retirement and health benefits, cost management, worker and employer attitudes, policy reform proposals, and pension assets and funding. There is widespread recognition that if employee benefits data exist, EBRI knows it.
EBRI delivers a steady stream of invaluable research and analysis.
EBRI publications include in-depth coverage of key issues and trends; summaries of research findings and policy developments; timely factsheets on hot topics; regular updates on legislative and regulatory developments; comprehensive reference resources on benefit programs and workforce issues; and major surveys of public attitudes.
EBRI meetings present and explore issues with thought leaders from all sectors. EBRI regularly provides congressional testimony, and briefs policymakers, member organizations,
and the media on employer benefits. EBRI issues press releases on newsworthy developments, and is among the most widely quoted
sources on employee benefits by all media. EBRI directs members and other constituencies to the information they need and undertakes new
research on an ongoing basis. EBRI maintains and analyzes the most comprehensive database of 401(k)-type programs in the
world. Its computer simulation analyses on Social Security reform and retirement income adequacy are unique.
EBRI makes information freely available to all.
EBRI assumes a public service responsibility to make its findings completely accessible at www.ebri.org — so that all decisions that relate to employee benefits, whether made in Congress or board rooms or families’ homes, are based on the highest quality, most dependable information. EBRI’s Web site posts all research findings, publications, and news alerts. EBRI also extends its education and public service role to improving Americans’ financial knowledge through its award-winning public service campaign ChoosetoSave® and the companion site www.choosetosave.org
EBRI is supported by organizations from all industries and sectors that appreciate the value of unbiased, reliable information on employee benefits. Visit www.ebri.org/about/join/ for more.

EBRI Employee Benefit Research Institute Issue Brief (ISSN 0887137X) is published monthly by the Employee Benefit Research Institute, 1100 13th St. NW, Suite 878, Washington, DC, 20005-4051, at $300 per year or is included as part of a membership subscription. Periodi-cals postage rate paid in Washington, DC, and additional mailing offices. POSTMASTER: Send address changes to: EBRI Issue Brief, 1100 13th St. NW, Suite 878, Washington, DC, 20005-4051. Copyright 2012 by Employee Benefit Research Institute. All rights reserved. No. 370.
The Employee Benefit Research Institute (EBRI) was founded in 1978. Its mission is to contribute to, to encourage, and to enhance the development of sound employee benefit programs and sound public policy through objective research and education. EBRI is the only private, nonprofit, nonpartisan, Washington, DC-based organization committed exclusively to public policy research and education on economic security and employee benefit issues. EBRI’s membership includes a cross-section of pension funds; businesses; trade associations; labor unions; health care providers and insurers; government organizations; and service firms.
EBRI’s work advances knowledge and understanding of employee benefits and their importance to the nation’s economy among policymakers, the news media, and the public. It does this by conducting and publishing policy research, analysis, and special reports on employee benefits issues; holding educational briefings for EBRI members, congressional and federal agency staff, and the news media; and sponsoring public opinion surveys on employee benefit issues. EBRI’s Education and Research Fund (EBRI-ERF) performs the charitable, educational, and scientific functions of the Institute. EBRI-ERF is a tax-exempt organization supported by contributions and grants.
EBRI Issue Briefs is a monthly periodical with in-depth evaluation of employee benefit issues and trends, as well as critical analyses of employee benefit policies and proposals. EBRI Notes is a monthly periodical providing current information on a variety of employee benefit topics. EBRI Fundamentals of Employee Benefit Programs offers a straightforward, basic explanation of employee benefit programs in the private and public sectors. The EBRI Databook on Employee Benefits is a statistical reference work on employee benefit programs and work force-related issues.
Contact EBRI Publications, (202) 659-0670; fax publication orders to (202) 775-6312. Subscriptions to EBRI Issue Briefs are included as part of EBRI membership, or as part of a $199 annual subscription to EBRI Notes and EBRI Issue Briefs. Change of Address: EBRI, 1100 13th St. NW, Suite 878, Washington, DC, 20005-4051, (202) 659-0670; fax number, (202) 775-6312; e-mail: [email protected] Membership Information: Inquiries regarding EBRI membership and/or contributions to EBRI-ERF should be directed to EBRI President Dallas Salisbury at the above address, (202) 659-0670; e-mail: [email protected]
Editorial Board: Dallas L. Salisbury, publisher; Stephen Blakely, editor. Any views expressed in this publication and those of the authors should not be ascribed to the officers, trustees, members, or other sponsors of the Employee Benefit Research Institute, the EBRI Education and Research Fund, or their staffs. Nothing herein is to be construed as an attempt to aid or hinder the adoption of any pending legislation, regulation, or interpretative rule, or as legal, accounting, actuarial, or other such professional advice. www.ebri.org EBRI Issue Brief is registered in the U.S. Patent and Trademark Office. ISSN: 0887137X/90 0887137X/90 $ .50+.50
© 2012, Employee Benefit Research InstituteEducation and Research Fund. All rights reserved.
Who we are
What we do
Our publications
Orders/ Subscriptions