employment and income transitions across ethnic groups - lucinda platt
DESCRIPTION
One of four presentations from 'New Insights into Ethnicity' event hosted by Understanding Society and JRF on 16 January 2014. More info at: https://www.understandingsociety.ac.uk/2013/11/07/new-insights-into-ethnicity-social-mobility-and-well-beingTRANSCRIPT

Employment and income transitions across ethnic groups
Lucinda Platt
London School of Economics

Context
In 1995, Jarvis and Jenkins wrote that: ‘How individuals’ incomes change from one year to the next in Britain is something little is known about’.
Since then that has changed dramatically, largely through analysis of the British Household Panel Survey (e.g. Jenkins 2011).
The policy value of studying income and employment dynamics is now widely accepted.
But in 2013 it is possible to say that how ethnic minorities’ incomes or employment change from one year to the next (in Britain and elsewhere) is something little is known about.
For the first time, Understanding Society makes this knowledge possible.

Research questions?
How do transitions into and out of employment vary across ethnic groups?
How do low income transitions and low income persistence vary across ethnic groups?
What is the relationship between employment status and low income risks – and does this vary by ethnic group?

Why do we care?
Transitions are more informative than point in time rates – stability and balancing moves in and out of a state can result in the same rate, but have different implications.
As Bane and Ellwood pointed out in 1986, dynamics bring causes into focus
Variation across groups may stem from different dynamic processes.
Up till now has not been possible to explore this
Working poor increasing focus of attention – worth exploring the extent to which employment is linked to changes in income status.
Relative position of minority ethnic groups has been shown to be disadvantaged – and previous evidence for partially hypercyclical relationship to downturns. But is this changing?
Relationship between work status and income status has typically seemed weaker for minority groups – household level situation or strategies may be different. Again is this still the case?

Approach Uses waves 1- 3 (2009/10- 2011/12) of Understanding Society. Some analysis with waves 1-2
only. All analysis takes account of survey design and applies relevant non-response weights for individual respondents.
Looking at change from baseline year to next: chances of changing from employment to non-employment and from higher to lower income
Adding a further year (more time for change to happen).
Among those who are consistently employed what are the chances of being on a lower income ever or at some point.
Among those who experience a transition into non-employment, what are the chances of being on a lower income ever or at some point.
Note low(er) income is bottom 40% of gross equivalent household income
Focus primarily on men – for simplicity and concision – and also more straightforward to interpret.
Sample of working age only: ages 24-59 to avoid students and early labour market position (a different issue) and early retirers.
Focus on selected set of ethnic groups: White UK, Indian, Pakistani, Bangladeshi, Black Caribbean, Black African, White Other.
Note: this is just looking at the initial picture – is there a case to answer? A reason for further investigation of dynamics and transitions by ethnic group and factors related to these.
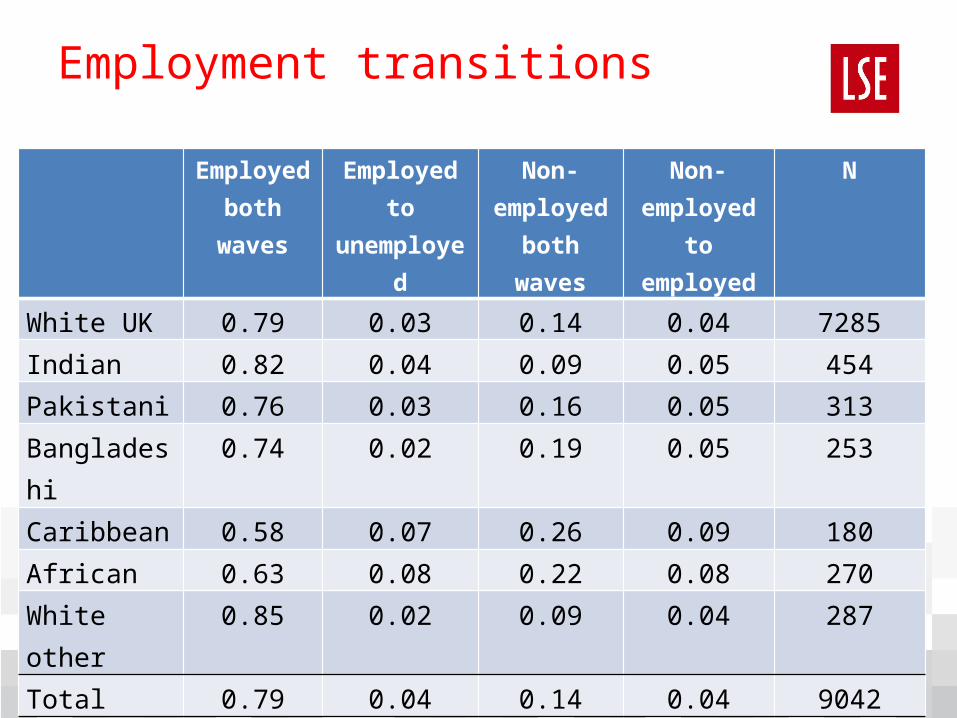
Employment transitions
Employed both
waves
Employed to
unemployed
Non-employed
both waves
Non-employed
to employed
N
White UK 0.79 0.03 0.14 0.04 7285
Indian 0.82 0.04 0.09 0.05 454
Pakistani 0.76 0.03 0.16 0.05 313
Bangladeshi 0.74 0.02 0.19 0.05 253
Caribbean 0.58 0.07 0.26 0.09 180
African 0.63 0.08 0.22 0.08 270
White other 0.85 0.02 0.09 0.04 287
Total 0.79 0.04 0.14 0.04 9042

Chances of becoming unemployed or employed…
Risk of becoming unemployed
Chance of becoming employed
NB small samplesAfter 1 wave After 2 waves After 1 wave After 2
wavesWhite UK 0.04 0.08 0.22 0.29
Indian 0.05 0.08 0.37 0.52
Pakistani 0.04 0.05 0.22 0.42
Bangladeshi 0.03 0.09 0.21 0.38
Caribbean 0.11 0.16 0.26 0.35
African 0.11 0.22 0.26 0.53
White other 0.02 0.04 0.31 0.39
Total 0.04 0.08 0.24 0.32

Low income occurrence and persistence by ethnic group
Men and Women Men only
<40% all 3 waves
<40% any wave
<40% all 3 waves
<40% any wave
White UK 0.16 0.45 0.15 0.41Indian 0.15 0.50 0.14 0.47Pakistani 0.46 0.82 0.44 0.81Bangladeshi 0.33 0.76 0.32 0.69Caribbean 0.24 0.58 0.23 0.56African 0.29 0.71 0.30 0.69White other 0.12 0.42 0.12 0.41Total 0.17 0.46 0.16 0.43

Low income among those continuously in employment for three waves
<40% all 3 waves <40% any wave
White UK 0.07 0.27Indian 0.08 0.37Pakistani 0.35 0.75Bangladeshi 0.21 0.60Caribbean 0.12 0.30African 0.14 0.48White other 0.07 0.34Total 0.08 0.30

Conclusions and issues
Risks of employment transitions - moves into non-employment and into employment greater for certain minority groups: Caribbeans and Africans i.e. greater vulnerability / instability
Low income persistence much higher for some minority groups: Bangladeshis and Pakistanis
Persistent and incidental lower income much more prevalent among continuously employed for certain groups: employment, even continuous employment, doesn’t bring the same returns in terms of standard of living
Processes of employment retention and income dynamics and relationship between employment and income vary across groups – suggesting different policy responses as well as different triggers.
Next steps - to explore factors associated with transitions and with income-employment relationship