employee job satisfaction and engagement - shrm · pdf fileemployee job satisfaction and...
TRANSCRIPT
Employee Job Satisfaction and EngagementThe Road to Economic Recovery
A R e s e a r c h R e p o r t b y t h e S o c i e t y f o r H u m a n R e s o u r c e M a n a g e m e n t ( S H R M )
About SHRMThe Society for Human Resource
Management (SHRM) is the world’s largest
association devoted to human resource
management. Representing more than
250,000 members in over 140 countries,
the Society serves the needs of HR
professionals and advances the interests of
the HR profession. Founded in 1948, SHRM
has more than 575 affiliated chapters
within the United States and subsidiary
offices in China, India and United Arab
Emirates. Visit SHRM Online at shrm.org.
Media Contact Kate Kennedy
[email protected] + 1.703.535.6260
Vanessa [email protected]
Phone +1.703.535.6072
USASHRM
1800 Duke StreetAlexandria, VA 22314Phone +1.800.283.7476
Fax +1.703.535.6432Email [email protected]
ChinaSHRM China
11th Floor, Building AGateway Plaza
No.18 Xiaguangli, North Road East Third Ring
Chaoyang DistrictBeijing, 100027
ChinaTel +86.10.59231033
Fax +86.10.59231055Email [email protected]
India605, 6th Floor,Global Business Park, Tower BGurgaon, Sector 26, Haryana 122002IndiaTel +91.12.44200243
United Arab Emirates Dubai Knowledge VillageBlock 9 – Ground floorExecutive Office 21PO Box 502221Dubai, UAETel +971.050.104.6330Fax +04.364.9465
OnlineSHRM Online shrm.orgSHRM Research shrm.org/researchSHRM Survey Findings shrm.org/surveysSHRM Research on Twitter @SHRM_ResearchSHRM Research on LinkedIn LinkedIn.comSHRM Research on SHRM Connect http://community.shrm.org/home
To order printed copies of this report, visit shrmstore.shrm.org or call 1-800-444-5006.
Employee Job Satisfaction and EngagementThe Road to Economic Recovery
A R e s e a r c h R e p o r t b y t h e S o c i e t y f o r H u m a n R e s o u r c e M a n a g e m e n t ( S H R M )
Contents
Contents
About This Research Report .................................................................... 1Executive Summary .................................................................................. 3Employee Job Satisfaction ....................................................................... 9
Career Development �������������������������������������������������������������������������������������������� 9Opportunities to Use Skills/Abilities ������������������������������������������������������������������������������������� 9Career Advancement Opportunities Within Organization ���������������������������������������������������10Job-Specific Training ������������������������������������������������������������������������������������������������������������10Organization’s Commitment to Professional Development ������������������������������������������������10Career Development Opportunities �������������������������������������������������������������������������������������10Paid Training and Tuition Reimbursement Programs ���������������������������������������������������������� 11Networking ��������������������������������������������������������������������������������������������������������������������������� 11
Employee Relationships with Management ������������������������������������������������������ 12Relationship with Immediate Supervisor ����������������������������������������������������������������������������12Communication Between Employees and Senior Management�����������������������������������������12Autonomy and Independence ����������������������������������������������������������������������������������������������13Management’s Recognition of Employee Job Performance ����������������������������������������������13
Compensation and Benefits ��������������������������������������������������������������������������������14Compensation/Pay ���������������������������������������������������������������������������������������������������������������14Benefits ���������������������������������������������������������������������������������������������������������������������������������15
Work Environment ���������������������������������������������������������������������������������������������� 20Job Security ������������������������������������������������������������������������������������������������������������������������20Organization’s Financial Stability �����������������������������������������������������������������������������������������21The Work Itself ����������������������������������������������������������������������������������������������������������������������21Feeling Safe in the Work Environment ���������������������������������������������������������������������������������21Overall Corporate Culture ����������������������������������������������������������������������������������������������������21Relationship with Co-Workers ����������������������������������������������������������������������������������������������21Meaningfulness of the Job ���������������������������������������������������������������������������������������������������21Contribution of Work to Organization’s Business Goals ������������������������������������������������������21Variety of Work���������������������������������������������������������������������������������������������������������������������22Organization’s Commitment to Corporate Social Responsibility ���������������������������������������22Organization’s Commitment to a Diverse and Inclusive Workforce �����������������������������������22Organization’s Commitment to a “Green” Workplace ��������������������������������������������������������22
Employee Engagement .............................................................................27Conditions for Engagement �������������������������������������������������������������������������������� 27Engagement Opinions ����������������������������������������������������������������������������������������� 27Engagement Behaviors ��������������������������������������������������������������������������������������� 28
Conclusions ............................................................................................. 33Methodology ........................................................................................... 34Appendix: Tables 7 - 23 ........................................................................... 39Endnotes .................................................................................................. 54Additional SHRM Resources ..................................................................55

About This Rese arch Report
Employee Job Satisfaction and Engagement | 1
About This Rese arch Report
About This Research Report
The following report represents the findings from the SHRM Employee Job Satisfaction and Engagement Survey of 600 U.S. employees. The overall employee survey was conducted in July and August of 2013. The purpose of the annual employee survey is to identify factors that influence overall employee satisfaction and engagement in the workplace. This information will provide insight on employee preferences and highlight key areas for organizations to consider as they develop and enhance initiatives for organizational improvement.
Every two years, SHRM also surveys human resource (HR) professionals to examine their overall job satisfaction and engagement levels. The results of that survey are included in this report. HR professionals were surveyed during Sep-tember and October of 2013; 347 responses were obtained.
The survey assesses 35 aspects of employee job satisfac-tion and 34 aspects of employee engagement. These aspects are categorized into the following eight areas:
1 Career development.
2 Relationship with management.
3 Compensation.
4 Benefits.
5 Work environment.
6 Conditions for engagement.
7 Engagement opinions.
8 Engagement behaviors.
The overall findings are explained in text and through supporting visual references. The research objective of this report is to provide the following analyses:
•Ananalysisoftheimportanceofemployeejobsatisfaction contributors, including statistically significant differences.
•Ananalysisofemployeesatisfactionwithjobsatisfaction contributors.
•Arankingofthetopfiveemployeejobsatisfactioncontributors by demographic variables, which include employee gender, age and job level.
•Ananalysisofemployeeengagementthroughanengagement index computation.
•Arankingofthetopfiveemployeeengagementaspectsby demographic variables, including employee gender, age and job level.
•Additionalanalysesbydemographicvariables,whichinclude employee gender, age and job level.
•AcomparisonofHRprofessionals’importantjobsatisfaction contributors to those of the overall employee population.
•AcomparisonofHRprofessionals’engagementtotheengagement level of the overall employee population.
Executive Summary
In 2013, 81% of U.S. employees reported overall satisfaction with their
current job, unchanged from 2012.
Employee Job Satisfaction and Engagement | 3
Executive Summary
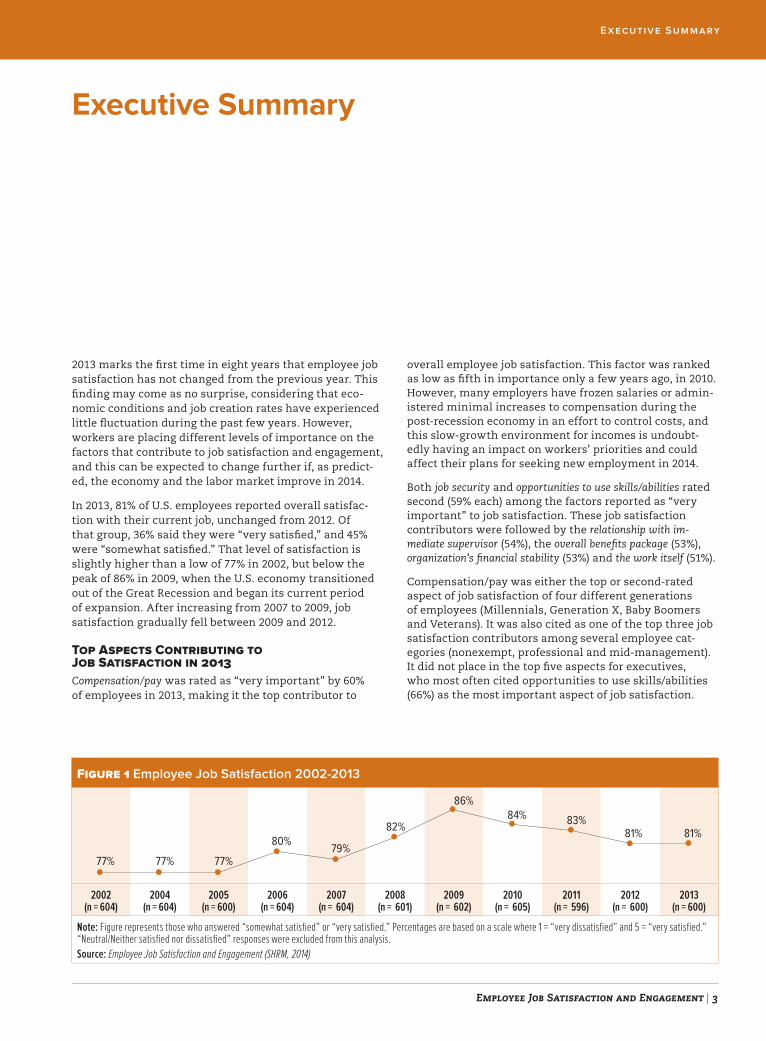
Figure 1 Employee Job Satisfaction 2002-2013
2002(n = 604)
2004(n = 604)
2005(n = 600)
2006(n = 604)
2007(n = 604)
2008(n = 601)
2009(n = 602)
2010(n = 605)
2011(n = 596)
2012(n = 600)
2013(n = 600)
Note: Figure represents those who answered “somewhat satisfied” or “very satisfied.” Percentages are based on a scale where 1 = “very dissatisfied” and 5 = “very satisfied.” “Neutral/Neither satisfied nor dissatisfied” responses were excluded from this analysis. Source: Employee Job Satisfaction and Engagement (SHRM, 2014)
Executive Summary
2013 marks the first time in eight years that employee job satisfaction has not changed from the previous year. This finding may come as no surprise, considering that eco-nomic conditions and job creation rates have experienced little fluctuation during the past few years. However, workers are placing different levels of importance on the factors that contribute to job satisfaction and engagement, and this can be expected to change further if, as predict-ed, the economy and the labor market improve in 2014.
In 2013, 81% of U.S. employees reported overall satisfac-tion with their current job, unchanged from 2012. Of that group, 36% said they were “very satisfied,” and 45% were “somewhat satisfied.” That level of satisfaction is slightly higher than a low of 77% in 2002, but below the peak of 86% in 2009, when the U.S. economy transitioned out of the Great Recession and began its current period of expansion. After increasing from 2007 to 2009, job satisfaction gradually fell between 2009 and 2012.
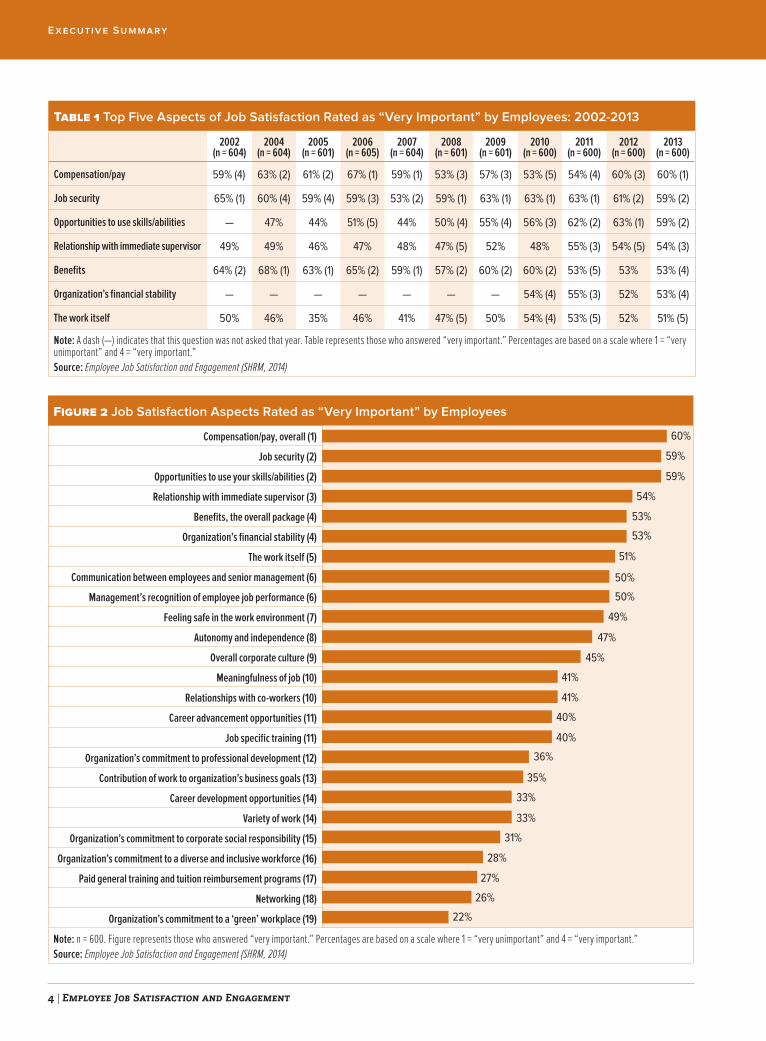
Top Aspects Contributing to Job Satisfaction in 2013 Compensation/pay was rated as “very important” by 60% of employees in 2013, making it the top contributor to
overall employee job satisfaction. This factor was ranked as low as fifth in importance only a few years ago, in 2010. However, many employers have frozen salaries or admin-istered minimal increases to compensation during the post-recession economy in an effort to control costs, and this slow-growth environment for incomes is undoubt-edly having an impact on workers’ priorities and could affect their plans for seeking new employment in 2014.
Both job security and opportunities to use skills/abilities rated second (59% each) among the factors reported as “very important” to job satisfaction. These job satisfaction contributors were followed by the relationship with im-mediate supervisor (54%), the overall benefits package (53%), organization’s financial stability (53%) and the work itself (51%).
Compensation/pay was either the top or second-rated aspect of job satisfaction of four different generations of employees (Millennials, Generation X, Baby Boomers and Veterans). It was also cited as one of the top three job satisfaction contributors among several employee cat-egories (nonexempt, professional and mid-management). It did not place in the top five aspects for executives, who most often cited opportunities to use skills/abilities (66%) as the most important aspect of job satisfaction.
77% 77% 77%
80%79%
82%
86%84% 83%
81% 81%
4 | Employee Job Satisfaction and Engagement
Executive Summary
Table 1 Top Five Aspects of Job Satisfaction Rated as “Very Important” by Employees: 2002-2013
2002 (n = 604)
2004 (n = 604)
2005 (n = 601)
2006 (n = 605)
2007 (n = 604)
2008 (n = 601)
2009 (n = 601)
2010 (n = 600)
2011 (n = 600)
2012 (n = 600)
2013 (n = 600)
Compensation/pay 59% (4) 63% (2) 61% (2) 67% (1) 59% (1) 53% (3) 57% (3) 53% (5) 54% (4) 60% (3) 60% (1)
Job security 65% (1) 60% (4) 59% (4) 59% (3) 53% (2) 59% (1) 63% (1) 63% (1) 63% (1) 61% (2) 59% (2)
Opportunities to use skills/abilities — 47% 44% 51% (5) 44% 50% (4) 55% (4) 56% (3) 62% (2) 63% (1) 59% (2)
Relationship with immediate supervisor 49% 49% 46% 47% 48% 47% (5) 52% 48% 55% (3) 54% (5) 54% (3)
Benefits 64% (2) 68% (1) 63% (1) 65% (2) 59% (1) 57% (2) 60% (2) 60% (2) 53% (5) 53% 53% (4)
Organization’s financial stability — — — — — — — 54% (4) 55% (3) 52% 53% (4)
The work itself 50% 46% 35% 46% 41% 47% (5) 50% 54% (4) 53% (5) 52% 51% (5)
Note: A dash (—) indicates that this question was not asked that year. Table represents those who answered “very important.” Percentages are based on a scale where 1 = “very unimportant” and 4 = “very important.” Source: Employee Job Satisfaction and Engagement (SHRM, 2014)
Figure 2 Job Satisfaction Aspects Rated as “Very Important” by Employees
Compensation/pay, overall (1)
Job security (2)
Opportunities to use your skills/abilities (2)
Relationship with immediate supervisor (3)
Benefits, the overall package (4)
Organization’s financial stability (4)
The work itself (5)
Communication between employees and senior management (6)
Management’s recognition of employee job performance (6)
Feeling safe in the work environment (7)
Autonomy and independence (8)
Overall corporate culture (9)
Meaningfulness of job (10)
Relationships with co-workers (10)
Career advancement opportunities (11)
Job specific training (11)
Organization’s commitment to professional development (12)
Contribution of work to organization’s business goals (13)
Career development opportunities (14)
Variety of work (14)
Organization’s commitment to corporate social responsibility (15)
Organization’s commitment to a diverse and inclusive workforce (16)
Paid general training and tuition reimbursement programs (17)
Networking (18)
Organization’s commitment to a ‘green’ workplace (19)
Note: n = 600. Figure represents those who answered “very important.” Percentages are based on a scale where 1 = “very unimportant” and 4 = “very important.” Source: Employee Job Satisfaction and Engagement (SHRM, 2014)
60%
59%
59%
54%
53%
53%
51%
50%
50%
49%
47%
45%
41%
41%
40%
40%
36%
35%
33%
33%
31%
28%
27%
26%
22%
Employee Job Satisfaction and Engagement | 5
Executive Summary
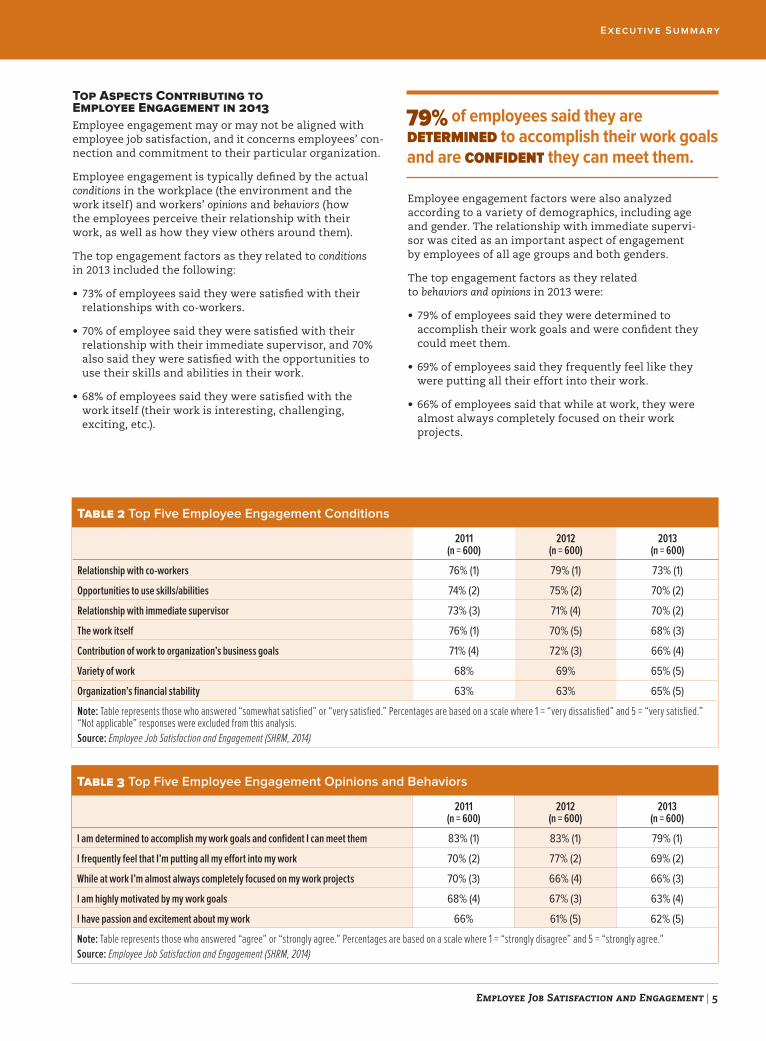
Table 2 Top Five Employee Engagement Conditions
2011 (n = 600)
2012 (n = 600)
2013 (n = 600)
Relationship with co-workers 76% (1) 79% (1) 73% (1)
Opportunities to use skills/abilities 74% (2) 75% (2) 70% (2)
Relationship with immediate supervisor 73% (3) 71% (4) 70% (2)
The work itself 76% (1) 70% (5) 68% (3)
Contribution of work to organization’s business goals 71% (4) 72% (3) 66% (4)
Variety of work 68% 69% 65% (5)
Organization’s financial stability 63% 63% 65% (5)
Note: Table represents those who answered “somewhat satisfied” or “very satisfied.” Percentages are based on a scale where 1 = “very dissatisfied” and 5 = “very satisfied.” “Not applicable” responses were excluded from this analysis. Source: Employee Job Satisfaction and Engagement (SHRM, 2014)
Top Aspects Contributing to Employee Engagement in 2013 Employee engagement may or may not be aligned with employee job satisfaction, and it concerns employees’ con-nection and commitment to their particular organization.
Employee engagement is typically defined by the actual conditions in the workplace (the environment and the work itself) and workers’ opinions and behaviors (how the employees perceive their relationship with their work, as well as how they view others around them).
The top engagement factors as they related to conditions in 2013 included the following:
•73%ofemployeessaidtheyweresatisfiedwiththeirrelationships with co-workers.
•70%ofemployeesaidtheyweresatisfiedwiththeirrelationship with their immediate supervisor, and 70% also said they were satisfied with the opportunities to use their skills and abilities in their work.
•68%ofemployeessaidtheyweresatisfiedwiththework itself (their work is interesting, challenging, exciting, etc.).
Employee engagement factors were also analyzed according to a variety of demographics, including age and gender. The relationship with immediate supervi-sor was cited as an important aspect of engagement by employees of all age groups and both genders.
The top engagement factors as they related to behaviors and opinions in 2013 were:
•79%ofemployeessaidtheyweredeterminedtoaccomplish their work goals and were confident they could meet them.
•69%ofemployeessaidtheyfrequentlyfeelliketheywere putting all their effort into their work.
•66%ofemployeessaidthatwhileatwork,theywerealmost always completely focused on their work projects.
Table 3 Top Five Employee Engagement Opinions and Behaviors
2011 (n = 600)
2012 (n = 600)
2013 (n = 600)
I am determined to accomplish my work goals and confident I can meet them 83% (1) 83% (1) 79% (1)
I frequently feel that I’m putting all my effort into my work 70% (2) 77% (2) 69% (2)
While at work I’m almost always completely focused on my work projects 70% (3) 66% (4) 66% (3)
I am highly motivated by my work goals 68% (4) 67% (3) 63% (4)
I have passion and excitement about my work 66% 61% (5) 62% (5)
Note: Table represents those who answered “agree” or “strongly agree.” Percentages are based on a scale where 1 = “strongly disagree” and 5 = “strongly agree.” Source: Employee Job Satisfaction and Engagement (SHRM, 2014)
79% of employees said they are determined to accomplish their work goals and are confident they can meet them.
6 | Employee Job Satisfaction and Engagement
Executive Summary
What Do These Findings Mean for Organizations?•Makeengagementatoppriority. With limited hiring
activity at some organizations, HR professionals may consider channeling more of their talent management efforts toward existing employees. If and when conditions improve in the labor market, it can be expected that disengaged and dissatisfied employees will pursue other opportunities. A May 2013 SHRM study, in collaboration with Globoforce, revealed that nearly half (47%) of HR professionals said that employee engagement is the most important HR challenge at their organization.1 New strategies for engagement can be explored, including positive feedback and recognition awards. The SHRM/Globoforce study also showed that while an overwhelming majority (94%) of organizations believe positive feedback has an impact on improving employee performance, many companies still do not use these tactics. Nearly one out of five organizations (19%) did not have an employee recognition program.
•Paycompetitively,butfocusonallaspectsofcompensation. Employees are once again placing high value on compensation/pay. However, knowing that many organizations are not making significant increases to salary budgets, a different approach to compensation may be at hand. Many experts now recommend a “total rewards” strategy, placing an emphasis on an organization’s benefits package as well as the base salary. Currently, this approach is not overwhelmingly prevalent, according to a December 2013 SHRM survey.2 Roughly one-fifth (18%) of organizations reported leveraging their benefits program to retain employees, and of that group, health care (68%) and
retirement savings and planning (57%) were leveraged mostfrequently.Amajorityoforganizationsindicatedthat those types of benefits would also increase in importance in the next three to five years in connection with employee retention programs.
•Strengthenrelationshipsatalllevelsoftheorganization. Although many employees emphasize compensation/pay as it relates to job satisfaction, a significant proportion also place importance on relationships with co-workers and supervisors. Fostering an environment that treats all employees equally,aswellasonethatencouragescommunicationbetween all levels of workers, can be an effective means of earning trust from employees and increasing their satisfaction with their jobs. The SHRM/Globoforce survey also revealed that 90% of organizations believe feedback from the employee’s direct supervisor, in combination with feedback from others in the organization (such as peers and higher-level managers and directors), provides a better assessment of employee performance compared with feedback from direct supervisors only.3
Although many employees emphasize compensation/pay as it relates to job satisfaction, a significant proportion also place importance on relationships with co-workers and supervisors.

Executive Summary
Employee Job Satisfac tion
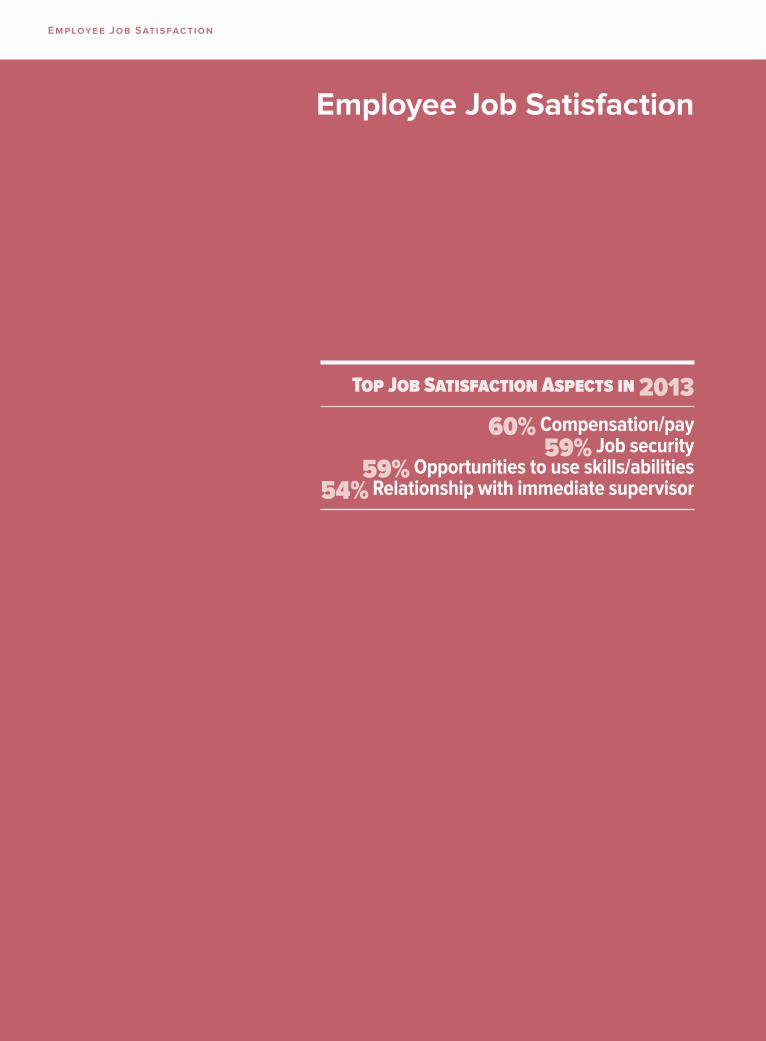
Employee Job Satisfaction
Top Job Satisfaction Aspects in 201360% Compensation/pay
59% Job security 59% Opportunities to use skills/abilities
54% Relationship with immediate supervisor
Employee Job Satisfaction and Engagement | 9
Employee Job Satisfac tion
Career Development
Career development provides opportunities that can be mutually beneficial for both employees and employers. Employees who partake in job training, continuing education and other types of professional development canrefineandacquirenewskillsetsthatcouldhelpadvance their career. In addition, a more knowledgeable staff may translate into various advantages for employers. Building more well-rounded employees by preparing them to better handle tasks and be successful in their roles helps organizations become more effective and efficient. For example, cross-training employees would mitigate the loss of productivity while backfilling a position.
Opportunities to Use Skills and AbilitiesNearly three-fifths (59%) of employees rated opportuni-ties to use their skills and abilities at work as a very important contributor to their job satisfaction. Dropping four percentage points, this aspect decreased from the number one spot in 2012 to the number three spot. Nevertheless, opportunities to use skills and abilities have been on the list of top five job satisfaction contribu-tors since 2008, and in 2006 as well. Seventy percent of employees were satisfied (responded “somewhat satisfied” or “very satisfied”) with this aspect. Within the career development category, opportunities to use skills and
abilities held the highest percentage of “very satisfied” employees. This level of satisfaction placed opportunities to use skills and abilities at work second on the list of factors contributing to employee engagement conditions.
According to the SHRM Workplace Forecast, a shortage of skilled workers is one of the principal concerns for the upcoming years.4 This concern may be a result of increased global competition for talent, higher demand for specialized jobs and the changing demographic of the current workforce (e.g., a large number of Baby Boomers retiring). Incorporating learning opportunities into employees’ personal development plans would help mitigate the skills gap predicted for the future workforce.
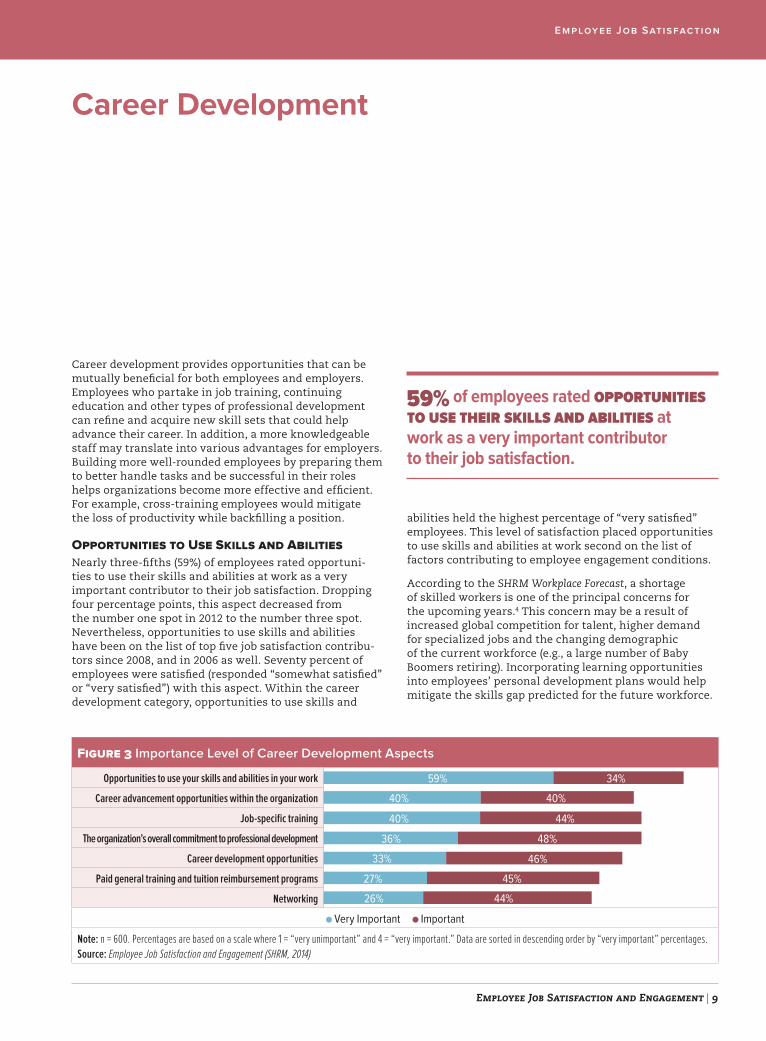
Figure 3 Importance Level of Career Development Aspects
Opportunities to use your skills and abilities in your work
Career advancement opportunities within the organization
Job-specific training
The organization’s overall commitment to professional development
Career development opportunities
Paid general training and tuition reimbursement programs
Networking
Very Important Important
Note: n = 600. Percentages are based on a scale where 1 = “very unimportant” and 4 = “very important.” Data are sorted in descending order by “very important” percentages. Source: Employee Job Satisfaction and Engagement (SHRM, 2014)
59%
40%
40%
36%
33%
27%
26%
34%
40%
44%
48%
46%
45%
44%
59% of employees rated opportunities to use their skills and abilities at work as a very important contributor to their job satisfaction.
10 | Employee Job Satisfaction and Engagement
Employee Job Satisfac tion
Expanding employees’ talents can help prevent inter-ruption in operations due to lack of skilled workers.
Career Advancement Opportunities Within OrganizationTwo out of five (40%) employees reported that career advancement opportunities within their organization were very important to their job satisfaction. This aspect has slowly gained in importance over the last six years; in 2007, only 28% felt that it was a contributor to their job satisfaction. One possible explanation for this gradual increase is the perception that it will be easier and less risky to advance one’s career within the organization than to seek out new employment opportunities. Considering that job security was the top job satisfaction contributor during the height of the recession, employees may have felt safer seeking out internal positions with the help of co-worker connections and their preexisting tenure with the organization.
As the economy continues to recover, organizations must be cognizant of how satisfied their employees are with op-portunities for upward mobility within the organization. Only 19% of employees reported being “very satisfied” and 29% were “somewhat satisfied” with the openings to “climb up the ladder.” Despite the still high unemploy-ment rate, workers may become more confident that they can find jobs elsewhere. Employee retention is critical as turnover can inflict a huge burden onto organizations. Losses in productivity during recruitment and training of new employees are among the financial and operational implications for organizations that do not strive to reduce turnover. SHRM’s 2013 Human Capital Benchmarking Report found that the average voluntary turnover rate was 13%, a 44% increase from the previous year.5 In addition, the report noted that the average cost-per-hire was $2,819 and the average time to fill a position was 32 days.
Furthermore, failure to see a bright future with the organization may damage employee morale and organi-zational culture. Organizations may want to consider de-veloping a mobility program that includes practices such as internal hiring, mentoring, leadership development programs, and succession planning. If upward mobility is not possible, however, job enlargement through job rotation might be a temporary substitute for employees.
Job-Specific TrainingJob-specific training can help employees develop their talents, empowering them to become more effective and engaged in their roles. Employees’ expanded knowledge could lead to enhanced organizational processes and increased productivity. Forty percent of employees viewed job-specific training as very important to their job satisfaction. Employees in nonmanagement positions found this aspect to be more important than did employees in executive-level positions. Slightly more than one-half (55%) of employees were satisfied with job-specific training at their organization.
A 2012 SHRM survey series titled “Changing Employee SkillsandEducationRequirements”foundthat57%oforganizations had a training budget in 2011.6 While state/
local and federal governments and the finance industry were most likely to have a training budget, high-tech, federal government and finance were the industries with the highest median training budgets. The median training budget across all industries was $50,000, and the total median training budgets tended to parallel the size of the organization. However, only a small percent-age of organizations’ training budgets is dedicated to remedial education to make up for a lack of basic skills.
Organization’s Commitment to Professional DevelopmentExpanding and improving employees’ skills and knowl-edge through professional development helps employees master their duties and responsibilities in their current role. Professional development can encompass learning opportunities such as formal and informal training and attainment of certifications or degrees. Organizations that dedicate a portion of their budget to professional develop-ment send a message that they invest in their employees. Additional benefits of professional development include personal development and greater opportunities for career advancement. Although only 36% of employees rated this aspect as very important to job satisfaction, approximately one-half (52%) of employees reported being satisfied with their organization’s commitment to pro-fessional development. Not surprisingly, professional non-management and middle-management employees placed more value on this aspect as a job satisfaction contributor compared with executive employees. Nonexempt (hourly) nonmanagement, professional nonmanagement and middle-management employees were less satisfied with this aspect compared with executive-level employees.
Other recent SHRM research reported that one-half of organizations have difficulty recruiting highly skilled employees, yet only 30% have positively leveraged benefits to recruit these workers in the last 12 months. Of the organizations that have leveraged their benefits package, 41% have used professional and career develop-ment benefits in attempts to attract highly skilled workers. More than one-half (56%) of organizations indicated that professional and career development will become more important when recruiting highly skilled employees in the next three to five years. Employees are more likely to feel engaged in their jobs when they feel that their employer is invested in growing their careers.
Career Development OpportunitiesDevelopingcareerpathsandladdersaretwotechniquesthat can encourage employees to evolve in their profes-sion. While career paths are typically seen as more horizontal movements and career ladders are viewed as more vertical movements, both options serve to help employees grow their skills and knowledge and can lead to higher levels of engagement. Similar to 2012, one-third (33%) of employees reported that career development opportunities were very important to their overall job satisfaction, and 50% were satisfied with this aspect in their current jobs. Naturally, this element was more important to younger workers (Millennials and Genera-tion X) than to workers in the Baby Boom generation.
Employee Job Satisfaction and Engagement | 11
Employee Job Satisfac tion
As organizations continue to be apprehensive about the potential skills gap in the future, it is important to empower employees with the resources needed to be suc-cessful in their roles. One possible option to prevent this shortage of skilled workers is to incorporate an internship program into the organization’s succession planning. A recent SHRM survey found that 34% of organizations hired more interns in 2013 than in the previous year. Organiza-tions most commonly offer internships to undergraduate students (89%), and 50% of organizations offer internships to graduate students and 17% to high school students. The majority (82%) of organizations have hired at least one intern as a full-time employee after the internship had ended. More organizations are recognizing the benefits of internship programs, such as gaining additional help with operations and building the talent of the future workforce.
Paid Training and Tuition ReimbursementTwenty-seven percent of employees felt that paid training and tuition reimbursement were very important to em-ployee job satisfaction, and 44% said they were satisfied withthisaspect.Organizationsthatrequiretheiremploy-ees to have advanced degrees or value higher education in their culture may want to emphasize this benefit in order to attract talent. The 2013 Employee Benefits research report indicated that roughly three-fifths of organizations already offer this benefit: 61% offered undergraduate educational assistance, and 59% offered graduate educa-tional assistance.7 According to the 2013 Human Capital Benchmarking Report, the average maximum reimburse-ment allowed for tuition/education expenses is $4,591.8
NetworkingWhile networking can be used to foster cross-functional and collaborative skills with internal and external partners, only 26% of employees felt that networking was very important to their job satisfaction. This aspect is near the bottom of the “very important” contributors to job satisfaction, higher only than an organization’s com-mitment to a “green” workplace. Despite its low position compared with the other job satisfaction contributors, networking has gained in importance over the years. One explanation for this growing trend may be the vast improvements and accessibility of technology and social networking. Almost one-half (48%) of employees were satisfied with their opportunities to network with others.
One trend among active and passive jobseekers may be to use social networking websites to determine common connections among current contacts or promising job opportunities. Conversely, using social networking sites for recruiting has been gaining in popularity, especially asatechniqueforattractingpassivejobcandidates.Infact, a 2013 SHRM survey on social networking websites and recruiting found that 77% had done so, a substantial increase from just five years ago (34%) or even two years ago (56%).9 More than two-thirds of organizations used social media to recruit passive candidates who might not otherwise apply or be contacted by the organiza-tion (80%), target candidates with specific skill sets (69%) and increase employer brand and recognition (67%). LinkedIn (94%) and Facebook (54%) were the most commonly used social networking websites.
12 | Employee Job Satisfaction and Engagement
Employee Job Satisfac tion
Employee Relationships with Management
Employeesfrequentlyassociatetheirperceptionoftheir supervisor with their overall attitude toward the organization. In fact, management issues are one of the major sources driving up employee turnover. This reason alone speaks to the multiple implications the employee/management relationship has on an organization. Poor managementhaswidespreadconsequences,rangingfromdiminished employee morale and reduced productivity to damage to an organization’s reputation. Developing effec-tive communication practices and respecting employees’ work and opinions lead to better relationships between managers and their staff. These efforts indicate that management has a vested interest in their employees.
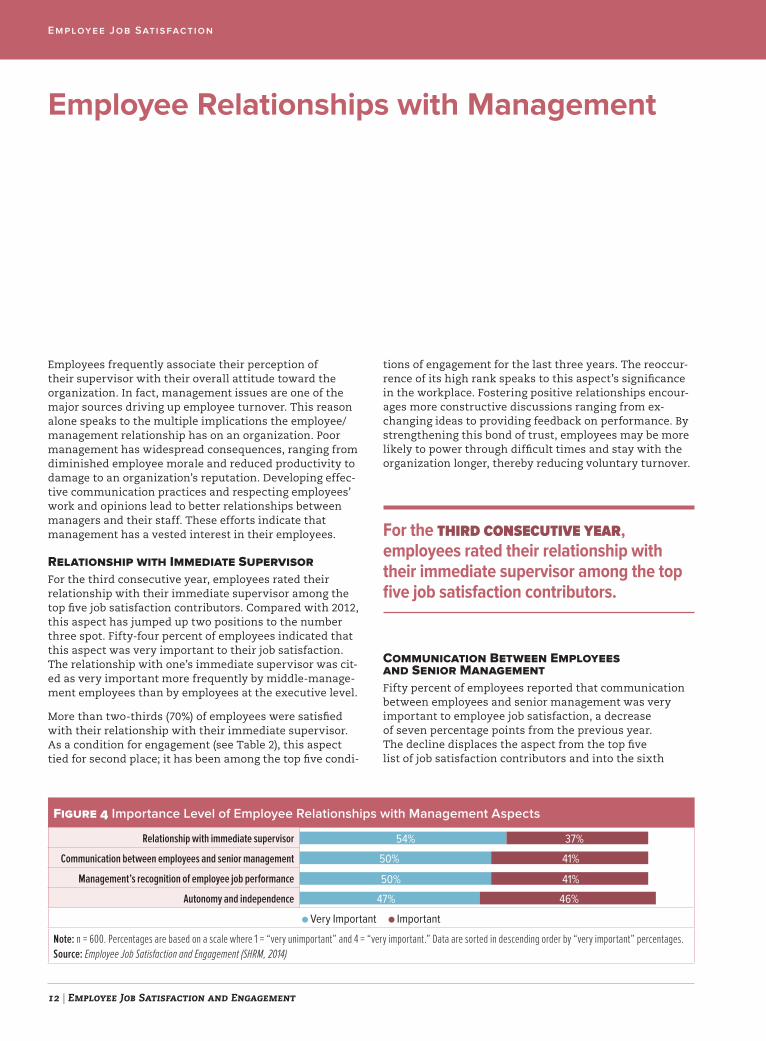
Relationship with Immediate SupervisorFor the third consecutive year, employees rated their relationship with their immediate supervisor among the top five job satisfaction contributors. Compared with 2012, this aspect has jumped up two positions to the number three spot. Fifty-four percent of employees indicated that this aspect was very important to their job satisfaction. The relationship with one’s immediate supervisor was cit-edasveryimportantmorefrequentlybymiddle-manage-ment employees than by employees at the executive level.
More than two-thirds (70%) of employees were satisfied with their relationship with their immediate supervisor. As a condition for engagement (see Table 2), this aspect tied for second place; it has been among the top five condi-
tions of engagement for the last three years. The reoccur-rence of its high rank speaks to this aspect’s significance in the workplace. Fostering positive relationships encour-ages more constructive discussions ranging from ex-changing ideas to providing feedback on performance. By strengthening this bond of trust, employees may be more likely to power through difficult times and stay with the organization longer, thereby reducing voluntary turnover.
Communication Between Employees and Senior ManagementFifty percent of employees reported that communication between employees and senior management was very important to employee job satisfaction, a decrease of seven percentage points from the previous year. The decline displaces the aspect from the top five list of job satisfaction contributors and into the sixth
Figure 4 Importance Level of Employee Relationships with Management Aspects
Relationship with immediate supervisor
Communication between employees and senior management
Management’s recognition of employee job performance
Autonomy and independence
Very Important Important
Note: n = 600. Percentages are based on a scale where 1 = “very unimportant” and 4 = “very important.” Data are sorted in descending order by “very important” percentages.Source: Employee Job Satisfaction and Engagement (SHRM, 2014)
54% 37%
50%
50%
47%
41%
41%
46%
For the third consecutive year, employees rated their relationship with their immediate supervisor among the top five job satisfaction contributors.
Employee Job Satisfaction and Engagement | 13
Employee Job Satisfac tion
position. Female employees perceived this aspect to be more important than did male employees.
Roughly one-half (53%) of employees were satisfied with the communication between employees and senior management. This particular aspect is significant as organizations attempt to recover from the recession. As organizational plans and strategies may shift while footing is regained, it is important to effectively com-municate any adjustments in business objectives and the organization’s vision. It is also helpful to reiterate organizational goals even if they remain unchanged, becauseconsistent,frequentmessagespromoteunityandemployee morale. Regardless, a transparent organiza-tion supports open communication lines, which can stimulate creativity and innovation through collabora-tion. On the other hand, one-way conversations imply managerial announcements or demands rather than dialogue and may stifle a healthy work environment, resulting in employees feeling isolated or “in the dark.”
Autonomy and IndependenceForty-seven percent of employees indicated that au-tonomy and independence were very important contribu-tors to job satisfaction. Even though management may establish goals and objectives for the organization, giving employees the freedom and flexibility to decide how and when they complete projects may improve employee satisfaction and engagement. Holding employees account-able for their work outcomes motivates them to produce better results. According to this research, employees in professional nonmanagement positions valued autonomy and independence more than employees in nonexempt nonmanagement positions did. Nearly two-thirds (64%) of employees were satisfied with their level of autonomy and independence in their current position.
Management’s Recognition of Employee Job PerformanceAlthough only 50% of employees reported that manage-ment’s recognition of employee job performance was very important to their job satisfaction, acknowledging employees’ work provides other benefits. While recogni-tion alone might not be sufficient to retain top performers, it assists in clarifying organizational goals and gaining a more precise picture of employees’ accomplishments. Re-search conducted by SHRM and Globoforce in 2013 found that fourth-fifths (81%) of organizations have an employee recognition program, and 84% believe that recognizing employees for their accomplishments provides employees with a clearer understanding of organizational objec-tives.10 Moreover, nearly all (94%) organizations feel that positive feedback that reinforces behaviors or perfor-mance that should be repeated has a greater impact on improving employee performance compared with nega-tive feedback. Nine out of 10 organizations (90%) believe that feedback from direct supervisors as well as others in the organization (e.g., peers, managers) more accurately reflects the employee’s performance compared with just the employee’s direct supervisor’s feedback. Organiza-tions may want to consider the value and usefulness of this type of feedback in annual performance reviews.
Several significant differences among employee demographics were found in the assessment of this job satisfaction contributor. Female employees were more likely to associate management’s recognition of employee job performance with their overall job satisfac-tion compared with male employees. Furthermore, professional nonmanagement employees considered this aspect to be more important than executive-level employees did. Overall, 56% of employees were satisfied with management’s recognition of their performance.
14 | Employee Job Satisfaction and Engagement
Employee Job Satisfac tion
Compensation and Benefits
Incopingwiththeconsequencesoftherecession,manyorganizations were forced to trim budgets and staff and operate with limited resources. As the economy begins to recover, employees may expect to see enhancements in their compensation and benefits packages. Given that conditions will improve at different rates for different businesses, organizations that cannot offer competitive salaries within their market may need to consider shifting their total rewards strategy. Although compensation was the number one job satisfaction contributor for 2013, sev-eral other perks such as health care and retirement sav-ings plans hold substantial weight in attracting top talent.
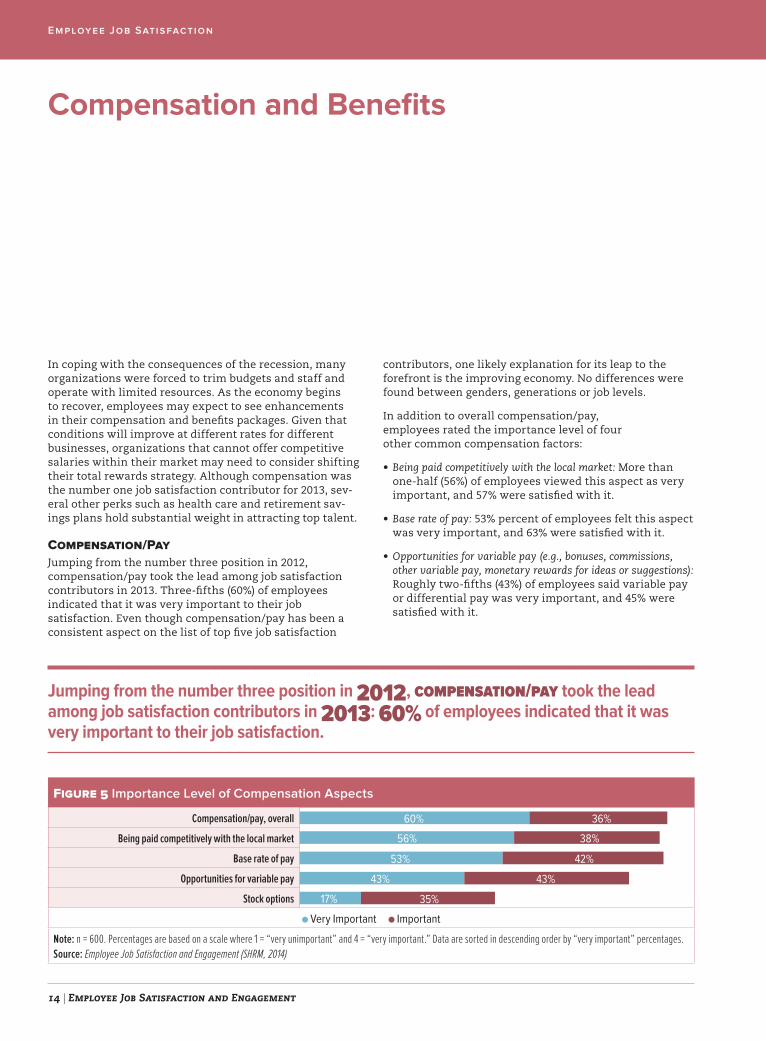
Compensation/PayJumping from the number three position in 2012, compensation/pay took the lead among job satisfaction contributors in 2013. Three-fifths (60%) of employees indicated that it was very important to their job satisfaction. Even though compensation/pay has been a consistent aspect on the list of top five job satisfaction
contributors, one likely explanation for its leap to the forefront is the improving economy. No differences were found between genders, generations or job levels.
In addition to overall compensation/pay, employees rated the importance level of four other common compensation factors:
•Being paid competitively with the local market: More than one-half (56%) of employees viewed this aspect as very important, and 57% were satisfied with it.
•Base rate of pay: 53% percent of employees felt this aspect was very important, and 63% were satisfied with it.
•Opportunities for variable pay (e.g., bonuses, commissions, other variable pay, monetary rewards for ideas or suggestions): Roughly two-fifths (43%) of employees said variable pay or differential pay was very important, and 45% were satisfied with it.
Figure 5 Importance Level of Compensation Aspects
Compensation/pay, overall
Being paid competitively with the local market
Base rate of pay
Opportunities for variable pay
Stock options
Very Important Important
Note: n = 600. Percentages are based on a scale where 1 = “very unimportant” and 4 = “very important.” Data are sorted in descending order by “very important” percentages. Source: Employee Job Satisfaction and Engagement (SHRM, 2014)
60%
56%
53%
43%
17%
36%
38%
42%
43%
35%
Jumping from the number three position in 2012, compensation/pay took the lead among job satisfaction contributors in 2013: 60% of employees indicated that it was very important to their job satisfaction.
Employee Job Satisfaction and Engagement | 15
Employee Job Satisfac tion
•Stock options: Less than one-fifth (17%) of employees viewed this aspect as very important; however, 41% of employees whose organizations offered stock options were satisfied with them.
In late 2013, SHRM LINE research signaled optimism in new-hire compensation.11 For both the manufactur-ing and the service sector, the rate of increase for new-hire compensation rose in comparison with the previous year. Top talent may soon be looking elsewhere for opportunities if they do not feel that theyarebeingadequatelyrewarded.Currently,employees are relatively satisfied (63%) with their pay.
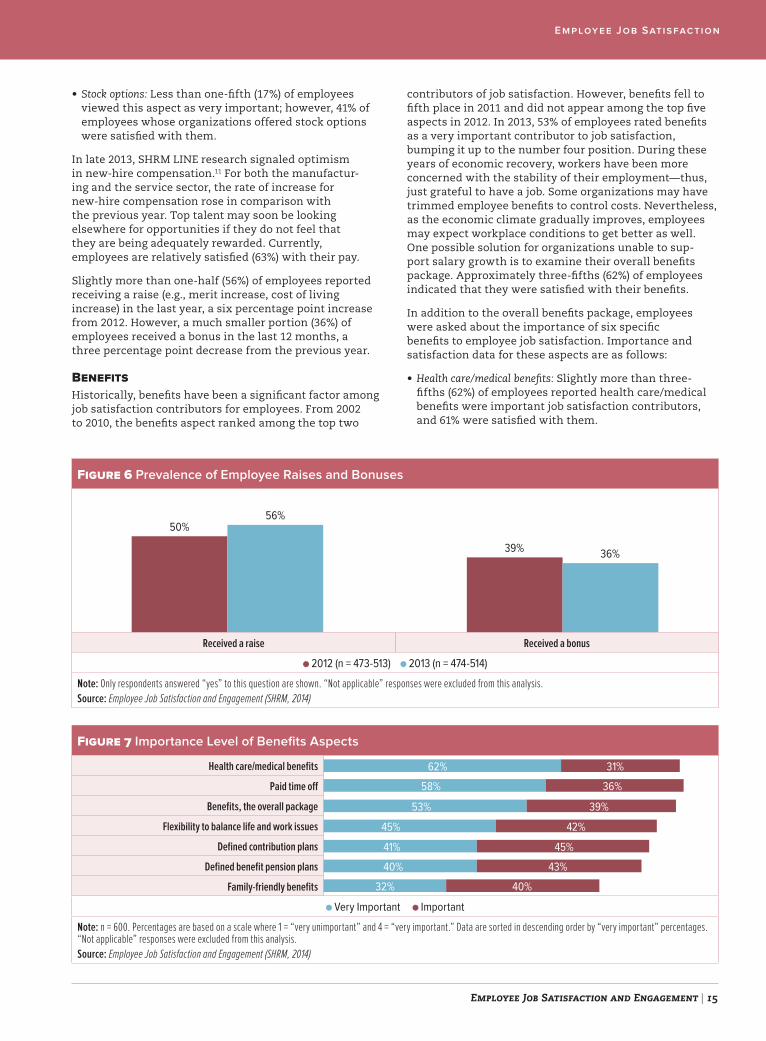
Slightly more than one-half (56%) of employees reported receiving a raise (e.g., merit increase, cost of living increase) in the last year, a six percentage point increase from 2012. However, a much smaller portion (36%) of employees received a bonus in the last 12 months, a three percentage point decrease from the previous year.
BenefitsHistorically, benefits have been a significant factor among job satisfaction contributors for employees. From 2002 to 2010, the benefits aspect ranked among the top two
contributors of job satisfaction. However, benefits fell to fifth place in 2011 and did not appear among the top five aspects in 2012. In 2013, 53% of employees rated benefits as a very important contributor to job satisfaction, bumping it up to the number four position. During these years of economic recovery, workers have been more concerned with the stability of their employment—thus, just grateful to have a job. Some organizations may have trimmed employee benefits to control costs. Nevertheless, as the economic climate gradually improves, employees may expect workplace conditions to get better as well. One possible solution for organizations unable to sup-port salary growth is to examine their overall benefits package. Approximately three-fifths (62%) of employees indicated that they were satisfied with their benefits.
In addition to the overall benefits package, employees were asked about the importance of six specific benefits to employee job satisfaction. Importance and satisfaction data for these aspects are as follows:
•Health care/medical benefits: Slightly more than three-fifths (62%) of employees reported health care/medical benefits were important job satisfaction contributors, and 61% were satisfied with them.
Figure 6 Prevalence of Employee Raises and Bonuses
Received a raise Received a bonus
2012 (n = 473-513) 2013 (n = 474-514)
Note: Only respondents answered “yes” to this question are shown. “Not applicable” responses were excluded from this analysis. Source: Employee Job Satisfaction and Engagement (SHRM, 2014)
50%
39%
56%
36%
Figure 7 Importance Level of Benefits Aspects
Health care/medical benefits
Paid time off
Benefits, the overall package
Flexibility to balance life and work issues
Defined contribution plans
Defined benefit pension plans
Family-friendly benefits
Very Important Important
Note: n = 600. Percentages are based on a scale where 1 = “very unimportant” and 4 = “very important.” Data are sorted in descending order by “very important” percentages. “Not applicable” responses were excluded from this analysis. Source: Employee Job Satisfaction and Engagement (SHRM, 2014)
62%
58%
53%
45%
41%
40%
32%
31%
36%
39%
42%
45%
43%
40%
16 | Employee Job Satisfaction and Engagement
Employee Job Satisfac tion
•Paid time off: Fifty-eight percent of employees indicated that paid time off was a very important job satisfaction contributor, and seven out of 10 employees were satisfied with it.
•Flexibility to balance life and work issues: Nearly one-half (45%) of employees felt that work/life balance was very important to their job satisfaction, and approximately two-thirds (68%) were satisfied with this aspect. Females were more likely than males to value this benefit as a job satisfaction contributor. In addition, Generation X employees placed more importance on work/life balance than Baby Boomers did.
•Defined contribution plans: Roughly two-fifths (41%) of employees believed defined contribution plans (e.g., 401(k), 403(b)) were very important job satisfaction contributors, and 61% were satisfied with them.
•Defined benefit pension plans: Four out of 10 employees rated defined benefit pension plans as very important to their job satisfaction, and more than one-half (55%) were satisfied with this benefit.
•Family-friendly benefits: Only one-third (32%) of employees felt that family-friendly benefits (e.g., domestic partnership benefits, subsidized child care, scholarships) were very important to job satisfaction, and one-half (51%) of employees were satisfied with them.
SHRM’s 2013 Employee Benefits report found that the prevalence of these benefits varied greatly. The most popular health care plan offered was a preferred provider organization (PPO), at 86%.12 Only about one-third (31%) of organizations offered a consumer-directed health care plan (CDHP); however, an increase may be expected as the new health care laws come into play. While nearly all organizations (97%) offered paid holidays, roughly
one-half (52%) offered a paid time off plan, which allows employees to choose how they spend their time off as it combines vacation, sick and personal time into one plan. A moderate amount of organizations offer various flexible work benefits such as telecommuting (58%), flextime (53%) and shift flexibility (19%). Far more organizations offer defined contribution retirement savings plans (92%) than defined benefit pension plans (19%), the prevalence of which has been trending downward over the past five years. Many organizations did not offer a diverse array of family-friendly benefits, as only 34% of organizations offered an on-site lactation/mother’s room, 12% offered a child care referral service, and 2% offered geriatric counseling. Additional detailed information on benefits trends over the last five years can be found in SHRM’s 2013 Employee Benefits research report.13
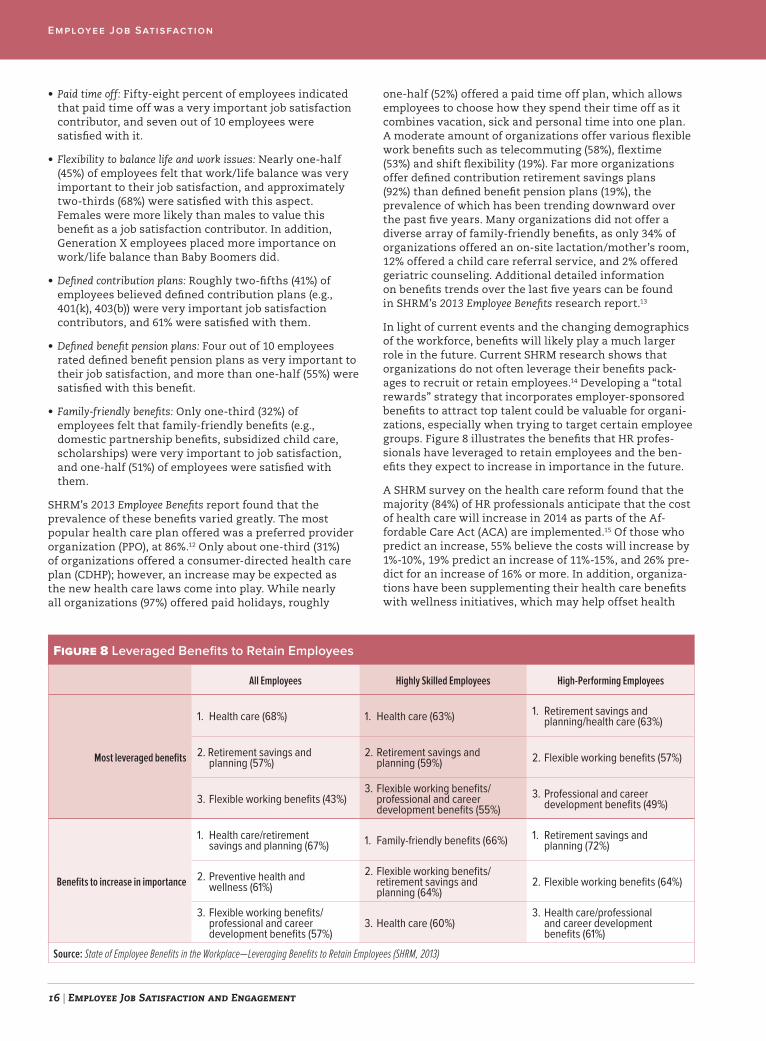
In light of current events and the changing demographics of the workforce, benefits will likely play a much larger role in the future. Current SHRM research shows that organizations do not often leverage their benefits pack-ages to recruit or retain employees.14 Developing a “total rewards” strategy that incorporates employer-sponsored benefits to attract top talent could be valuable for organi-zations, especially when trying to target certain employee groups. Figure 8 illustrates the benefits that HR profes-sionals have leveraged to retain employees and the ben-efits they expect to increase in importance in the future.
A SHRM survey on the health care reform found that the majority (84%) of HR professionals anticipate that the cost of health care will increase in 2014 as parts of the Af-fordable Care Act (ACA) are implemented.15 Of those who predict an increase, 55% believe the costs will increase by 1%-10%, 19% predict an increase of 11%-15%, and 26% pre-dict for an increase of 16% or more. In addition, organiza-tions have been supplementing their health care benefits with wellness initiatives, which may help offset health
Figure 8 Leveraged Benefits to Retain Employees
All Employees Highly Skilled Employees High-Performing Employees
Most leveraged benefits
1� Health care (68%) 1� Health care (63%) 1� Retirement savings and planning/health care (63%)
2� Retirement savings and planning (57%)
2� Retirement savings and planning (59%) 2� Flexible working benefits (57%)
3� Flexible working benefits (43%)3� Flexible working benefits/
professional and career development benefits (55%)
3� Professional and career development benefits (49%)
Benefits to increase in importance
1� Health care/retirement savings and planning (67%) 1� Family-friendly benefits (66%) 1� Retirement savings and
planning (72%)
2� Preventive health and wellness (61%)
2� Flexible working benefits/retirement savings and planning (64%)
2� Flexible working benefits (64%)
3� Flexible working benefits/professional and career development benefits (57%)
3� Health care (60%)3� Health care/professional
and career development benefits (61%)
Source: State of Employee Benefits in the Workplace—Leveraging Benefits to Retain Employees (SHRM, 2013)
Employee Job Satisfaction and Engagement | 17
Employee Job Satisfac tion
care costs. For example, it can be difficult for employees to find time outside of work to exercise or prepare nutritious meals. Giving employees the resources needed to achieve their health goals could also translate into reduced costs through factors such as fewer health care claims.
Along with health care, retirement savings and planning benefits are typically components employees consider to be the most valuable among organizations’ benefits offerings. Before exiting the workforce, Baby Boomers may be more concerned about making catch-up contribu-tions to retirement savings plans to counterbalance any losses incurred during the recession. According to SHRM’s 2013 Employee Benefits report, 76% of organizations offer catch-up contributions, and 71% offer hardship withdrawals.16 Alleviating employees of these financial burdens may have a positive impact on their ability tofocusandthusimprovethequalityoftheirwork.
In recent years, flexible work arrangements have become more accepted in the workplace. SHRM research found that almost three-fifths (57%) of organizations provide employees the option to use flexible work arrange-ments, an increase from the previous year.17 Although the percentage of organizations offering this benefit may not have increased dramatically, the number of people allowed to use this benefit has grown. Forty-five percent of organizations reported that at least one-half of their staff was permitted to use these benefits, compared with 34% in 2012. One-third of organizations also indicated that employee participation in flexible work arrangements increased from last year. Given the Millennial generation’s value of autonomy and the rising global competition that has led to a 24/7 culture, these benefits may gain in popularity in the upcoming years.
18 | Employee Job Satisfaction and Engagement
Employee Job Satisfac tion
TrendsinCompensationandBenefitsAmongHRProfessionalEmployees
In a survey conducted biannually, a separate sample of HR professionals was asked the same questions about job satisfaction and engagement. A total of 347 HR professionals completed the survey dur-ing September and October of 2013. The results were then compared to the 2013 overall employee population and to the 2011 HR professionals’ data.
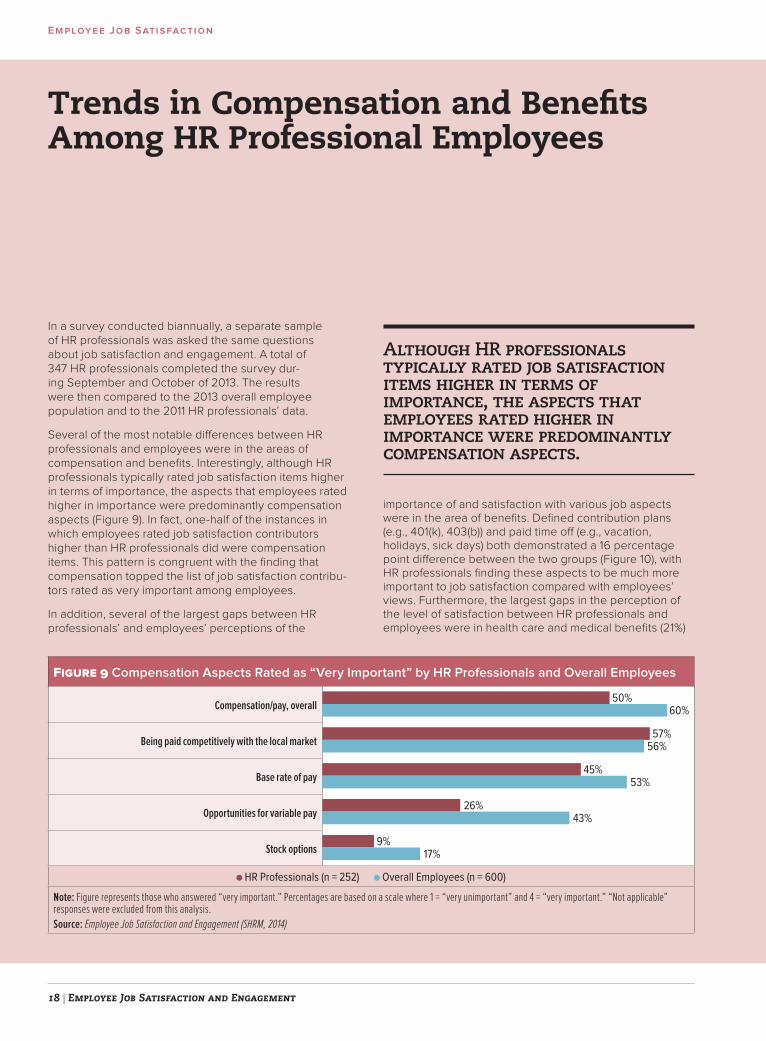
Several of the most notable differences between HR professionals and employees were in the areas of compensation and benefits. Interestingly, although HR professionals typically rated job satisfaction items higher in terms of importance, the aspects that employees rated higher in importance were predominantly compensation aspects (Figure 9). In fact, one-half of the instances in which employees rated job satisfaction contributors higher than HR professionals did were compensation items. This pattern is congruent with the finding that compensation topped the list of job satisfaction contribu-tors rated as very important among employees.
In addition, several of the largest gaps between HR professionals’ and employees’ perceptions of the
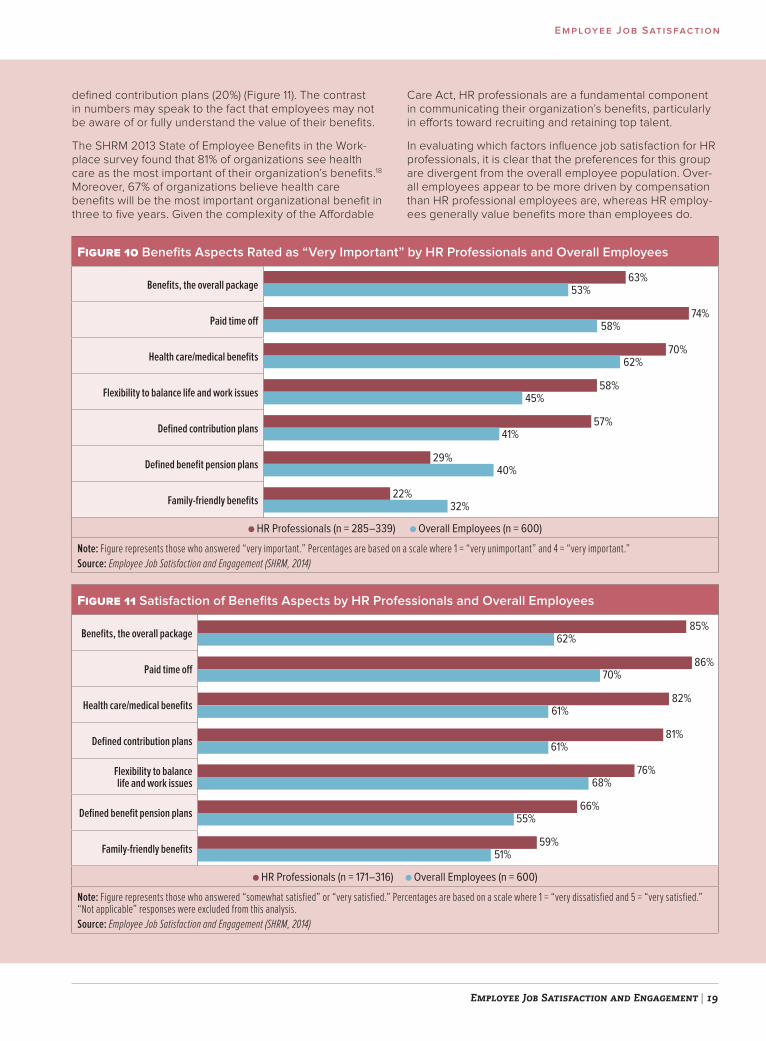
importance of and satisfaction with various job aspects were in the area of benefits. Defined contribution plans (e.g., 401(k), 403(b)) and paid time off (e.g., vacation, holidays, sick days) both demonstrated a 16 percentage point difference between the two groups (Figure 10), with HR professionals finding these aspects to be much more important to job satisfaction compared with employees’ views. Furthermore, the largest gaps in the perception of the level of satisfaction between HR professionals and employees were in health care and medical benefits (21%)
Figure 9 Compensation Aspects Rated as “Very Important” by HR Professionals and Overall Employees
Compensation/pay, overall
Being paid competitively with the local market
Base rate of pay
Opportunities for variable pay
Stock options
HR Professionals (n = 252) Overall Employees (n = 600)
Note: Figure represents those who answered “very important.” Percentages are based on a scale where 1 = “very unimportant” and 4 = “very important.” “Not applicable” responses were excluded from this analysis.Source: Employee Job Satisfaction and Engagement (SHRM, 2014)
50%60%
57%56%
45%53%
26%43%
9%17%
Although HR professionals typically rated job satisfaction items higher in terms of importance, the aspects that employees rated higher in importance were predominantly compensation aspects�
Employee Job Satisfaction and Engagement | 19
Employee Job Satisfac tion
defined contribution plans (20%) (Figure 11). The contrast in numbers may speak to the fact that employees may not be aware of or fully understand the value of their benefits.
The SHRM 2013 State of Employee Benefits in the Work-place survey found that 81% of organizations see health care as the most important of their organization’s benefits.18 Moreover, 67% of organizations believe health care benefits will be the most important organizational benefit in three to five years. Given the complexity of the Affordable
Care Act, HR professionals are a fundamental component in communicating their organization’s benefits, particularly in efforts toward recruiting and retaining top talent.
In evaluating which factors influence job satisfaction for HR professionals, it is clear that the preferences for this group are divergent from the overall employee population. Over-all employees appear to be more driven by compensation than HR professional employees are, whereas HR employ-ees generally value benefits more than employees do.
Figure 11 Satisfaction of Benefits Aspects by HR Professionals and Overall Employees
Benefits, the overall package
Paid time off
Health care/medical benefits
Defined contribution plans
Flexibility to balance life and work issues
Defined benefit pension plans
Family-friendly benefits
HR Professionals (n = 171–316) Overall Employees (n = 600)
Note: Figure represents those who answered “somewhat satisfied” or “very satisfied.” Percentages are based on a scale where 1 = “very dissatisfied and 5 = “very satisfied.” “Not applicable” responses were excluded from this analysis. Source: Employee Job Satisfaction and Engagement (SHRM, 2014)
85%62%
86%70%
82%61%
81%61%
76%68%
66%55%
59%51%
Figure 10 Benefits Aspects Rated as “Very Important” by HR Professionals and Overall Employees
Benefits, the overall package
Paid time off
Health care/medical benefits
Flexibility to balance life and work issues
Defined contribution plans
Defined benefit pension plans
Family-friendly benefits
HR Professionals (n = 285–339) Overall Employees (n = 600)
Note: Figure represents those who answered “very important.” Percentages are based on a scale where 1 = “very unimportant” and 4 = “very important.”Source: Employee Job Satisfaction and Engagement (SHRM, 2014)
63%53%
74%58%
70%62%
58%45%
57%41%
29%40%
22%32%
20 | Employee Job Satisfaction and Engagement
Employee Job Satisfac tion
Work Environment
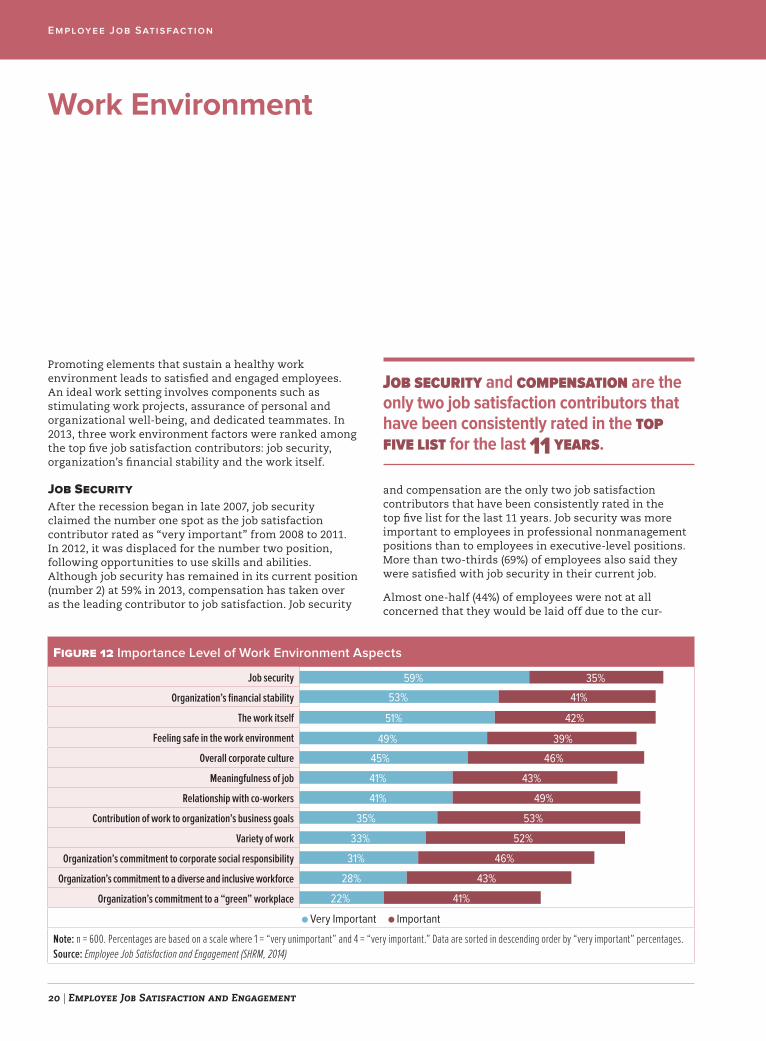
Promoting elements that sustain a healthy work environment leads to satisfied and engaged employees. An ideal work setting involves components such as stimulating work projects, assurance of personal and organizational well-being, and dedicated teammates. In 2013, three work environment factors were ranked among the top five job satisfaction contributors: job security, organization’s financial stability and the work itself.
Job SecurityAfter the recession began in late 2007, job security claimed the number one spot as the job satisfaction contributor rated as “very important” from 2008 to 2011. In 2012, it was displaced for the number two position, following opportunities to use skills and abilities. Although job security has remained in its current position (number 2) at 59% in 2013, compensation has taken over as the leading contributor to job satisfaction. Job security
and compensation are the only two job satisfaction contributors that have been consistently rated in the top five list for the last 11 years. Job security was more important to employees in professional nonmanagement positions than to employees in executive-level positions. More than two-thirds (69%) of employees also said they were satisfied with job security in their current job.
Almost one-half (44%) of employees were not at all concerned that they would be laid off due to the cur-
Figure 12 Importance Level of Work Environment Aspects
Job security
Organization’s financial stability
The work itself
Feeling safe in the work environment
Overall corporate culture
Meaningfulness of job
Relationship with co-workers
Contribution of work to organization’s business goals
Variety of work
Organization’s commitment to corporate social responsibility
Organization’s commitment to a diverse and inclusive workforce
Organization’s commitment to a “green” workplace
Very Important Important
Note: n = 600. Percentages are based on a scale where 1 = “very unimportant” and 4 = “very important.” Data are sorted in descending order by “very important” percentages. Source: Employee Job Satisfaction and Engagement (SHRM, 2014)
59%
53%
51%
49%
35%
41%
42%
39%
45% 46%
41% 43%
41% 49%
35% 53%
33% 52%
31% 46%
28% 43%
22% 41%
Job security and compensation are the only two job satisfaction contributors that have been consistently rated in the top five list for the last 11 years.
Employee Job Satisfaction and Engagement | 21
Employee Job Satisfac tion
rent economic climate, even though one-third (32%) of employees reported layoffs in their organizations within thepast12months.Accordingtothefourthquarter2013SHRM’s Jobs Outlook Survey (JOS), 55% of HR professionals were optimistic about job creation in the U.S. for the end of 2013.18 This number has grown compared with early 2013 (50%) and compared with late 2012 (45%).
Organization’s Financial StabilityFifty-three percent of employees reported that their organization’s financial stability has a very important impact on employee job satisfaction. This year, organiza-tion’s financial stability tied with benefits for fourth place as a very important job satisfaction contributor. Although more HR professionals have faith that the labor market is growing, this aspect is still a concern for employees. Three-fifths (61%) of employees stated that they would be unlikely or very unlikely to look for a job outside of their current organization within the next 12 months. Similarly, 65% of employees reported being satisfied with their organization’s financial stability.
The Work Itself“The work itself” (e.g., stimulating and challenging assignments) can enhance engagement as employees are more motivated to explore topics that incite curiosity and inspiration. Given that many individuals spend much of their waking hours on the job, employees may have more interest in their work and their orga-nizations than their employers think. It is a common misperception that workers are just trying to “get by” with doing the bare minimum. Rather than mundane, repetitive tasks, employees often prefer working on topics that inspire and energize them; double bonus if employees are given the freedom to decide what, how and/or when their projects are completed.
Fifty-one percent of employees reported that the work itself was very important to job satisfaction, making it the fifth most important aspect in the list of job satisfaction contributors. Approximately two-thirds (68%) of employees were satisfied with their work.
Feeling Safe in the Work EnvironmentAccording to recent SHRM research, less than one-fifth of organizations have experienced incidents of domestic violence (19%), sexual violence (11%) or stalking (14%) within the last year.19 More than one-half (54%) of organizations had a formal workplace policy on sexual violence; however, only about one-third had policies on domestic violence (35%) or stalking (31%). To uphold the overall success and well-being of its staff, it is advanta-geous for an organization to assess its safety needs to maximize its efforts in preventing acts of harm.
Although unfortunate events may occur anywhere, even in the workplace, it is reasonable for employees to expect a certain level of security and protection. Forty-nine percent of employees reported that feeling safe in the work environment was very important to their job satisfaction. Female employees considered this aspect as a more important job satisfaction contributor
than male workers did. Three out of four employees were satisfied with their level of safety in the workplace.
Overall Corporate CultureOften thought of as the “glue of an organization,” corporate culture can be described as the shared attitudes and mannerisms held by the members of the organiza-tion. These norms influence how groups, internally and externally, interact with each other. Components of corporate culture range from tangible items such as the dress code and architecture of an office, to the intangibles such as an organization’s mission and values. Because auniquecorporateculturecanhelpanorganizationstand out, it is a critical element that can be used to gain a competitive advantage amongst competitors and to attract a talented workforce. Organizations with a strong corporate culture may even interlock it with the organization’s brand, especially when organizations encourage employees to “live the brand.” Almost one-half (45%) of employees indicated that corporate culture was a very important job satisfaction contributor, and 60% of employees were satisfied with this aspect.
Relationships with Co-workersPositive relationships with co-workers can foster a sense of loyalty, camaraderie and moral support among staff. These bonds may boost overall results and productiv-ity as employees are more likely to want to remain a cohesive team and avoid disappointing their teammates, especially when faced with adversity. Creating a more pleasant working environment through relationships with co-workers can increase employee satisfaction. Although only two out of five (41%) employees felt that their relationship with co-workers was very important to their job satisfaction, employees were generally satisfied with these relationships (73%).
Meaningfulness of the JobMeaningfulness of one’s job can be thought of as the feel-ing that the job contributes to society as a whole. As the core of a foundation, the mission and vision are essential for an organization because they provide guidance and direction and also appeal for buy-in from stakeholders (e.g., clients, investors). The effectiveness of how this pur-poseiscommunicatedtoemployeesisequallyimportant.Management may spend a considerable amount of time on communication through speeches and newsletters, but if the majority of employees still don’t seem to identify with the message, it might be a sign that the vision is either undercommunicated or that employees aren’t being shown the link between their work and the organization’s overall mission. Making a difference toward a cause that is bigger than any one individual or the organization can offer a sense of fulfillment to employees. Two-fifths (41%) of employees stated that meaningfulness of the job was very important to their job satisfaction, and 64% of employees were satisfied with this aspect.
Contribution of Work to the Organization’s Business GoalsSimilar to meaningfulness of the job, employees would prefer to think that their time and efforts are contributing
22 | Employee Job Satisfaction and Engagement
Employee Job Satisfac tion
to the greater picture. Recognizing how assignments sup-port the organization’s business goals can help increase employeejobsatisfaction.Managementmayfrequentlyassume that employees already know the significance and relevance of their assignments. However, clearly explain-ing and reiterating how employees’ work is valued can mitigate these problems. Although only 35% of employees perceived contributing to the organization’s business goals as a very important job satisfaction contributor, 66% of employees were satisfied with this aspect.
Variety of WorkRarelydoyoucomeacrossemployeeswhorequestthesame tedious assignments over and over again. Most employees, at least occasionally, like the ability to work on different types of projects. Implementing business practices such as job rotation, job expansion and enrich-ment can help employees expand their skills and knowl-edge and keep their engagement levels high. One-third (33%) of employees reported that the variety of work was very important to their job satisfaction. Although this aspect was not a high contributor to job satisfaction, 65% of employees were satisfied with the variety of their work.
Organization’s Commitment to Corporate Social ResponsibilityCorporate social responsibility (CSR) can be described as a business position that recognizes ethical, envi-ronmental and social awareness and the obligation to make a positive influence beyond the organization itself. Engaging in CSR initiatives signals that organizations are concerned about their local and global community. These programs may include charitable donations and participation in fair trade practices. Although the inten-tion of CSR is not to gain immediate financial benefits, incorporating such initiatives into an organization’s business model could affect profitability and improve its brand and reputation. Thirty-one percent of employees indicated that their organization’s commitment to corporate social responsibility is a very important contributor to their job satisfaction, placing it in the bottomquadrantofjobsatisfactioncontributors.Slightlymore than one-half (54%) of employees reported being satisfied with their organization’s commitment to CSR.
Organization’s Commitment to a Diverse and Inclusive WorkforceAlthough an organization’s commitment to a diverse and inclusive workforce was rather low on the list of very important job satisfaction contributors (28%), there is reason to believe that it will gain more weight in the near future. By 2020, the number of Hispanics in the labor force is projected to grow by 7.7 million, or 34%, and their share of the labor force is expected to increase from 14.8% in 2010 to 18.6% in 2020.20 The labor force shares for Asians and blacks are projected to be 5.7% and 12%, respectively, up slightly from 4.7% and 11.6% in 2010. Additional demo-graphic analyses indicate that females and Millennials deemed diversity and inclusion to be more important than males and Baby Boomers did, respectively. This aspect may become a higher priority over the next decade, given that acceptance- and collaboration-driven Millennials
will comprise more of the workforce. Nearly three-fifths (57%) of employees were satisfied with their organiza-tion’s level of commitment to diversity and inclusion.
Diversity and inclusion are not limited to the evolv-ing workforce, but also include laws that affect how organizations function. For example, in June 2013, Section 3 of the Defense of Marriage Act was struck down,declaringtheunequaltreatmentofsame-sexmarriages to be unconstitutional. The repeal of the discriminatory law granted lesbian, gay, bisexual and transgender (LGBT) couples more than 1,100 federal benefits and protections, which they had previously been denied, in states that recognize same-sex marriages.
Organizations may want to consider forming a diversity committee to support inclusive thinking, beginning with incorporating it into the organization’s corporate culture. Other good practices involve modifying job descriptions to reflect inclusive thinking and establish-ing goals for diverse populations in promotion and succession planning. Furthermore, encouraging a diversity of backgrounds in an organization may prevent groupthink and expand the creativity of ideas.
Organization’s Commitment to a “Green” WorkplaceBecause only 22% of employees indicated their organiza-tion’s commitment to a “green” workplace to be very important to their job satisfaction, this aspect was the least important job satisfaction contributor. Similar to organizational commitment to a diverse and inclusive workforce, this aspect was more appealing to female than to male employees and to Millennials than to Baby Boomers. One-half (50%) of employees were satisfied with their organization’s commitment to sustainable practices.
Current SHRM research indicates that 72% of organiza-tions practice sustainable workplace initiatives and 50% of those organizations have a formal sustainable workplace policy that integrates these goals into their strategic planning process.21 The survey findings also reported additional benefits for engaging in sustainable practices: attracting top talent (51%), improving employee retention (40%) and developing leadership (36%).

Employee Job Satisfac tion
24 | Employee Job Satisfaction and Engagement
Employee Job Satisfac tion
JobSatisfactionofHRProfessionals: AreHRProfessionalsHappierinTheirJobsthanOtherEmployees?
In 2013, 86% of HR professionals said that they were satisfied (45% were “very satisfied” and 41% were “somewhat satisfied”) with their current jobs. Although this percentage is comparable to the overall percentage of satisfied U.S. employees (81%), the number of “very satisfied” respondents was almost 10 percentage points higher for HR professionals. Furthermore, when HR professionals were asked about the overall satisfaction levels of employees at their organizations, they believed that 76% of employees were “very satisfied” or “somewhat satisfied” with their current positions, reflecting that HR professionals rate themselves as being happier in their jobs than other employees in their organizations. This pattern, in general, remains fairly consistent—HR professionals rated the importance of the contributors to job satisfaction and the level of satisfaction with those contributors higher compared with the overall U.S. employee sample.
Important Job Satisfaction Contributors for HR ProfessionalsIn 2013, opportunities to use skills and abilities and the relationship with the immediate supervisor tied as the top contributors of job satisfaction deemed “very important” by HR professionals. Approximately four-fifths (81%) of respondents indicated that these aspects were “very important” to their job satisfaction. 2011 data showed that
opportunities to use skills and abilities were the leading contributor to job satisfaction, at 83%, and the relationship with the immediate supervisor closely followed at 79%.
Even though at least two-thirds of all HR professionals viewed opportunities to use skills and abilities as a “very important” contributor to job satisfaction, HR employees in middle management were more likely to see this item as “very important” compared with HR employees in nonexempt nonmanagement positions. No significant differences were found when findings were analyzed by gender and age. Furthermore, no significant differences by job level, gender or age were found for the relationship with the immediate supervisor.
HR professionals exhibited different preferences with respect to the aspects influencing job satisfaction compared with the overall employee population. Although opportunities to use skills and abilities and the relationship with the immediate supervisor were in the top five job satisfaction contributors of overall employee population, the results suggest that HR professionals place more importance on relationship-based and work environment factors than on compensation. In 2013, compensation was the top job satisfaction contributor for overall U.S. employees, whereas it was rated as the 10th most important job satisfaction contributor for HR professionals.
Employee Job Satisfaction and Engagement | 25
Employee Job Satisfac tion
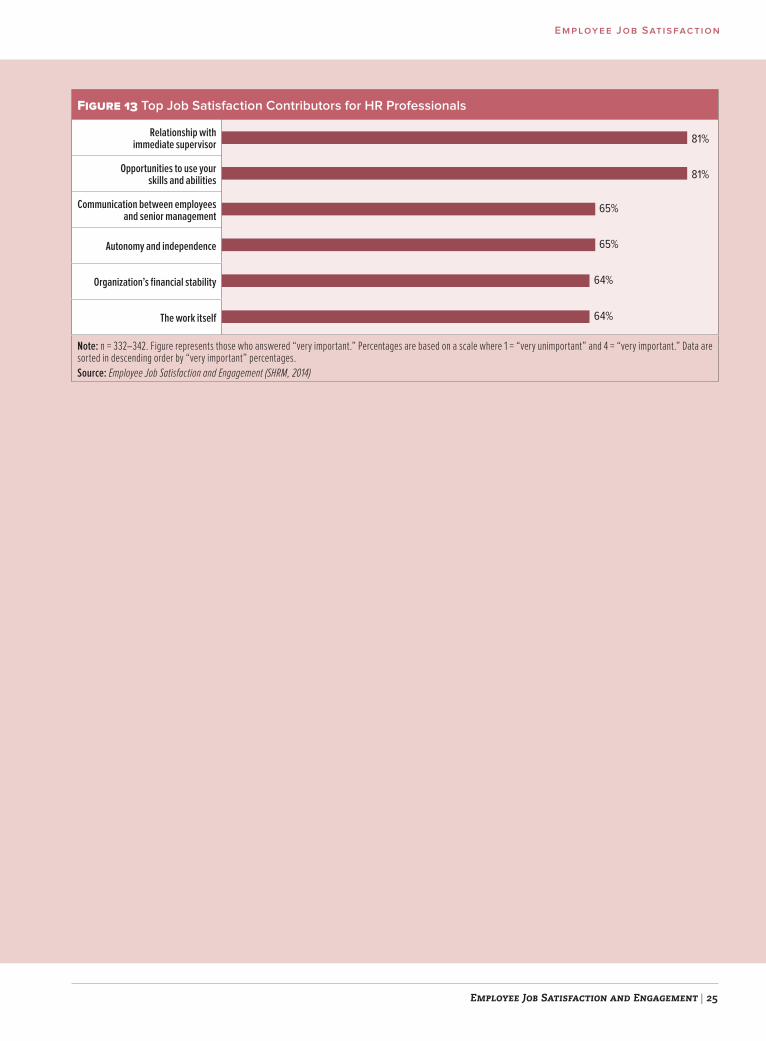
Figure 13 Top Job Satisfaction Contributors for HR Professionals
Relationship with immediate supervisor
Opportunities to use your skills and abilities
Communication between employees and senior management
Autonomy and independence
Organization’s financial stability
The work itself
Note: n = 332–342. Figure represents those who answered “very important.” Percentages are based on a scale where 1 = “very unimportant” and 4 = “very important.” Data are sorted in descending order by “very important” percentages.Source: Employee Job Satisfaction and Engagement (SHRM, 2014)
81%
81%
65%
65%
64%
64%
Employee Engagement
Employee Engagement
Engagement opinions + Engagement behaviors + Conditions for Engagement = Employee Engagement
Employee Job Satisfaction and Engagement | 27
Employee Engagement
Engagement Conditions, Opinions and Behaviors
In this study, employee engagement was examined through 34 aspects related to employee engagement conditions, opinions and behaviors.* Based on a five-point scale, with 1 being the least engaged and 5 being the most engaged, an average of all employee engagement items yielded an index of 3.6, indicating that employees are moderately engaged. Engagement levels have remained stable since 2011. Likewise, the majority of this year’s engagement aspect percentages were comparable to the previous year’s percentages or were slightly lower.
Conditions for EngagementA number of job satisfaction contributors related to the conditions of the workplace are linked to em-ployee engagement—these aspects are referred to as the conditions for engagement in this research. Optimal levels of employee engagement can be reached by promoting particular workplace settings. Provid-ing these ideal circumstances allows employees to commit their undivided attention to their work.
The 2013 data suggest that employees were, in general, moderately to very satisfied with engagement condi-tions at their workplace. Similar to 2012, relationships with co-workers were the element in which employees reported the most satisfaction (73%). In addition, seven out of 10 employees said they were satisfied with opportunities to use their skills and abilities as well as with their relationship with their immediate supervisor. Employees were least satisfied with network-ing and career advancement opportunities (48%).
While differences were not apparent when the data were analyzed by gender and age, differences between job levels were observed. Management-level employees were more likely to be satisfied with engagement conditions of their organization than were nonmanagement employees. Namely, discrepancies of satisfaction levels between exec-utives and nonexempt nonmanagement employees were uncovered. Organizations that reinforce the “us versus
them” mentality may create strong hierarchies, eliciting cynicism, distrust and negative relationships. Organiza-tions looking to improve these conditions may want to consider a flatter organizational structure, ensuring more balance across positions within the organization.
Engagement Opinions: The “Feel” of Employee EngagementComposed of the eight statements in Table 5, engage-ment opinions are expressed through feelings of deep concentration, eagerness and passion. These statements capture personal reflection of the employees’ relation-ship with their own work rather than the collective employees. Personal engagement invigorates employees to feel enthusiastic and energized by their work.
Similar to 2012, the engagement statement that prompted the most overall agreement (79%) was the determination to accomplish work goals and confidence that these goals could be met. Sixty-nine percent of employees indicatedthattheyfrequentlyfeelliketheyareputtingall their effort into their work, and 66% said that they are almost always completely focused on their work projects while at work. The engagement statement that the least amount of employees (53%) agreed with was the enjoyment of volunteering for activities beyond their jobrequirements.Employeesmayalreadybefeelingstretched thin, thus participating in these activities may accentuate preexisting stress related to their workload.
Additional analyses of engagement opinions revealed significant differences between particular demographic groups, especially by job level. In six of the eight en-gagement opinions, executive-level employees had a
* Using a five-point scale, respondents indicated their degree of satisfaction and agreement with these items. For engagement conditions, the following scale was employed: “1” represents “very dissatisfied” and “5” represents “very satisfied.” For engagement opinions and behaviors, “1” represents “strongly disagree” and “5” represents “strongly agree.”
SHRM’s employee engagement index found that employees are moderately engaged.
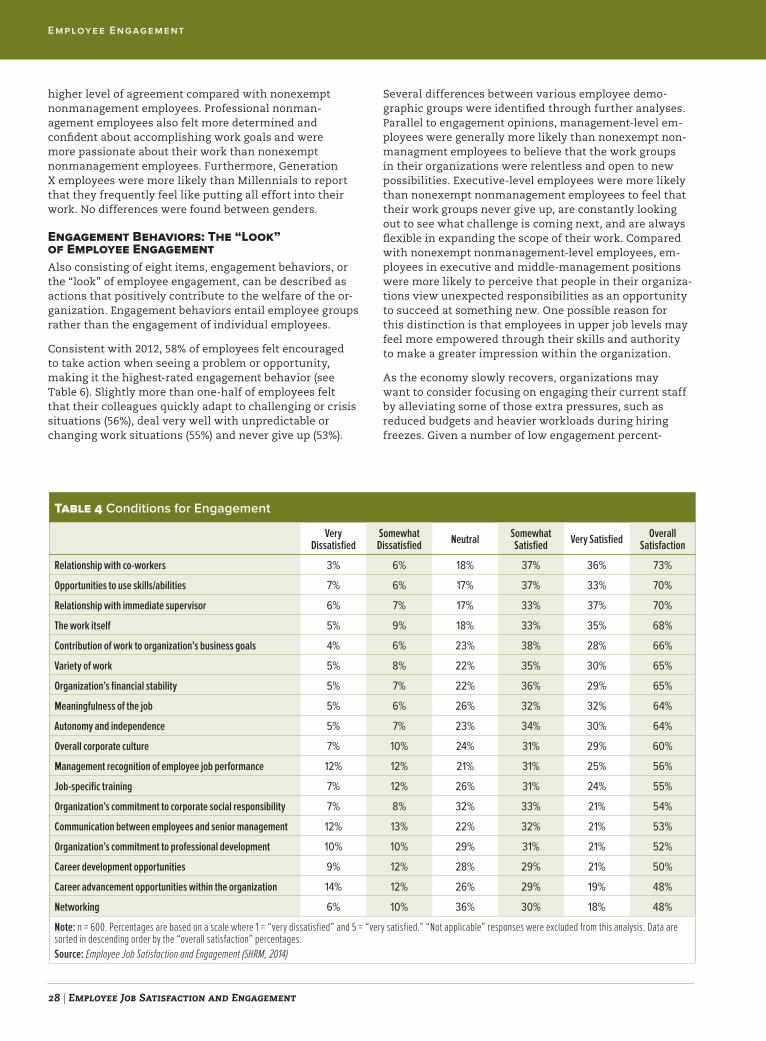
28 | Employee Job Satisfaction and Engagement
Employee Engagement
higher level of agreement compared with nonexempt nonmanagement employees. Professional nonman-agement employees also felt more determined and confident about accomplishing work goals and were more passionate about their work than nonexempt nonmanagement employees. Furthermore, Generation X employees were more likely than Millennials to report thattheyfrequentlyfeellikeputtingalleffortintotheirwork. No differences were found between genders.
Engagement Behaviors: The “Look” of Employee EngagementAlso consisting of eight items, engagement behaviors, or the “look” of employee engagement, can be described as actions that positively contribute to the welfare of the or-ganization. Engagement behaviors entail employee groups rather than the engagement of individual employees.
Consistent with 2012, 58% of employees felt encouraged to take action when seeing a problem or opportunity, making it the highest-rated engagement behavior (see Table 6). Slightly more than one-half of employees felt thattheircolleaguesquicklyadapttochallengingorcrisissituations (56%), deal very well with unpredictable or changing work situations (55%) and never give up (53%).
Several differences between various employee demo-graphic groups were identified through further analyses. Parallel to engagement opinions, management-level em-ployees were generally more likely than nonexempt non-managment employees to believe that the work groups in their organizations were relentless and open to new possibilities. Executive-level employees were more likely than nonexempt nonmanagement employees to feel that their work groups never give up, are constantly looking out to see what challenge is coming next, and are always flexible in expanding the scope of their work. Compared with nonexempt nonmanagement-level employees, em-ployees in executive and middle-management positions were more likely to perceive that people in their organiza-tions view unexpected responsibilities as an opportunity to succeed at something new. One possible reason for this distinction is that employees in upper job levels may feel more empowered through their skills and authority to make a greater impression within the organization.
As the economy slowly recovers, organizations may want to consider focusing on engaging their current staff by alleviating some of those extra pressures, such as reduced budgets and heavier workloads during hiring freezes. Given a number of low engagement percent-
Table 4 Conditions for Engagement
Very Dissatisfied
Somewhat Dissatisfied Neutral Somewhat
Satisfied Very Satisfied Overall Satisfaction
Relationship with co-workers 3% 6% 18% 37% 36% 73%
Opportunities to use skills/abilities 7% 6% 17% 37% 33% 70%
Relationship with immediate supervisor 6% 7% 17% 33% 37% 70%
The work itself 5% 9% 18% 33% 35% 68%
Contribution of work to organization’s business goals 4% 6% 23% 38% 28% 66%
Variety of work 5% 8% 22% 35% 30% 65%
Organization’s financial stability 5% 7% 22% 36% 29% 65%
Meaningfulness of the job 5% 6% 26% 32% 32% 64%
Autonomy and independence 5% 7% 23% 34% 30% 64%
Overall corporate culture 7% 10% 24% 31% 29% 60%
Management recognition of employee job performance 12% 12% 21% 31% 25% 56%
Job-specific training 7% 12% 26% 31% 24% 55%
Organization’s commitment to corporate social responsibility 7% 8% 32% 33% 21% 54%
Communication between employees and senior management 12% 13% 22% 32% 21% 53%
Organization’s commitment to professional development 10% 10% 29% 31% 21% 52%
Career development opportunities 9% 12% 28% 29% 21% 50%
Career advancement opportunities within the organization 14% 12% 26% 29% 19% 48%
Networking 6% 10% 36% 30% 18% 48%
Note: n = 600. Percentages are based on a scale where 1 = “very dissatisfied” and 5 = “very satisfied.” “Not applicable” responses were excluded from this analysis. Data are sorted in descending order by the “overall satisfaction” percentages. Source: Employee Job Satisfaction and Engagement (SHRM, 2014)
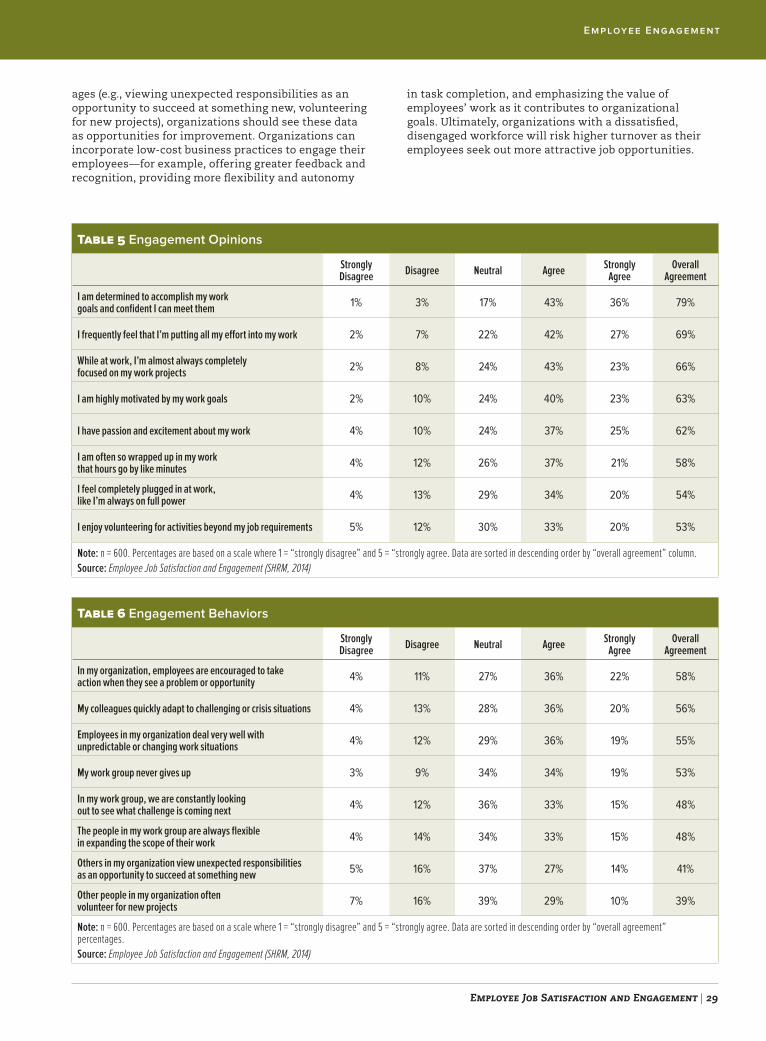
Employee Job Satisfaction and Engagement | 29
Employee Engagement
Table 5 Engagement Opinions
Strongly Disagree Disagree Neutral Agree Strongly
AgreeOverall
Agreement
I am determined to accomplish my work goals and confident I can meet them 1% 3% 17% 43% 36% 79%
I frequently feel that I’m putting all my effort into my work 2% 7% 22% 42% 27% 69%
While at work, I’m almost always completely focused on my work projects 2% 8% 24% 43% 23% 66%
I am highly motivated by my work goals 2% 10% 24% 40% 23% 63%
I have passion and excitement about my work 4% 10% 24% 37% 25% 62%
I am often so wrapped up in my work that hours go by like minutes 4% 12% 26% 37% 21% 58%
I feel completely plugged in at work, like I’m always on full power 4% 13% 29% 34% 20% 54%
I enjoy volunteering for activities beyond my job requirements 5% 12% 30% 33% 20% 53%
Note: n = 600. Percentages are based on a scale where 1 = “strongly disagree” and 5 = “strongly agree. Data are sorted in descending order by “overall agreement” column.Source: Employee Job Satisfaction and Engagement (SHRM, 2014)
Table 6 Engagement Behaviors
Strongly Disagree Disagree Neutral Agree Strongly
AgreeOverall
Agreement
In my organization, employees are encouraged to take action when they see a problem or opportunity 4% 11% 27% 36% 22% 58%
My colleagues quickly adapt to challenging or crisis situations 4% 13% 28% 36% 20% 56%
Employees in my organization deal very well with unpredictable or changing work situations 4% 12% 29% 36% 19% 55%
My work group never gives up 3% 9% 34% 34% 19% 53%
In my work group, we are constantly looking out to see what challenge is coming next 4% 12% 36% 33% 15% 48%
The people in my work group are always flexible in expanding the scope of their work 4% 14% 34% 33% 15% 48%
Others in my organization view unexpected responsibilities as an opportunity to succeed at something new 5% 16% 37% 27% 14% 41%
Other people in my organization often volunteer for new projects 7% 16% 39% 29% 10% 39%
Note: n = 600. Percentages are based on a scale where 1 = “strongly disagree” and 5 = “strongly agree. Data are sorted in descending order by “overall agreement” percentages.Source: Employee Job Satisfaction and Engagement (SHRM, 2014)
ages (e.g., viewing unexpected responsibilities as an opportunity to succeed at something new, volunteering for new projects), organizations should see these data as opportunities for improvement. Organizations can incorporate low-cost business practices to engage their employees—for example, offering greater feedback and recognition, providing more flexibility and autonomy
in task completion, and emphasizing the value of employees’ work as it contributes to organizational goals. Ultimately, organizations with a dissatisfied, disengaged workforce will risk higher turnover as their employees seek out more attractive job opportunities.
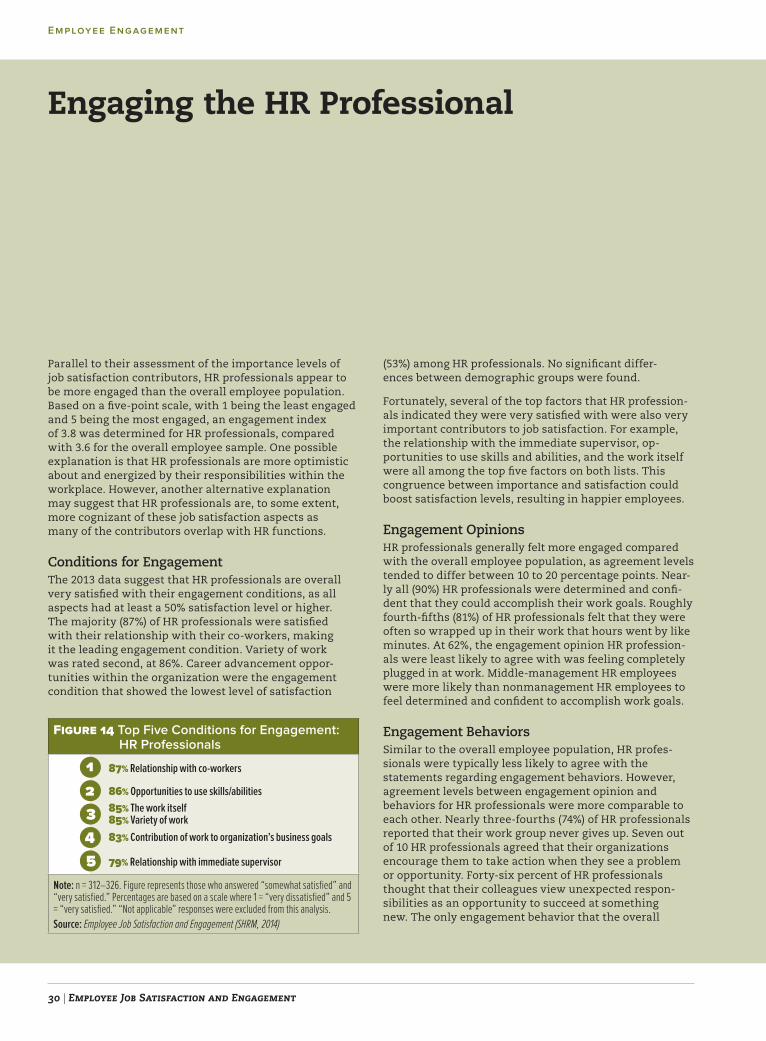
30 | Employee Job Satisfaction and Engagement
Employee Engagement
EngagingtheHRProfessional
Parallel to their assessment of the importance levels of job satisfaction contributors, HR professionals appear to be more engaged than the overall employee population. Based on a five-point scale, with 1 being the least engaged and 5 being the most engaged, an engagement index of 3.8 was determined for HR professionals, compared with 3.6 for the overall employee sample. One possible explanation is that HR professionals are more optimistic about and energized by their responsibilities within the workplace. However, another alternative explanation may suggest that HR professionals are, to some extent, more cognizant of these job satisfaction aspects as many of the contributors overlap with HR functions.
Conditions for EngagementThe 2013 data suggest that HR professionals are overall very satisfied with their engagement conditions, as all aspects had at least a 50% satisfaction level or higher. The majority (87%) of HR professionals were satisfied with their relationship with their co-workers, making it the leading engagement condition. Variety of work was rated second, at 86%. Career advancement oppor-tunities within the organization were the engagement condition that showed the lowest level of satisfaction
(53%) among HR professionals. No significant differ-ences between demographic groups were found.
Fortunately, several of the top factors that HR profession-als indicated they were very satisfied with were also very important contributors to job satisfaction. For example, the relationship with the immediate supervisor, op-portunities to use skills and abilities, and the work itself were all among the top five factors on both lists. This congruence between importance and satisfaction could boost satisfaction levels, resulting in happier employees.
Engagement OpinionsHR professionals generally felt more engaged compared with the overall employee population, as agreement levels tended to differ between 10 to 20 percentage points. Near-ly all (90%) HR professionals were determined and confi-dent that they could accomplish their work goals. Roughly fourth-fifths (81%) of HR professionals felt that they were often so wrapped up in their work that hours went by like minutes. At 62%, the engagement opinion HR profession-als were least likely to agree with was feeling completely plugged in at work. Middle-management HR employees were more likely than nonmanagement HR employees to feel determined and confident to accomplish work goals.
Engagement BehaviorsSimilar to the overall employee population, HR profes-sionals were typically less likely to agree with the statements regarding engagement behaviors. However, agreement levels between engagement opinion and behaviors for HR professionals were more comparable to each other. Nearly three-fourths (74%) of HR professionals reported that their work group never gives up. Seven out of 10 HR professionals agreed that their organizations encourage them to take action when they see a problem or opportunity. Forty-six percent of HR professionals thought that their colleagues view unexpected respon-sibilities as an opportunity to succeed at something new. The only engagement behavior that the overall
Figure 14 Top Five Conditions for Engagement: HR Professionals
Note: n = 312–326. Figure represents those who answered “somewhat satisfied” and “very satisfied.” Percentages are based on a scale where 1 = “very dissatisfied” and 5 = “very satisfied.” “Not applicable” responses were excluded from this analysis. Source: Employee Job Satisfaction and Engagement (SHRM, 2014)
1
3
4
5
2
87% Relationship with co-workers
86% Opportunities to use skills/abilities85% The work itself85% Variety of work83% Contribution of work to organization’s business goals
79% Relationship with immediate supervisor
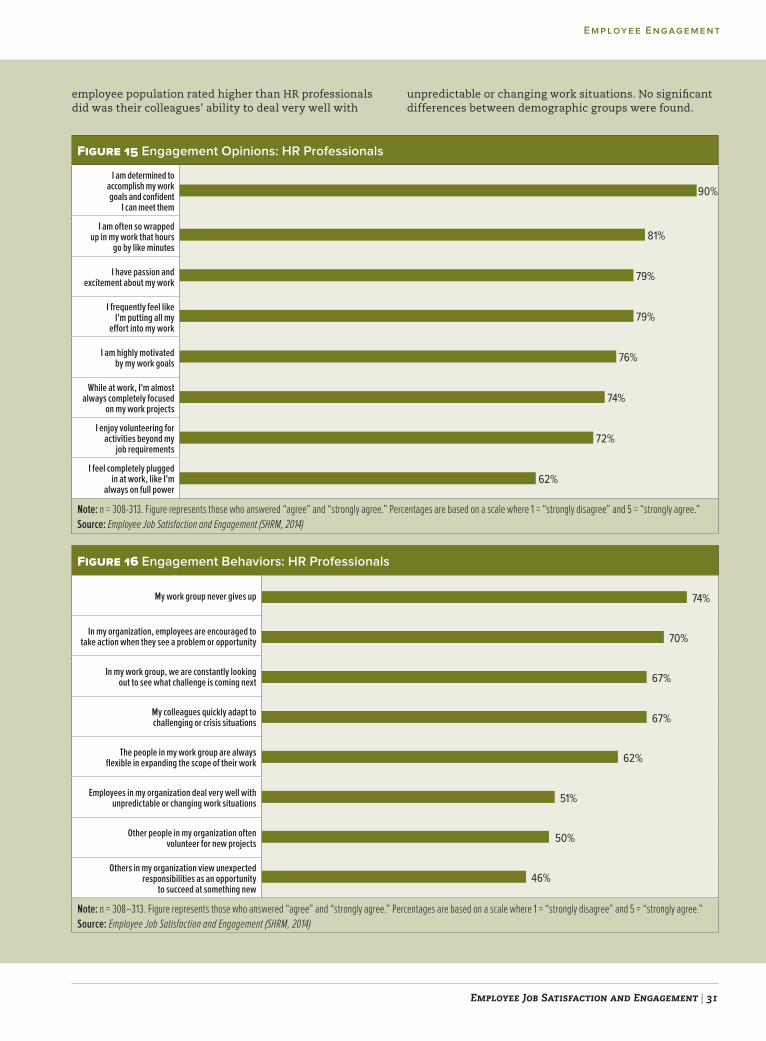
Employee Job Satisfaction and Engagement | 31
Employee Engagement
Figure 16 Engagement Behaviors: HR Professionals
My work group never gives up
In my organization, employees are encouraged to take action when they see a problem or opportunity
In my work group, we are constantly looking out to see what challenge is coming next
My colleagues quickly adapt to challenging or crisis situations
The people in my work group are always flexible in expanding the scope of their work
Employees in my organization deal very well with unpredictable or changing work situations
Other people in my organization often volunteer for new projects
Others in my organization view unexpected responsibilities as an opportunity
to succeed at something new
Note: n = 308–313. Figure represents those who answered “agree” and “strongly agree.” Percentages are based on a scale where 1 = “strongly disagree” and 5 = “strongly agree.”Source: Employee Job Satisfaction and Engagement (SHRM, 2014)
74%
70%
67%
67%
62%
51%
50%
46%
Figure 15 Engagement Opinions: HR Professionals
I am determined to accomplish my work goals and confident
I can meet them
I am often so wrapped up in my work that hours
go by like minutes
I have passion and excitement about my work
I frequently feel like I'm putting all my
effort into my work
I am highly motivated by my work goals
While at work, I'm almost always completely focused
on my work projects
I enjoy volunteering for activities beyond my
job requirements
I feel completely plugged in at work, like I'm
always on full power
Note: n = 308-313. Figure represents those who answered “agree” and “strongly agree.” Percentages are based on a scale where 1 = “strongly disagree” and 5 = “strongly agree.”Source: Employee Job Satisfaction and Engagement (SHRM, 2014)
90%
81%
79%
79%
74%
72%
62%
76%
employee population rated higher than HR professionals did was their colleagues’ ability to deal very well with
unpredictable or changing work situations. No significant differences between demographic groups were found.

Conclus ions
Conclusions
Employee Job Satisfaction and Engagement | 33
Conclus ions
Employee Engagement Paramount for Retention of Top Talent
It is likely not a coincidence that job satisfaction reached its height just as the U.S. economy was emerg-ing from the Great Recession. It was a period of time when working conditions were not ideal for some, as headcounts were reduced at many organizations and production was picked up by existing workers, but most employees were perhaps simply grateful to have a job during a time of heightened unemployment. Since then, as the economy has expanded—and job opportunities have improved commensurately—workers are still largely satisfied with their jobs, but the level of contentment has declined and could continue to drop without added emphasis on employee engagement.
Theresultsofthissurveyarequiteclearonwhatisdriving employees’ job satisfaction at the moment. Compensation/pay is typically a top priority, as it was in 2013, but many workers are also motivated and inspired by the relationships they have with colleagues and supervisors, and the ability to use their skills in their jobs. Yet even during a climate of economic expansionandlowfrequencyofthelarge-scalelayoffsthat characterized the Great Recession, workers remain very worried about job security: 56% had some level of concern about the safety of their job, according to this survey.Consequently,manyworkersvaluejobsecurityhighly as it relates to job satisfaction (59% overall).
Employees’ concerns and struggles with job satisfaction are, in fact, being recognized, according to other SHRM research. Nearly all of HR professionals (99%) said their employees had some level of frustration with getting things accomplished at their organization, according to a May 2013 SHRM survey in collaboration with Globoforce.22 The answer to allaying those concerns may lie with renewed efforts on employee engagement.
Considering that so many employees value communica-tion and strong relationships with their peers and manag-ers, organizations should examine their policies that encourage regular feedback and performance recognition. Theimportanceofthesefactorsisnotuniquetooneparticular segment of the workforce—the relationship with the immediate supervisor, for instance, was named as an important aspect of engagement by employees of all age groups and experience levels. At the same time, monetary rewards are not necessarily the only solution to recognizing workers’ efforts. Employees would welcome a variety of noncash rewards as part of a formal recognition program at their organization, according to this survey.
Ultimately, as economic conditions improve, many workers can be expected to explore other employment opportunities. As a result, employee engagement, talent management and retention of top performers will all be paramount for HR professionals for the foreseeable future.
Compensation/pay is typically a top priority, but many workers are also motivated and inspired by the relationships they have with colleagues and supervisors, and the ability to use their skills in their jobs.
34 | Employee Job Satisfaction and Engagement
Methodology
Methodology
Survey MethodologyThe sample of employees used in this research was randomly selected by an outside survey research organization’s web-enabled employee panel, which is based on the American Community Study. In total, 600 individuals completed the online 2013 Job Satisfaction and Engagement Survey. All respondents were employed either full time or part time.
The sample of 600 employees in the 2013 sample and the 2012 sample appeared to be comparable.
The sample of HR professionals used in this research was randomly selected from SHRM’s membership database, which included approximately 260,000 individual mem-bers at the time the survey was conducted. Only members who had not participated in a SHRM survey in the last six months were included in the sampling frame. In total, 347 HR professionals completed the online 2013 HR Professionals’ Job Satisfaction and Engagement Survey. All respondents were employed, either full time or part time.
A comparison between the sample of the 600 employees and the 347 HR professionals demonstrated multiple differences. HR professionals in the 2013 sample were more likely to be employed by organizations with 100-499 employees, more likely to have shorter tenure, more likely to be Gen Xers and less likely to be Millennials, more likely to be female, more likely to be in a middle-manage-ment position and less likely to be in a nonmanagement position, and more likely to have a higher education level.
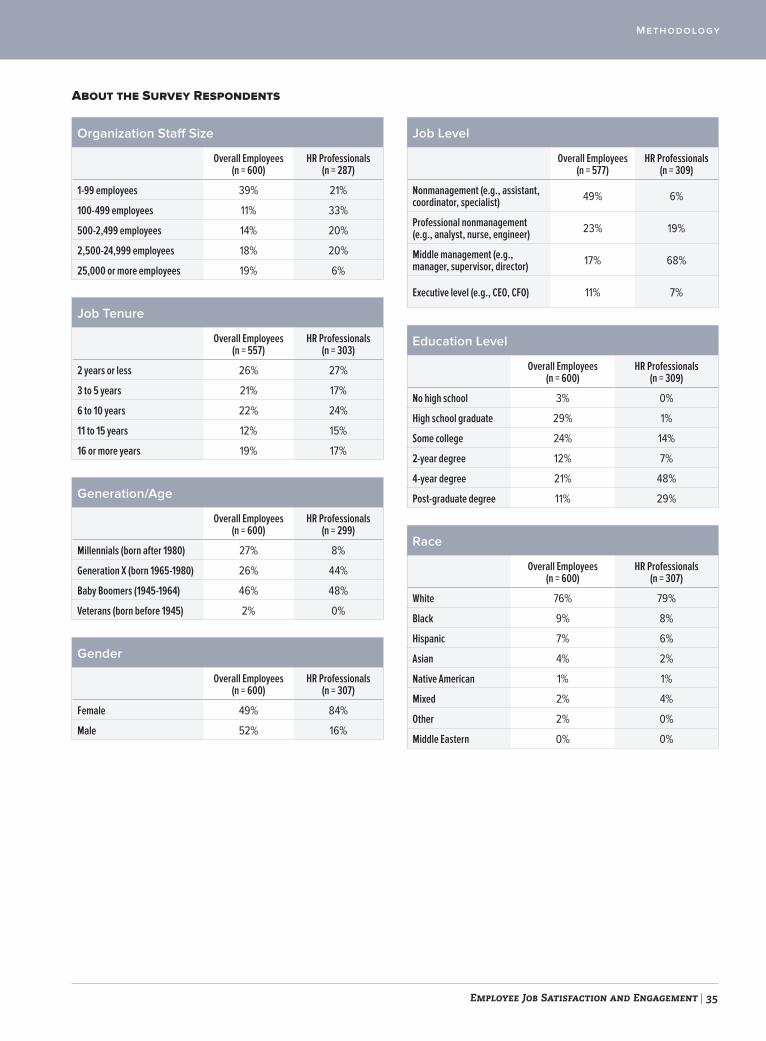
Employee Job Satisfaction and Engagement | 35
Methodology
About the Survey Respondents
Organization Staff Size
Overall Employees(n = 600)
HR Professionals(n = 287)
1-99 employees 39% 21%
100-499 employees 11% 33%
500-2,499 employees 14% 20%
2,500-24,999 employees 18% 20%
25,000 or more employees 19% 6%
Job Tenure
Overall Employees (n = 557)
HR Professionals (n = 303)
2 years or less 26% 27%
3 to 5 years 21% 17%
6 to 10 years 22% 24%
11 to 15 years 12% 15%
16 or more years 19% 17%
Generation/Age
Overall Employees(n = 600)
HR Professionals(n = 299)
Millennials (born after 1980) 27% 8%
Generation X (born 1965-1980) 26% 44%
Baby Boomers (1945-1964) 46% 48%
Veterans (born before 1945) 2% 0%
Gender
Overall Employees(n = 600)
HR Professionals(n = 307)
Female 49% 84%
Male 52% 16%
Job Level
Overall Employees(n = 577)
HR Professionals(n = 309)
Nonmanagement (e.g., assistant, coordinator, specialist) 49% 6%
Professional nonmanagement (e.g., analyst, nurse, engineer) 23% 19%
Middle management (e.g., manager, supervisor, director) 17% 68%
Executive level (e.g., CEO, CFO) 11% 7%
Education Level
Overall Employees(n = 600)
HR Professionals(n = 309)
No high school 3% 0%
High school graduate 29% 1%
Some college 24% 14%
2-year degree 12% 7%
4-year degree 21% 48%
Post-graduate degree 11% 29%
Race
Overall Employees(n = 600)
HR Professionals(n = 307)
White 76% 79%
Black 9% 8%
Hispanic 7% 6%
Asian 4% 2%
Native American 1% 1%
Mixed 2% 4%
Other 2% 0%
Middle Eastern 0% 0%
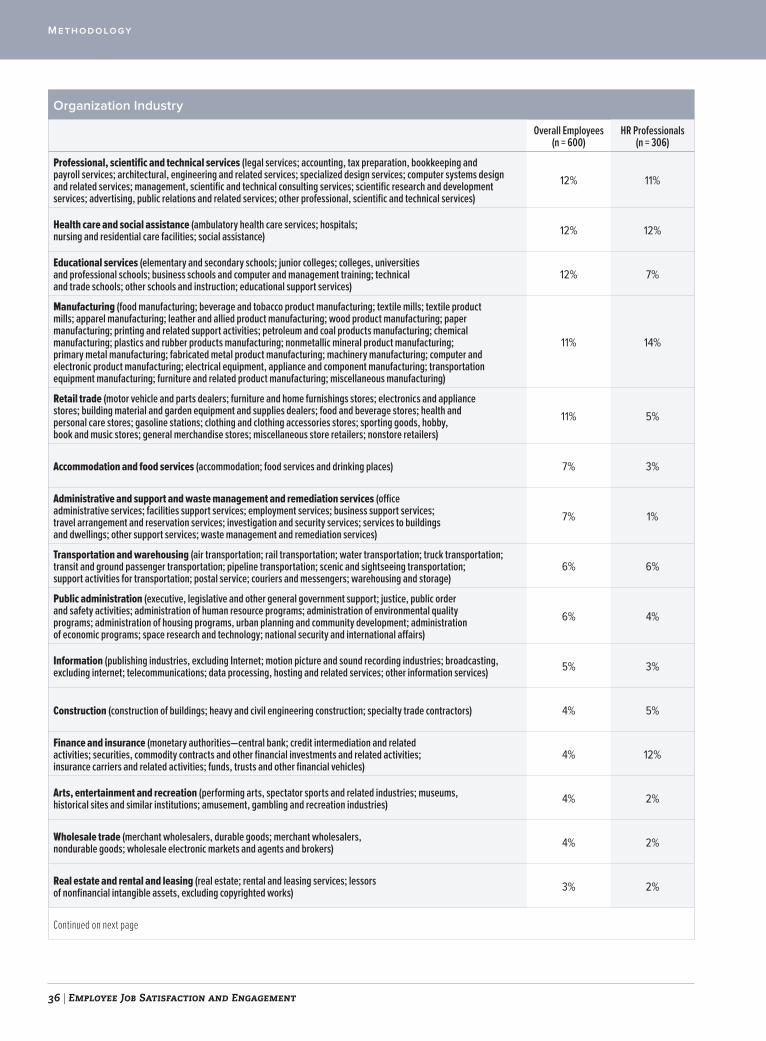
36 | Employee Job Satisfaction and Engagement
Methodology
Organization Industry
Overall Employees(n = 600)
HR Professionals(n = 306)
Professional, scientific and technical services (legal services; accounting, tax preparation, bookkeeping and payroll services; architectural, engineering and related services; specialized design services; computer systems design and related services; management, scientific and technical consulting services; scientific research and development services; advertising, public relations and related services; other professional, scientific and technical services)
12% 11%
Health care and social assistance (ambulatory health care services; hospitals; nursing and residential care facilities; social assistance) 12% 12%
Educational services (elementary and secondary schools; junior colleges; colleges, universities and professional schools; business schools and computer and management training; technical and trade schools; other schools and instruction; educational support services)
12% 7%
Manufacturing (food manufacturing; beverage and tobacco product manufacturing; textile mills; textile product mills; apparel manufacturing; leather and allied product manufacturing; wood product manufacturing; paper manufacturing; printing and related support activities; petroleum and coal products manufacturing; chemical manufacturing; plastics and rubber products manufacturing; nonmetallic mineral product manufacturing; primary metal manufacturing; fabricated metal product manufacturing; machinery manufacturing; computer and electronic product manufacturing; electrical equipment, appliance and component manufacturing; transportation equipment manufacturing; furniture and related product manufacturing; miscellaneous manufacturing)
11% 14%
Retail trade (motor vehicle and parts dealers; furniture and home furnishings stores; electronics and appliance stores; building material and garden equipment and supplies dealers; food and beverage stores; health and personal care stores; gasoline stations; clothing and clothing accessories stores; sporting goods, hobby, book and music stores; general merchandise stores; miscellaneous store retailers; nonstore retailers)
11% 5%
Accommodation and food services (accommodation; food services and drinking places) 7% 3%
Administrative and support and waste management and remediation services (office administrative services; facilities support services; employment services; business support services; travel arrangement and reservation services; investigation and security services; services to buildings and dwellings; other support services; waste management and remediation services)
7% 1%
Transportation and warehousing (air transportation; rail transportation; water transportation; truck transportation; transit and ground passenger transportation; pipeline transportation; scenic and sightseeing transportation; support activities for transportation; postal service; couriers and messengers; warehousing and storage)
6% 6%
Public administration (executive, legislative and other general government support; justice, public order and safety activities; administration of human resource programs; administration of environmental quality programs; administration of housing programs, urban planning and community development; administration of economic programs; space research and technology; national security and international affairs)
6% 4%
Information (publishing industries, excluding Internet; motion picture and sound recording industries; broadcasting, excluding internet; telecommunications; data processing, hosting and related services; other information services) 5% 3%
Construction (construction of buildings; heavy and civil engineering construction; specialty trade contractors) 4% 5%
Finance and insurance (monetary authorities—central bank; credit intermediation and related activities; securities, commodity contracts and other financial investments and related activities; insurance carriers and related activities; funds, trusts and other financial vehicles)
4% 12%
Arts, entertainment and recreation (performing arts, spectator sports and related industries; museums, historical sites and similar institutions; amusement, gambling and recreation industries) 4% 2%
Wholesale trade (merchant wholesalers, durable goods; merchant wholesalers, nondurable goods; wholesale electronic markets and agents and brokers) 4% 2%
Real estate and rental and leasing (real estate; rental and leasing services; lessors of nonfinancial intangible assets, excluding copyrighted works) 3% 2%
Continued on next page
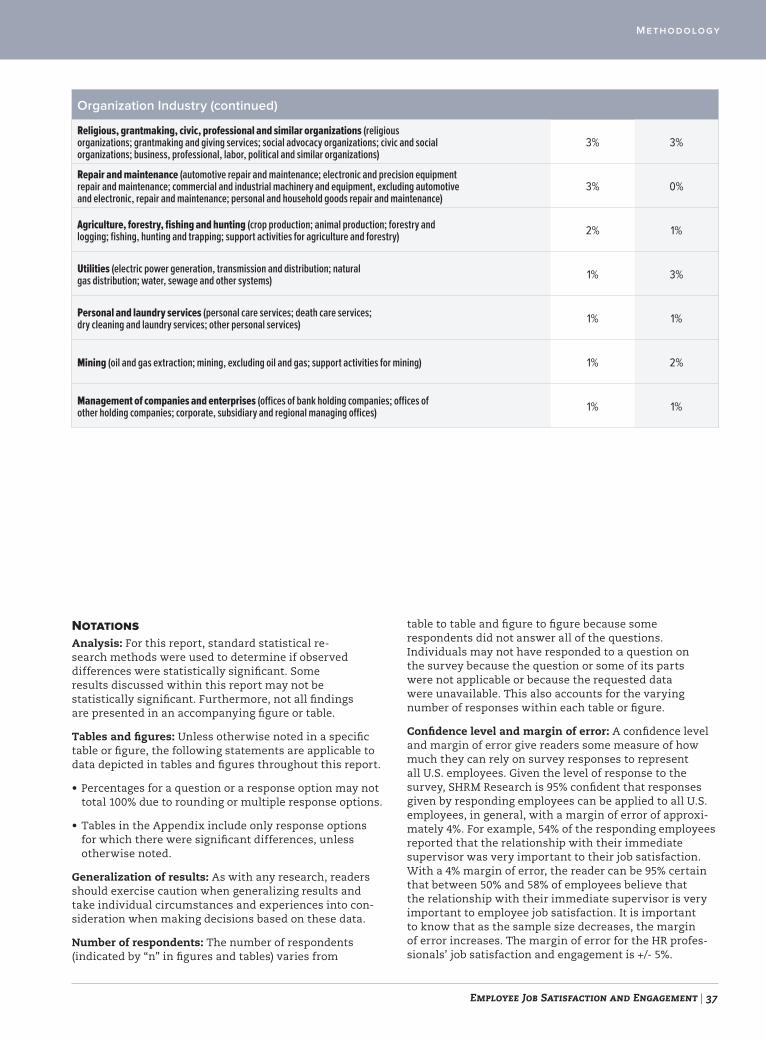
Employee Job Satisfaction and Engagement | 37
Methodology
Organization Industry (continued)
Religious, grantmaking, civic, professional and similar organizations (religious organizations; grantmaking and giving services; social advocacy organizations; civic and social organizations; business, professional, labor, political and similar organizations)
3% 3%
Repair and maintenance (automotive repair and maintenance; electronic and precision equipment repair and maintenance; commercial and industrial machinery and equipment, excluding automotive and electronic, repair and maintenance; personal and household goods repair and maintenance)
3% 0%
Agriculture, forestry, fishing and hunting (crop production; animal production; forestry and logging; fishing, hunting and trapping; support activities for agriculture and forestry) 2% 1%
Utilities (electric power generation, transmission and distribution; natural gas distribution; water, sewage and other systems) 1% 3%
Personal and laundry services (personal care services; death care services; dry cleaning and laundry services; other personal services) 1% 1%
Mining (oil and gas extraction; mining, excluding oil and gas; support activities for mining) 1% 2%
Management of companies and enterprises (offices of bank holding companies; offices of other holding companies; corporate, subsidiary and regional managing offices) 1% 1%
Notations Analysis: For this report, standard statistical re-search methods were used to determine if observed differences were statistically significant. Some results discussed within this report may not be statistically significant. Furthermore, not all findings are presented in an accompanying figure or table.
Tablesandfigures: Unless otherwise noted in a specific table or figure, the following statements are applicable to data depicted in tables and figures throughout this report.
•Percentagesforaquestionoraresponseoptionmaynottotal 100% due to rounding or multiple response options.
•TablesintheAppendixincludeonlyresponseoptionsfor which there were significant differences, unless otherwise noted.
Generalizationofresults: As with any research, readers should exercise caution when generalizing results and take individual circumstances and experiences into con-sideration when making decisions based on these data.
Numberofrespondents: The number of respondents (indicated by “n” in figures and tables) varies from
table to table and figure to figure because some respondentsdidnotanswerallofthequestions.Individualsmaynothaverespondedtoaquestiononthesurveybecausethequestionorsomeofitspartswerenotapplicableorbecausetherequesteddatawere unavailable. This also accounts for the varying number of responses within each table or figure.
Confidencelevelandmarginoferror: A confidence level and margin of error give readers some measure of how much they can rely on survey responses to represent all U.S. employees. Given the level of response to the survey, SHRM Research is 95% confident that responses given by responding employees can be applied to all U.S. employees, in general, with a margin of error of approxi-mately 4%. For example, 54% of the responding employees reported that the relationship with their immediate supervisor was very important to their job satisfaction. With a 4% margin of error, the reader can be 95% certain that between 50% and 58% of employees believe that the relationship with their immediate supervisor is very important to employee job satisfaction. It is important to know that as the sample size decreases, the margin of error increases. The margin of error for the HR profes-sionals’ job satisfaction and engagement is +/- 5%.

Appendix
Appendix
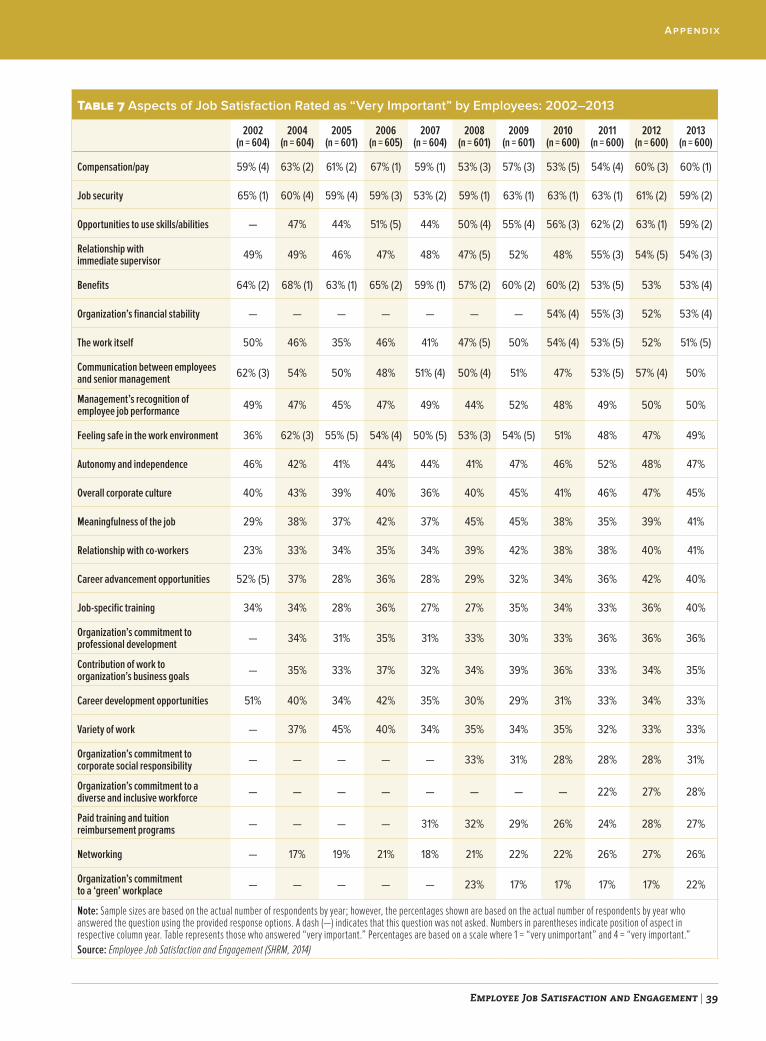
Employee Job Satisfaction and Engagement | 39
Appendix
Table 7 Aspects of Job Satisfaction Rated as “Very Important” by Employees: 2002–2013
2002(n = 604)
2004(n = 604)
2005(n = 601)
2006(n = 605)
2007(n = 604)
2008(n = 601)
2009(n = 601)
2010(n = 600)
2011(n = 600)
2012(n = 600)
2013(n = 600)
Compensation/pay 59% (4) 63% (2) 61% (2) 67% (1) 59% (1) 53% (3) 57% (3) 53% (5) 54% (4) 60% (3) 60% (1)
Job security 65% (1) 60% (4) 59% (4) 59% (3) 53% (2) 59% (1) 63% (1) 63% (1) 63% (1) 61% (2) 59% (2)
Opportunities to use skills/abilities — 47% 44% 51% (5) 44% 50% (4) 55% (4) 56% (3) 62% (2) 63% (1) 59% (2)
Relationship with immediate supervisor 49% 49% 46% 47% 48% 47% (5) 52% 48% 55% (3) 54% (5) 54% (3)
Benefits 64% (2) 68% (1) 63% (1) 65% (2) 59% (1) 57% (2) 60% (2) 60% (2) 53% (5) 53% 53% (4)
Organization’s financial stability — — — — — — — 54% (4) 55% (3) 52% 53% (4)
The work itself 50% 46% 35% 46% 41% 47% (5) 50% 54% (4) 53% (5) 52% 51% (5)
Communication between employees and senior management 62% (3) 54% 50% 48% 51% (4) 50% (4) 51% 47% 53% (5) 57% (4) 50%
Management’s recognition of employee job performance 49% 47% 45% 47% 49% 44% 52% 48% 49% 50% 50%
Feeling safe in the work environment 36% 62% (3) 55% (5) 54% (4) 50% (5) 53% (3) 54% (5) 51% 48% 47% 49%
Autonomy and independence 46% 42% 41% 44% 44% 41% 47% 46% 52% 48% 47%
Overall corporate culture 40% 43% 39% 40% 36% 40% 45% 41% 46% 47% 45%
Meaningfulness of the job 29% 38% 37% 42% 37% 45% 45% 38% 35% 39% 41%
Relationship with co-workers 23% 33% 34% 35% 34% 39% 42% 38% 38% 40% 41%
Career advancement opportunities 52% (5) 37% 28% 36% 28% 29% 32% 34% 36% 42% 40%
Job-specific training 34% 34% 28% 36% 27% 27% 35% 34% 33% 36% 40%
Organization’s commitment to professional development — 34% 31% 35% 31% 33% 30% 33% 36% 36% 36%
Contribution of work to organization’s business goals — 35% 33% 37% 32% 34% 39% 36% 33% 34% 35%
Career development opportunities 51% 40% 34% 42% 35% 30% 29% 31% 33% 34% 33%
Variety of work — 37% 45% 40% 34% 35% 34% 35% 32% 33% 33%
Organization’s commitment to corporate social responsibility — — — — — 33% 31% 28% 28% 28% 31%
Organization’s commitment to a diverse and inclusive workforce — — — — — — — — 22% 27% 28%
Paid training and tuition reimbursement programs — — — — 31% 32% 29% 26% 24% 28% 27%
Networking — 17% 19% 21% 18% 21% 22% 22% 26% 27% 26%
Organization’s commitment to a ‘green’ workplace — — — — — 23% 17% 17% 17% 17% 22%
Note: Sample sizes are based on the actual number of respondents by year; however, the percentages shown are based on the actual number of respondents by year who answered the question using the provided response options. A dash (—) indicates that this question was not asked. Numbers in parentheses indicate position of aspect in respective column year. Table represents those who answered “very important.” Percentages are based on a scale where 1 = “very unimportant” and 4 = “very important.” Source: Employee Job Satisfaction and Engagement (SHRM, 2014)
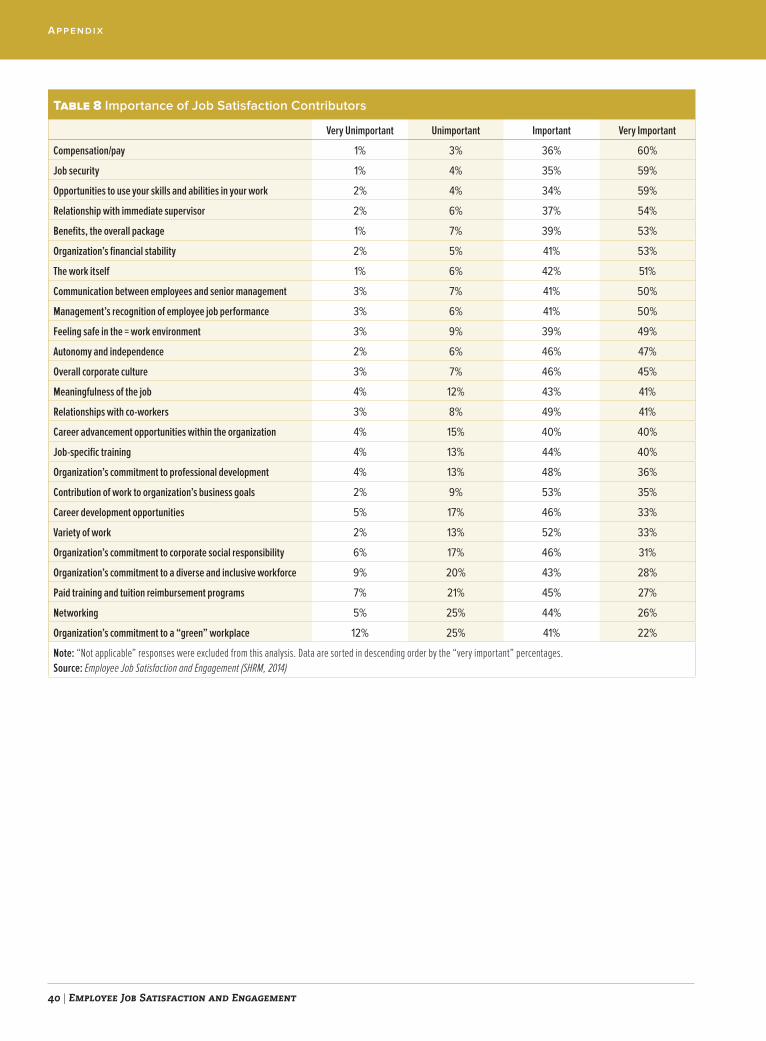
40 | Employee Job Satisfaction and Engagement
Appendix
Table 8 Importance of Job Satisfaction Contributors
Very Unimportant Unimportant Important Very Important
Compensation/pay 1% 3% 36% 60%
Job security 1% 4% 35% 59%
Opportunities to use your skills and abilities in your work 2% 4% 34% 59%
Relationship with immediate supervisor 2% 6% 37% 54%
Benefits, the overall package 1% 7% 39% 53%
Organization’s financial stability 2% 5% 41% 53%
The work itself 1% 6% 42% 51%
Communication between employees and senior management 3% 7% 41% 50%
Management’s recognition of employee job performance 3% 6% 41% 50%
Feeling safe in the = work environment 3% 9% 39% 49%
Autonomy and independence 2% 6% 46% 47%
Overall corporate culture 3% 7% 46% 45%
Meaningfulness of the job 4% 12% 43% 41%
Relationships with co-workers 3% 8% 49% 41%
Career advancement opportunities within the organization 4% 15% 40% 40%
Job-specific training 4% 13% 44% 40%
Organization’s commitment to professional development 4% 13% 48% 36%
Contribution of work to organization’s business goals 2% 9% 53% 35%
Career development opportunities 5% 17% 46% 33%
Variety of work 2% 13% 52% 33%
Organization’s commitment to corporate social responsibility 6% 17% 46% 31%
Organization’s commitment to a diverse and inclusive workforce 9% 20% 43% 28%
Paid training and tuition reimbursement programs 7% 21% 45% 27%
Networking 5% 25% 44% 26%
Organization’s commitment to a “green” workplace 12% 25% 41% 22%
Note: “Not applicable” responses were excluded from this analysis. Data are sorted in descending order by the “very important” percentages. Source: Employee Job Satisfaction and Engagement (SHRM, 2014)
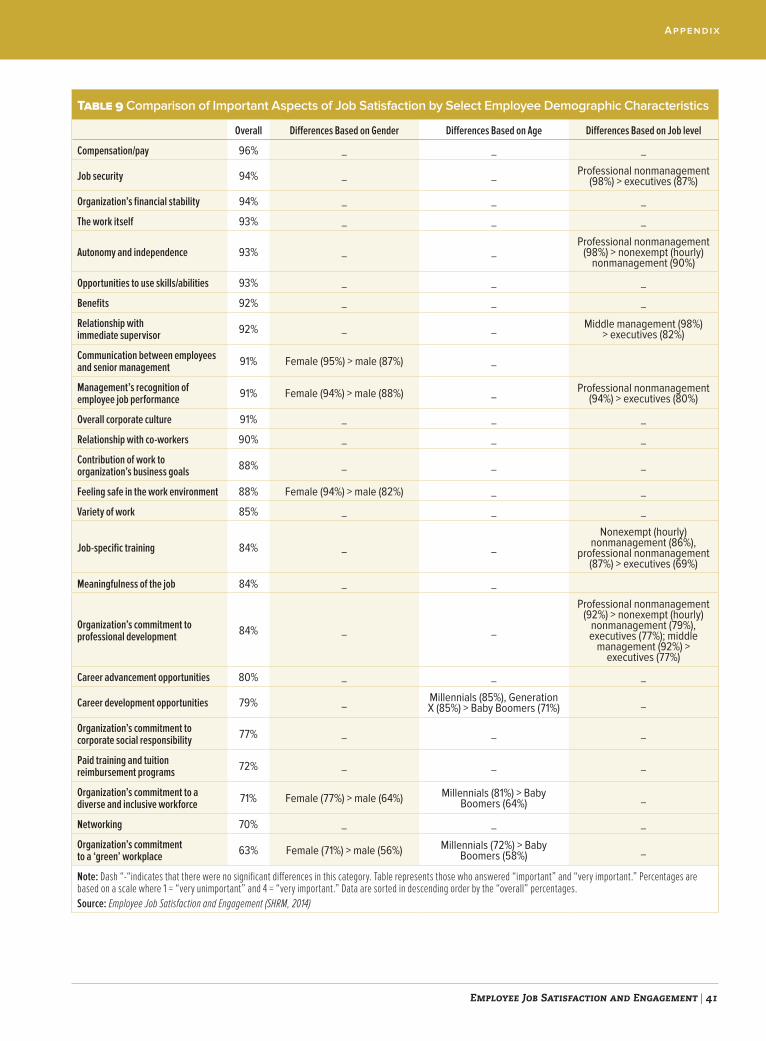
Employee Job Satisfaction and Engagement | 41
Appendix
Table 9 Comparison of Important Aspects of Job Satisfaction by Select Employee Demographic Characteristics
Overall Differences Based on Gender Differences Based on Age Differences Based on Job level
Compensation/pay 96% _ _ _
Job security 94% _ _ Professional nonmanagement (98%) > executives (87%)
Organization’s financial stability 94% _ _ _
The work itself 93% _ _ _
Autonomy and independence 93% _ _Professional nonmanagement
(98%) > nonexempt (hourly) nonmanagement (90%)
Opportunities to use skills/abilities 93% _ _ _
Benefits 92% _ _ _
Relationship with immediate supervisor 92% _ _ Middle management (98%)
> executives (82%)
Communication between employees and senior management 91% Female (95%) > male (87%) _
Management’s recognition of employee job performance 91% Female (94%) > male (88%) _ Professional nonmanagement
(94%) > executives (80%)
Overall corporate culture 91% _ _ _
Relationship with co-workers 90% _ _ _
Contribution of work to organization’s business goals 88% _ _ _
Feeling safe in the work environment 88% Female (94%) > male (82%) _ _
Variety of work 85% _ _ _
Job-specific training 84% _ _Nonexempt (hourly)
nonmanagement (86%), professional nonmanagement
(87%) > executives (69%)
Meaningfulness of the job 84% _ _
Organization’s commitment to professional development 84% _ _
Professional nonmanagement (92%) > nonexempt (hourly)
nonmanagement (79%), executives (77%); middle
management (92%) > executives (77%)
Career advancement opportunities 80% _ _ _
Career development opportunities 79% _ Millennials (85%), Generation X (85%) > Baby Boomers (71%) _
Organization’s commitment to corporate social responsibility 77% _ _ _
Paid training and tuition reimbursement programs 72% _ _ _
Organization’s commitment to a diverse and inclusive workforce 71% Female (77%) > male (64%) Millennials (81%) > Baby
Boomers (64%) _
Networking 70% _ _ _
Organization’s commitment to a ‘green’ workplace 63% Female (71%) > male (56%) Millennials (72%) > Baby
Boomers (58%) _
Note: Dash “-“indicates that there were no significant differences in this category. Table represents those who answered “important” and “very important.” Percentages are based on a scale where 1 = “very unimportant” and 4 = “very important.” Data are sorted in descending order by the “overall” percentages.Source: Employee Job Satisfaction and Engagement (SHRM, 2014)
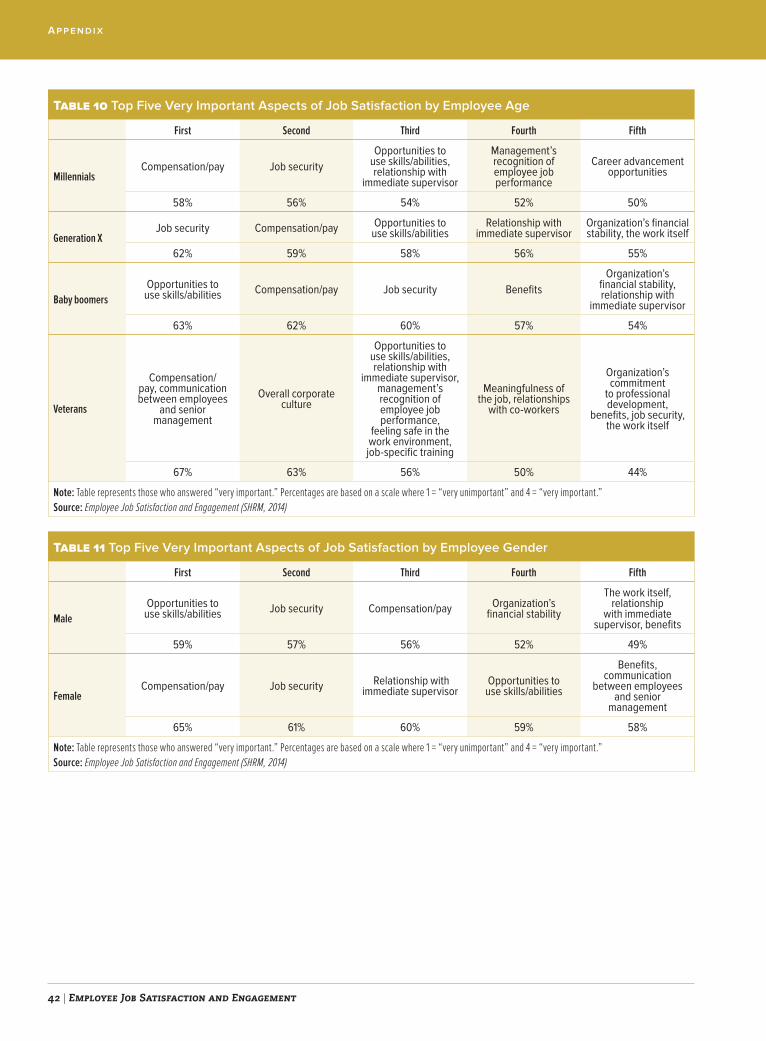
42 | Employee Job Satisfaction and Engagement
Appendix
Table 10 Top Five Very Important Aspects of Job Satisfaction by Employee Age
First Second Third Fourth Fifth
MillennialsCompensation/pay Job security
Opportunities to use skills/abilities, relationship with
immediate supervisor
Management’s recognition of employee job performance
Career advancement opportunities
58% 56% 54% 52% 50%
Generation XJob security Compensation/pay Opportunities to
use skills/abilitiesRelationship with
immediate supervisorOrganization’s financial stability, the work itself
62% 59% 58% 56% 55%
Baby boomersOpportunities to
use skills/abilities Compensation/pay Job security BenefitsOrganization’s
financial stability, relationship with
immediate supervisor
63% 62% 60% 57% 54%
Veterans
Compensation/pay, communication between employees
and senior management
Overall corporate culture
Opportunities to use skills/abilities, relationship with
immediate supervisor, management’s recognition of employee job performance,
feeling safe in the work environment, job-specific training
Meaningfulness of the job, relationships
with co-workers
Organization’s commitment
to professional development,
benefits, job security, the work itself
67% 63% 56% 50% 44%
Note: Table represents those who answered “very important.” Percentages are based on a scale where 1 = “very unimportant” and 4 = “very important.”Source: Employee Job Satisfaction and Engagement (SHRM, 2014)
Table 11 Top Five Very Important Aspects of Job Satisfaction by Employee Gender
First Second Third Fourth Fifth
MaleOpportunities to
use skills/abilities Job security Compensation/pay Organization’s financial stability
The work itself, relationship
with immediate supervisor, benefits
59% 57% 56% 52% 49%
FemaleCompensation/pay Job security Relationship with
immediate supervisorOpportunities to
use skills/abilities
Benefits, communication
between employees and senior
management
65% 61% 60% 59% 58%
Note: Table represents those who answered “very important.” Percentages are based on a scale where 1 = “very unimportant” and 4 = “very important.”Source: Employee Job Satisfaction and Engagement (SHRM, 2014)
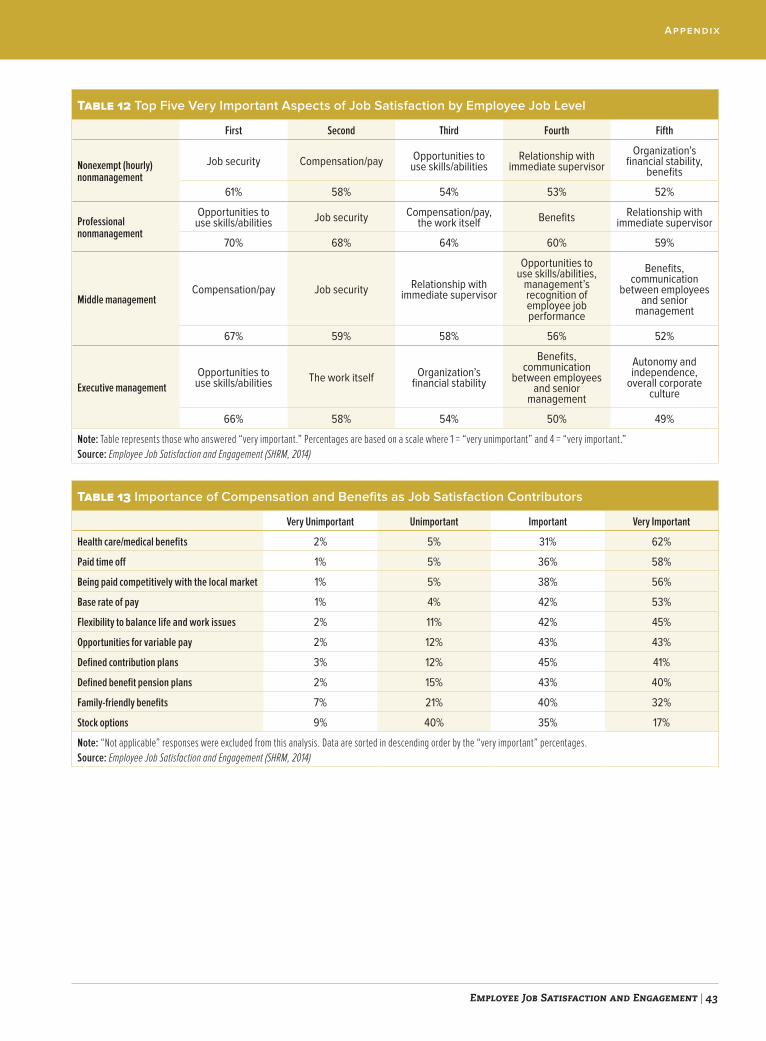
Employee Job Satisfaction and Engagement | 43
Appendix
Table 12 Top Five Very Important Aspects of Job Satisfaction by Employee Job Level
First Second Third Fourth Fifth
Nonexempt (hourly) nonmanagement
Job security Compensation/pay Opportunities to use skills/abilities
Relationship with immediate supervisor
Organization’s financial stability,
benefits
61% 58% 54% 53% 52%
Professional nonmanagement
Opportunities to use skills/abilities Job security Compensation/pay,
the work itself Benefits Relationship with immediate supervisor
70% 68% 64% 60% 59%
Middle managementCompensation/pay Job security Relationship with
immediate supervisor
Opportunities to use skills/abilities,
management’s recognition of employee job performance
Benefits, communication
between employees and senior
management
67% 59% 58% 56% 52%
Executive managementOpportunities to
use skills/abilities The work itself Organization’s financial stability
Benefits, communication
between employees and senior
management
Autonomy and independence,
overall corporate culture
66% 58% 54% 50% 49%
Note: Table represents those who answered “very important.” Percentages are based on a scale where 1 = “very unimportant” and 4 = “very important.”Source: Employee Job Satisfaction and Engagement (SHRM, 2014)
Table 13 Importance of Compensation and Benefits as Job Satisfaction Contributors
Very Unimportant Unimportant Important Very Important
Health care/medical benefits 2% 5% 31% 62%
Paid time off 1% 5% 36% 58%
Being paid competitively with the local market 1% 5% 38% 56%
Base rate of pay 1% 4% 42% 53%
Flexibility to balance life and work issues 2% 11% 42% 45%
Opportunities for variable pay 2% 12% 43% 43%
Defined contribution plans 3% 12% 45% 41%
Defined benefit pension plans 2% 15% 43% 40%
Family-friendly benefits 7% 21% 40% 32%
Stock options 9% 40% 35% 17%
Note: “Not applicable” responses were excluded from this analysis. Data are sorted in descending order by the “very important” percentages. Source: Employee Job Satisfaction and Engagement (SHRM, 2014)
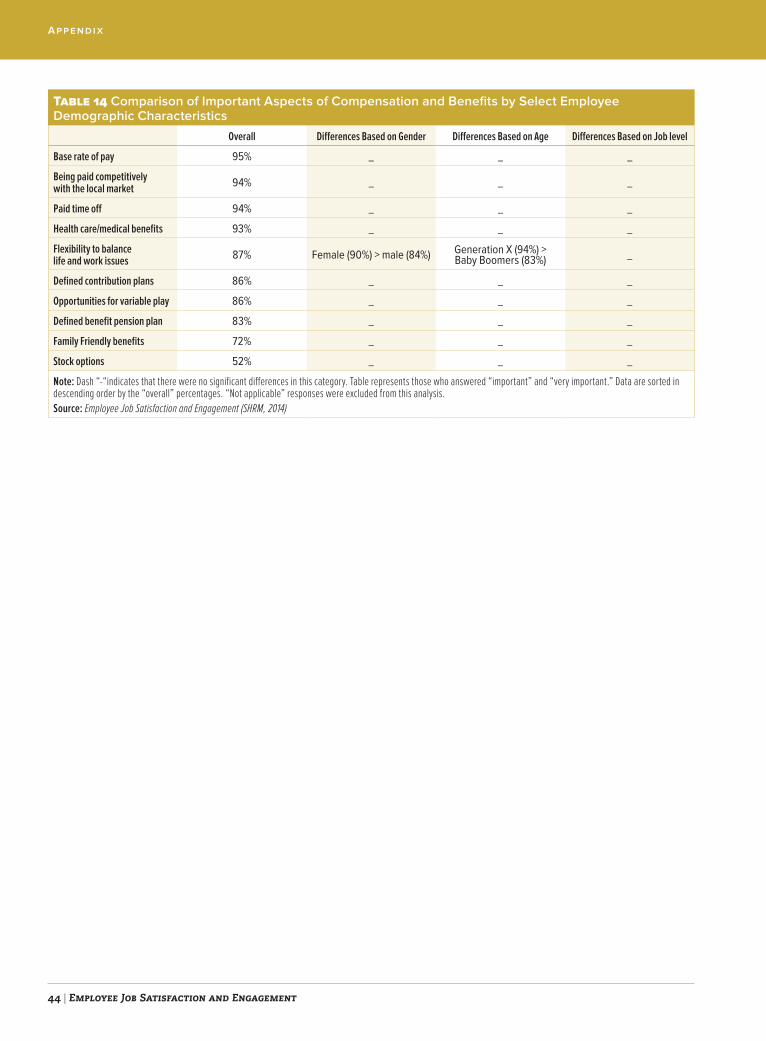
44 | Employee Job Satisfaction and Engagement
Appendix
Table 14 Comparison of Important Aspects of Compensation and Benefits by Select Employee Demographic Characteristics
Overall Differences Based on Gender Differences Based on Age Differences Based on Job level
Base rate of pay 95% _ _ _
Being paid competitively with the local market 94% _ _ _
Paid time off 94% _ _ _
Health care/medical benefits 93% _ _ _
Flexibility to balance life and work issues 87% Female (90%) > male (84%) Generation X (94%) >
Baby Boomers (83%) _
Defined contribution plans 86% _ _ _
Opportunities for variable play 86% _ _ _
Defined benefit pension plan 83% _ _ _
Family Friendly benefits 72% _ _ _
Stock options 52% _ _ _
Note: Dash “-“indicates that there were no significant differences in this category. Table represents those who answered “important” and “very important.” Data are sorted in descending order by the “overall” percentages. “Not applicable” responses were excluded from this analysis.Source: Employee Job Satisfaction and Engagement (SHRM, 2014)
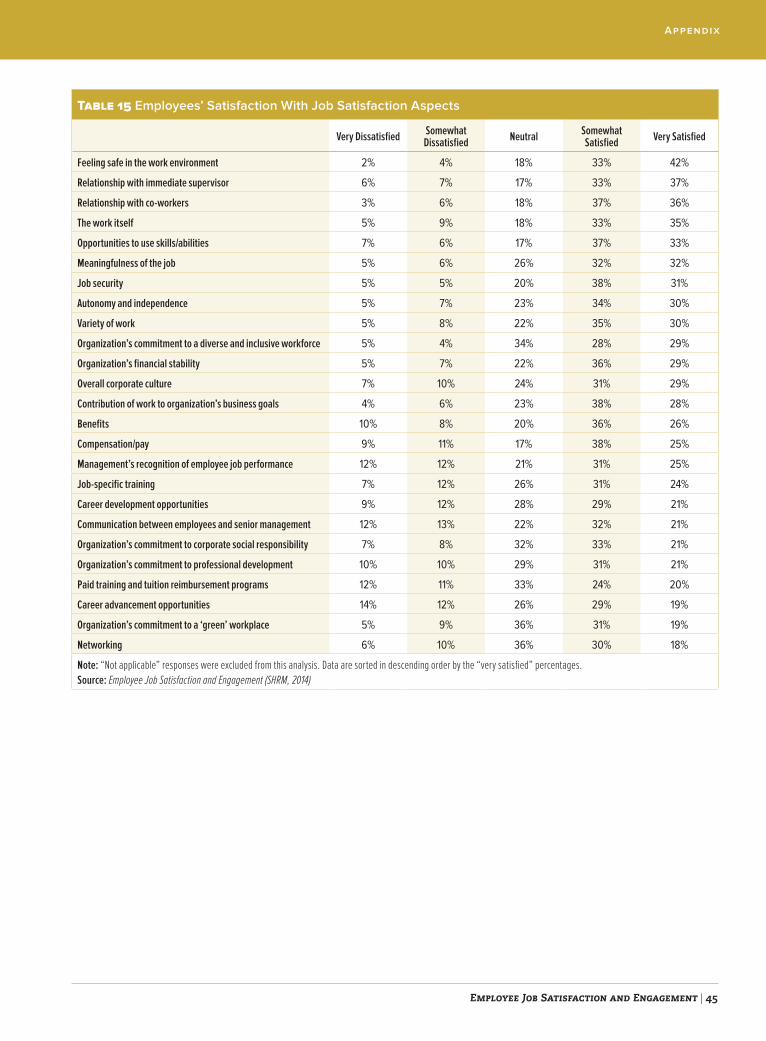
Employee Job Satisfaction and Engagement | 45
Appendix
Table 15 Employees’ Satisfaction With Job Satisfaction Aspects
Very Dissatisfied Somewhat Dissatisfied Neutral Somewhat
Satisfied Very Satisfied
Feeling safe in the work environment 2% 4% 18% 33% 42%
Relationship with immediate supervisor 6% 7% 17% 33% 37%
Relationship with co-workers 3% 6% 18% 37% 36%
The work itself 5% 9% 18% 33% 35%
Opportunities to use skills/abilities 7% 6% 17% 37% 33%
Meaningfulness of the job 5% 6% 26% 32% 32%
Job security 5% 5% 20% 38% 31%
Autonomy and independence 5% 7% 23% 34% 30%
Variety of work 5% 8% 22% 35% 30%
Organization’s commitment to a diverse and inclusive workforce 5% 4% 34% 28% 29%
Organization’s financial stability 5% 7% 22% 36% 29%
Overall corporate culture 7% 10% 24% 31% 29%
Contribution of work to organization’s business goals 4% 6% 23% 38% 28%
Benefits 10% 8% 20% 36% 26%
Compensation/pay 9% 11% 17% 38% 25%
Management’s recognition of employee job performance 12% 12% 21% 31% 25%
Job-specific training 7% 12% 26% 31% 24%
Career development opportunities 9% 12% 28% 29% 21%
Communication between employees and senior management 12% 13% 22% 32% 21%
Organization’s commitment to corporate social responsibility 7% 8% 32% 33% 21%
Organization’s commitment to professional development 10% 10% 29% 31% 21%
Paid training and tuition reimbursement programs 12% 11% 33% 24% 20%
Career advancement opportunities 14% 12% 26% 29% 19%
Organization’s commitment to a ‘green’ workplace 5% 9% 36% 31% 19%
Networking 6% 10% 36% 30% 18%
Note: “Not applicable” responses were excluded from this analysis. Data are sorted in descending order by the “very satisfied” percentages. Source: Employee Job Satisfaction and Engagement (SHRM, 2014)
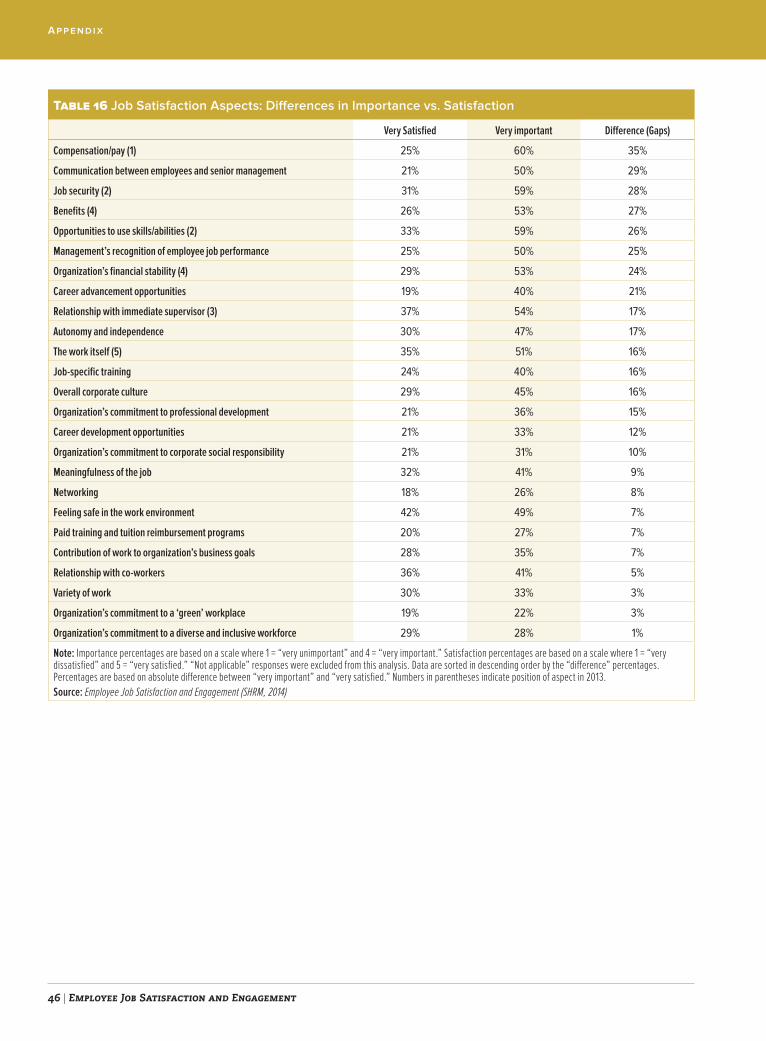
46 | Employee Job Satisfaction and Engagement
Appendix
Table 16 Job Satisfaction Aspects: Differences in Importance vs. Satisfaction
Very Satisfied Very important Difference (Gaps)
Compensation/pay (1) 25% 60% 35%
Communication between employees and senior management 21% 50% 29%
Job security (2) 31% 59% 28%
Benefits (4) 26% 53% 27%
Opportunities to use skills/abilities (2) 33% 59% 26%
Management’s recognition of employee job performance 25% 50% 25%
Organization’s financial stability (4) 29% 53% 24%
Career advancement opportunities 19% 40% 21%
Relationship with immediate supervisor (3) 37% 54% 17%
Autonomy and independence 30% 47% 17%
The work itself (5) 35% 51% 16%
Job-specific training 24% 40% 16%
Overall corporate culture 29% 45% 16%
Organization’s commitment to professional development 21% 36% 15%
Career development opportunities 21% 33% 12%
Organization’s commitment to corporate social responsibility 21% 31% 10%
Meaningfulness of the job 32% 41% 9%
Networking 18% 26% 8%
Feeling safe in the work environment 42% 49% 7%
Paid training and tuition reimbursement programs 20% 27% 7%
Contribution of work to organization’s business goals 28% 35% 7%
Relationship with co-workers 36% 41% 5%
Variety of work 30% 33% 3%
Organization’s commitment to a ‘green’ workplace 19% 22% 3%
Organization’s commitment to a diverse and inclusive workforce 29% 28% 1%
Note: Importance percentages are based on a scale where 1 = “very unimportant” and 4 = “very important.” Satisfaction percentages are based on a scale where 1 = “very dissatisfied” and 5 = “very satisfied.” “Not applicable” responses were excluded from this analysis. Data are sorted in descending order by the “difference” percentages. Percentages are based on absolute difference between “very important” and “very satisfied.” Numbers in parentheses indicate position of aspect in 2013. Source: Employee Job Satisfaction and Engagement (SHRM, 2014)
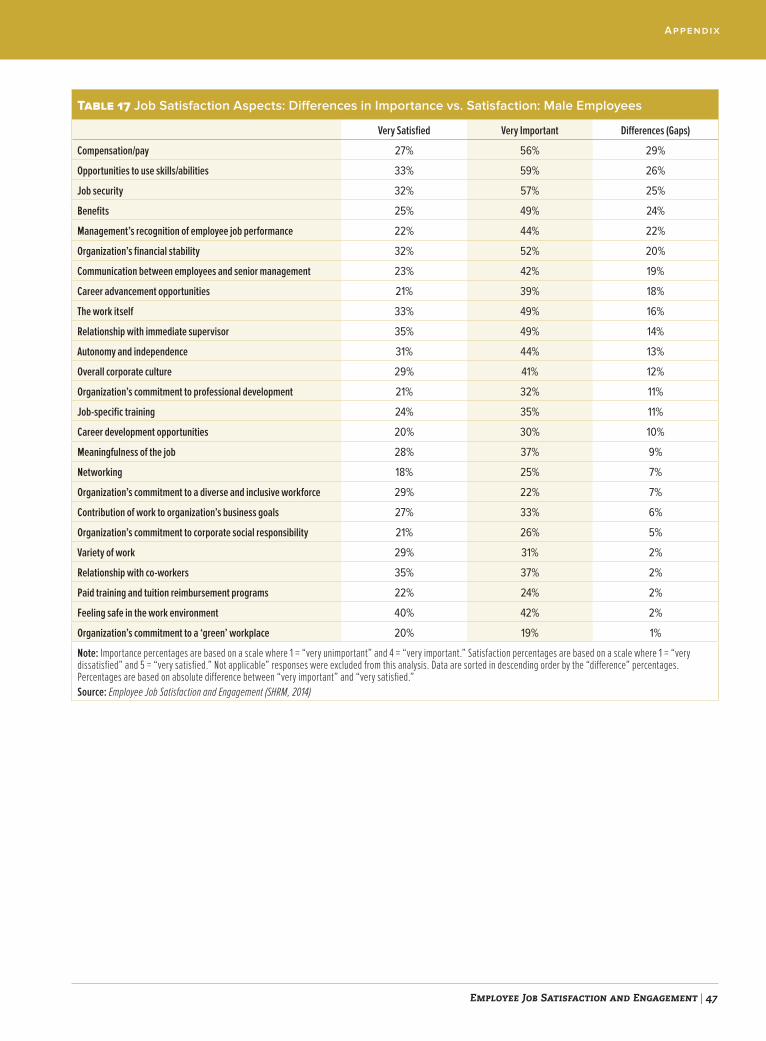
Employee Job Satisfaction and Engagement | 47
Appendix
Table 17 Job Satisfaction Aspects: Differences in Importance vs. Satisfaction: Male Employees
Very Satisfied Very Important Differences (Gaps)
Compensation/pay 27% 56% 29%
Opportunities to use skills/abilities 33% 59% 26%
Job security 32% 57% 25%
Benefits 25% 49% 24%
Management’s recognition of employee job performance 22% 44% 22%
Organization’s financial stability 32% 52% 20%
Communication between employees and senior management 23% 42% 19%
Career advancement opportunities 21% 39% 18%
The work itself 33% 49% 16%
Relationship with immediate supervisor 35% 49% 14%
Autonomy and independence 31% 44% 13%
Overall corporate culture 29% 41% 12%
Organization’s commitment to professional development 21% 32% 11%
Job-specific training 24% 35% 11%
Career development opportunities 20% 30% 10%
Meaningfulness of the job 28% 37% 9%
Networking 18% 25% 7%
Organization’s commitment to a diverse and inclusive workforce 29% 22% 7%
Contribution of work to organization’s business goals 27% 33% 6%
Organization’s commitment to corporate social responsibility 21% 26% 5%
Variety of work 29% 31% 2%
Relationship with co-workers 35% 37% 2%
Paid training and tuition reimbursement programs 22% 24% 2%
Feeling safe in the work environment 40% 42% 2%
Organization’s commitment to a ‘green’ workplace 20% 19% 1%
Note: Importance percentages are based on a scale where 1 = “very unimportant” and 4 = “very important.” Satisfaction percentages are based on a scale where 1 = “very dissatisfied” and 5 = “very satisfied.” Not applicable” responses were excluded from this analysis. Data are sorted in descending order by the “difference” percentages. Percentages are based on absolute difference between “very important” and “very satisfied.”Source: Employee Job Satisfaction and Engagement (SHRM, 2014)
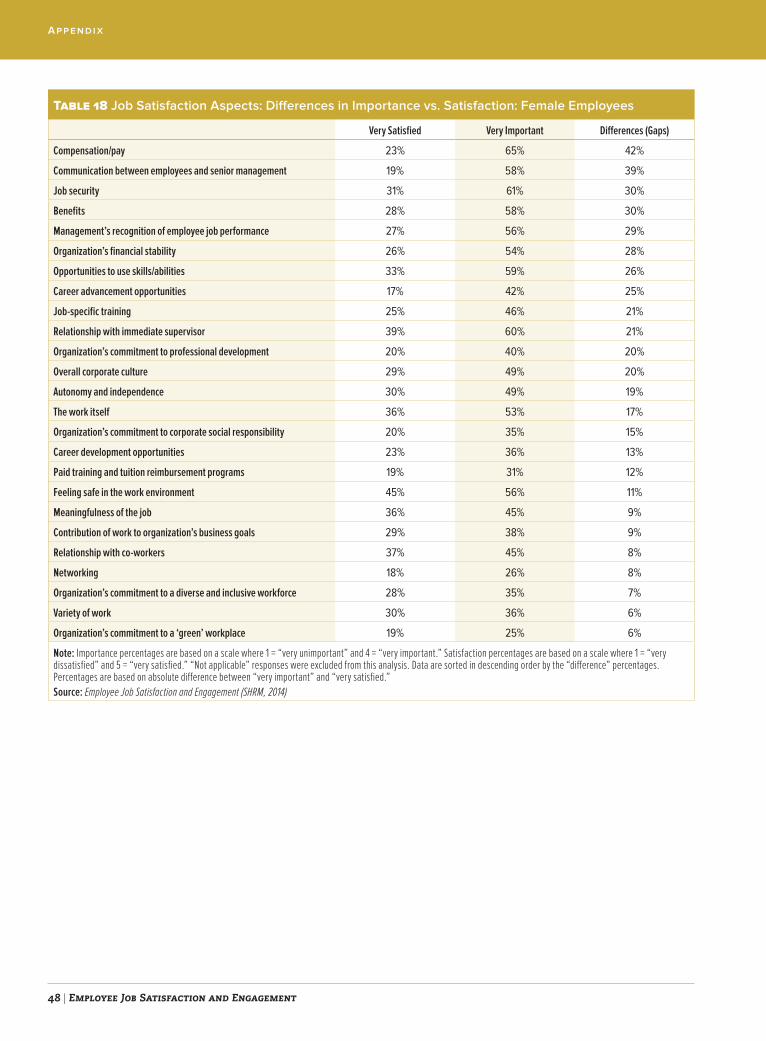
48 | Employee Job Satisfaction and Engagement
Appendix
Table 18 Job Satisfaction Aspects: Differences in Importance vs. Satisfaction: Female Employees
Very Satisfied Very Important Differences (Gaps)
Compensation/pay 23% 65% 42%
Communication between employees and senior management 19% 58% 39%
Job security 31% 61% 30%
Benefits 28% 58% 30%
Management’s recognition of employee job performance 27% 56% 29%
Organization’s financial stability 26% 54% 28%
Opportunities to use skills/abilities 33% 59% 26%
Career advancement opportunities 17% 42% 25%
Job-specific training 25% 46% 21%
Relationship with immediate supervisor 39% 60% 21%
Organization’s commitment to professional development 20% 40% 20%
Overall corporate culture 29% 49% 20%
Autonomy and independence 30% 49% 19%
The work itself 36% 53% 17%
Organization’s commitment to corporate social responsibility 20% 35% 15%
Career development opportunities 23% 36% 13%
Paid training and tuition reimbursement programs 19% 31% 12%
Feeling safe in the work environment 45% 56% 11%
Meaningfulness of the job 36% 45% 9%
Contribution of work to organization’s business goals 29% 38% 9%
Relationship with co-workers 37% 45% 8%
Networking 18% 26% 8%
Organization’s commitment to a diverse and inclusive workforce 28% 35% 7%
Variety of work 30% 36% 6%
Organization’s commitment to a ‘green’ workplace 19% 25% 6%
Note: Importance percentages are based on a scale where 1 = “very unimportant” and 4 = “very important.” Satisfaction percentages are based on a scale where 1 = “very dissatisfied” and 5 = “very satisfied.” “Not applicable” responses were excluded from this analysis. Data are sorted in descending order by the “difference” percentages. Percentages are based on absolute difference between “very important” and “very satisfied.” Source: Employee Job Satisfaction and Engagement (SHRM, 2014)
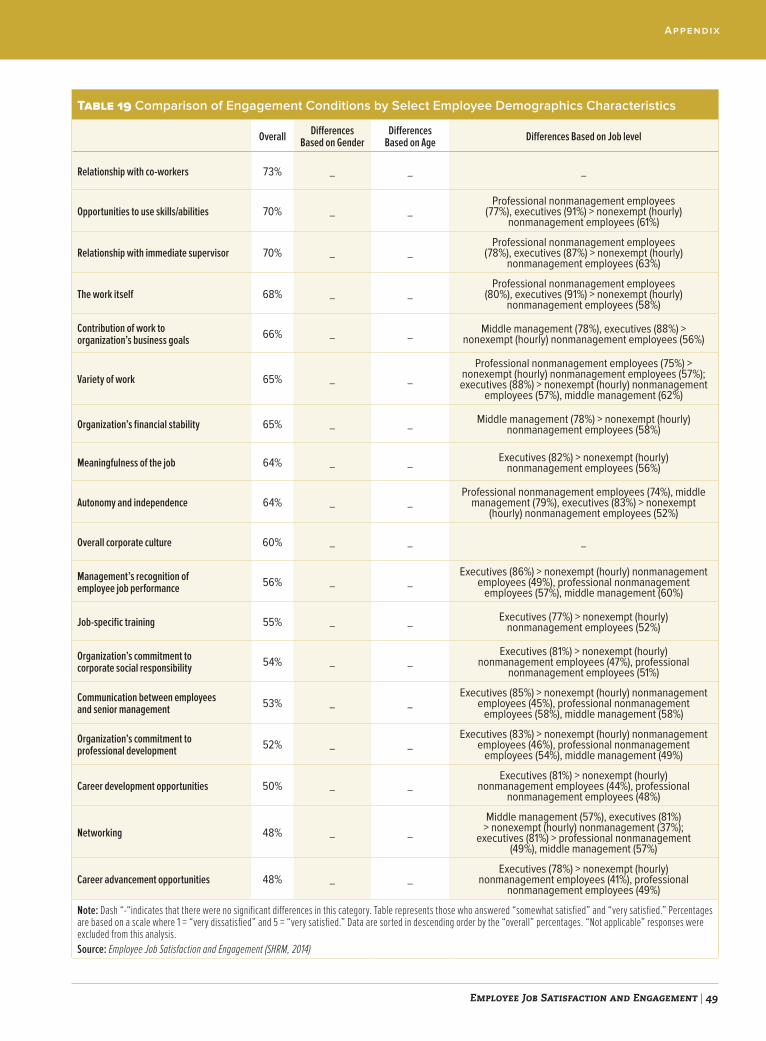
Employee Job Satisfaction and Engagement | 49
Appendix
Table 19 Comparison of Engagement Conditions by Select Employee Demographics Characteristics
Overall Differences Based on Gender
Differences Based on Age Differences Based on Job level
Relationship with co-workers 73% _ _ _
Opportunities to use skills/abilities 70% _ _Professional nonmanagement employees
(77%), executives (91%) > nonexempt (hourly) nonmanagement employees (61%)
Relationship with immediate supervisor 70% _ _Professional nonmanagement employees
(78%), executives (87%) > nonexempt (hourly) nonmanagement employees (63%)
The work itself 68% _ _Professional nonmanagement employees
(80%), executives (91%) > nonexempt (hourly) nonmanagement employees (58%)
Contribution of work to organization’s business goals 66% _ _ Middle management (78%), executives (88%) >
nonexempt (hourly) nonmanagement employees (56%)
Variety of work 65% _ _Professional nonmanagement employees (75%) >
nonexempt (hourly) nonmanagement employees (57%); executives (88%) > nonexempt (hourly) nonmanagement
employees (57%), middle management (62%)
Organization’s financial stability 65% _ _ Middle management (78%) > nonexempt (hourly) nonmanagement employees (58%)
Meaningfulness of the job 64% _ _ Executives (82%) > nonexempt (hourly) nonmanagement employees (56%)
Autonomy and independence 64% _ _Professional nonmanagement employees (74%), middle
management (79%), executives (83%) > nonexempt (hourly) nonmanagement employees (52%)
Overall corporate culture 60% _ _ _
Management’s recognition of employee job performance 56% _ _
Executives (86%) > nonexempt (hourly) nonmanagement employees (49%), professional nonmanagement
employees (57%), middle management (60%)
Job-specific training 55% _ _ Executives (77%) > nonexempt (hourly) nonmanagement employees (52%)
Organization’s commitment to corporate social responsibility 54% _ _
Executives (81%) > nonexempt (hourly) nonmanagement employees (47%), professional
nonmanagement employees (51%)
Communication between employees and senior management 53% _ _
Executives (85%) > nonexempt (hourly) nonmanagement employees (45%), professional nonmanagement
employees (58%), middle management (58%)
Organization’s commitment to professional development 52% _ _
Executives (83%) > nonexempt (hourly) nonmanagement employees (46%), professional nonmanagement
employees (54%), middle management (49%)
Career development opportunities 50% _ _Executives (81%) > nonexempt (hourly)
nonmanagement employees (44%), professional nonmanagement employees (48%)
Networking 48% _ _Middle management (57%), executives (81%) > nonexempt (hourly) nonmanagement (37%);
executives (81%) > professional nonmanagement (49%), middle management (57%)
Career advancement opportunities 48% _ _Executives (78%) > nonexempt (hourly)
nonmanagement employees (41%), professional nonmanagement employees (49%)
Note: Dash “-“indicates that there were no significant differences in this category. Table represents those who answered “somewhat satisfied” and “very satisfied.” Percentages are based on a scale where 1 = “very dissatisfied” and 5 = “very satisfied.” Data are sorted in descending order by the “overall” percentages. “Not applicable” responses were excluded from this analysis. Source: Employee Job Satisfaction and Engagement (SHRM, 2014)
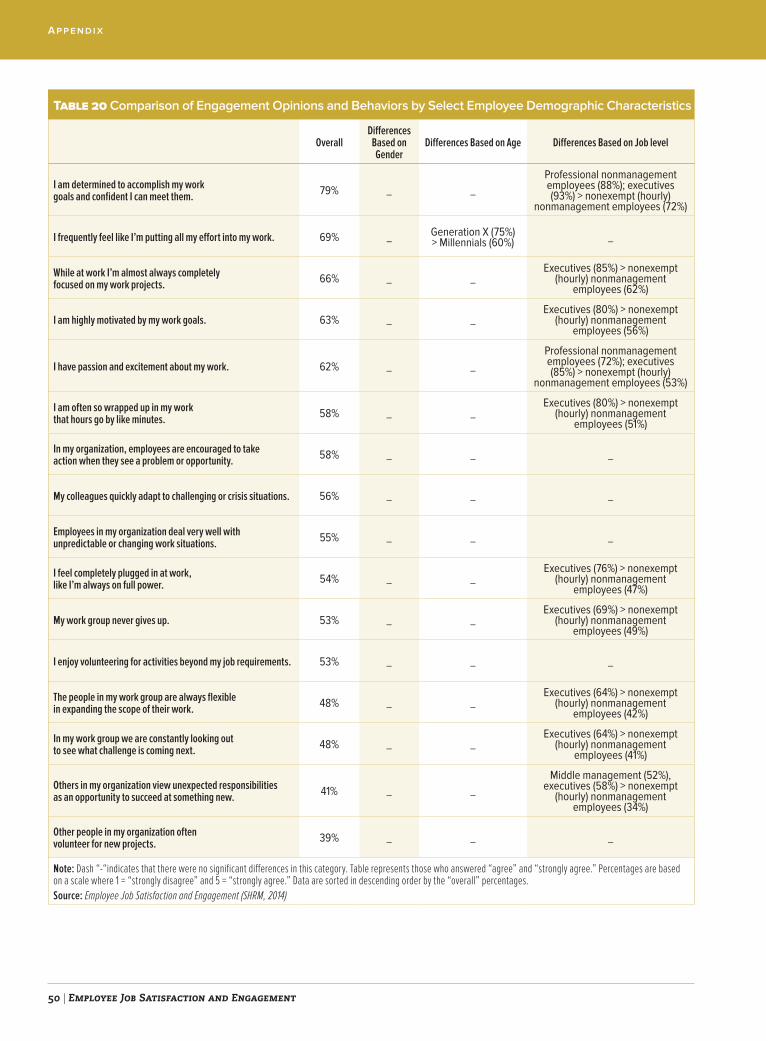
50 | Employee Job Satisfaction and Engagement
Appendix
Table 20 Comparison of Engagement Opinions and Behaviors by Select Employee Demographic Characteristics
OverallDifferences
Based on Gender
Differences Based on Age Differences Based on Job level
I am determined to accomplish my work goals and confident I can meet them. 79% _ _
Professional nonmanagement employees (88%); executives (93%) > nonexempt (hourly)
nonmanagement employees (72%)
I frequently feel like I’m putting all my effort into my work. 69% _ Generation X (75%) > Millennials (60%) _
While at work I’m almost always completely focused on my work projects. 66% _ _
Executives (85%) > nonexempt (hourly) nonmanagement
employees (62%)
I am highly motivated by my work goals. 63% _ _Executives (80%) > nonexempt
(hourly) nonmanagement employees (56%)
I have passion and excitement about my work. 62% _ _Professional nonmanagement employees (72%); executives (85%) > nonexempt (hourly)
nonmanagement employees (53%)
I am often so wrapped up in my work that hours go by like minutes. 58% _ _
Executives (80%) > nonexempt (hourly) nonmanagement
employees (51%)
In my organization, employees are encouraged to take action when they see a problem or opportunity. 58% _ _ _
My colleagues quickly adapt to challenging or crisis situations. 56% _ _ _
Employees in my organization deal very well with unpredictable or changing work situations. 55% _ _ _
I feel completely plugged in at work, like I’m always on full power. 54% _ _
Executives (76%) > nonexempt (hourly) nonmanagement
employees (47%)
My work group never gives up. 53% _ _Executives (69%) > nonexempt
(hourly) nonmanagement employees (49%)
I enjoy volunteering for activities beyond my job requirements. 53% _ _ _
The people in my work group are always flexible in expanding the scope of their work. 48% _ _
Executives (64%) > nonexempt (hourly) nonmanagement
employees (42%)
In my work group we are constantly looking out to see what challenge is coming next. 48% _ _
Executives (64%) > nonexempt (hourly) nonmanagement
employees (41%)
Others in my organization view unexpected responsibilities as an opportunity to succeed at something new. 41% _ _
Middle management (52%), executives (58%) > nonexempt
(hourly) nonmanagement employees (34%)
Other people in my organization often volunteer for new projects. 39% _ _ _
Note: Dash “-“indicates that there were no significant differences in this category. Table represents those who answered “agree” and “strongly agree.” Percentages are based on a scale where 1 = “strongly disagree” and 5 = “strongly agree.” Data are sorted in descending order by the “overall” percentages.Source: Employee Job Satisfaction and Engagement (SHRM, 2014)
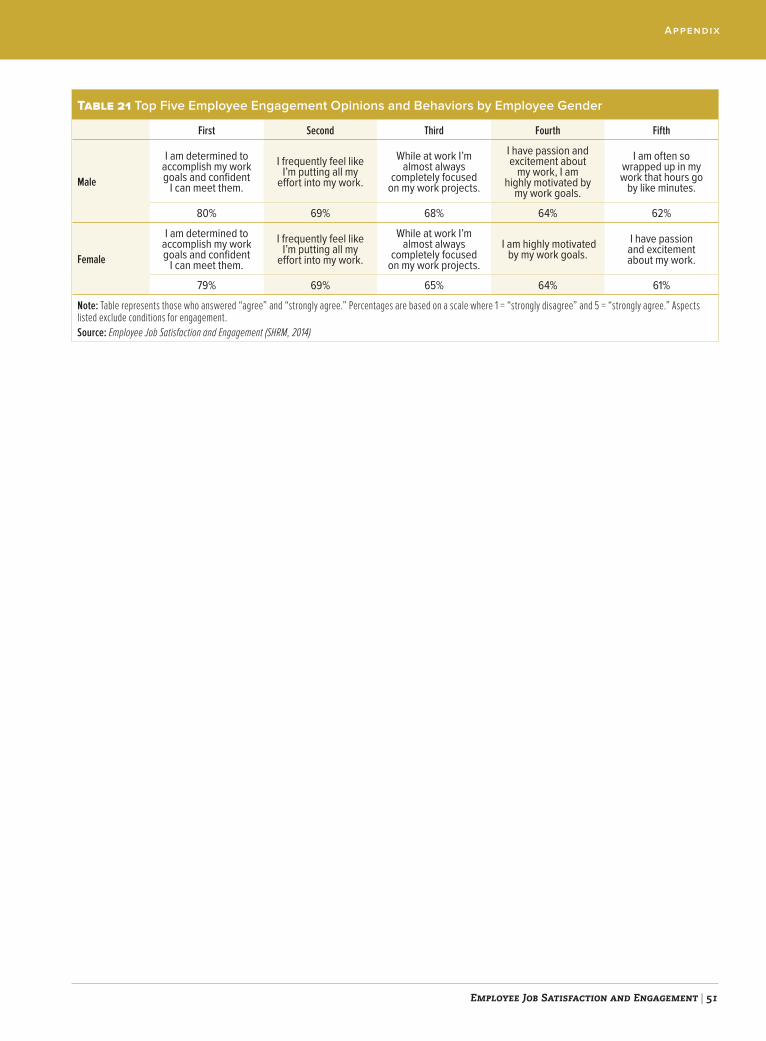
Employee Job Satisfaction and Engagement | 51
Appendix
Table 21 Top Five Employee Engagement Opinions and Behaviors by Employee Gender
First Second Third Fourth Fifth
Male
I am determined to accomplish my work goals and confident
I can meet them�
I frequently feel like I’m putting all my
effort into my work�
While at work I’m almost always
completely focused on my work projects�
I have passion and excitement about
my work, I am highly motivated by
my work goals�
I am often so wrapped up in my work that hours go
by like minutes�
80% 69% 68% 64% 62%
Female
I am determined to accomplish my work goals and confident
I can meet them�
I frequently feel like I’m putting all my
effort into my work�
While at work I’m almost always
completely focused on my work projects�
I am highly motivated by my work goals�
I have passion and excitement about my work�
79% 69% 65% 64% 61%
Note: Table represents those who answered “agree” and “strongly agree.” Percentages are based on a scale where 1 = “strongly disagree” and 5 = “strongly agree.” Aspects listed exclude conditions for engagement.Source: Employee Job Satisfaction and Engagement (SHRM, 2014)
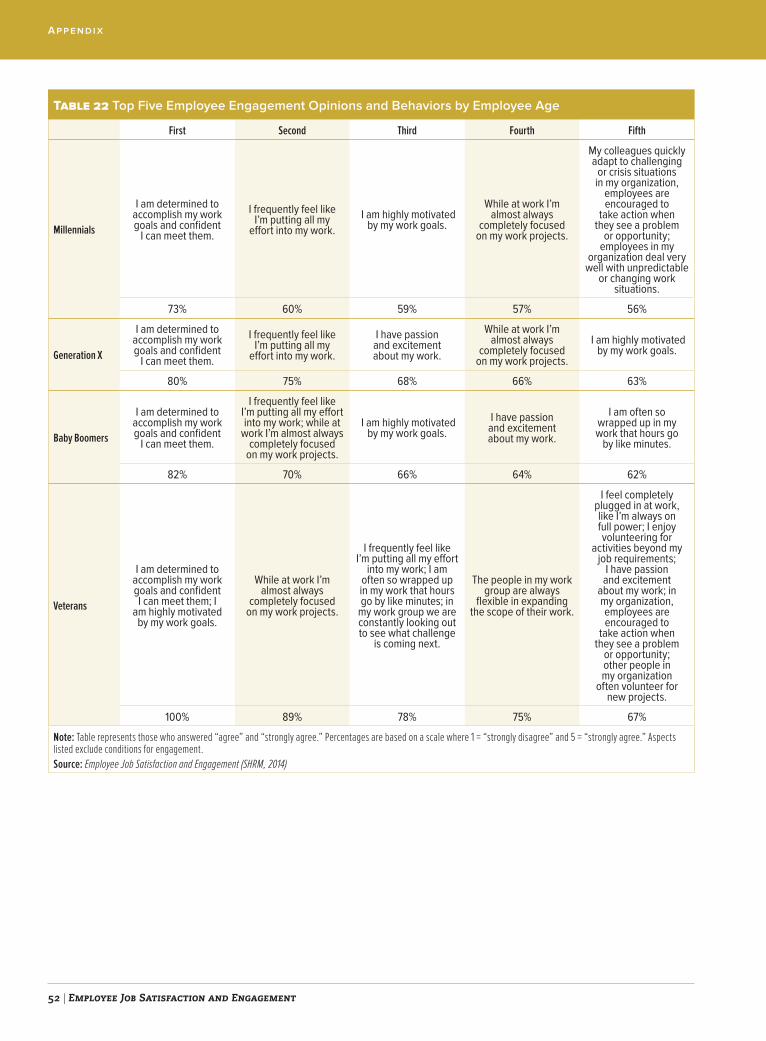
52 | Employee Job Satisfaction and Engagement
Appendix
Table 22 Top Five Employee Engagement Opinions and Behaviors by Employee Age
First Second Third Fourth Fifth
Millennials
I am determined to accomplish my work goals and confident
I can meet them�
I frequently feel like I’m putting all my
effort into my work� I am highly motivated
by my work goals�
While at work I’m almost always
completely focused on my work projects�
My colleagues quickly adapt to challenging
or crisis situations in my organization,
employees are encouraged to
take action when they see a problem
or opportunity; employees in my
organization deal very well with unpredictable
or changing work situations�
73% 60% 59% 57% 56%
Generation X
I am determined to accomplish my work goals and confident
I can meet them�
I frequently feel like I’m putting all my
effort into my work�
I have passion and excitement about my work�
While at work I’m almost always
completely focused on my work projects�
I am highly motivated by my work goals�
80% 75% 68% 66% 63%
Baby Boomers
I am determined to accomplish my work goals and confident
I can meet them�
I frequently feel like I’m putting all my effort into my work; while at
work I’m almost always completely focused
on my work projects�
I am highly motivated by my work goals�
I have passion and excitement about my work�
I am often so wrapped up in my work that hours go
by like minutes�
82% 70% 66% 64% 62%
Veterans
I am determined to accomplish my work goals and confident I can meet them; I
am highly motivated by my work goals�
While at work I’m almost always
completely focused on my work projects�
I frequently feel like I’m putting all my effort
into my work; I am often so wrapped up in my work that hours go by like minutes; in
my work group we are constantly looking out to see what challenge
is coming next�
The people in my work group are always
flexible in expanding the scope of their work�
I feel completely plugged in at work, like I’m always on full power; I enjoy volunteering for
activities beyond my job requirements;
I have passion and excitement
about my work; in my organization, employees are encouraged to
take action when they see a problem
or opportunity; other people in my organization
often volunteer for new projects�
100% 89% 78% 75% 67%
Note: Table represents those who answered “agree” and “strongly agree.” Percentages are based on a scale where 1 = “strongly disagree” and 5 = “strongly agree.” Aspects listed exclude conditions for engagement.Source: Employee Job Satisfaction and Engagement (SHRM, 2014)
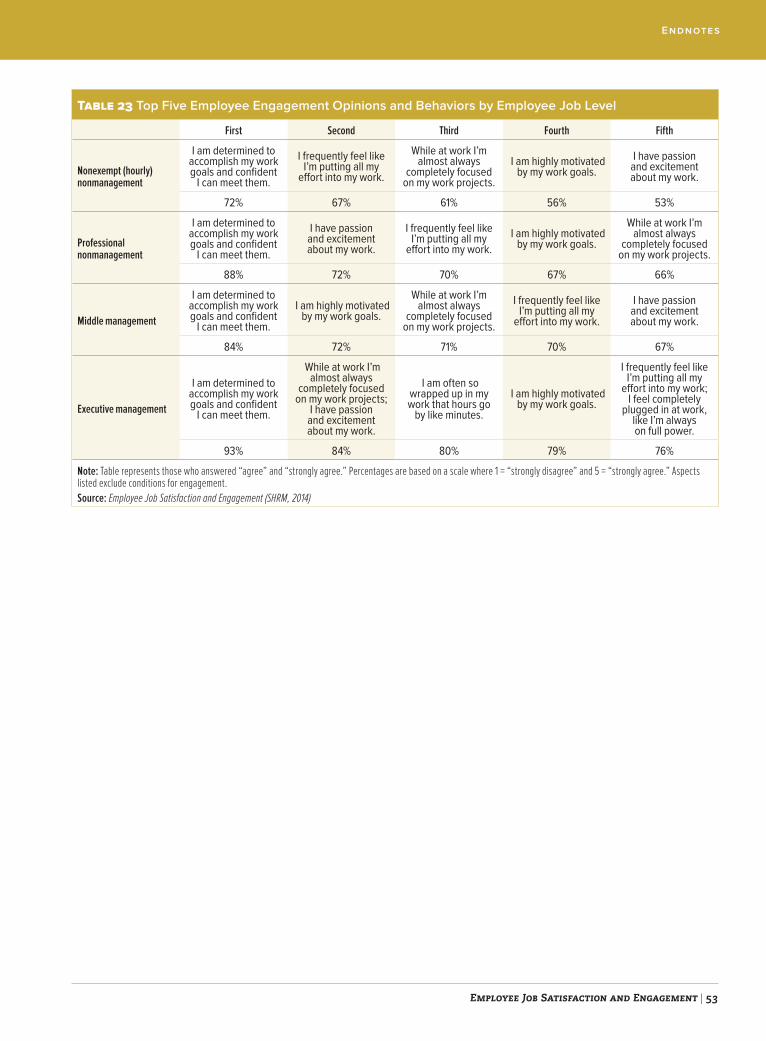
Employee Job Satisfaction and Engagement | 53
Endnotes
Table 23 Top Five Employee Engagement Opinions and Behaviors by Employee Job Level
First Second Third Fourth Fifth
Nonexempt (hourly) nonmanagement
I am determined to accomplish my work goals and confident
I can meet them�
I frequently feel like I’m putting all my
effort into my work�
While at work I’m almost always
completely focused on my work projects�
I am highly motivated by my work goals�
I have passion and excitement about my work�
72% 67% 61% 56% 53%
Professional nonmanagement
I am determined to accomplish my work goals and confident
I can meet them�
I have passion and excitement about my work�
I frequently feel like I’m putting all my
effort into my work� I am highly motivated
by my work goals�
While at work I’m almost always
completely focused on my work projects�
88% 72% 70% 67% 66%
Middle management
I am determined to accomplish my work goals and confident
I can meet them�
I am highly motivated by my work goals�
While at work I’m almost always
completely focused on my work projects�
I frequently feel like I’m putting all my
effort into my work�
I have passion and excitement about my work�
84% 72% 71% 70% 67%
Executive management
I am determined to accomplish my work goals and confident
I can meet them�
While at work I’m almost always
completely focused on my work projects;
I have passion and excitement about my work�
I am often so wrapped up in my work that hours go
by like minutes�
I am highly motivated by my work goals�
I frequently feel like I’m putting all my
effort into my work; I feel completely
plugged in at work, like I’m always on full power�
93% 84% 80% 79% 76%
Note: Table represents those who answered “agree” and “strongly agree.” Percentages are based on a scale where 1 = “strongly disagree” and 5 = “strongly agree.” Aspects listed exclude conditions for engagement.Source: Employee Job Satisfaction and Engagement (SHRM, 2014)
54 | Employee Job Satisfaction and Engagement
Endnotes
Endnotes
1 Society for Human Resource Management. (2013). SHRM/Globoforce Employee Recognition Programs. Retrieved from www.shrm.org.
2 Society for Human Resource Management. (2013). SHRM Findings: State of Employee Benefits in the Workplace. Retrieved from www.shrm.org.
3 Society for Human Resource Management. (2013). SHRM/Globoforce Employee Recognition Programs. Retrieved from www.shrm.org.
4 Society for Human Resource Management. (2013). SHRM Workplace Forecast: The Top Workplace Trends According to HR Professionals. Retrieved from www.shrm.org.
5 Society for Human Resource Management. (2013). SHRM 2013 Human Capital Benchmarking Report. Retrieved from www.shrm.org.
6 Society for Human Resource Management. (2012). Changing Employee Skills and Education Requirements—Training Budgets, Resources and Strategies. Retrieved from www.shrm.org.
7 Society for Human Resource Management. (2013). 2013 Employee Benefits: A research report by SHRM. Alexandria, VA: Author.
8 Society for Human Resource Management. (2013). SHRM 2013 Human Capital Benchmarking Report. Retrieved from www.shrm.org.
9 Society for Human Resource Management. (2013). SHRM Survey Findings: Social Networking Websites and Recruiting/Selection. Retrieved from www.shrm.org.
10 Society for Human Resource Management (2013). SHRM/Globoforce Employee Recognition Programs. Retrieved from www.shrm.org.
11 Society for Human Resource Management. (2013, December). SHRM LINE Employment Report. Retrieved from www.shrm.org/line.
12 Society for Human Resource Management. (2013). 2013 Employee Benefits: A research report by SHRM. Alexandria, VA: Author.
13 Ibid.
14 Society for Human Resource Management. (2013). SHRM Survey Findings: State of Employee Benefits in the Workplace series. Retrieved from www.shrm.org.
15 Society for Human Resource Management. (2013). SHRM Survey Findings: Health Care Reform—Impact of Health Care Coverage and Costs. Retrieved from www.shrm.org.
16 Society for Human Resource Management. (2013). 2013 Employee Benefits: A research report by SHRM. Alexandria, VA: Author.
17 Society for Human Resource Management. (2013). SHRM Survey Findings: State of Employee Benefits in the Workplace series. Retrieved from www.shrm.org.
18 Society for Human Resource Management. (2013). SHRM jobs outlook survey (October –December 2013). Retrieved from http://www.shrm.org/Research/MonthlyEmploymentIndices/lmo/Pages/default.aspx
19 Society for Human Resource Management. (2013). SHRM Survey Findings: The Workplace Impact of Domestic and Sexual Violence and Stalking. Retrieved from www.shrm.org.
20 U.S. Bureau of Labor Statistics. (2012). Employment Projections 2010-2020. Retrieved from www.bls.gov.
21 Society for Human Resource Management. (2013). SHRM survey findings: Sustainable Workplace Practices. Retrieved from www.shrm.org.
22 Society for Human Resource Management. (2013, May). SHRM/Globoforce Survey: Employee Recognition Programs. Retrieved from www.shrm.org.
Employee Job Satisfaction and Engagement | 55
Addit ional SHRM Resources
Additional SHRM Resources
Survey and Poll FindingsHow are other organizations handling an HR issue that your organization is facing? Get the information you need to make informed decisions about HR policies, practices and business strategies through SHRM’s survey and poll findings. Data on new HR and business topics are released regularly. www.shrm.org/surveys
Key research reports released annually include the Employee Job Satisfaction and Engagement research report, which tracks year-to-year changes in aspects of the work environment related to job satisfaction and employee engagement. Employee perspec-tives about the importance of workplace factors to overall job satisfaction are also assessed.
The Ongoing Impact of the Recession series examines topics such as recruiting and skill gaps, organizational financial health and hiring, and global competition and hiring strategies. In addition to providing overall results for U.S. organizations, results are broken out into eight industry-level reports.
Labor Market and Economic DataNeed data on what’s really happening in the job market? The SHRM LINE Employment Report cov-ers the service and manufacturing sectors on key areas for recruiting each month, including hiring expectations, month-to-month data on new-hire compensation changes and the only published measure ofrecruitingdifficultyofhighlyqualifiedcandidatesfor the most critical positions. www.shrm.org/line
The SHRM Jobs Outlook Survey (JOS) Report examines hiring and recruiting trends twice annually in the United States. It is based on a survey of more than 400 public and private-sector human resource profes-sionals with a direct role in the staffing decisions at their respective companies. www.shrm.org/jos
SHRM’s Metro Economic Outlook reports provide comprehen-sive analyses of the economies of the largest metropolitan areas in the United States. The reports include data from SHRM, the private sector and the government,
as well as insights from experts connected to each metro area’s economy. www.shrm.org/metrooutlook
Workplace Trends and ForecastingWant to learn more about key trends affecting the workplace and the HR profession? The latest SHRM Workplace Forecast: The Top Workplace Trends According to HR Professionals examines the trends in demographics, economics, public policy, globalization and technol-ogy that HR professionals think will have the biggest strategic impact on their organizations and the HR profession in the years ahead. www.shrm.org/trends
Future Insights: Top Trends According to SHRM’s HR Subject Matter Expert Panels highlights key HR-related topics and trends, as compiled by subject matter experts from SHRM’s Special Expertise Panels. www.shrm.org/trends
Customized Benchmarking Reports*Need metrics? We have more than 500 benchmarks categorized in seven reports listed compiled from a database of 10,000 organizations. Customize the output for your report based on industry, employee size and more. www.shrm.org/benchmarking The following reports are available:
•HumanCapitalBenchmarking(ourmostpopularreport).
• JobSatisfactionandEmployeeEngagementBenchmarking.
•EmployeeBenefitsPrevalenceBenchmarking.
•HealthCareBenchmarking.
•RetirementandWelfareBenchmarking.
•FamiliesandWorkInstitute’sWorkplaceEffectivenessand Flexibility Benchmarking.
•PaidLeaveBenchmarking.
Employee Engagement Survey Service*How engaged are your employees? SHRM will help you find out through People InSight, our job satisfaction and
56 | Employee Job Satisfaction and Engagement
Appendix
engagement survey service. Results are provided by individual department and overall employee population and benchmarked against overall norms, including in-dustry and organization staff size, from SHRM’s database of 10,000 employees. www.shrm.org/peopleinsight
Customized Research Services*What do HR professionals think? Access the world’s largest global community of HR professionals for custom survey research projects. SHRM develops the surveyquestionsinconjunctionwithyourorganization,administers the survey to a random sample of SHRM members, analyzes the data and prepares the final results. Examples of recent projects include workplace wellness initiatives, employee recognition programs, hiring veterans with disabilities, employee benefits, and diversity. www.shrm.org/customizedresearch
* These are fee-based services
Addit ional SHRM Resources
Employee Job Satisfaction and Engagement | 57
Project Team
Project leaderChristina Lee, researcher, Total Rewards Strategies, SHRM Research
SHRM project contributorsAlexander Alonso, Ph.D., SPHR, vice president, SHRM Research
Evren Esen, SPHR, director, SHRM Survey Programs
Joseph Coombs, senior analyst, Workforce Trends and Forecasting
Yan Dong, SHRM Research
Copy editingKatya Scanlan, copy editor
DesignTerry Biddle, senior design specialist
This report is published by the Society for Human Resource Management (SHRM). All content is for informational purposes only and is not to be construed as a guaranteed outcome. The Society for Human Resource Management cannot accept responsibility for any errors or omissions or any liability resulting from the use or misuse of any such information.
© May 2014. Society for Human Resource Management. All rights reserved. Printed in the United States of America.
This publication may not be reproduced, stored in a retrieval system or transmitted in whole or in part, in any form or by any means, electronic, mechanical, photocopying, recording or otherwise, without the prior written permission of the Society for Human Resource Management.
SHRM members can download this research report and many others free of charge at www.shrm.org/surveys. If you are not a SHRM member and would like to become one, please visit www.shrm.org/application.
Projec t Te am

Fill the gap between expensive benchmarking services and going it alone. SHRM offers customized benchmarking reports that can help you and your organization benchmark against more than 500 metrics in employee benefits prevalence, health care, human capital, job satisfaction and employee engagement, retirement and welfare, workplace effectiveness and flexibility, and paid leave. Visit our website at shrm.org/benchmarks or call 703-535-6366.
Need Advanced Benchmarking Reports and Advice?Workforce Analytics Solution for Human Capital Benchmarks includes four customized data segments to fit your needs:
1. Industry, staff size, sub-industries, unionization, revenue, sector (nonprofit, for-profit, government), consulting and more.
2. Region (based on SHRM membership regions).
3. Industry.
4. All industries.
Affordable Customized Benchmarking Reportsshrm.org/benchmarks
Revenue per FTE HR-to-Employee Ratio HR Expenses Annual Salary Increase Time-to-Fill Cost-per-Hire Annual Overall Turnover Rate Annual Voluntary Turnover Rate HR Expense to FTE Ratio Areas of HR Outsourcing Revenue per FTE HR-to-Employee Ratio HR Expenses Annual Salary Increase Time-to-Fill Cost-per-Hire Annual Overall Turnover Rate Annual Voluntary Turnover Rate HR Expense to FTE Ratio Areas of HR Outsourcing Revenue per FTE HR-to-Employee Ratio HR Expenses Annual Salary Increase Time-to-Fill Cost-per-Hire Annual Overall Turnover Rate Annual Voluntary Turnover Rate HR Expense to FTE Ratio Areas of HR Outsourcing Revenue per FTE HR-to-Employee Ratio HR Expenses Annual Salary Increase Time-to-Fill Cost-per-Hire Annual Overall Turnover Rate Annual Vol-untary Turnover Rate HR Expense to FTE Ratio Areas of HR Outsourcing Revenue per FTE HR-to-Employee Ratio HR Expenses Annual Salary Increase Time-to-Fill Cost-per-Hire Annual Overall Turn-over Rate Annual Voluntary Turnover Rate HR Expense to FTE Ratio Areas of HR Outsourcing Rev-enue per FTE HR-to-Employee Ratio HR Expenses Annual Salary Increase Time-to-Fill Cost-per-Hire Annual Overall Turnover Rate Annual Voluntary Turnover Rate HR Expense to FTE Ratio Areas of HR Outsourcing Revenue per FTE HR-to-Employee Ratio HR Expenses Annual Salary Increase Time-to-Fill Cost-per-Hire Annual Overall Turnover Rate Annual Voluntary Turnover Rate HR Expense to FTE Ratio Areas of HR Outsourcing Revenue per FTE HR-to-Employee Ratio HR Expenses Annual Salary Increase Time-to-Fill Cost-per-Hire Annual Overall Turnover Rate Annual Voluntary Turnover Rate HR Expense to FTE Ratio Areas of HR Outsourcing Revenue per FTE HR-to-Employee Ratio HR Expenses Annual Salary Increase Time-to-Fill Cost-per-Hire Annual Overall Turnover Rate Annual Voluntary Turnover Rate HR Expense to FTE Ratio Areas of HR Outsourcing Revenue per FTE HR-to-Employee Ratio HR Expenses Annual Salary Increase Time-to-Fill Cost-per-Hire Annual Overall Turnover Rate Annual Voluntary Turnover Rate HR Expense to FTE Ratio Areas of HR Outsourcing Revenue per FTE HR-to-Employee Ratio HR Expenses Annual Salary Increase Time-to-Fill Cost-per-Hire Annual Overall Turnover Rate Annual Voluntary Turnover Rate HR Expense to FTE Ratio Areas of HR Outsourcing Revenue per FTE HR-to-Employee Ratio HR Expenses Annual Salary Increase Time-to-Fill Cost-per-Hire Annual Overall Turnover Rate Annual Voluntary Turnover Rate HR Expense to FTE Ratio Areas of HR Outsourcing Revenue per FTE HR-to-Employee Ratio HR Expenses Annual Salary Increase Time-to-Fill Cost-per-Hire Annual Overall Turnover Rate Annual Voluntary Turnover Rate HR Expense to FTE Ratio Areas of HR Outsourcing Revenue per FTE HR-to-Employee Ratio HR Expenses Annual Salary Increase Time-to-Fill Cost-per-Hire Annual Overall Turnover Rate Annual Voluntary Turnover Rate HR Expense to FTE Ratio Areas of HR Outsourcing
SHRM® Human CapitalCustomizedBenCHmarkingRepoRt
www.shrm.org/benchmarks
Total Annual Health Care Cost per Covered Employee Number and Types of Health Care Plans Of-fered Monthly Premium Employer Pays for Employee-Only Coverage Waiting Period in Months for Coverage for New Employees Amount of Specific Stop-Loss (SSL) Coverage Annual Out-of-Network Deductible for Employee-Only Coverage Co-pay for In-Network Primary Care Office Visits for Employ-ee-Only Coverage Employer Contribution to Health Savings Account Total Annual Health Care Cost per Covered Employee Number and Types of Health Care Plans Offered Monthly Premium Employer Pays for Employee-Only Coverage Waiting Period in Months for Coverage for New Employees Amount of Specific Stop-Loss (SSL) Coverage Annual Out-of-Network Deductible for Employee-Only Cover-age Co-pay for In-Network Primary Care Office Visits for Employee-Only Coverage Employer Contri-bution to Health Savings Account Total Annual Health Care Cost per Covered Employee Number and Types of Health Care Plans Offered Monthly Premium Employer Pays for Employee-Only Coverage Waiting Period in Months for Coverage for New Employees Amount of Specific Stop-Loss (SSL) Cov-erage Annual Out-of-Network Deductible for Employee-Only Coverage Co-pay for In-Network Primary Care Office Visits for Employee-Only Coverage Employer Contribution to Health Savings Account Total Annual Health Care Cost per Covered Employee Number and Types of Health Care Plans Of-fered Monthly Premium Employer Pays for Employee-Only Coverage Waiting Period in Months for Coverage for New Employees Amount of Specific Stop-Loss (SSL) Coverage Annual Out-of-Network Deductible for Employee-Only Coverage Co-pay for In-Network Primary Care Office Visits for Employ-ee-Only Coverage Employer Contribution to Health Savings Account Total Annual Health Care Cost per Covered Employee Number and Types of Health Care Plans Offered Monthly Premium Employer Pays for Employee-Only Coverage Waiting Period in Months for Coverage for New Employees Amount of Specific Stop-Loss (SSL) Coverage Annual Out-of-Network Deductible for Employee-Only Cover-age Co-pay for In-Network Primary Care Office Visits for Employee-Only Coverage Employer Contri-bution to Health Savings Account Total Annual Health Care Cost per Covered Employee Number and Types of Health Care Plans Offered Monthly Premium Employer Pays for Employee-Only Coverage Waiting Period in Months for Coverage for New Employees Amount of Specific Stop-Loss (SSL) Cov-erage Annual Out-of-Network Deductible for Employee-Only Coverage Co-pay for In-Network Primary Care Office Visits for Employee-Only Coverage Employer Contribution to Health Savings Account Total Annual Health Care Cost per Covered Employee Number and Types of Health Care Plans Of-fered Monthly Premium Employer Pays for Employee-Only Coverage Waiting Period in Months for Coverage for New Employees Amount of Specific Stop-Loss (SSL) Coverage Annual Out-of-Network Deductible for Employee-Only Coverage Co-pay for In-Network Primary Care Office Visits for Employ-ee-Only Coverage Employer Contribution to Health Savings Account
SHRM® HealtH Care Customized BenCHmarking RepoRt
www.shrm.org/benchmarks
Percentage of Traditional Final Average Pension Percentage of Traditional Career Average Pension Length of Cliff Vesting Period 401(k) Employer Match 401(k), 403(b) or Similar Prevalence Rates Percentage of Organizations Providing Employer Contribution Graded Vesting Period Cliff Vesting Period Percentage of Organizations Providing Retiree Health Care Percentage of Traditional Final Average Pension Percentage of Traditional Career Average Pension Length of Cliff Vesting Period 401(k) Employer Match 401(k), 403(b) or Similar Prevalence Rates Percentage of Organizations Providing Employer Contribution Graded Vesting Period Cliff Vesting Period Percentage of Organiza-tions Providing Retiree Health Care Percentage of Traditional Final Average Pension Percentage of Traditional Career Average Pension Length of Cliff Vesting Period 401(k) Employer Match 401(k), 403(b) or Similar Prevalence Rates Percentage of Organizations Providing Employer Contribution Graded Vesting Period Cliff Vesting Period Percentage of Organizations Providing Retiree Health Care Percentage of Traditional Final Average Pension Percentage of Traditional Career Average Pen-sion Length of Cliff Vesting Period 401(k) Employer Match 401(k), 403(b) or Similar Prevalence Rates Percentage of Organizations Providing Employer Contribution Graded Vesting Period Cliff Vesting Period Percentage of Organizations Providing Retiree Health Care Percentage of Traditional Final Average Pension Percentage of Traditional Career Average Pension Length of Cliff Vesting Period 401(k) Employer Match 401(k), 403(b) or Similar Prevalence Rates Percentage of Organiza-tions Providing Employer Contribution Graded Vesting Period Cliff Vesting Period Percentage of Or-ganizations Providing Retiree Health Care Percentage of Traditional Final Average Pension Percent-age of Traditional Career Average Pension Length of Cliff Vesting Period 401(k) Employer Match 401(k), 403(b) or Similar Prevalence Rates Percentage of Organizations Providing Employer Contri-bution Graded Vesting Period Cliff Vesting Period Percentage of Organizations Providing Retiree Health Care Percentage of Traditional Final Average Pension Percentage of Traditional Career Aver-age Pension Length of Cliff Vesting Period 401(k) Employer Match 401(k), 403(b) or Similar Preva-lence Rates Percentage of Organizations Providing Employer Contribution Graded Vesting Period Cliff Vesting Period Percentage of Organizations Providing Retiree Health Care Percentage of Tradi-tional Final Average Pension Percentage of Traditional Career Average Pension Length of Cliff Vest-ing Period 401(k) Employer Match 401(k), 403(b) or Similar Prevalence Rates Percentage of Orga-nizations Providing Employer Contribution Graded Vesting Period Cliff Vesting Period Percentage of Organizations Providing Retiree Health Care Percentage of Traditional Final Average Pension Per-centage of Traditional Career Average Pension Length of Cliff Vesting Period 401(k) Employer Match 401(k), 403(b) or Similar Prevalence Rates Percentage of Organizations Providing Employer Contribution Graded Vesting Period Cliff Vesting Period Percentage of Organizations Providing Re-tiree Health Care
SHRM® retirement & Welfare Customized BenCHmarking RepoRt
www.shrm.org/benchmarks
www.shrm.org/benchmarks
SHRM® JOB SatiSfaCtiOn AND emPloYee eNGaGemeNt Customized BenCHmarking RepoRt
www.shrm.org/benchmarks
SHRM® familieS and WOrk inStitute’S WorkPlaCe effeCtiveneSS & flexiBility Customized BenCHmarking RepoRt
Percentage of organizations offering a PTO plan Percentage of organizations offering paid vacation to part-time employees Number of paid sick days advanced to newly hired full-time employees Per-centage of organizations with paid personal leave accrual by �scal year Number of paid holidays per year for full-time employees Percentage of organizations offering paid bereavement leave to full-time employees Maximum number of paid sabbatical days available to eligible employees Percent-age of organizations offering paid military leave Percentage of organizations offering paid maternity leave Percentage of organizations offering a PTO plan Percentage of organizations offering paid va-cation to part-time employees Number of paid sick days advanced to newly hired full-time employ-ees Percentage of organizations with paid personal leave accrual by �scal year Number of paid holi-days per year for full-time employees Percentage of organizations offering paid bereavement leave to full-time employees Maximum number of paid sabbatical days available to eligible employees Percentage of organizations offering paid military leave Percentage of organizations offering paid maternity leave Percentage of organizations offering a PTO plan Percentage of organizations offer-ing paid vacation to part-time employees Number of paid sick days advanced to newly hired full-time employees Percentage of organizations with paid personal leave accrual by �scal year Number of paid holidays per year for full-time employees Percentage of organizations offering paid bereave-ment leave to full-time employees Maximum number of paid sabbatical days available to eligible employees Percentage of organizations offering paid military leave Percentage of organizations of-fering paid maternity leave Percentage of organizations offering a PTO plan Percentage of organiza-tions offering paid vacation to part-time employees Number of paid sick days advanced to newly hired full-time employees Percentage of organizations with paid personal leave accrual by �scal year Number of paid holidays per year for full-time employees Percentage of organizations offering paid bereavement leave to full-time employees Maximum number of paid sabbatical days available to eligible employees Percentage of organizations offering paid military leave Percentage of organi-zations offering paid maternity leave Percentage of organizations offering a PTO plan Percentage of organizations offering paid vacation to part-time employees Number of paid sick days advanced to newly hired full-time employees Percentage of organizations with paid personal leave accrual by �scal year Number of paid holidays per year for full-time employees Percentage of organizations of-fering paid bereavement leave to full-time employees Maximum number of paid sabbatical days available to eligible employees Percentage of organizations offering paid military leave Percentage of organizations offering paid maternity leave Percentage of organizations offering a PTO plan
www.shrm.org/benchmarks
SHRM® pAID LeAVe Customized BenCHmarking RepoRt
Health and Welfare Benefits Preventive Health and Wellness Benefits Retirement Savings and Planning Benefits Financial and Compensation Benefits Leave Benefits Family-friendly Benefits Flexible Working Benefits Personal Services Benefits Housing and Relocation Benefits Business Travel Benefits Health and Welfare Benefits Preventive Health and Wellness Benefits Retirement Savings and Planning Benefits Financial and Compensation Benefits Leave Benefits Family-friendly Benefits Flexible Working Benefits Personal Services Benefits Housing and Relocation Benefits Business Travel Benefits Health and Welfare Benefits Preventive Health and Wellness Benefits Retirement Savings and Planning Benefits Financial and Compensation Benefits Leave Benefits Family-friendly Benefits Flexible Working Benefits Personal Services Benefits Housing and Relocation Benefits Business Travel Benefits Health and Welfare Benefits Preventive Health and Wellness Benefits Retirement Savings and Planning Benefits Financial and Compensation Benefits Leave Benefits Family-friendly Benefits Flexible Working Benefits Personal Services Benefits Housing and Relocation Benefits Business Travel Benefits Health and Welfare Benefits Preventive Health and Wellness Benefits Retirement Savings and Planning Benefits Financial and Compensation Benefits Leave Benefits Family-friendly Benefits Flexible Working Benefits Personal Services Benefits Housing and Relocation Benefits Business Travel Benefits Health and Welfare Benefits Preventive Health and Wellness Benefits Retirement Savings and Planning Benefits Financial and Compensation Benefits Leave Benefits Family-friendly Benefits Flexible Working Benefits Personal Services Benefits Housing and Relocation Benefits Business Travel Benefits Health and Welfare Benefits Preventive Health and Wellness Benefits Retirement Savings and Planning Benefits Financial and Compensation Benefits Leave Benefits Family-friendly Benefits Flexible Working Benefits Personal Services Benefits Housing and Relocation Benefits Business Travel Benefits Health and Welfare Benefits Preventive Health and Wellness Benefits Retirement Savings and Planning Benefits Financial and Compensation Benefits Leave Benefits Family-friendly Benefits Flexible Working Benefits Personal Services Benefits Housing and Relocation Benefits Business Travel Benefits Health and Welfare Benefits Preventive Health and Wellness Benefits Retirement Savings and Planning Benefits Financial and Compensation Benefits Leave Benefits Family-friendly Benefits Flexible Working Benefits Personal Services Benefits Housing and Relocation Benefits Business Travel Benefits Health and Welfare Benefits Preventive Health and Wellness Benefits Retirement Savings and Planning Benefits Financial and Compensation Benefits Leave Benefits Family-friendly Benefits Flexible Working Benefits Personal Services Benefits Housing and Relocation Benefits Business Travel Benefits Health and Welfare Benefits Preventive Health and Wellness Benefits Retirement Savings and Planning Benefits Financial and Compensation Benefits Leave Benefits Family-friendly Benefits Flexible Working Benefits Personal Services Benefits Housing and Relocation Benefits Business Travel Benefits
SHRM® eMpLoYee BENEFITS PreValeNCe Customized BenCHmarking RepoRt
www.shrm.org/benchmarks
1800 Duke StreetAlexandria, VA 22314USA
9 781586 443719
ISBN 978-1-586-44371-9
SHRM Store #: 62.27056$199.95 nonmember | $99.95 member
And we’ll do all the legwork.
You’ve implemented strategies to attract and keep the best employees. Now fi nd out
what truly MOTIVATES your workforce. PEOPLE
INSIGHT
SHRM®
An Employee Job Satisfaction & Engagement Survey Service
To schedule a brief demo or to order now, contact us at:
shrm.org/peopleinsight � � | � +1.703.535.6295 � | � � [email protected]
14-0028