employee job satisfaction and engagement survey
TRANSCRIPT

EMPLOYEE JOB SATISFACTION AND ENGAGEMENTRevitalizing a Changing Workforce
A R E S E A RCH R E P O R T B Y
T H E SOC I E T Y F O R H UMAN
R E SOU RC E M A N AG EM EN T
Founded in 1948, the Society for Human Resource
Management (SHRM) is the world’s largest HR
membership organization devoted to human resource
management. Representing more than 275,000
members in over 160 countries, the Society is the
leading provider of resources to serve the needs of HR
professionals and advance the professional practice
of human resource management. SHRM has more
than 575 aKliated chapters within the United States
and subsidiary oKces in China, India and United
Arab Emirates. Visit SHRM Online at shrm.org.
MEDIA CONTACT
Kate Kennedy
E-mail [email protected]
Phone + 1.703.535.6260
Vanessa Hill
E-mail [email protected]
Phone +1.703.535.6072
USA
SHRM Headquarters
Alexandria, VA 22314
Phone +1.800.283.7476
E-mail [email protected]
CHINA
Gateway Plaza
Chaoyang District
Beijing, 100027
Phone +86.10.59231033
E-mail [email protected]
INDIA
Gurgaon, Sector 26
Haryana 122002
Phone +91.12.44200243
E-mail [email protected]
UNITED ARAB EMIRATES
Dubai Knowledge Village
Dubai, UAE
Phone +971.050.104.6330
E-mail [email protected]
ONLINE
SHRM Online shrm.org
SHRM Research & Surveys
shrm.org/hr-today/trends-and-forecasting/research-and-surveys
SHRM Research on Twitter @SHRM_Research
SHRM Research on LinkedIn LinkedIn.com
SHRM Research on SHRM Connect
http://community.shrm.org/home
To order printed copies of this report, visit shrmstore.shrm.org or call 1-800-444-5006.
16-0060
EMPLOYEE JOB SATISFACTION AND ENGAGEMENTRevitalizing a Changing Workforce
A R E S E A RCH R E P O R T B Y
T H E SOC I E T Y F O R H UMAN
R E SOU RC E M A N AG EM EN T
REVITALIZING A CHANGING WORKFORCE | 1
2 About This Research Report4 Executive Summary
10 Millennials: Misunderstood in the Workplace?14 Employee Job Satisfaction: Career Development16 Opportunities to Use Skills/Abilities17 Career Advancement Opportunities18 Job-specific Training18 Organization’s Commitment to Professional
Development18 Career Development Opportunities19 Company-paid General Training19 Networking Opportunities20 Employee Job Satisfaction: Compensation and Benefits21 Compensation/Pay22 Benefits26 Employee Job Satisfaction: Employee Relationships
with Management28 Respectful Treatment of All Employees at All Levels28 Trust Between Employees and Senior Management28 Relationship with Immediate Supervisor28 Immediate Supervisor’s Respect for Employees’ Ideas28 Communication Between Employees and Senior
Management29 Management’s Recognition of Employee Job
Performance29 Autonomy and Independence29 Management’s Communication of Organization’s
Goals and Strategies
30 Employee Job Satisfaction: Work Environment32 Job Security32 Organization’s Financial Stability32 Feeling Safe in the Work Environment32 The Work Itself32 Overall Corporate Culture33 Meaningfulness of the Job33 Teamwork Within Department/Business Unit33 Relationship with Co-workers33 Contribution of Work to Organization’s Business Goals33 Teamwork Between Departments/Business Units34 Communication Between Departments/Business Units34 Variety of Work34 Organization’s Commitment to Corporate Social
Responsibility34 Organization’s Commitment to a Diverse and Inclusive
Workforce35 Organization’s Commitment to a “Green” Workplace36 Employee Engagement37 Conditions for Engagement38 Engagement Opinions40 Engagement Behaviors42 Conclusions44 Methodology48 Appendix60 Endnotes62 Additional SHRM Resources
CONTENTS

2 | EMPLOYEE JOB SATISFACTION AND ENGAGEMENT
ABOUT THIS RESEARCH REPORT

REVITALIZING A CHANGING WORKFORCE | 3
The following report represents the findings from the SHRM Employee Job Satisfaction and Engagement Survey of 600 U.S. employees, conducted in November-December 2015. The purpose of the annual employee survey is to identify factors that influence overall employee satisfaction and engagement in the workplace. This information will provide insight on employee preferences and highlight key areas for organizations to consider as they develop and enhance initiatives for organizational improvement.
The survey assessed 43 aspects of employee job satisfaction and 37 aspects of employee engagement. Each year the aspects are examined and modified, if necessary. The aspects are categorized into the following eight areas:
The overall findings are explained in text and through supporting visual references. Analysis by trend data, demographic variables and other variables can be found in the Appendix. The research objectives of this report are to provide the following information:
CAREER DEVELOPMENT
COMPENSATION
BENEFITS
EMPLOYEE RELATIONSHIPS WITH MANAGEMENT
WORK ENVIRONMENT
CONDITIONS FOR ENGAGEMENT
ENGAGEMENT OPINIONS
ENGAGEMENT BEHAVIORS
• An analysis of the importance of various contributors to employee job satisfaction, including statistically significant differences.
• An analysis of the relationship between employee satisfaction levels of job satisfaction contributors.
• A rating of the top five contributors to overall employee job satisfaction by demographic variables, including employee gender, age and job level.
• An analysis of employee engagement through an engagement index computation.
• Additional analyses by demographics, including employee gender, age and job level.

4 | EMPLOYEE JOB SATISFACTION AND ENGAGEMENT
FIGURE 1
EMPLOYEE JOB SATISFACTION 2005 - 2015
Note: Figure represents respondents who indicated they where “somewhat satisfied” or “very satisfied” with their current job. Percentages are based on a scale where 1 = “very dissatisfied” and 5 = “very satisfied.” “Neutral/Neither satisfied nor dissatisfied” were excluded from this analysis.
Source: Employee Job Satisfaction and Engagement (SHRM, 2016)
77%
80%79%
82%
86%
84%83%
81% 81%
86%
88%
2005 (n = 600)
2006 (n = 604)
2007 (n = 604)
2008 (n = 601)
2009 (n = 602)
2010 (n = 605)
2011 (n = 596)
2012 (n = 600)
2013 (n = 600)
2014 (n = 600)
2015 (n = 517)

REVITALIZING A CHANGING WORKFORCE | 5
This year presents the greatest proportion of employees satisfied with their current job since SHRM first administered the Employee Job Satisfaction Survey in 2002.
EXECUTIVE SUMMARY
OF U.S. EMPLOYEES REPORTED OVERALL SATISFACTION WITH THEIR CURRENT
JOB, MARKING THE HIGHEST LEVEL OF SATISFACTION OVER THE LAST 10 YEARS.
FIGURE 2
SATISFACTION WITH CURRENT JOB AND ORGANIZATION
FIGURE 3
LIKELIHOOD OF LOOKING FOR A JOB OUTSIDE CURRENT ORGANIZATION IN THE NEXT 12 MONTHS
88%
In 2015, 88% of U.S. employees reported they were
satisfied with their job overall, with 37% reporting
they were very satisfied and 51% reporting they
were somewhat satisfied. This percentage marks the
highest level of satisfaction over the last 10 years.
Since 2013, the percentage of satisfied employees
has been trending upward. Nevertheless, it is evident
that a larger portion of employees are satisfied only
to a certain extent, which signals the possibility for
improvement. Similar attitudes were found with
satisfaction toward employers: 45% indicated being
somewhat satisfied and 40% indicated being very
satisfied with their organization.
Not surprisingly, as the economy has remained
relatively stable over the last couple of years,
organizations may have found themselves being
able to reintroduce incentives and perks that had
been reduced or eliminated as a result of the Great
Recession. Conversely, employees have more flexibility
to seek out employment opportunities that better
fit their needs and wants rather than remain in a
position for its job security. Forty-five percent of
employees reported that they would be likely or very
likely to look for other jobs outside their current
organization within the next year.
Note: n = 517-521. Figure represents respondents who indicated they were “somewhat satisfied” or “very satisfied” with their current job or organization. Percentages are based on a scale where 1 = “very dissatisfied” and 5 = “very satisfied.” “Neutral/Neither satisfied nor dissatisfied” were excluded from this analysis.
Source: Employee Job Satisfaction and Engagement (SHRM, 2016)
Note: n = 583-600.
Source: Employee Job Satisfaction and Engagement (SHRM, 2016)
Unlikely
2015 2014 2013
Current Job Current Organization
28% 27%29% 32%22% 23% 22%
5%
37%
4%
40%51%
45%
7% 10%
22% 21%17%
27% 29%
Very unlikely Likely Very likely
6 | EMPLOYEE JOB SATISFACTION AND ENGAGEMENT
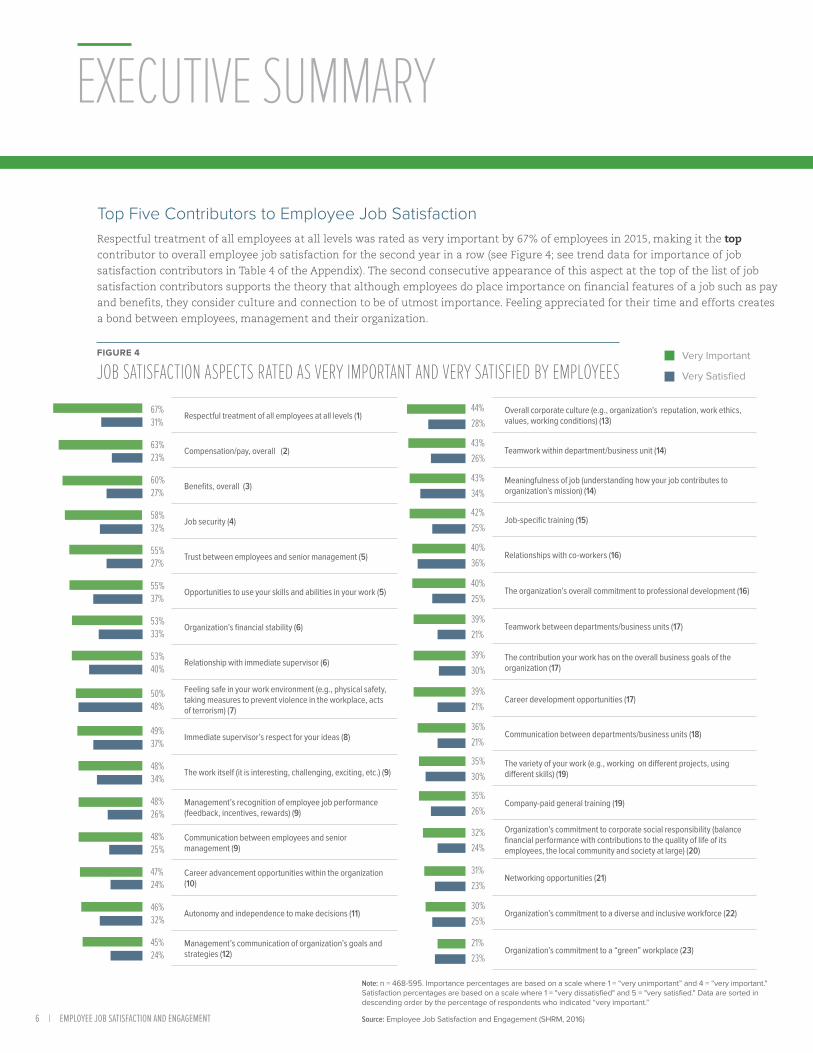
Top Five Contributors to Employee Job SatisfactionRespectful treatment of all employees at all levels was rated as very important by 67% of employees in 2015, making it the top
contributor to overall employee job satisfaction for the second year in a row (see Figure 4; see trend data for importance of job
satisfaction contributors in Table 4 of the Appendix). The second consecutive appearance of this aspect at the top of the list of job
satisfaction contributors supports the theory that although employees do place importance on financial features of a job such as pay
and benefits, they consider culture and connection to be of utmost importance. Feeling appreciated for their time and efforts creates
a bond between employees, management and their organization.
EXECUTIVE SUMMARY
Very Important
Very Satisfied
Note: n = 468-595. Importance percentages are based on a scale where 1 = “very unimportant” and 4 = “very important." Satisfaction percentages are based on a scale where 1 = "very dissatisfied" and 5 = "very satisfied." Data are sorted in descending order by the percentage of respondents who indicated “very important.”
Source: Employee Job Satisfaction and Engagement (SHRM, 2016)
44%
28%Overall corporate culture (e.g., organization’s reputation, work ethics, values, working conditions) (13)
43%
26%Teamwork within department/business unit (14)
43%
34%Meaningfulness of job (understanding how your job contributes to organization’s mission) (14)
42%
25%Job-specific training (15)
40%
36%Relationships with co-workers (16)
40%
25%The organization’s overall commitment to professional development (16)
39%
21%Teamwork between departments/business units (17)
39%
30%The contribution your work has on the overall business goals of the organization (17)
39%
21%Career development opportunities (17)
36%
21%Communication between departments/business units (18)
35%
30%The variety of your work (e.g., working on different projects, using different skills) (19)
35%
26%Company-paid general training (19)
32%
24%
Organization’s commitment to corporate social responsibility (balance financial performance with contributions to the quality of life of its employees, the local community and society at large) (20)
31%
23%Networking opportunities (21)
30%
25%Organization’s commitment to a diverse and inclusive workforce (22)
21%
23%Organization’s commitment to a “green” workplace (23)
67% 31%
Respectful treatment of all employees at all levels (1)
63% 23%
Compensation/pay, overall (2)
60% 27%
Benefits, overall (3)
58% 32%
Job security (4)
55% 27%
Trust between employees and senior management (5)
55% 37%
Opportunities to use your skills and abilities in your work (5)
53% 33%
Organization’s financial stability (6)
53% 40%
Relationship with immediate supervisor (6)
50% 48%
Feeling safe in your work environment (e.g., physical safety, taking measures to prevent violence in the workplace, acts of terrorism) (7)
49% 37%
Immediate supervisor’s respect for your ideas (8)
48% 34%
The work itself (it is interesting, challenging, exciting, etc.) (9)
48% 26%
Management’s recognition of employee job performance (feedback, incentives, rewards) (9)
48% 25%
Communication between employees and senior management (9)
47% 24%
Career advancement opportunities within the organization (10)
46% 32%
Autonomy and independence to make decisions (11)
45% 24%
Management’s communication of organization’s goals and strategies (12)
FIGURE 4
JOB SATISFACTION ASPECTS RATED AS VERY IMPORTANT AND VERY SATISFIED BY EMPLOYEES
REVITALIZING A CHANGING WORKFORCE | 7
At 63%, overall compensation/pay was the second most important
contributor to job satisfaction, jumping from the fourth position in 2014. This
aspect has held a spot within the leading five job satisfaction contributors
since 2002, when SHRM first began administering its Job Satisfaction Survey.
Overall benefits were the third most important job satisfaction contributor,
with 60% of employees rating it as very important. Similar to compensation/
pay, benefits have also been among the top five contributors to job satisfaction
since in 2002, with the exception of 2012. Moving from the fifth position in
2014 to fourth in 2015 was job security, with 58% of employees citing it as
very important to their job satisfaction; this aspect has moved around the five
principal job satisfaction influencers since 2002.
It is undeniable that compensation/pay, benefits and job security all shape
the degree to which employees are satisfied; however, it is also noteworthy to
mention that the extent of their importance fluctuates as a result of external
factors such as changing economic conditions. Organizations may need to
tailor their retention and recruitment strategies around multiple elements,
creating a total rewards program. Relying solely on an individual aspect may
make their approach less effective or even outdated as dynamics quickly shift.
EXECUTIVE SUMMARY
The fifth leading job satisfaction contributor
in 2015 was a tie between two aspects:
opportunities to use skills and abilities, and trust
between employees and senior management.
Just over one-half (55%) of employees rated these
workplace features as very important to their
job satisfaction. Not surprisingly, employees
indicated that they want chances to demonstrate
their talents. This trend was especially visible
when job mobility and growth were static;
however, even as employment opportunities
expand, employees are noting the importance
of fine-tuning their expertise. Although trust
between employees and senior management
fell three spots, its presence within the leading
five job satisfaction contributors reveals that
employees value interpersonal relationships
and a workplace culture that fosters trust from
leadership.
RESPECTFUL TREATMENT OF ALL EMPLOYEES AT ALL LEVELS WAS RATED AS
VERY IMPORTANT BY EMPLOYEES IN 2015.67%
Compensation/pay was the second most important contributor to job
satisfaction, jumping from the fourth position in 2014.
63%
COMPENSATION/ PAY
ORGANIZATIONS MAY NEED TO TAILOR THEIR RETENTION AND RECRUITMENT STRATEGIES AROUND MULTIPLE ELEMENTS, CREATING A TOTAL REWARDS PROGRAM.
EXECUTIVE SUMMARY

8 | EMPLOYEE JOB SATISFACTION AND ENGAGEMENT
Top Aspects Contributing to Employee EngagementOn a scale of 1 to 5, with 1 being the least engaged and 5 being the most engaged, this research found employees to be moderately
engaged with an index of 3.8, relatively similar to prior years (3.7 in 2014 and 3.6 in 2013). Employee engagement may or may not
be aligned with employee job satisfaction, as engagement is tied to employees’ connection and commitment to their work and their
particular organization. Furthermore, while employee engagement levels indicate that employees appear to be moderately engaged,
this level of engagement may not be widespread throughout the entire organization, as employees in lower job levels appear to be
less engaged.
Employee engagement is typically defined by the actual conditions in the workplace (the environment and the work itself) and
workers’ opinions and behaviors (how the employees perceive their relationship with their work, as well as how they view others
around them relating to their work).
Employee engagement factors were also analyzed according to a variety of demographics, including gender, age and job level.
Statistically significant differences revealed from these analyses are shown in the Appendix.
EXECUTIVE SUMMARY
Conditions for Engagement
+ +
=
Engagement Opinions
Employee Engagement
77% Relationships with co-workers.
77% Opportunities to use skills and abilities.
76% Meaningfulness of their job.
89% I am confident I can meet my work goals.
86% I am determined to accomplish my work goals.
77% I have a clear understanding of my organization's vision/mission.
70% In my organization, employees are encouraged to take action when they see a problem or opportunity.
65% My colleagues quickly adapt to challenging or crisis situations.
64% The people in my work group never give up despite difficulties.
Employee Behaviors
FIGURE 5
EMPLOYEE ENGAGEMENT
Note: Top three employee engagement conditions, opinions and behaviors are shown.
Source: Employee Job Satisfaction and Engagement (SHRM, 2016)
REVITALIZING A CHANGING WORKFORCE | 9
What Do These Findings Mean for Organizations?Employees still value culture, but compensation is increasing in importance. There is some evidence that after an extended
period of wage stagnation, compensation is starting to
improve for more workers. But this trend is not widespread
and perhaps explains why more employees in 2015 ranked
overall compensation/pay as very important for determining
job satisfaction when compared with 2014. More than three out
of five (63%) respondents cited this factor in 2015, the highest
level since 2006 (67%). This also marked the second consecutive
year that respondents most frequently pointed to respectful
treatment of all employees at all levels as very important for
determining job satisfaction. Knowing this, HR professionals’
recruitment and retention strategies should be balanced
with competitive compensation and a workplace culture that
promotes respect.
Workers’ priorities are often similar across generations, but strategies should not reflect a one-size-fits-all approach. In what has become a challenging time for managing talent
of all levels, HR professionals are frequently leveraging their
organizations’ benefits as a means of recruiting and retaining
high-performing employees. The results from this survey show
that Millennials, members of Generation X and Baby Boomers
all place a high level of importance on overall benefits when
determining job satisfaction. However, they value a few other
aspects of their jobs differently. Millennials (88%) placed greater
importance on career development opportunities than Baby
Boomers did (76%), for example, and members of Generation
X (89%) more frequently cited organization’s commitment to
professional development as a contributor to job satisfaction
compared with Baby Boomers (79%). As the proportions of
Millennial and Baby Boomer workers in the labor force shift in
the future, HR professionals should be aware of different factors
that engage employees of all generations.
Employees want to feel valued and included. Employers
should encourage constant communication and feedback
among employees at all levels of the organization. Workers
of all career levels and generations place high value on
compensation- and benefit-related factors when determining
job satisfaction, but nonfinancial factors also weigh heavily
in employees’ satisfaction with their careers. At least half of
respondents to this survey found a variety of these factors to be
very important, including trust between employees and senior
management, relationship with immediate supervisor, and
feeling safe in the work environment. By fostering a workplace
environment that emphasizes communication, respect for
others and collaboration among workers at all levels, HR
professionals can expect higher levels of engagement from their
employees.
EXECUTIVE SUMMARY
WORKERS OF ALL CAREER LEVELS AND GENERATIONS PLACE HIGH VALUE ON COMPENSATION- AND BENEFIT-RELATED FACTORS WHEN DETERMINING JOB SATISFACTION, BUT NONFINANCIAL FACTORS ALSO WEIGH HEAVILY IN EMPLOYEES’ SATISFACTION WITH THEIR JOBS.
EXECUTIVE SUMMARY

10 | EMPLOYEE JOB SATISFACTION AND ENGAGEMENT
STEREOTYPES ABOUT MILLENNIALS OFTEN LEAD TO MISINTERPRETATIONS ABOUT THIS COHORT. THEIR CONFIDENCE AND IDEALISTIC AND AMBITIOUS OUTLOOK ARE FREQUENTLY MISTAKEN FOR ARROGANCE AND EGOTISM.
GIVEN TODAY’S ADVANCEMENTS, MILLENNIALS MAY BE ACHIEVING MILESTONES MORE QUICKLY THAN
THEIR GENERATIONAL COUNTERPARTS AND, THEREFORE, LESS WILLING TO STAY PUT FOR EXTENSIVE
PERIODS OF TIME WITHOUT PROMOTION.

REVITALIZING A CHANGING WORKFORCE | 11
The Millennial generation is frequently generalized as entitled,
lazy and self-centered. Given these stereotypes, it would not be
surprising to see these young workers as less satisfied with their
jobs. This research, however, found no statistically significant
differences in job satisfaction between generations. Overall,
88% of employees were satisfied with their job this year; 86% of
Millennials indicated the same. Similar percentages were reported
for Generation X (88%) and Baby Boomers (90%) (see Figure 6).
Stereotypes about Millennials often lead to misinterpretations
about this cohort.2 Their confidence and idealistic and ambitious
outlook are frequently mistaken for arrogance and egotism. Given
today’s advancements, Millennials may be achieving milestones
more quickly than their generational counterparts and, therefore,
less willing to stay put for extensive periods of time without
promotion. Arguably a bit impatient, Millennials are, in reality,
eager to contribute and want to be involved, but their attitude is
repeatedly frowned upon. For example, as found in this research,
younger workers want opportunities for development and self-
improvement, even if that means searching for employment
outside their current organization. Despite their determination,
typically seen as a positive attribute, society misconstrues
these shorter tenures as job-hopping, with the implication that
Millennials lack a sense of loyalty to their employer.
As a result of these perceptions, organizations develop initiatives
and programs to mitigate potential problems while working with
these younger staff. However, how effective are these efforts?
In fact, are they even addressing the correct issues? It is most
likely that this workplace tension is actually a result of various
factors and is falsely attributed to generational differences. Many
conflicts may be more a product of various life stages, career
stages or job levels.3 For instance, employees with children may
place a higher value on family-friendly benefits.
Moreover, this research indicates that there are not a lot of
distinctions between what factors each generation values and
the degree of satisfaction with these factors. Not surprisingly,
MILLENNIALS Misunderstood in the Workplace?
FIGURE 6
JOB SATISFACTION BY GENERATION
Overall Employees
Millennial Employees
Generation X Employees
Baby Boomer Employees
Note: n = 158-517. Figure represents respondents who indicated they were “somewhat satisfied” or “very satisfied” with their current job. Percentages are based on a scale where 1 = “very dissatisfied” and 5 = “very satisfied.” “Neutral/Neither satisfied nor dissatisfied” were excluded from this analysis.
Source: Employee Job Satisfaction and Engagement (SHRM, 2016)
At the time when more Baby Boomers begin to exit the workforce, a greater number of Millennials will enter the workforce. It is estimated that Millennial workers (those born between 1980 and 2000) will comprise one-half of the workforce by 2020.1

12 | EMPLOYEE JOB SATISFACTION AND ENGAGEMENT
Millennials placed more importance on
job-speci�c training, career development
opportunities and career advancement
opportunities contributing to their job
satisfaction compared with older generations
(see Figure 7). On the other hand, this research
revealed several differences among employees
from different job levels in their perceptions
of importance of and satisfaction with overall
compensation/pay, contribution of work to
organization’s business goals, variety of work
and other aspects (see Table 6, Table 11 and Table
17 in the Appendix).
Furthermore, these shifts in workplace demographics coincide with a
unique time period in the professional world.4 Maintaining “business as
usual” is anything but usual and is getting increasingly more dif�cult.
Some believe that the demand for a 24/7 environment is a Millennial
characteristic, but isn’t that a universal attitude? Largely on account of
access to and speed of the Internet and other evolving technology, we are
able to attain vast amounts of information and resources in mere moments.
Organizations must adjust to �t the changing business landscape,
externally and internally. Ful�lling consumers’ expectations and wants in a
real-time manner requires revision of systems and policies. Organizations
must also strive to be adaptable within their workplace to survive by
transitioning to continuous feedback instead of relying on solely a formal
performance review process and offering �exible work arrangements to
avoid business interruptions. The need to dispose of rigid procedures is a
re�ection of the changing business world rather than the integration of the
growing number of Millennial workers.
MILLENNIALS Misunderstood in the Workplace?
Source: Employee Job Satisfaction and Engagement (SHRM, 2016)
95%
88%89%
83%
76%73%
MILLENNIALS
MILLENNIALSMILLENNIALS
BABY BOOMERS
BABY BOOMERS
BABY BOOMERS
FIGURE 7
DIFFERENCES IN IMPORTANCE OF CAREER DEVELOPMENT ASPECTS BY GENERATION
Job-specific training
REVITALIZING A CHANGING WORKFORCE | 13
What Should Organizations Consider as Millennials Are Integrated into the Workforce? Stop the stereotypes. Getting rid of any preconceived notions about Millennials can avoid carrying forward inaccurate
perceptions about the group. Although Millennials may have slightly different mindsets, on the whole, they tend to place
significance on several of the same aspects of job satisfaction that Generation X and Baby Boomers do. Putting excessive
focus on generational differences only perpetuates these false impressions. When designing training and development
programs or benefits strategies, keep in mind other elements such as career level and life stage, not just age, to build an
approach that is appropriate for various groups of employees.
MILLENNIALS ARE LOOKING TO CREATE OUTCOMES WITHIN MEANINGFUL PROJECTS; DEVELOPING A BOND WITH THESE EMPLOYEES AND SHOWING CONFIDENCE THAT THEY CAN ACCOMPLISH OBJECTIVES WILL HELP KEEP THEM ENGAGED AND HOLD THEM ACCOUNTABLE IN ACHIEVING SET GOALS.
Develop and engage your talent. Given that the only generational
differences among job satisfaction contributors were within
the career development category, it is obvious that Millennials
believe managers and employers should nurture and invest in
them with the intention of advancing within their profession.
Millennials may become impatient with mundane tasks while
attempting to pursue their interest, thus it is important to provide
opportunities for them to be challenged with new tasks as they
have mastered others. Another approach to engage this generation
is to implement reverse mentoring: allowing Millennials to be
mentors as well as mentees. This strategy may provide this tech-
savvy and idealist group of employees an opportunity to display
their abilities, especially during a phase of transitioning business
conditions. Furthermore, this type of mentoring reinforces the
idea that everyone matters.
Cultivate culture. Value-centric Millennials typically place high
importance on openness, equality, community and purpose
(although, according to this research, all employees are looking for
these types of aspects). Transparency and fairness generate trust.
In addition, building an inclusive feel within the organization will
help establish an emotional connection between the employee
and the employer.
MILLENNIALS: MISUNDERSTOOD IN THE WORKPLACE?

14 | EMPLOYEE JOB SATISFACTION AND ENGAGEMENT
EMPLOYEE JOB SATISFACTION: CAREER DEVELOPMENT

REVITALIZING A CHANGING WORKFORCE | 15
Given the changes in the way organizations are operating and the shifting demographic
composition of the workforce, offering
career development opportunities to
employees could be extremely beneficial to
employers.
Informal and formal learning experiences can provide employees
with a more comprehensive skill set and reassurance that their
employer recognizes their value. Presented with new knowledge
and abilities, employees will be better prepared to handle new
technologies and innovations and may be able to contribute to
enhancing their organization’s systems and procedures.
Opportunities to use your skills and abilities in your work
Career advancement opportunities within the organization
Job-specific training
The organization’s overall commitment to professional development
Career development opportunities
Company-paid general training
Networking opportunities
Important
Very Important
Somewhat Satisfied
Very Satisfied
FIGURE 8
IMPORTANCE OF AND SATISFACTION WITH CAREER DEVELOPMENT ASPECTS
Note: n = 568-590. Importance percentages are based on a scale where 1 = “very unimportant” and 4 = “very important.” Satisfaction percentages are based on a scale where 1 = “very dissatisfied” and 5 = “very satisfied.” Data are sorted in descending order by the percentage of respondents who indicated “very important."
Source: Employee Job Satisfaction and Engagement (SHRM, 2016)
37% 55%
46% 40%
36% 47%
44% 39%
47% 42%
47% 35%
49% 31%
30% 40%37%
34%25%
33%24%
37%21%
37%25%
35%26%
36%23%
IMPORTANCE SATISFACTION
16 | EMPLOYEE JOB SATISFACTION AND ENGAGEMENT
Opportunities to Use Skills and AbilitiesMore than one-half (55%) of employees rated
opportunities to use their skills and abilities
at work as a very important contributor to
their job satisfaction. This aspect is tied at
number five with trust between employees
and senior management. Research indicates
that HR professionals are worried about the
potential mismatch between the skills required
to be successful in a role and the skills that
job candidates actually possess. In research
addressing the human capital challenges
in the coming decade, SHRM found that the
leading concerns among HR professionals
were developing the next generation of
organizational leaders (39%) and managing the
loss of key workers and their skill sets due to
retirement (35%).5 Given the anticipated skills
gap, career and professional development
is particularly important to employees and
employers alike. It is essential for organizations
to prepare not only for the influx of Millennial
workers and outflow of Baby Boomers, but also
for the changes in organizational operations as
a result of factors such as new technologies and
innovations. Investing in career development
opportunities for employees can be valuable
for all groups involved. Providing job training,
mentoring and other chances to enhance
employee learning can serve as a retention and
recruitment strategy.
Nearly eight out of 10 (77%) employees
indicated they were satisfied (responded
“somewhat satisfied” or “very satisfied”)
with this aspect. Similar to previous years,
opportunities to use skills and abilities held the
highest percentage of very satisfied employees
within the career development category. This
high level of satisfaction placed opportunities
to use skills and abilities at work second on
the list of factors contributing to employee
engagement.
FIGURE 9
REASONS EMPLOYEES STAY OR LEAVE THEIR CURRENT ORGANIZATION
Note: Percentages do not total 100% due to multiple response options.
Source: Employee Job Satisfaction and Engagement (SHRM, 2016)
Compensation/pay
Benefits
Career advancement opportunities
Job security
Meaningful work
Flexibility to balance work and life issues
Workplace stress
Location
Challenging work
Overall organizational culture
Opportunities for training and development
Relationship with immediate supervisor
Other
62%47%
30%30%
27%9%
24%23%
17%18%
16%34%
14%9%
12%15%
9%11%
7%8%
4%2%
4%12%
3%5%
Seek Job Outside (n = 270) Stay at Current Job (n = 330)
More than one-quarter (27%) of
employees who anticipate looking
for a new job outside of their
organization within the next year
reported better career advance-
ment opportunities as a reason for
the search, whereas among the
employees who said they would be
unlikely or very unlikely to explore
external employment options, only
9% noted career advancements as
motivation to remain with their cur-
rent employer. This sharp contrast
in percentages suggests that
organizations may need to improve
their efforts to promote employees
from within the organization.
27%
CAREER DEVELOPMENT
REVITALIZING A CHANGING WORKFORCE | 17
Career Advancement Opportunities Within OrganizationNearly one-half (47%) of employees reported that career
advancement opportunities within their organization were very
important to their job satisfaction, the same percentage as last
year. Over the past eight years, the percentage of employees
considering career advancement opportunities as very important
to their job satisfaction has risen by almost 20 percentage
points. Not surprisingly, Millennials and Gen Xers were more
likely than Baby Boomers to consider career advancement
opportunities as important job satisfaction contributors.
Professional nonmanagement employees were also more likely
than executives to think this aspect was important.
One-quarter (24%) of employees reported being very satisfied
and one-third (33%) were somewhat satisfied with the
opportunity for upward mobility in their organization. Middle-
management employees and executives were more likely to be
satisfied with career advancement opportunities compared with
employees at the nonexempt (hourly) nonmanagement level.
Employee retention is critical as turnover can inflict a huge
burden on organizations. Productivity loss during recruitment
and training of new employees has financial and operational
consequences for organizations that do not strive to reduce
turnover. SHRM’s 2015 Human Capital Benchmarking Report found
that the average voluntary turnover rate was 12%.6 Furthermore,
the report noted that the average cost-per-hire was $3,420,
an increase of 73% compared with 2010, and the average time
spent filling a position was 42 days, 15 more days than just five
years ago.
With an improved labor market and the economy, organizations
are making strides to retain top talent. Forty-five percent of
employees reported that it would be likely, to some degree, that
they would seek out job opportunities outside of their current
organization in the next 12 months. Of those employees who
anticipate looking for new employment options, more than one-
quarter (27%) reported better career advancement opportunities
as a reason for the search, whereas among the employees who
said they would be unlikely or very unlikely to explore outside
employment, only 9% noted career advancements as motivation
to remain with their current employer (see Figure 9). This sharp
contrast in percentages suggests that organizations may need
to improve their efforts to promote employees from within
the organization. Not only is it costly for employers to recruit
external candidates, but it may harbor animosity among current
employees. Always hiring outside applicants may imply that
existing employees are not qualified, incapable of succeeding in
the role or undeserving of a promotion. Mobility programs and
job enlargement are methods that organizations can implement
to boost engagement levels.
CAREER DEVELOPMENT
OVER THE PAST EIGHT YEARS, THE PERCENTAGE OF EMPLOYEES CONSIDERING CAREER ADVANCEMENT OPPORTUNITIES AS VERY IMPORTANT TO THEIR JOB SATISFACTION HAS RISEN BY ALMOST 20 PERCENTAGE POINTS. NOT SURPRISINGLY, MILLENNIALS AND GEN XERS WERE MORE LIKELY THAN BABY BOOMERS TO CONSIDER CAREER ADVANCEMENT OPPORTUNITIES AS IMPORTANT JOB SATISFACTION CONTRIBUTORS.
18 | EMPLOYEE JOB SATISFACTION AND ENGAGEMENT
Job-specific TrainingJob-specific training can help employees develop their talents,
empowering them to become more effective and engaged in
their roles. Employees’ expanded knowledge could lead to
enhanced organizational processes and increased productivity.
Forty-two percent of employees viewed job-specific training
as very important to their job satisfaction. Three-fifths (62%)
of employees indicated they were satisfied with job-specific
training at their organization. Female and Millennial employees
reported job-specific training to be more important to their
job satisfaction than did male and Baby Boomer employees,
respectively.
Organization’s Commitment to Professional DevelopmentExpanding and improving employees’ skills and knowledge
through professional development helps them master
their responsibilities in their current role. Professional
development can encompass various learning opportunities,
such as formal and informal training and attainment of
certifications or degrees. Organizations that dedicate a portion
of their budget to professional development send a message
that they invest in their employees. Additional benefits of
professional development include personal development and
greater opportunities for career advancement. Forty percent
of employees rated this aspect as very important to job
satisfaction. Generation X employees were more likely to report
their organization’s commitment to professional development
as very important to their job satisfaction compared with Baby
Boomers. Nearly three-fifths (59%) of respondents reported
being satisfied with their organization’s commitment to
professional development. Executives were more satisfied with
this aspect than were nonexempt (hourly) nonmanagement and
professional nonmanagement employees.
SHRM research on the strategic use of benefits found that
55% of organizations had difficulty recruiting highly skilled
employees; however, just two out of five (40%) respondents
had positively leveraged their organization’s benefits to recruit
these workers in the last 12 months, and approximately two-
fifths (39%) of them positively leveraged professional and career
development benefits.7 Slightly more than one-half (54%) of
organizations indicated they thought professional and career
development would become more important when recruiting
highly skilled employees in the next three to five years.
Engagement can be improved by attaining new knowledge and
skills; providing ways in which to do so can also help build trust
and commitment among employees.
Career Development OpportunitiesDeveloping career paths and ladders are two techniques that
can encourage employees to evolve in their profession. Whereas
career paths are typically seen as more horizontal movements
and career ladders are viewed as more vertical movements,
both options serve to help employees grow their skills and
knowledge and can lead to higher levels of engagement. Two-
fifths (39%) of employees, the same percentage as in 2014,
reported that career development opportunities were very
important to their overall job satisfaction, and 58% were
satisfied with this aspect in their current job. This element
was more important to Millennials than to workers in the
Baby Boom generation. Professional nonmanagement, middle-
management and executive employees were more likely to
report being satisfied with this aspect than were nonexempt
(hourly) nonmanagement employees.
Research found that the top advantages of older workers
(employees who are 55 or older) are their additional experience
(77%), maturity/professionalism (71%) and stronger work ethic
(70%).8 Although many believe that the loss of older workers
could potentially create a skills shortage, 34% of organizations
have not taken any steps to mitigate the issue. As organizations
prepare for the possible skills gap in the coming years, it is
critical to empower employees with the resources they need to
be successful in their roles.
One possible option to prevent a shortage of skilled workers
is to recruit younger workers to help fill positions left by the
exiting workforce. A recent SHRM survey found that one out
of five (20%) organizations had hired 2015 college graduates
to begin working after graduation, and 15% indicated they
CAREER DEVELOPMENT
REVITALIZING A CHANGING WORKFORCE | 19
CAREER DEVELOPMENT
had hired 2015 college graduates to begin working before
graduation.9 Forty-six percent of organizations had talent
development strategies or training programs that focused
on recent graduates and/or other employees with limited
work experience. These programs may help bridge the
anticipated skills gap.
Company-paid General TrainingThirty-five percent of employees felt that paid training
was very important to employee job satisfaction, and 61%
said they were satisfied with this aspect, an increase of
17 percentage points from 2013. The rise in satisfaction
may be a result of organizations returning training to
their lists of offered benefits after a period of shrinking
budgets during the Great Recession or a tool to retain or
recruit talented workers. Organizations that require their
employees to have advanced degrees or value higher
education in their culture may want to emphasize this
benefit to help attract talent.
THE 2015 EMPLOYEE BENEFITS RESEARCH REPORT INDICATED THAT ROUGHLY ONE-HALF OF ORGANIZATIONS OFFERED EDUCATIONAL ASSISTANCE BENEFITS: 56% OFFERED UNDERGRADUATE EDUCATIONAL ASSISTANCE, AND 52% OFFERED GRADUATE EDUCATIONAL ASSISTANCE.10
ACCORDING TO THE 2015 HUMAN CAPITAL BENCHMARKING REPORT, THE AVERAGE MAXIMUM REIMBURSEMENT ALLOWED FOR TUITION/EDUCATION EXPENSES IS $4,442, A DECREASE OF 11% FROM 2014.11
Networking OpportunitiesNetworking can be used to foster cross-functional and
collaborative skills with internal and external partners.
Thirty-one percent of employees felt that networking
opportunities were very important to their job satisfaction,
and 59% percent were satisfied with their opportunities to
network, an increase of seven percentage points since last
year. Although this aspect is ranked within the bottom five
contributors to job satisfaction, it has gained importance
over the years. One explanation for this growing trend may
be the vast improvements and accessibility of technology
and social media such as LinkedIn and Twitter. Executives
were more satisfied with opportunities for networking
compared with nonexempt (hourly) nonmanagement,
professional nonmanagement and middle-management
employees.
The use of social media for the purpose of recruiting and
screening job candidates has become increasingly popular.
The majority (84%) of organizations had used social media
as a recruitment tool, an increase of 28 percentage points
from 2011, according to recent research from SHRM.12
Another 9% of organizations indicated that although
they had never used this approach, they planned to use
it. Pursuing passive job candidates (82%) continues to be
the leading motivation behind recruiting via social media,
followed by increasing employer brand and recognition
(77%) and seeking out candidates with particular skill
sets (71%). This technique may be helpful to employers
in reaching out to candidates who may not have applied
otherwise and identifying potential applicants who could
meet the requirements of difficult-to-fill positions.
20 | EMPLOYEE JOB SATISFACTION AND ENGAGEMENT
EMPLOYEE JOB SATISFACTION: COMPENSATION AND BENEFITS
REVITALIZING A CHANGING WORKFORCE | 21
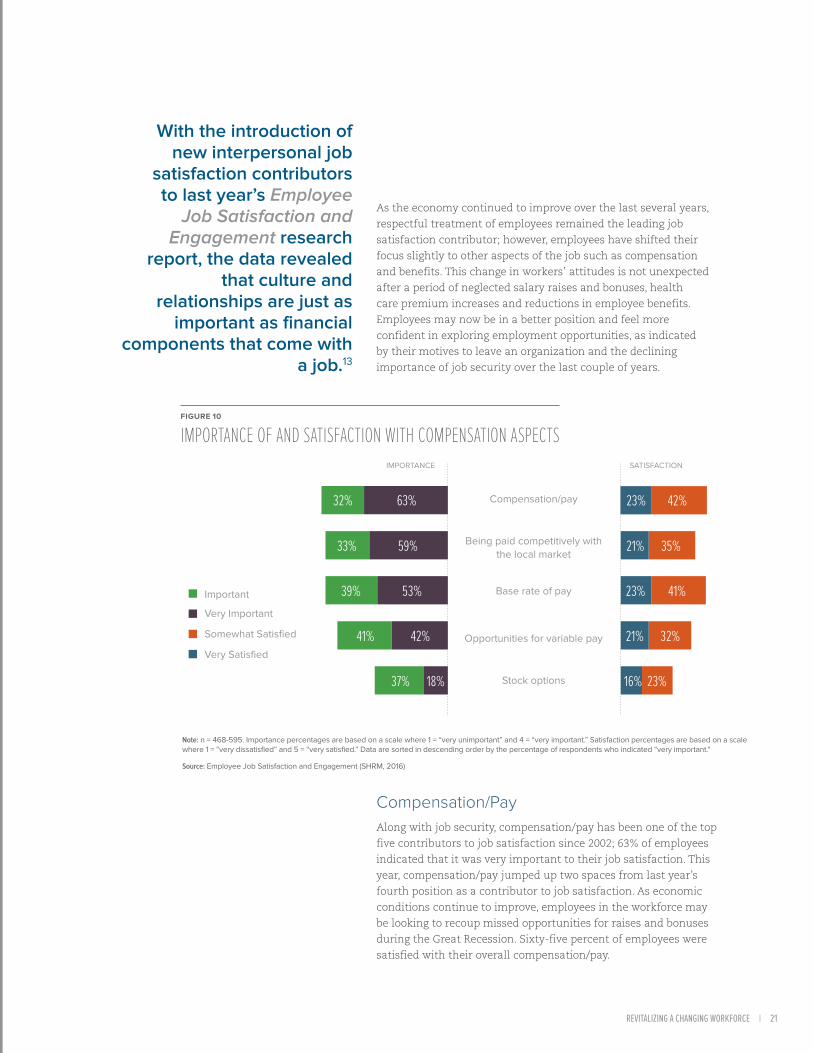
With the introduction of new interpersonal job
satisfaction contributors to last year’s Employee
Job Satisfaction and Engagement research
report, the data revealed that culture and
relationships are just as important as financial
components that come with a job.13
As the economy continued to improve over the last several years,
respectful treatment of employees remained the leading job
satisfaction contributor; however, employees have shifted their
focus slightly to other aspects of the job such as compensation
and benefits. This change in workers’ attitudes is not unexpected
after a period of neglected salary raises and bonuses, health
care premium increases and reductions in employee benefits.
Employees may now be in a better position and feel more
confident in exploring employment opportunities, as indicated
by their motives to leave an organization and the declining
importance of job security over the last couple of years.
Compensation/PayAlong with job security, compensation/pay has been one of the top
five contributors to job satisfaction since 2002; 63% of employees
indicated that it was very important to their job satisfaction. This
year, compensation/pay jumped up two spaces from last year’s
fourth position as a contributor to job satisfaction. As economic
conditions continue to improve, employees in the workforce may
be looking to recoup missed opportunities for raises and bonuses
during the Great Recession. Sixty-five percent of employees were
satisfied with their overall compensation/pay.
Compensation/pay
Being paid competitively with the local market
Base rate of pay
Opportunities for variable pay
Stock options
Important
Very Important
Somewhat Satisfied
Very Satisfied
Note: n = 468-595. Importance percentages are based on a scale where 1 = “very unimportant” and 4 = “very important.” Satisfaction percentages are based on a scale where 1 = “very dissatisfied” and 5 = “very satisfied.” Data are sorted in descending order by the percentage of respondents who indicated “very important."
Source: Employee Job Satisfaction and Engagement (SHRM, 2016)
FIGURE 10
IMPORTANCE OF AND SATISFACTION WITH COMPENSATION ASPECTS
32%
33%
39%
41%
37%
63%
59%
53%
42%
18%
32%21%
41%23%
35%21%
23%16%
42%23%
IMPORTANCE SATISFACTION
22 | EMPLOYEE JOB SATISFACTION AND ENGAGEMENT
In addition to overall compensation/pay, employees rated the
importance of four other common compensation factors that
contribute to job satisfaction:
• Being paid competitively with the local market: Nearly three-
fifths (59%) of employees viewed this aspect as very important
to job satisfaction, and 56% were satisfied with this factor.
Professional nonmanagement employees were more likely than
nonexempt (hourly) employees to view being paid competitively
with the local market as very important to their job satisfaction.
• Base rate of pay: One-half (53%) of employees rated this aspect
as very important to job satisfaction; 64% indicated they were
satisfied with this aspect. Generation X employees were more
likely to cite base rate of pay as an important contributor to
their job satisfaction compared with Baby Boomers.
• Opportunities for variable pay (e.g., bonuses, commissions,
other variable pay, monetary rewards for ideas or suggestions):
Roughly two-fifths (42%) of employees reported variable pay or
differential pay was very important to job satisfaction, and 53%
were satisfied with this factor.
• Stock options: Less than one-fifth (18%) of employees indicated
this aspect was very important to job satisfaction; about two-
fifths (39%) of employees whose organizations offered stock
options were satisfied with this benefit.
In January 2016, SHRM Leading Indicators of National
Employment® (LINE®) research signaled optimism in new-hire
compensation.14 In comparison with the previous year, the
rate of increase for new-hire compensation rose slightly in the
manufacturing sector and substantially in the service sector. Top
talent may soon be looking elsewhere for opportunities if they do
not feel like they are being adequately rewarded.
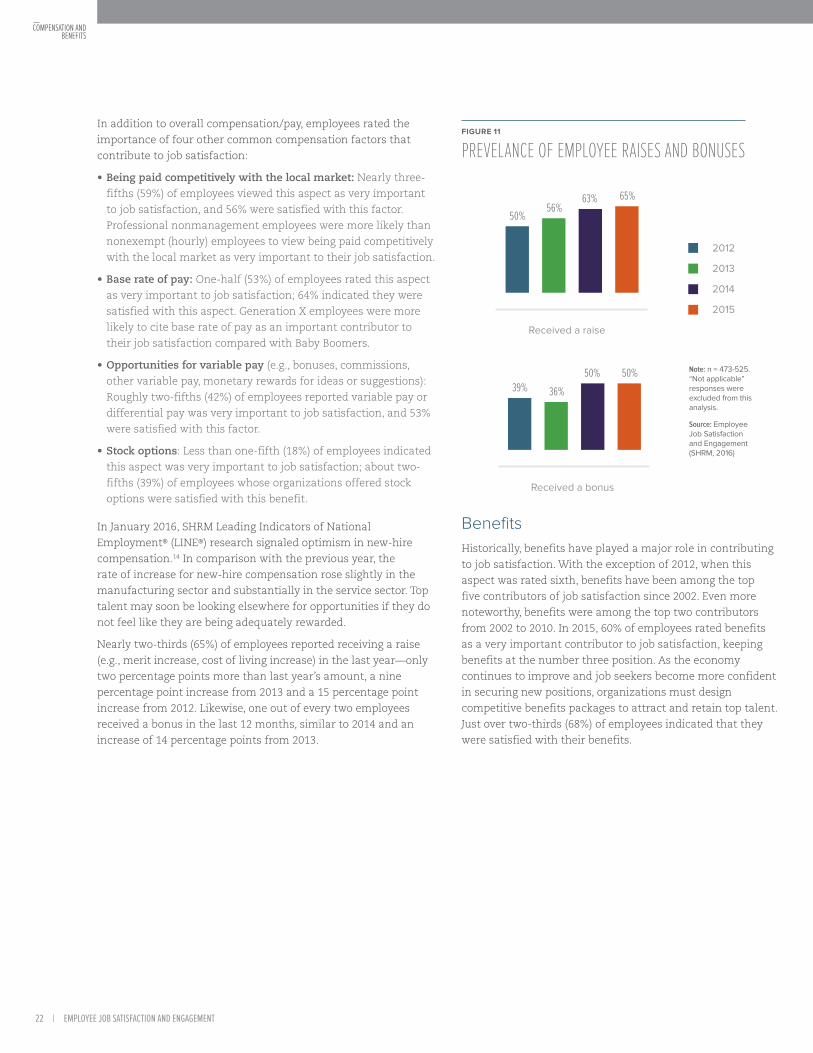
Nearly two-thirds (65%) of employees reported receiving a raise
(e.g., merit increase, cost of living increase) in the last year—only
two percentage points more than last year’s amount, a nine
percentage point increase from 2013 and a 15 percentage point
increase from 2012. Likewise, one out of every two employees
received a bonus in the last 12 months, similar to 2014 and an
increase of 14 percentage points from 2013.
BenefitsHistorically, benefits have played a major role in contributing
to job satisfaction. With the exception of 2012, when this
aspect was rated sixth, benefits have been among the top
five contributors of job satisfaction since 2002. Even more
noteworthy, benefits were among the top two contributors
from 2002 to 2010. In 2015, 60% of employees rated benefits
as a very important contributor to job satisfaction, keeping
benefits at the number three position. As the economy
continues to improve and job seekers become more confident
in securing new positions, organizations must design
competitive benefits packages to attract and retain top talent.
Just over two-thirds (68%) of employees indicated that they
were satisfied with their benefits.
Received a raise
Received a bonus
2012
2013
2014
2015
50%
39%
56%
36%
63%
50%
65%
50%
FIGURE 11
PREVELANCE OF EMPLOYEE RAISES AND BONUSES
Note: n = 473-525. “Not applicable” responses were excluded from this analysis.
Source: Employee Job Satisfaction and Engagement (SHRM, 2016)
COMPENSATION AND BENEFITS

REVITALIZING A CHANGING WORKFORCE | 23
In addition to the overall benefits package, employees were
asked about the importance of seven specific benefits to
overall job satisfaction. Importance and satisfaction data for
these aspects are as follows:
• Paid time off: Sixty-three percent of employees indicated
that paid time off was a very important contributor to job
satisfaction, and 71% of employees were satisfied with this
benefit at their organization.
• Health care/medical benefits: Slightly more than three-
fifths (62%) of employees reported health care/medical
benefits were very important, and 66% were satisfied with
this aspect of their benefits package.
• Flexibility to balance life and work issues: More than one-
half (53%) of employees reported work/life balance was very
important to their job satisfaction, the same percentage
as base rate of pay. Approximately two-thirds (65%) of
employees were satisfied with their work/life balance.
• Defined contribution plans: Nearly one-half (48%) of
employees rated defined contribution plans (e.g., 401(k),
403(b)) as very important to job satisfaction; two-thirds
(64%) indicated they were satisfied with their organization’s
defined contribution plan(s).
Note: n = 474-579. Importance percentages are based on a scale where 1 = “very unimportant” and 4 = “very important.” Satisfaction percentages are based on a scale where 1 = “very dissatisfied” and 5 = “very satisfied.” Data are sorted in descending order by the percentage of respondents who indicated “very important."
Source: Employee Job Satisfaction and Engagement (SHRM, 2016)
Important
Very Important
Somewhat Satisfied
Very Satisfied
Paid time off
Health care/medical benefits
Benefits, overall
Flexibility to balance life and work issues
Defined contribution plans
Family-friendly benefits
Defined benefit pension plan
Wellness programs
FIGURE 12
IMPORTANCE OF AND SATISFACTION WITH BENEFIT ASPECTS
30%30% 63%
37% 53%
30% 62%
41% 48%
32% 60%
40% 35%
42% 34%
42% 27%
38%33%
34%31%
37%29%
36%28%
41%27%
32%25%
28%23%
31%21%
• Family-friendly benefits: More than one-third (35%) of
employees indicated that family-friendly benefits (e.g., domestic
partnership benefits, subsidized child care, scholarships) were
very important to job satisfaction; almost three-fifths (57%) of
employees were satisfied with them.
• Defined benefit pension plans: Roughly one-third (34%)
of employees rated defined benefit pension plans as very
important to job satisfaction, and one-half (51%) of those with
access to a defined benefit pension plan were satisfied with it.
• Wellness programs: Almost one-quarter (27%) of employees
indicated that wellness programs were a very important
contributor to job satisfaction, and 52% of those whose
organizations offered wellness programs were satisfied with
them.
IMPORTANCE SATISFACTION
COMPENSATION AND BENEFITS
24 | EMPLOYEE JOB SATISFACTION AND ENGAGEMENT
SHRM’s 2015 Employee Benefits research report found that the
prevalence of these benefits varied greatly. For example, the
most common health care plan offered was a preferred provider
organization (PPO), at 85%.15 However, 43% of organizations
offered health savings accounts (HSAs), which have significantly
increased in popularity since 2011. As the cost of health care
continues to climb, organizations may shift to different types of
health care to offset the expenses.
Whereas nearly all organizations (98%) offered paid holidays,
roughly one-half (53%) of organizations offered a paid time off
(PTO) plan, which combines vacation, sick and personal time
into one plan and thereby allows employees to choose how
they spend their time off. Additionally, a greater number of
organizations offered the following types of leave benefits in
2015 compared with 2014: paid sick leave, paid family leave,
paid maternity leave, parental leave above federal FMLA leave
and parental leave above any state FMLA leave. A moderate
proportion of organizations offered various flexible work
benefits such as telecommuting (60%), flextime (54%) and shift
flexibility (21%). Far more organizations offered a traditional
401(k) or similar defined contribution retirement savings
plans (90%) than defined benefit pension plans (26%). Many
organizations did not offer a diverse array of family-friendly
benefits: 35% of organizations offered an onsite lactation/
mother’s room, 9% offered a child care referral service, and 1%
offered geriatric counseling. Additional detailed information
on benefits trends over the last five years can be found in the
SHRM 2015 Employee Benefits research report.16
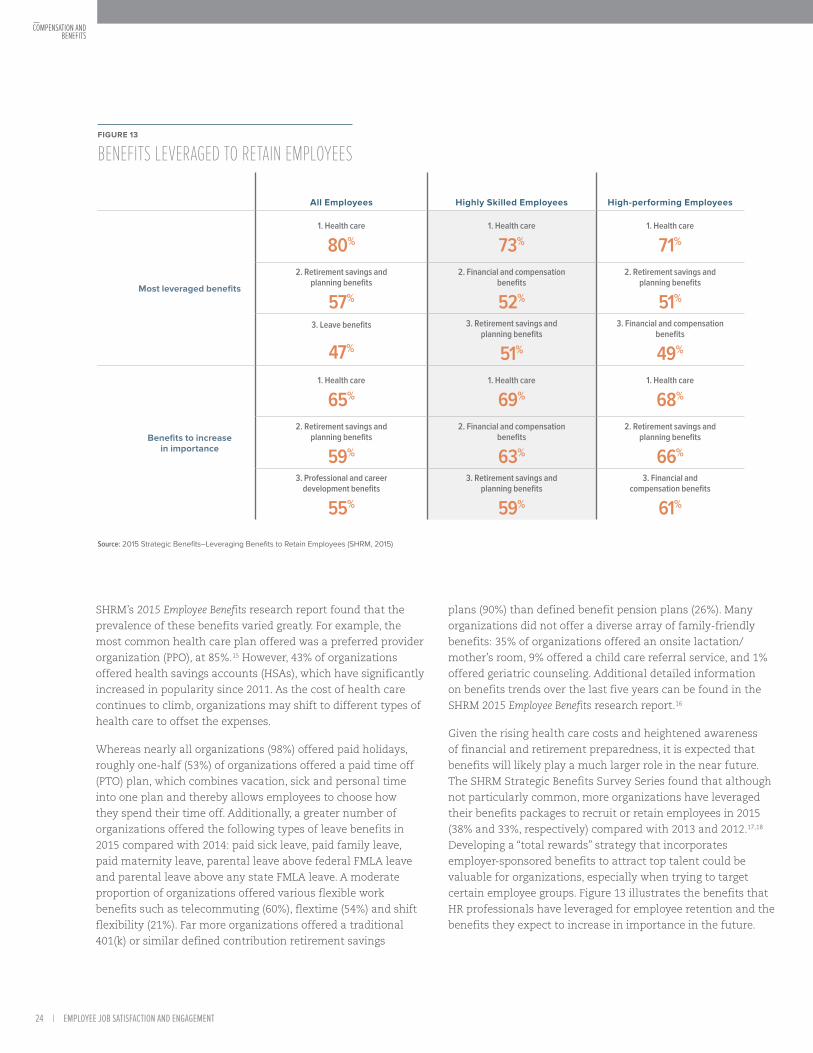
Given the rising health care costs and heightened awareness
of financial and retirement preparedness, it is expected that
benefits will likely play a much larger role in the near future.
The SHRM Strategic Benefits Survey Series found that although
not particularly common, more organizations have leveraged
their benefits packages to recruit or retain employees in 2015
(38% and 33%, respectively) compared with 2013 and 2012.17,18
Developing a “total rewards” strategy that incorporates
employer-sponsored benefits to attract top talent could be
valuable for organizations, especially when trying to target
certain employee groups. Figure 13 illustrates the benefits that
HR professionals have leveraged for employee retention and the
benefits they expect to increase in importance in the future.
COMPENSATION AND BENEFITS
All Employees Highly Skilled Employees High-performing Employees
Most leveraged benefits
1. Health care
80%1. Health care
73%1. Health care
71%
2. Retirement savings and planning benefits
57%
2. Financial and compensation benefits
52%
2. Retirement savings and planning benefits
51%
3. Leave benefits
47%
3. Retirement savings and planning benefits
51%
3. Financial and compensation benefits
49%
Benefits to increase in importance
1. Health care
65%1. Health care
69%1. Health care
68%
2. Retirement savings and planning benefits
59%
2. Financial and compensation benefits
63%
2. Retirement savings and planning benefits
66%
3. Professional and career development benefits
55%
3. Retirement savings and planning benefits
59%
3. Financial and compensation benefits
61%
FIGURE 13
BENEFITS LEVERAGED TO RETAIN EMPLOYEES
Source: 2015 Strategic Benefits―Leveraging Benefits to Retain Employees (SHRM, 2015)
REVITALIZING A CHANGING WORKFORCE | 25
The SHRM Strategic Benefits Survey Series on health care
indicated that approximately three out of four (76%) organizations
reported an increase in their total health care costs in their
most recent plan year compared with the previous plan year.19
Nearly all (99%) organizations reported being somewhat or very
concerned about controlling health care costs. Roughly one-
half of organizations have explored options such as creating an
organizational culture that promotes health and wellness, an
increase from 2013, and offering consumer-directed health plans
(e.g., HRAs and HSAs). Although giving employees resources
needed to live healthier lifestyles can mean reduced costs for
employers, employees still may have to grapple with unavoidable
medical expenses.
Research conducted by SHRM and McGraw-Hill Federal Credit
Union found that medical expenses were the top financial
challenge affecting employees.20 Approximately two-fifths (38%)
of HR professionals reported that employees had more financial
challenges now than during the early part of the Great Recession.
HR professionals reported that employees’ personal financial
challenges interfered with work performance in areas such as
overall employee stress (50%), ability to focus on work (47%) and
overall productivity (29%). Although 57% of organizations provide
some type of financial education, most of the topics involve
retirement and investment planning. As the demographics of the
workforce shift, organizations may need to rethink the types of
financial education they offer to their employees. More emphasis
may be needed in areas such as general budgeting advice and
medical/health care cost planning to adjust for employees dealing
with student loans and medical expenses. Alleviating financial
burdens may have a positive impact on employees’ ability to focus
and thus improve the quality of their work.
COMPENSATION AND BENEFITS

26 | EMPLOYEE JOB SATISFACTION AND ENGAGEMENT
EMPLOYEE JOB SATISFACTION: EMPLOYEE RELATIONSHIPS WITH MANAGEMENT

REVITALIZING A CHANGING WORKFORCE | 27
Toxic relationships can quickly lead to disgruntled employees,
waning effectiveness levels and other negative consequences.
Positive relationships based on a foundation of mutual trust and
understanding have the potential to enhance productivity and
organizational success. Management can show support for their
staff by considering their viewpoints and presenting opportunities
for employees to demonstrate their talents and effective
communication.
Because employees spend much of their waking hours at work, it is not difficult to
understand the importance of interpersonal dynamics in
the workplace.
Respectful treatment of all employees at all levels
Trust between employees and senior management
Relationship with immediate supervisor
Immediate supervisor’s respect for employees' ideas
Management’s recognition of employee job performance
Communication between employees and senior management
Autonomy and independence
Management’s communication of organization’s goals and strategies
Important
Very Important
Somewhat Satisfied
Very Satisfied
Note: n = 581-590. Importance percentages are based on a scale where 1 = “very unimportant” and 4 = “very important.” Satisfaction percentages are based on a scale where 1 = “very dissatisfied” and 5 = “very satisfied.” Data are sorted in descending order by the percentage of respondents who indicated “very important."
Source: Employee Job Satisfaction and Engagement (SHRM, 2016)
FIGURE 14
IMPORTANCE OF AND SATISFACTION WITH RELATIONSHIP WITH MANAGEMENT ASPECTS
28% 67%
39% 55%
38% 53%
41% 49%
43% 48%
44% 48%
43% 46%
45% 45%
40%31%
35%27%
34%40%
34%37%
37%26%
39%25%
39%32%
41%24%
IMPORTANCE SATISFACTION

28 | EMPLOYEE JOB SATISFACTION AND ENGAGEMENT
Respectful Treatment of All Employees at All LevelsFor the second year in a row, respectful
treatment of all employees at all
levels topped the chart as the leading
contributor to job satisfaction.
Approximately two-thirds (67%) of
employees deemed this aspect to be
very important to their job satisfaction.
Seventy-one percent of employees were
satisfied with the level of respect given
to employees at their organization.
Respect throughout the organization
can be incorporated into the corporate
culture. It can begin with techniques
such as seeking common ground while
recognizing and accepting differences.
Trust Between Employees and Senior ManagementFifty-five percent of employees reported
that trust between employees and senior
management was very important to
their job satisfaction, making it the fifth
contributor to job satisfaction, dropping
three spaces compared with last year.
It is currently tied with opportunities
to use skills and abilities in one’s work.
Roughly three-fifths (62%) of employees
were satisfied with trust between
employees and senior management in
their organization. Organizations that
lack trust between their employees
and upper management often
develop adverse working conditions.
If management does not support its
workers, suspicion may arise, resulting
in a less than productive workforce.
Apprehensive employees may feel the
need to withhold information or use
other tactics to gain leverage.
Relationship with Immediate SupervisorSimilar to last year, relationship with
immediate supervisor remained in the
sixth place, with 53% of employees
rating it as very important to their
job satisfaction; the same percentage
indicated organization’s financial
stability was very important. These two
factors tied for the sixth position among
the top contributors to job satisfaction.
Nearly three-fourths (74%) of employees
were satisfied with their relationship
with their immediate supervisor. As a
condition for engagement (see Table
2), this aspect was the third highest, a
jump of two places since last year. Given
that an employee’s relationship with
his or her immediate supervisor has
been among the top five conditions of
engagement over the last five years, its
higher ranking speaks to this aspect’s
relevance in the workplace. Fostering
positive relationships encourages
constructive dialogue, from exchanging
ideas to providing feedback on
performance. By strengthening this bond
of trust, employees may be more likely
to work through and stay committed
during difficult times, reducing the
chances of voluntary turnover and
associated costs.
Immediate Supervisor’s Respect for Employees’ IdeasSimilar to respectful treatment,
appreciation for employees’ ideas is
also significant to workers’ sense of
belonging. Furthermore, those directly
working on the day-to-day challenges
of the job may generate the most
effective ideas. Nearly one-half (49%)
of employees indicated that their
immediate supervisor’s respect for their
ideas was very important to their job
satisfaction, a drop of seven percentages
points compared with last year. Seven
out of 10 (71%) employees were satisfied
with their immediate supervisor’s
respect for their ideas.
Communication Between Employees and Senior ManagementWith the rise of flexible work
arrangements, globalization and
technological advances that make it
possible for knowledge workers to work
from virtually anywhere, strengthening
communication efforts is a critical
function of a successful organization.
It is also important for organizations to
pay attention to what communication
methods are most conducive for their
particular environment, the purpose of
the exchange and their staff’s preference.
Choosing the wrong communication
technique could influence the
effectiveness of the message and, thus,
possibly affect its end goal.
Forty-eight percent of employees
reported that communication between
employees and senior management
was very important to employee job
satisfaction. It is tied for the ninth
position with management’s recognition
of employee job performance. Nearly
two-thirds (64%) of employees were
satisfied with the communication
between employees and senior
management. Middle-management
and executive employees were more
likely to be satisfied with this aspect
than nonexempt nonmanagement
employees. This discrepancy may be a
signal that organizations are not sharing
information all the way down the chain
of command.
EMPLOYEE RELATIONSHIPS WITH MANAGEMENT
REVITALIZING A CHANGING WORKFORCE | 29
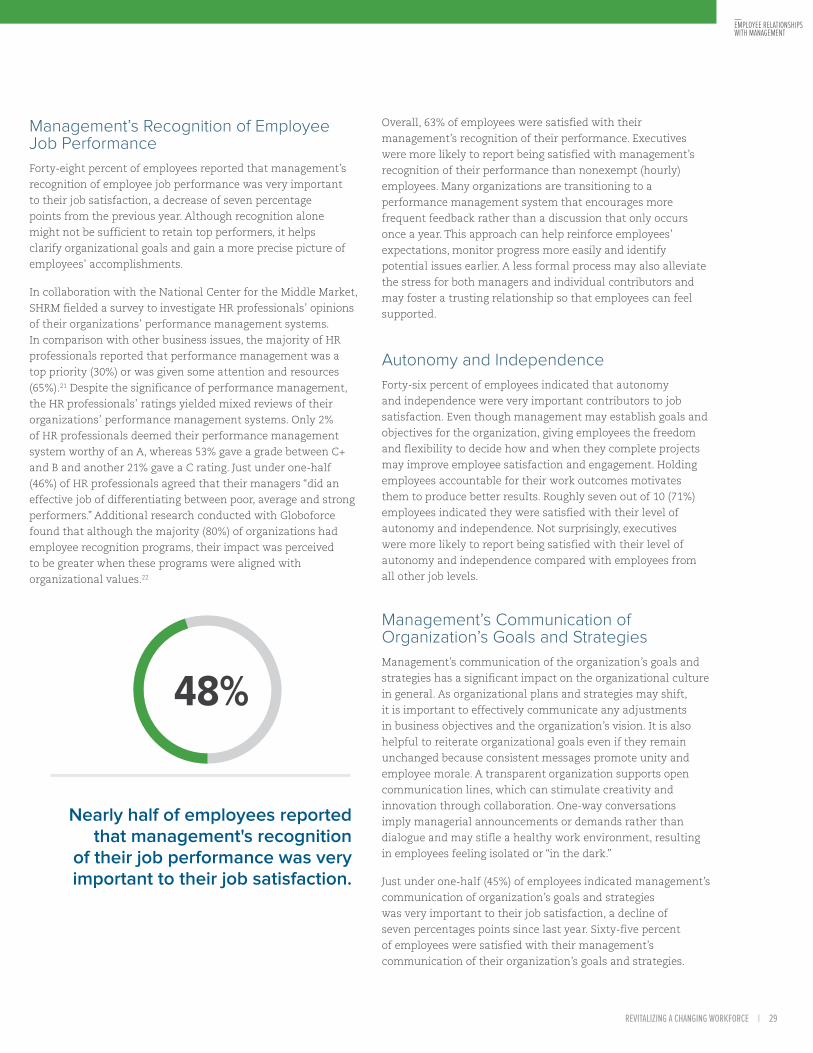
Management’s Recognition of Employee Job PerformanceForty-eight percent of employees reported that management’s
recognition of employee job performance was very important
to their job satisfaction, a decrease of seven percentage
points from the previous year. Although recognition alone
might not be sufficient to retain top performers, it helps
clarify organizational goals and gain a more precise picture of
employees’ accomplishments.
In collaboration with the National Center for the Middle Market,
SHRM fielded a survey to investigate HR professionals’ opinions
of their organizations’ performance management systems.
In comparison with other business issues, the majority of HR
professionals reported that performance management was a
top priority (30%) or was given some attention and resources
(65%).21 Despite the significance of performance management,
the HR professionals’ ratings yielded mixed reviews of their
organizations’ performance management systems. Only 2%
of HR professionals deemed their performance management
system worthy of an A, whereas 53% gave a grade between C+
and B and another 21% gave a C rating. Just under one-half
(46%) of HR professionals agreed that their managers “did an
effective job of differentiating between poor, average and strong
performers.” Additional research conducted with Globoforce
found that although the majority (80%) of organizations had
employee recognition programs, their impact was perceived
to be greater when these programs were aligned with
organizational values.22
Overall, 63% of employees were satisfied with their
management’s recognition of their performance. Executives
were more likely to report being satisfied with management’s
recognition of their performance than nonexempt (hourly)
employees. Many organizations are transitioning to a
performance management system that encourages more
frequent feedback rather than a discussion that only occurs
once a year. This approach can help reinforce employees’
expectations, monitor progress more easily and identify
potential issues earlier. A less formal process may also alleviate
the stress for both managers and individual contributors and
may foster a trusting relationship so that employees can feel
supported.
Autonomy and IndependenceForty-six percent of employees indicated that autonomy
and independence were very important contributors to job
satisfaction. Even though management may establish goals and
objectives for the organization, giving employees the freedom
and flexibility to decide how and when they complete projects
may improve employee satisfaction and engagement. Holding
employees accountable for their work outcomes motivates
them to produce better results. Roughly seven out of 10 (71%)
employees indicated they were satisfied with their level of
autonomy and independence. Not surprisingly, executives
were more likely to report being satisfied with their level of
autonomy and independence compared with employees from
all other job levels.
Management’s Communication of Organization’s Goals and StrategiesManagement’s communication of the organization’s goals and
strategies has a significant impact on the organizational culture
in general. As organizational plans and strategies may shift,
it is important to effectively communicate any adjustments
in business objectives and the organization’s vision. It is also
helpful to reiterate organizational goals even if they remain
unchanged because consistent messages promote unity and
employee morale. A transparent organization supports open
communication lines, which can stimulate creativity and
innovation through collaboration. One-way conversations
imply managerial announcements or demands rather than
dialogue and may stifle a healthy work environment, resulting
in employees feeling isolated or “in the dark.”
Just under one-half (45%) of employees indicated management’s
communication of organization’s goals and strategies
was very important to their job satisfaction, a decline of
seven percentages points since last year. Sixty-five percent
of employees were satisfied with their management’s
communication of their organization’s goals and strategies.
48%
Nearly half of employees reported that management's recognition
of their job performance was very important to their job satisfaction.
EMPLOYEE RELATIONSHIPS WITH MANAGEMENT
30 | EMPLOYEE JOB SATISFACTION AND ENGAGEMENT
EMPLOYEE JOB SATISFACTION: WORK ENVIRONMENT

REVITALIZING A CHANGING WORKFORCE | 31
Job security
Organization’s financial stability
Feeling safe in the work environment
The work itself
Overall corporate culture
Meaningfulness of job
Teamwork within department/business unit
Relationships with co-workers
Teamwork between departments/business units
Contribution of work to organization’s business goals
Communication between departments/ business units
Variety of work
Organization’s commitment to corporate social responsibility
Organization’s commitment to a diverse and inclusive workforce
Organization’s commitment to a “green” workplace
Promoting elements that sustain a healthy work environment fosters satisfied and engaged employees. An ideal work setting involves
components such as stimulating work projects, assurance of personal and organizational well-being, and dedicated teammates.
FIGURE 15
IMPORTANCE OF AND SATISFACTION WITH WORK ENVIRONMENT ASPECTS
Note: n = 474-579. Importance percentages are based on a scale where 1 = “very unimportant” and 4 = “very important.” Satisfaction percentages are based on a scale where 1 = “very dissatisfied” and 5 = “very satisfied.” Data are sorted in descending order by the percentage of respondents who indicated “very important." Source: Employee Job Satisfaction and Engagement (SHRM, 2016)
Important
Very Important
Somewhat Satisfied
Very Satisfied
58%34%
39%51%
48%44%
32%50%
53%40%
36%53%
44%48%
30%47%
50%38%
35%50%
43%47%
21%46%
43%49%
40%48%
39%50%
32% 39%
30% 42%
34% 40%
24% 39%
33% 40%
21% 38%
28% 41%
25% 39%
48% 35%
30% 39%
34% 42%
23% 32%
26% 42%
36% 41%
21% 40%
IMPORTANCE SATISFACTION
32 | EMPLOYEE JOB SATISFACTION AND ENGAGEMENT
Job SecurityEven though economic conditions have stabilized, job security
still continues to be a major factor influencing workers’ job
satisfaction. After the Great Recession began in late 2007, job
security claimed the number one spot as the job satisfaction
contributor rated as very important from 2008 to 2011. In
2012 and 2013, it dropped down to number two, replaced by
opportunities to use skills and abilities and compensation/pay,
respectively. Job security dropped down to the fourth position
in 2014 and 2015. This year, 58% of employees reported job
security as very important to their job satisfaction. Although
workers still value steady employment, they are gaining more
confidence as the labor market grows, causing job applicants
to reprioritize the elements they seek in a job. Job security and
compensation are the only two job satisfaction contributors
that have remained in the top five list for the last 13 years.
Roughly seven out of 10 (71%) employees also said they were
satisfied with job security in their current job.
According to this research, even though one-third (37%) of
employees reported layoffs in their organization within the past
12 months, roughly one-half (52%) were not at all concerned
about the security of their current job. Moreover, nearly one-
half (45%) of employees said they would be likely or very likely
to look for a job outside of their organization in the next 12
months (see Figure 3). Among that group of employees, 62%
reported wanting to pursue other employment for better
compensation/pay (see Figure 9). Others said they were looking
for better benefits (30%) and better career advancement
opportunities (27%) than what their current job offered.
Organization’s Financial StabilityFifty-three percent of employees reported that their
organization’s financial stability had a very important impact
on their job satisfaction. Organization’s financial stability was
tied with relationship with immediate supervisor for the sixth
position among contributors to job satisfaction, a jump of two
places compared with last year. Although an organization’s
financial stability still remains a crucial job satisfaction
contributor, its importance may become overshadowed by
other aspects as the labor market improves. Employees may be
less concerned about the employer’s financial stability as they
become more confident about other employment opportunities.
Roughly three-fourths (73%) of employees reported being
satisfied with their organization’s financial stability.
Feeling Safe in the Work EnvironmentAccording to recent SHRM research, less than one-fifth of
organizations have experienced incidents of domestic violence
(19%), sexual violence (11%) or stalking (14%) within the last
year.23 More than one-half (54%) of organizations had a formal
workplace policy on sexual violence in place; however, only
about one-third had policies on sexual violence (35%) and
stalking (31%). To uphold the overall well-being of their staff,
organizations must assess their safety needs on a regular basis
to maximize the efforts in preventing harmful acts.
Although unfortunate events may occur anywhere, even in
the workplace, it is reasonable for employees to expect a
certain level of security and protection at work. Fifty percent of
employees reported that feeling safe in the work environment
was very important to their job satisfaction. Female employees
were more likely than male employees to report this aspect as
an important job satisfaction contributor. Eighty-three percent
of employees were satisfied with their level of safety in the
workplace.
The Work ItselfThe work itself (e.g., stimulating and challenging assignments)
can enhance engagement as employees are more motivated
to explore tasks that incite curiosity and inspiration. Given
that many individuals spend much of their waking hours on
the job, employees may have more interest in their work and
in their organizations than their employers think. Rather than
mundane, repetitive tasks, employees often prefer working on
topics that inspire and energize them; even better if employees
are given the freedom to decide what projects are completed
and how.
Nearly one-half (48%) of employees reported that the work itself
was very important to job satisfaction, positioning it within
the top 10 list of job satisfaction contributors, at the ninth
spot. Professional nonmanagement and middle-management
employees were more likely to cite this aspect as a contributor
to their job satisfaction compared with nonexempt (hourly)
nonmanagement employees. Approximately three-fourths
(74%) of employees reported being satisfied with their work. All
other job levels were more satisfied with the work itself than
nonexempt (hourly) management employees were.
Overall Corporate CultureOften thought of as the “glue of an organization,” corporate
culture can be described as the shared attitudes and
mannerisms held by the members of the organization. These
norms influence how groups, internally and externally, interact
with each other. Components of corporate culture range from
tangible items, such as the dress code and architecture of an
office, to the intangibles, such as an organization’s mission
and values. Because a unique corporate culture can help an
organization stand out, it is a critical element that can be
used to gain a competitive advantage among competitors and
to attract a talented workforce. Organizations with a strong
WORK ENVIRONMENT

REVITALIZING A CHANGING WORKFORCE | 33
corporate culture may even interlock it into the organization’s
brand, especially when organizations encourage employees
to “live the brand.” More than two-fifths (44%) of employees
indicated that corporate culture was a very important job
satisfaction contributor, with more middle-management than
nonexempt (hourly) employees seeing this aspect as very
important. Sixty-nine percent of employees were satisfied with
this aspect. A greater proportion of executives were satisfied
with their organization’s corporate culture than nonexempt
(hourly) nonmanagement employees.
Meaningfulness of the JobMeaningfulness of one’s job can be thought of as the feeling
that one’s job contributes to society as a whole, a specific
community, a cause, etc. At the core of an organization, a
clear mission and vision are essential because they not only
provide guidance and direction but also appeal to stakeholders
(e.g., clients, investors) to get their buy-in. The effectiveness of
communicating this purpose to employees is equally important.
Management may spend a considerable amount of time on
communication through speeches and newsletters, but if the
majority of employees do not identify with the message, it may
be a sign that the vision is either undercommunicated or that
employees are not being shown the link between their work and
the organization’s overall mission. Making a difference toward a
cause that is bigger than any one individual or the organization
can offer a sense of fulfillment to employees. Nearly one-half
(43%) of employees reported that meaningfulness of the job was
very important to their job satisfaction. Seventy-six percent of
employees were satisfied with this aspect. Middle management
and executives were more likely to be satisfied with the
meaningfulness of their job than were nonexempt (hourly)
nonmanagement employees.
Teamwork Within Department/Business Unit Recent SHRM research on job analysis activities found that
approximately one-fifth (22%) of organizations conducted
personality testing as a method to evaluate job candidates.24
These results suggest that integrating applicants who have
character traits complimentary to the team may affect job
satisfaction and, ultimately, productivity. Although the amount
of teamwork necessary for successful outcomes may vary
based on the type of job, it is inevitable that all organizations
will require some interdepartment/business unit collaboration.
More than two-fifths (43%) of employees felt that teamwork
within their department or business unit was very important to
their job satisfaction, and 68% of employees were satisfied with
this aspect, an increase of four percentage points from
last year.
Relationships with Co-workersPositive relationships with co-workers can foster a sense of
loyalty, camaraderie, and moral support and engagement
among staff. These bonds may boost overall results and
productivity as employees are more likely to want to avoid
disappointing their teammates and to remain a cohesive team,
especially when faced with adversity. Creating a more pleasant
working environment through relationships with co-workers
can increase employee satisfaction. Two out of five (40%)
employees felt that relationships with co-workers were very
important to their job satisfaction, and 77% of employees were
satisfied with these relationships.
Contribution of Work to the Organization’s Business GoalsEmployees generally want to feel that their time and efforts are
contributing to the bigger picture. Recognizing how assignments
support the organization’s business goals can help improve
employee job satisfaction. Management may frequently assume
that employees already know the significance and relevance
of their assignments. However, setting clear explanations
and reiterating how employees’ work is valued can improve
employee effectiveness. Fewer than two-fifths (39%) of
employees perceived contributing to the organization’s business
goals as a very important job satisfaction contributor. Middle-
management employees were more likely than nonexempt
(hourly) employees to view this aspect as very important to
their job satisfaction. Seventy-two percent of employees were
satisfied with this aspect.
Teamwork Between Departments/Business Units Just as teamwork within departments/business units is
important, so is teamwork between different departments/
business units within an organization. In fact, this collaboration
can be more challenging as departments sometimes operate
in silos. Coordinating on projects across departments can help
build a more cohesive message for the organization’s external
audience and strengthen its brand. Thirty-nine percent of
employees indicated that teamwork between departments/
business units was a very important job satisfaction
contributor. More than three-fifths (61%) of employees were
satisfied with this factor.
WORK ENVIRONMENT

34 | EMPLOYEE JOB SATISFACTION AND ENGAGEMENT
Communication Between Departments/Business Units SHRM research on recruitment unanimously showed that
communication was the most valuable skill, aside from
educational training, that organizations looked for in general
job applicants.25 This finding reinforces the importance of
communication skills in the workplace. Not only are the
interactions within a department or business unit critical,
but being able to communicate and collaborate between
departments or business units is essential to organizational
success. Operating in distinct divisions or silos could have a
major impact on how effectively an organization delivers its
brand and message to its target audience.
Just over one-third (36%) of employees felt communication
between departments/business units in their organization
was very important to their job satisfaction. Professional
nonmanagement employees were more likely than nonexempt
(hourly) nonmanagement employees to consider this aspect to
be very important to their job satisfaction. Approximately three-
fifths (59%) of employees were satisfied with the communication
between departments/business units in their organization.
Variety of WorkWorkers may become bored and impatient with repetitive
tasks and quickly lose interest in the purpose of their role.
Providing stretch goals and other opportunities can boost
employees’ engagement levels. Implementing business practices
such as job rotation, job expansion and enrichment can
help employees expand their skills and knowledge and keep
their engagement levels high. These approaches can also be
beneficial to employers as employees may gain a better overall
understanding of how the organization operates. More than
one-third (35%) of employees reported that the variety of their
work was very important to their job satisfaction. Professional
nonmanagement and middle-management employees were
more likely to report variety of work as a very important
aspect of job satisfaction compared with nonexempt (hourly)
nonmanagement employees. Although this aspect was not a
high contributor to job satisfaction, 69% of employees were
satisfied with the variety of their work. Middle-management and
executive employees were more likely that nonexempt (hourly)
nonmanagement employees to be satisfied with the variety of
their work.
Organization’s Commitment to Corporate Social ResponsibilityCorporate social responsibility (CSR) can be described as a
business position that recognizes ethical, environmental
and social awareness. The obligation to make a positive
influence beyond the organization itself is also a part of this
aspect. Engaging in CSR initiatives signals that organizations
are concerned about their surrounding local and global
community. These programs may include charitable donations
and compliance with fair trade practices. Although it is not
the intention of CSR to gain immediate financial benefits,
incorporating such initiatives into an organization’s business
model could affect profitability and improve its brand and
reputation. Approximately one-third (32%) of employees
indicated that their organization’s commitment to corporate
social responsibility was a very important contributor to their
job satisfaction. Females were more likely than males to report
their organization’s commitment to CSR as a very important job
satisfaction contributor. Nearly two-thirds (63%) of employees
reported being satisfied with their organization’s commitment
to CSR, an increase of five percentages points from last year.
More professional nonmanagement employees were satisfied
with this aspect than nonexempt (hourly) nonmanagement
employees.
Organization’s Commitment to a Diverse and Inclusive WorkforceAlthough an organization’s commitment to a diverse and
inclusive workforce was rather low on the list of very important
job satisfaction contributors (30%), there is reason to believe
that it will gain more weight in the near future. Additional
demographic analyses indicate that more females than males
deemed diversity and inclusion as very important to their job
satisfaction. Nearly two-thirds (64%) of employees were satisfied
with their organization’s level of commitment to diversity and
inclusion, an increase of six percentages points from last year.
Organizations may want to consider forming a diversity
committee to support inclusiveness. SHRM research found
that only 17% of organizations had internal groups such as
diversity councils and diversity advisory boards.26 Among
those, larger organizations were three times more likely than
small organizations to have these groups. Although 15% of
organizations had staff dedicated exclusively to diversity and
inclusion, another 17% used existing staff volunteers for this
task. Employers may want to begin with incorporating diversity
and inclusion into the organization’s corporate culture; other
good practices involve modifying job descriptions to reflect
inclusive thinking and establishing goals for diverse populations
in promotion and succession planning. Furthermore,
encouraging a diversity of backgrounds in an organization may
prevent groupthink and expand creativity.
WORK ENVIRONMENT
REVITALIZING A CHANGING WORKFORCE | 35
Organization’s Commitment to a “Green” WorkplaceWith 21% of employees indicating their organization’s
commitment to a “green” workplace was very important
to their job satisfaction, this aspect was the last job
satisfaction contributor on the 2015 list, similar to last
year. Fifty-five percent of employees were satisfied with
their organization’s commitment to a “green” workplace.
WORK ENVIRONMENT

36 | EMPLOYEE JOB SATISFACTION AND ENGAGEMENT
EMPLOYEE ENGAGEMENT
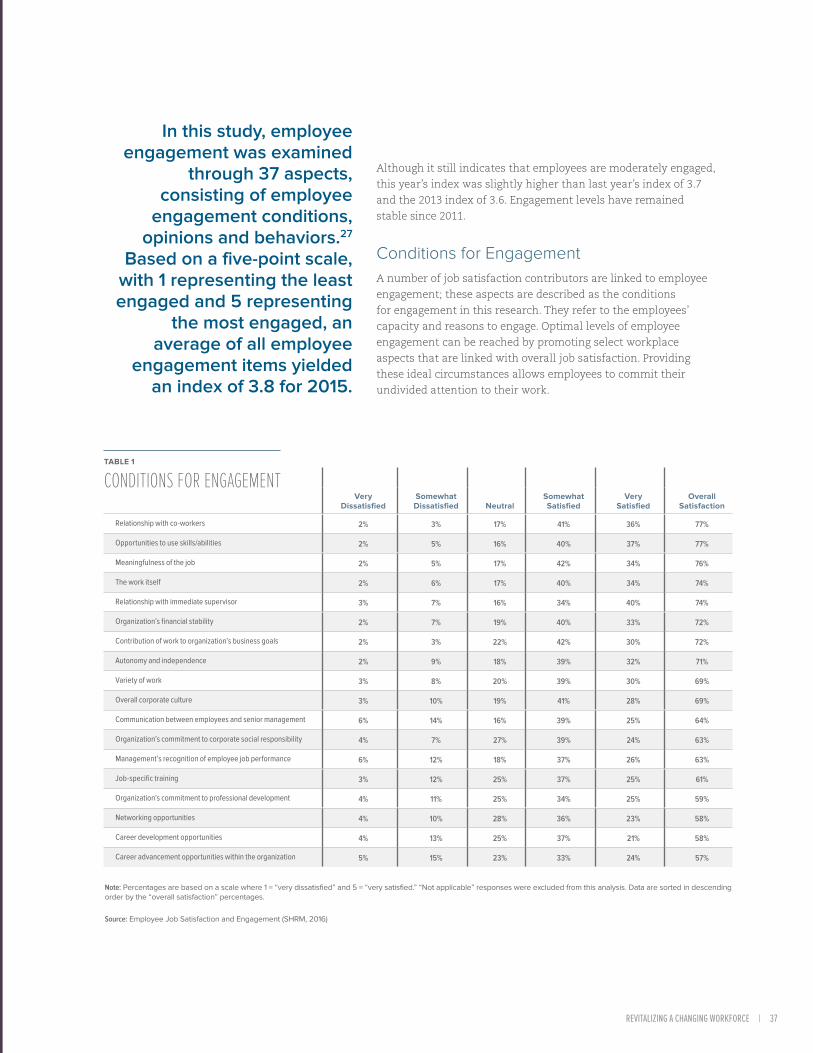
REVITALIZING A CHANGING WORKFORCE | 37
Although it still indicates that employees are moderately engaged,
this year’s index was slightly higher than last year’s index of 3.7
and the 2013 index of 3.6. Engagement levels have remained
stable since 2011.
Conditions for EngagementA number of job satisfaction contributors are linked to employee
engagement; these aspects are described as the conditions
for engagement in this research. They refer to the employees’
capacity and reasons to engage. Optimal levels of employee
engagement can be reached by promoting select workplace
aspects that are linked with overall job satisfaction. Providing
these ideal circumstances allows employees to commit their
undivided attention to their work.
Very Dissatisfied
Somewhat Dissatisfied Neutral
Somewhat Satisfied
Very Satisfied
Overall Satisfaction
Relationship with co-workers 2% 3% 17% 41% 36% 77%
Opportunities to use skills/abilities 2% 5% 16% 40% 37% 77%
Meaningfulness of the job 2% 5% 17% 42% 34% 76%
The work itself 2% 6% 17% 40% 34% 74%
Relationship with immediate supervisor 3% 7% 16% 34% 40% 74%
Organization’s financial stability 2% 7% 19% 40% 33% 72%
Contribution of work to organization’s business goals 2% 3% 22% 42% 30% 72%
Autonomy and independence 2% 9% 18% 39% 32% 71%
Variety of work 3% 8% 20% 39% 30% 69%
Overall corporate culture 3% 10% 19% 41% 28% 69%
Communication between employees and senior management 6% 14% 16% 39% 25% 64%
Organization’s commitment to corporate social responsibility 4% 7% 27% 39% 24% 63%
Management’s recognition of employee job performance 6% 12% 18% 37% 26% 63%
Job-specific training 3% 12% 25% 37% 25% 61%
Organization’s commitment to professional development 4% 11% 25% 34% 25% 59%
Networking opportunities 4% 10% 28% 36% 23% 58%
Career development opportunities 4% 13% 25% 37% 21% 58%
Career advancement opportunities within the organization 5% 15% 23% 33% 24% 57%
TABLE 1
CONDITIONS FOR ENGAGEMENT
Note: Percentages are based on a scale where 1 = “very dissatisfied” and 5 = “very satisfied.” “Not applicable” responses were excluded from this analysis. Data are sorted in descending order by the “overall satisfaction” percentages.
Source: Employee Job Satisfaction and Engagement (SHRM, 2016)
In this study, employee engagement was examined
through 37 aspects, consisting of employee
engagement conditions, opinions and behaviors.27
Based on a five-point scale, with 1 representing the least engaged and 5 representing
the most engaged, an average of all employee
engagement items yielded an index of 3.8 for 2015.
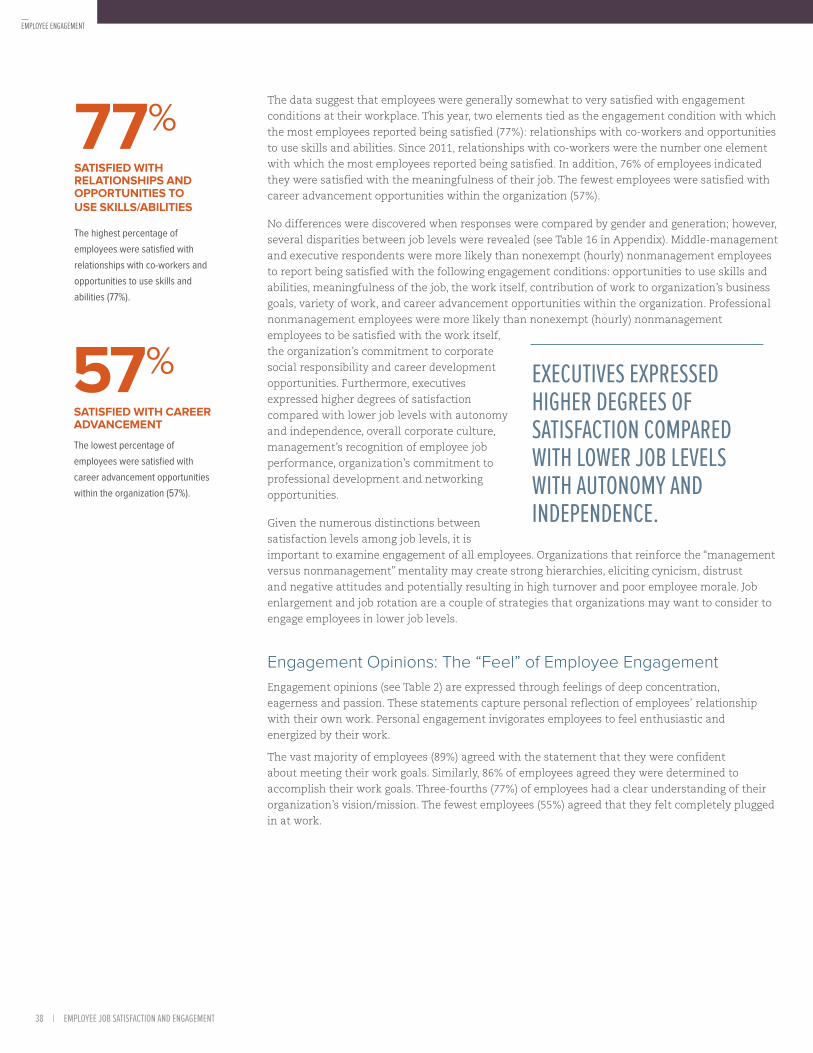
38 | EMPLOYEE JOB SATISFACTION AND ENGAGEMENT
The data suggest that employees were generally somewhat to very satisfied with engagement
conditions at their workplace. This year, two elements tied as the engagement condition with which
the most employees reported being satisfied (77%): relationships with co-workers and opportunities
to use skills and abilities. Since 2011, relationships with co-workers were the number one element
with which the most employees reported being satisfied. In addition, 76% of employees indicated
they were satisfied with the meaningfulness of their job. The fewest employees were satisfied with
career advancement opportunities within the organization (57%).
No differences were discovered when responses were compared by gender and generation; however,
several disparities between job levels were revealed (see Table 16 in Appendix). Middle-management
and executive respondents were more likely than nonexempt (hourly) nonmanagement employees
to report being satisfied with the following engagement conditions: opportunities to use skills and
abilities, meaningfulness of the job, the work itself, contribution of work to organization’s business
goals, variety of work, and career advancement opportunities within the organization. Professional
nonmanagement employees were more likely than nonexempt (hourly) nonmanagement
employees to be satisfied with the work itself,
the organization’s commitment to corporate
social responsibility and career development
opportunities. Furthermore, executives
expressed higher degrees of satisfaction
compared with lower job levels with autonomy
and independence, overall corporate culture,
management’s recognition of employee job
performance, organization’s commitment to
professional development and networking
opportunities.
Given the numerous distinctions between
satisfaction levels among job levels, it is
important to examine engagement of all employees. Organizations that reinforce the “management
versus nonmanagement” mentality may create strong hierarchies, eliciting cynicism, distrust
and negative attitudes and potentially resulting in high turnover and poor employee morale. Job
enlargement and job rotation are a couple of strategies that organizations may want to consider to
engage employees in lower job levels.
Engagement Opinions: The “Feel” of Employee EngagementEngagement opinions (see Table 2) are expressed through feelings of deep concentration,
eagerness and passion. These statements capture personal reflection of employees’ relationship
with their own work. Personal engagement invigorates employees to feel enthusiastic and
energized by their work.
The vast majority of employees (89%) agreed with the statement that they were confident
about meeting their work goals. Similarly, 86% of employees agreed they were determined to
accomplish their work goals. Three-fourths (77%) of employees had a clear understanding of their
organization’s vision/mission. The fewest employees (55%) agreed that they felt completely plugged
in at work.
SATISFIED WITH RELATIONSHIPS AND OPPORTUNITIES TO USE SKILLS/ABILITIES
The highest percentage of
employees were satisfied with
relationships with co-workers and
opportunities to use skills and
abilities (77%).
The lowest percentage of
employees were satisfied with
career advancement opportunities
within the organization (57%).
77%
57% SATISFIED WITH CAREER ADVANCEMENT
EXECUTIVES EXPRESSED HIGHER DEGREES OF SATISFACTION COMPARED WITH LOWER JOB LEVELS WITH AUTONOMY AND INDEPENDENCE.
EMPLOYEE ENGAGEMENT
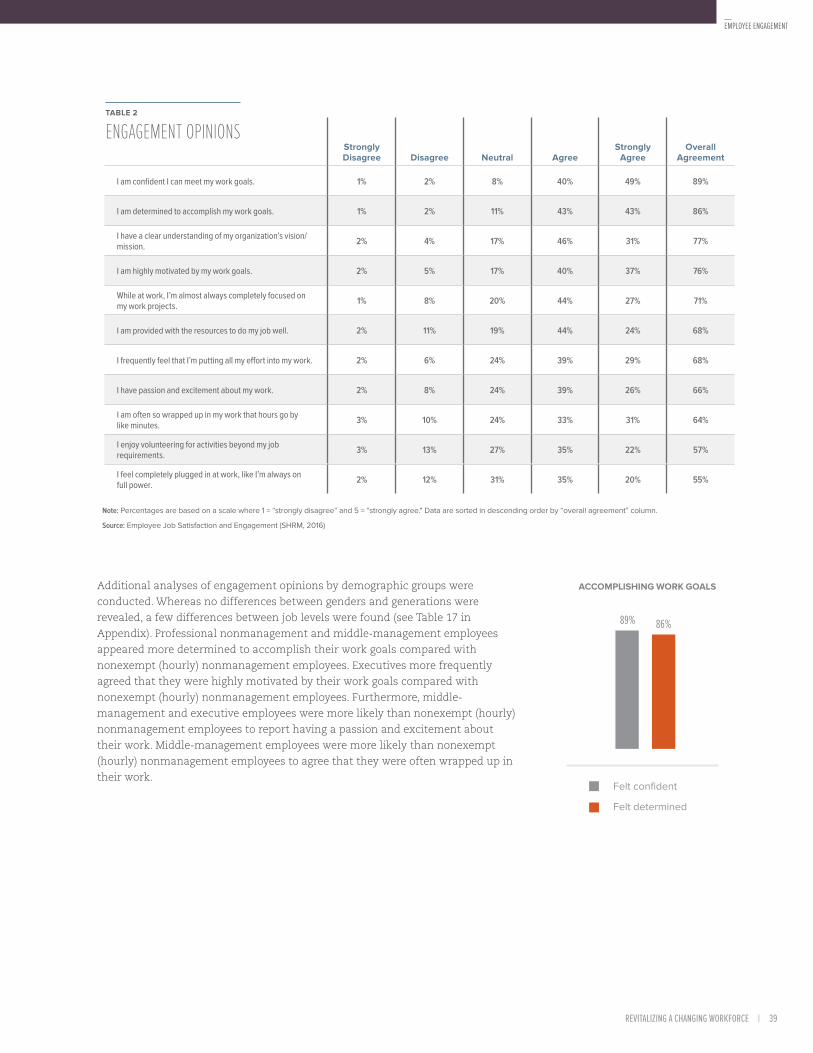
REVITALIZING A CHANGING WORKFORCE | 39
ACCOMPLISHING WORK GOALSAdditional analyses of engagement opinions by demographic groups were
conducted. Whereas no differences between genders and generations were
revealed, a few differences between job levels were found (see Table 17 in
Appendix). Professional nonmanagement and middle-management employees
appeared more determined to accomplish their work goals compared with
nonexempt (hourly) nonmanagement employees. Executives more frequently
agreed that they were highly motivated by their work goals compared with
nonexempt (hourly) nonmanagement employees. Furthermore, middle-
management and executive employees were more likely than nonexempt (hourly)
nonmanagement employees to report having a passion and excitement about
their work. Middle-management employees were more likely than nonexempt
(hourly) nonmanagement employees to agree that they were often wrapped up in
their work. Felt confident
Felt determined
89% 86%
Strongly Disagree Disagree Neutral Agree
Strongly Agree
Overall Agreement
I am confident I can meet my work goals. 1% 2% 8% 40% 49% 89%
I am determined to accomplish my work goals. 1% 2% 11% 43% 43% 86%
I have a clear understanding of my organization’s vision/mission. 2% 4% 17% 46% 31% 77%
I am highly motivated by my work goals. 2% 5% 17% 40% 37% 76%
While at work, I’m almost always completely focused on my work projects. 1% 8% 20% 44% 27% 71%
I am provided with the resources to do my job well. 2% 11% 19% 44% 24% 68%
I frequently feel that I’m putting all my effort into my work. 2% 6% 24% 39% 29% 68%
I have passion and excitement about my work. 2% 8% 24% 39% 26% 66%
I am often so wrapped up in my work that hours go by like minutes. 3% 10% 24% 33% 31% 64%
I enjoy volunteering for activities beyond my job requirements. 3% 13% 27% 35% 22% 57%
I feel completely plugged in at work, like I’m always on full power. 2% 12% 31% 35% 20% 55%
Note: Percentages are based on a scale where 1 = “strongly disagree” and 5 = “strongly agree." Data are sorted in descending order by “overall agreement” column.
Source: Employee Job Satisfaction and Engagement (SHRM, 2016)
TABLE 2
ENGAGEMENT OPINIONS
EMPLOYEE ENGAGEMENT

40 | EMPLOYEE JOB SATISFACTION AND ENGAGEMENT
Engagement Behaviors: The “Look” of Employee EngagementEngagement behaviors—the “look” of employee engagement—
can be described as actions that positively contribute to the
welfare of the organization. Engagement behaviors entail
employee groups rather than the engagement of individual
employees (i.e., engagement opinions).
Seventy percent of employees perceived that in their
organization employees were encouraged to take action when
seeing a problem or opportunity, the highest-rated engagement
behavior since 2011. Other noteworthy findings include roughly
two-thirds of employees feeling that their colleagues quickly
adapted to challenging or crisis situations (65%) and never gave
up despite difficulties (64%).
Very few differences were uncovered while exploring the
engagement behavior data by various demographics (see Table
17 in Appendix). Middle-management employees were more
likely than nonexempt (hourly) nonmanagement employees to
agree that other people in their organization often volunteered
for new projects. No significant differences by generation or
gender were found.
As the economy continues to recover and employees are more
willing to leave their current positions, employers may want
to consider developing ways to engage their staff. Given a
number of low engagement areas (e.g., viewing unexpected
responsibilities as an opportunity to succeed at something new,
volunteering for new projects), organizations have opportunities
for improvement. Organizations can incorporate low-cost
business practices to engage their employees—for example,
offering more feedback and recognition, providing more
flexibility and autonomy in task completion, and emphasizing
the value of employees’ work as it contributes to organizational
goals. Ultimately, organizations with a dissatisfied, disengaged
workforce will risk higher turnover as their employees seek out
more attractive job opportunities.
Strongly Disagree Disagree Neutral Agree
Strongly Agree
Overall Agreement
In my organization, employees are encouraged to take action when they see a problem or opportunity.
2% 9% 20% 46% 24% 70%
My colleagues quickly adapt to challenging or crisis situations. 1% 11% 24% 43% 22% 65%
My work group never gives up despite difficulties. 1% 9% 26% 43% 21% 64%
Employees in my organization deal very well with unpredictable or changing work situations. 3% 10% 26% 41% 21% 61%
In my work group, we are constantly looking out to see what challenge is coming next. 2% 12% 30% 38% 19% 57%
The people in my work group are always flexible in expanding the scope of their work. 3% 12% 31% 38% 17% 55%
Others in my organization view unexpected responsibilities as an opportunity to succeed at something new.
4% 14% 30% 37% 16% 53%
Other people in my organization often volunteer for new projects. 4% 18% 31% 32% 16% 48%
Note: Percentages are based on a scale where 1 = “strongly disagree” and 5 = “strongly agree." Data are sorted in descending order by “overall agreement” column.
Source: Employee Job Satisfaction and Engagement (SHRM, 2016)
TABLE 3
ENGAGEMENT BEHAVIORS
EMPLOYEE ENGAGEMENT

REVITALIZING A CHANGING WORKFORCE | 41

CONCLUSIONS

REVITALIZING A CHANGING WORKFORCE | 43
There is little doubt that the U.S. labor market has grown stronger
in recent years. Roughly 5.8 million jobs were created in the
2014-2015 timeframe, which marked the best two-year stretch of
employment gains since 1998-1999, according to the U.S. Bureau
of Labor Statistics (BLS).28
Although wage growth has not accelerated substantially during
this time, the ranks of the country’s long-term unemployed—
those without jobs for 26 weeks or longer—have declined
considerably. And although millions of people continue to work
part time for economic reasons—defined by the BLS as those who
would prefer full-time employment but work part time because
their hours have been reduced or they cannot find a full-time
job—their numbers have slowly decreased as well.
However, other data show that hiring could be even more robust.
HR professionals reported elevated levels of recruiting difficulty
throughout 2015, according to SHRM’s Leading Indicators of
National Employment (LINE) report.29 In a separate SHRM survey,
more than one-half (55%) of HR professionals said they had
trouble in particular with recruiting highly skilled employees.30
Recruiting problems aside, another significant challenge for HR
professionals is keeping current employees engaged with their
jobs. Even in this period of sizable employment growth, workers
are moderately engaged, meaning some may be detached from
their current roles or fearful of losing their jobs, according to this
survey. Nearly one-half (48%) of those surveyed had some level
of concern about the security of their job, and another 45% said
there was some degree of likelihood that they would look for work
outside of their organization within the next 12 months.
Consequently, HR professionals have a formidable task in
managing current trends with the U.S. labor market. Improved
economic conditions have increased demand for hiring, yet
recruiting struggles are prevalent at many organizations.
Employment conditions have stabilized, but many workers do not
feel secure in their jobs and will likely explore other options.
In turn, effective employee engagement can perhaps alleviate
these issues for HR professionals. Many already agree that
this is their top concern. “Maintaining high levels of employee
engagement” was the most pressing human capital challenge in
today’s economic environment, according to Business and Human
Capital Challenges Today and in the Future, a 2015 research report
from SHRM.31
Data from this research show that many employees place equal
emphasis on financial factors, such as competitive compensation
and benefits, and nonfinancial factors, such as communication
between employees and management and respectful treatment
of all workers. As a result, creating a workplace environment that
balances these factors should be a top priority of HR professionals.
CONCLUSIONS
Hiring trends have significant implications for job
satisfaction; in leaner times with low employment growth,
workers tend to stay put and place high value on job
security, even if they are not particularly happy with their
positions. Conversely, during labor market expansions,
more workers gain confidence in their prospects and seek
career opportunities with other organizations.

METHODOLOGY
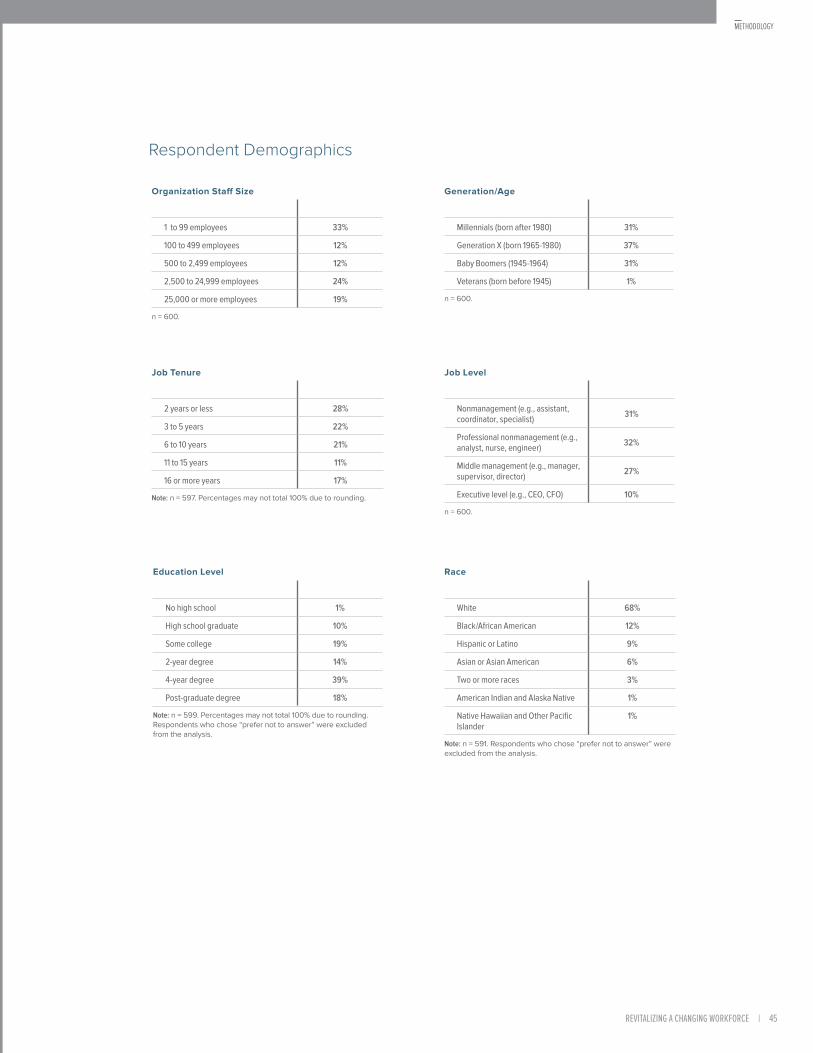
REVITALIZING A CHANGING WORKFORCE | 45
Organization Staff Size
1 to 99 employees 33%
100 to 499 employees 12%
500 to 2,499 employees 12%
2,500 to 24,999 employees 24%
25,000 or more employees 19%
n = 600.
Job Tenure
2 years or less 28%
3 to 5 years 22%
6 to 10 years 21%
11 to 15 years 11%
16 or more years 17%
Note: n = 597. Percentages may not total 100% due to rounding.
Generation/Age
Millennials (born after 1980) 31%
Generation X (born 1965-1980) 37%
Baby Boomers (1945-1964) 31%
Veterans (born before 1945) 1%
n = 600.
Job Level
Nonmanagement (e.g., assistant, coordinator, specialist) 31%
Professional nonmanagement (e.g., analyst, nurse, engineer) 32%
Middle management (e.g., manager, supervisor, director) 27%
Executive level (e.g., CEO, CFO) 10%
n = 600.
Education Level
No high school 1%
High school graduate 10%
Some college 19%
2-year degree 14%
4-year degree 39%
Post-graduate degree 18%
Note: n = 599. Percentages may not total 100% due to rounding. Respondents who chose “prefer not to answer” were excluded from the analysis.
Race
White 68%
Black/African American 12%
Hispanic or Latino 9%
Asian or Asian American 6%
Two or more races 3%
American Indian and Alaska Native 1%
Native Hawaiian and Other Pacific Islander
1%
Note: n = 591. Respondents who chose “prefer not to answer” were excluded from the analysis.
Respondent Demographics
METHODOLOGY
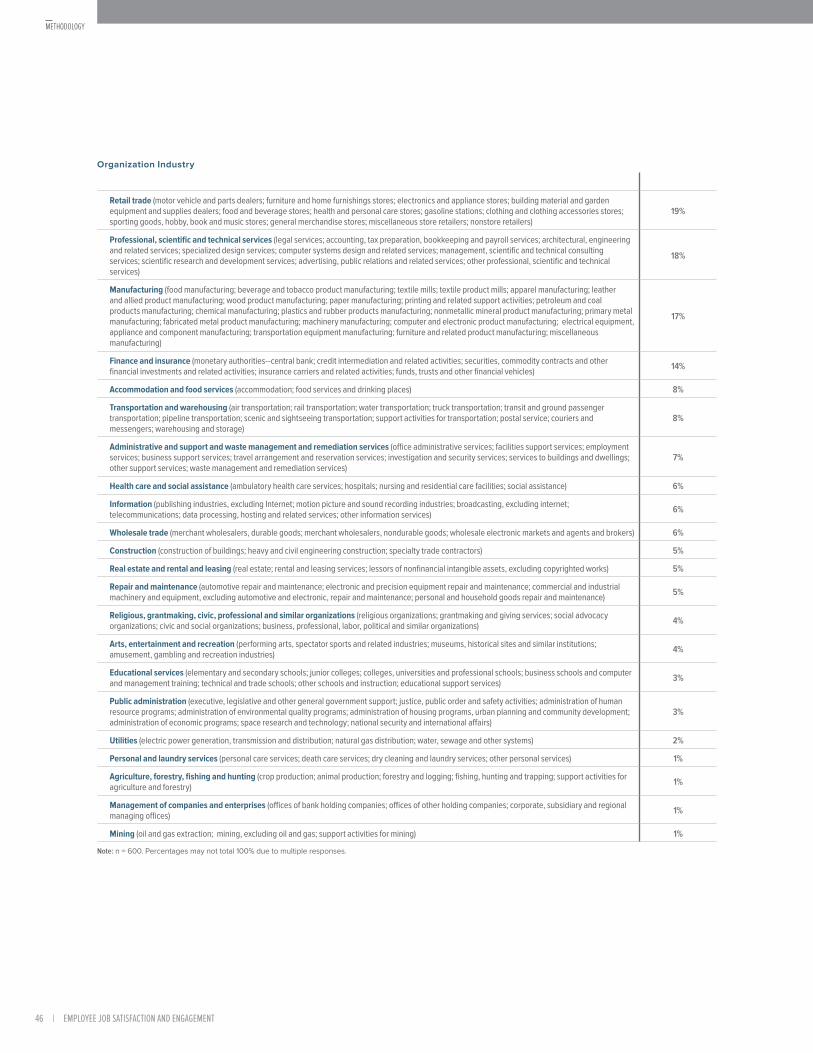
46 | EMPLOYEE JOB SATISFACTION AND ENGAGEMENT
Organization Industry
Retail trade (motor vehicle and parts dealers; furniture and home furnishings stores; electronics and appliance stores; building material and garden equipment and supplies dealers; food and beverage stores; health and personal care stores; gasoline stations; clothing and clothing accessories stores; sporting goods, hobby, book and music stores; general merchandise stores; miscellaneous store retailers; nonstore retailers)
19%
Professional, scientific and technical services (legal services; accounting, tax preparation, bookkeeping and payroll services; architectural, engineering and related services; specialized design services; computer systems design and related services; management, scientific and technical consulting services; scientific research and development services; advertising, public relations and related services; other professional, scientific and technical services)
18%
Manufacturing (food manufacturing; beverage and tobacco product manufacturing; textile mills; textile product mills; apparel manufacturing; leather and allied product manufacturing; wood product manufacturing; paper manufacturing; printing and related support activities; petroleum and coal products manufacturing; chemical manufacturing; plastics and rubber products manufacturing; nonmetallic mineral product manufacturing; primary metal manufacturing; fabricated metal product manufacturing; machinery manufacturing; computer and electronic product manufacturing; electrical equipment, appliance and component manufacturing; transportation equipment manufacturing; furniture and related product manufacturing; miscellaneous manufacturing)
17%
Finance and insurance (monetary authorities--central bank; credit intermediation and related activities; securities, commodity contracts and other financial investments and related activities; insurance carriers and related activities; funds, trusts and other financial vehicles) 14%
Accommodation and food services (accommodation; food services and drinking places) 8%
Transportation and warehousing (air transportation; rail transportation; water transportation; truck transportation; transit and ground passenger transportation; pipeline transportation; scenic and sightseeing transportation; support activities for transportation; postal service; couriers and messengers; warehousing and storage)
8%
Administrative and support and waste management and remediation services (office administrative services; facilities support services; employment services; business support services; travel arrangement and reservation services; investigation and security services; services to buildings and dwellings; other support services; waste management and remediation services)
7%
Health care and social assistance (ambulatory health care services; hospitals; nursing and residential care facilities; social assistance) 6%
Information (publishing industries, excluding Internet; motion picture and sound recording industries; broadcasting, excluding internet; telecommunications; data processing, hosting and related services; other information services) 6%
Wholesale trade (merchant wholesalers, durable goods; merchant wholesalers, nondurable goods; wholesale electronic markets and agents and brokers) 6%
Construction (construction of buildings; heavy and civil engineering construction; specialty trade contractors) 5%
Real estate and rental and leasing (real estate; rental and leasing services; lessors of nonfinancial intangible assets, excluding copyrighted works) 5%
Repair and maintenance (automotive repair and maintenance; electronic and precision equipment repair and maintenance; commercial and industrial machinery and equipment, excluding automotive and electronic, repair and maintenance; personal and household goods repair and maintenance) 5%
Religious, grantmaking, civic, professional and similar organizations (religious organizations; grantmaking and giving services; social advocacy organizations; civic and social organizations; business, professional, labor, political and similar organizations) 4%
Arts, entertainment and recreation (performing arts, spectator sports and related industries; museums, historical sites and similar institutions; amusement, gambling and recreation industries) 4%
Educational services (elementary and secondary schools; junior colleges; colleges, universities and professional schools; business schools and computer and management training; technical and trade schools; other schools and instruction; educational support services) 3%
Public administration (executive, legislative and other general government support; justice, public order and safety activities; administration of human resource programs; administration of environmental quality programs; administration of housing programs, urban planning and community development; administration of economic programs; space research and technology; national security and international affairs)
3%
Utilities (electric power generation, transmission and distribution; natural gas distribution; water, sewage and other systems) 2%
Personal and laundry services (personal care services; death care services; dry cleaning and laundry services; other personal services) 1%
Agriculture, forestry, fishing and hunting (crop production; animal production; forestry and logging; fishing, hunting and trapping; support activities for agriculture and forestry) 1%
Management of companies and enterprises (offices of bank holding companies; offices of other holding companies; corporate, subsidiary and regional managing offices) 1%
Mining (oil and gas extraction; mining, excluding oil and gas; support activities for mining) 1%
Note: n = 600. Percentages may not total 100% due to multiple responses.
METHODOLOGY
REVITALIZING A CHANGING WORKFORCE | 47
Organization Industry
Retail trade (motor vehicle and parts dealers; furniture and home furnishings stores; electronics and appliance stores; building material and garden equipment and supplies dealers; food and beverage stores; health and personal care stores; gasoline stations; clothing and clothing accessories stores; sporting goods, hobby, book and music stores; general merchandise stores; miscellaneous store retailers; nonstore retailers)
19%
Professional, scientific and technical services (legal services; accounting, tax preparation, bookkeeping and payroll services; architectural, engineering and related services; specialized design services; computer systems design and related services; management, scientific and technical consulting services; scientific research and development services; advertising, public relations and related services; other professional, scientific and technical services)
18%
Manufacturing (food manufacturing; beverage and tobacco product manufacturing; textile mills; textile product mills; apparel manufacturing; leather and allied product manufacturing; wood product manufacturing; paper manufacturing; printing and related support activities; petroleum and coal products manufacturing; chemical manufacturing; plastics and rubber products manufacturing; nonmetallic mineral product manufacturing; primary metal manufacturing; fabricated metal product manufacturing; machinery manufacturing; computer and electronic product manufacturing; electrical equipment, appliance and component manufacturing; transportation equipment manufacturing; furniture and related product manufacturing; miscellaneous manufacturing)
17%
Finance and insurance (monetary authorities--central bank; credit intermediation and related activities; securities, commodity contracts and other financial investments and related activities; insurance carriers and related activities; funds, trusts and other financial vehicles) 14%
Accommodation and food services (accommodation; food services and drinking places) 8%
Transportation and warehousing (air transportation; rail transportation; water transportation; truck transportation; transit and ground passenger transportation; pipeline transportation; scenic and sightseeing transportation; support activities for transportation; postal service; couriers and messengers; warehousing and storage)
8%
Administrative and support and waste management and remediation services (office administrative services; facilities support services; employment services; business support services; travel arrangement and reservation services; investigation and security services; services to buildings and dwellings; other support services; waste management and remediation services)
7%
Health care and social assistance (ambulatory health care services; hospitals; nursing and residential care facilities; social assistance) 6%
Information (publishing industries, excluding Internet; motion picture and sound recording industries; broadcasting, excluding internet; telecommunications; data processing, hosting and related services; other information services) 6%
Wholesale trade (merchant wholesalers, durable goods; merchant wholesalers, nondurable goods; wholesale electronic markets and agents and brokers) 6%
Construction (construction of buildings; heavy and civil engineering construction; specialty trade contractors) 5%
Real estate and rental and leasing (real estate; rental and leasing services; lessors of nonfinancial intangible assets, excluding copyrighted works) 5%
Repair and maintenance (automotive repair and maintenance; electronic and precision equipment repair and maintenance; commercial and industrial machinery and equipment, excluding automotive and electronic, repair and maintenance; personal and household goods repair and maintenance) 5%
Religious, grantmaking, civic, professional and similar organizations (religious organizations; grantmaking and giving services; social advocacy organizations; civic and social organizations; business, professional, labor, political and similar organizations) 4%
Arts, entertainment and recreation (performing arts, spectator sports and related industries; museums, historical sites and similar institutions; amusement, gambling and recreation industries) 4%
Educational services (elementary and secondary schools; junior colleges; colleges, universities and professional schools; business schools and computer and management training; technical and trade schools; other schools and instruction; educational support services) 3%
Public administration (executive, legislative and other general government support; justice, public order and safety activities; administration of human resource programs; administration of environmental quality programs; administration of housing programs, urban planning and community development; administration of economic programs; space research and technology; national security and international affairs)
3%
Utilities (electric power generation, transmission and distribution; natural gas distribution; water, sewage and other systems) 2%
Personal and laundry services (personal care services; death care services; dry cleaning and laundry services; other personal services) 1%
Agriculture, forestry, fishing and hunting (crop production; animal production; forestry and logging; fishing, hunting and trapping; support activities for agriculture and forestry) 1%
Management of companies and enterprises (offices of bank holding companies; offices of other holding companies; corporate, subsidiary and regional managing offices) 1%
Mining (oil and gas extraction; mining, excluding oil and gas; support activities for mining) 1%
Note: n = 600. Percentages may not total 100% due to multiple responses.
METHODOLOGY
Survey MethodologyThe sample of employees used in this research was randomly selected by an outside survey research organization’s
web-enabled employee panel. In total, 600 individuals completed the online 2015 Employee Job Satisfaction and
Engagement Survey in November and December 2015. All respondents were employed, either full time or part time.
The demographic profile of the sample obtained was matched to the demographic profile of U.S. employees.
The U.S. Census Bureau conducts a monthly survey of households called the Current Population Survey (CPS) for
the Bureau of Labor Statistics to attain information about the labor force, its characteristics and employment. A
comparison between the sample of 600 employees in the 2015 Employee Job Satisfaction and Engagement Survey
sample and the CPS showed differences in education level, race/ethnicity and organizational industry. Compared
with the CPS findings, the 2015 sample consisted of more employees with higher-level educational degrees, more
racially diverse employees and more employees in the following industries: retail; professional, scientific and
technical services; manufacturing; and finance. The 2015 sample had fewer employees in the health care and social
assistance and educational services industries.
Notations Analysis: For this report, standard statistical research methods were used to determine if observed differences were
statistically significant (i.e., likelihood that the difference is not likely due to chance). Some results discussed within
this report may not be statistically significant. Furthermore, not all findings are presented in an accompanying
figure or table.
Tables: Unless otherwise noted in a specific table,
please note that the following statements are
applicable to data depicted in tables throughout this
report.
• Data are sorted in descending order by the “overall”
column in each table.
• Percentages for a question or a response option may
not total 100% due to rounding.
• Tables in the Appendix present the overall percentage
and the percentage by select employee demographic
characteristics; however, only response options for
which there were significant differences are shown.
Figures: Unless otherwise noted in a specific figure, the
following statements are applicable to data depicted in
figures throughout this report.
• Percentages for a question or a response option may
not total 100% due to rounding.
Generalization of results: As with any research, readers
should exercise caution when generalizing results and
take individual circumstances and experiences into
consideration when making decisions based on
these data.
Number of respondents: The number of respondents
(indicated by “n” in figures and tables) varies from table
to table and figure to figure because some respondents
did not answer all of the questions. Individuals may
not have responded to a question on the survey
because the question or some of its parts were
not applicable or because the requested data were
unavailable. This also accounts for the varying number
of responses represented within each table or figure.
Confidence level and margin of error: A confidence level
and margin of error give readers some measure of how
much they can rely on survey responses to represent
all U.S. employees. Given the level of response to
survey items asked of all respondents, SHRM Research
is 95% confident that responses given by responding
employees can be applied to all U.S. employees, in
general, with a margin of error of approximately
2%. For example, 53% of the responding employees
reported that the relationship with their immediate
supervisor was very important to their job satisfaction.
With a 95% confidence interval, the reader can be
95% certain that between 51% and 55% of employees
believe that the relationship with their immediate
supervisor is very important to employee job
satisfaction. It is important to note that as the sample
size decreases, the margin of error increases.
METHODOLOGY

48 | EMPLOYEE JOB SATISFACTION AND ENGAGEMENT
APPENDIX
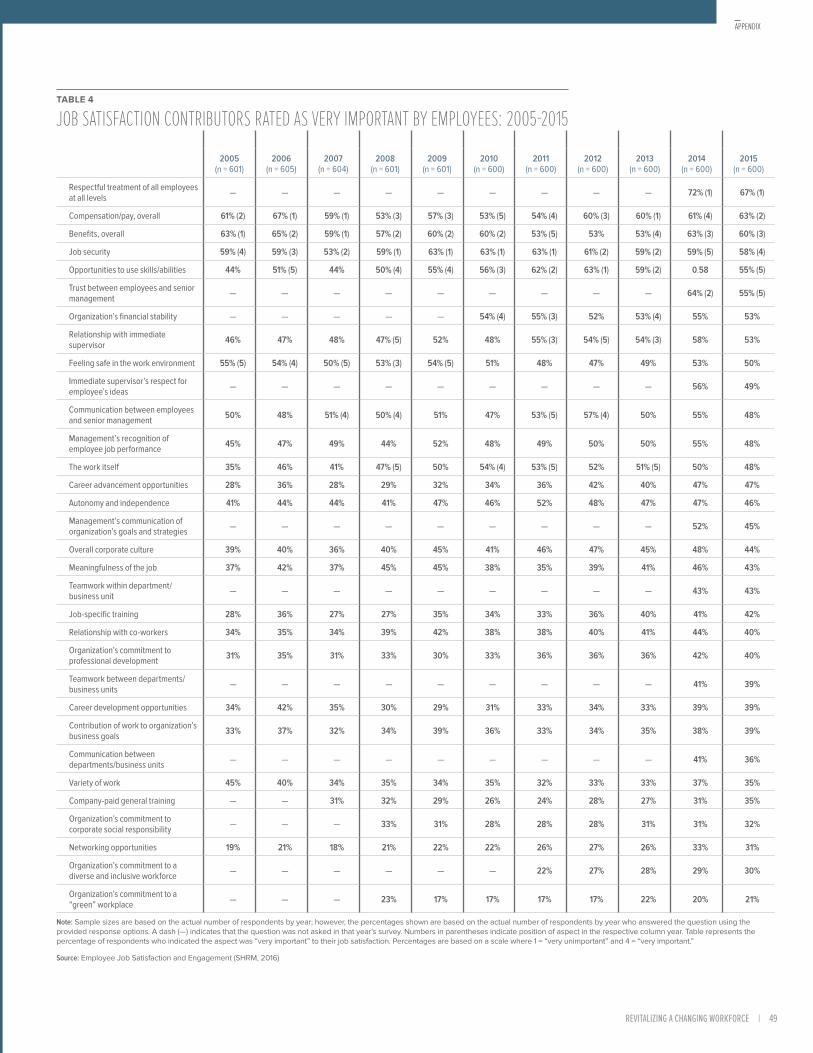
REVITALIZING A CHANGING WORKFORCE | 49
TABLE 4
JOB SATISFACTION CONTRIBUTORS RATED AS VERY IMPORTANT BY EMPLOYEES: 2005-2015
2005 (n = 601)
2006 (n = 605)
2007 (n = 604)
2008 (n = 601)
2009 (n = 601)
2010 (n = 600)
2011 (n = 600)
2012 (n = 600)
2013 (n = 600)
2014 (n = 600)
2015 (n = 600)
Respectful treatment of all employees at all levels — — — — — — — — — 72% (1) 67% (1)
Compensation/pay, overall 61% (2) 67% (1) 59% (1) 53% (3) 57% (3) 53% (5) 54% (4) 60% (3) 60% (1) 61% (4) 63% (2)
Benefits, overall 63% (1) 65% (2) 59% (1) 57% (2) 60% (2) 60% (2) 53% (5) 53% 53% (4) 63% (3) 60% (3)
Job security 59% (4) 59% (3) 53% (2) 59% (1) 63% (1) 63% (1) 63% (1) 61% (2) 59% (2) 59% (5) 58% (4)
Opportunities to use skills/abilities 44% 51% (5) 44% 50% (4) 55% (4) 56% (3) 62% (2) 63% (1) 59% (2) 0.58 55% (5)
Trust between employees and senior management — — — — — — — — — 64% (2) 55% (5)
Organization’s financial stability — — — — — 54% (4) 55% (3) 52% 53% (4) 55% 53%
Relationship with immediate supervisor 46% 47% 48% 47% (5) 52% 48% 55% (3) 54% (5) 54% (3) 58% 53%
Feeling safe in the work environment 55% (5) 54% (4) 50% (5) 53% (3) 54% (5) 51% 48% 47% 49% 53% 50%
Immediate supervisor’s respect for employee’s ideas — — — — — — — — — 56% 49%
Communication between employees and senior management 50% 48% 51% (4) 50% (4) 51% 47% 53% (5) 57% (4) 50% 55% 48%
Management’s recognition of employee job performance 45% 47% 49% 44% 52% 48% 49% 50% 50% 55% 48%
The work itself 35% 46% 41% 47% (5) 50% 54% (4) 53% (5) 52% 51% (5) 50% 48%
Career advancement opportunities 28% 36% 28% 29% 32% 34% 36% 42% 40% 47% 47%
Autonomy and independence 41% 44% 44% 41% 47% 46% 52% 48% 47% 47% 46%
Management’s communication of organization’s goals and strategies — — — — — — — — — 52% 45%
Overall corporate culture 39% 40% 36% 40% 45% 41% 46% 47% 45% 48% 44%
Meaningfulness of the job 37% 42% 37% 45% 45% 38% 35% 39% 41% 46% 43%
Teamwork within department/business unit — — — — — — — — — 43% 43%
Job-specific training 28% 36% 27% 27% 35% 34% 33% 36% 40% 41% 42%
Relationship with co-workers 34% 35% 34% 39% 42% 38% 38% 40% 41% 44% 40%
Organization’s commitment to professional development 31% 35% 31% 33% 30% 33% 36% 36% 36% 42% 40%
Teamwork between departments/business units — — — — — — — — — 41% 39%
Career development opportunities 34% 42% 35% 30% 29% 31% 33% 34% 33% 39% 39%
Contribution of work to organization’s business goals 33% 37% 32% 34% 39% 36% 33% 34% 35% 38% 39%
Communication between departments/business units — — — — — — — — — 41% 36%
Variety of work 45% 40% 34% 35% 34% 35% 32% 33% 33% 37% 35%
Company-paid general training — — 31% 32% 29% 26% 24% 28% 27% 31% 35%
Organization’s commitment to corporate social responsibility — — — 33% 31% 28% 28% 28% 31% 31% 32%
Networking opportunities 19% 21% 18% 21% 22% 22% 26% 27% 26% 33% 31%
Organization’s commitment to a diverse and inclusive workforce — — — — — — 22% 27% 28% 29% 30%
Organization’s commitment to a “green” workplace — — — 23% 17% 17% 17% 17% 22% 20% 21%
Note: Sample sizes are based on the actual number of respondents by year; however, the percentages shown are based on the actual number of respondents by year who answered the question using the provided response options. A dash (—) indicates that the question was not asked in that year’s survey. Numbers in parentheses indicate position of aspect in the respective column year. Table represents the percentage of respondents who indicated the aspect was “very important” to their job satisfaction. Percentages are based on a scale where 1 = “very unimportant” and 4 = “very important.”
Source: Employee Job Satisfaction and Engagement (SHRM, 2016)
APPENDIX
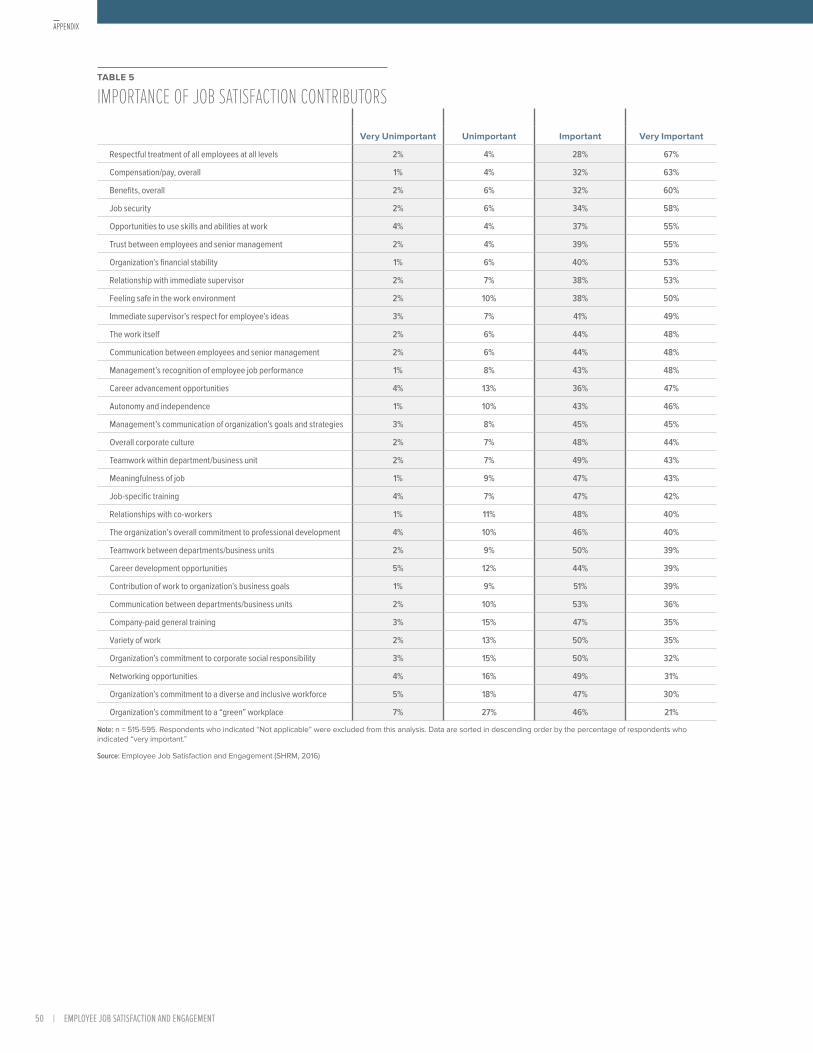
50 | EMPLOYEE JOB SATISFACTION AND ENGAGEMENT
TABLE 5
IMPORTANCE OF JOB SATISFACTION CONTRIBUTORS
Very Unimportant Unimportant Important Very Important
Respectful treatment of all employees at all levels 2% 4% 28% 67%
Compensation/pay, overall 1% 4% 32% 63%
Benefits, overall 2% 6% 32% 60%
Job security 2% 6% 34% 58%
Opportunities to use skills and abilities at work 4% 4% 37% 55%
Trust between employees and senior management 2% 4% 39% 55%
Organization’s financial stability 1% 6% 40% 53%
Relationship with immediate supervisor 2% 7% 38% 53%
Feeling safe in the work environment 2% 10% 38% 50%
Immediate supervisor’s respect for employee’s ideas 3% 7% 41% 49%
The work itself 2% 6% 44% 48%
Communication between employees and senior management 2% 6% 44% 48%
Management’s recognition of employee job performance 1% 8% 43% 48%
Career advancement opportunities 4% 13% 36% 47%
Autonomy and independence 1% 10% 43% 46%
Management’s communication of organization’s goals and strategies 3% 8% 45% 45%
Overall corporate culture 2% 7% 48% 44%
Teamwork within department/business unit 2% 7% 49% 43%
Meaningfulness of job 1% 9% 47% 43%
Job-specific training 4% 7% 47% 42%
Relationships with co-workers 1% 11% 48% 40%
The organization’s overall commitment to professional development 4% 10% 46% 40%
Teamwork between departments/business units 2% 9% 50% 39%
Career development opportunities 5% 12% 44% 39%
Contribution of work to organization’s business goals 1% 9% 51% 39%
Communication between departments/business units 2% 10% 53% 36%
Company-paid general training 3% 15% 47% 35%
Variety of work 2% 13% 50% 35%
Organization’s commitment to corporate social responsibility 3% 15% 50% 32%
Networking opportunities 4% 16% 49% 31%
Organization’s commitment to a diverse and inclusive workforce 5% 18% 47% 30%
Organization’s commitment to a “green” workplace 7% 27% 46% 21%
Note: n = 515-595. Respondents who indicated “Not applicable” were excluded from this analysis. Data are sorted in descending order by the percentage of respondents who indicated “very important.”
Source: Employee Job Satisfaction and Engagement (SHRM, 2016)
APPENDIX

REVITALIZING A CHANGING WORKFORCE | 51
TABLE 6
IMPORTANCE OF JOB SATISFACTION CONTRIBUTORS, BY SELECT EMPLOYEE DEMOGRAPHICS
OverallDifferences Based on
GenderDifferences Based on
Generation/AgeDifferences Based on
Job Level
Compensation/pay, overall 95% — — Professional nonmanagement (98%) > nonexempt (hourly) (92%)
Respectful treatment of all employees at all levels 94% — — —
Trust between employees and senior management 94% — — —
Organization’s financial stability 93% — — —
Benefits, overall 93% — — —
Job security 92% — — —
Communication between employees and senior management 92% — — —
The work itself 92% — —Professional nonmanagement
(95%), middle management (95%) > nonexempt (hourly) (86%)
Overall corporate culture 92% — — Middle management (95%) > nonexempt (hourly) (87%)
Teamwork within department/business unit 92% — — —
Opportunities to use skills/abilities 92% — — —
Relationship with immediate supervisor 91% — — —
Management’s recognition of employee job performance 91% — — —
Immediate supervisor’s respect for employee’s ideas 90% — — —
Management’s communication of organization’s goals and strategies 90% — — —
Meaningfulness of the job 90% — — —
Contribution of work to organization’s business goals 90% — — Middle management (94%) > nonexempt (hourly) (84%)
Teamwork between departments/ business units 89% — — —
Autonomy and independence 89% — — —
Job-specific training 89% Females (92%) > males (87%) Millennials (95%) > Baby Boomers (83%) —
Communication between departments/business units 88% — — Professional nonmanagement (92%) > nonexempt (hourly) (82%)
Relationship with co-workers 88% — — —
Feeling safe in the work environment 88% Females (92%) > males (85%) — —
Organization’s commitment to professional development 86% — Generation X (89%) > Baby Boomers (79%) —
Variety of work 84% — —Professional nonmanagement
(87%), middle management (88%) > nonexempt (hourly) (76%)
Career development opportunities 83% — Millennials (88%) > Baby Boomers (76%) —
Career advancement opportunities 83% —Millennials (89%),
Generation X (86%) > Baby Boomers (73%)
Professional nonmanagement (88%) > executives (71%)
Organization’s commitment to corporate social responsibility 82% Females (86%) > males (78%) — —
Company-paid general training 82% — — —
Networking opportunities 80% — — —
Organization’s commitment to a diverse and inclusive workforce 77% Females (83%) > males (71%) — —
Organization’s commitment to a “green” workplace 67% — — —
Note: A dash (—) indicates that there were no statistically significant differences by the respective demographic (e.g., by gender). Table represents the percentage of responding employees who reported each aspect was “important” or “very important” to their job satisfaction. Percentages are based on a scale where 1 = “very unimportant” and 4 = “very important.” Data are sorted in descending order by the “overall” percentage column. Respondents who indicated “Not applicable” were excluded from this analysis.
Source: Employee Job Satisfaction and Engagement (SHRM, 2016)
APPENDIX

52 | EMPLOYEE JOB SATISFACTION AND ENGAGEMENT
TABLE 7
TOP FIVE JOB SATISFACTION CONTRIBUTORS RATED AS VERY IMPORTANT, BY EMPLOYEE GENDER
First Second Third Fourth Fifth
Male
Respectful treatment of all employees at all levels Compensation, overall Benefits, overall Job security Opportunities to use skills/abilities; trust
between employees and senior management
64% 60% 59% 56% 55%
Female
Respectful treatment of all employees at all levels Compensation, overall Benefits, overall Job security
Opportunities to use skills/abilities; relationship with immediate supervisor; trust between
employees and senior management; feeling safe in the work environment
69% 65% 61% 60% 55%
Note: Table represents the percentage of respondents who rated each aspect as “very important” to their job satisfaction. Percentages are based on a scale where 1 = “very unimportant” and 4 = “very important.” Source: Employee Job Satisfaction and Engagement (SHRM, 2016)
TABLE 8
TOP FIVE JOB SATISFACTION CONTRIBUTORS RATED AS VERY IMPORTANT, BY EMPLOYEE GENERATION/AGE
First Second Third Fourth Fifth
Millennials
Respectful treatment of all employees at all levels Compensation, overall Benefits, overall Job security
Opportunities to use skills/abilities; relationship with immediate
supervisor; trust between employees and senior management
66% 65% 61% 58% 55%
Generation X
Respectful treatment of all employees at all levels
Compensation, overall; job security Benefits, overall Opportunities to use
skills/abilities
Trust between employees and senior management; organization’s financial
stability
70% 66% 65% 58% 56%
Baby Boomers
Respectful treatment of all employees at all levels Compensation, overall
Trust between employees and
senior management; organization’s financial
stability
Benefits, overall Relationship with immediate supervisor
63% 57% 54% 53% 52%
Note: Table represents the percentage of respondents who rated each aspect “very important” to their job satisfaction. Percentages are based on a scale where 1 = “very unimportant” and 4 = “very important.” Responses from Veterans were not shown due to a small sample size (n < 25). Source: Employee Job Satisfaction and Engagement (SHRM, 2016)
TABLE 9
TOP FIVE JOB SATISFACTION CONTRIBUTORS RATED AS VERY IMPORTANT, BY EMPLOYEE JOB LEVEL
First Second Third Fourth Fifth
Nonexempt (hourly) nonmanagement
Respectful treatment of all employees at all levels
Compensation/pay, overall; benefits, overall Job security
Trust between employees and senior
management
Feeling safe in the work environment;
organization’s financial stability
65% 64% 60% 50% 49%
Professional nonmanagement
Respectful treatment of all employees at all levels
Compensation/pay, overall Benefits, overall Job security
Opportunities to use skills/abilities; relationship with
immediate supervisor
70% 64% 63% 59% 57%
Middle management
Respectful treatment of all employees at all levels
Trust between employees and
senior management; compensation, overall
Opportunities to use skills/abilities
Relationship with immediate supervisor
Immediate supervisor’s respect for employee’s ideas; benefits, overall;
job security
66% 61% 60% 58% 57%
Executive management
Opportunities to use skills/abilities
Communication between employees and
senior management
Respectful treatment of all employees at all
levels
Organization’s financial stability Compensation, overall
72% 64% 63% 62% 57%
Note: Table represents the percentage of respondents who rated each aspect as “very important” to their job satisfaction. Percentages are based on a scale where 1 = “very unimportant” and 4 = “very important.” Source: Employee Job Satisfaction and Engagement (SHRM, 2016)
APPENDIX
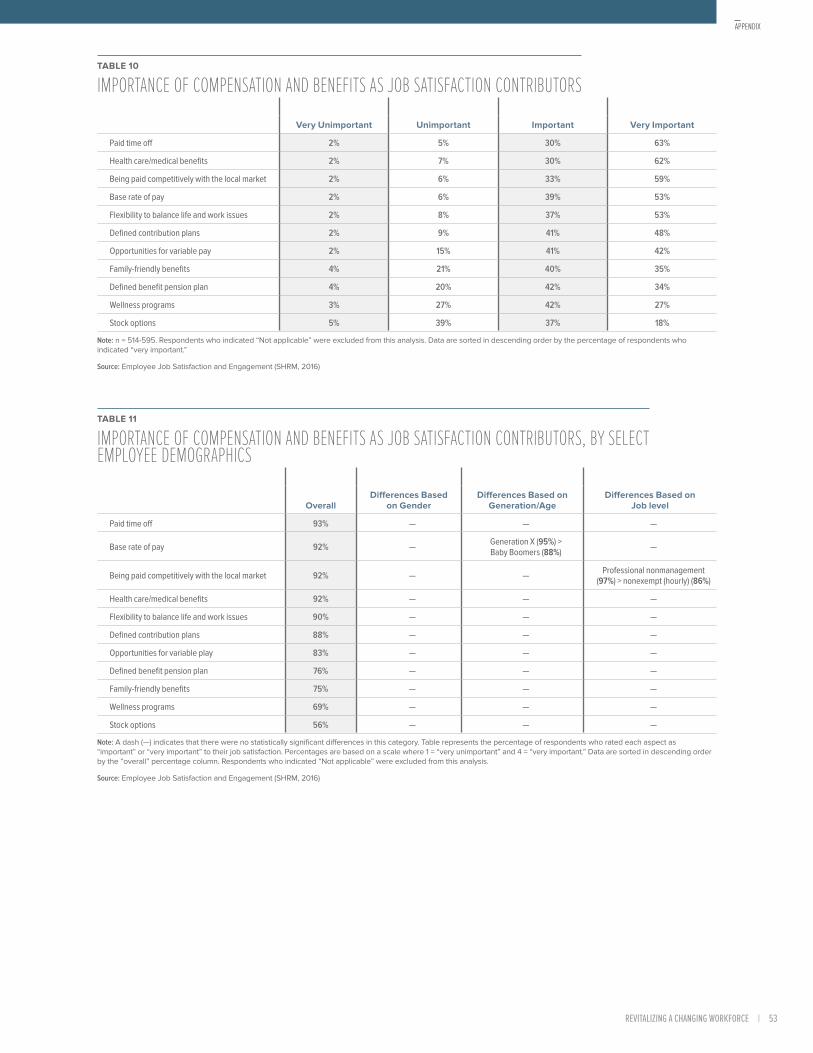
REVITALIZING A CHANGING WORKFORCE | 53
TABLE 10
IMPORTANCE OF COMPENSATION AND BENEFITS AS JOB SATISFACTION CONTRIBUTORS
Very Unimportant Unimportant Important Very Important
Paid time off 2% 5% 30% 63%
Health care/medical benefits 2% 7% 30% 62%
Being paid competitively with the local market 2% 6% 33% 59%
Base rate of pay 2% 6% 39% 53%
Flexibility to balance life and work issues 2% 8% 37% 53%
Defined contribution plans 2% 9% 41% 48%
Opportunities for variable pay 2% 15% 41% 42%
Family-friendly benefits 4% 21% 40% 35%
Defined benefit pension plan 4% 20% 42% 34%
Wellness programs 3% 27% 42% 27%
Stock options 5% 39% 37% 18%
Note: n = 514-595. Respondents who indicated “Not applicable” were excluded from this analysis. Data are sorted in descending order by the percentage of respondents who indicated “very important.”
Source: Employee Job Satisfaction and Engagement (SHRM, 2016)
TABLE 11
IMPORTANCE OF COMPENSATION AND BENEFITS AS JOB SATISFACTION CONTRIBUTORS, BY SELECT EMPLOYEE DEMOGRAPHICS
Overall
Differences Based on Gender
Differences Based on Generation/Age
Differences Based on Job level
Paid time off 93% — — —
Base rate of pay 92% — Generation X (95%) > Baby Boomers (88%) —
Being paid competitively with the local market 92% — — Professional nonmanagement (97%) > nonexempt (hourly) (86%)
Health care/medical benefits 92% — — —
Flexibility to balance life and work issues 90% — — —
Defined contribution plans 88% — — —
Opportunities for variable play 83% — — —
Defined benefit pension plan 76% — — —
Family-friendly benefits 75% — — —
Wellness programs 69% — — —
Stock options 56% — — —
Note: A dash (—) indicates that there were no statistically significant differences in this category. Table represents the percentage of respondents who rated each aspect as “important” or “very important” to their job satisfaction. Percentages are based on a scale where 1 = “very unimportant” and 4 = “very important.” Data are sorted in descending order by the “overall” percentage column. Respondents who indicated “Not applicable” were excluded from this analysis.
Source: Employee Job Satisfaction and Engagement (SHRM, 2016)
APPENDIX
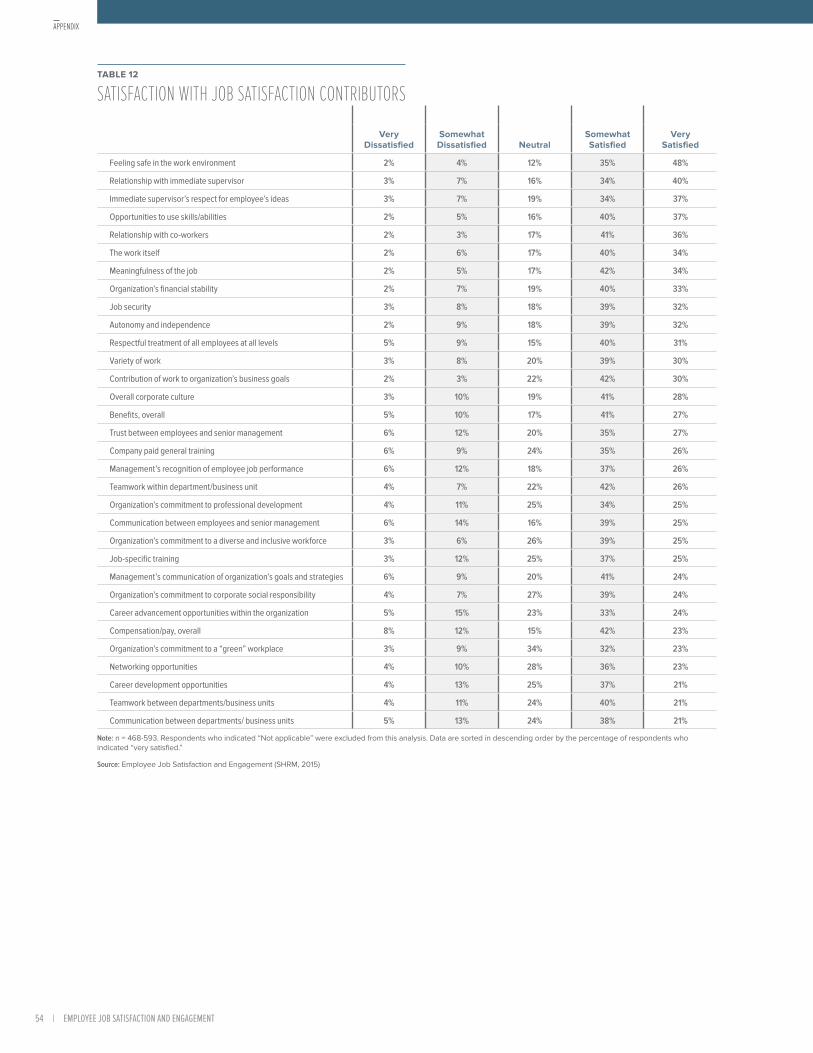
54 | EMPLOYEE JOB SATISFACTION AND ENGAGEMENT
TABLE 12
SATISFACTION WITH JOB SATISFACTION CONTRIBUTORS
Very Dissatisfied
Somewhat Dissatisfied Neutral
Somewhat Satisfied
Very Satisfied
Feeling safe in the work environment 2% 4% 12% 35% 48%
Relationship with immediate supervisor 3% 7% 16% 34% 40%
Immediate supervisor’s respect for employee’s ideas 3% 7% 19% 34% 37%
Opportunities to use skills/abilities 2% 5% 16% 40% 37%
Relationship with co-workers 2% 3% 17% 41% 36%
The work itself 2% 6% 17% 40% 34%
Meaningfulness of the job 2% 5% 17% 42% 34%
Organization’s financial stability 2% 7% 19% 40% 33%
Job security 3% 8% 18% 39% 32%
Autonomy and independence 2% 9% 18% 39% 32%
Respectful treatment of all employees at all levels 5% 9% 15% 40% 31%
Variety of work 3% 8% 20% 39% 30%
Contribution of work to organization’s business goals 2% 3% 22% 42% 30%
Overall corporate culture 3% 10% 19% 41% 28%
Benefits, overall 5% 10% 17% 41% 27%
Trust between employees and senior management 6% 12% 20% 35% 27%
Company paid general training 6% 9% 24% 35% 26%
Management’s recognition of employee job performance 6% 12% 18% 37% 26%
Teamwork within department/business unit 4% 7% 22% 42% 26%
Organization’s commitment to professional development 4% 11% 25% 34% 25%
Communication between employees and senior management 6% 14% 16% 39% 25%
Organization’s commitment to a diverse and inclusive workforce 3% 6% 26% 39% 25%
Job-specific training 3% 12% 25% 37% 25%
Management’s communication of organization’s goals and strategies 6% 9% 20% 41% 24%
Organization’s commitment to corporate social responsibility 4% 7% 27% 39% 24%
Career advancement opportunities within the organization 5% 15% 23% 33% 24%
Compensation/pay, overall 8% 12% 15% 42% 23%
Organization’s commitment to a “green” workplace 3% 9% 34% 32% 23%
Networking opportunities 4% 10% 28% 36% 23%
Career development opportunities 4% 13% 25% 37% 21%
Teamwork between departments/business units 4% 11% 24% 40% 21%
Communication between departments/ business units 5% 13% 24% 38% 21%
Note: n = 468-593. Respondents who indicated “Not applicable” were excluded from this analysis. Data are sorted in descending order by the percentage of respondents who indicated “very satisfied.”
Source: Employee Job Satisfaction and Engagement (SHRM, 2015)
APPENDIX
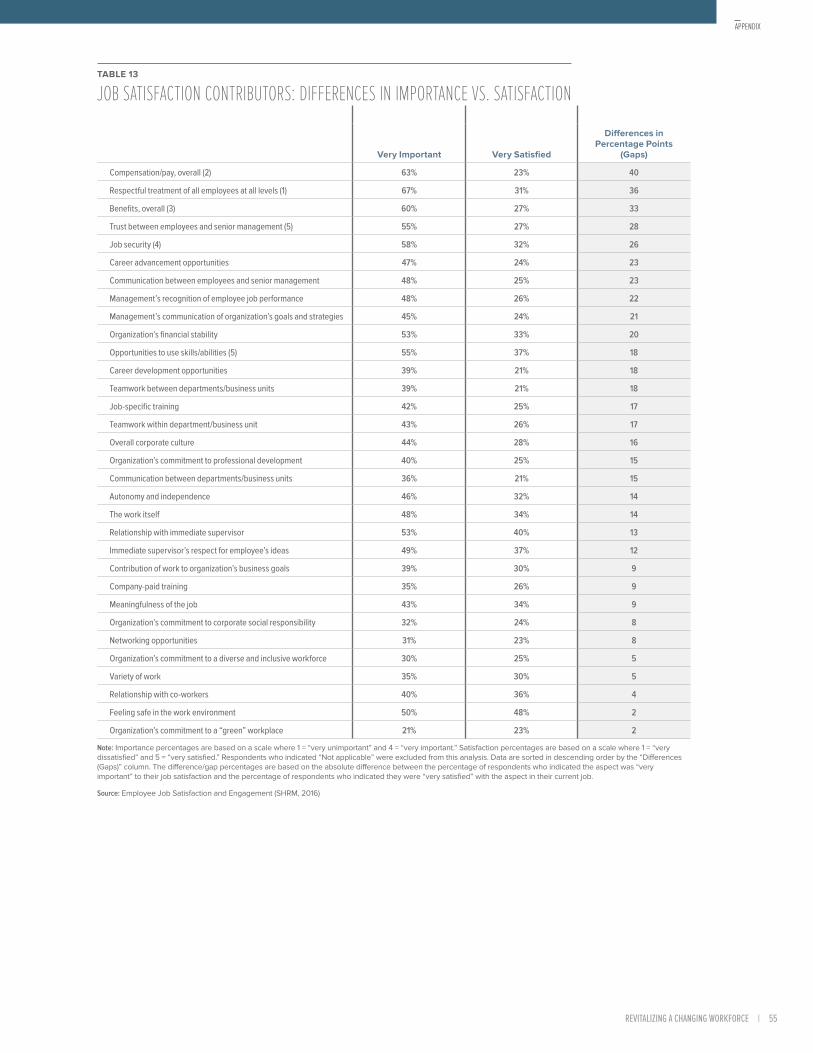
REVITALIZING A CHANGING WORKFORCE | 55
TABLE 12
SATISFACTION WITH JOB SATISFACTION CONTRIBUTORS
Very Dissatisfied
Somewhat Dissatisfied Neutral
Somewhat Satisfied
Very Satisfied
Feeling safe in the work environment 2% 4% 12% 35% 48%
Relationship with immediate supervisor 3% 7% 16% 34% 40%
Immediate supervisor’s respect for employee’s ideas 3% 7% 19% 34% 37%
Opportunities to use skills/abilities 2% 5% 16% 40% 37%
Relationship with co-workers 2% 3% 17% 41% 36%
The work itself 2% 6% 17% 40% 34%
Meaningfulness of the job 2% 5% 17% 42% 34%
Organization’s financial stability 2% 7% 19% 40% 33%
Job security 3% 8% 18% 39% 32%
Autonomy and independence 2% 9% 18% 39% 32%
Respectful treatment of all employees at all levels 5% 9% 15% 40% 31%
Variety of work 3% 8% 20% 39% 30%
Contribution of work to organization’s business goals 2% 3% 22% 42% 30%
Overall corporate culture 3% 10% 19% 41% 28%
Benefits, overall 5% 10% 17% 41% 27%
Trust between employees and senior management 6% 12% 20% 35% 27%
Company paid general training 6% 9% 24% 35% 26%
Management’s recognition of employee job performance 6% 12% 18% 37% 26%
Teamwork within department/business unit 4% 7% 22% 42% 26%
Organization’s commitment to professional development 4% 11% 25% 34% 25%
Communication between employees and senior management 6% 14% 16% 39% 25%
Organization’s commitment to a diverse and inclusive workforce 3% 6% 26% 39% 25%
Job-specific training 3% 12% 25% 37% 25%
Management’s communication of organization’s goals and strategies 6% 9% 20% 41% 24%
Organization’s commitment to corporate social responsibility 4% 7% 27% 39% 24%
Career advancement opportunities within the organization 5% 15% 23% 33% 24%
Compensation/pay, overall 8% 12% 15% 42% 23%
Organization’s commitment to a “green” workplace 3% 9% 34% 32% 23%
Networking opportunities 4% 10% 28% 36% 23%
Career development opportunities 4% 13% 25% 37% 21%
Teamwork between departments/business units 4% 11% 24% 40% 21%
Communication between departments/ business units 5% 13% 24% 38% 21%
Note: n = 468-593. Respondents who indicated “Not applicable” were excluded from this analysis. Data are sorted in descending order by the percentage of respondents who indicated “very satisfied.”
Source: Employee Job Satisfaction and Engagement (SHRM, 2015)
TABLE 13
JOB SATISFACTION CONTRIBUTORS: DIFFERENCES IN IMPORTANCE VS. SATISFACTION
Very Important Very Satisfied
Differences in Percentage Points
(Gaps)
Compensation/pay, overall (2) 63% 23% 40
Respectful treatment of all employees at all levels (1) 67% 31% 36
Benefits, overall (3) 60% 27% 33
Trust between employees and senior management (5) 55% 27% 28
Job security (4) 58% 32% 26
Career advancement opportunities 47% 24% 23
Communication between employees and senior management 48% 25% 23
Management’s recognition of employee job performance 48% 26% 22
Management’s communication of organization’s goals and strategies 45% 24% 21
Organization’s financial stability 53% 33% 20
Opportunities to use skills/abilities (5) 55% 37% 18
Career development opportunities 39% 21% 18
Teamwork between departments/business units 39% 21% 18
Job-specific training 42% 25% 17
Teamwork within department/business unit 43% 26% 17
Overall corporate culture 44% 28% 16
Organization’s commitment to professional development 40% 25% 15
Communication between departments/business units 36% 21% 15
Autonomy and independence 46% 32% 14
The work itself 48% 34% 14
Relationship with immediate supervisor 53% 40% 13
Immediate supervisor’s respect for employee’s ideas 49% 37% 12
Contribution of work to organization’s business goals 39% 30% 9
Company-paid training 35% 26% 9
Meaningfulness of the job 43% 34% 9
Organization’s commitment to corporate social responsibility 32% 24% 8
Networking opportunities 31% 23% 8
Organization’s commitment to a diverse and inclusive workforce 30% 25% 5
Variety of work 35% 30% 5
Relationship with co-workers 40% 36% 4
Feeling safe in the work environment 50% 48% 2
Organization’s commitment to a “green” workplace 21% 23% 2
Note: Importance percentages are based on a scale where 1 = “very unimportant” and 4 = “very important.” Satisfaction percentages are based on a scale where 1 = “very dissatisfied” and 5 = “very satisfied.” Respondents who indicated “Not applicable” were excluded from this analysis. Data are sorted in descending order by the “Differences (Gaps)” column. The difference/gap percentages are based on the absolute difference between the percentage of respondents who indicated the aspect was “very important” to their job satisfaction and the percentage of respondents who indicated they were “very satisfied” with the aspect in their current job.
Source: Employee Job Satisfaction and Engagement (SHRM, 2016)
APPENDIX
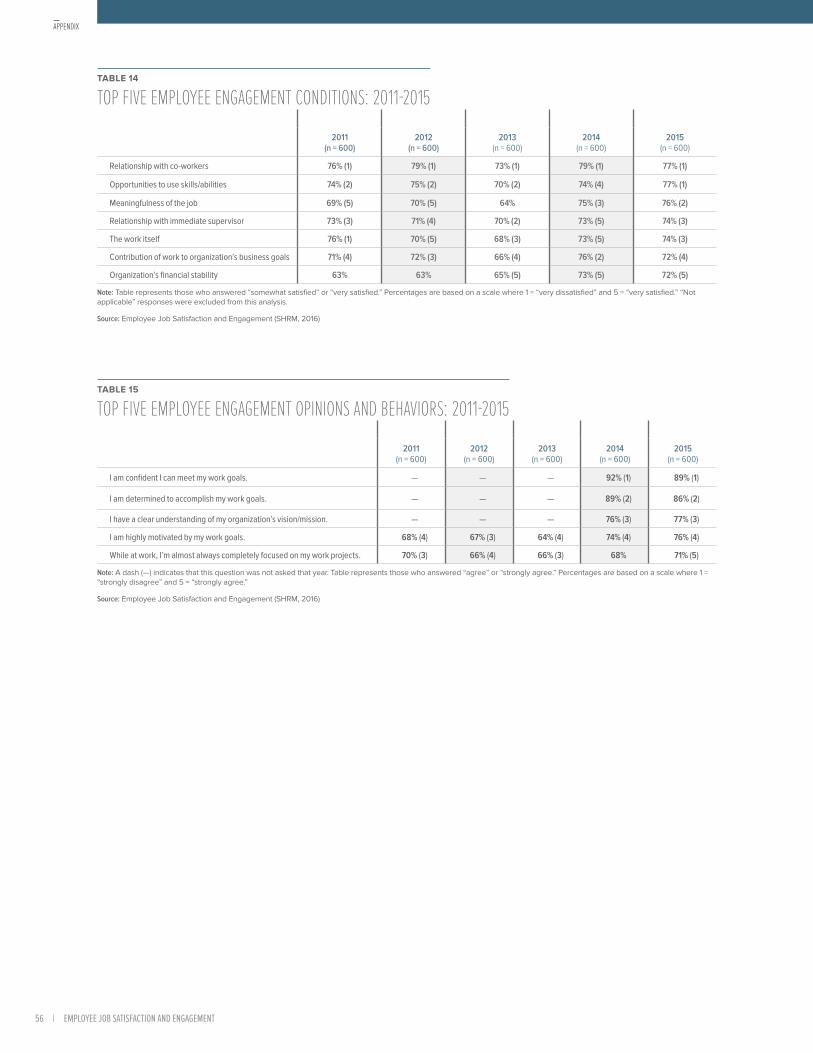
56 | EMPLOYEE JOB SATISFACTION AND ENGAGEMENT
TABLE 14
TOP FIVE EMPLOYEE ENGAGEMENT CONDITIONS: 2011-2015
2011 (n = 600)
2012 (n = 600)
2013 (n = 600)
2014 (n = 600)
2015 (n = 600)
Relationship with co-workers 76% (1) 79% (1) 73% (1) 79% (1) 77% (1)
Opportunities to use skills/abilities 74% (2) 75% (2) 70% (2) 74% (4) 77% (1)
Meaningfulness of the job 69% (5) 70% (5) 64% 75% (3) 76% (2)
Relationship with immediate supervisor 73% (3) 71% (4) 70% (2) 73% (5) 74% (3)
The work itself 76% (1) 70% (5) 68% (3) 73% (5) 74% (3)
Contribution of work to organization’s business goals 71% (4) 72% (3) 66% (4) 76% (2) 72% (4)
Organization’s financial stability 63% 63% 65% (5) 73% (5) 72% (5)
Note: Table represents those who answered “somewhat satisfied” or “very satisfied.” Percentages are based on a scale where 1 = “very dissatisfied” and 5 = “very satisfied.” “Not applicable” responses were excluded from this analysis.
Source: Employee Job Satisfaction and Engagement (SHRM, 2016)
TABLE 15
TOP FIVE EMPLOYEE ENGAGEMENT OPINIONS AND BEHAVIORS: 2011-2015
2011 (n = 600)
2012 (n = 600)
2013 (n = 600)
2014 (n = 600)
2015 (n = 600)
I am confident I can meet my work goals. — — — 92% (1) 89% (1)
I am determined to accomplish my work goals. — — — 89% (2) 86% (2)
I have a clear understanding of my organization’s vision/mission. — — — 76% (3) 77% (3)
I am highly motivated by my work goals. 68% (4) 67% (3) 64% (4) 74% (4) 76% (4)
While at work, I’m almost always completely focused on my work projects. 70% (3) 66% (4) 66% (3) 68% 71% (5)
Note: A dash (—) indicates that this question was not asked that year. Table represents those who answered “agree” or “strongly agree.” Percentages are based on a scale where 1 = “strongly disagree” and 5 = “strongly agree.”
Source: Employee Job Satisfaction and Engagement (SHRM, 2016)
APPENDIX
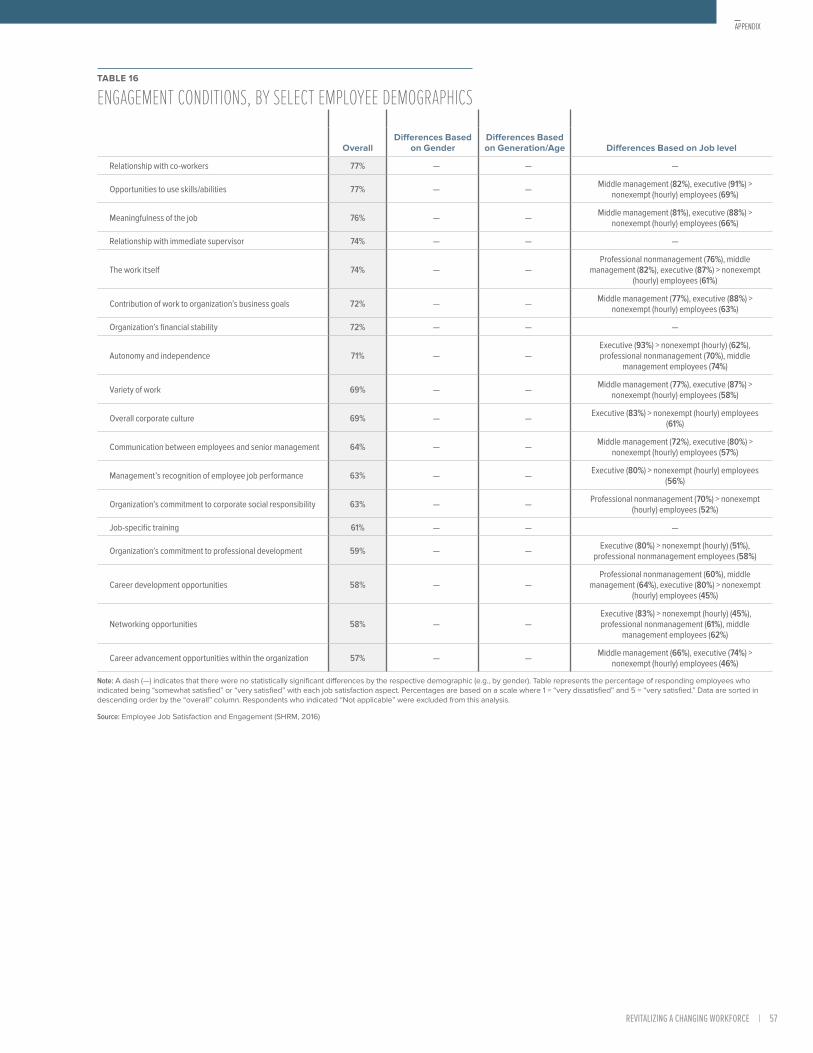
REVITALIZING A CHANGING WORKFORCE | 57
TABLE 15
TOP FIVE EMPLOYEE ENGAGEMENT OPINIONS AND BEHAVIORS: 2011-2015
2011 (n = 600)
2012 (n = 600)
2013 (n = 600)
2014 (n = 600)
2015 (n = 600)
I am confident I can meet my work goals. — — — 92% (1) 89% (1)
I am determined to accomplish my work goals. — — — 89% (2) 86% (2)
I have a clear understanding of my organization’s vision/mission. — — — 76% (3) 77% (3)
I am highly motivated by my work goals. 68% (4) 67% (3) 64% (4) 74% (4) 76% (4)
While at work, I’m almost always completely focused on my work projects. 70% (3) 66% (4) 66% (3) 68% 71% (5)
Note: A dash (—) indicates that this question was not asked that year. Table represents those who answered “agree” or “strongly agree.” Percentages are based on a scale where 1 = “strongly disagree” and 5 = “strongly agree.”
Source: Employee Job Satisfaction and Engagement (SHRM, 2016)
TABLE 16
ENGAGEMENT CONDITIONS, BY SELECT EMPLOYEE DEMOGRAPHICS
OverallDifferences Based
on GenderDifferences Based on Generation/Age Differences Based on Job level
Relationship with co-workers 77% — — —
Opportunities to use skills/abilities 77% — — Middle management (82%), executive (91%) > nonexempt (hourly) employees (69%)
Meaningfulness of the job 76% — — Middle management (81%), executive (88%) > nonexempt (hourly) employees (66%)
Relationship with immediate supervisor 74% — — —
The work itself 74% — —Professional nonmanagement (76%), middle
management (82%), executive (87%) > nonexempt (hourly) employees (61%)
Contribution of work to organization’s business goals 72% — — Middle management (77%), executive (88%) > nonexempt (hourly) employees (63%)
Organization’s financial stability 72% — — —
Autonomy and independence 71% — —Executive (93%) > nonexempt (hourly) (62%), professional nonmanagement (70%), middle
management employees (74%)
Variety of work 69% — — Middle management (77%), executive (87%) > nonexempt (hourly) employees (58%)
Overall corporate culture 69% — — Executive (83%) > nonexempt (hourly) employees (61%)
Communication between employees and senior management 64% — — Middle management (72%), executive (80%) > nonexempt (hourly) employees (57%)
Management’s recognition of employee job performance 63% — — Executive (80%) > nonexempt (hourly) employees (56%)
Organization’s commitment to corporate social responsibility 63% — — Professional nonmanagement (70%) > nonexempt (hourly) employees (52%)
Job-specific training 61% — — —
Organization’s commitment to professional development 59% — — Executive (80%) > nonexempt (hourly) (51%), professional nonmanagement employees (58%)
Career development opportunities 58% — —Professional nonmanagement (60%), middle
management (64%), executive (80%) > nonexempt (hourly) employees (45%)
Networking opportunities 58% — — Executive (83%) > nonexempt (hourly) (45%), professional nonmanagement (61%), middle
management employees (62%)
Career advancement opportunities within the organization 57% — — Middle management (66%), executive (74%) > nonexempt (hourly) employees (46%)
Note: A dash (—) indicates that there were no statistically significant differences by the respective demographic (e.g., by gender). Table represents the percentage of responding employees who indicated being “somewhat satisfied” or “very satisfied” with each job satisfaction aspect. Percentages are based on a scale where 1 = “very dissatisfied” and 5 = “very satisfied.” Data are sorted in descending order by the “overall” column. Respondents who indicated “Not applicable” were excluded from this analysis.
Source: Employee Job Satisfaction and Engagement (SHRM, 2016)
APPENDIX
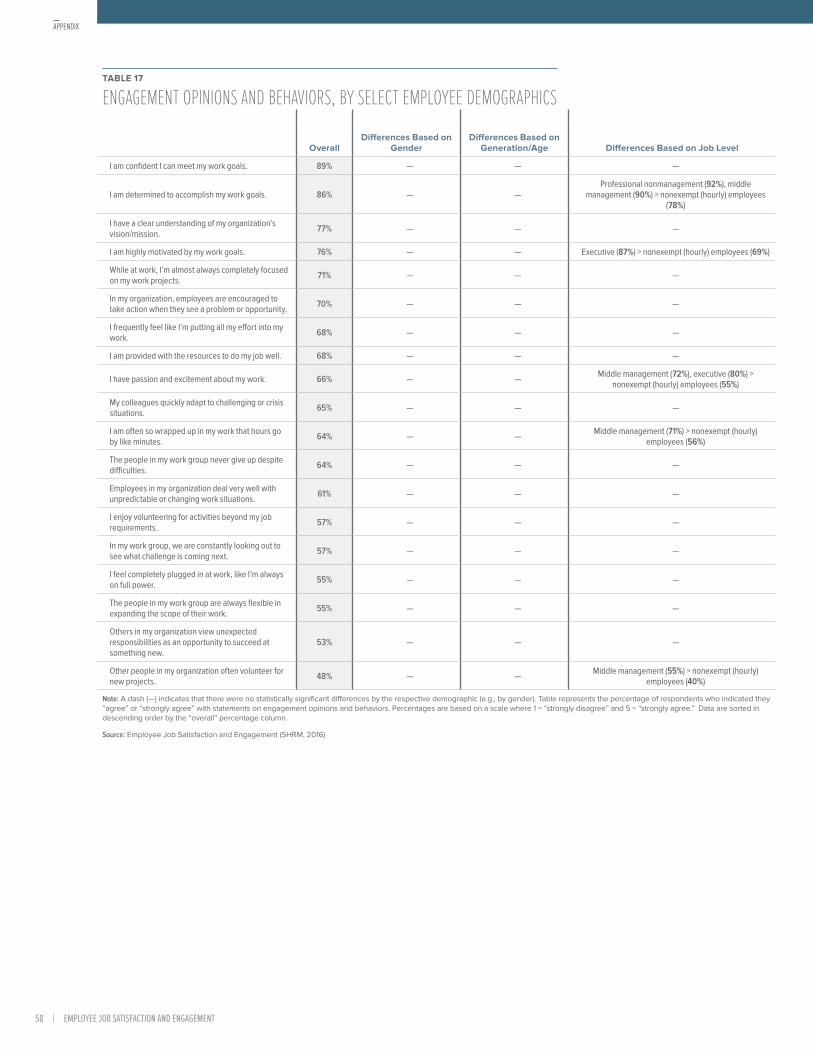
58 | EMPLOYEE JOB SATISFACTION AND ENGAGEMENT
TABLE 17
ENGAGEMENT OPINIONS AND BEHAVIORS, BY SELECT EMPLOYEE DEMOGRAPHICS
Overall
Differences Based on Gender
Differences Based on Generation/Age Differences Based on Job Level
I am confident I can meet my work goals. 89% — — —
I am determined to accomplish my work goals. 86% — —Professional nonmanagement (92%), middle
management (90%) > nonexempt (hourly) employees (78%)
I have a clear understanding of my organization’s vision/mission. 77% — — —
I am highly motivated by my work goals. 76% — — Executive (87%) > nonexempt (hourly) employees (69%)
While at work, I’m almost always completely focused on my work projects. 71% — — —
In my organization, employees are encouraged to take action when they see a problem or opportunity. 70% — — —
I frequently feel like I’m putting all my effort into my work. 68% — — —
I am provided with the resources to do my job well. 68% — — —
I have passion and excitement about my work. 66% — — Middle management (72%), executive (80%) > nonexempt (hourly) employees (55%)
My colleagues quickly adapt to challenging or crisis situations. 65% — — —
I am often so wrapped up in my work that hours go by like minutes. 64% — — Middle management (71%) > nonexempt (hourly)
employees (56%)
The people in my work group never give up despite difficulties. 64% — — —
Employees in my organization deal very well with unpredictable or changing work situations. 61% — — —
I enjoy volunteering for activities beyond my job requirements. 57% — — —
In my work group, we are constantly looking out to see what challenge is coming next. 57% — — —
I feel completely plugged in at work, like I’m always on full power. 55% — — —
The people in my work group are always flexible in expanding the scope of their work. 55% — — —
Others in my organization view unexpected responsibilities as an opportunity to succeed at something new.
53% — — —
Other people in my organization often volunteer for new projects. 48% — — Middle management (55%) > nonexempt (hourly)
employees (40%)
Note: A dash (—) indicates that there were no statistically significant differences by the respective demographic (e.g., by gender). Table represents the percentage of respondents who indicated they “agree” or “strongly agree” with statements on engagement opinions and behaviors. Percentages are based on a scale where 1 = “strongly disagree” and 5 = “strongly agree.” Data are sorted in descending order by the “overall” percentage column.
Source: Employee Job Satisfaction and Engagement (SHRM, 2016)
APPENDIX

REVITALIZING A CHANGING WORKFORCE | 59
TABLE 17
ENGAGEMENT OPINIONS AND BEHAVIORS, BY SELECT EMPLOYEE DEMOGRAPHICS
Overall
Differences Based on Gender
Differences Based on Generation/Age Differences Based on Job Level
I am confident I can meet my work goals. 89% — — —
I am determined to accomplish my work goals. 86% — —Professional nonmanagement (92%), middle
management (90%) > nonexempt (hourly) employees (78%)
I have a clear understanding of my organization’s vision/mission. 77% — — —
I am highly motivated by my work goals. 76% — — Executive (87%) > nonexempt (hourly) employees (69%)
While at work, I’m almost always completely focused on my work projects. 71% — — —
In my organization, employees are encouraged to take action when they see a problem or opportunity. 70% — — —
I frequently feel like I’m putting all my effort into my work. 68% — — —
I am provided with the resources to do my job well. 68% — — —
I have passion and excitement about my work. 66% — — Middle management (72%), executive (80%) > nonexempt (hourly) employees (55%)
My colleagues quickly adapt to challenging or crisis situations. 65% — — —
I am often so wrapped up in my work that hours go by like minutes. 64% — — Middle management (71%) > nonexempt (hourly)
employees (56%)
The people in my work group never give up despite difficulties. 64% — — —
Employees in my organization deal very well with unpredictable or changing work situations. 61% — — —
I enjoy volunteering for activities beyond my job requirements. 57% — — —
In my work group, we are constantly looking out to see what challenge is coming next. 57% — — —
I feel completely plugged in at work, like I’m always on full power. 55% — — —
The people in my work group are always flexible in expanding the scope of their work. 55% — — —
Others in my organization view unexpected responsibilities as an opportunity to succeed at something new.
53% — — —
Other people in my organization often volunteer for new projects. 48% — — Middle management (55%) > nonexempt (hourly)
employees (40%)
Note: A dash (—) indicates that there were no statistically significant differences by the respective demographic (e.g., by gender). Table represents the percentage of respondents who indicated they “agree” or “strongly agree” with statements on engagement opinions and behaviors. Percentages are based on a scale where 1 = “strongly disagree” and 5 = “strongly agree.” Data are sorted in descending order by the “overall” percentage column.
Source: Employee Job Satisfaction and Engagement (SHRM, 2016)

ENDNOTES
REVITALIZING A CHANGING WORKFORCE | 61
1 SHRM Foundation. (2015). Engaging and integrating a younger workforce: KFC South Pacific discussion guide. Retrieved from shrmfoundation.org.
2 Society for Human Resource Management. (2015). The Millennial question. Retrieved from shrm.org.
3 SHRM Foundation. (2015). Generational conflict at work: Separating fact from fiction. Retrieved from shrmfoundation.org.
4 Gavett, G. (2016, January-February). Synthesis generations united. Harvard Business Review. Retrieved from hrb.org.
5 Society for Human Resource Management. (2015). Business and human capital challenges today and in the future. Alexandria, VA: SHRM.
6 Society for Human Resource Management. (2015). SHRM 2015 human capital benchmarking report. Retrieved from shrm.org.
7 Society for Human Resource Management. (2015). 2015 strategic benefits survey—leveraging benefits to recruit employees. Retrieved from shrm.org.
8 Society for Human Resource Management. (2015). The aging workforce—basic and applied skills. Retrieved from shrm.org.
9 Society for Human Resource Management. (2015). SHRM survey findings: The hiring of 2015 college graduates. Retrieved from shrm.org.
10 Society for Human Resource Management. (2015). 2015 employee benefits: An overview of employees benefits offerings in the U.S. Alexandria, VA: SHRM.
11 Society for Human Resource Management. (2015). SHRM 2015 human capital benchmarking report. Retrieved from shrm.org.
12 Society for Human Resource Management. (2016). Using social media for talent acquisition—recruitment and screening. Retrieved from shrm.org.
13 Society for Human Resource Management. (2015). Employee job satisfaction and engagement: Optimizing organizational culture for success. Alexandria, VA: SHRM.
14 Society for Human Resource Management. (2016, January). SHRM LINE employment report. Retrieved from shrm.org/line.
15 Society for Human Resource Management. (2015). 2015 employee benefits: An overview of employees benefits offerings in the U.S. Alexandria, VA: SHRM.
16 Ibid.
17 Society for Human Resource Management. (2015). 2015 SHRM strategic benefits survey—leveraging benefits to recruit employees. Retrieved from shrm.org.
18 Society for Human Resource Management. (2015). 2015 SHRM strategic benefits survey—leveraging benefits to retain employees. Retrieved from shrm.org.
19 Society for Human Resource Management. (2015). 2015 SHRM strategic benefits survey—health care. Retrieved from shrm.org.
20 Society for Human Resource Management. (2014). SHRM/McGraw-Hill Federal Credit Union: Financial wellness in the workplace. Retrieved from shrm.org.
21 Society for Human Resource Management (2014). SHRM/National Center for the Middle Market: HR professionals’ perceptions about performance management effectiveness. Retrieved from shrm.org.
22 Society for Human Resource Management (2015). SHRM/Globoforce: Employee recognition programs. Retrieved from shrm.org.
23 Society for Human Resource Management. (2013). SHRM survey findings: The workplace impact of domestic and sexual violence and stalking. Retrieved from shrm.org.
24 Society for Human Resource Management. (2014). SHRM/ACT survey findings: Job analysis activities. Retrieved from shrm.org.
25 Society for Human Resource Management. (2014). SHRM/Kaplan University School of Business & Information Technology: Recruitment for business and IT employment opportunities. Retrieved from shrm.org.
26 Society for Human Resource Management. (2014). SHRM diversity and inclusion survey. Retrieved from shrm.org.
27 Using a five-point scale, respondents indicated their degree of satisfaction and agreement with items on engagement conditions, opinions and behaviors. For engagement conditions, the following scale was employed: “1” represents “very dissatisfied” and “5” represents “very satisfied.” For engagement opinions and behaviors, “1” represents “strongly disagree” and “5” represents “strongly agree.”
28 U.S. Bureau of Labor Statistics. (2015). Current employment statistics. Retrieved from http://www.bls.gov/ces/.
29 Society for Human Resource Management. (2015). SHRM LINE employment report. Retrieved from shrm.org/line.
30 Society for Human Resource Management. (2015). 2015 strategic benefits—leveraging benefits to recruit employees. Retrieved from shrm.org.
31 Society for Human Resource Management. (2015). Business and human capital challenges today and in the future. Alexandria, VA: SHRM.
ENDNOTES

ADDITIONAL SHRM RESOURCES
REVITALIZING A CHANGING WORKFORCE | 63
Survey and Poll FindingsHow are other organizations handling an HR issue that
your organization is facing? Get the information you need
to make informed decisions about HR policies, practices
and business strategies through SHRM’s survey and poll
findings. Data on new HR- and business-related topics are
released regularly. shrm.org/surveys
Key research reports released annually include the
Employee Benefits research report, which provides
information about various types of benefits U.S.
organizations offer to their employees, such as health care
and welfare benefits, retirement savings and planning
benefits, and financial and compensation benefits. This
comprehensive report includes over 300 benefits and
examines trend data over the last five years.
The Economic Conditions Series examines topics such as
recruiting and skills gaps, organizational financial health
and hiring, and global competition and hiring strategies. In
addition to providing overall results for U.S. organizations,
results are broken out into eight industry-level reports.
Labor Market and Economic DataNeed data on what’s really happening in the job market?
The SHRM LINE Employment Report covers key areas for
recruiting each month, including hiring expectations,
changes in new-hire compensation from month to month
and the only published measure of recruiting difficulty
of highly qualified candidates for the most critical
positions. Results are reported for both the service and
manufacturing sectors. shrm.org/line
The SHRM Jobs Outlook Survey (JOS) examines hiring and
recruiting trends annually in the United States. It is based
on a survey of more than 600 public and private-sector
human resource professionals with a direct role in the
staffing decisions at their respective companies.
shrm.org/jos
SHRM’s Metro Economic Outlook reports provide
comprehensive analyses of the economies of the
largest metropolitan areas in the United States. These
reports include data from SHRM, the private sector and
the government, as well as insights from experts who are
connected to each metro area’s economy.
shrm.org/metrooutlook
Workplace Trends and ForecastingWant to learn more about key trends affecting the
workplace and the HR profession? The latest SHRM
Workplace Forecast: The Top Workplace Trends According to
HR Professionals examines the trends in demographics,
economics, public policy, globalization and technology
that HR professionals think will have the biggest strategic
impact on their organizations and the HR profession in the
years ahead. shrm.org/trends
The HR Jobs Pulse Survey Report examines hiring trends
in the HR profession and their perceptions for the labor
market. The research determines the confidence level of
HR professionals in finding employment and job security.
Customized Benchmarking Reports*Need metrics? We have more than 500 benchmarks
categorized by the five reports listed below and a database
of over 10,000 organizations. Customize the output for your
report based on industry, employee size and more.
shrm.org/benchmarking
• Human Capital Benchmarking
• Employee Benefits Prevalence Benchmarking
• Health Care Benchmarking
• Paid Leave Benchmarking
• Talent Acquisition Benchmarking
Employee Engagement Survey Service*How engaged are your employees? SHRM will help you
find out through People InSight, our job satisfaction
and engagement survey service. Results are provided by
individual department and overall employee population,
and benchmarked against overall norms, including
industry and organization staff size, in SHRM’s database of
over 10,000 employees. shrm.org/peopleinsight
Customized Research Services*What do HR professionals think? Access the world’s
largest global community of HR professionals for custom
survey research projects. SHRM develops survey questions
in collaboration with your organization; administers
the survey to a random sample of SHRM members;
analyzes the data; and prepares reports on the final
results. Examples of recent projects include the following:
total financial impact of employee absences, the aging
workforce, job analysis activities, financial wellness and
education, and performance management effectiveness.
shrm.org/customizedresearch
shrm.org/research*Fee-based services
ADDITIONAL SHRM RESOURCES
Project leader
Christina Lee
researcher, Total Rewards Strategies, SHRM Research
Project contributors
Alexander Alonso, Ph.D., SHRM-SCP
senior vice president, Knowledge Development, SHRM
Evren Esen, SHRM-SCP
director, Survey Programs, SHRM Research
Joseph Coombs
senior analyst, Workforce Trends, SHRM Research
Tanya Mulvey
researcher, Talent Management & Workforce Skills, SHRM Research
Justina Victor, SHRM-SCP
manager, Engagement Products, SHRM Research
Karen Wessels
researcher, Workforce Planning, SHRM Research
Halona Ng
SHRM Research
Copy editing
Katya Scanlan, copy editor
Design
Scott Harris, senior design specialist
Shirley E.M.Raybuck, senior design specialist
64 | EMPLOYEE JOB SATISFACTION AND ENGAGEMENT
PROJECT TEAM

This report is published by the Society for Human Resource Management
(SHRM). All content is for informational purposes only and is not to be
construed as a guaranteed outcome. The Society for Human Resource
Management cannot accept responsibility for any errors or omissions or any
liability resulting from the use or misuse of any such information.
© April 2016 Society for Human Resource Management. All rights reserved.
Printed in the United States of America. This publication may not be
reproduced, stored in a retrieval system or transmitted in whole or in part,
in any form or by any means, electronic, mechanical, photocopying,
recording or otherwise, without the prior written permission of the
Society for Human Resource Management.
SHRM members can download this research report and many others free of charge at www.shrm.org/hr-today/trends-and-forecasting/research-and-surveys.
If you are not a SHRM member and would like to become one, please visit www.shrm.org/application.
1800 Duke Street
Alexandria, VA 22314
USA
4440517815869
ISBN 9781586444051
SHRM Store #: 62.27061$199.95 nonmember | $99.95 member
And we’ll do all the legwork.
You’ve implemented strategies to attract and keep the best employees. Now fi nd out
what truly MOTIVATES your workforce.
PEOPLE INSIGHT
SHRM®
An Employee Job Satisfaction & Engagement Survey Service
To schedule a brief demo or to order now, contact us at:
shrm.org/peopleinsight 0 | +1.703.535.6295 0 | 0 [email protected]
14-0462