electrochemical membrane for co2 capture and … library/events/2013/co2 capture/h...electrochemical...
TRANSCRIPT

Ultra-Clean, Efficient, Reliable Power
Electrochemical Membrane for CO2 Capture and Power Generation
DE-FE0007634
Hossein Ghezel-Ayagh FuelCell Energy, Inc.
2013 NETL CO2 Capture Technology Meeting
July 10, 2013 Pittsburgh, PA

FuelCell Energy, Inc.
1.4 MW plant at a municipal building
2.4 MW plant owned by an Independent power producer
600 kW plant at a food processor
11.2 MW plant - largest fuel cell park in the world
Delivering ultra-clean baseload distributed generation globally
Premier developer of stationary fuel cell products, with >40 years of experience
Headquarters in Danbury, CT (USA), international presence in USA, Canada, Germany (Fraunhofer, IKTS) and South Korea (Posco)
Delivering Direct FuelCell® (DFC®) power plants for On-Site Power and Utility Grid Support
Over 80 Direct FuelCell plants generating power at more than 50 sites globally
Service Install Sell (direct & via partners) Manufacture
2

DE-FE0007634 Project Outline
FuelCell Energy Inc. (FCE) System design, GAP analysis, ECM fabrication, and bench-scale testing of an 11.7 m2 area ECM system for CO2 capture.
Pacific Northwest National Laboratory (PNNL) Test effects of flue gas contaminants on ECM.
URS Corporation Review ECM-based system design, equipment and plant costing, and flue gas clean-up system design.
Overall Project Objectives:
Project Participants:
Demonstrate ability of FCE’s electrochemical membrane (ECM)-based system to separate ≥ 90% of CO2 from a simulated PC flue-gas stream and to compress the CO2 for sequestration or beneficial use
Demonstrate that ECM system is an economical alternative for post-
combustion CO2 capture in PC-based power plants, and that it meets DOE objectives for incremental cost of electricity (COE)
3
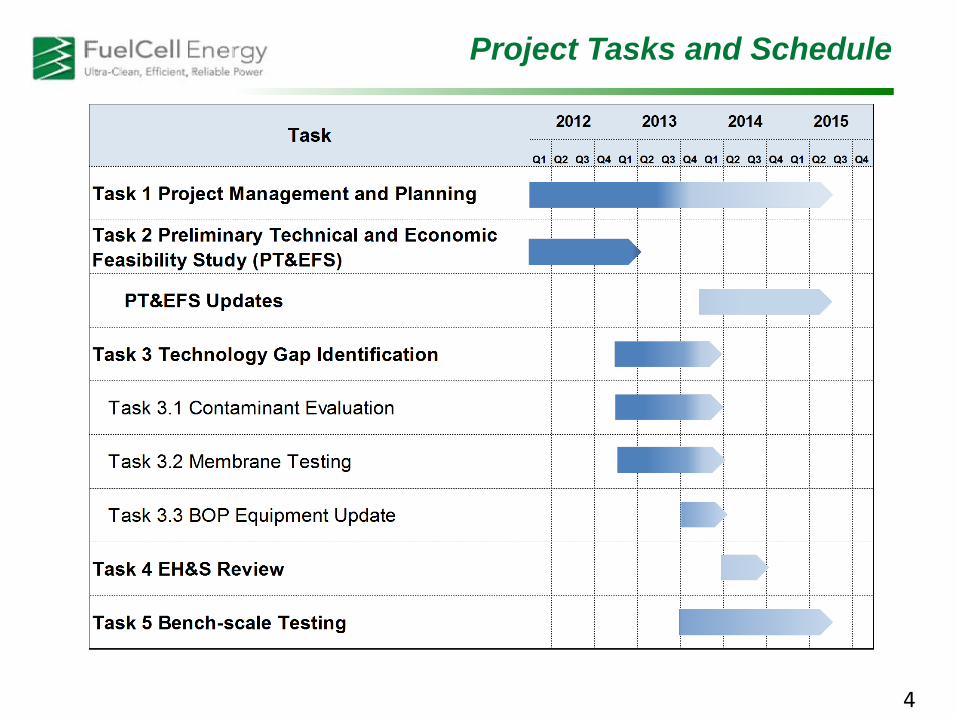
Project Tasks and Schedule
4

Electrochemical Membrane (ECM) Technology
5
CH4 + 2H2O 4H2 + CO2
ANODE CATALYST
CATHODE CATALYSTCATHODE
ELECTROLYTE
INTERNAL REFORMING
H2 + CO3= H2O + CO2 + 2e-
1/2O2 + CO2 + 2e- CO3=
ANODE
NATURAL GAS/BIOGAS
CO3=
e-
e-
STEAM
FLUE GAS
HEAT
CO2 DEPLETED GAS
CAPTURED CO2,H2, H2O
CH4 + 2H2O 4H2 + CO2
ANODE CATALYST
CATHODE CATALYSTCATHODE
ELECTROLYTE
INTERNAL REFORMING
H2 + CO3= H2O + CO2 + 2e-
1/2O2 + CO2 + 2e- CO3=
ANODE
NATURAL GAS/BIOGAS
CO3=
e-
e-
STEAM
FLUE GAS
HEAT
CO2 DEPLETED GAS
CAPTURED CO2,H2, H2O
Net Results
• Simultaneous Power Production and CO2 Separation from Flue Gas of an Existing Facility
• Excess Process Water Byproduct • Complete Selectivity towards CO2 as Compared to N2
The driving force for CO2 separation is electrochemical potential, not pressure differential across the membrane

ECM Assembly
ECM Stack Four-Stack Module Enclosed Module
ECM Module Assembly
6
Planar Electrochemical Membrane assemblies are stacked and incorporated into MW-scale modules
ECM is a modular technology: • Ease of scale up and transport • Suitable for incremental phased applications to almost any type of
CO2-emitting plant

59 MW Fuel Cell Park
7
Project being developed by POSCO, Korea Hydro Nuclear Power Co. (KHNP) and Samchully Gas Co in Hwaseong, South Korea
World’s largest fuel cell installation
– Located in Hwasung City, S. Korea – Comprised of 42 modules – Expected to be fully operational in
early 2014

CEPACS System Block Flow Diagram
8
Combined Electric Power and Carbon-dioxide Separation (CEPACS) System Concept Implementation for 550 MW Reference PC Plant*
* Cost and Performance Baseline for Fossil Energy Plants, Volume 1: Bituminous Coal and Natural Gas to Electricity, Revision 2, DOE/NETL-2010/1397, November 2010.
CEPACS system produces: • Supercritical CO2 (90% CO2 capture from PC Plant) • Excess Process Water • Additional 441 MW of clean AC power @ 44.4% Efficiency (based on LHV Natural Gas)
ANODE
CATHODE Flue Gas from 550MW PC Plant
Air
Natural Gas
Shift Reactor
Product Water
CO2/H2
Sep. Carbon Dioxide
Plant Exhaust
Oxidizer
Process Water
ECM Modules SO2 Removal
Heat Recovery

CEPACS System Performance
• CEPACS System increases power output of Baseline PC plant by 80% while capturing > 90% CO2 from flue gas
• PC plant retrofitted with CEPACS system is 3 percentage points more efficient than Baseline PC Plant without carbon capture 9

ECM System Economics
10
• PC plant retrofitted with ECM system can meet DOE incremental COE target of 35%
DOE Target: ≤ 35%
PC w/o CO2 capture PC w Amine CO2 Capture PC w ECM Capture
• Cost per ton of CO2 avoided is reduced by more than 50% using ECM instead of Amine scrubber

System Performance Validation Tests
11
ECM can achieve very high flux (>120 cc/s/m2) and substantial power generation at 90+% carbon dioxide capture from PC Plant flue gas
250 cm2 ECM utilized to validate CEPACS system performance
Performance of ECM for Carbon Capture from Reference PC Plant at Baseline and Optimized System Conditions

ECM Performance Stability
12
Verified Stability of ECM Performance for Carbon Capture and Power Production Using Simulated PC Plant Flue Gas during a Month of Testing
600
620
640
660
680
700
720
740
760
780
800
1/31 2/5 2/10 2/15 2/20 2/25
Pow
er D
ensi
ty (W
/m2)
Date
Constant CO2 Flux: 98 cc/s/m2

Flue Gas Contaminant Effects Testing
13
Walk-in ventilated lab space and multiple work stations are used at PNNL
Testing Goals: o Assess physical and chemical interactions of main flue
gas pollutants with ECM o Determine ECM performance effects with S, Cl, Hg, and
Se in flue gases o Enable selection of clean-up technology for CEPACS
System
Approach : o Utilize ECM button cell tests to determine the effect
of individual impurities on cell performance. o Maintain CO2 flux o Measure ECM cell resistance and voltage o Analyze impurity effects on ECM using Electrochemical
Impedance Spectroscopy (EIS)
o Perform post-test analyses using microscopy and surface analytical tools (SEM/EDS, TEM, FIB-SEM, AES, XPS, ToF-SIMS) to determine:
• Nature of impurity-ECM interactions, • Presence of alteration phases formed from any reactions • Surface adsorption
Multiple button cells in furnace, each with individual gas flow and electrical controls

Effects of SO2 on ECM
14
• ECM button cells were tested with 1 ppm SO2 (in feed gas) representing the effluent concentration (0.4ppm) from the polishing Flue Gas Desulfurization (FGD) unit in the CEPACS system
• The test showed stable membrane performance at 1 ppm SO2 concentration: • Constant CO2 Transport Flux • Minimal Voltage degradation impact

Effects of Mercury on ECM
15
• An ECM button cell is currently being tested with 750 ppb Mercury (Hg) in feed gas (2-3 orders of magnitude higher concentrations than typical flue gas)
• The test showed stable membrane performance after >280 hours of operation: • Constant CO2 Transport Flux • No performance loss observed • Test is being continued for a longer duration
0
0.1
0.2
0.3
0.4
0.5
0.6
0.7
0.8
0.9
80 180 280 380 480 580
Volta
ge (V
)
Time (Hours)
Hg vapor

ECM NOx Destruction Capabilities
16
Reaction Mechanism by which NOx is Removed from the Cathode and Destroyed in the Anode

NOx Removal Tests
17
Cathode Outlet NOx Concentration with Increased CO2 Flux for Carbon Capture at Various Cathode Inlet NOx Concentrations
Increase in Carbon Capture Flux

NOx Removal Efficiency
18
ECM Capability for NOx Destruction Remains > 70% at High Inlet NOx Concentration (200 ppm) During Carbon Capture under System Conditions

Summary of ECM Benefits
19
Commercially proven fuel cell technology repurposed for carbon capture
Allows separation of >90% of carbon dioxide from flue gas of coal plants
~ 35% increase in cost-of-electricity (COE) for post-combustion CO2 capture
Produces additional electric power using a supplemental fuel, rather than consuming power
Increases the net efficiency of coal plant by ~ 8 percentage points
Capabilities to reduce NOx emissions leading to potential elimination of SCR
Modular technology suitable for incremental applications (phased addition)
Generates excess clean water as part of the electrochemical separation process

Acknowledgements
20
ECM Carbon Capture from Coal Plants supported by DOE/NETL (Award Number: DE-FE0007634) Guidance from NETL team: Shailesh Vora, Jose Figueroa, and Lynn Brickett