avr - co2 capture and liquefaction
TRANSCRIPT
AVR - CO2 CAPTURE ANDLIQUEFACTIONJuliana Monteiro, Purvil Khakharia, Joris Koornneef
This project is supported with Topsector Energiesubsidies of the Ministry of Economic Affairs
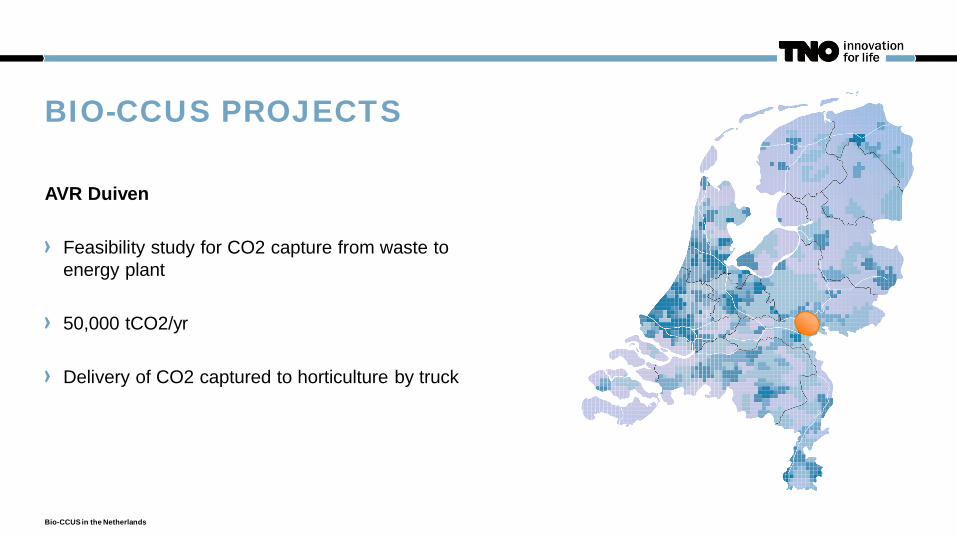
BIO-CCUS PROJECTS
AVR Duiven
Feasibility study for CO2 capture from waste toenergy plant
50,000 tCO2/yr
Delivery of CO2 captured to horticulture by truck
Bio-CCUS in the Netherlands
SETTING THE SCENE
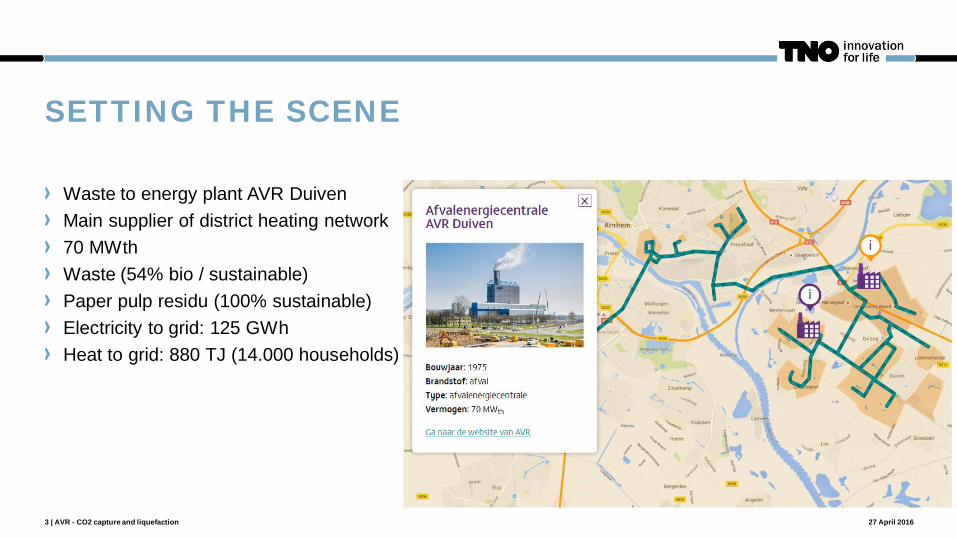
Waste to energy plant AVR DuivenMain supplier of district heating network70 MWthWaste (54% bio / sustainable)Paper pulp residu (100% sustainable)Electricity to grid: 125 GWhHeat to grid: 880 TJ (14.000 households)
27 April 20163 | AVR - CO2 capture and liquefaction
SETTING THE SCENE
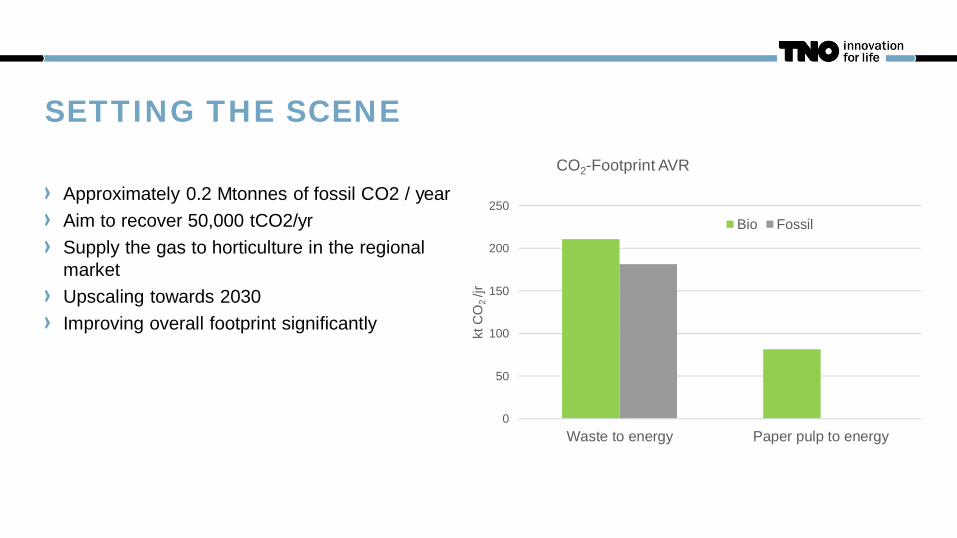
Approximately 0.2 Mtonnes of fossil CO2 / yearAim to recover 50,000 tCO2/yrSupply the gas to horticulture in the regionalmarketUpscaling towards 2030Improving overall footprint significantly
0
50
100
150
200
250
Waste to energy Paper pulp to energy
ktC
O2/jr
CO2-Footprint AVR
Bio Fossil
SETTING THE SCENE
0%
5%
10%
15%
20%
25%
j f m a m j j a s o n d
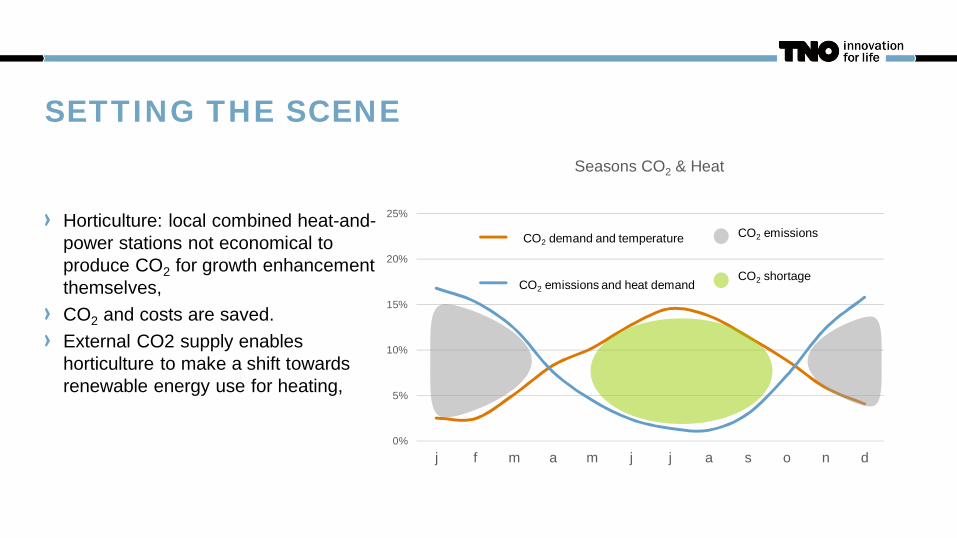
Seasons CO2 & Heat
Temperatuur / CO2-vraag
Warmtevraag / Gasverbruik
CO2 emissions
CO2 shortage
CO2 demand and temperatureCO2 demand and temperature
CO2 emissions and heat demand
Horticulture: local combined heat-and-power stations not economical toproduce CO2 for growth enhancementthemselves,CO2 and costs are saved.External CO2 supply enableshorticulture to make a shift towardsrenewable energy use for heating,
PHASED APPROACH
27 April 20166 | AVR - CO2 capture and liquefaction
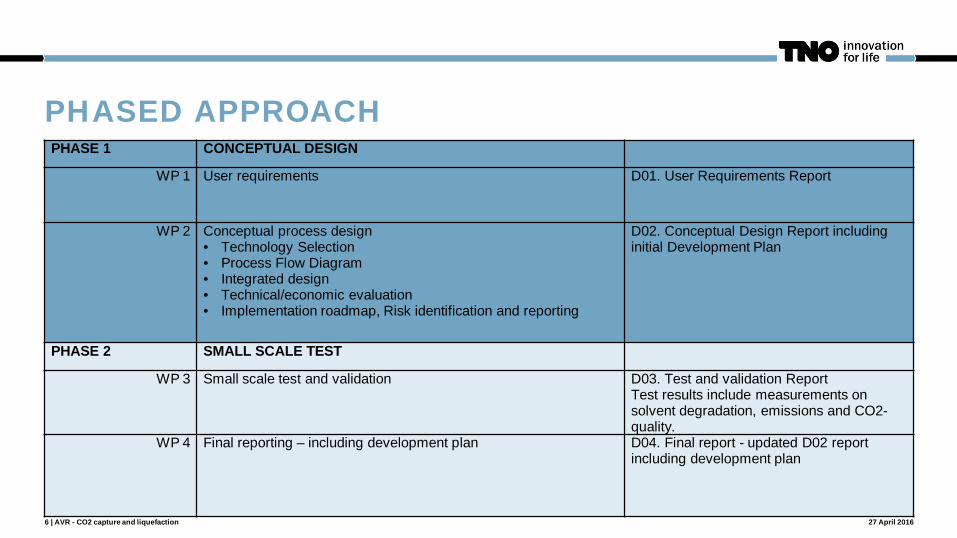
PHASE 1 CONCEPTUAL DESIGN
WP 1 User requirements D01. User Requirements Report
WP 2 Conceptual process design• Technology Selection• Process Flow Diagram• Integrated design• Technical/economic evaluation• Implementation roadmap, Risk identification and reporting
D02. Conceptual Design Report includinginitial Development Plan
PHASE 2 SMALL SCALE TEST
WP 3 Small scale test and validation D03. Test and validation ReportTest results include measurements onsolvent degradation, emissions and CO2-quality.
WP 4 Final reporting – including development plan D04. Final report - updated D02 reportincluding development plan

SOME FIRST INSIGTHS
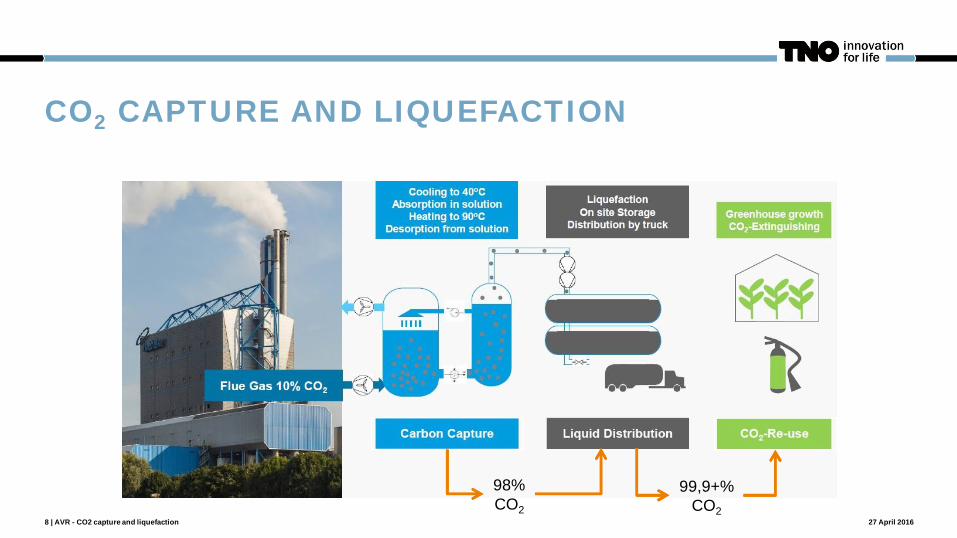
CO2 CAPTURE AND LIQUEFACTION
8 | AVR - CO2 capture and liquefaction 27 April 2016
98%CO2
99,9+%CO2
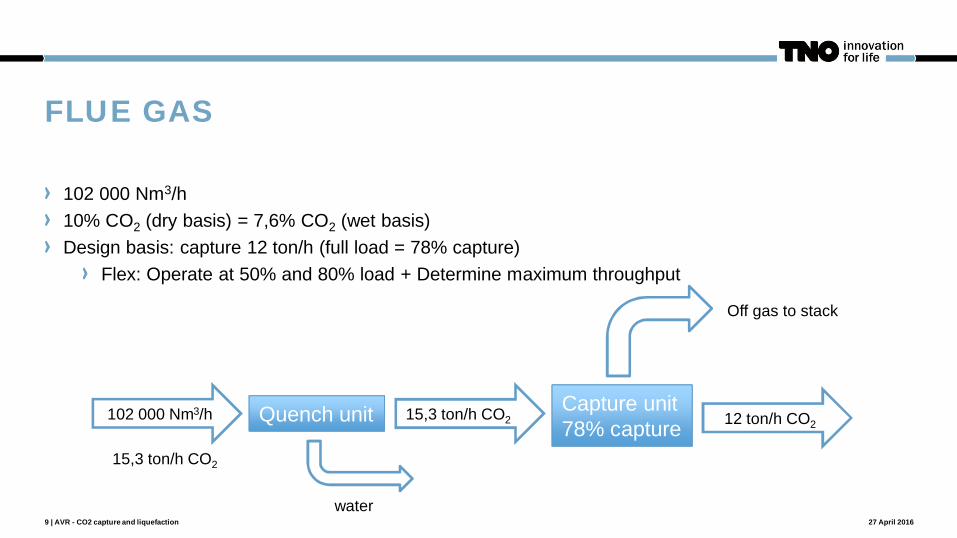
FLUE GAS
102 000 Nm3/h10% CO2 (dry basis) = 7,6% CO2 (wet basis)Design basis: capture 12 ton/h (full load = 78% capture)
Flex: Operate at 50% and 80% load + Determine maximum throughput
27 April 20169 | AVR - CO2 capture and liquefaction
15,3 ton/h CO2Capture unit78% capture 12 ton/h CO2
Off gas to stack
102 000 Nm3/h Quench unit
15,3 ton/h CO2
water
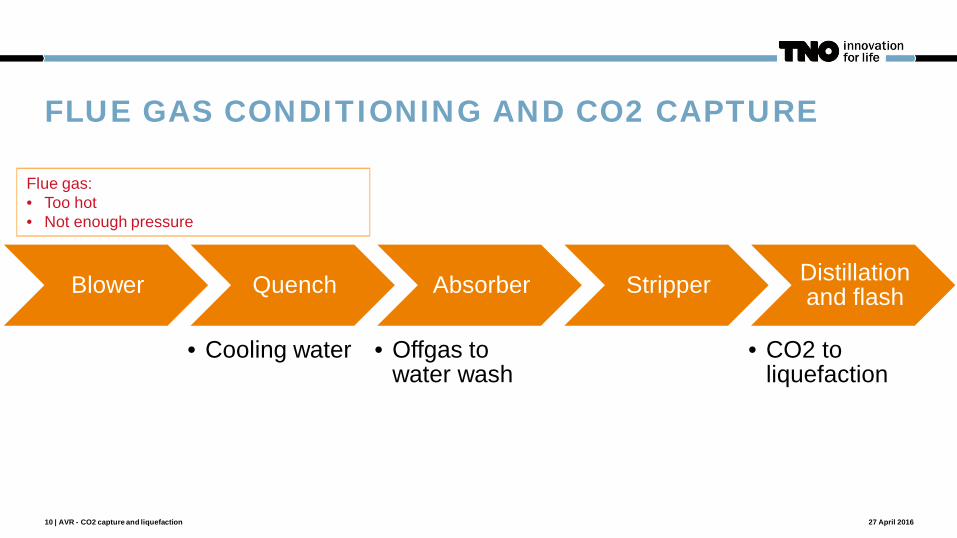
FLUE GAS CONDITIONING AND CO2 CAPTURE
Blower Quench
• Cooling water
Absorber
• Offgas towater wash
Stripper Distillationand flash
• CO2 toliquefaction
27 April 201610 | AVR - CO2 capture and liquefaction
Flue gas:• Too hot• Not enough pressure
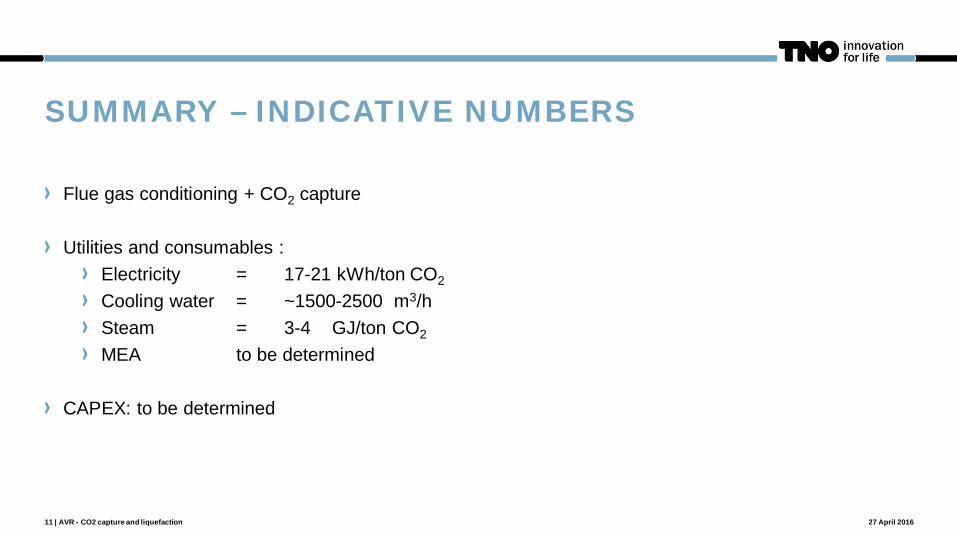
SUMMARY – INDICATIVE NUMBERS
11 | AVR - CO2 capture and liquefaction 27 April 2016
Flue gas conditioning + CO2 capture
Utilities and consumables :Electricity = 17-21 kWh/ton CO2
Cooling water = ~1500-2500 m3/hSteam = 3-4 GJ/ton CO2
MEA to be determined
CAPEX: to be determined
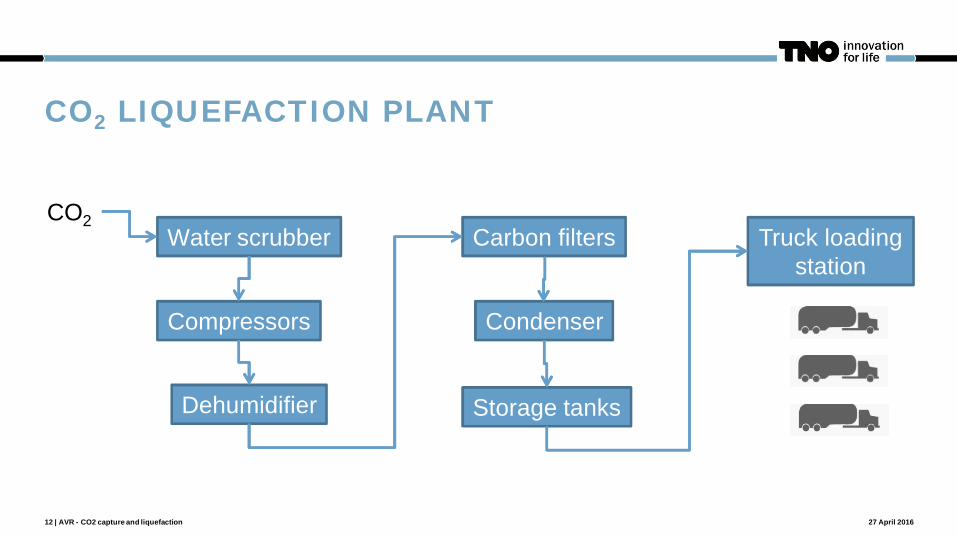
CO2 LIQUEFACTION PLANT
12 | AVR - CO2 capture and liquefaction 27 April 2016
Water scrubber
Compressors
Dehumidifier
Carbon filters
Condenser
Storage tanks
CO2Truck loading
station

NEXT STEPS
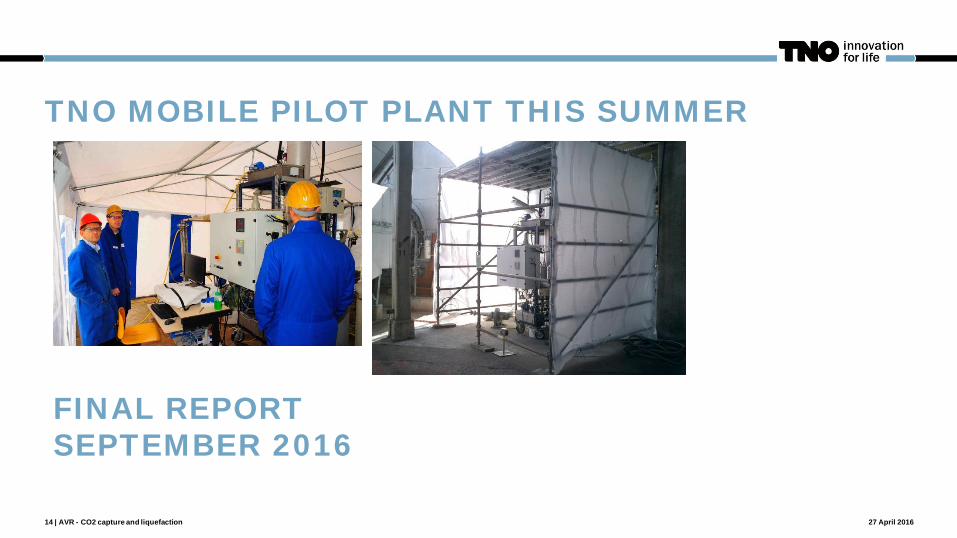
TNO MOBILE PILOT PLANT THIS SUMMER
27 April 201614 | AVR - CO2 capture and liquefaction
FINAL REPORTSEPTEMBER 2016
QUESTIONS?
Bio-CCUS in the Netherlands