electric power sector: value creation 2005 - 2014 · pdf fileelectric power sector: value...
TRANSCRIPT
Value Creation by Power Sector Companies
Electric Power Sector:
Value Creation 2005 - 2014
University of Houston, C.T. Bauer College of Business
Student Research Project
This report is developed solely for the purpose of class discussion. Cases and reports do not represent endorsements by the faculty or the C.T. Bauer College of Business on effective or ineffective
management.
Value Creation by Power Sector Companies
1
Contents 1. Introduction ....................................................................................................................................... 2
1.1 Research Objectives ................................................................................................................... 2
1.2 The Power Sector (OFS) .............................................................................................................. 2
2. Summary of Findings ......................................................................................................................... 6
2.1 Drivers of Shareholder Value ........................................................................................................... 6
2.2 Power Company Valuation ............................................................................................................ 10
2.2.1 Intrinsic Value ............................................................................................................................. 10
2.2.2 Cash Flows .................................................................................................................................. 12
2.2.3 Cost of Capital ............................................................................................................................. 12
2.3 Governance .................................................................................................................................... 12
2.4 Conclusions from Intrinsic Value Analysis ...................................................................................... 13
Appendix .................................................................................................................................................. 16
Company Profiles ..................................................................................................................................... 17
1. FirstEnergy Corp. .......................................................................................................................... 18
2. PG&E Corporation ........................................................................................................................ 29
3. Entergy Corporation..................................................................................................................... 40
4. NRG Energy, Inc. .......................................................................................................................... 51
5. Public Service Enterprise Group ................................................................................................... 62
6. Pennsylvania Power & Light (PPL) Corporation ........................................................................... 71
7. American Electric Power (AEP) Corporation ................................................................................ 81
8. Calpine ......................................................................................................................................... 91
9. Edison International ................................................................................................................... 101
10. NextEra Energy Inc. ................................................................................................................ 112
11. Duke Energy ........................................................................................................................... 121
12. Southern Company................................................................................................................. 128
13. ENGIE (formerly GDF Suez) .................................................................................................... 137
14. Dominion Resources Inc. ........................................................................................................ 149
15. AES Corporation ..................................................................................................................... 159
Value Creation by Power Sector Companies
2
1. Introduction
1.1 Research Objectives
This report documents the findings of a research project undertaken by students in the C.T. Bauer College
of Business MBA program at the University of Houston.
The purpose of the project was to understand how Companies in the Power Sector have created value for
their shareholders and other stakeholders in the past, and the strategic lessons that can be learned from
their successes and failures.
The intent has been to create a vehicle that will integrate the capabilities within the C.T. Bauer School of
top tier academic research with experience-based knowledge of the challenges facing energy companies.
Through this integration and our long time frame looking back and forward five to ten years, we hope to
provide a set of analyses and commentaries that will complement existing reports available from financial
institutions and will be useful both to financial institutions and to the companies studied.
Prior reports have covered the Super-majors, National Oil Companies, Independent Producers,
Independent Refiners, Oilfield Services and Midstream MLP sectors. All can be accessed at
http://www.bauer.uh.edu/centers/uhgemi/energy-cases-featured.php. We hope that these reports will
deepen the relationship between the University of Houston and energy companies in Houston and
beyond, creating opportunities for mutually beneficial dialogue, and that the classes will increase the
value of the students to prospective employers.
1.2 The Power Sector (OFS)
The Power Sector has battled headwinds in recent years as public policy changes have substantially
changed the rules of the game for companies engaged in power generation, transmission, distribution
and marketing of electricity. Starting in the 1990s and early 2000s with a wave of deregulation that
transformed natural gas and power markets in several regional jurisdictions, further changes have sought
to reduce electricity demand through efficiency improvements, tightened environmental rules are leading
to closure of many coal fired power plants, and federal and state initiatives have forced the expansion of
renewable power sources through renewable portfolio standards and subsidies.
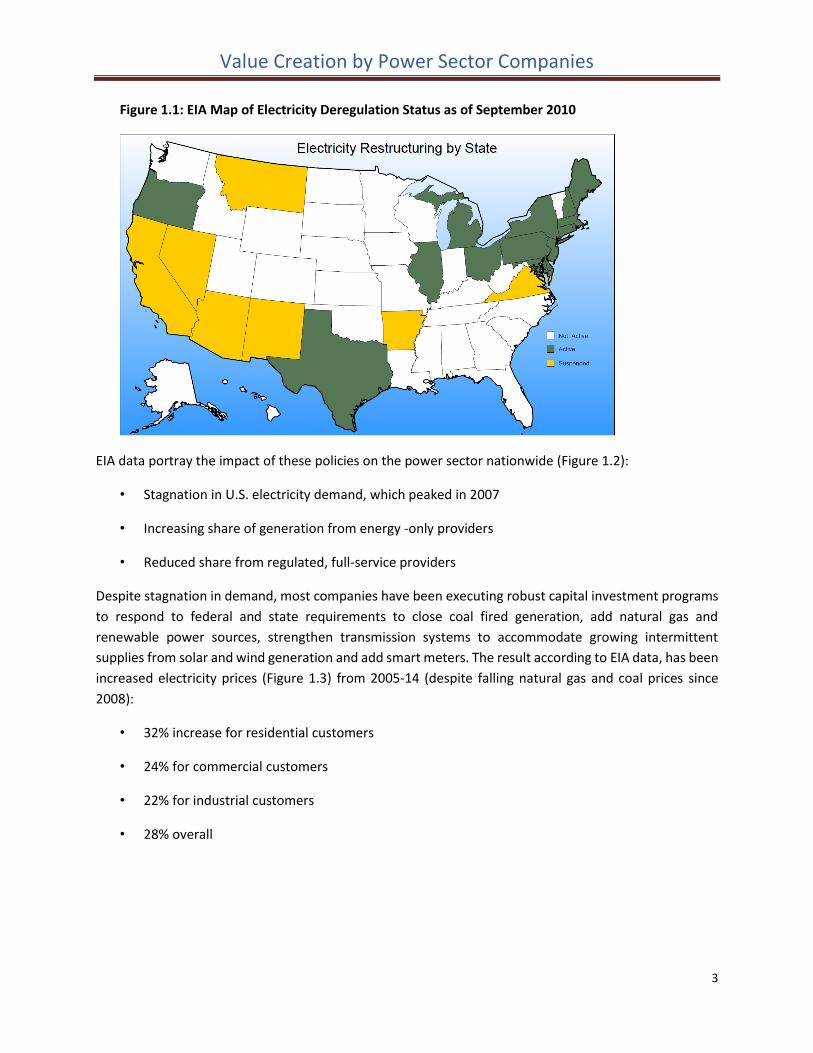
According to the EIA (Figure 1.1) companies operating in the Northeast, parts of the Midwest, Texas and
Oregon are now exposed to competition, while their peers in the southeast and much of the mid-
continent still operate as traditional full-service, integrated utilities.
Value Creation by Power Sector Companies
3
Figure 1.1: EIA Map of Electricity Deregulation Status as of September 2010
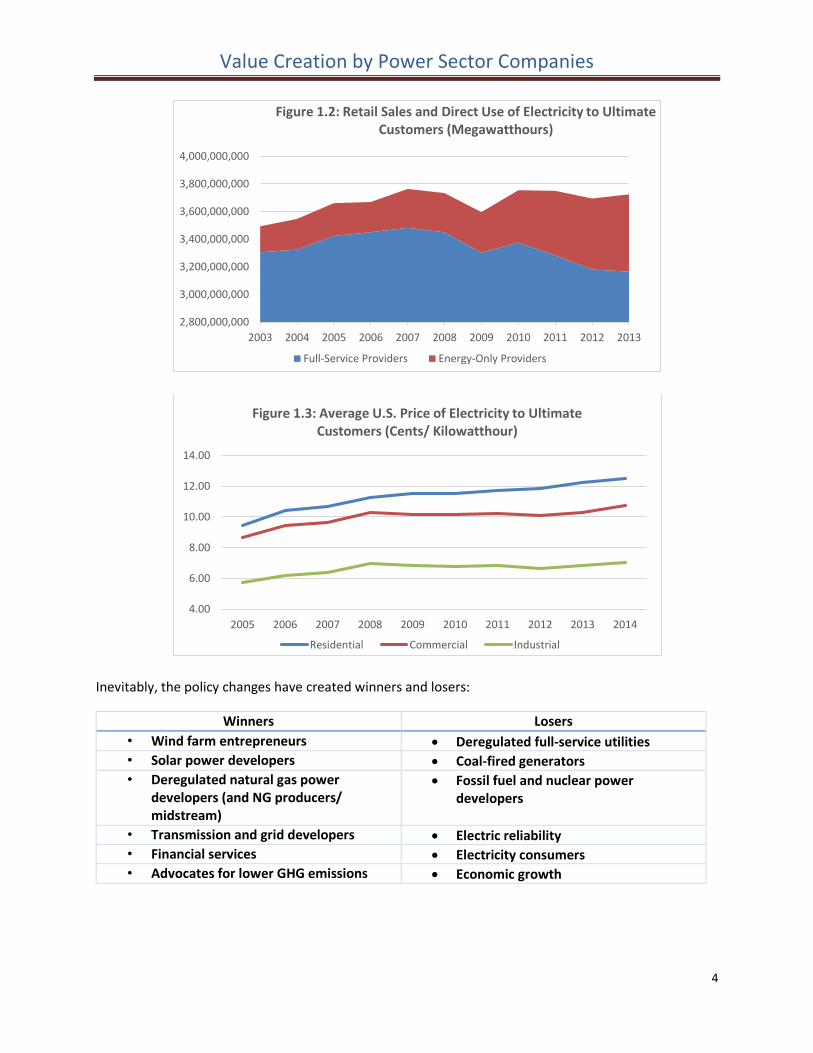
EIA data portray the impact of these policies on the power sector nationwide (Figure 1.2):
• Stagnation in U.S. electricity demand, which peaked in 2007
• Increasing share of generation from energy -only providers
• Reduced share from regulated, full-service providers
Despite stagnation in demand, most companies have been executing robust capital investment programs
to respond to federal and state requirements to close coal fired generation, add natural gas and
renewable power sources, strengthen transmission systems to accommodate growing intermittent
supplies from solar and wind generation and add smart meters. The result according to EIA data, has been
increased electricity prices (Figure 1.3) from 2005-14 (despite falling natural gas and coal prices since
2008):
• 32% increase for residential customers
• 24% for commercial customers
• 22% for industrial customers
• 28% overall
Value Creation by Power Sector Companies
4
Inevitably, the policy changes have created winners and losers:
Winners Losers
• Wind farm entrepreneurs Deregulated full-service utilities
• Solar power developers Coal-fired generators
• Deregulated natural gas power developers (and NG producers/ midstream)
Fossil fuel and nuclear power developers
• Transmission and grid developers Electric reliability
• Financial services Electricity consumers
• Advocates for lower GHG emissions Economic growth
2,800,000,000
3,000,000,000
3,200,000,000
3,400,000,000
3,600,000,000
3,800,000,000
4,000,000,000
2003 2004 2005 2006 2007 2008 2009 2010 2011 2012 2013
Figure 1.2: Retail Sales and Direct Use of Electricity to Ultimate Customers (Megawatthours)
Full-Service Providers Energy-Only Providers
4.00
6.00
8.00
10.00
12.00
14.00
2005 2006 2007 2008 2009 2010 2011 2012 2013 2014
Figure 1.3: Average U.S. Price of Electricity to Ultimate Customers (Cents/ Kilowatthour)
Residential Commercial Industrial
Value Creation by Power Sector Companies
5
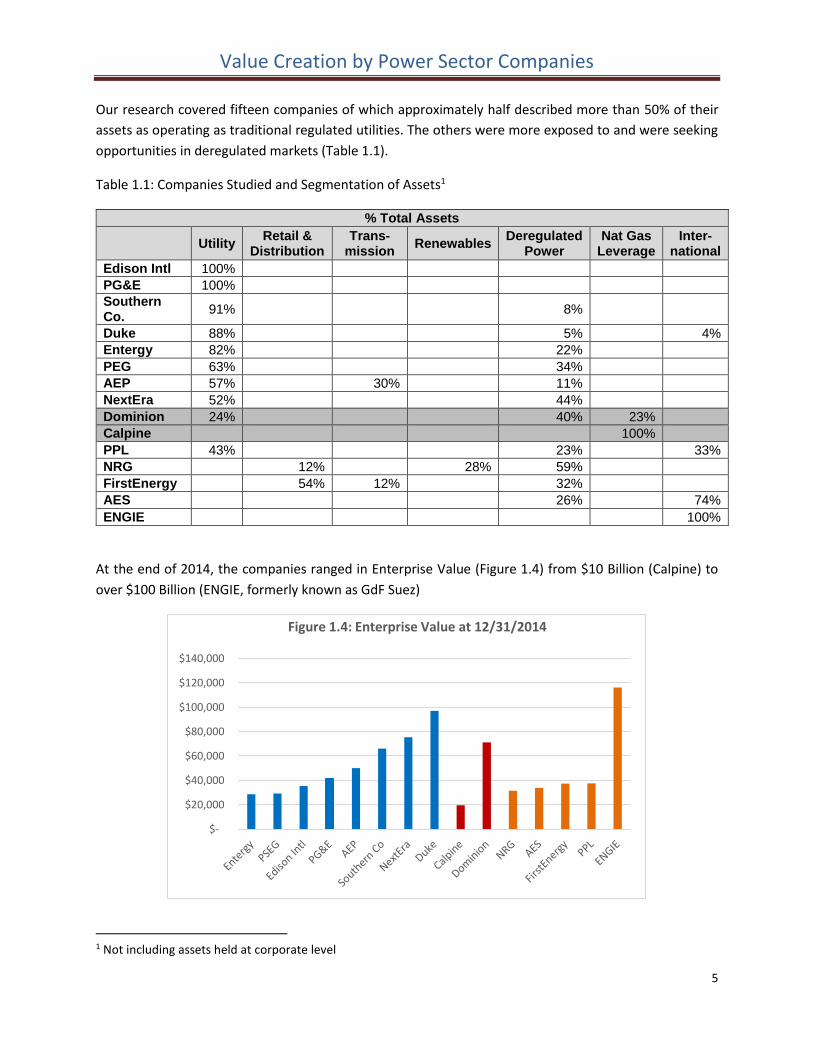
Our research covered fifteen companies of which approximately half described more than 50% of their
assets as operating as traditional regulated utilities. The others were more exposed to and were seeking
opportunities in deregulated markets (Table 1.1).
Table 1.1: Companies Studied and Segmentation of Assets1
% Total Assets
Utility Retail &
Distribution Trans-
mission Renewables
Deregulated Power
Nat Gas Leverage
Inter-national
Edison Intl 100%
PG&E 100%
Southern Co.
91% 8%
Duke 88% 5% 4%
Entergy 82% 22%
PEG 63% 34%
AEP 57% 30% 11%
NextEra 52% 44%
Dominion 24% 40% 23%
Calpine 100%
PPL 43% 23% 33%
NRG 12% 28% 59%
FirstEnergy 54% 12% 32%
AES 26% 74%
ENGIE 100%
At the end of 2014, the companies ranged in Enterprise Value (Figure 1.4) from $10 Billion (Calpine) to
over $100 Billion (ENGIE, formerly known as GdF Suez)
1 Not including assets held at corporate level
$-
$20,000
$40,000
$60,000
$80,000
$100,000
$120,000
$140,000
Figure 1.4: Enterprise Value at 12/31/2014

Value Creation by Power Sector Companies
6
As in our previous studies, we start with the premise that shareholder value tracks the expected intrinsic
value of the firm. Intrinsic value in turn is shaped by expectations of growth, returns on capital and risk.
These are the result of strategic portfolio choices, execution capabilities and the leadership and
organizational philosophy that define the firm’s human system and which the companies have developed
over many years.
2. Summary of Findings
2.1 Drivers of Shareholder Value
As for previous industry sectors, we focus our inquiry on the relationship between Total Shareholder
Returns (TSR) and independent variables: growth (measured as annual revenue growth and Capex/ Total
Assets), profitability (EBITDA/ Total Assets) and risk (average beta). Our overall framework is dispayed on
Figure 2.1: shareholder value follows intrinsic value (NPV of estimated future cash flows discounted at the
cost of capital); intrinsic value is a function of growth, returns and risk, which is shaped by strategic
portfolio choices, effective operations and capabilities, and an aligned leadership model.
Our first finding is that the Sub-Sectors have produced differentiated Total Shareholder Returns (TSR) over
the period 2008-13 (Table 2.1). We find that the companies with more than 50% assets in regulated
utilities have outperformed those with assets largely in deregulated markets, despite very similar average
results in revenue growth and EBITDA returns on total assets. One differentiating driver appears to be
Beta for the regulated companies, which is on average half the Beta in the deregulated companies. A
second differentiator is a higher reinvestment in capital projects by the utilities, but without producing
any advantage in revenue growth over the non-utility companies. This implies more prudent capital
allocation in the deregulated companies. A third differentiator is that the utility companies have all grown
Value Creation by Power Sector Companies
7
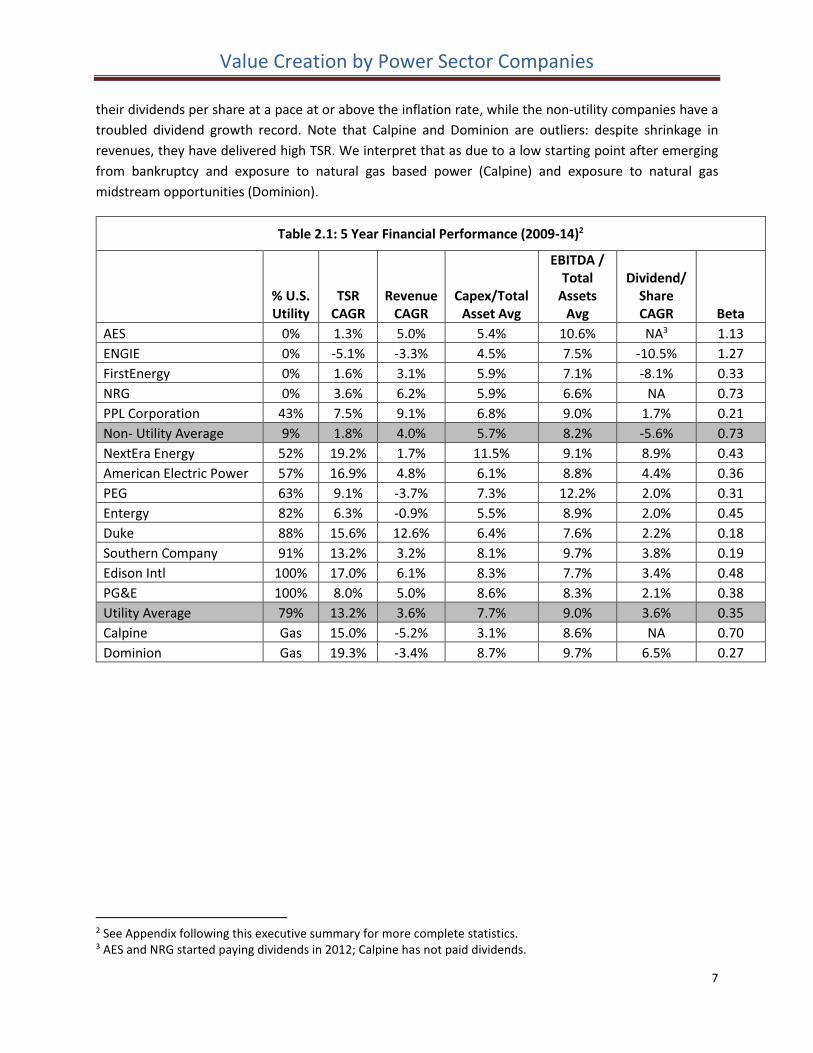
their dividends per share at a pace at or above the inflation rate, while the non-utility companies have a
troubled dividend growth record. Note that Calpine and Dominion are outliers: despite shrinkage in
revenues, they have delivered high TSR. We interpret that as due to a low starting point after emerging
from bankruptcy and exposure to natural gas based power (Calpine) and exposure to natural gas
midstream opportunities (Dominion).
Table 2.1: 5 Year Financial Performance (2009-14)2
% U.S. Utility
TSR CAGR
Revenue CAGR
Capex/Total Asset Avg
EBITDA / Total
Assets Avg
Dividend/ Share CAGR Beta
AES 0% 1.3% 5.0% 5.4% 10.6% NA3 1.13
ENGIE 0% -5.1% -3.3% 4.5% 7.5% -10.5% 1.27
FirstEnergy 0% 1.6% 3.1% 5.9% 7.1% -8.1% 0.33
NRG 0% 3.6% 6.2% 5.9% 6.6% NA 0.73
PPL Corporation 43% 7.5% 9.1% 6.8% 9.0% 1.7% 0.21
Non- Utility Average 9% 1.8% 4.0% 5.7% 8.2% -5.6% 0.73
NextEra Energy 52% 19.2% 1.7% 11.5% 9.1% 8.9% 0.43
American Electric Power 57% 16.9% 4.8% 6.1% 8.8% 4.4% 0.36
PEG 63% 9.1% -3.7% 7.3% 12.2% 2.0% 0.31
Entergy 82% 6.3% -0.9% 5.5% 8.9% 2.0% 0.45
Duke 88% 15.6% 12.6% 6.4% 7.6% 2.2% 0.18
Southern Company 91% 13.2% 3.2% 8.1% 9.7% 3.8% 0.19
Edison Intl 100% 17.0% 6.1% 8.3% 7.7% 3.4% 0.48
PG&E 100% 8.0% 5.0% 8.6% 8.3% 2.1% 0.38
Utility Average 79% 13.2% 3.6% 7.7% 9.0% 3.6% 0.35
Calpine Gas 15.0% -5.2% 3.1% 8.6% NA 0.70
Dominion Gas 19.3% -3.4% 8.7% 9.7% 6.5% 0.27
2 See Appendix following this executive summary for more complete statistics. 3 AES and NRG started paying dividends in 2012; Calpine has not paid dividends.
Value Creation by Power Sector Companies
8
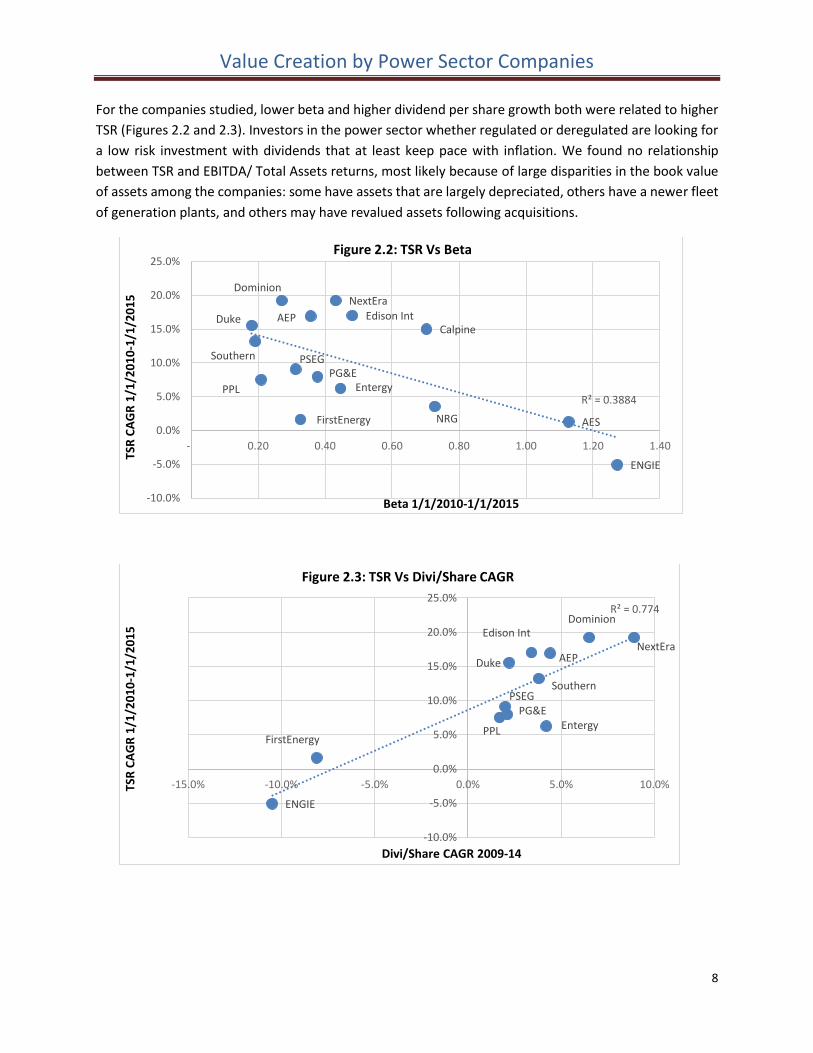
For the companies studied, lower beta and higher dividend per share growth both were related to higher
TSR (Figures 2.2 and 2.3). Investors in the power sector whether regulated or deregulated are looking for
a low risk investment with dividends that at least keep pace with inflation. We found no relationship
between TSR and EBITDA/ Total Assets returns, most likely because of large disparities in the book value
of assets among the companies: some have assets that are largely depreciated, others have a newer fleet
of generation plants, and others may have revalued assets following acquisitions.
Edison Int
PG&E
Southern
Duke
Entergy
PSEG
AEP
NextEraDominion
Calpine
PPL
NRGFirstEnergy AES
ENGIE
R² = 0.3884
-10.0%
-5.0%
0.0%
5.0%
10.0%
15.0%
20.0%
25.0%
- 0.20 0.40 0.60 0.80 1.00 1.20 1.40
TSR
CA
GR
1/1
/20
10
-1/1
/20
15
Beta 1/1/2010-1/1/2015
Figure 2.2: TSR Vs Beta
Edison Int
PG&E
Southern
Duke
Entergy
PSEG
AEPNextEra
Dominion
PPLFirstEnergy
ENGIE
R² = 0.774
-10.0%
-5.0%
0.0%
5.0%
10.0%
15.0%
20.0%
25.0%
-15.0% -10.0% -5.0% 0.0% 5.0% 10.0%TSR
CA
GR
1/1
/20
10
-1/1
/20
15
Divi/Share CAGR 2009-14
Figure 2.3: TSR Vs Divi/Share CAGR
Value Creation by Power Sector Companies
9
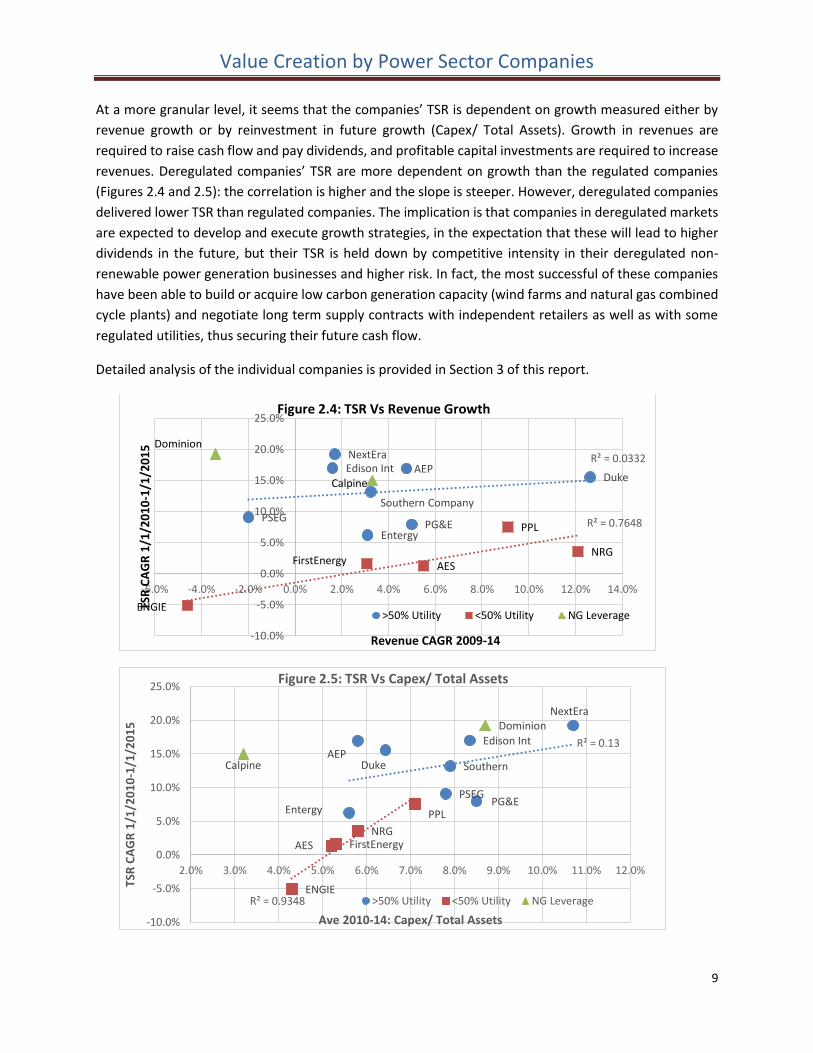
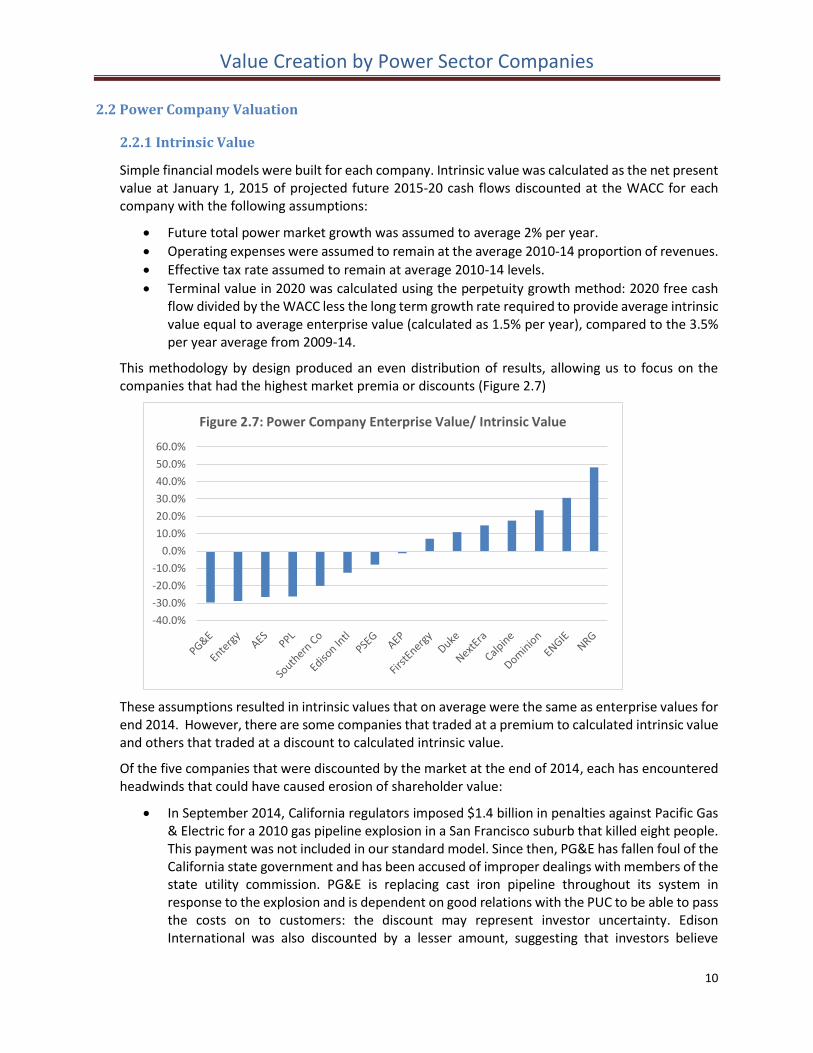
At a more granular level, it seems that the companies’ TSR is dependent on growth measured either by
revenue growth or by reinvestment in future growth (Capex/ Total Assets). Growth in revenues are
required to raise cash flow and pay dividends, and profitable capital investments are required to increase
revenues. Deregulated companies’ TSR are more dependent on growth than the regulated companies
(Figures 2.4 and 2.5): the correlation is higher and the slope is steeper. However, deregulated companies
delivered lower TSR than regulated companies. The implication is that companies in deregulated markets
are expected to develop and execute growth strategies, in the expectation that these will lead to higher
dividends in the future, but their TSR is held down by competitive intensity in their deregulated non-
renewable power generation businesses and higher risk. In fact, the most successful of these companies
have been able to build or acquire low carbon generation capacity (wind farms and natural gas combined
cycle plants) and negotiate long term supply contracts with independent retailers as well as with some
regulated utilities, thus securing their future cash flow.
Detailed analysis of the individual companies is provided in Section 3 of this report.
Edison Int
PG&E
Southern Company
Duke
Entergy
PSEG
AEPNextEra
PPL
NRGFirstEnergy AES
ENGIE
Dominion
Calpine
R² = 0.0332
R² = 0.7648
-10.0%
-5.0%
0.0%
5.0%
10.0%
15.0%
20.0%
25.0%
-6.0% -4.0% -2.0% 0.0% 2.0% 4.0% 6.0% 8.0% 10.0% 12.0% 14.0%
TSR
CA
GR
1/1
/20
10
-1/1
/20
15
Revenue CAGR 2009-14
Figure 2.4: TSR Vs Revenue Growth
>50% Utility <50% Utility NG Leverage
Edison Int
PG&E
SouthernDuke
Entergy
PSEG
AEP
NextEra
PPL
NRGFirstEnergyAES
ENGIE
Dominion
Calpine
R² = 0.13
R² = 0.9348
-10.0%
-5.0%
0.0%
5.0%
10.0%
15.0%
20.0%
25.0%
2.0% 3.0% 4.0% 5.0% 6.0% 7.0% 8.0% 9.0% 10.0% 11.0% 12.0%
TSR
CA
GR
1/1
/20
10
-1/1
/20
15
Ave 2010-14: Capex/ Total Assets
Figure 2.5: TSR Vs Capex/ Total Assets
>50% Utility <50% Utility NG Leverage
Value Creation by Power Sector Companies
10
2.2 Power Company Valuation
2.2.1 Intrinsic Value
Simple financial models were built for each company. Intrinsic value was calculated as the net present value at January 1, 2015 of projected future 2015-20 cash flows discounted at the WACC for each company with the following assumptions:
Future total power market growth was assumed to average 2% per year.
Operating expenses were assumed to remain at the average 2010-14 proportion of revenues.
Effective tax rate assumed to remain at average 2010-14 levels.
Terminal value in 2020 was calculated using the perpetuity growth method: 2020 free cash flow divided by the WACC less the long term growth rate required to provide average intrinsic value equal to average enterprise value (calculated as 1.5% per year), compared to the 3.5% per year average from 2009-14.
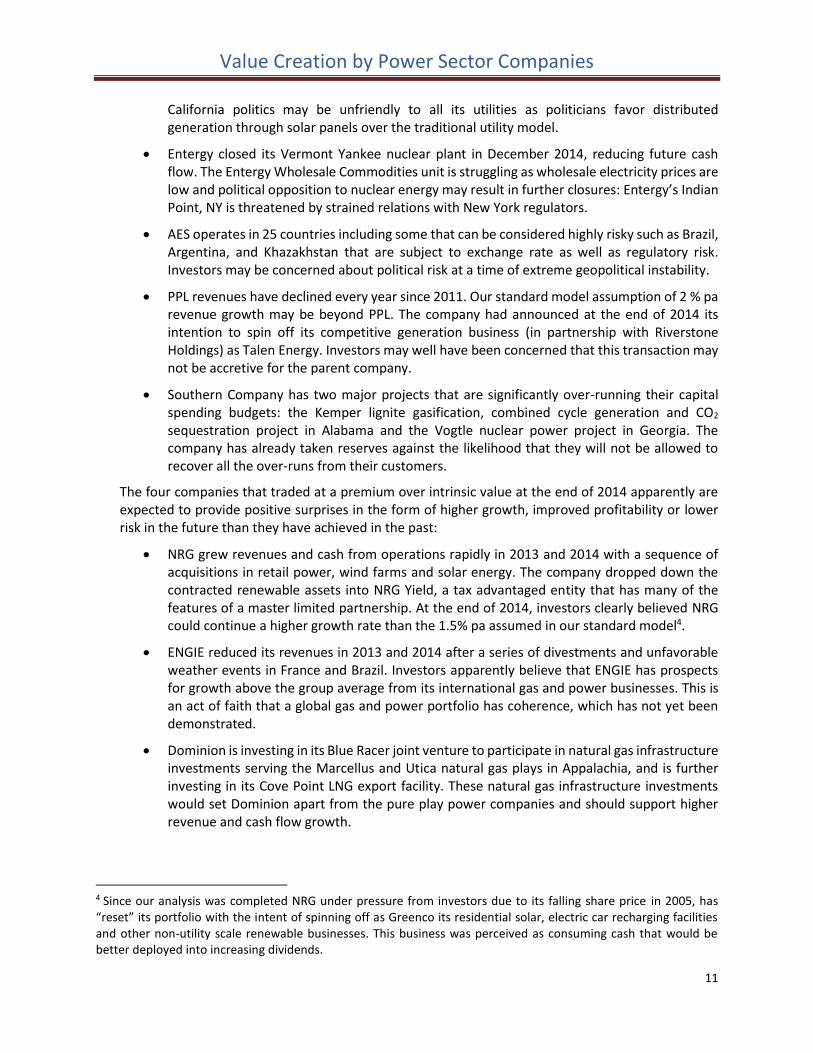
This methodology by design produced an even distribution of results, allowing us to focus on the companies that had the highest market premia or discounts (Figure 2.7)
These assumptions resulted in intrinsic values that on average were the same as enterprise values for end 2014. However, there are some companies that traded at a premium to calculated intrinsic value and others that traded at a discount to calculated intrinsic value.
Of the five companies that were discounted by the market at the end of 2014, each has encountered headwinds that could have caused erosion of shareholder value:
In September 2014, California regulators imposed $1.4 billion in penalties against Pacific Gas & Electric for a 2010 gas pipeline explosion in a San Francisco suburb that killed eight people. This payment was not included in our standard model. Since then, PG&E has fallen foul of the California state government and has been accused of improper dealings with members of the state utility commission. PG&E is replacing cast iron pipeline throughout its system in response to the explosion and is dependent on good relations with the PUC to be able to pass the costs on to customers: the discount may represent investor uncertainty. Edison International was also discounted by a lesser amount, suggesting that investors believe
-40.0%
-30.0%
-20.0%
-10.0%
0.0%
10.0%
20.0%
30.0%
40.0%
50.0%
60.0%
Figure 2.7: Power Company Enterprise Value/ Intrinsic Value
Value Creation by Power Sector Companies
11
California politics may be unfriendly to all its utilities as politicians favor distributed generation through solar panels over the traditional utility model.
Entergy closed its Vermont Yankee nuclear plant in December 2014, reducing future cash flow. The Entergy Wholesale Commodities unit is struggling as wholesale electricity prices are low and political opposition to nuclear energy may result in further closures: Entergy’s Indian Point, NY is threatened by strained relations with New York regulators.
AES operates in 25 countries including some that can be considered highly risky such as Brazil, Argentina, and Khazakhstan that are subject to exchange rate as well as regulatory risk. Investors may be concerned about political risk at a time of extreme geopolitical instability.
PPL revenues have declined every year since 2011. Our standard model assumption of 2 % pa revenue growth may be beyond PPL. The company had announced at the end of 2014 its intention to spin off its competitive generation business (in partnership with Riverstone Holdings) as Talen Energy. Investors may well have been concerned that this transaction may not be accretive for the parent company.
Southern Company has two major projects that are significantly over-running their capital spending budgets: the Kemper lignite gasification, combined cycle generation and CO2 sequestration project in Alabama and the Vogtle nuclear power project in Georgia. The company has already taken reserves against the likelihood that they will not be allowed to recover all the over-runs from their customers.
The four companies that traded at a premium over intrinsic value at the end of 2014 apparently are expected to provide positive surprises in the form of higher growth, improved profitability or lower risk in the future than they have achieved in the past:
NRG grew revenues and cash from operations rapidly in 2013 and 2014 with a sequence of acquisitions in retail power, wind farms and solar energy. The company dropped down the contracted renewable assets into NRG Yield, a tax advantaged entity that has many of the features of a master limited partnership. At the end of 2014, investors clearly believed NRG could continue a higher growth rate than the 1.5% pa assumed in our standard model4.
ENGIE reduced its revenues in 2013 and 2014 after a series of divestments and unfavorable weather events in France and Brazil. Investors apparently believe that ENGIE has prospects for growth above the group average from its international gas and power businesses. This is an act of faith that a global gas and power portfolio has coherence, which has not yet been demonstrated.
Dominion is investing in its Blue Racer joint venture to participate in natural gas infrastructure investments serving the Marcellus and Utica natural gas plays in Appalachia, and is further investing in its Cove Point LNG export facility. These natural gas infrastructure investments would set Dominion apart from the pure play power companies and should support higher revenue and cash flow growth.
4 Since our analysis was completed NRG under pressure from investors due to its falling share price in 2005, has “reset” its portfolio with the intent of spinning off as Greenco its residential solar, electric car recharging facilities and other non-utility scale renewable businesses. This business was perceived as consuming cash that would be better deployed into increasing dividends.
Value Creation by Power Sector Companies
12
Calpine, as a specialist in building, operating, contracting and financing highly efficient natural gas fired combined cycle generating plants, has an established business model for creating shareholder value. The company has grown its revenues strongly in 2013 and 2014; investors clearly expect Calpine to continue growing above the group average rate.
2.2.2 Cash Flows
Cash flow from operations from 2005-13 was calculated as earnings before taxes excluding unusual
items, less taxes as paid, plus depreciation and amortization and change in net working capital.
Calculated future cash flow from operations assumed 1.5% p.a. growth in revenues for each company,
so assumed no changes in market share.
Capital expenditures were assumed to continue into the future at the same proportion of cash flow
from operations as during 2008-14, capped at 70%.
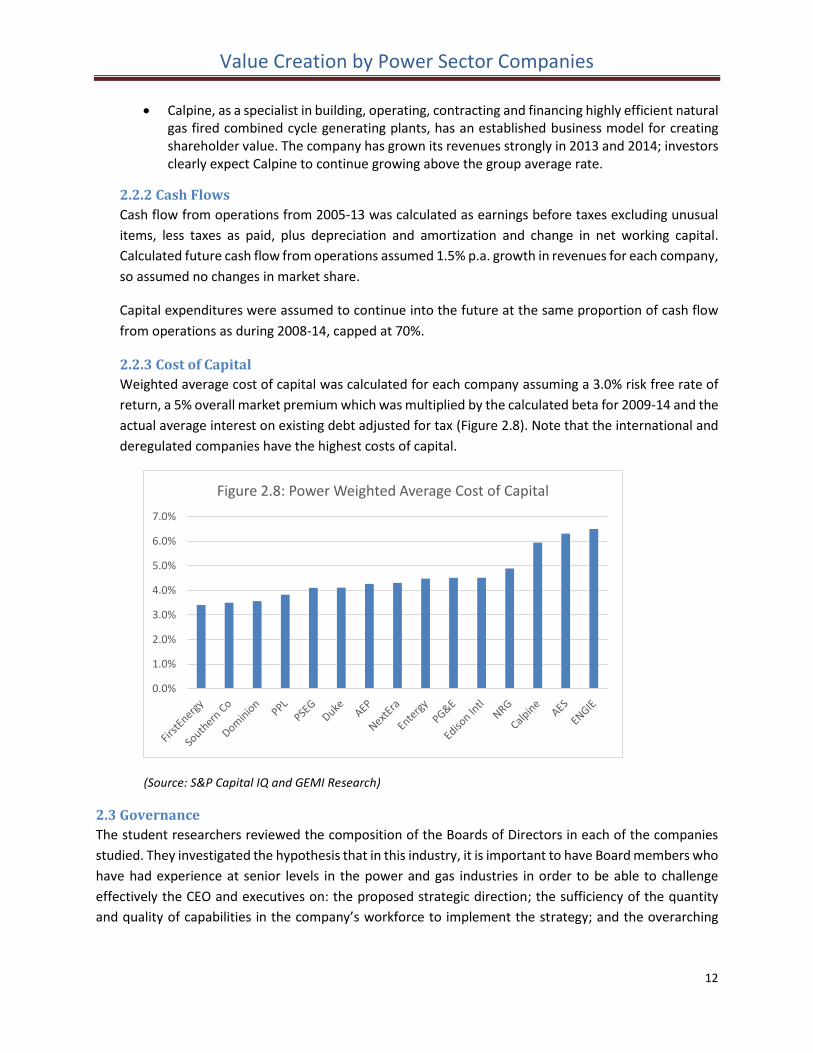
2.2.3 Cost of Capital
Weighted average cost of capital was calculated for each company assuming a 3.0% risk free rate of
return, a 5% overall market premium which was multiplied by the calculated beta for 2009-14 and the
actual average interest on existing debt adjusted for tax (Figure 2.8). Note that the international and
deregulated companies have the highest costs of capital.
(Source: S&P Capital IQ and GEMI Research)
2.3 Governance
The student researchers reviewed the composition of the Boards of Directors in each of the companies
studied. They investigated the hypothesis that in this industry, it is important to have Board members who
have had experience at senior levels in the power and gas industries in order to be able to challenge
effectively the CEO and executives on: the proposed strategic direction; the sufficiency of the quantity
and quality of capabilities in the company’s workforce to implement the strategy; and the overarching
0.0%
1.0%
2.0%
3.0%
4.0%
5.0%
6.0%
7.0%
Figure 2.8: Power Weighted Average Cost of Capital
Value Creation by Power Sector Companies
13
leadership and organizational framework of the company, including clarity of strategic communications,
values and culture, performance management, decision rules and talent development.
To do this we ranked Board members according to the scoring system below (Table 2.3)
Table 2.3: Board Member Scoring System
Member Background Power or Gas Industry
Other Energy, IT or Telecom
Banking, Finance, Other Industry
Other
Weight 3 2 1 0
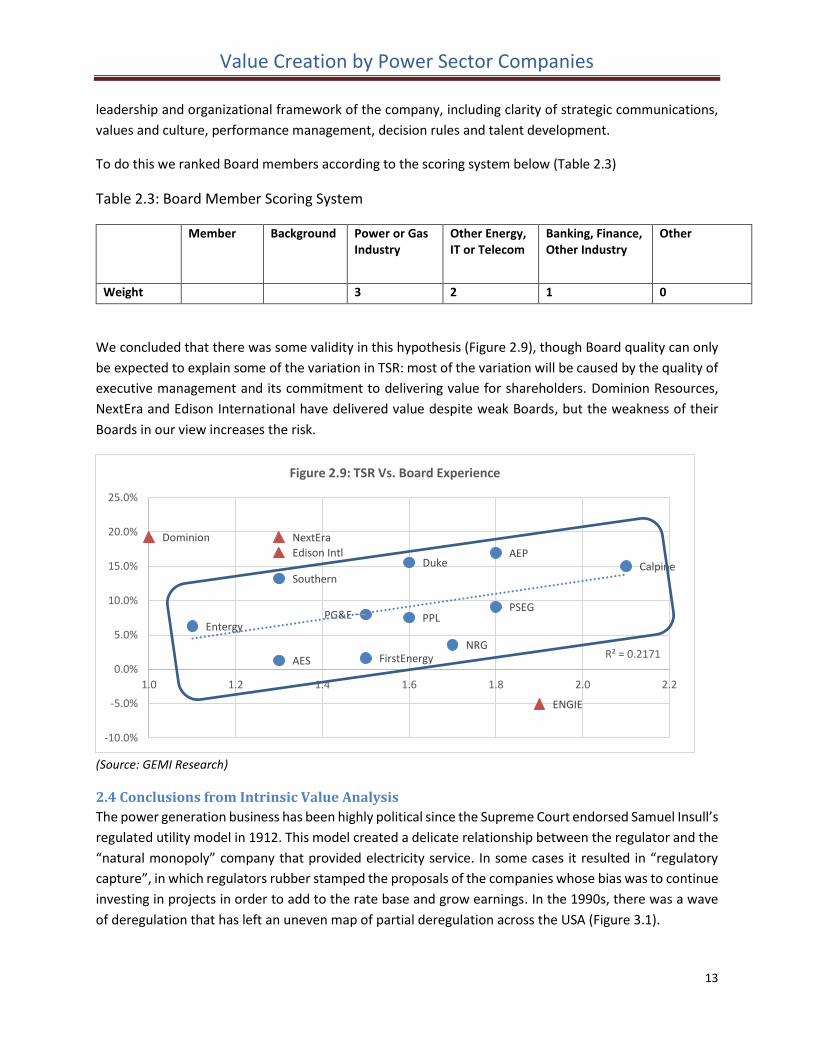
We concluded that there was some validity in this hypothesis (Figure 2.9), though Board quality can only
be expected to explain some of the variation in TSR: most of the variation will be caused by the quality of
executive management and its commitment to delivering value for shareholders. Dominion Resources,
NextEra and Edison International have delivered value despite weak Boards, but the weakness of their
Boards in our view increases the risk.
(Source: GEMI Research)
2.4 Conclusions from Intrinsic Value Analysis
The power generation business has been highly political since the Supreme Court endorsed Samuel Insull’s
regulated utility model in 1912. This model created a delicate relationship between the regulator and the
“natural monopoly” company that provided electricity service. In some cases it resulted in “regulatory
capture”, in which regulators rubber stamped the proposals of the companies whose bias was to continue
investing in projects in order to add to the rate base and grow earnings. In the 1990s, there was a wave
of deregulation that has left an uneven map of partial deregulation across the USA (Figure 3.1).
PG&E
Southern
Duke
Entergy
PSEG
AEPCalpine
PPL
NRGFirstEnergyAES
Edison Intl
NextEraDominion
ENGIE
R² = 0.2171
-10.0%
-5.0%
0.0%
5.0%
10.0%
15.0%
20.0%
25.0%
1.0 1.2 1.4 1.6 1.8 2.0 2.2
Figure 2.9: TSR Vs. Board Experience
Value Creation by Power Sector Companies
14
State politicians from time to time intervened when they perceived the regulator-company relationship
to be too intimate. They also imposed constraints on the system in the form of environmental regulations
and renewable portfolio standards. The federal government is also intervening with a series of national
environmental regulations that have the clear intent of forcing coal fired power generation plants to close,
as well as subsidies for renewable energy projects.
Companies, therefore, must manage a series of stakeholders with goals that could threaten their mission
of providing affordable, reliable energy to their customers, and uncover the opportunities inherent in
these apparent threats to create value for their shareholders. Some companies have been more successful
than others:
NRG and NextEra have invested heavily in renewable wind and solar power with long term
contracts with retailers that have allowed growth in revenues and earnings. Both have dropped
down most of these assets into tax advantaged YieldCos, opening up a new source of funds from
investors looking to participate in the YieldCo tax advantaged distributions. NextEra (19.2% pa)
delivered higher 2009-14 TSR than NRG (3.6% pa), though NRG was valued at a higher premium
over our modeled intrinsic value. NextEra has the advantage of a regulated Florida Power & Light
as a keel for its renewables investments, while NRG is anchored to its large position in intensely
competitive deregulated power markets.
AEP (16.9% pa TSR growth) has found growth through investments in transmission lines required
to bring rural wind energy to urban population centers. The company appears to be reasonably
valued based on our standard model, so has potential for further TSR growth if revenue can be
grown faster than 1.5% pa.
Edison International (17.0% pa TSR growth) has been investing steadily in modernizing its power
transmission and distribution system to accommodate two-way flows between the grid and solar
generating buildings. It has embraced electric vehicles and has invested in charging stations and
in a commercial electric vehicle manufacturer.
Duke (15.5% TSR growth) has continued to invest in modernizing the grid for its utilities as well as
in building and acquiring commercial wind and regulated solar farms and recently. Commercial
wind is sold under long term contracts and the regulated businesses earn a stipulated return, so
that Duke can continue to grow revenues, cash flow and dividends. The company seems
reasonably valued and does not seem to be penalized for its large fleet of coal fired power plants,
nor for the consequences of its recent and possible future spills from coal ash pits.
Dominion (19.3% pa TSR Growth) and Calpine (15.0% TSR growth) are highly leveraged to natural
gas: Calpine by virtue of its expanding fleet of natural gas fired combined cycle generation plants,
and Dominion through investments in natural gas infrastructure serving Marcellus and Utica
production. Both are valued at a premium over our standard model intrinsic value.
The strategic lessons are clear. So long as: PUCs allow investments in expanding transmission and
modernizing the grid to be included in company rate bases; renewables are favored by subsidies and
renewable portfolio standards leading to long term contracts with marketers; and the public does not
baulk at higher electricity prices, utilities can continue to grow faster than our standard model
Value Creation by Power Sector Companies
15
assumptions and deliver attractive returns. If at some point in the future the public perceives that
electricity prices are increasing and reliability is deteriorating, and is not convinced that the benefits of
renewable energy outweigh the increased costs, then there will be some push-back that PUCs would be
bound to consider. In that scenario, power companies would be challenged to find new growth
opportunities.
The companies with lower TSR growth have encountered specific headwinds causing their values to be
discounted as described in Section 2.2.1 above. The lessons from their troubles are:
Operational integrity is vital in this industry: explosions and reliability lapses will be punished and
will destroy shareholder value.
Good relations with regulators are important, but should be earned not bought.
Cost overruns will not be fully passed on to consumers, and will destroy shareholder value.
Nuclear energy is still unpopular and is a risky bet absent strong regulatory support.
International investments in the power sector have only created value in a few countries.
Companies with substantial assets dedicated to generating power for deregulated markets have a
problem. As illustrated in the comparison of NRG and NextEra above, their ability to increase shareholder
value will be constrained by low power prices in highly competitive, often oversupplied markets. Their
future success will depend on forced closure of existing power plants, either coal plants unable to
economically meet EPA regulations, or nuclear plants reaching the end of their lives, that will increase
capacity utilization, strengthen wholesale electricity prices and require construction of new capacity. Even
then, companies will be reluctant to build new plants without some assurance that the power can be sold
at prices that will remunerate their investment. Capacity markets may be necessary to provide such an
incentive and reduce the risk of reduced reliability. If there are problems with domestic oil refineries,
gasoline can readily be withdrawn from inventory or imported: the same is not the case for electricity,
which is more difficult and expensive to store and cannot be imported on ships.
Value Creation by Power Sector Companies
16
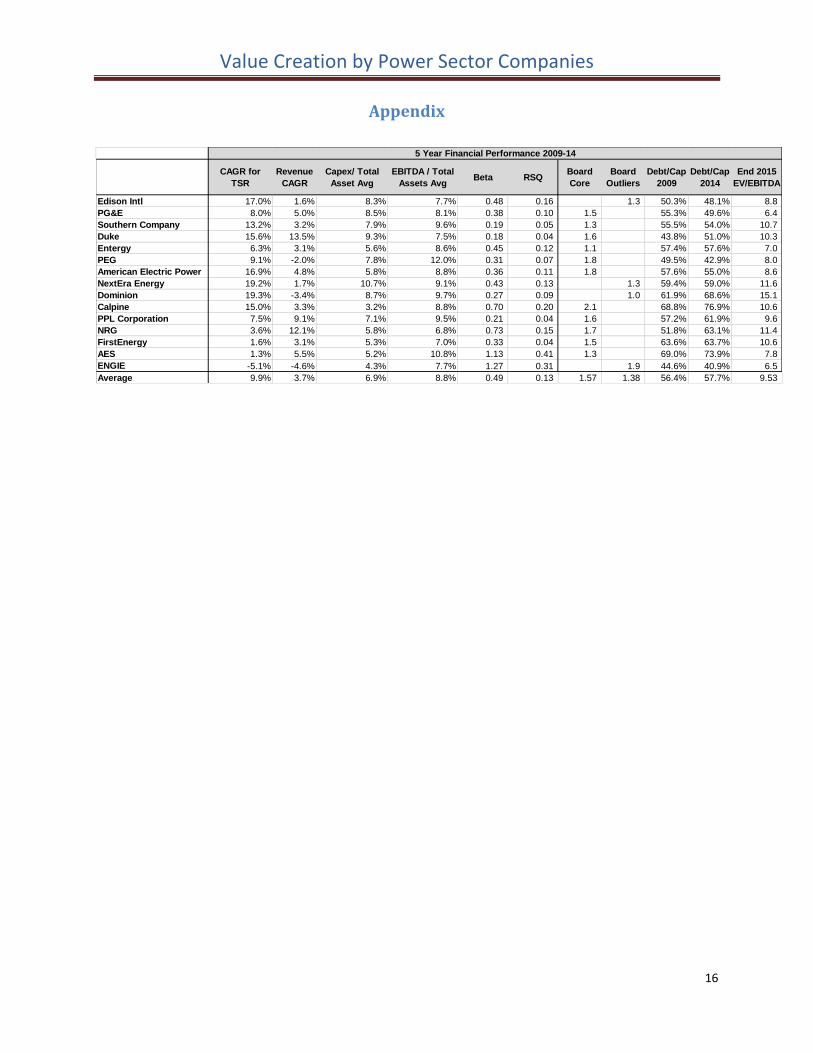
Appendix
CAGR for
TSR
Revenue
CAGR
Capex/ Total
Asset Avg
EBITDA / Total
Assets AvgBeta RSQ
Board
Core
Board
Outliers
Debt/Cap
2009
Debt/Cap
2014
End 2015
EV/EBITDA
Edison Intl 17.0% 1.6% 8.3% 7.7% 0.48 0.16 1.3 50.3% 48.1% 8.8
PG&E 8.0% 5.0% 8.5% 8.1% 0.38 0.10 1.5 55.3% 49.6% 6.4
Southern Company 13.2% 3.2% 7.9% 9.6% 0.19 0.05 1.3 55.5% 54.0% 10.7
Duke 15.6% 13.5% 9.3% 7.5% 0.18 0.04 1.6 43.8% 51.0% 10.3
Entergy 6.3% 3.1% 5.6% 8.6% 0.45 0.12 1.1 57.4% 57.6% 7.0
PEG 9.1% -2.0% 7.8% 12.0% 0.31 0.07 1.8 49.5% 42.9% 8.0
American Electric Power 16.9% 4.8% 5.8% 8.8% 0.36 0.11 1.8 57.6% 55.0% 8.6
NextEra Energy 19.2% 1.7% 10.7% 9.1% 0.43 0.13 1.3 59.4% 59.0% 11.6
Dominion 19.3% -3.4% 8.7% 9.7% 0.27 0.09 1.0 61.9% 68.6% 15.1
Calpine 15.0% 3.3% 3.2% 8.8% 0.70 0.20 2.1 68.8% 76.9% 10.6
PPL Corporation 7.5% 9.1% 7.1% 9.5% 0.21 0.04 1.6 57.2% 61.9% 9.6
NRG 3.6% 12.1% 5.8% 6.8% 0.73 0.15 1.7 51.8% 63.1% 11.4
FirstEnergy 1.6% 3.1% 5.3% 7.0% 0.33 0.04 1.5 63.6% 63.7% 10.6
AES 1.3% 5.5% 5.2% 10.8% 1.13 0.41 1.3 69.0% 73.9% 7.8
ENGIE -5.1% -4.6% 4.3% 7.7% 1.27 0.31 1.9 44.6% 40.9% 6.5
Average 9.9% 3.7% 6.9% 8.8% 0.49 0.13 1.57 1.38 56.4% 57.7% 9.53
5 Year Financial Performance 2009-14
Value Creation by Power Sector Companies
17
Company Profiles
Value Creation by Power Sector Companies
18
1. FirstEnergy Corp.
History
FirstEnergy Corp. was formed in 1997 through the merger of Ohio Edison Company and Centerior Energy Corporation. Through this merger, FirstEnergy (FE) became the holding company for Ohio Edison and its Pennsylvania Power Company subsidiary, as well as The Cleveland Electric Illuminating Company and The Toledo Edison Company.
At that time, FirstEnergy was the 11th largest investor-owned electric system in the nation, based on annual electric sales of 64 billion kilowatt-hours, with total assets of nearly $20 billion. Based in Akron, Ohio, the new company employed some 10,000 employees, served 2.2 million customers within 13,200 square miles of northern and central Ohio and western Pennsylvania, and had approximately 12,000 megawatts of generating capacity.
FE nearly doubled its revenue to more than $12 billion and customers served to more than 4.3 million when it merged with the former GPU, Inc., based in Morristown, N.J., in 2001. GPU served 2.1 million customers in a 24,000 square-mile service area in Pennsylvania and New Jersey through its three operating companies: Metropolitan Edison Company, Pennsylvania Electric Company, and Jersey Central Power & Light Company.
In 2011, FE completed a merger with Allegheny Energy, a Greensburg, Pa.-based company that served 1.6 million customers in Pennsylvania, West Virginia, Maryland and Virginia. The merger more than doubled FE's highly efficient, supercritical coal capacity and provided opportunities for the company to grow and expand into new markets with a stronger, more focused competitive operation.
Today, FE is one of the nation's largest investor-owned electric systems based on the number of customers served.
Table 1: Corporate timeline
1997
Ohio Edison Company and Centerior Energy Corporation merged, creating FE as the holding company for Ohio Edison and its Pennsylvania Power Company subsidiary. In addition, The Cleveland Electric Illuminating Company and The Toledo Edison Company was now controlled by the newly-formed FE.
2001 FE merged with General Public Utilities (GPU, Inc.), in a$12bn deal doubling FE’s revenue and customer base.
2002 FE sold Midlands Electricity plc to UtiliCorp United Inc. for $2bn.
2011 FE merged with Allegheny Energy, Inc. in a $9.3bn deal that added 1.6 m customers and doubled their coal capacity.
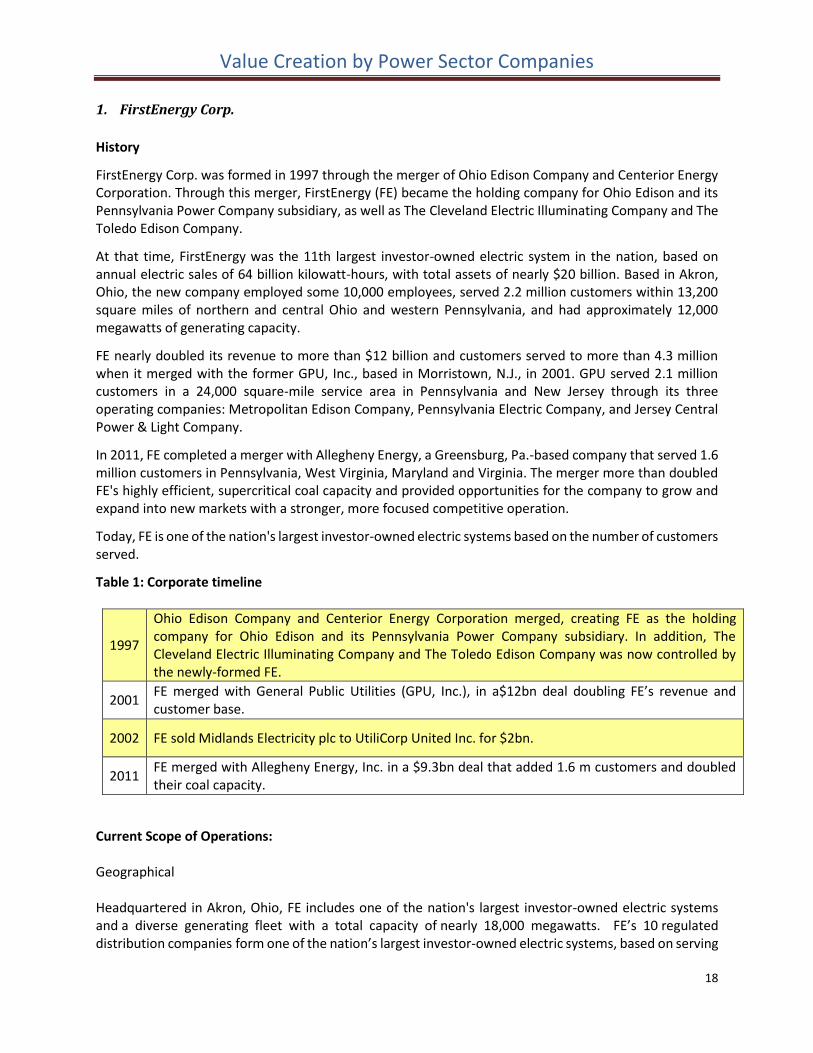
Current Scope of Operations: Geographical Headquartered in Akron, Ohio, FE includes one of the nation's largest investor-owned electric systems and a diverse generating fleet with a total capacity of nearly 18,000 megawatts. FE’s 10 regulated distribution companies form one of the nation’s largest investor-owned electric systems, based on serving
Value Creation by Power Sector Companies
19
6 million customers in the Midwest and Mid-Atlantic regions. Stretching from the Ohio-Indiana border to the New Jersey shore, the companies operate a vast infrastructure of more than 194,000 miles of distribution lines and are dedicated to providing customers with safe, reliable and responsive service. Figure 1 FirstEnergy Map
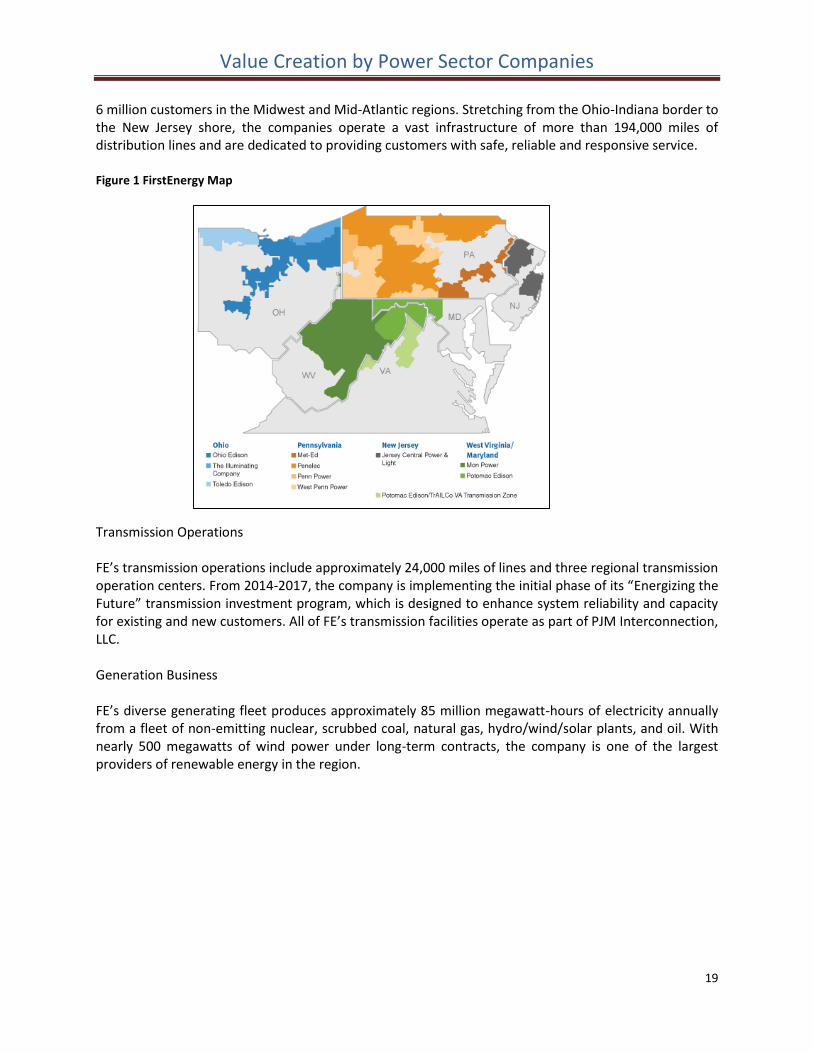
Transmission Operations FE’s transmission operations include approximately 24,000 miles of lines and three regional transmission operation centers. From 2014-2017, the company is implementing the initial phase of its “Energizing the Future” transmission investment program, which is designed to enhance system reliability and capacity for existing and new customers. All of FE’s transmission facilities operate as part of PJM Interconnection, LLC. Generation Business FE’s diverse generating fleet produces approximately 85 million megawatt-hours of electricity annually from a fleet of non-emitting nuclear, scrubbed coal, natural gas, hydro/wind/solar plants, and oil. With nearly 500 megawatts of wind power under long-term contracts, the company is one of the largest providers of renewable energy in the region.
Value Creation by Power Sector Companies
20
Figure 2 FE’s Generation Business Fleet Mix
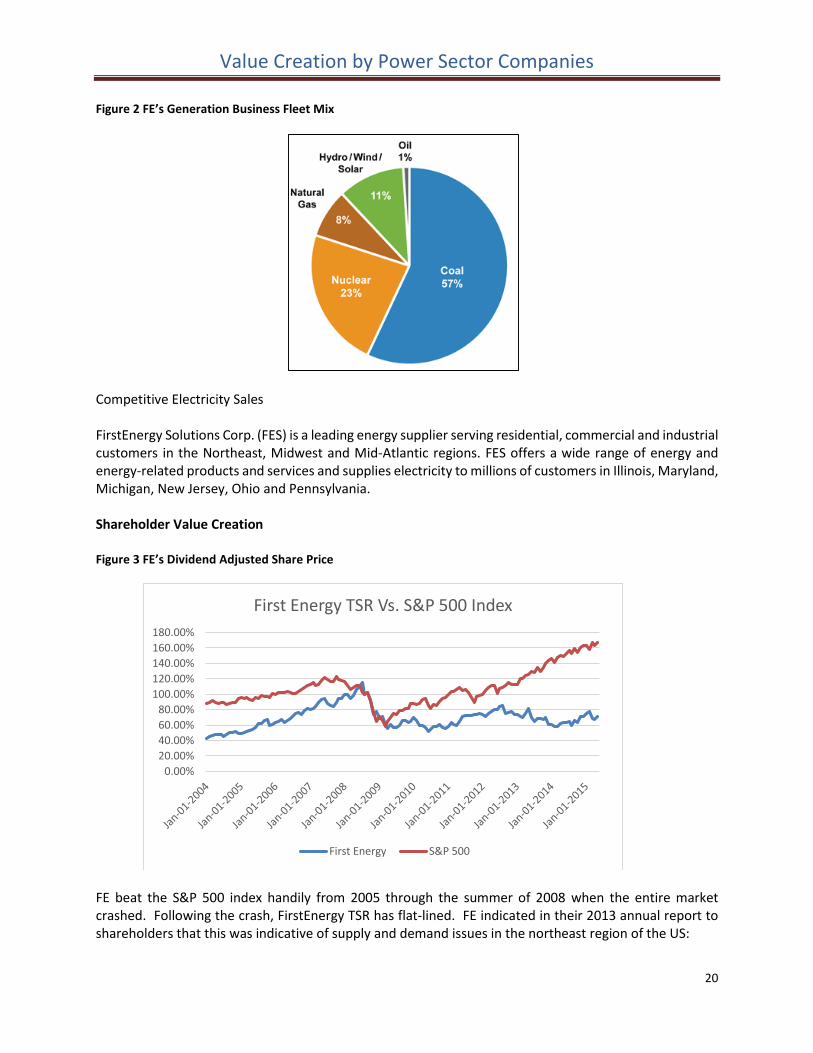
Competitive Electricity Sales FirstEnergy Solutions Corp. (FES) is a leading energy supplier serving residential, commercial and industrial customers in the Northeast, Midwest and Mid-Atlantic regions. FES offers a wide range of energy and energy-related products and services and supplies electricity to millions of customers in Illinois, Maryland, Michigan, New Jersey, Ohio and Pennsylvania. Shareholder Value Creation Figure 3 FE’s Dividend Adjusted Share Price
FE beat the S&P 500 index handily from 2005 through the summer of 2008 when the entire market crashed. Following the crash, FirstEnergy TSR has flat-lined. FE indicated in their 2013 annual report to shareholders that this was indicative of supply and demand issues in the northeast region of the US:
0.00%
20.00%
40.00%
60.00%
80.00%
100.00%
120.00%
140.00%
160.00%
180.00%
First Energy TSR Vs. S&P 500 Index
First Energy S&P 500
Value Creation by Power Sector Companies
21
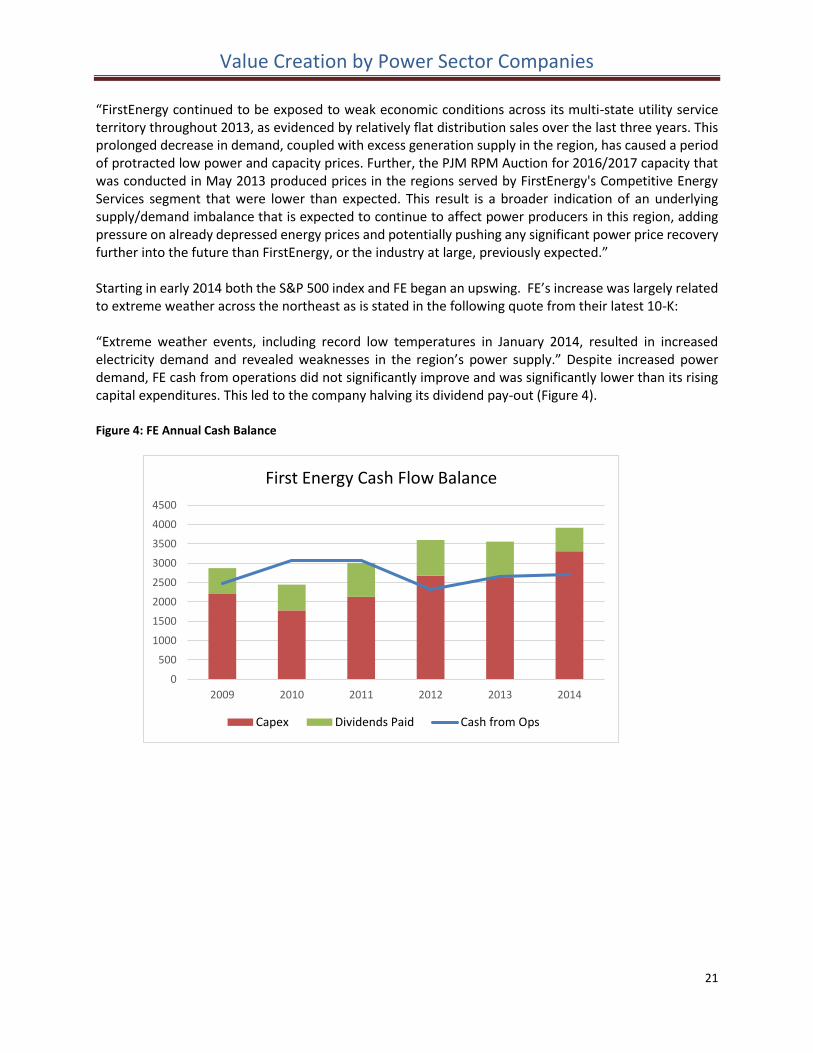
“FirstEnergy continued to be exposed to weak economic conditions across its multi-state utility service territory throughout 2013, as evidenced by relatively flat distribution sales over the last three years. This prolonged decrease in demand, coupled with excess generation supply in the region, has caused a period of protracted low power and capacity prices. Further, the PJM RPM Auction for 2016/2017 capacity that was conducted in May 2013 produced prices in the regions served by FirstEnergy's Competitive Energy Services segment that were lower than expected. This result is a broader indication of an underlying supply/demand imbalance that is expected to continue to affect power producers in this region, adding pressure on already depressed energy prices and potentially pushing any significant power price recovery further into the future than FirstEnergy, or the industry at large, previously expected.” Starting in early 2014 both the S&P 500 index and FE began an upswing. FE’s increase was largely related to extreme weather across the northeast as is stated in the following quote from their latest 10-K: “Extreme weather events, including record low temperatures in January 2014, resulted in increased electricity demand and revealed weaknesses in the region’s power supply.” Despite increased power demand, FE cash from operations did not significantly improve and was significantly lower than its rising capital expenditures. This led to the company halving its dividend pay-out (Figure 4). Figure 4: FE Annual Cash Balance
0
500
1000
1500
2000
2500
3000
3500
4000
4500
2009 2010 2011 2012 2013 2014
First Energy Cash Flow Balance
Capex Dividends Paid Cash from Ops
Value Creation by Power Sector Companies
22
Financial and Operating Results
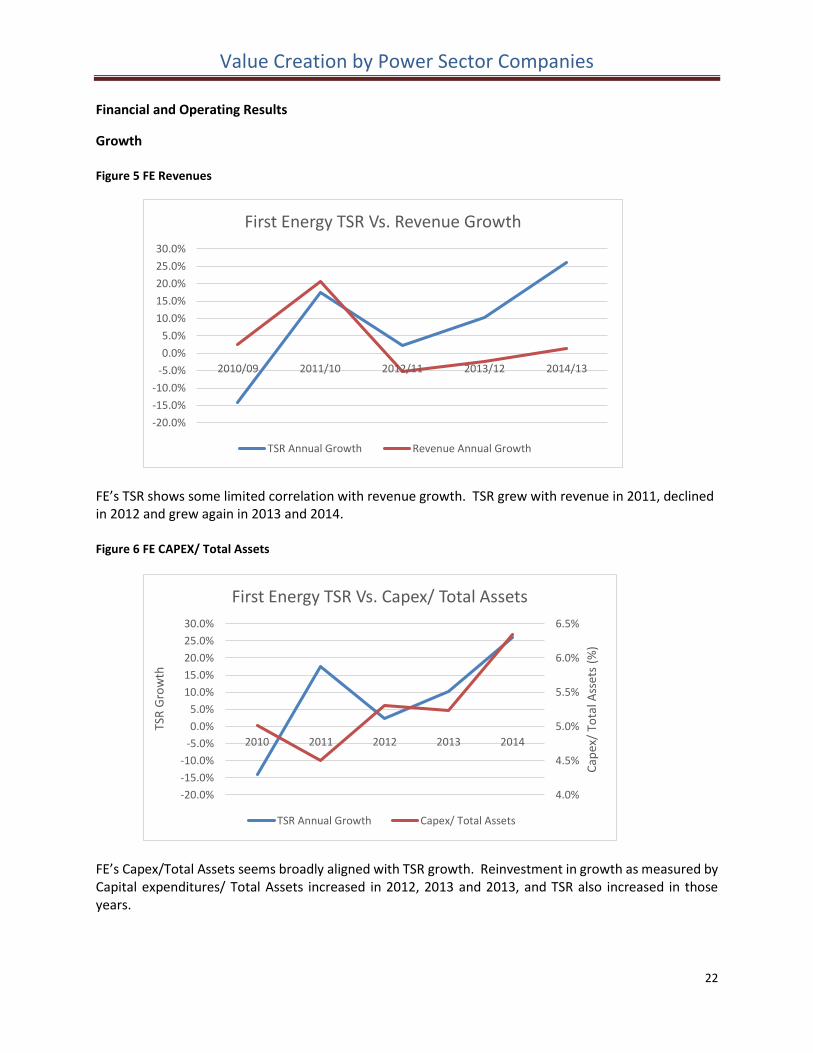
Growth Figure 5 FE Revenues
FE’s TSR shows some limited correlation with revenue growth. TSR grew with revenue in 2011, declined in 2012 and grew again in 2013 and 2014. Figure 6 FE CAPEX/ Total Assets
FE’s Capex/Total Assets seems broadly aligned with TSR growth. Reinvestment in growth as measured by Capital expenditures/ Total Assets increased in 2012, 2013 and 2013, and TSR also increased in those years.
-20.0%
-15.0%
-10.0%
-5.0%
0.0%
5.0%
10.0%
15.0%
20.0%
25.0%
30.0%
2010/09 2011/10 2012/11 2013/12 2014/13
First Energy TSR Vs. Revenue Growth
TSR Annual Growth Revenue Annual Growth
4.0%
4.5%
5.0%
5.5%
6.0%
6.5%
-20.0%
-15.0%
-10.0%
-5.0%
0.0%
5.0%
10.0%
15.0%
20.0%
25.0%
30.0%
2010 2011 2012 2013 2014
Cap
ex/
Tota
l Ass
ets
(%)
TSR
Gro
wth
First Energy TSR Vs. Capex/ Total Assets
TSR Annual Growth Capex/ Total Assets
Value Creation by Power Sector Companies
23
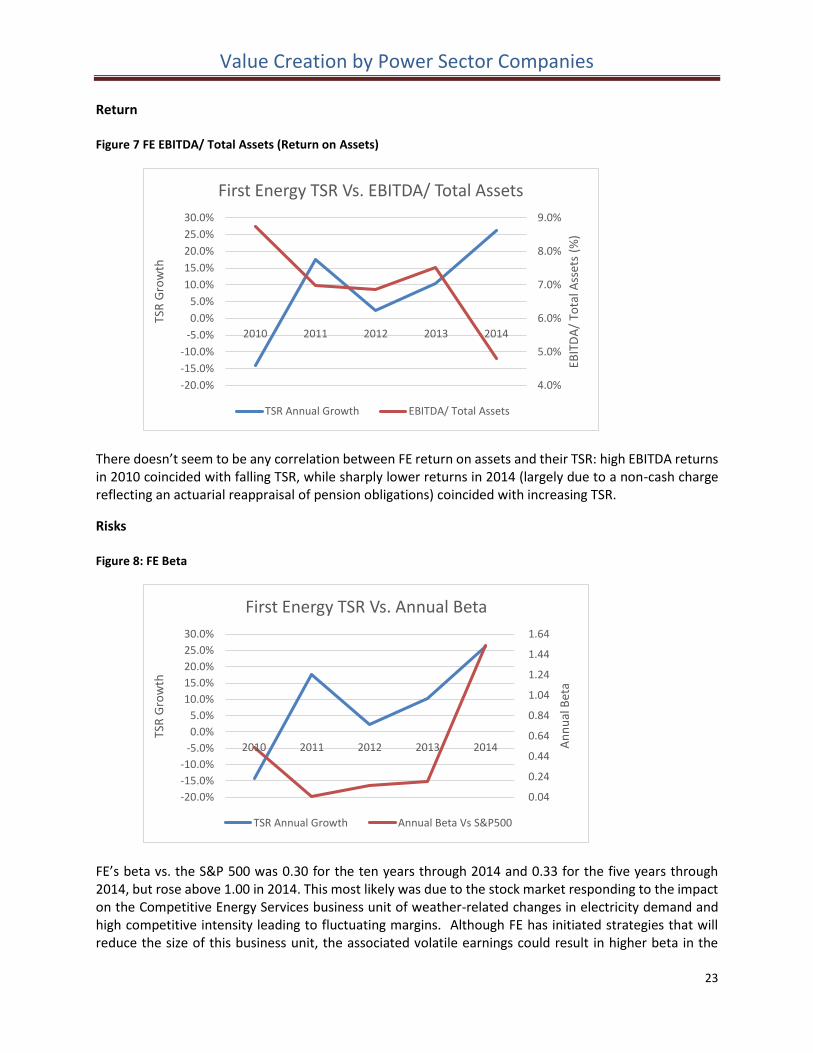
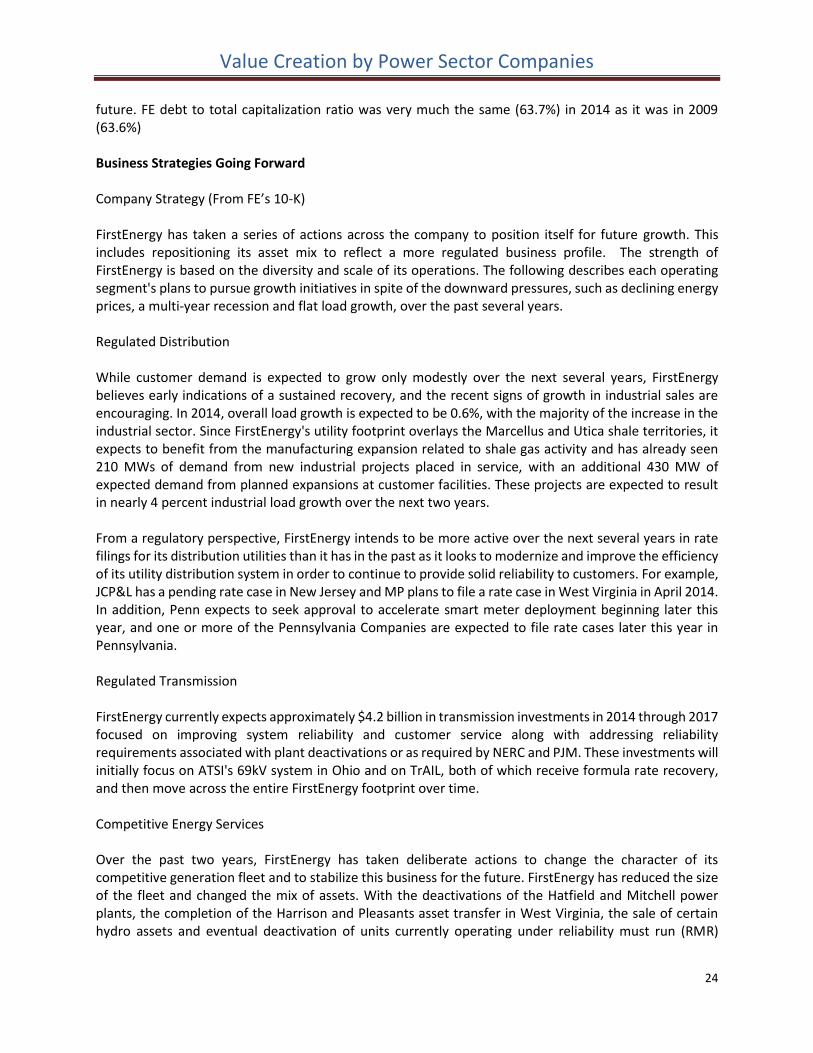
Return Figure 7 FE EBITDA/ Total Assets (Return on Assets)
There doesn’t seem to be any correlation between FE return on assets and their TSR: high EBITDA returns in 2010 coincided with falling TSR, while sharply lower returns in 2014 (largely due to a non-cash charge reflecting an actuarial reappraisal of pension obligations) coincided with increasing TSR.
Risks Figure 8: FE Beta
FE’s beta vs. the S&P 500 was 0.30 for the ten years through 2014 and 0.33 for the five years through 2014, but rose above 1.00 in 2014. This most likely was due to the stock market responding to the impact on the Competitive Energy Services business unit of weather-related changes in electricity demand and high competitive intensity leading to fluctuating margins. Although FE has initiated strategies that will reduce the size of this business unit, the associated volatile earnings could result in higher beta in the
4.0%
5.0%
6.0%
7.0%
8.0%
9.0%
-20.0%
-15.0%
-10.0%
-5.0%
0.0%
5.0%
10.0%
15.0%
20.0%
25.0%
30.0%
2010 2011 2012 2013 2014
EBIT
DA
/ To
tal A
sset
s (%
)
TSR
Gro
wth
First Energy TSR Vs. EBITDA/ Total Assets
TSR Annual Growth EBITDA/ Total Assets
0.04
0.24
0.44
0.64
0.84
1.04
1.24
1.44
1.64
-20.0%
-15.0%
-10.0%
-5.0%
0.0%
5.0%
10.0%
15.0%
20.0%
25.0%
30.0%
2010 2011 2012 2013 2014 An
nu
al B
eta
TSR
Gro
wth
First Energy TSR Vs. Annual Beta
TSR Annual Growth Annual Beta Vs S&P500
Value Creation by Power Sector Companies
24
future. FE debt to total capitalization ratio was very much the same (63.7%) in 2014 as it was in 2009 (63.6%) Business Strategies Going Forward Company Strategy (From FE’s 10-K) FirstEnergy has taken a series of actions across the company to position itself for future growth. This includes repositioning its asset mix to reflect a more regulated business profile. The strength of FirstEnergy is based on the diversity and scale of its operations. The following describes each operating segment's plans to pursue growth initiatives in spite of the downward pressures, such as declining energy prices, a multi-year recession and flat load growth, over the past several years. Regulated Distribution While customer demand is expected to grow only modestly over the next several years, FirstEnergy believes early indications of a sustained recovery, and the recent signs of growth in industrial sales are encouraging. In 2014, overall load growth is expected to be 0.6%, with the majority of the increase in the industrial sector. Since FirstEnergy's utility footprint overlays the Marcellus and Utica shale territories, it expects to benefit from the manufacturing expansion related to shale gas activity and has already seen 210 MWs of demand from new industrial projects placed in service, with an additional 430 MW of expected demand from planned expansions at customer facilities. These projects are expected to result in nearly 4 percent industrial load growth over the next two years. From a regulatory perspective, FirstEnergy intends to be more active over the next several years in rate filings for its distribution utilities than it has in the past as it looks to modernize and improve the efficiency of its utility distribution system in order to continue to provide solid reliability to customers. For example, JCP&L has a pending rate case in New Jersey and MP plans to file a rate case in West Virginia in April 2014. In addition, Penn expects to seek approval to accelerate smart meter deployment beginning later this year, and one or more of the Pennsylvania Companies are expected to file rate cases later this year in Pennsylvania. Regulated Transmission FirstEnergy currently expects approximately $4.2 billion in transmission investments in 2014 through 2017 focused on improving system reliability and customer service along with addressing reliability requirements associated with plant deactivations or as required by NERC and PJM. These investments will initially focus on ATSI's 69kV system in Ohio and on TrAIL, both of which receive formula rate recovery, and then move across the entire FirstEnergy footprint over time. Competitive Energy Services Over the past two years, FirstEnergy has taken deliberate actions to change the character of its competitive generation fleet and to stabilize this business for the future. FirstEnergy has reduced the size of the fleet and changed the mix of assets. With the deactivations of the Hatfield and Mitchell power plants, the completion of the Harrison and Pleasants asset transfer in West Virginia, the sale of certain hydro assets and eventual deactivation of units currently operating under reliability must run (RMR)
Value Creation by Power Sector Companies
25
arrangements with Pennsylvania, Jersey, Maryland Interconnection (PJM), FirstEnergy’s competitive generating portfolio will consist of more than 13,000 MWs of diversified capacity, down from approximately 18,000 MWs at the beginning of 2013.
FirstEnergy also has significantly reduced projected capital expenditures for this segment by approximately $1 billion over the next four years. Competitive Energy Services segment spending for Mercury and Air Toxics Standards (MATS) is expected to be approximately $240 million, and the majority of the remaining capital investments will be focused on projects to extend the life of FirstEnergy's nuclear assets, including the planned installation of new steam generators at Davis-Besse in 2014, and new steam generators and a new reactor head at Beaver Valley Unit 2 in 2017.
Over the next several years FirstEnergy is targeting annual retail sales of approximately 100 million MWH, primarily supported by its competitive generation assets. FirstEnergy's competitive generation portfolio, excluding RMR units, is comprised of 38% supercritical coal, 10% subcritical coal, 31% nuclear, 12% gas and oil, and 9% renewables. In total, these generating assets make up one of the cleanest, lowest-cost generation fleets in the U.S. and are expected to generate between 75 and 80 million MWHs annually. Overall, FirstEnergy's actions are expected to place its competitive operations in a much stronger position to manage through the current power market cycle, while also retaining upside potential if and when markets improve and limiting downside risk from continued depressed conditions associated with capacity prices and forward energy prices. Leadership and Governance Board Members Paul T. Addison - Retired in 2002 as managing director in the Utilities Department of Salomon Smith Barney (Citigroup), an investment banking and financial services firm. Director of the Company since 2003. Committees: Audit, Finance (Chair) Anthony J. Alexander - Executive Chairman of the Board. He served as a Director of FirstEnergy Solutions Corp. and also served as a Director of many other subsidiaries of the Company. Until January 1, 2015, he served as President and Chief Executive Officer, a position he held since 2004. Director of the Company since 2002. Michael J. Anderson - Chairman of the board of directors and chief executive officer since 2012 of The Andersons, Inc., a diversified company with interests in the grain, ethanol, and plant nutrient sectors of U.S. agriculture, as well as in railcar leasing and repair, turf products production, and general merchandise retailing. Chairman of the board of directors, president and chief executive officer of The Andersons, Inc. from 2009 to 2012 and president, chief executive officer and director of The Andersons, Inc. from 1999 to 2009. He has been chairman of the board of Interstate Bakeries Corp. within the past five years. Director of the Company since 2007. William T. Cottle - Retired in 2003 as chairman of the board, president, and chief executive officer of STP Nuclear Operating Company, a nuclear operating company for the South Texas Project. Director of the Company since 2003.
Value Creation by Power Sector Companies
26
Robert B. Heisler, Jr. - Retired in 2011 as Dean of the College of Business Administration and Graduate School of Management (a position held since 2008) of Kent State University. Special assistant for Community and Business Strategies to the president of Kent State University from September 2008 to October 2008 and from 2007 to June 2008. Interim vice president for Finance and Administration of Kent State University from June 2008 to September 2008. Retired in 2007 as chairman of the board (a position held since 2001) of KeyBank N.A., the flagship banking entity within KeyCorp. Chief executive officer of the McDonald Financial Group from 2004 to 2007 and executive vice president of KeyCorp from 1994 to 2007. He is a director of TFS Financial Corporation, The J. M. Smucker Company and Myers Industries, Inc. Director of the Company from 1998 to 2004 and since 2006. Julia L. Johnson - President of NetCommunications, LLC, a national regulatory and public affairs firm focusing primarily on energy, telecommunications, and broadcast regulation, since 2000. She is a director of American Water Works Company, Inc., MasTec, Inc., and NorthWestern Corporation. Director of the Company since 2011 and director of Allegheny Energy, Inc. (merged with the Company in 2011) from 2003 to 2011. Charles E. Jones - President and Chief Executive Officer of FirstEnergy Corp. since January 1, 2015. He was President of the Company's Utility subsidiaries from 2010 to 2015. He was Executive Vice President and President FirstEnergy Utilities from 2014 to 2015, and Senior Vice President and President of FirstEnergy Utilities from 2010 to 2011. He was also Senior Vice President of the Company's utility subsidiaries from 2009 to 2010. He serves as a Director of many other subsidiaries of the Company. Director of the Company since January 1, 2015. Ted J. Kleisner - Retired in 2013 as chairman (a position held since 2012) of Hershey Entertainment & Resorts Company, an entertainment and hospitality company. Chairman and chief executive officer from January to December 2012, president and chief executive officer from 2007 to 2012 and director from 1996 to 2013 of Hershey Entertainment & Resorts Company. President of CSX Hotels, Inc (d/b/a The Greenbrier) from 1988 to 2006 and president and chief executive officer of The Greenbrier Resort & Club Management Company from 1988-2006. Director of the Company since 2011 and director of Allegheny Energy, Inc. (merged with the Company in 2011) from 2001 to 2011. Donald T. Misheff - Retired in 2011 as managing partner (a position held since 2003) of the Northeast Ohio offices of Ernst & Young LLP, a public accounting firm. He is a director of Aleris Corporation and TimkenSteel Corporation. Director of the Company since 2012. Ernest J. Novak, Jr. - Retired in 2003 as managing partner (a position held since 1998) of the Cleveland office of Ernst & Young LLP, a public accounting firm. He is a director of BorgWarner, Inc. and A. Schulman, Inc. Director of the Company since 2004. Christopher D. Pappas - President and chief executive officer of Trinseo S.A. (formerly Styron LLC), a global materials company and manufacturer of plastics, latex and rubber, since 2010. President and chief executive officer of NOVA Chemicals Corporation (“Nova Chemicals”), a producer of plastics and chemicals, in 2009. President and chief operating officer from 2008 to 2009, chief operating officer from 2006 to 2008, and senior vice president & president, Styrenics from 2000 to 2006 for Nova Chemicals. Within the past five years, he was also a director of Nova Chemicals. He is a director Trinseo S.A. Director of the Company since 2011 and director of Allegheny Energy, Inc. (merged with the Company in 2011) from 2008 to 2011.
Value Creation by Power Sector Companies
27
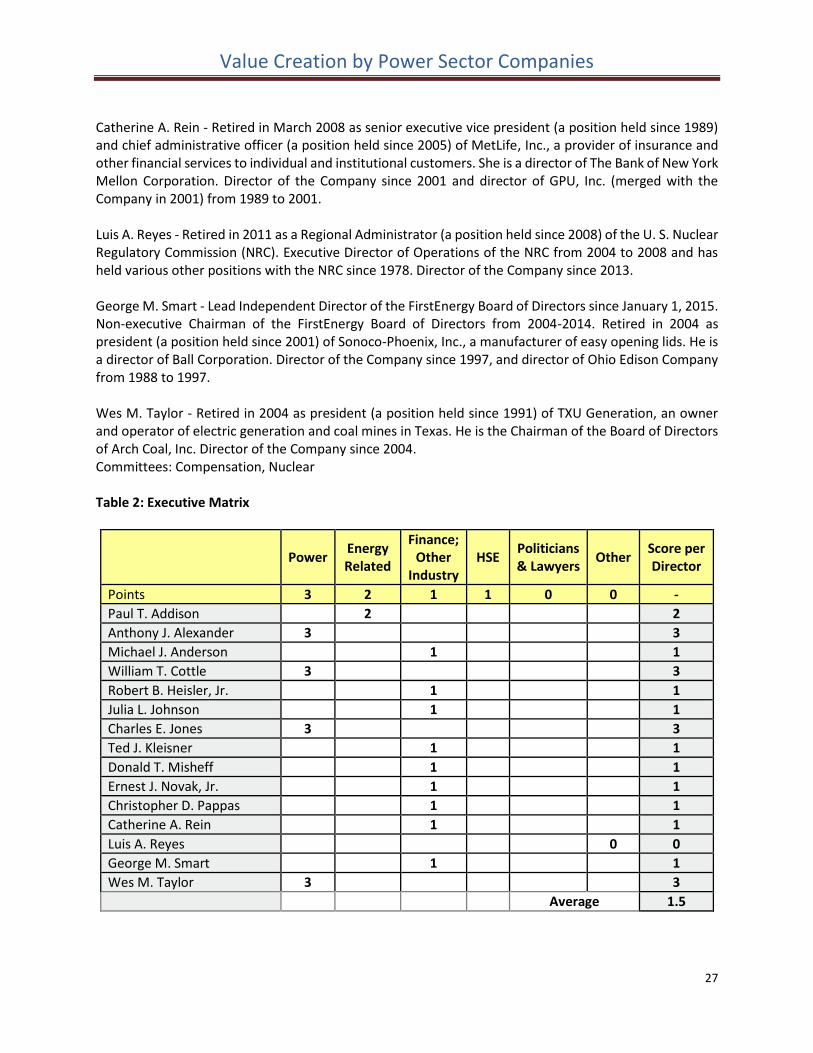
Catherine A. Rein - Retired in March 2008 as senior executive vice president (a position held since 1989) and chief administrative officer (a position held since 2005) of MetLife, Inc., a provider of insurance and other financial services to individual and institutional customers. She is a director of The Bank of New York Mellon Corporation. Director of the Company since 2001 and director of GPU, Inc. (merged with the Company in 2001) from 1989 to 2001. Luis A. Reyes - Retired in 2011 as a Regional Administrator (a position held since 2008) of the U. S. Nuclear Regulatory Commission (NRC). Executive Director of Operations of the NRC from 2004 to 2008 and has held various other positions with the NRC since 1978. Director of the Company since 2013. George M. Smart - Lead Independent Director of the FirstEnergy Board of Directors since January 1, 2015. Non-executive Chairman of the FirstEnergy Board of Directors from 2004-2014. Retired in 2004 as president (a position held since 2001) of Sonoco-Phoenix, Inc., a manufacturer of easy opening lids. He is a director of Ball Corporation. Director of the Company since 1997, and director of Ohio Edison Company from 1988 to 1997. Wes M. Taylor - Retired in 2004 as president (a position held since 1991) of TXU Generation, an owner and operator of electric generation and coal mines in Texas. He is the Chairman of the Board of Directors of Arch Coal, Inc. Director of the Company since 2004. Committees: Compensation, Nuclear Table 2: Executive Matrix
Power
Energy Related
Finance; Other
Industry HSE
Politicians & Lawyers
Other Score per Director
Points 3 2 1 1 0 0 -
Paul T. Addison 2 2
Anthony J. Alexander 3 3
Michael J. Anderson 1 1
William T. Cottle 3 3
Robert B. Heisler, Jr. 1 1
Julia L. Johnson 1 1
Charles E. Jones 3 3
Ted J. Kleisner 1 1
Donald T. Misheff 1 1
Ernest J. Novak, Jr. 1 1
Christopher D. Pappas 1 1
Catherine A. Rein 1 1
Luis A. Reyes 0 0
George M. Smart 1 1
Wes M. Taylor 3 3
Average 1.5
Value Creation by Power Sector Companies
28
FE has a large number of directors with a total of 15. Four of the directors have experience in the power industry. One has experience in other energy. Nine have experience in finance or other industry. And one has experience as a regulator. This brings their average score to 1.5, which is average for the sector, but weak compared to other energy companies.
Valuation FE Enterprise Value at end 2014 was $37.3 Billion, a premium of 7.1% over its intrinsic value calculated by our standard model of $34.9 Billion, suggesting that the company is reasonably valued. However, with 32% of its assets in competitive energy sales, over half of which coal generated, the company will be hard pressed to meet the standard model’s assumed 2% pa revenue growth.
Value Creation by Power Sector Companies
29
2. PG&E Corporation
History PG&E Corporation was founded in 1852 by Peter and James Donahue. The original name of the company was the San Francisco Gas Company, but after merging with the California Gas and Electric Corporation in 1905 it was changed to Pacific Gas and Electric Company. In 1997, with California moving toward restructuring of its electric market, PG&E Corporation became the parent company of Pacific Gas and Electric Company. Table 1: Corporate Timeline
1852 Founded by Peter and James Donahue as the San Francisco Gas Company
1905 San Francisco Gas Company merges with the California Gas and Electric Corporation to become Pacific Gas and Electric Company
1906 Major earthquake destroys large parts of San Francisco along with much of PG&E's infrastructure
1930's PG&E creates an integrated system across Northern California expanding their reach to more rural areas
1945 PG&E increases their workforce by one-third due to post-World War II economic expansion and population boom
1948 Construction is completed on the 502-mile super-inch pipeline connecting the gas fields of Texas and New Mexico with California
1961 PG&E completes the 612-mile PGT Northwest Pipeline, which brings gas from Canada to Northern California
1984 Diablo Canyon Nuclear Power Plant goes online
1997 PG&E Corporation becomes the parent company for Pacific Gas and Electric Company
2001 PG&E Corporation files for Chapter 11 bankruptcy due to the California energy crisis
2004 PG&E Corporation settles filing after 3 years under U.S. Bankruptcy Court protection
Current Scope of Operations
PG&E Corporation is one of the largest combination natural gas and electric utilities in the United States. The company’s primary business is the transmission and delivery of energy for the state of California. Headquartered in San Francisco, California, PG&E provides natural gas and electric service to approximately 16 million people throughout a 70,000 square-mile service area in northern and central California. The company and all other utilities in the state are regulated by the California Public Utilities Commission (CPUC). PG&E currently has about 5 million electricity customers and around 4 million natural gas customers. The company also operates over 141,000 miles of electric distribution lines and about 42,000 miles of natural gas distribution pipelines.
Value Creation by Power Sector Companies
30
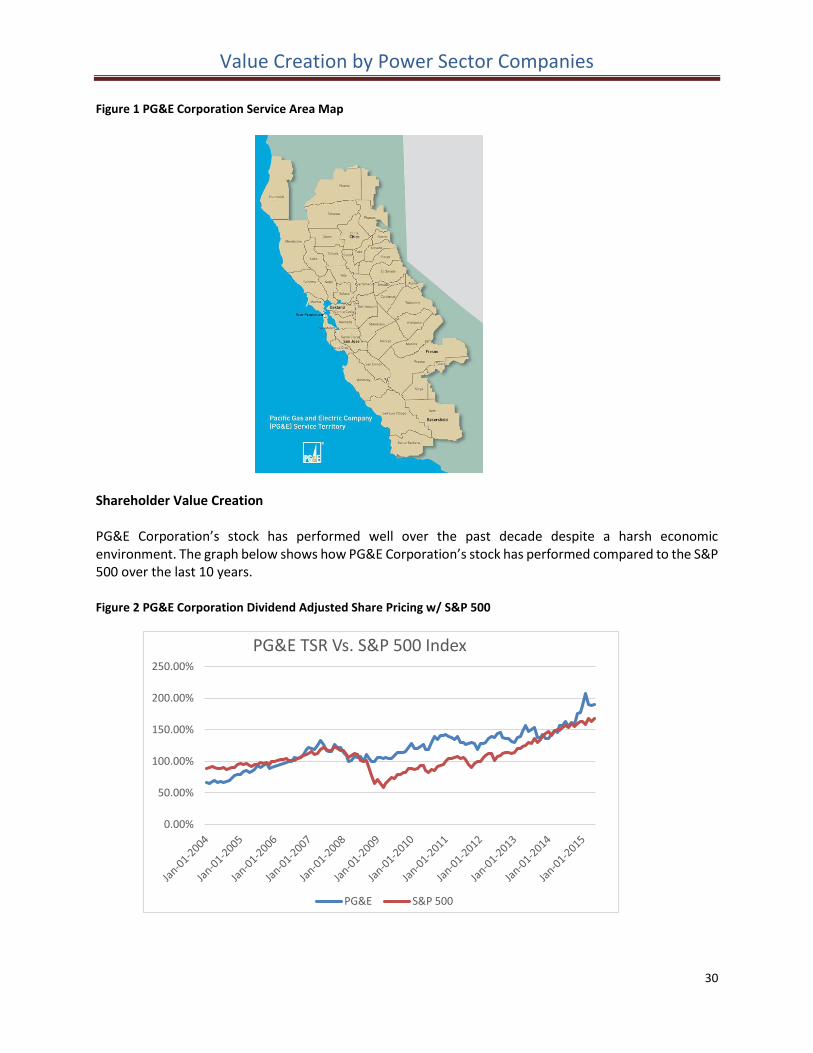
Figure 1 PG&E Corporation Service Area Map
Shareholder Value Creation PG&E Corporation’s stock has performed well over the past decade despite a harsh economic environment. The graph below shows how PG&E Corporation’s stock has performed compared to the S&P 500 over the last 10 years.
Figure 2 PG&E Corporation Dividend Adjusted Share Pricing w/ S&P 500
0.00%
50.00%
100.00%
150.00%
200.00%
250.00%
PG&E TSR Vs. S&P 500 Index
PG&E S&P 500
Value Creation by Power Sector Companies
31
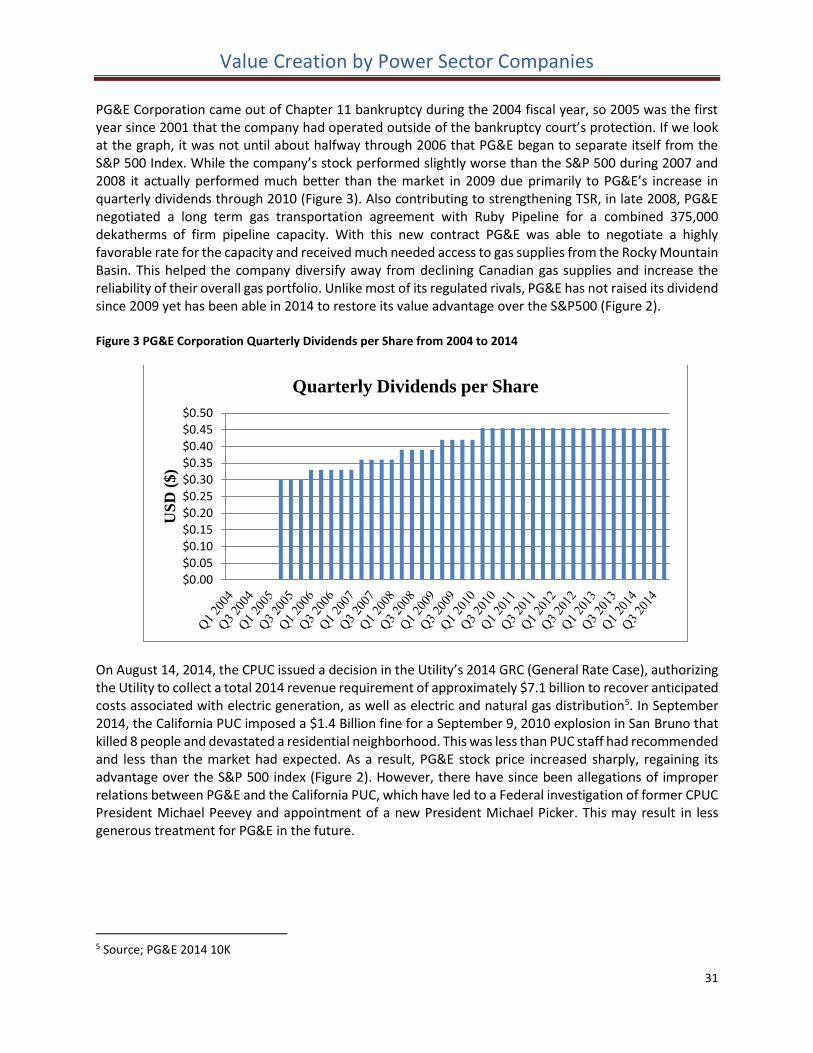
PG&E Corporation came out of Chapter 11 bankruptcy during the 2004 fiscal year, so 2005 was the first year since 2001 that the company had operated outside of the bankruptcy court’s protection. If we look at the graph, it was not until about halfway through 2006 that PG&E began to separate itself from the S&P 500 Index. While the company’s stock performed slightly worse than the S&P 500 during 2007 and 2008 it actually performed much better than the market in 2009 due primarily to PG&E’s increase in quarterly dividends through 2010 (Figure 3). Also contributing to strengthening TSR, in late 2008, PG&E negotiated a long term gas transportation agreement with Ruby Pipeline for a combined 375,000 dekatherms of firm pipeline capacity. With this new contract PG&E was able to negotiate a highly favorable rate for the capacity and received much needed access to gas supplies from the Rocky Mountain Basin. This helped the company diversify away from declining Canadian gas supplies and increase the reliability of their overall gas portfolio. Unlike most of its regulated rivals, PG&E has not raised its dividend since 2009 yet has been able in 2014 to restore its value advantage over the S&P500 (Figure 2). Figure 3 PG&E Corporation Quarterly Dividends per Share from 2004 to 2014
On August 14, 2014, the CPUC issued a decision in the Utility’s 2014 GRC (General Rate Case), authorizing the Utility to collect a total 2014 revenue requirement of approximately $7.1 billion to recover anticipated costs associated with electric generation, as well as electric and natural gas distribution5. In September 2014, the California PUC imposed a $1.4 Billion fine for a September 9, 2010 explosion in San Bruno that killed 8 people and devastated a residential neighborhood. This was less than PUC staff had recommended and less than the market had expected. As a result, PG&E stock price increased sharply, regaining its advantage over the S&P 500 index (Figure 2). However, there have since been allegations of improper relations between PG&E and the California PUC, which have led to a Federal investigation of former CPUC President Michael Peevey and appointment of a new President Michael Picker. This may result in less generous treatment for PG&E in the future.
5 Source; PG&E 2014 10K
$0.00
$0.05
$0.10
$0.15
$0.20
$0.25
$0.30
$0.35
$0.40
$0.45
$0.50
US
D (
$)
Quarterly Dividends per Share
Value Creation by Power Sector Companies
32
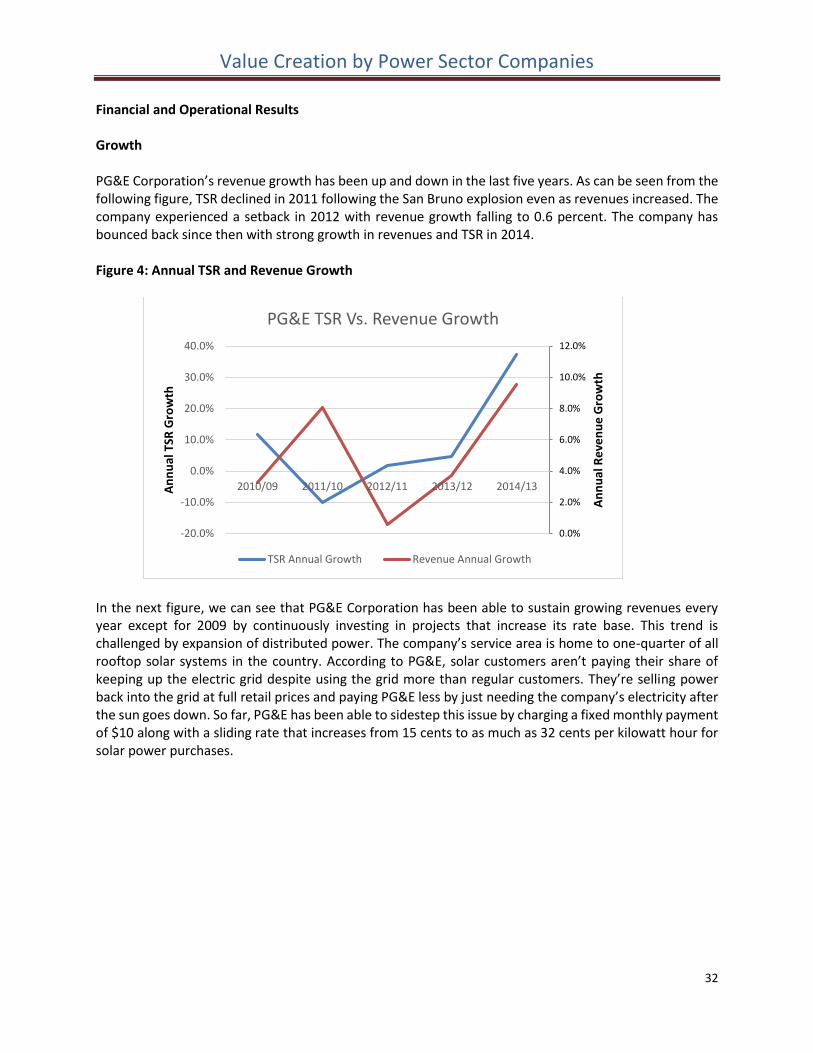
Financial and Operational Results Growth PG&E Corporation’s revenue growth has been up and down in the last five years. As can be seen from the following figure, TSR declined in 2011 following the San Bruno explosion even as revenues increased. The company experienced a setback in 2012 with revenue growth falling to 0.6 percent. The company has bounced back since then with strong growth in revenues and TSR in 2014. Figure 4: Annual TSR and Revenue Growth
In the next figure, we can see that PG&E Corporation has been able to sustain growing revenues every year except for 2009 by continuously investing in projects that increase its rate base. This trend is challenged by expansion of distributed power. The company’s service area is home to one-quarter of all rooftop solar systems in the country. According to PG&E, solar customers aren’t paying their share of keeping up the electric grid despite using the grid more than regular customers. They’re selling power back into the grid at full retail prices and paying PG&E less by just needing the company’s electricity after the sun goes down. So far, PG&E has been able to sidestep this issue by charging a fixed monthly payment of $10 along with a sliding rate that increases from 15 cents to as much as 32 cents per kilowatt hour for solar power purchases.
0.0%
2.0%
4.0%
6.0%
8.0%
10.0%
12.0%
-20.0%
-10.0%
0.0%
10.0%
20.0%
30.0%
40.0%
2010/09 2011/10 2012/11 2013/12 2014/13
An
nu
al R
eve
nu
e G
row
th
An
nu
al T
SR G
row
th
PG&E TSR Vs. Revenue Growth
TSR Annual Growth Revenue Annual Growth
Value Creation by Power Sector Companies
33
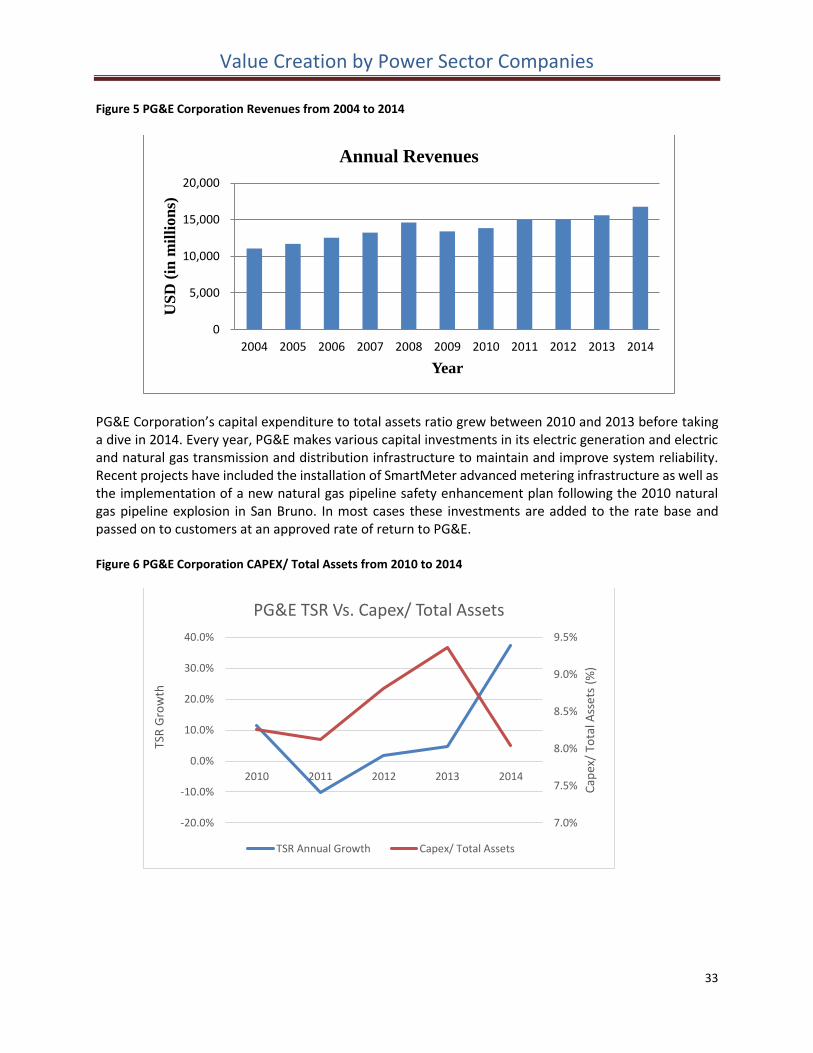
Figure 5 PG&E Corporation Revenues from 2004 to 2014
PG&E Corporation’s capital expenditure to total assets ratio grew between 2010 and 2013 before taking a dive in 2014. Every year, PG&E makes various capital investments in its electric generation and electric and natural gas transmission and distribution infrastructure to maintain and improve system reliability. Recent projects have included the installation of SmartMeter advanced metering infrastructure as well as the implementation of a new natural gas pipeline safety enhancement plan following the 2010 natural gas pipeline explosion in San Bruno. In most cases these investments are added to the rate base and passed on to customers at an approved rate of return to PG&E. Figure 6 PG&E Corporation CAPEX/ Total Assets from 2010 to 2014
0
5,000
10,000
15,000
20,000
2004 2005 2006 2007 2008 2009 2010 2011 2012 2013 2014
US
D (
in m
illi
on
s)
Year
Annual Revenues
7.0%
7.5%
8.0%
8.5%
9.0%
9.5%
-20.0%
-10.0%
0.0%
10.0%
20.0%
30.0%
40.0%
2010 2011 2012 2013 2014
Cap
ex/
Tota
l Ass
ets
(%)
TSR
Gro
wth
PG&E TSR Vs. Capex/ Total Assets
TSR Annual Growth Capex/ Total Assets
Value Creation by Power Sector Companies
34
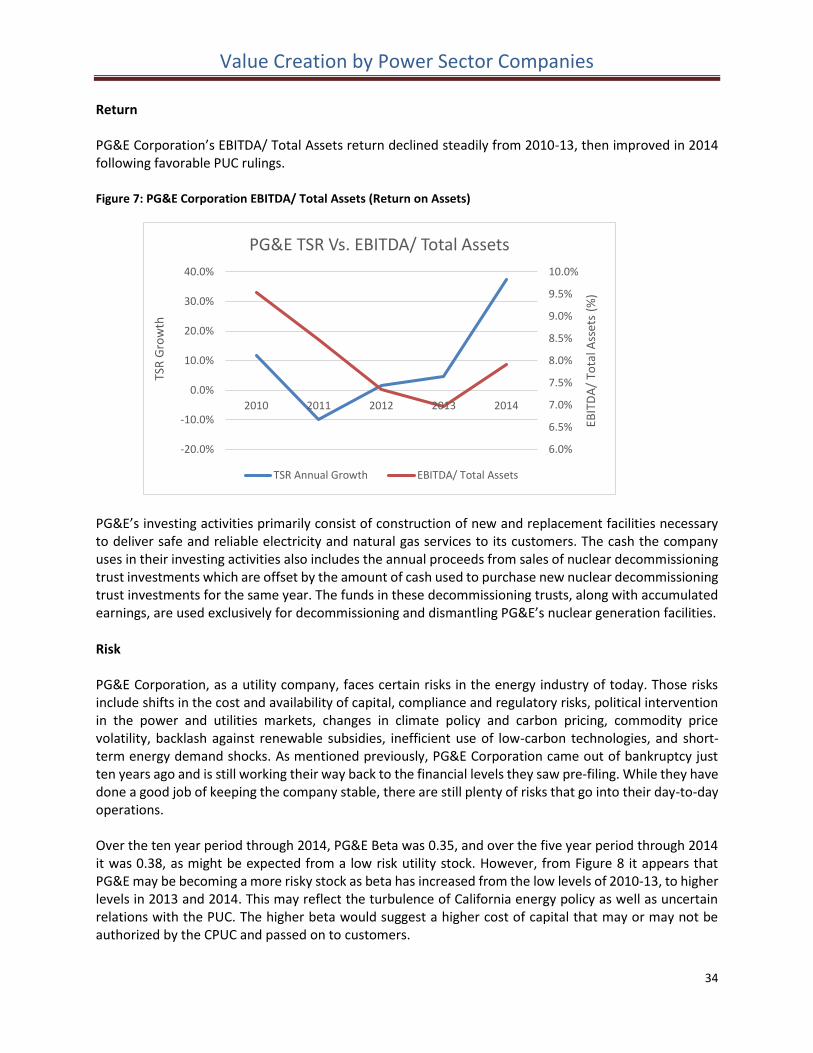
Return PG&E Corporation’s EBITDA/ Total Assets return declined steadily from 2010-13, then improved in 2014 following favorable PUC rulings.
Figure 7: PG&E Corporation EBITDA/ Total Assets (Return on Assets)
PG&E’s investing activities primarily consist of construction of new and replacement facilities necessary to deliver safe and reliable electricity and natural gas services to its customers. The cash the company uses in their investing activities also includes the annual proceeds from sales of nuclear decommissioning trust investments which are offset by the amount of cash used to purchase new nuclear decommissioning trust investments for the same year. The funds in these decommissioning trusts, along with accumulated earnings, are used exclusively for decommissioning and dismantling PG&E’s nuclear generation facilities.
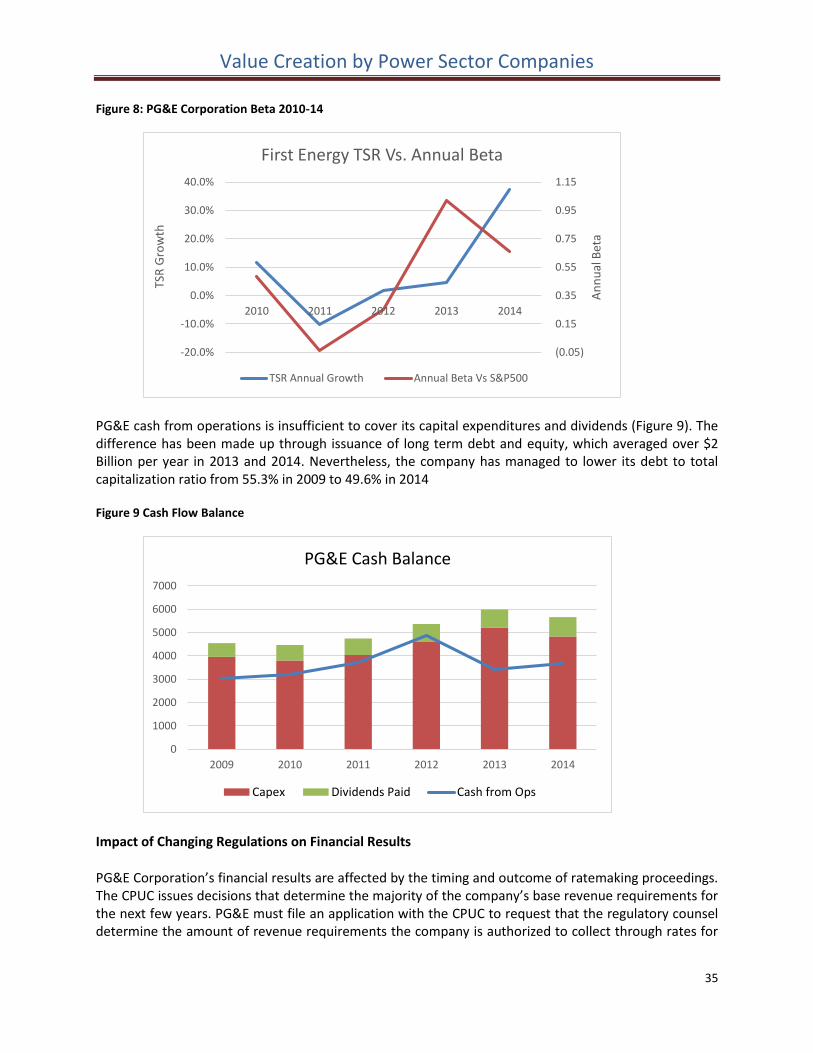
Risk PG&E Corporation, as a utility company, faces certain risks in the energy industry of today. Those risks include shifts in the cost and availability of capital, compliance and regulatory risks, political intervention in the power and utilities markets, changes in climate policy and carbon pricing, commodity price volatility, backlash against renewable subsidies, inefficient use of low-carbon technologies, and short-term energy demand shocks. As mentioned previously, PG&E Corporation came out of bankruptcy just ten years ago and is still working their way back to the financial levels they saw pre-filing. While they have done a good job of keeping the company stable, there are still plenty of risks that go into their day-to-day operations. Over the ten year period through 2014, PG&E Beta was 0.35, and over the five year period through 2014 it was 0.38, as might be expected from a low risk utility stock. However, from Figure 8 it appears that PG&E may be becoming a more risky stock as beta has increased from the low levels of 2010-13, to higher levels in 2013 and 2014. This may reflect the turbulence of California energy policy as well as uncertain relations with the PUC. The higher beta would suggest a higher cost of capital that may or may not be authorized by the CPUC and passed on to customers.
6.0%
6.5%
7.0%
7.5%
8.0%
8.5%
9.0%
9.5%
10.0%
-20.0%
-10.0%
0.0%
10.0%
20.0%
30.0%
40.0%
2010 2011 2012 2013 2014
EBIT
DA
/ To
tal A
sset
s (%
)
TSR
Gro
wth
PG&E TSR Vs. EBITDA/ Total Assets
TSR Annual Growth EBITDA/ Total Assets
Value Creation by Power Sector Companies
35
Figure 8: PG&E Corporation Beta 2010-14
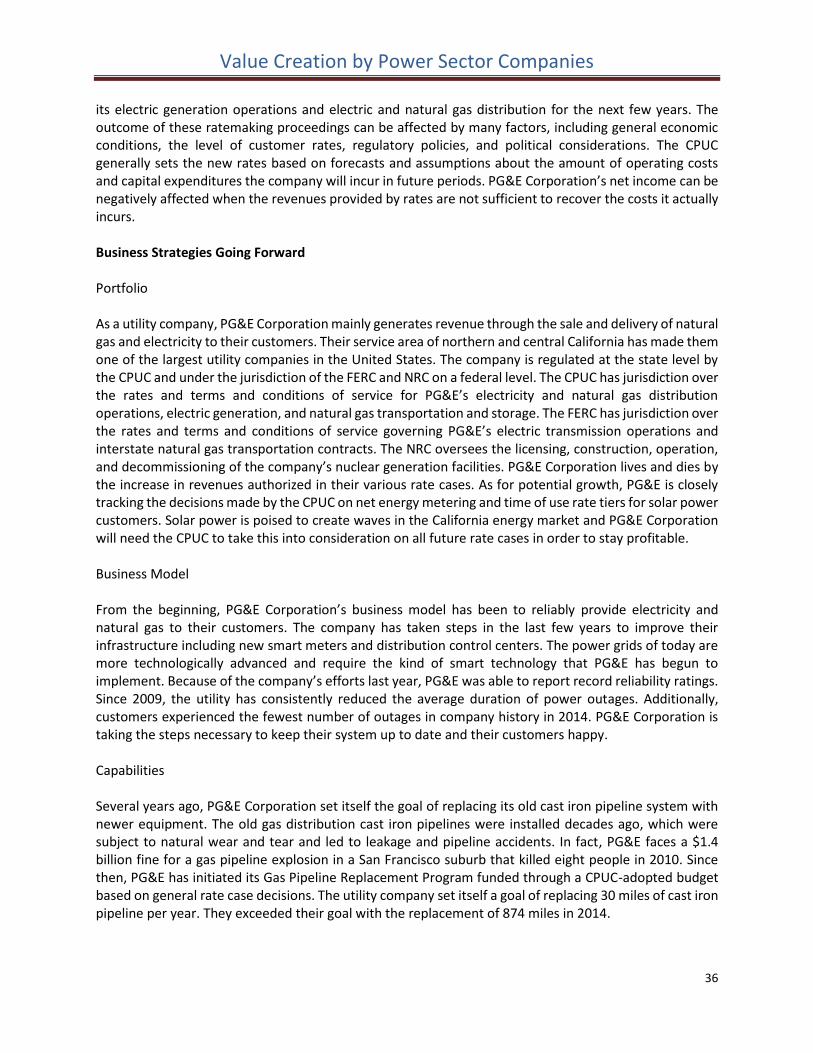
PG&E cash from operations is insufficient to cover its capital expenditures and dividends (Figure 9). The difference has been made up through issuance of long term debt and equity, which averaged over $2 Billion per year in 2013 and 2014. Nevertheless, the company has managed to lower its debt to total capitalization ratio from 55.3% in 2009 to 49.6% in 2014 Figure 9 Cash Flow Balance
Impact of Changing Regulations on Financial Results
PG&E Corporation’s financial results are affected by the timing and outcome of ratemaking proceedings. The CPUC issues decisions that determine the majority of the company’s base revenue requirements for the next few years. PG&E must file an application with the CPUC to request that the regulatory counsel determine the amount of revenue requirements the company is authorized to collect through rates for
(0.05)
0.15
0.35
0.55
0.75
0.95
1.15
-20.0%
-10.0%
0.0%
10.0%
20.0%
30.0%
40.0%
2010 2011 2012 2013 2014
An
nu
al B
eta
TSR
Gro
wth
First Energy TSR Vs. Annual Beta
TSR Annual Growth Annual Beta Vs S&P500
0
1000
2000
3000
4000
5000
6000
7000
2009 2010 2011 2012 2013 2014
PG&E Cash Balance
Capex Dividends Paid Cash from Ops
Value Creation by Power Sector Companies
36
its electric generation operations and electric and natural gas distribution for the next few years. The outcome of these ratemaking proceedings can be affected by many factors, including general economic conditions, the level of customer rates, regulatory policies, and political considerations. The CPUC generally sets the new rates based on forecasts and assumptions about the amount of operating costs and capital expenditures the company will incur in future periods. PG&E Corporation’s net income can be negatively affected when the revenues provided by rates are not sufficient to recover the costs it actually incurs. Business Strategies Going Forward Portfolio As a utility company, PG&E Corporation mainly generates revenue through the sale and delivery of natural gas and electricity to their customers. Their service area of northern and central California has made them one of the largest utility companies in the United States. The company is regulated at the state level by the CPUC and under the jurisdiction of the FERC and NRC on a federal level. The CPUC has jurisdiction over the rates and terms and conditions of service for PG&E’s electricity and natural gas distribution operations, electric generation, and natural gas transportation and storage. The FERC has jurisdiction over the rates and terms and conditions of service governing PG&E’s electric transmission operations and interstate natural gas transportation contracts. The NRC oversees the licensing, construction, operation, and decommissioning of the company’s nuclear generation facilities. PG&E Corporation lives and dies by the increase in revenues authorized in their various rate cases. As for potential growth, PG&E is closely tracking the decisions made by the CPUC on net energy metering and time of use rate tiers for solar power customers. Solar power is poised to create waves in the California energy market and PG&E Corporation will need the CPUC to take this into consideration on all future rate cases in order to stay profitable. Business Model From the beginning, PG&E Corporation’s business model has been to reliably provide electricity and natural gas to their customers. The company has taken steps in the last few years to improve their infrastructure including new smart meters and distribution control centers. The power grids of today are more technologically advanced and require the kind of smart technology that PG&E has begun to implement. Because of the company’s efforts last year, PG&E was able to report record reliability ratings. Since 2009, the utility has consistently reduced the average duration of power outages. Additionally, customers experienced the fewest number of outages in company history in 2014. PG&E Corporation is taking the steps necessary to keep their system up to date and their customers happy. Capabilities Several years ago, PG&E Corporation set itself the goal of replacing its old cast iron pipeline system with newer equipment. The old gas distribution cast iron pipelines were installed decades ago, which were subject to natural wear and tear and led to leakage and pipeline accidents. In fact, PG&E faces a $1.4 billion fine for a gas pipeline explosion in a San Francisco suburb that killed eight people in 2010. Since then, PG&E has initiated its Gas Pipeline Replacement Program funded through a CPUC-adopted budget based on general rate case decisions. The utility company set itself a goal of replacing 30 miles of cast iron pipeline per year. They exceeded their goal with the replacement of 874 miles in 2014.
Value Creation by Power Sector Companies
37
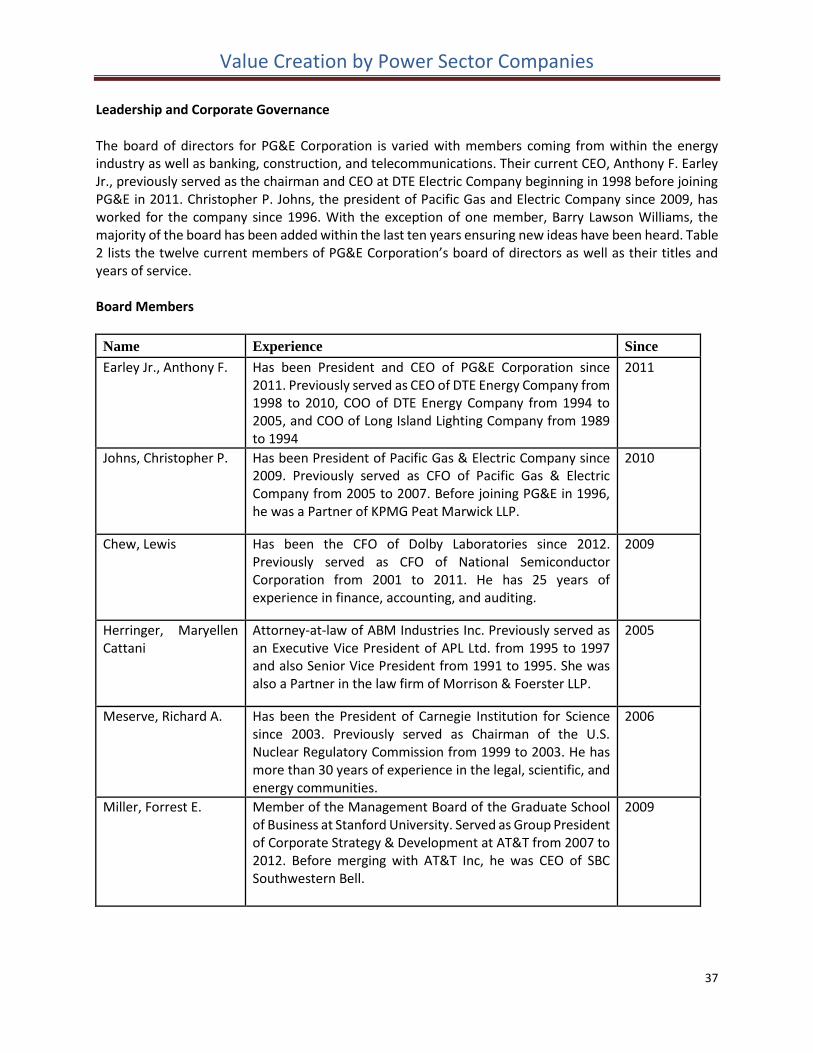
Leadership and Corporate Governance
The board of directors for PG&E Corporation is varied with members coming from within the energy industry as well as banking, construction, and telecommunications. Their current CEO, Anthony F. Earley Jr., previously served as the chairman and CEO at DTE Electric Company beginning in 1998 before joining PG&E in 2011. Christopher P. Johns, the president of Pacific Gas and Electric Company since 2009, has worked for the company since 1996. With the exception of one member, Barry Lawson Williams, the majority of the board has been added within the last ten years ensuring new ideas have been heard. Table 2 lists the twelve current members of PG&E Corporation’s board of directors as well as their titles and years of service. Board Members
Name Experience Since
Earley Jr., Anthony F. Has been President and CEO of PG&E Corporation since 2011. Previously served as CEO of DTE Energy Company from 1998 to 2010, COO of DTE Energy Company from 1994 to 2005, and COO of Long Island Lighting Company from 1989 to 1994
2011
Johns, Christopher P. Has been President of Pacific Gas & Electric Company since 2009. Previously served as CFO of Pacific Gas & Electric Company from 2005 to 2007. Before joining PG&E in 1996, he was a Partner of KPMG Peat Marwick LLP.
2010
Chew, Lewis Has been the CFO of Dolby Laboratories since 2012. Previously served as CFO of National Semiconductor Corporation from 2001 to 2011. He has 25 years of experience in finance, accounting, and auditing.
2009
Herringer, Maryellen Cattani
Attorney-at-law of ABM Industries Inc. Previously served as an Executive Vice President of APL Ltd. from 1995 to 1997 and also Senior Vice President from 1991 to 1995. She was also a Partner in the law firm of Morrison & Foerster LLP.
2005
Meserve, Richard A. Has been the President of Carnegie Institution for Science since 2003. Previously served as Chairman of the U.S. Nuclear Regulatory Commission from 1999 to 2003. He has more than 30 years of experience in the legal, scientific, and energy communities.
2006
Miller, Forrest E. Member of the Management Board of the Graduate School of Business at Stanford University. Served as Group President of Corporate Strategy & Development at AT&T from 2007 to 2012. Before merging with AT&T Inc, he was CEO of SBC Southwestern Bell.
2009
Value Creation by Power Sector Companies
38
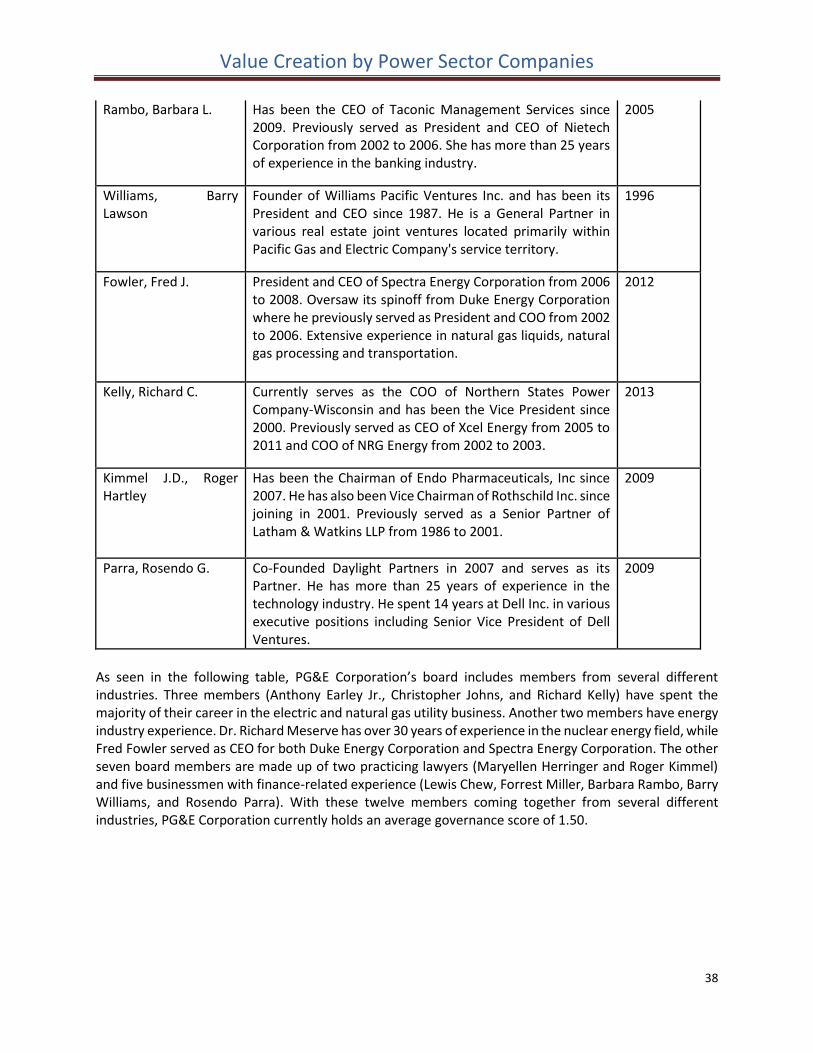
Rambo, Barbara L. Has been the CEO of Taconic Management Services since 2009. Previously served as President and CEO of Nietech Corporation from 2002 to 2006. She has more than 25 years of experience in the banking industry.
2005
Williams, Barry Lawson
Founder of Williams Pacific Ventures Inc. and has been its President and CEO since 1987. He is a General Partner in various real estate joint ventures located primarily within Pacific Gas and Electric Company's service territory.
1996
Fowler, Fred J. President and CEO of Spectra Energy Corporation from 2006 to 2008. Oversaw its spinoff from Duke Energy Corporation where he previously served as President and COO from 2002 to 2006. Extensive experience in natural gas liquids, natural gas processing and transportation.
2012
Kelly, Richard C. Currently serves as the COO of Northern States Power Company-Wisconsin and has been the Vice President since 2000. Previously served as CEO of Xcel Energy from 2005 to 2011 and COO of NRG Energy from 2002 to 2003.
2013
Kimmel J.D., Roger Hartley
Has been the Chairman of Endo Pharmaceuticals, Inc since 2007. He has also been Vice Chairman of Rothschild Inc. since joining in 2001. Previously served as a Senior Partner of Latham & Watkins LLP from 1986 to 2001.
2009
Parra, Rosendo G. Co-Founded Daylight Partners in 2007 and serves as its Partner. He has more than 25 years of experience in the technology industry. He spent 14 years at Dell Inc. in various executive positions including Senior Vice President of Dell Ventures.
2009
As seen in the following table, PG&E Corporation’s board includes members from several different industries. Three members (Anthony Earley Jr., Christopher Johns, and Richard Kelly) have spent the majority of their career in the electric and natural gas utility business. Another two members have energy industry experience. Dr. Richard Meserve has over 30 years of experience in the nuclear energy field, while Fred Fowler served as CEO for both Duke Energy Corporation and Spectra Energy Corporation. The other seven board members are made up of two practicing lawyers (Maryellen Herringer and Roger Kimmel) and five businessmen with finance-related experience (Lewis Chew, Forrest Miller, Barbara Rambo, Barry Williams, and Rosendo Parra). With these twelve members coming together from several different industries, PG&E Corporation currently holds an average governance score of 1.50.
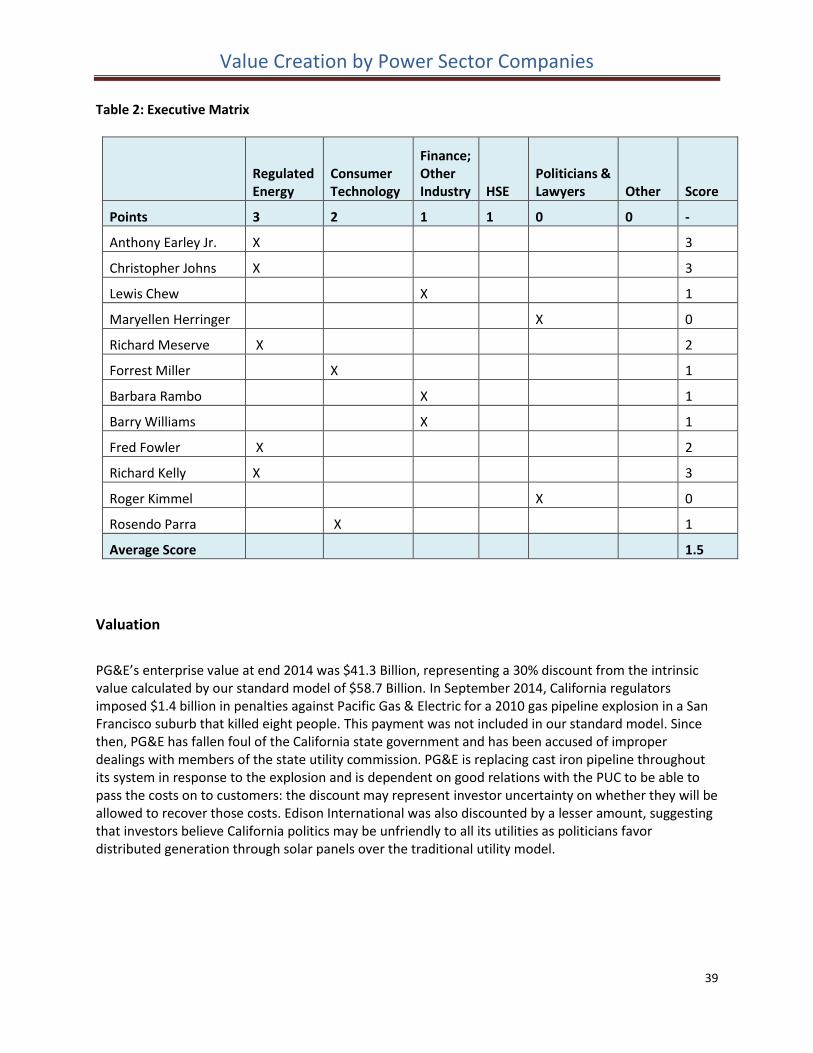
Value Creation by Power Sector Companies
39
Table 2: Executive Matrix
Regulated Energy
Consumer Technology
Finance; Other Industry HSE
Politicians & Lawyers Other Score
Points 3 2 1 1 0 0 -
Anthony Earley Jr. X 3
Christopher Johns X 3
Lewis Chew X 1
Maryellen Herringer X 0
Richard Meserve X 2
Forrest Miller X 1
Barbara Rambo X 1
Barry Williams X 1
Fred Fowler X 2
Richard Kelly X 3
Roger Kimmel X 0
Rosendo Parra X 1
Average Score 1.5
Valuation
PG&E’s enterprise value at end 2014 was $41.3 Billion, representing a 30% discount from the intrinsic value calculated by our standard model of $58.7 Billion. In September 2014, California regulators imposed $1.4 billion in penalties against Pacific Gas & Electric for a 2010 gas pipeline explosion in a San Francisco suburb that killed eight people. This payment was not included in our standard model. Since then, PG&E has fallen foul of the California state government and has been accused of improper dealings with members of the state utility commission. PG&E is replacing cast iron pipeline throughout its system in response to the explosion and is dependent on good relations with the PUC to be able to pass the costs on to customers: the discount may represent investor uncertainty on whether they will be allowed to recover those costs. Edison International was also discounted by a lesser amount, suggesting that investors believe California politics may be unfriendly to all its utilities as politicians favor distributed generation through solar panels over the traditional utility model.

Value Creation by Power Sector Companies
40
3. Entergy Corporation
History Entrepreneur, Harvey Crouch, formed Arkansas Power Company in November 1913. He used sawdust from Arkansas Land and Lumber Company to generate electricity for his power company. Crouch’s goal was to have an integrated electric system to provide reliable power at a low price. The company grew rapidly, and in 1923 he acquired and merged 4 independent electric companies in Mississippi to form Mississippi Power and Light. Crouch wanted to develop an interconnected system between states. In order to provide power to Mississippi, he formed Louisiana Power and Light to take advantage of Louisiana’s abundant supply of Natural Gas. Together, these 3 companies owned the largest power plant south of St. Louis, Missouri. Meanwhile, Sidney Mitchel was working for Electric Bond and Share Company, a subsidiary of General Electric. He acquired and merged several electric utilities in New Orleans and soon he began competing with Couch as their expansions overlapped. In 1925, knowing that they could not continue to compete, the two men joined forces and consolidated their properties. They formed Electric Power and Light Corporation, the system that would become Energy. In 1949, Electric Power and Light Corp. was dissolved due to provisions in the Public Utility Holding Company Act. Middle South Utilities, Inc. formed, in its place, as a holding company for Mississippi Power and Light, Louisiana Power and Light and New Orleans Public Service. In 1989 the company name was changed to Entergy. Entergy acquired Gulf States Utilities in the early 1990s and became one of the largest electric utilities in the nation. Table 1: Corporate Timeline
Timeline of Significant Events in Entergy's History
1913 Arkansas Power Company is incorporated by Harvey Couch.
1914 Couch lights Arkadelphia and Malvern, Arkansas.
1915 Couch acquires additional properties and renames company to Arkansas Light and Power (AP&L).
1922 New Orleans Public Service, Inc. (NOPSI) established as sole provider of utility and transit service in New Orleans
1923 Mississippi Power and Light Company (MP&L) is formed.
1924 Remmel Dam becomes Couch's first hydro project.
1925 All Couch companies are combined with Electric Bond and Share (EBASCO).
1941 Harvey Couch dies.
1949 Middle South Utilities, Inc. (MSU), Entergy's forerunner, is formed from old Couch companies in Louisiana, Arkansas and Mississippi.
1950 NOPSI begins construction of A.B. Patterson station to meet six-fold increase in the city's electricity demand.
1963 Service Company is formed to provide common services to all companies.
1965 Hurricane Betsy destroys southern end of the system; massive rebuilding required.
1968 AP&L customers are doubling electricity usage every eight years.
1970 AP&L implements the nation's first battery-powered bucket truck, replacing bucket arms that worked off the motor of the truck
1972 System Fuels, Inc. is formed to centrally buy all fuel for the system plants.
1974 Arkansas Nuclear One Unit 1 comes on line in Russellville.
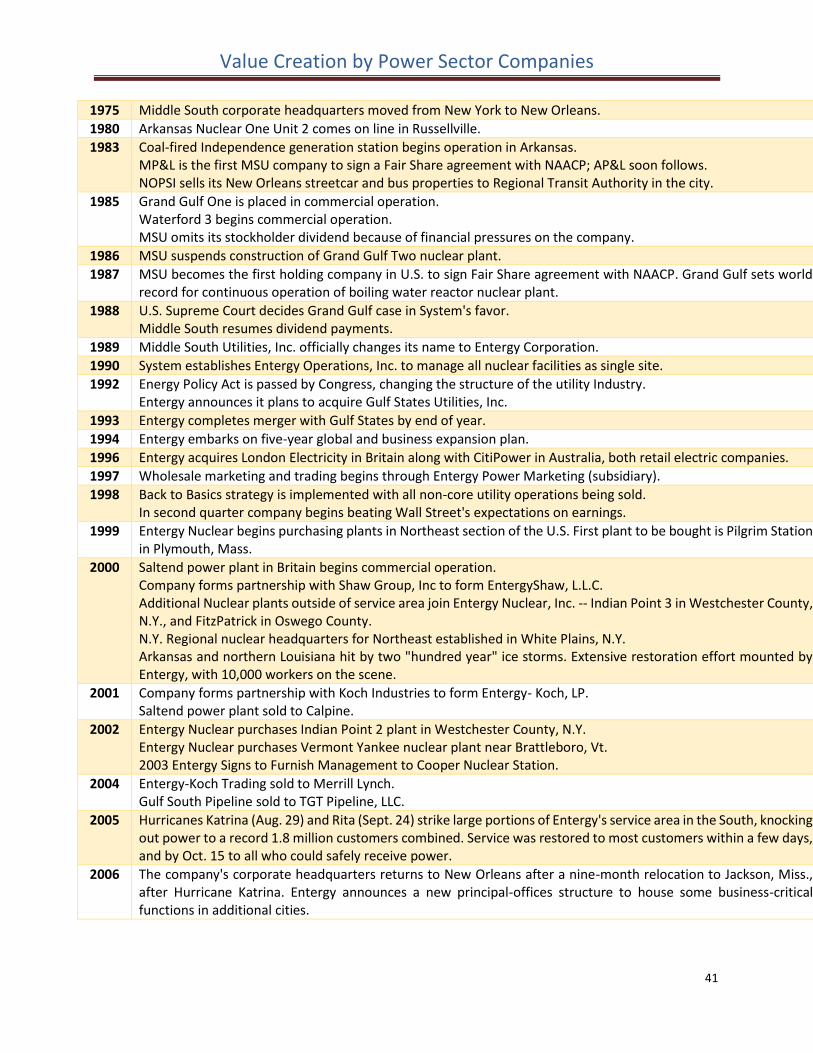
Value Creation by Power Sector Companies
41
1975 Middle South corporate headquarters moved from New York to New Orleans.
1980 Arkansas Nuclear One Unit 2 comes on line in Russellville.
1983 Coal-fired Independence generation station begins operation in Arkansas. MP&L is the first MSU company to sign a Fair Share agreement with NAACP; AP&L soon follows. NOPSI sells its New Orleans streetcar and bus properties to Regional Transit Authority in the city.
1985 Grand Gulf One is placed in commercial operation. Waterford 3 begins commercial operation. MSU omits its stockholder dividend because of financial pressures on the company.
1986 MSU suspends construction of Grand Gulf Two nuclear plant.
1987 MSU becomes the first holding company in U.S. to sign Fair Share agreement with NAACP. Grand Gulf sets world record for continuous operation of boiling water reactor nuclear plant.
1988 U.S. Supreme Court decides Grand Gulf case in System's favor. Middle South resumes dividend payments.
1989 Middle South Utilities, Inc. officially changes its name to Entergy Corporation.
1990 System establishes Entergy Operations, Inc. to manage all nuclear facilities as single site.
1992 Energy Policy Act is passed by Congress, changing the structure of the utility Industry. Entergy announces it plans to acquire Gulf States Utilities, Inc.
1993 Entergy completes merger with Gulf States by end of year.
1994 Entergy embarks on five-year global and business expansion plan.
1996 Entergy acquires London Electricity in Britain along with CitiPower in Australia, both retail electric companies.
1997 Wholesale marketing and trading begins through Entergy Power Marketing (subsidiary).
1998 Back to Basics strategy is implemented with all non-core utility operations being sold. In second quarter company begins beating Wall Street's expectations on earnings.
1999 Entergy Nuclear begins purchasing plants in Northeast section of the U.S. First plant to be bought is Pilgrim Station in Plymouth, Mass.
2000 Saltend power plant in Britain begins commercial operation. Company forms partnership with Shaw Group, Inc to form EntergyShaw, L.L.C. Additional Nuclear plants outside of service area join Entergy Nuclear, Inc. -- Indian Point 3 in Westchester County, N.Y., and FitzPatrick in Oswego County. N.Y. Regional nuclear headquarters for Northeast established in White Plains, N.Y. Arkansas and northern Louisiana hit by two "hundred year" ice storms. Extensive restoration effort mounted by Entergy, with 10,000 workers on the scene.
2001 Company forms partnership with Koch Industries to form Entergy- Koch, LP. Saltend power plant sold to Calpine.
2002 Entergy Nuclear purchases Indian Point 2 plant in Westchester County, N.Y. Entergy Nuclear purchases Vermont Yankee nuclear plant near Brattleboro, Vt. 2003 Entergy Signs to Furnish Management to Cooper Nuclear Station.
2004 Entergy-Koch Trading sold to Merrill Lynch. Gulf South Pipeline sold to TGT Pipeline, LLC.
2005 Hurricanes Katrina (Aug. 29) and Rita (Sept. 24) strike large portions of Entergy's service area in the South, knocking out power to a record 1.8 million customers combined. Service was restored to most customers within a few days, and by Oct. 15 to all who could safely receive power.
2006 The company's corporate headquarters returns to New Orleans after a nine-month relocation to Jackson, Miss., after Hurricane Katrina. Entergy announces a new principal-offices structure to house some business-critical functions in additional cities.
Value Creation by Power Sector Companies
42
The company transferred reliability coordination for its transmission system to the Independent Coordinator of Transmission, after managing responsibility for reliability in the transmission systems of several companies since 1988.
2007 Entergy completes the purchase of the Palisades nuclear plant in Michigan. Entergy Gulf States completes its planned separation into Louisiana and Texas companies. Entergy announced it will purchase the 322MW Calcasieu Generating Facility in southwestern Louisiana, and the 789-megawatt Ouachita Plant near Monroe, La., and repower the existing natural gas generating unit at the Little Gypsy site in Montz, La. The company announced plans to spin off its non-utility nuclear business.
2008 Entergy Gulf States Louisiana, L.L.C. completed the purchase of the Calcasieu Generating Facility. Entergy crews from four states restored power for hundreds of thousands of customers after separate severe weather outbreaks, including tornadoes, in Arkansas, Louisiana and Mississippi during January, February and April.
2009 More than 4,000 workers worked to restore power to customers after a severe January ice storm in Arkansas. Entergy announced plans to acquire Unit 2 of the Acadia Energy Center, a 580-megawatt generating unit located near Eunice, La.
2010 The company identified and stopped a source of tritium leakage at its Vermont Yankee nuclear power plant and began work to support the remediation of soil and groundwater at the site. The company announced it would unwind the business infrastructure associated with a previously announced plan to spin off its non-utility nuclear business. As part of a reorganization the company created Entergy Wholesale Commodities, or EWC, to integrate the assets of Entergy Nuclear and Entergy Asset Management.
2011 The company announced it would seek regulatory approval to join the regional transmission organization Midwest Independent Transmission System Operator. The company asked for approval to build a state-of-the-art natural gas generation unit at its existing Ninemile Point Plant in Louisiana, and completed the acquisition of the Acadia Energy Center unit. Entergy Wholesale Commodities purchased the Rhode Island State Energy Center, an approximately 583-megawatt, natural gas-fired combined-cycle generating plant. Entergy Corporation and ITC Holdings Corp. announced that the Boards of Directors of both companies had approved a definitive agreement under which Entergy will divest and then merge its electric transmission business into ITC.
2012 Entergy acquired the Hot Springs (Arkansas) and Hinds (Mississippi) energy facilities. Hurricane Isaac left more than 787,000 customers without power, making it the fourth-most significant storm in Entergy’s history in terms of outages. The Edison Electric Institute honored Entergy for its work restoring power to its customers after Hurricane Isaac and to customers of other utilities after Hurricane Sandy and the June 2012 derecho weather event. Entergy completed all of the retail regulatory decisions needed for the six operating companies to move forward with their plan to join MISO. MISO assumed the role of Entergy's independent coordinator of transmission.
2013 The company announced it plans to close and begin decommissioning its Vermont Yankee Nuclear Power Station at the end of 2014. Entergy and ITC announced they would discontinue pursuit of a transmission spin/merger. The six Entergy utility operating companies formally began operations in the Midcontinent Independent System Operator, or MISO, after more than two years of planning, design and implementation. Entergy celebrated its 100th anniversary.
2014 Entergy Louisiana and Entergy Gulf States Louisiana asked the Louisiana Public Service Commission for permission to become a single utility. Entergy Louisiana added a new power plant to its fleet, with the December completion of the Ninemile 6 combined-cycle gas turbine unit in Westwego, Louisiana.
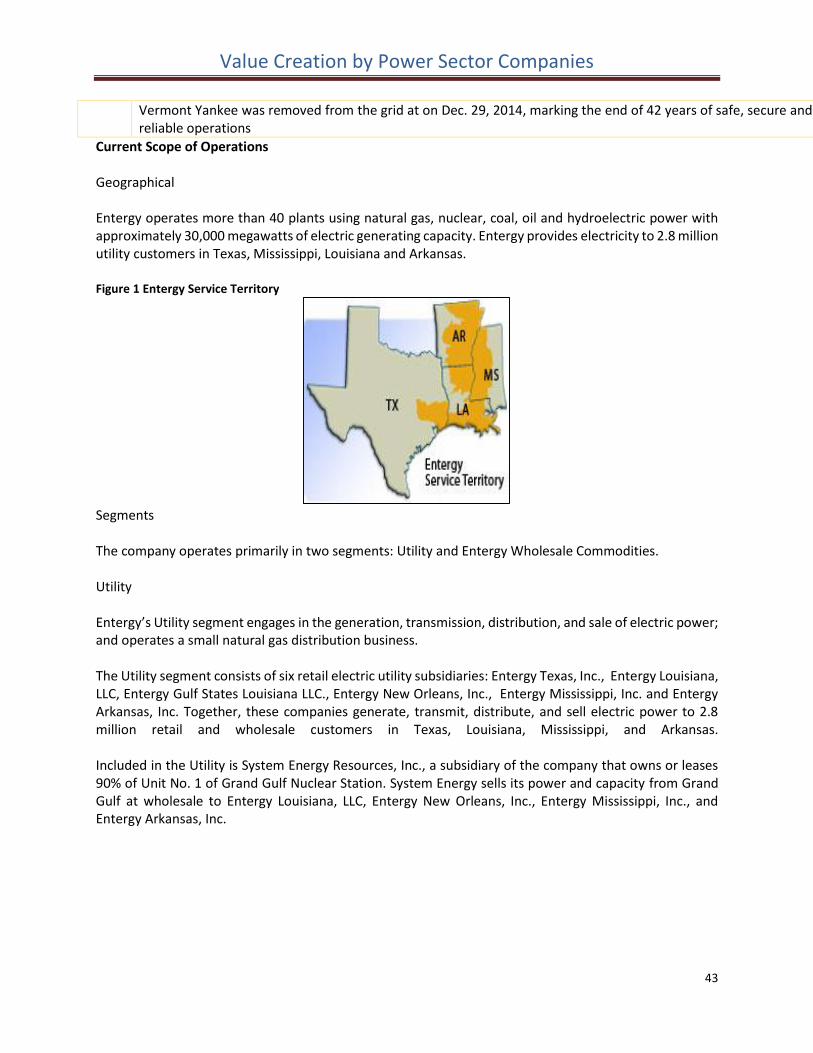
Value Creation by Power Sector Companies
43
Vermont Yankee was removed from the grid at on Dec. 29, 2014, marking the end of 42 years of safe, secure and reliable operations
Current Scope of Operations Geographical Entergy operates more than 40 plants using natural gas, nuclear, coal, oil and hydroelectric power with approximately 30,000 megawatts of electric generating capacity. Entergy provides electricity to 2.8 million utility customers in Texas, Mississippi, Louisiana and Arkansas. Figure 1 Entergy Service Territory
Segments The company operates primarily in two segments: Utility and Entergy Wholesale Commodities. Utility Entergy’s Utility segment engages in the generation, transmission, distribution, and sale of electric power; and operates a small natural gas distribution business. The Utility segment consists of six retail electric utility subsidiaries: Entergy Texas, Inc., Entergy Louisiana, LLC, Entergy Gulf States Louisiana LLC., Entergy New Orleans, Inc., Entergy Mississippi, Inc. and Entergy Arkansas, Inc. Together, these companies generate, transmit, distribute, and sell electric power to 2.8 million retail and wholesale customers in Texas, Louisiana, Mississippi, and Arkansas. Included in the Utility is System Energy Resources, Inc., a subsidiary of the company that owns or leases 90% of Unit No. 1 of Grand Gulf Nuclear Station. System Energy sells its power and capacity from Grand Gulf at wholesale to Entergy Louisiana, LLC, Entergy New Orleans, Inc., Entergy Mississippi, Inc., and Entergy Arkansas, Inc.
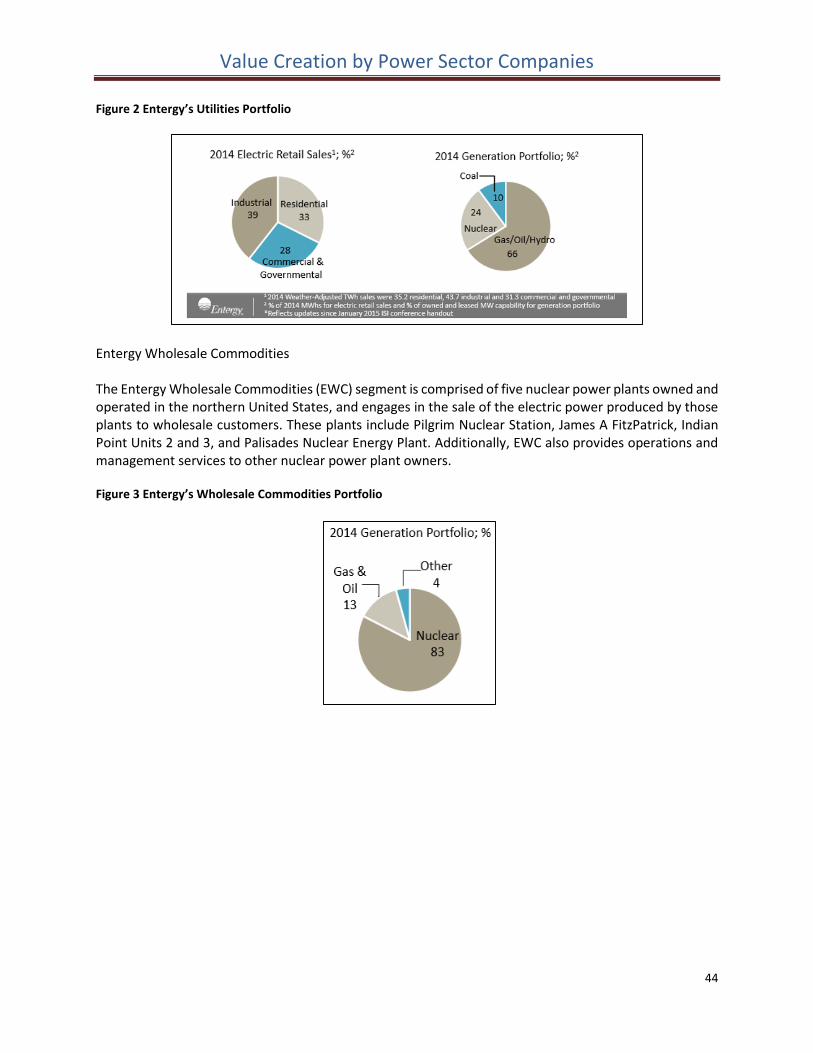
Value Creation by Power Sector Companies
44
Figure 2 Entergy’s Utilities Portfolio
Entergy Wholesale Commodities The Entergy Wholesale Commodities (EWC) segment is comprised of five nuclear power plants owned and operated in the northern United States, and engages in the sale of the electric power produced by those plants to wholesale customers. These plants include Pilgrim Nuclear Station, James A FitzPatrick, Indian Point Units 2 and 3, and Palisades Nuclear Energy Plant. Additionally, EWC also provides operations and management services to other nuclear power plant owners. Figure 3 Entergy’s Wholesale Commodities Portfolio
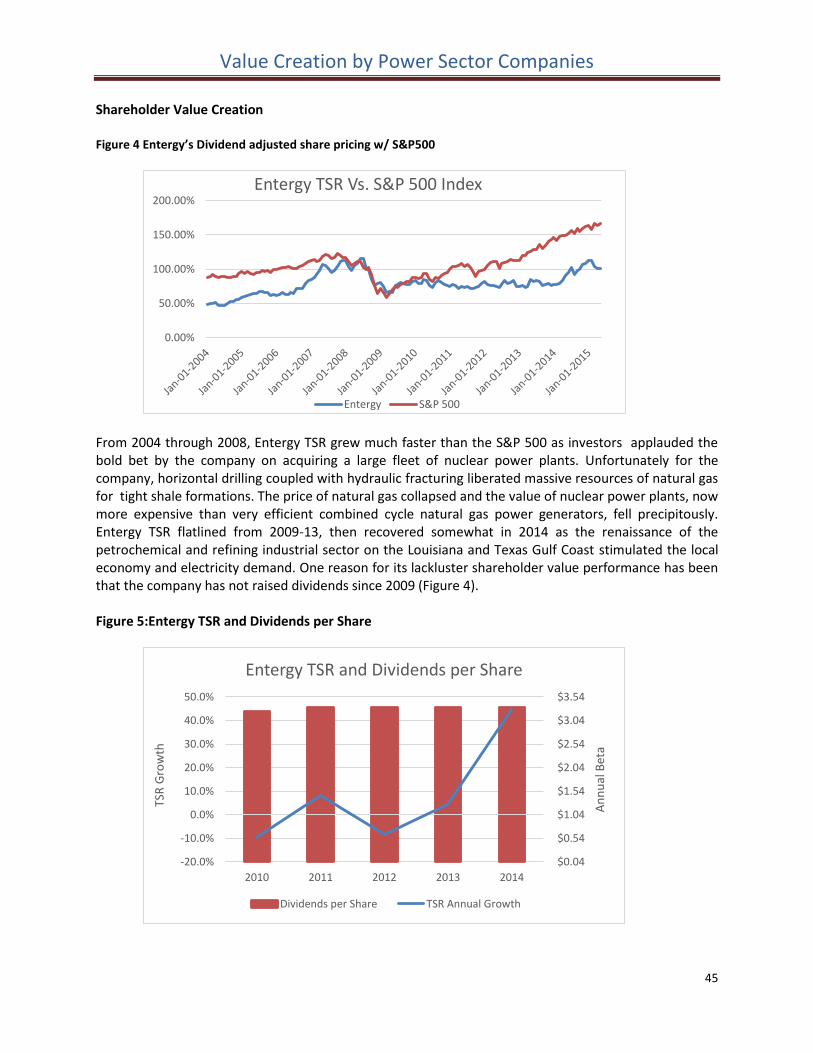
Value Creation by Power Sector Companies
45
Shareholder Value Creation Figure 4 Entergy’s Dividend adjusted share pricing w/ S&P500
From 2004 through 2008, Entergy TSR grew much faster than the S&P 500 as investors applauded the bold bet by the company on acquiring a large fleet of nuclear power plants. Unfortunately for the company, horizontal drilling coupled with hydraulic fracturing liberated massive resources of natural gas for tight shale formations. The price of natural gas collapsed and the value of nuclear power plants, now more expensive than very efficient combined cycle natural gas power generators, fell precipitously. Entergy TSR flatlined from 2009-13, then recovered somewhat in 2014 as the renaissance of the petrochemical and refining industrial sector on the Louisiana and Texas Gulf Coast stimulated the local economy and electricity demand. One reason for its lackluster shareholder value performance has been that the company has not raised dividends since 2009 (Figure 4). Figure 5:Entergy TSR and Dividends per Share
0.00%
50.00%
100.00%
150.00%
200.00%Entergy TSR Vs. S&P 500 Index
Entergy S&P 500
$0.04
$0.54
$1.04
$1.54
$2.04
$2.54
$3.04
$3.54
-20.0%
-10.0%
0.0%
10.0%
20.0%
30.0%
40.0%
50.0%
2010 2011 2012 2013 2014
An
nu
al B
eta
TSR
Gro
wth
Entergy TSR and Dividends per Share
Dividends per Share TSR Annual Growth
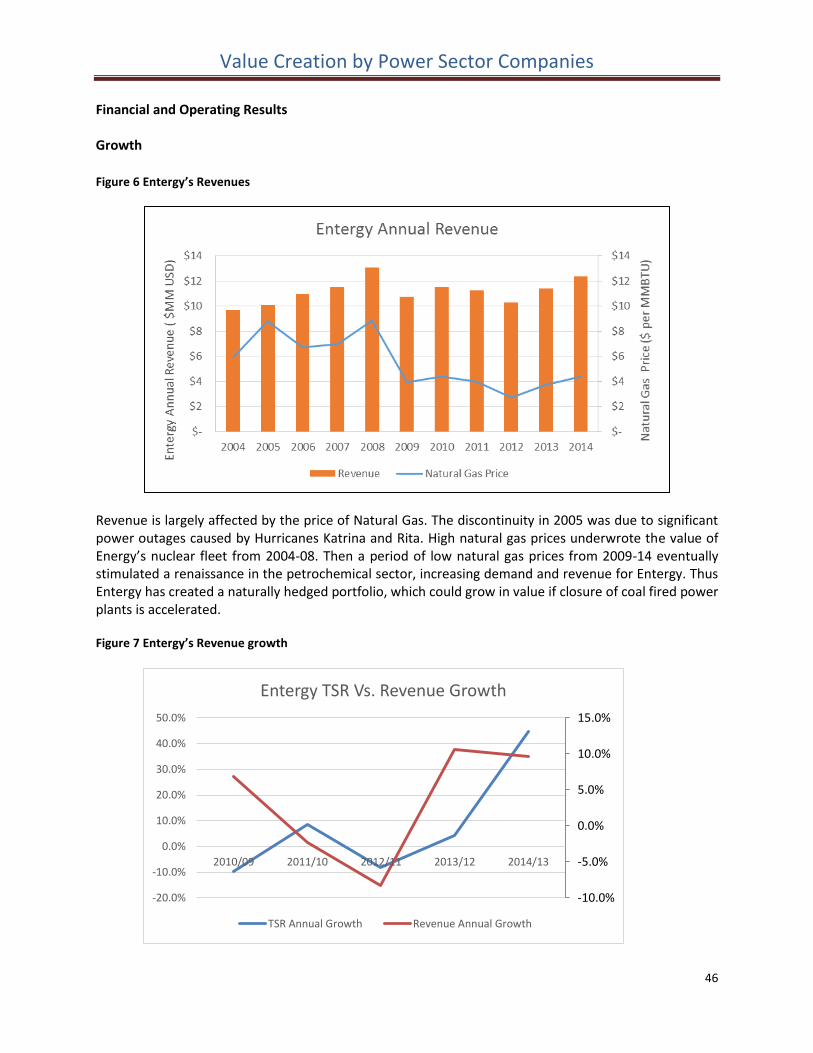
Value Creation by Power Sector Companies
46
Financial and Operating Results Growth Figure 6 Entergy’s Revenues
Revenue is largely affected by the price of Natural Gas. The discontinuity in 2005 was due to significant power outages caused by Hurricanes Katrina and Rita. High natural gas prices underwrote the value of Energy’s nuclear fleet from 2004-08. Then a period of low natural gas prices from 2009-14 eventually stimulated a renaissance in the petrochemical sector, increasing demand and revenue for Entergy. Thus Entergy has created a naturally hedged portfolio, which could grow in value if closure of coal fired power plants is accelerated. Figure 7 Entergy’s Revenue growth
-10.0%
-5.0%
0.0%
5.0%
10.0%
15.0%
-20.0%
-10.0%
0.0%
10.0%
20.0%
30.0%
40.0%
50.0%
2010/09 2011/10 2012/11 2013/12 2014/13
Entergy TSR Vs. Revenue Growth
TSR Annual Growth Revenue Annual Growth
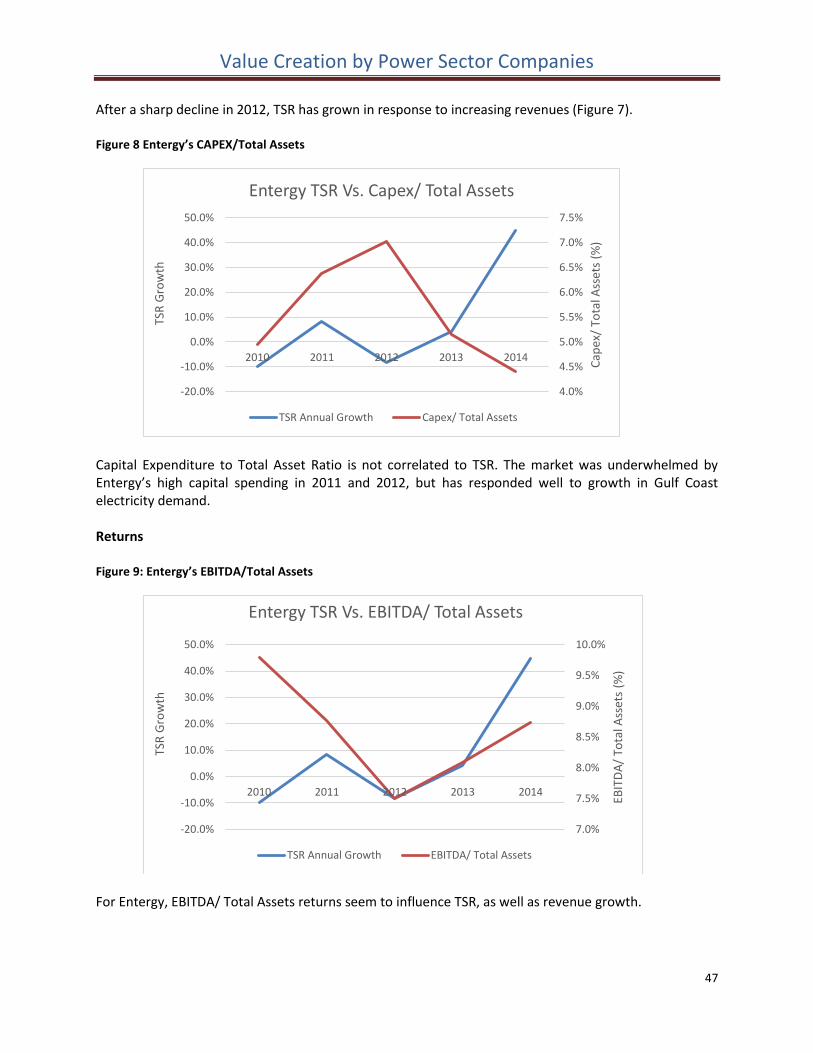
Value Creation by Power Sector Companies
47
After a sharp decline in 2012, TSR has grown in response to increasing revenues (Figure 7). Figure 8 Entergy’s CAPEX/Total Assets
Capital Expenditure to Total Asset Ratio is not correlated to TSR. The market was underwhelmed by Entergy’s high capital spending in 2011 and 2012, but has responded well to growth in Gulf Coast electricity demand. Returns Figure 9: Entergy’s EBITDA/Total Assets
For Entergy, EBITDA/ Total Assets returns seem to influence TSR, as well as revenue growth.
4.0%
4.5%
5.0%
5.5%
6.0%
6.5%
7.0%
7.5%
-20.0%
-10.0%
0.0%
10.0%
20.0%
30.0%
40.0%
50.0%
2010 2011 2012 2013 2014
Cap
ex/
Tota
l Ass
ets
(%)
TSR
Gro
wth
Entergy TSR Vs. Capex/ Total Assets
TSR Annual Growth Capex/ Total Assets
7.0%
7.5%
8.0%
8.5%
9.0%
9.5%
10.0%
-20.0%
-10.0%
0.0%
10.0%
20.0%
30.0%
40.0%
50.0%
2010 2011 2012 2013 2014
EBIT
DA
/ To
tal A
sset
s (%
)
TSR
Gro
wth
Entergy TSR Vs. EBITDA/ Total Assets
TSR Annual Growth EBITDA/ Total Assets
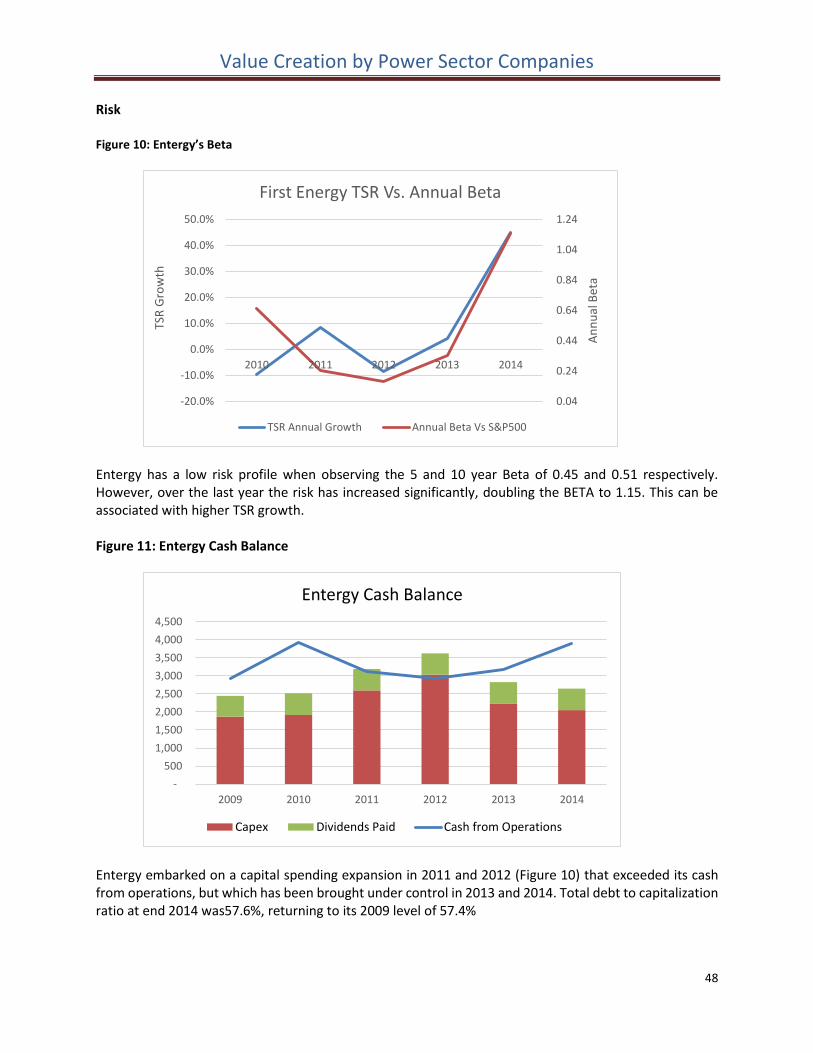
Value Creation by Power Sector Companies
48
Risk Figure 10: Entergy’s Beta
Entergy has a low risk profile when observing the 5 and 10 year Beta of 0.45 and 0.51 respectively. However, over the last year the risk has increased significantly, doubling the BETA to 1.15. This can be associated with higher TSR growth. Figure 11: Entergy Cash Balance
Entergy embarked on a capital spending expansion in 2011 and 2012 (Figure 10) that exceeded its cash from operations, but which has been brought under control in 2013 and 2014. Total debt to capitalization ratio at end 2014 was57.6%, returning to its 2009 level of 57.4%
0.04
0.24
0.44
0.64
0.84
1.04
1.24
-20.0%
-10.0%
0.0%
10.0%
20.0%
30.0%
40.0%
50.0%
2010 2011 2012 2013 2014
An
nu
al B
eta
TSR
Gro
wth
First Energy TSR Vs. Annual Beta
TSR Annual Growth Annual Beta Vs S&P500
-
500
1,000
1,500
2,000
2,500
3,000
3,500
4,000
4,500
2009 2010 2011 2012 2013 2014
Entergy Cash Balance
Capex Dividends Paid Cash from Operations
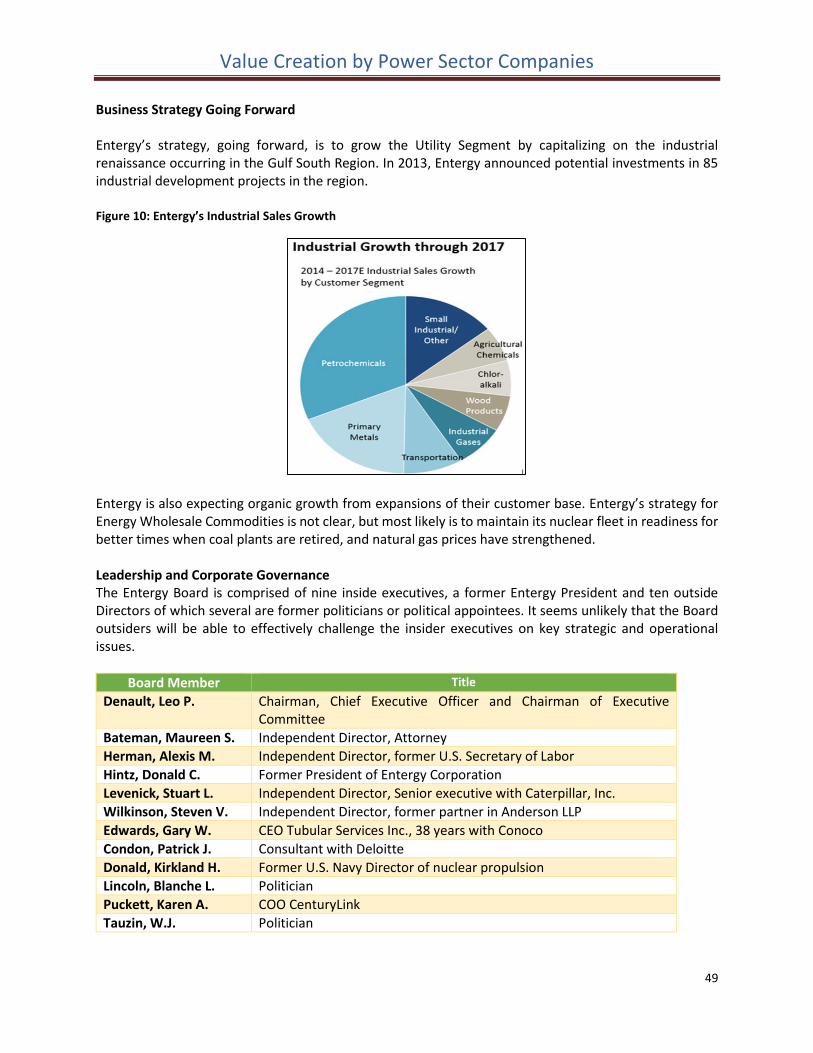
Value Creation by Power Sector Companies
49
Business Strategy Going Forward Entergy’s strategy, going forward, is to grow the Utility Segment by capitalizing on the industrial renaissance occurring in the Gulf South Region. In 2013, Entergy announced potential investments in 85 industrial development projects in the region. Figure 10: Entergy’s Industrial Sales Growth
Entergy is also expecting organic growth from expansions of their customer base. Entergy’s strategy for Energy Wholesale Commodities is not clear, but most likely is to maintain its nuclear fleet in readiness for better times when coal plants are retired, and natural gas prices have strengthened. Leadership and Corporate Governance The Entergy Board is comprised of nine inside executives, a former Entergy President and ten outside Directors of which several are former politicians or political appointees. It seems unlikely that the Board outsiders will be able to effectively challenge the insider executives on key strategic and operational issues.
Board Member Title
Denault, Leo P. Chairman, Chief Executive Officer and Chairman of Executive Committee
Bateman, Maureen S. Independent Director, Attorney
Herman, Alexis M. Independent Director, former U.S. Secretary of Labor
Hintz, Donald C. Former President of Entergy Corporation
Levenick, Stuart L. Independent Director, Senior executive with Caterpillar, Inc.
Wilkinson, Steven V. Independent Director, former partner in Anderson LLP
Edwards, Gary W. CEO Tubular Services Inc., 38 years with Conoco
Condon, Patrick J. Consultant with Deloitte
Donald, Kirkland H. Former U.S. Navy Director of nuclear propulsion
Lincoln, Blanche L. Politician
Puckett, Karen A. COO CenturyLink
Tauzin, W.J. Politician
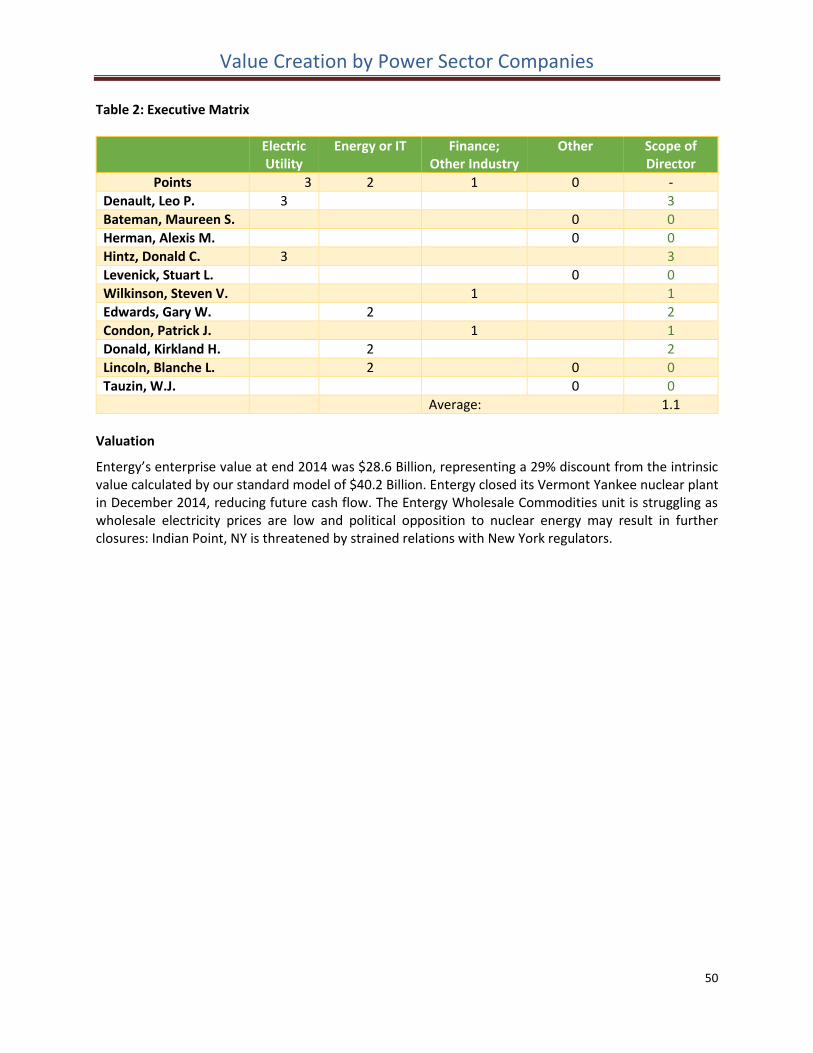
Value Creation by Power Sector Companies
50
Table 2: Executive Matrix
Electric Utility
Energy or IT Finance; Other Industry
Other Scope of Director
Points 3 2 1 0 -
Denault, Leo P. 3 3
Bateman, Maureen S. 0 0
Herman, Alexis M. 0 0
Hintz, Donald C. 3 3
Levenick, Stuart L. 0 0
Wilkinson, Steven V. 1 1
Edwards, Gary W. 2 2
Condon, Patrick J. 1 1
Donald, Kirkland H. 2 2
Lincoln, Blanche L. 2 0 0
Tauzin, W.J. 0 0
Average: 1.1
Valuation
Entergy’s enterprise value at end 2014 was $28.6 Billion, representing a 29% discount from the intrinsic value calculated by our standard model of $40.2 Billion. Entergy closed its Vermont Yankee nuclear plant in December 2014, reducing future cash flow. The Entergy Wholesale Commodities unit is struggling as wholesale electricity prices are low and political opposition to nuclear energy may result in further closures: Indian Point, NY is threatened by strained relations with New York regulators.
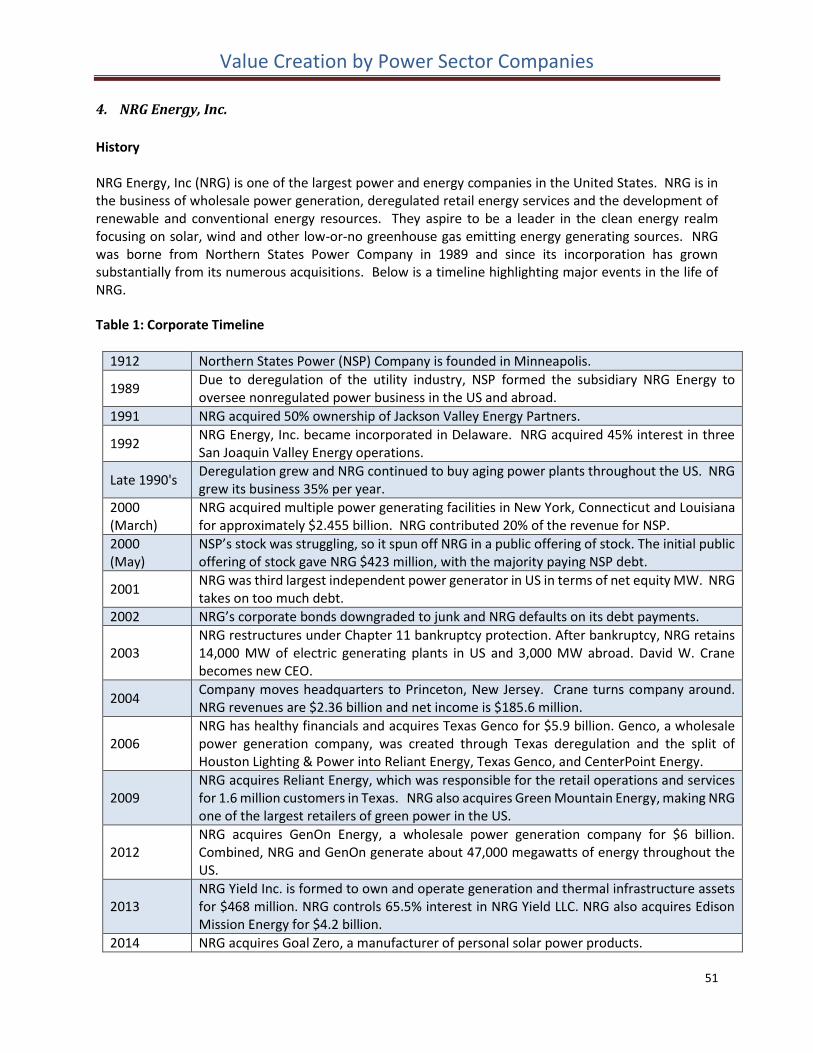
Value Creation by Power Sector Companies
51
4. NRG Energy, Inc.
History NRG Energy, Inc (NRG) is one of the largest power and energy companies in the United States. NRG is in the business of wholesale power generation, deregulated retail energy services and the development of renewable and conventional energy resources. They aspire to be a leader in the clean energy realm focusing on solar, wind and other low-or-no greenhouse gas emitting energy generating sources. NRG was borne from Northern States Power Company in 1989 and since its incorporation has grown substantially from its numerous acquisitions. Below is a timeline highlighting major events in the life of NRG.
Table 1: Corporate Timeline
1912 Northern States Power (NSP) Company is founded in Minneapolis.
1989 Due to deregulation of the utility industry, NSP formed the subsidiary NRG Energy to oversee nonregulated power business in the US and abroad.
1991 NRG acquired 50% ownership of Jackson Valley Energy Partners.
1992 NRG Energy, Inc. became incorporated in Delaware. NRG acquired 45% interest in three San Joaquin Valley Energy operations.
Late 1990's Deregulation grew and NRG continued to buy aging power plants throughout the US. NRG grew its business 35% per year.
2000 (March)
NRG acquired multiple power generating facilities in New York, Connecticut and Louisiana for approximately $2.455 billion. NRG contributed 20% of the revenue for NSP.
2000 (May)
NSP’s stock was struggling, so it spun off NRG in a public offering of stock. The initial public offering of stock gave NRG $423 million, with the majority paying NSP debt.
2001 NRG was third largest independent power generator in US in terms of net equity MW. NRG takes on too much debt.
2002 NRG’s corporate bonds downgraded to junk and NRG defaults on its debt payments.
2003 NRG restructures under Chapter 11 bankruptcy protection. After bankruptcy, NRG retains 14,000 MW of electric generating plants in US and 3,000 MW abroad. David W. Crane becomes new CEO.
2004 Company moves headquarters to Princeton, New Jersey. Crane turns company around. NRG revenues are $2.36 billion and net income is $185.6 million.
2006 NRG has healthy financials and acquires Texas Genco for $5.9 billion. Genco, a wholesale power generation company, was created through Texas deregulation and the split of Houston Lighting & Power into Reliant Energy, Texas Genco, and CenterPoint Energy.
2009 NRG acquires Reliant Energy, which was responsible for the retail operations and services for 1.6 million customers in Texas. NRG also acquires Green Mountain Energy, making NRG one of the largest retailers of green power in the US.
2012 NRG acquires GenOn Energy, a wholesale power generation company for $6 billion. Combined, NRG and GenOn generate about 47,000 megawatts of energy throughout the US.
2013 NRG Yield Inc. is formed to own and operate generation and thermal infrastructure assets for $468 million. NRG controls 65.5% interest in NRG Yield LLC. NRG also acquires Edison Mission Energy for $4.2 billion.
2014 NRG acquires Goal Zero, a manufacturer of personal solar power products.
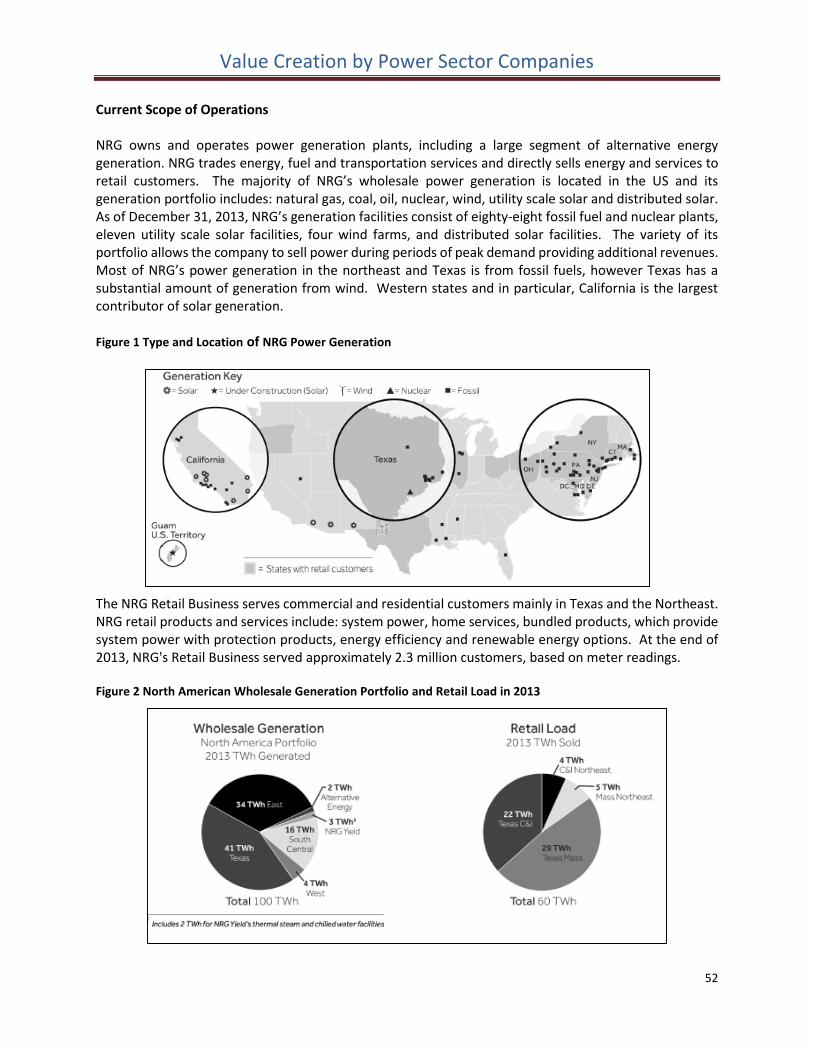
Value Creation by Power Sector Companies
52
Current Scope of Operations NRG owns and operates power generation plants, including a large segment of alternative energy generation. NRG trades energy, fuel and transportation services and directly sells energy and services to retail customers. The majority of NRG’s wholesale power generation is located in the US and its generation portfolio includes: natural gas, coal, oil, nuclear, wind, utility scale solar and distributed solar. As of December 31, 2013, NRG’s generation facilities consist of eighty-eight fossil fuel and nuclear plants, eleven utility scale solar facilities, four wind farms, and distributed solar facilities. The variety of its portfolio allows the company to sell power during periods of peak demand providing additional revenues. Most of NRG’s power generation in the northeast and Texas is from fossil fuels, however Texas has a substantial amount of generation from wind. Western states and in particular, California is the largest contributor of solar generation. Figure 1 Type and Location of NRG Power Generation
The NRG Retail Business serves commercial and residential customers mainly in Texas and the Northeast. NRG retail products and services include: system power, home services, bundled products, which provide system power with protection products, energy efficiency and renewable energy options. At the end of 2013, NRG's Retail Business served approximately 2.3 million customers, based on meter readings. Figure 2 North American Wholesale Generation Portfolio and Retail Load in 2013
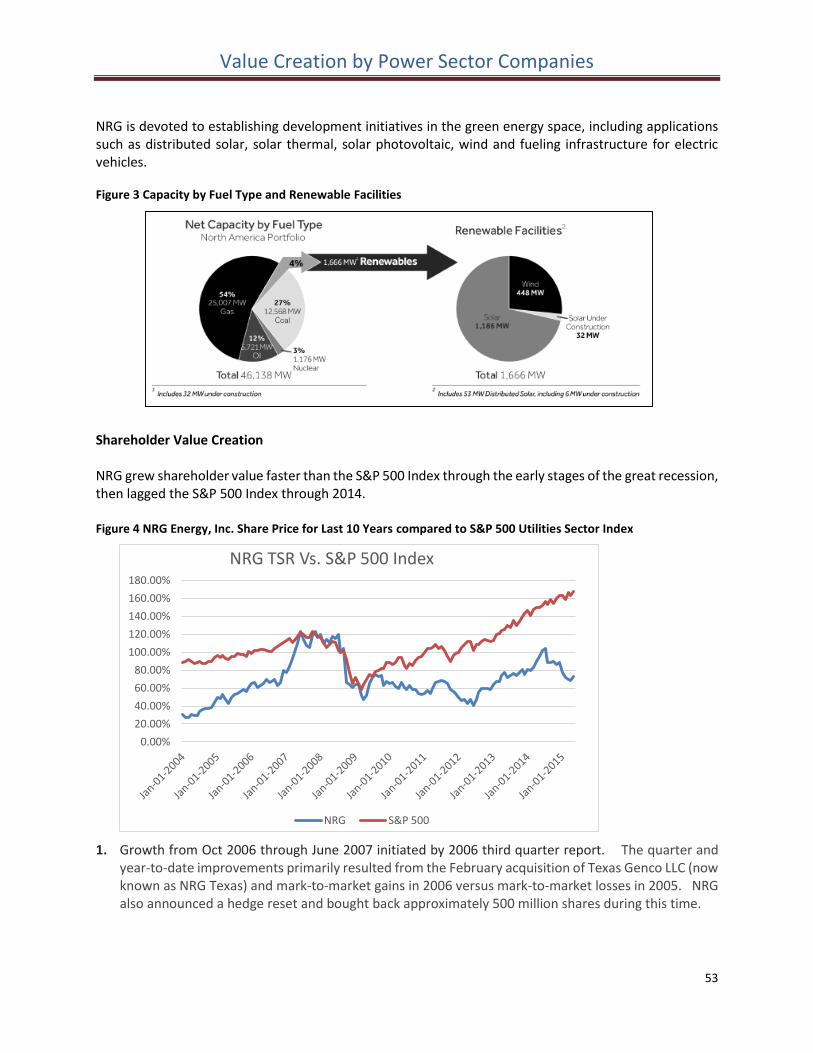
Value Creation by Power Sector Companies
53
NRG is devoted to establishing development initiatives in the green energy space, including applications such as distributed solar, solar thermal, solar photovoltaic, wind and fueling infrastructure for electric vehicles.
Figure 3 Capacity by Fuel Type and Renewable Facilities
Shareholder Value Creation NRG grew shareholder value faster than the S&P 500 Index through the early stages of the great recession, then lagged the S&P 500 Index through 2014. Figure 4 NRG Energy, Inc. Share Price for Last 10 Years compared to S&P 500 Utilities Sector Index
1. Growth from Oct 2006 through June 2007 initiated by 2006 third quarter report. The quarter and year-to-date improvements primarily resulted from the February acquisition of Texas Genco LLC (now known as NRG Texas) and mark-to-market gains in 2006 versus mark-to-market losses in 2005. NRG also announced a hedge reset and bought back approximately 500 million shares during this time.
0.00%
20.00%
40.00%
60.00%
80.00%
100.00%
120.00%
140.00%
160.00%
180.00%
NRG TSR Vs. S&P 500 Index
NRG S&P 500
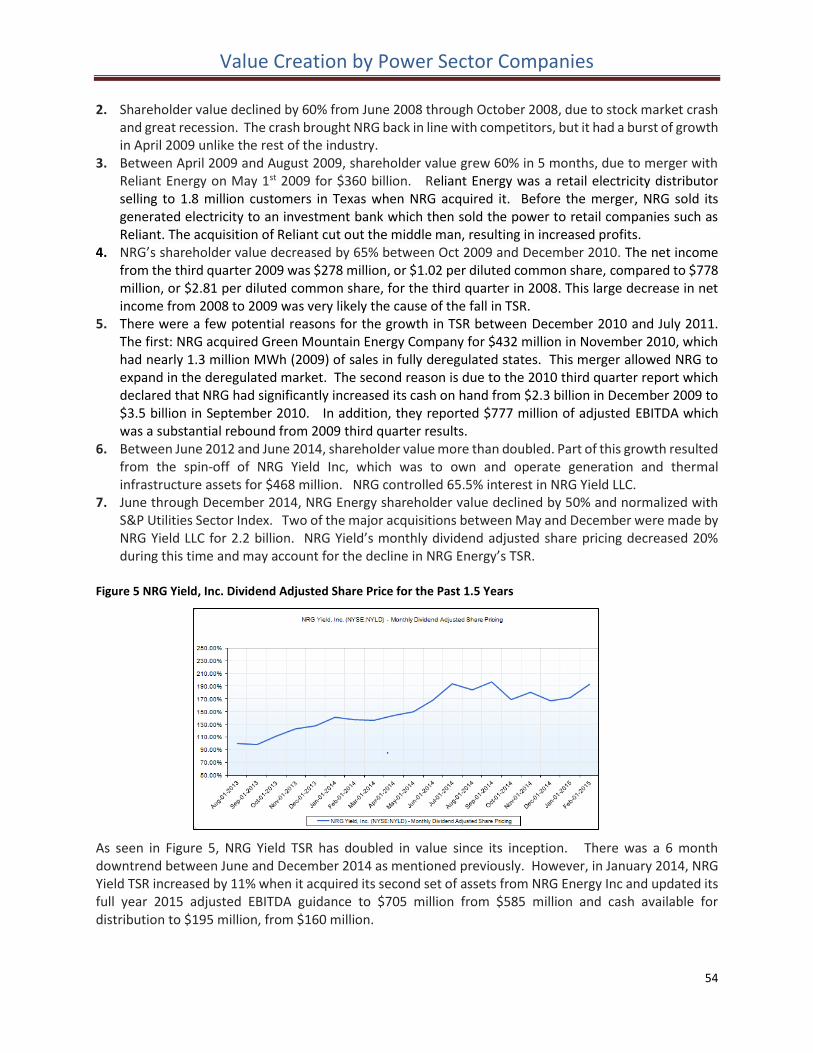
Value Creation by Power Sector Companies
54
2. Shareholder value declined by 60% from June 2008 through October 2008, due to stock market crash and great recession. The crash brought NRG back in line with competitors, but it had a burst of growth in April 2009 unlike the rest of the industry.
3. Between April 2009 and August 2009, shareholder value grew 60% in 5 months, due to merger with Reliant Energy on May 1st 2009 for $360 billion. Reliant Energy was a retail electricity distributor selling to 1.8 million customers in Texas when NRG acquired it. Before the merger, NRG sold its generated electricity to an investment bank which then sold the power to retail companies such as Reliant. The acquisition of Reliant cut out the middle man, resulting in increased profits.
4. NRG’s shareholder value decreased by 65% between Oct 2009 and December 2010. The net income from the third quarter 2009 was $278 million, or $1.02 per diluted common share, compared to $778 million, or $2.81 per diluted common share, for the third quarter in 2008. This large decrease in net income from 2008 to 2009 was very likely the cause of the fall in TSR.
5. There were a few potential reasons for the growth in TSR between December 2010 and July 2011. The first: NRG acquired Green Mountain Energy Company for $432 million in November 2010, which had nearly 1.3 million MWh (2009) of sales in fully deregulated states. This merger allowed NRG to expand in the deregulated market. The second reason is due to the 2010 third quarter report which declared that NRG had significantly increased its cash on hand from $2.3 billion in December 2009 to $3.5 billion in September 2010. In addition, they reported $777 million of adjusted EBITDA which was a substantial rebound from 2009 third quarter results.
6. Between June 2012 and June 2014, shareholder value more than doubled. Part of this growth resulted from the spin-off of NRG Yield Inc, which was to own and operate generation and thermal infrastructure assets for $468 million. NRG controlled 65.5% interest in NRG Yield LLC.
7. June through December 2014, NRG Energy shareholder value declined by 50% and normalized with S&P Utilities Sector Index. Two of the major acquisitions between May and December were made by NRG Yield LLC for 2.2 billion. NRG Yield’s monthly dividend adjusted share pricing decreased 20% during this time and may account for the decline in NRG Energy’s TSR.
Figure 5 NRG Yield, Inc. Dividend Adjusted Share Price for the Past 1.5 Years
As seen in Figure 5, NRG Yield TSR has doubled in value since its inception. There was a 6 month downtrend between June and December 2014 as mentioned previously. However, in January 2014, NRG Yield TSR increased by 11% when it acquired its second set of assets from NRG Energy Inc and updated its full year 2015 adjusted EBITDA guidance to $705 million from $585 million and cash available for distribution to $195 million, from $160 million.
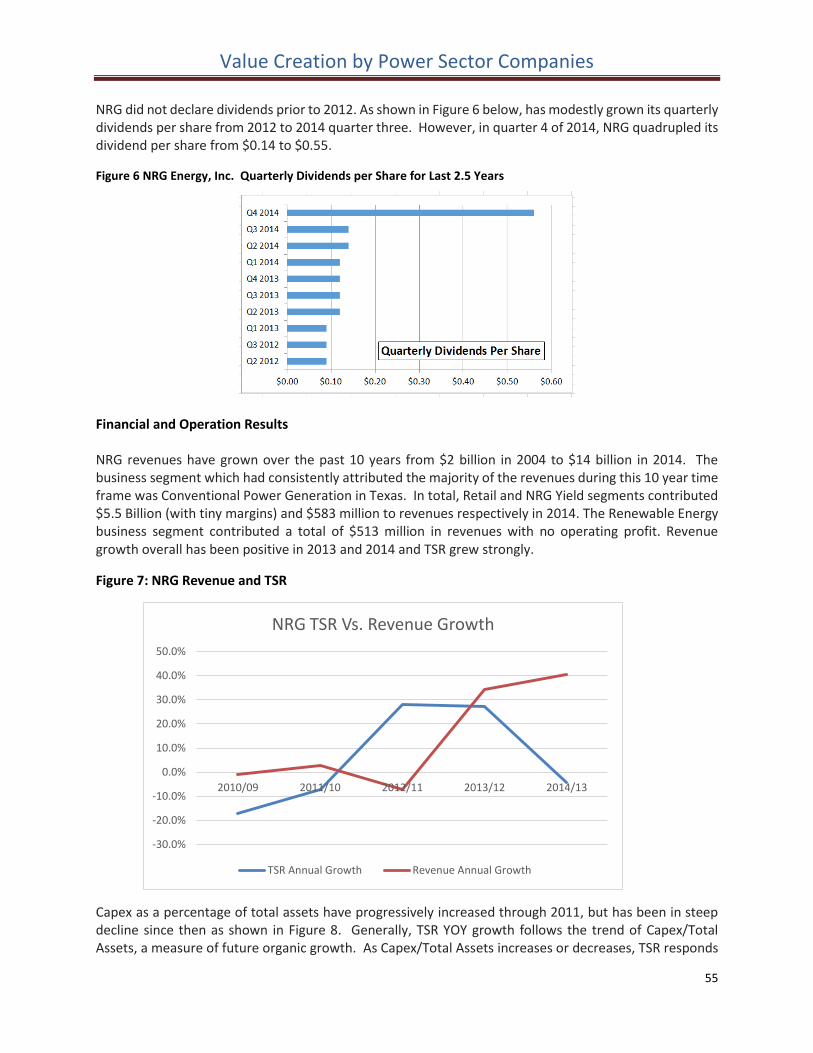
Value Creation by Power Sector Companies
55
NRG did not declare dividends prior to 2012. As shown in Figure 6 below, has modestly grown its quarterly dividends per share from 2012 to 2014 quarter three. However, in quarter 4 of 2014, NRG quadrupled its dividend per share from $0.14 to $0.55.
Figure 6 NRG Energy, Inc. Quarterly Dividends per Share for Last 2.5 Years
Financial and Operation Results NRG revenues have grown over the past 10 years from $2 billion in 2004 to $14 billion in 2014. The business segment which had consistently attributed the majority of the revenues during this 10 year time frame was Conventional Power Generation in Texas. In total, Retail and NRG Yield segments contributed $5.5 Billion (with tiny margins) and $583 million to revenues respectively in 2014. The Renewable Energy business segment contributed a total of $513 million in revenues with no operating profit. Revenue growth overall has been positive in 2013 and 2014 and TSR grew strongly.
Figure 7: NRG Revenue and TSR
Capex as a percentage of total assets have progressively increased through 2011, but has been in steep decline since then as shown in Figure 8. Generally, TSR YOY growth follows the trend of Capex/Total Assets, a measure of future organic growth. As Capex/Total Assets increases or decreases, TSR responds
-30.0%
-20.0%
-10.0%
0.0%
10.0%
20.0%
30.0%
40.0%
50.0%
2010/09 2011/10 2012/11 2013/12 2014/13
NRG TSR Vs. Revenue Growth
TSR Annual Growth Revenue Annual Growth
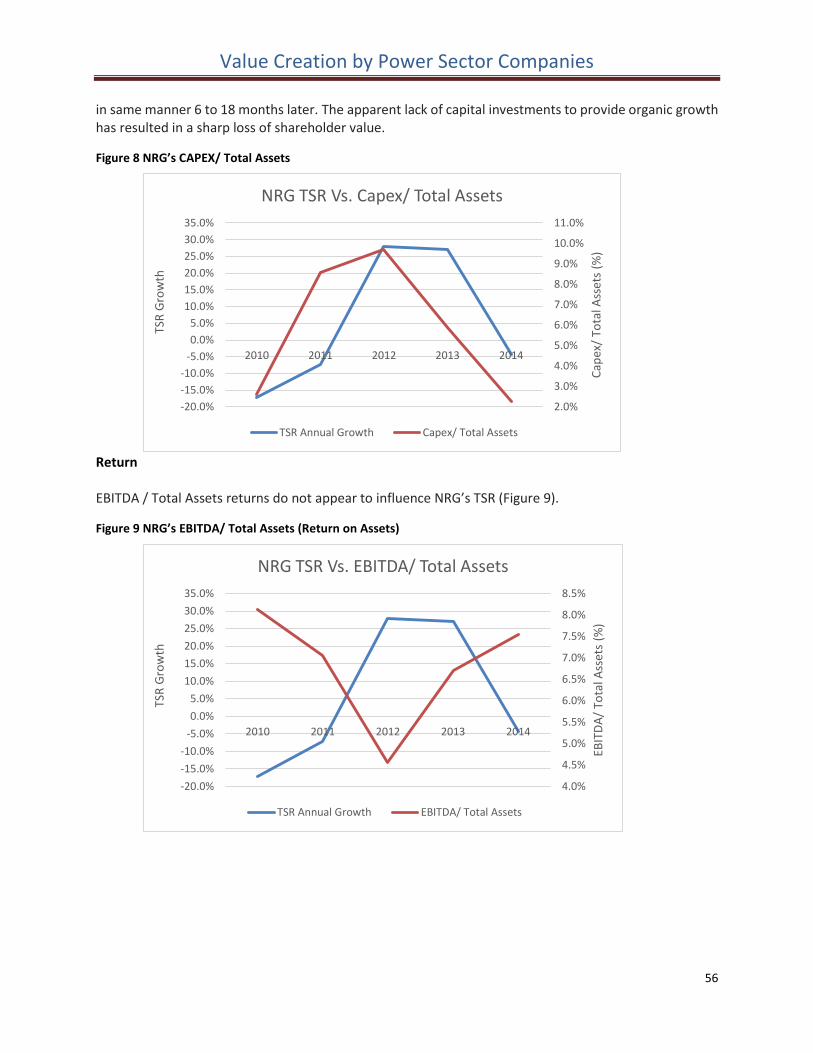
Value Creation by Power Sector Companies
56
in same manner 6 to 18 months later. The apparent lack of capital investments to provide organic growth has resulted in a sharp loss of shareholder value.
Figure 8 NRG’s CAPEX/ Total Assets
Return EBITDA / Total Assets returns do not appear to influence NRG’s TSR (Figure 9).
Figure 9 NRG’s EBITDA/ Total Assets (Return on Assets)
2.0%
3.0%
4.0%
5.0%
6.0%
7.0%
8.0%
9.0%
10.0%
11.0%
-20.0%
-15.0%
-10.0%
-5.0%
0.0%
5.0%
10.0%
15.0%
20.0%
25.0%
30.0%
35.0%
2010 2011 2012 2013 2014
Cap
ex/
Tota
l Ass
ets
(%)
TSR
Gro
wth
NRG TSR Vs. Capex/ Total Assets
TSR Annual Growth Capex/ Total Assets
4.0%
4.5%
5.0%
5.5%
6.0%
6.5%
7.0%
7.5%
8.0%
8.5%
-20.0%
-15.0%
-10.0%
-5.0%
0.0%
5.0%
10.0%
15.0%
20.0%
25.0%
30.0%
35.0%
2010 2011 2012 2013 2014
EBIT
DA
/ To
tal A
sset
s (%
)
TSR
Gro
wth
NRG TSR Vs. EBITDA/ Total Assets
TSR Annual Growth EBITDA/ Total Assets
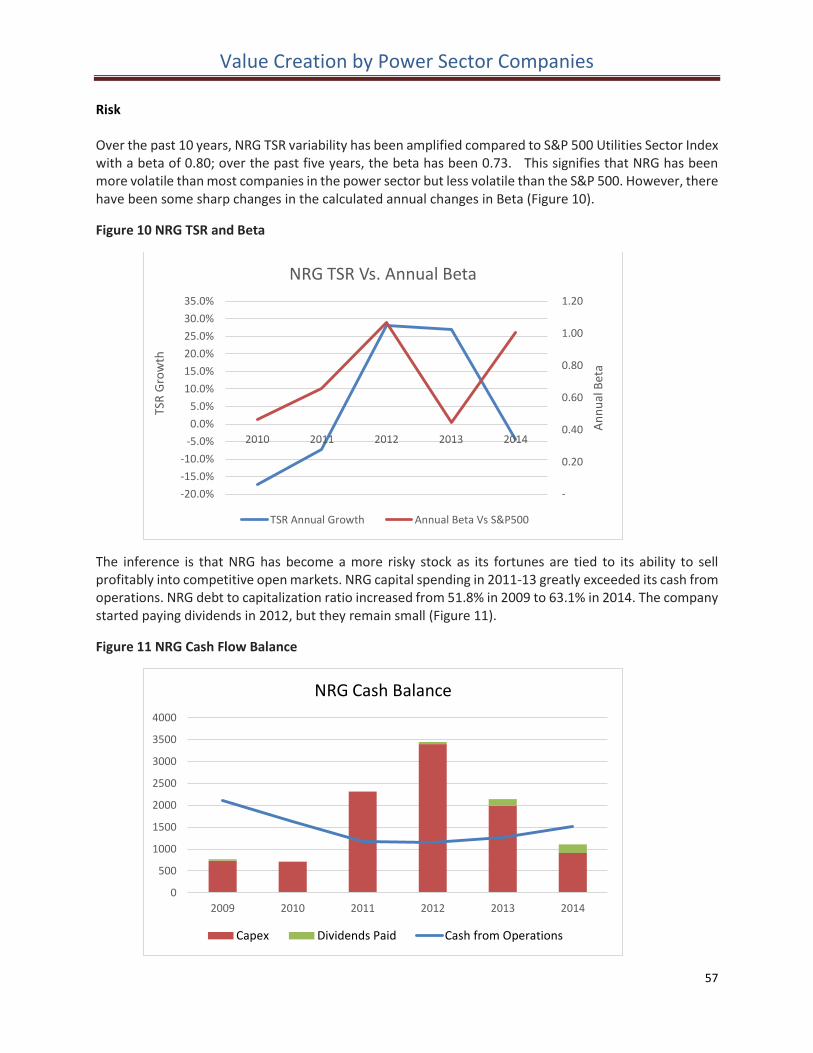
Value Creation by Power Sector Companies
57
Risk Over the past 10 years, NRG TSR variability has been amplified compared to S&P 500 Utilities Sector Index with a beta of 0.80; over the past five years, the beta has been 0.73. This signifies that NRG has been more volatile than most companies in the power sector but less volatile than the S&P 500. However, there have been some sharp changes in the calculated annual changes in Beta (Figure 10).
Figure 10 NRG TSR and Beta
The inference is that NRG has become a more risky stock as its fortunes are tied to its ability to sell profitably into competitive open markets. NRG capital spending in 2011-13 greatly exceeded its cash from operations. NRG debt to capitalization ratio increased from 51.8% in 2009 to 63.1% in 2014. The company started paying dividends in 2012, but they remain small (Figure 11).
Figure 11 NRG Cash Flow Balance
-
0.20
0.40
0.60
0.80
1.00
1.20
-20.0%
-15.0%
-10.0%
-5.0%
0.0%
5.0%
10.0%
15.0%
20.0%
25.0%
30.0%
35.0%
2010 2011 2012 2013 2014
An
nu
al B
eta
TSR
Gro
wth
NRG TSR Vs. Annual Beta
TSR Annual Growth Annual Beta Vs S&P500
0
500
1000
1500
2000
2500
3000
3500
4000
2009 2010 2011 2012 2013 2014
NRG Cash Balance
Capex Dividends Paid Cash from Operations
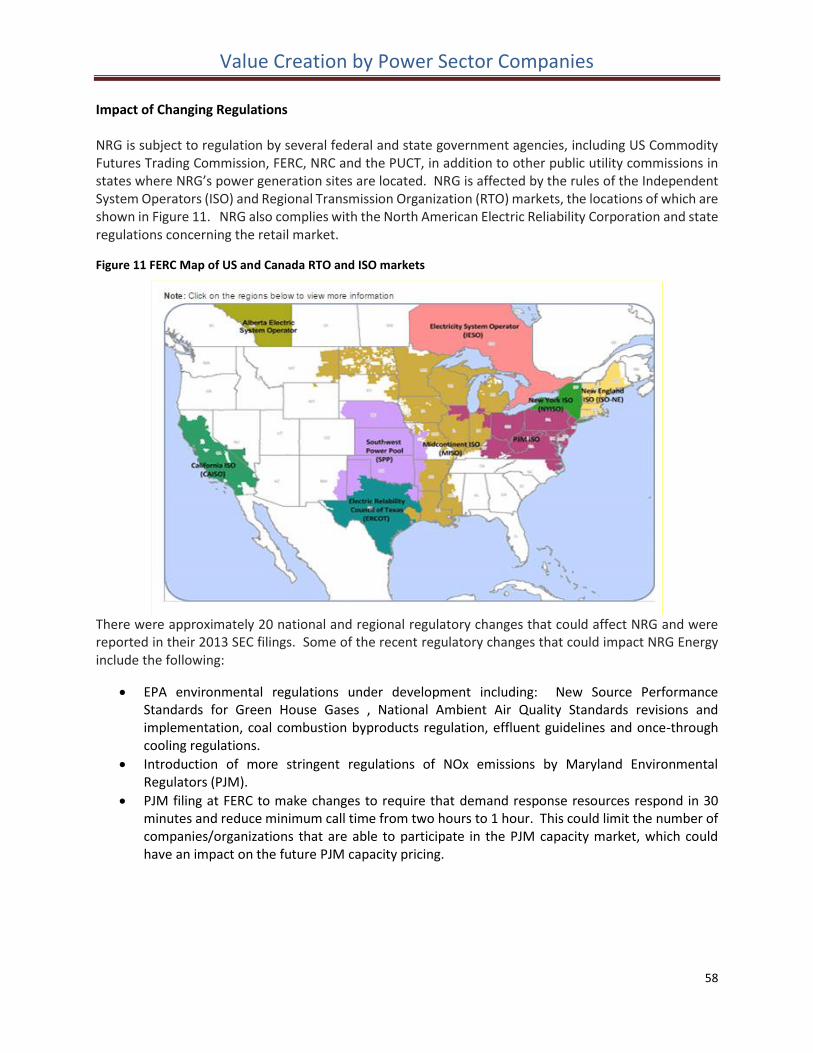
Value Creation by Power Sector Companies
58
Impact of Changing Regulations NRG is subject to regulation by several federal and state government agencies, including US Commodity Futures Trading Commission, FERC, NRC and the PUCT, in addition to other public utility commissions in states where NRG’s power generation sites are located. NRG is affected by the rules of the Independent System Operators (ISO) and Regional Transmission Organization (RTO) markets, the locations of which are shown in Figure 11. NRG also complies with the North American Electric Reliability Corporation and state regulations concerning the retail market.
Figure 11 FERC Map of US and Canada RTO and ISO markets
There were approximately 20 national and regional regulatory changes that could affect NRG and were reported in their 2013 SEC filings. Some of the recent regulatory changes that could impact NRG Energy include the following:
EPA environmental regulations under development including: New Source Performance Standards for Green House Gases , National Ambient Air Quality Standards revisions and implementation, coal combustion byproducts regulation, effluent guidelines and once-through cooling regulations.
Introduction of more stringent regulations of NOx emissions by Maryland Environmental Regulators (PJM).
PJM filing at FERC to make changes to require that demand response resources respond in 30 minutes and reduce minimum call time from two hours to 1 hour. This could limit the number of companies/organizations that are able to participate in the PJM capacity market, which could have an impact on the future PJM capacity pricing.
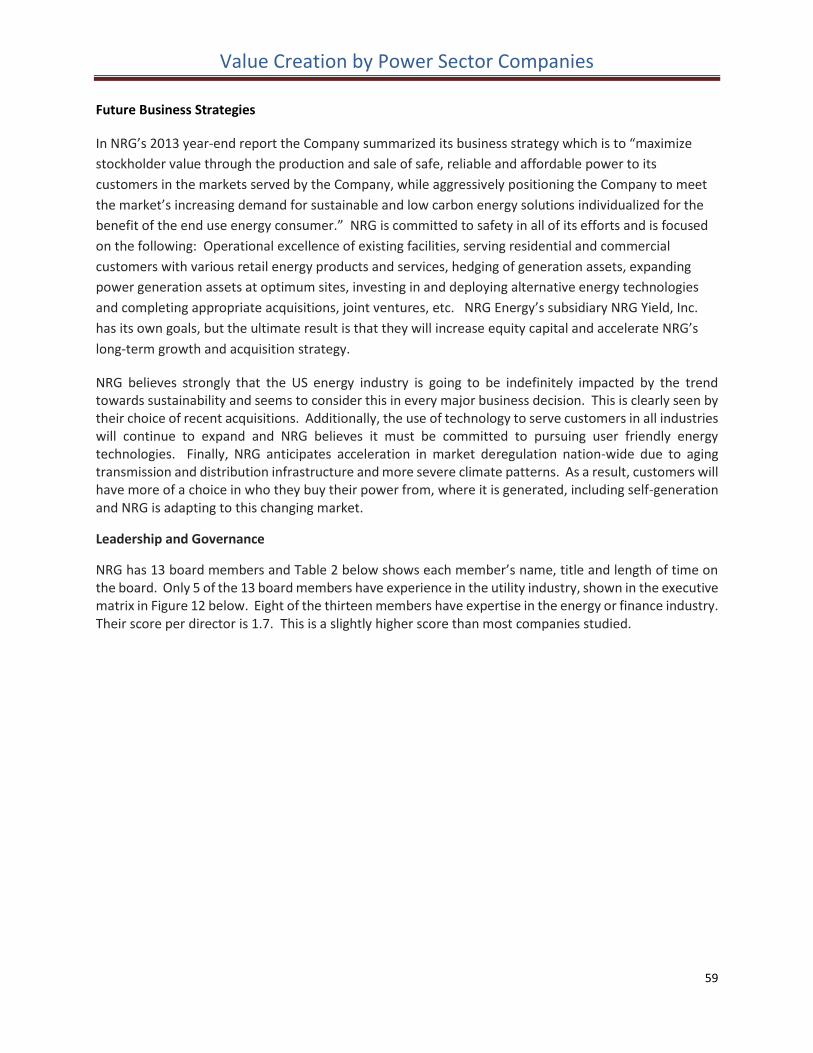
Value Creation by Power Sector Companies
59
Future Business Strategies
In NRG’s 2013 year-end report the Company summarized its business strategy which is to “maximize
stockholder value through the production and sale of safe, reliable and affordable power to its
customers in the markets served by the Company, while aggressively positioning the Company to meet
the market’s increasing demand for sustainable and low carbon energy solutions individualized for the
benefit of the end use energy consumer.” NRG is committed to safety in all of its efforts and is focused
on the following: Operational excellence of existing facilities, serving residential and commercial
customers with various retail energy products and services, hedging of generation assets, expanding
power generation assets at optimum sites, investing in and deploying alternative energy technologies
and completing appropriate acquisitions, joint ventures, etc. NRG Energy’s subsidiary NRG Yield, Inc.
has its own goals, but the ultimate result is that they will increase equity capital and accelerate NRG’s
long-term growth and acquisition strategy.
NRG believes strongly that the US energy industry is going to be indefinitely impacted by the trend towards sustainability and seems to consider this in every major business decision. This is clearly seen by their choice of recent acquisitions. Additionally, the use of technology to serve customers in all industries will continue to expand and NRG believes it must be committed to pursuing user friendly energy technologies. Finally, NRG anticipates acceleration in market deregulation nation-wide due to aging transmission and distribution infrastructure and more severe climate patterns. As a result, customers will have more of a choice in who they buy their power from, where it is generated, including self-generation and NRG is adapting to this changing market.
Leadership and Governance
NRG has 13 board members and Table 2 below shows each member’s name, title and length of time on the board. Only 5 of the 13 board members have experience in the utility industry, shown in the executive matrix in Figure 12 below. Eight of the thirteen members have expertise in the energy or finance industry. Their score per director is 1.7. This is a slightly higher score than most companies studied.
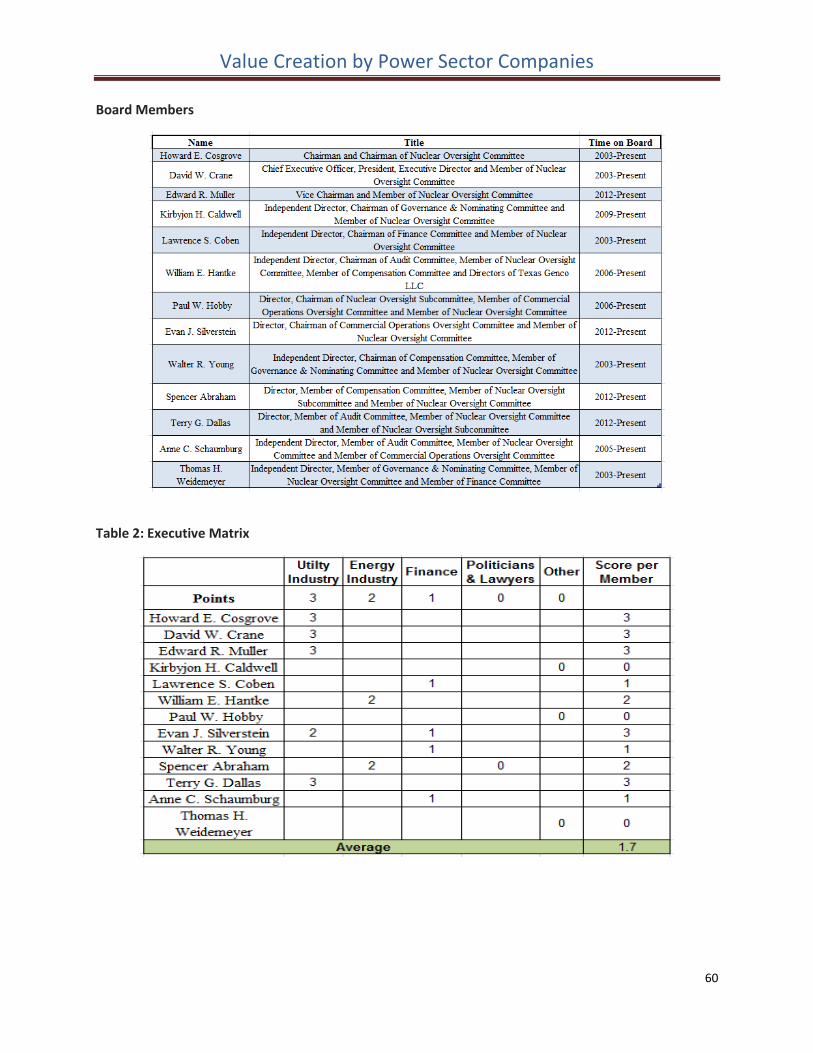
Value Creation by Power Sector Companies
60
Board Members
Table 2: Executive Matrix
Value Creation by Power Sector Companies
61
Valuation
At the end of 2014, NRG had an Enterprise Value of $31.5 Billion, compared to an Intrinsic Value
calculated by our standard model of $21.2 Billion for a market premium of 48%. NRG grew revenues and cash from operations rapidly in 2013 and 2014 with a sequence of acquisitions in retail power, wind farms and solar energy. The company dropped down the contracted renewable assets into NRG Yield, a tax advantaged entity that has many of the features of a master limited partnership. At the end of 2014, investors clearly believed NRG could continue a higher growth rate than the 2% pa assumed in our standard model.
However, revenue growth have come from acquisitions rather than organic investments and segment results show that almost all NRG’s profits came from selling its generated power into competitive markets. Its investments in retail power, renewables, distributed solar have not yet delivered significant earnings.
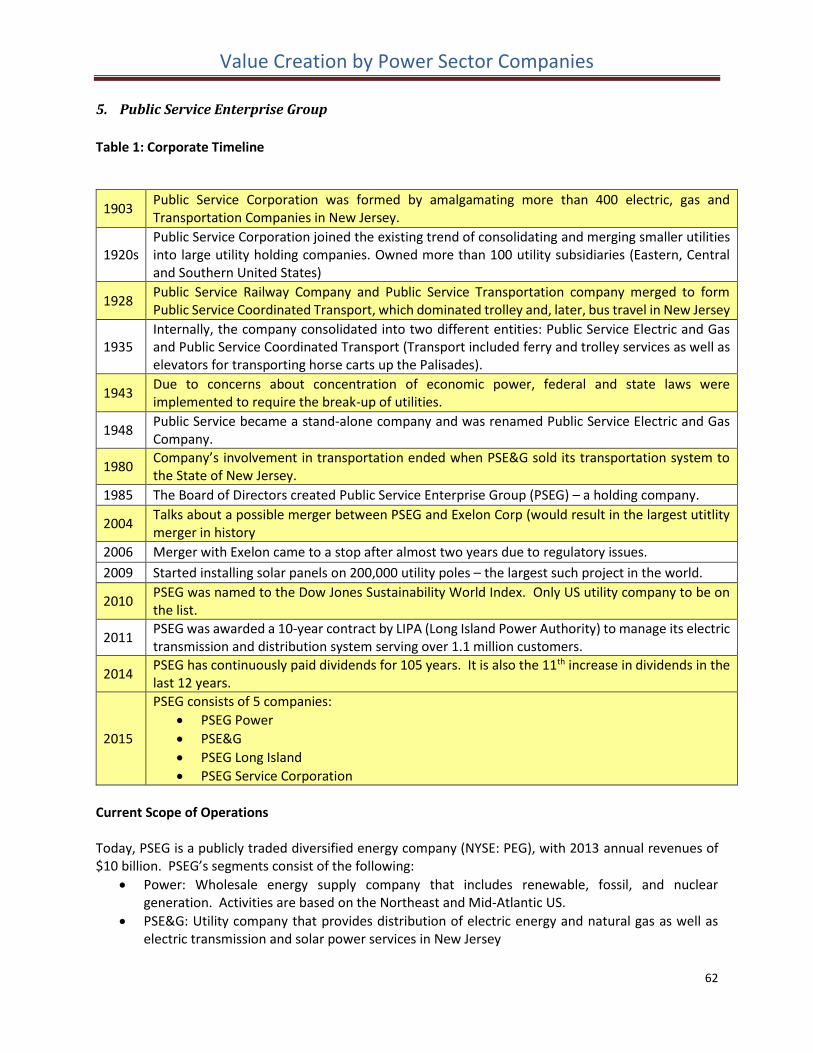
Value Creation by Power Sector Companies
62
5. Public Service Enterprise Group
Table 1: Corporate Timeline
Current Scope of Operations Today, PSEG is a publicly traded diversified energy company (NYSE: PEG), with 2013 annual revenues of $10 billion. PSEG’s segments consist of the following:
Power: Wholesale energy supply company that includes renewable, fossil, and nuclear generation. Activities are based on the Northeast and Mid-Atlantic US.
PSE&G: Utility company that provides distribution of electric energy and natural gas as well as electric transmission and solar power services in New Jersey
1903 Public Service Corporation was formed by amalgamating more than 400 electric, gas and Transportation Companies in New Jersey.
1920s Public Service Corporation joined the existing trend of consolidating and merging smaller utilities into large utility holding companies. Owned more than 100 utility subsidiaries (Eastern, Central and Southern United States)
1928 Public Service Railway Company and Public Service Transportation company merged to form Public Service Coordinated Transport, which dominated trolley and, later, bus travel in New Jersey
1935 Internally, the company consolidated into two different entities: Public Service Electric and Gas and Public Service Coordinated Transport (Transport included ferry and trolley services as well as elevators for transporting horse carts up the Palisades).
1943 Due to concerns about concentration of economic power, federal and state laws were implemented to require the break-up of utilities.
1948 Public Service became a stand-alone company and was renamed Public Service Electric and Gas Company.
1980 Company’s involvement in transportation ended when PSE&G sold its transportation system to the State of New Jersey.
1985 The Board of Directors created Public Service Enterprise Group (PSEG) – a holding company.
2004 Talks about a possible merger between PSEG and Exelon Corp (would result in the largest utitlity merger in history
2006 Merger with Exelon came to a stop after almost two years due to regulatory issues.
2009 Started installing solar panels on 200,000 utility poles – the largest such project in the world.
2010 PSEG was named to the Dow Jones Sustainability World Index. Only US utility company to be on the list.
2011 PSEG was awarded a 10-year contract by LIPA (Long Island Power Authority) to manage its electric transmission and distribution system serving over 1.1 million customers.
2014 PSEG has continuously paid dividends for 105 years. It is also the 11th increase in dividends in the last 12 years.
2015
PSEG consists of 5 companies:
PSEG Power
PSE&G
PSEG Long Island
PSEG Service Corporation
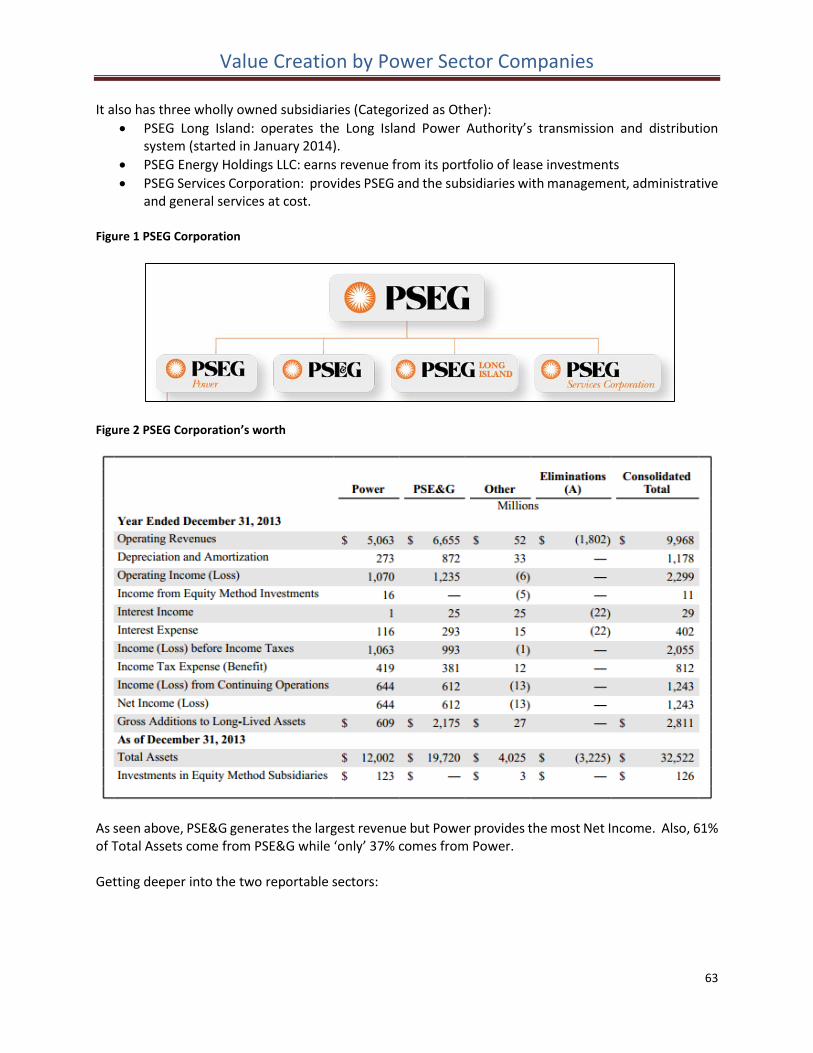
Value Creation by Power Sector Companies
63
It also has three wholly owned subsidiaries (Categorized as Other):
PSEG Long Island: operates the Long Island Power Authority’s transmission and distribution system (started in January 2014).
PSEG Energy Holdings LLC: earns revenue from its portfolio of lease investments
PSEG Services Corporation: provides PSEG and the subsidiaries with management, administrative and general services at cost.
Figure 1 PSEG Corporation
Figure 2 PSEG Corporation’s worth
As seen above, PSE&G generates the largest revenue but Power provides the most Net Income. Also, 61% of Total Assets come from PSE&G while ‘only’ 37% comes from Power. Getting deeper into the two reportable sectors:
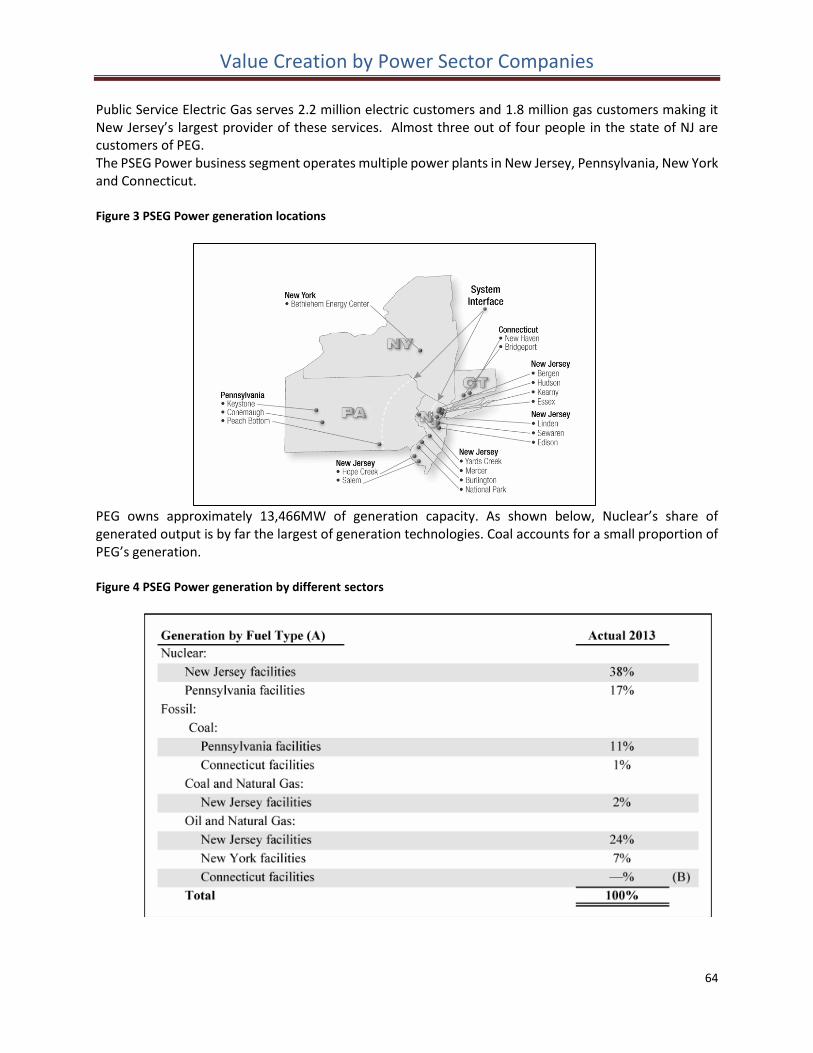
Value Creation by Power Sector Companies
64
Public Service Electric Gas serves 2.2 million electric customers and 1.8 million gas customers making it New Jersey’s largest provider of these services. Almost three out of four people in the state of NJ are customers of PEG. The PSEG Power business segment operates multiple power plants in New Jersey, Pennsylvania, New York and Connecticut. Figure 3 PSEG Power generation locations
PEG owns approximately 13,466MW of generation capacity. As shown below, Nuclear’s share of generated output is by far the largest of generation technologies. Coal accounts for a small proportion of PEG’s generation. Figure 4 PSEG Power generation by different sectors
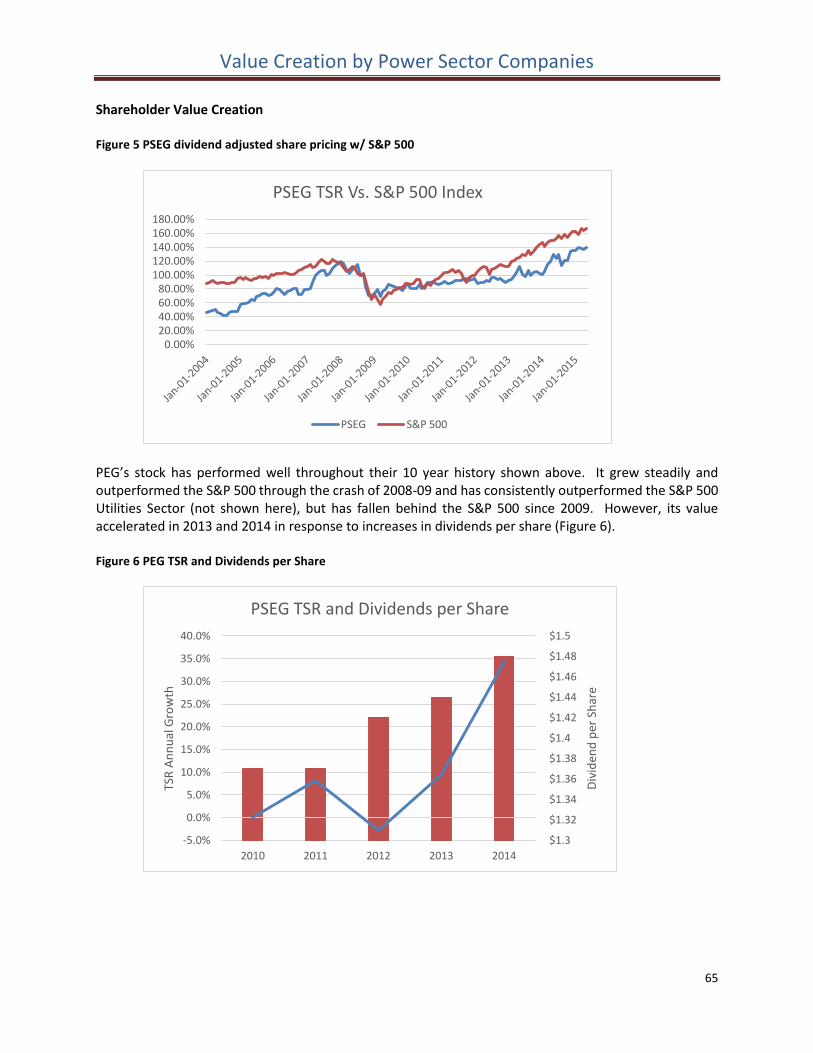
Value Creation by Power Sector Companies
65
Shareholder Value Creation Figure 5 PSEG dividend adjusted share pricing w/ S&P 500
PEG’s stock has performed well throughout their 10 year history shown above. It grew steadily and outperformed the S&P 500 through the crash of 2008-09 and has consistently outperformed the S&P 500 Utilities Sector (not shown here), but has fallen behind the S&P 500 since 2009. However, its value accelerated in 2013 and 2014 in response to increases in dividends per share (Figure 6). Figure 6 PEG TSR and Dividends per Share
0.00%20.00%40.00%60.00%80.00%
100.00%120.00%140.00%160.00%180.00%
PSEG TSR Vs. S&P 500 Index
PSEG S&P 500
$1.3
$1.32
$1.34
$1.36
$1.38
$1.4
$1.42
$1.44
$1.46
$1.48
$1.5
-5.0%
0.0%
5.0%
10.0%
15.0%
20.0%
25.0%
30.0%
35.0%
40.0%
2010 2011 2012 2013 2014
Div
iden
d p
er S
har
e
TSR
An
nu
al G
row
th
PSEG TSR and Dividends per Share
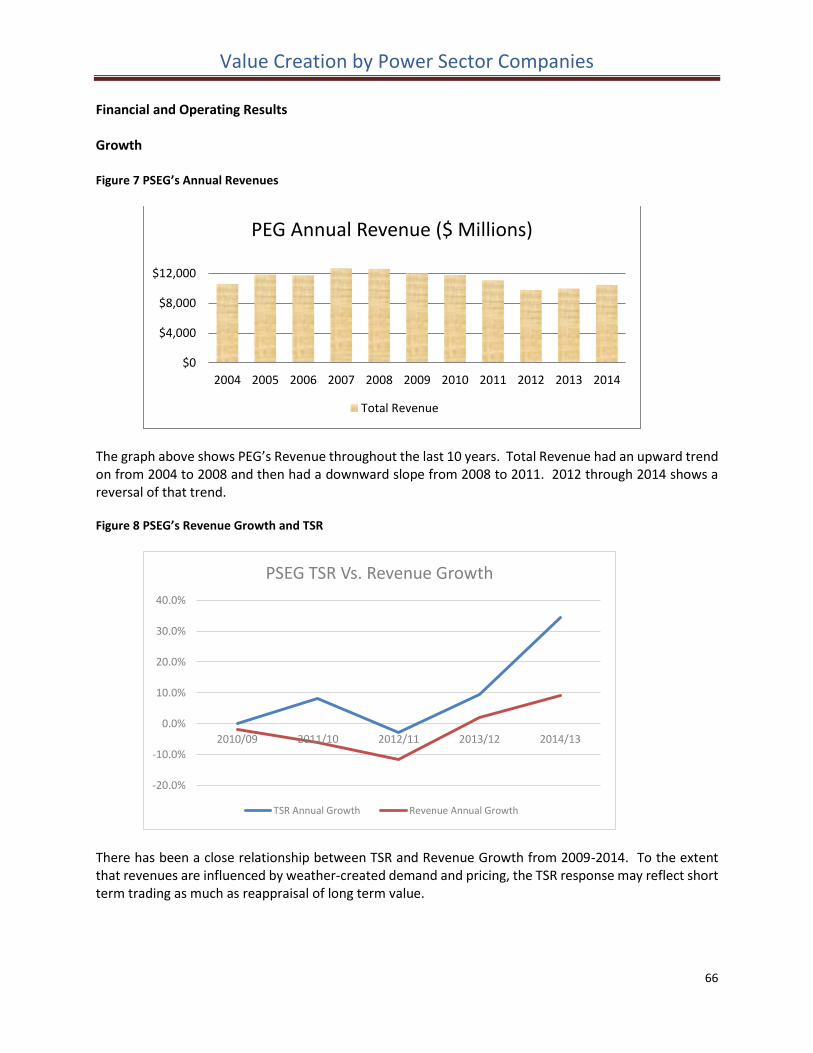
Value Creation by Power Sector Companies
66
Financial and Operating Results Growth Figure 7 PSEG’s Annual Revenues
The graph above shows PEG’s Revenue throughout the last 10 years. Total Revenue had an upward trend on from 2004 to 2008 and then had a downward slope from 2008 to 2011. 2012 through 2014 shows a reversal of that trend. Figure 8 PSEG’s Revenue Growth and TSR
There has been a close relationship between TSR and Revenue Growth from 2009-2014. To the extent that revenues are influenced by weather-created demand and pricing, the TSR response may reflect short term trading as much as reappraisal of long term value.
$0
$4,000
$8,000
$12,000
2004 2005 2006 2007 2008 2009 2010 2011 2012 2013 2014
PEG Annual Revenue ($ Millions)
Total Revenue
-20.0%
-10.0%
0.0%
10.0%
20.0%
30.0%
40.0%
2010/09 2011/10 2012/11 2013/12 2014/13
PSEG TSR Vs. Revenue Growth
TSR Annual Growth Revenue Annual Growth
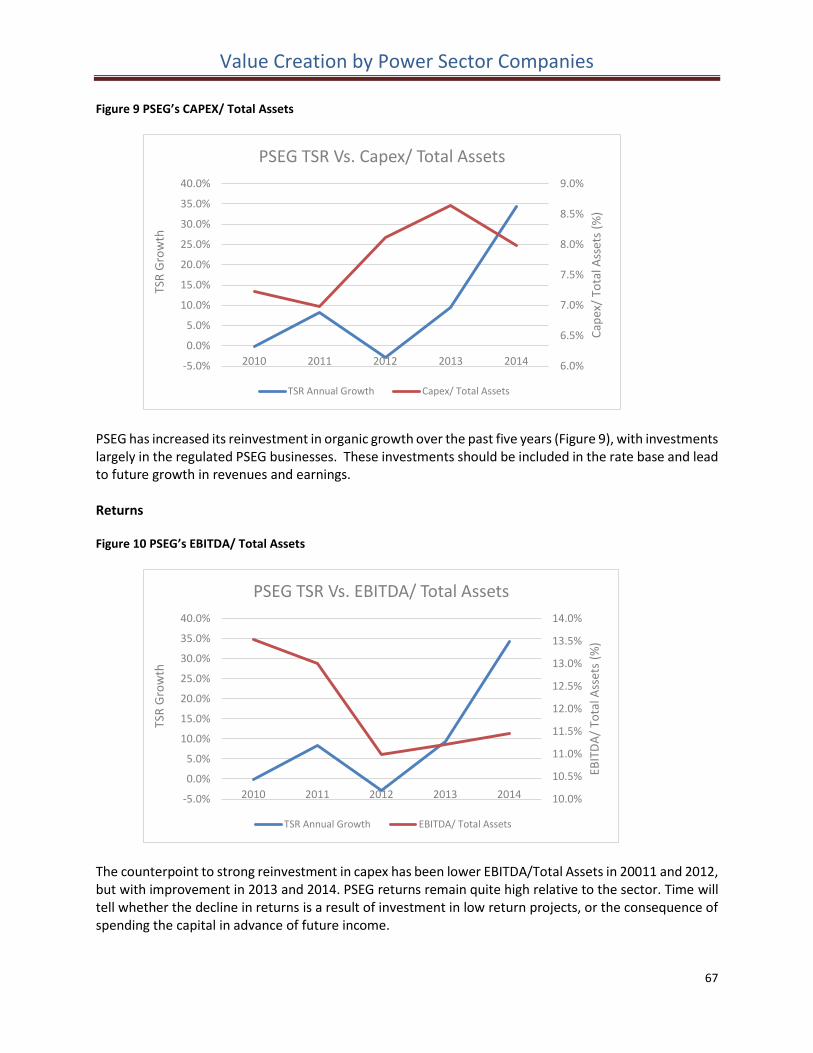
Value Creation by Power Sector Companies
67
Figure 9 PSEG’s CAPEX/ Total Assets
PSEG has increased its reinvestment in organic growth over the past five years (Figure 9), with investments largely in the regulated PSEG businesses. These investments should be included in the rate base and lead to future growth in revenues and earnings. Returns Figure 10 PSEG’s EBITDA/ Total Assets
The counterpoint to strong reinvestment in capex has been lower EBITDA/Total Assets in 20011 and 2012, but with improvement in 2013 and 2014. PSEG returns remain quite high relative to the sector. Time will tell whether the decline in returns is a result of investment in low return projects, or the consequence of spending the capital in advance of future income.
6.0%
6.5%
7.0%
7.5%
8.0%
8.5%
9.0%
-5.0%
0.0%
5.0%
10.0%
15.0%
20.0%
25.0%
30.0%
35.0%
40.0%
2010 2011 2012 2013 2014
Cap
ex/
Tota
l Ass
ets
(%)
TSR
Gro
wth
PSEG TSR Vs. Capex/ Total Assets
TSR Annual Growth Capex/ Total Assets
10.0%
10.5%
11.0%
11.5%
12.0%
12.5%
13.0%
13.5%
14.0%
-5.0%
0.0%
5.0%
10.0%
15.0%
20.0%
25.0%
30.0%
35.0%
40.0%
2010 2011 2012 2013 2014
EBIT
DA
/ To
tal A
sset
s (%
)
TSR
Gro
wth
PSEG TSR Vs. EBITDA/ Total Assets
TSR Annual Growth EBITDA/ Total Assets
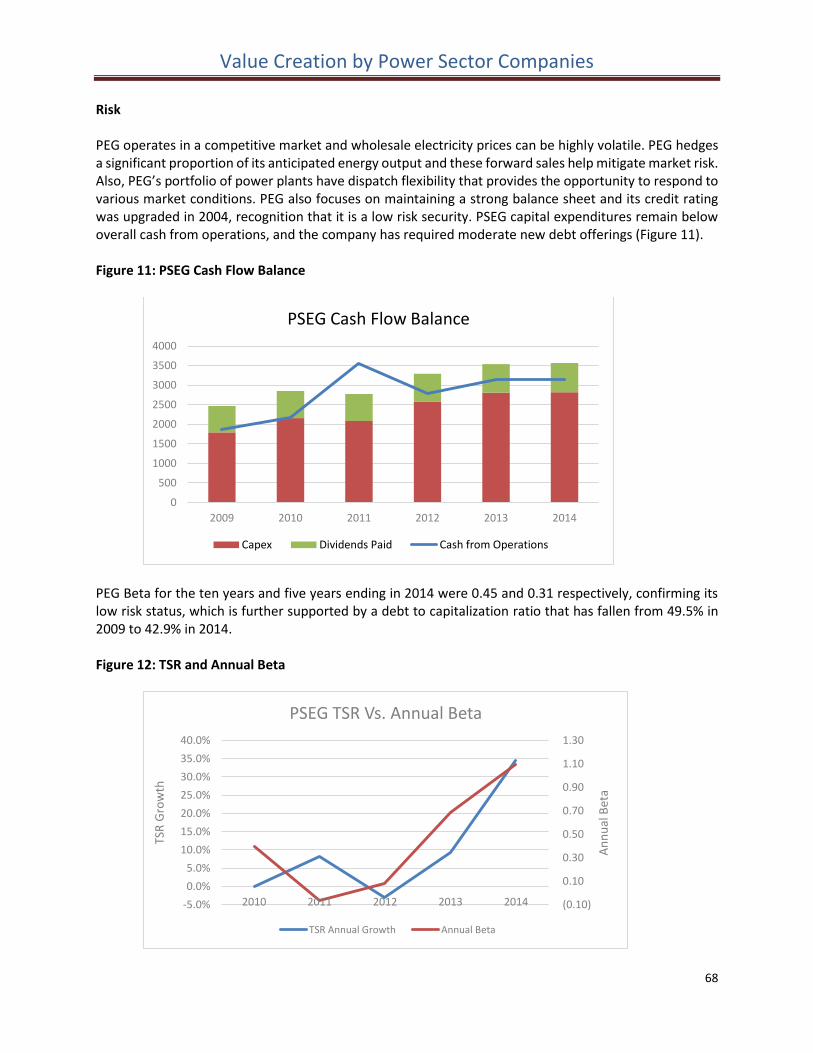
Value Creation by Power Sector Companies
68
Risk PEG operates in a competitive market and wholesale electricity prices can be highly volatile. PEG hedges a significant proportion of its anticipated energy output and these forward sales help mitigate market risk. Also, PEG’s portfolio of power plants have dispatch flexibility that provides the opportunity to respond to various market conditions. PEG also focuses on maintaining a strong balance sheet and its credit rating was upgraded in 2004, recognition that it is a low risk security. PSEG capital expenditures remain below overall cash from operations, and the company has required moderate new debt offerings (Figure 11). Figure 11: PSEG Cash Flow Balance
PEG Beta for the ten years and five years ending in 2014 were 0.45 and 0.31 respectively, confirming its low risk status, which is further supported by a debt to capitalization ratio that has fallen from 49.5% in 2009 to 42.9% in 2014. Figure 12: TSR and Annual Beta
0
500
1000
1500
2000
2500
3000
3500
4000
2009 2010 2011 2012 2013 2014
PSEG Cash Flow Balance
Capex Dividends Paid Cash from Operations
(0.10)
0.10
0.30
0.50
0.70
0.90
1.10
1.30
-5.0%
0.0%
5.0%
10.0%
15.0%
20.0%
25.0%
30.0%
35.0%
40.0%
2010 2011 2012 2013 2014
An
nu
al B
eta
TSR
Gro
wth
PSEG TSR Vs. Annual Beta
TSR Annual Growth Annual Beta
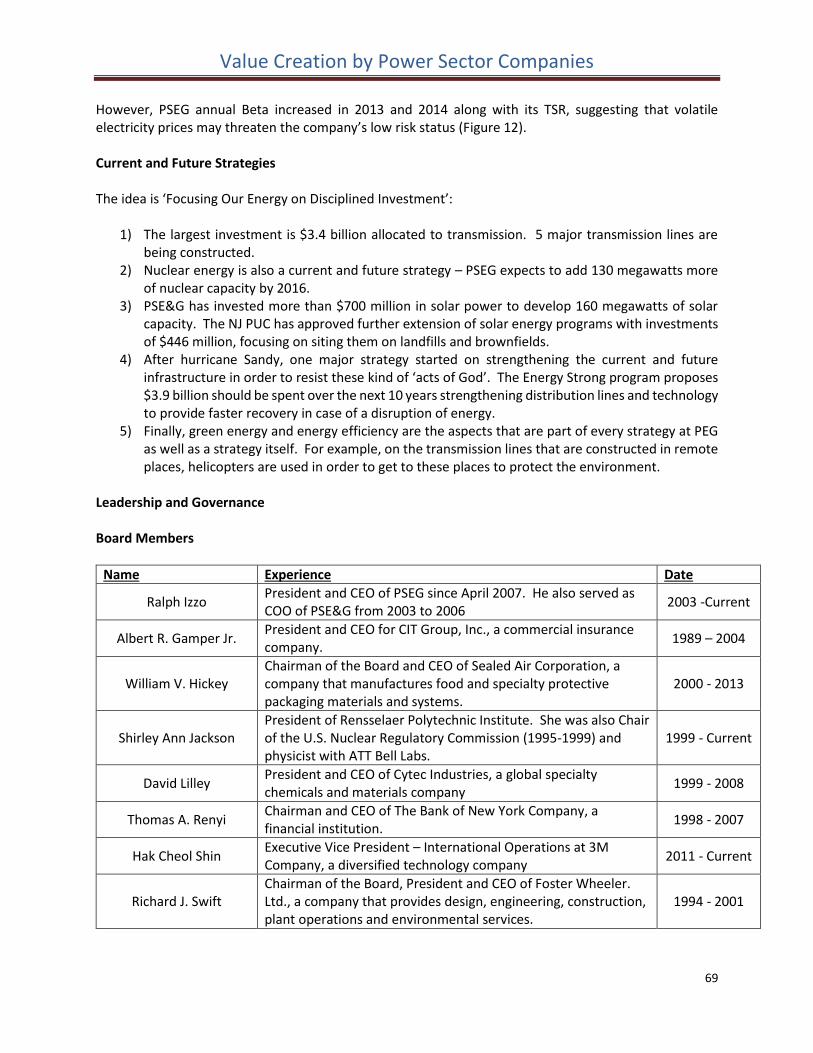
Value Creation by Power Sector Companies
69
However, PSEG annual Beta increased in 2013 and 2014 along with its TSR, suggesting that volatile electricity prices may threaten the company’s low risk status (Figure 12). Current and Future Strategies The idea is ‘Focusing Our Energy on Disciplined Investment’:
1) The largest investment is $3.4 billion allocated to transmission. 5 major transmission lines are being constructed.
2) Nuclear energy is also a current and future strategy – PSEG expects to add 130 megawatts more of nuclear capacity by 2016.
3) PSE&G has invested more than $700 million in solar power to develop 160 megawatts of solar capacity. The NJ PUC has approved further extension of solar energy programs with investments of $446 million, focusing on siting them on landfills and brownfields.
4) After hurricane Sandy, one major strategy started on strengthening the current and future infrastructure in order to resist these kind of ‘acts of God’. The Energy Strong program proposes $3.9 billion should be spent over the next 10 years strengthening distribution lines and technology to provide faster recovery in case of a disruption of energy.
5) Finally, green energy and energy efficiency are the aspects that are part of every strategy at PEG as well as a strategy itself. For example, on the transmission lines that are constructed in remote places, helicopters are used in order to get to these places to protect the environment.
Leadership and Governance Board Members
Name Experience Date
Ralph Izzo President and CEO of PSEG since April 2007. He also served as COO of PSE&G from 2003 to 2006
2003 -Current
Albert R. Gamper Jr. President and CEO for CIT Group, Inc., a commercial insurance company.
1989 – 2004
William V. Hickey Chairman of the Board and CEO of Sealed Air Corporation, a company that manufactures food and specialty protective packaging materials and systems.
2000 - 2013
Shirley Ann Jackson President of Rensselaer Polytechnic Institute. She was also Chair of the U.S. Nuclear Regulatory Commission (1995-1999) and physicist with ATT Bell Labs.
1999 - Current
David Lilley President and CEO of Cytec Industries, a global specialty chemicals and materials company
1999 - 2008
Thomas A. Renyi Chairman and CEO of The Bank of New York Company, a financial institution.
1998 - 2007
Hak Cheol Shin Executive Vice President – International Operations at 3M Company, a diversified technology company
2011 - Current
Richard J. Swift Chairman of the Board, President and CEO of Foster Wheeler. Ltd., a company that provides design, engineering, construction, plant operations and environmental services.
1994 - 2001
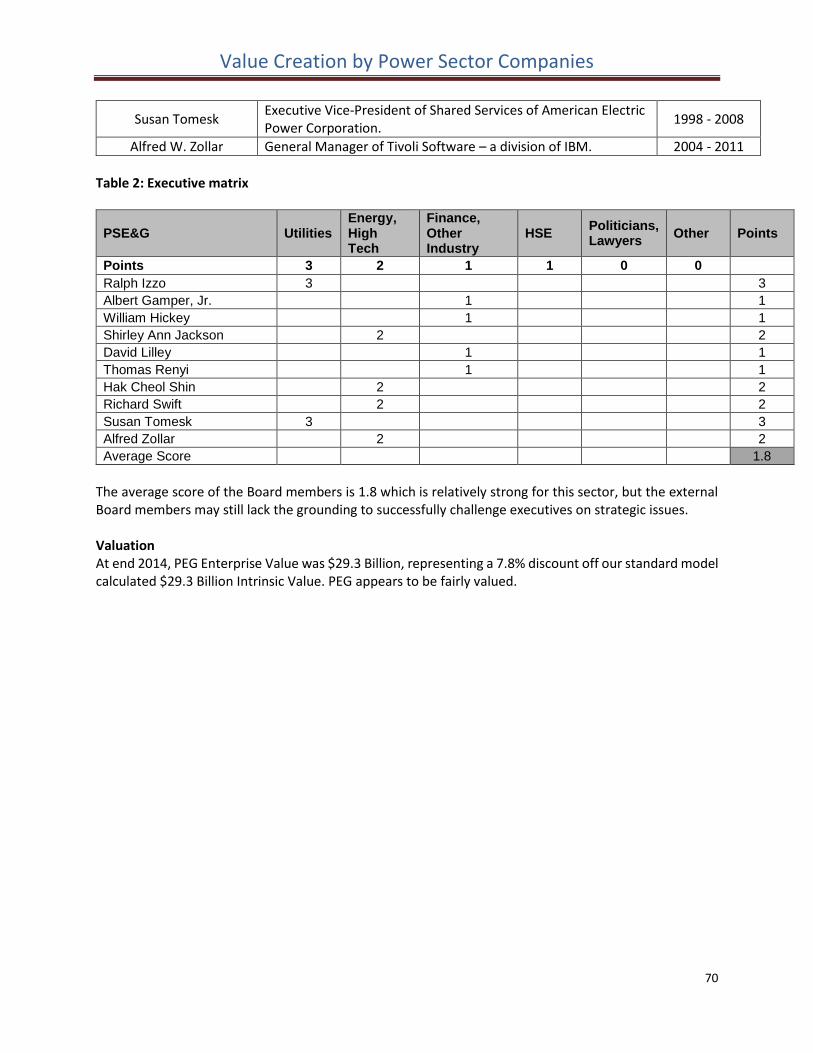
Value Creation by Power Sector Companies
70
Susan Tomesk Executive Vice-President of Shared Services of American Electric Power Corporation.
1998 - 2008
Alfred W. Zollar General Manager of Tivoli Software – a division of IBM. 2004 - 2011
Table 2: Executive matrix
PSE&G Utilities Energy, High Tech
Finance, Other Industry
HSE Politicians, Lawyers
Other Points
Points 3 2 1 1 0 0
Ralph Izzo 3 3
Albert Gamper, Jr. 1 1
William Hickey 1 1
Shirley Ann Jackson 2 2
David Lilley 1 1
Thomas Renyi 1 1
Hak Cheol Shin 2 2
Richard Swift 2 2
Susan Tomesk 3 3
Alfred Zollar 2 2
Average Score 1.8
The average score of the Board members is 1.8 which is relatively strong for this sector, but the external Board members may still lack the grounding to successfully challenge executives on strategic issues. Valuation At end 2014, PEG Enterprise Value was $29.3 Billion, representing a 7.8% discount off our standard model calculated $29.3 Billion Intrinsic Value. PEG appears to be fairly valued.
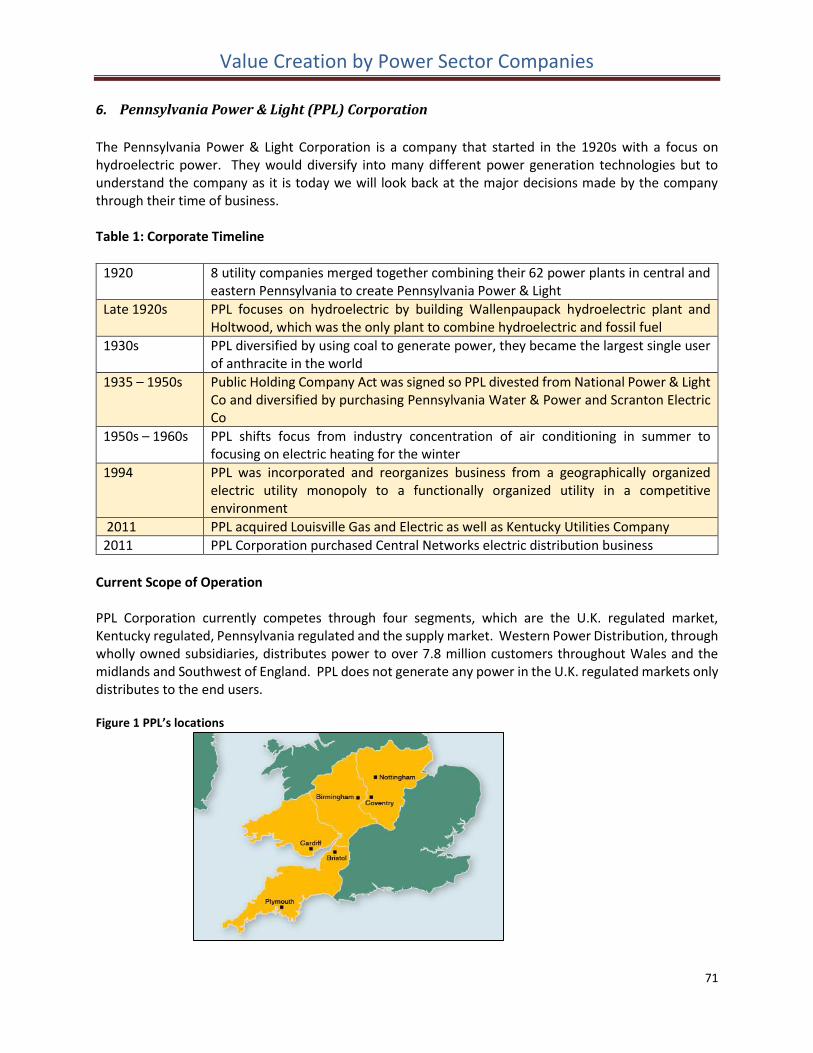
Value Creation by Power Sector Companies
71
6. Pennsylvania Power & Light (PPL) Corporation
The Pennsylvania Power & Light Corporation is a company that started in the 1920s with a focus on hydroelectric power. They would diversify into many different power generation technologies but to understand the company as it is today we will look back at the major decisions made by the company through their time of business. Table 1: Corporate Timeline
1920 8 utility companies merged together combining their 62 power plants in central and eastern Pennsylvania to create Pennsylvania Power & Light
Late 1920s PPL focuses on hydroelectric by building Wallenpaupack hydroelectric plant and Holtwood, which was the only plant to combine hydroelectric and fossil fuel
1930s PPL diversified by using coal to generate power, they became the largest single user of anthracite in the world
1935 – 1950s Public Holding Company Act was signed so PPL divested from National Power & Light Co and diversified by purchasing Pennsylvania Water & Power and Scranton Electric Co
1950s – 1960s PPL shifts focus from industry concentration of air conditioning in summer to focusing on electric heating for the winter
1994 PPL was incorporated and reorganizes business from a geographically organized electric utility monopoly to a functionally organized utility in a competitive environment
2011 PPL acquired Louisville Gas and Electric as well as Kentucky Utilities Company
2011 PPL Corporation purchased Central Networks electric distribution business
Current Scope of Operation PPL Corporation currently competes through four segments, which are the U.K. regulated market, Kentucky regulated, Pennsylvania regulated and the supply market. Western Power Distribution, through wholly owned subsidiaries, distributes power to over 7.8 million customers throughout Wales and the midlands and Southwest of England. PPL does not generate any power in the U.K. regulated markets only distributes to the end users. Figure 1 PPL’s locations
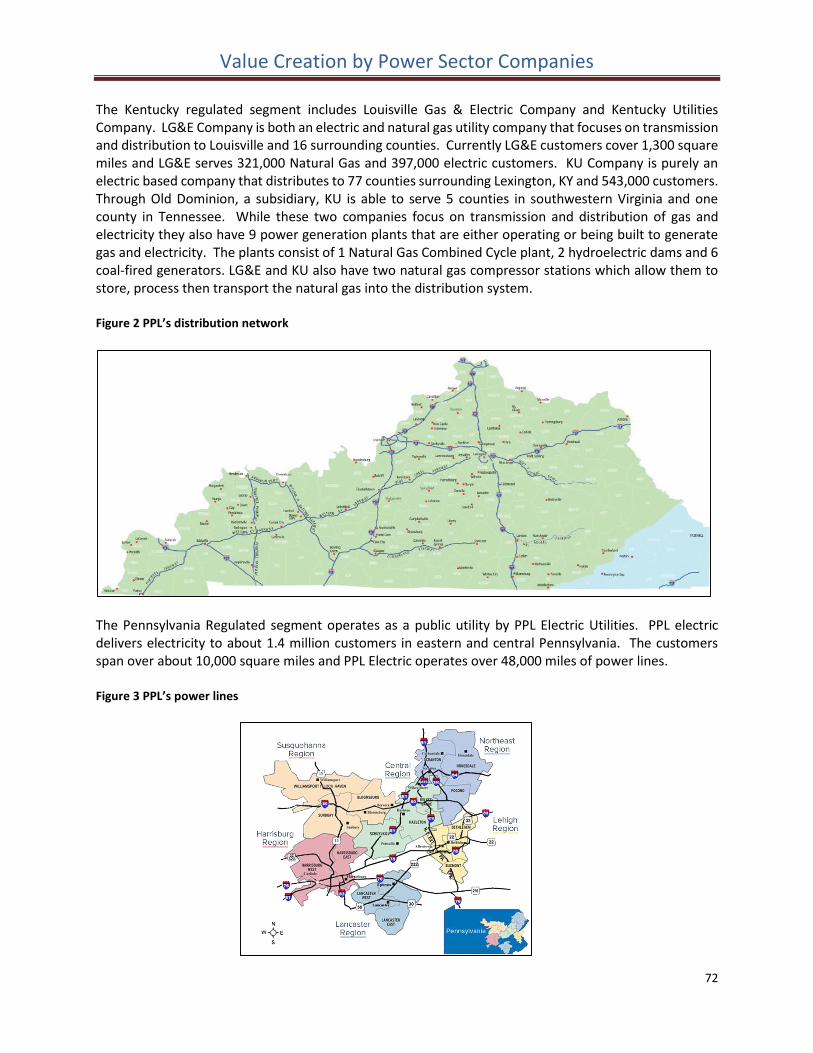
Value Creation by Power Sector Companies
72
The Kentucky regulated segment includes Louisville Gas & Electric Company and Kentucky Utilities Company. LG&E Company is both an electric and natural gas utility company that focuses on transmission and distribution to Louisville and 16 surrounding counties. Currently LG&E customers cover 1,300 square miles and LG&E serves 321,000 Natural Gas and 397,000 electric customers. KU Company is purely an electric based company that distributes to 77 counties surrounding Lexington, KY and 543,000 customers. Through Old Dominion, a subsidiary, KU is able to serve 5 counties in southwestern Virginia and one county in Tennessee. While these two companies focus on transmission and distribution of gas and electricity they also have 9 power generation plants that are either operating or being built to generate gas and electricity. The plants consist of 1 Natural Gas Combined Cycle plant, 2 hydroelectric dams and 6 coal-fired generators. LG&E and KU also have two natural gas compressor stations which allow them to store, process then transport the natural gas into the distribution system. Figure 2 PPL’s distribution network
The Pennsylvania Regulated segment operates as a public utility by PPL Electric Utilities. PPL electric delivers electricity to about 1.4 million customers in eastern and central Pennsylvania. The customers span over about 10,000 square miles and PPL Electric operates over 48,000 miles of power lines. Figure 3 PPL’s power lines
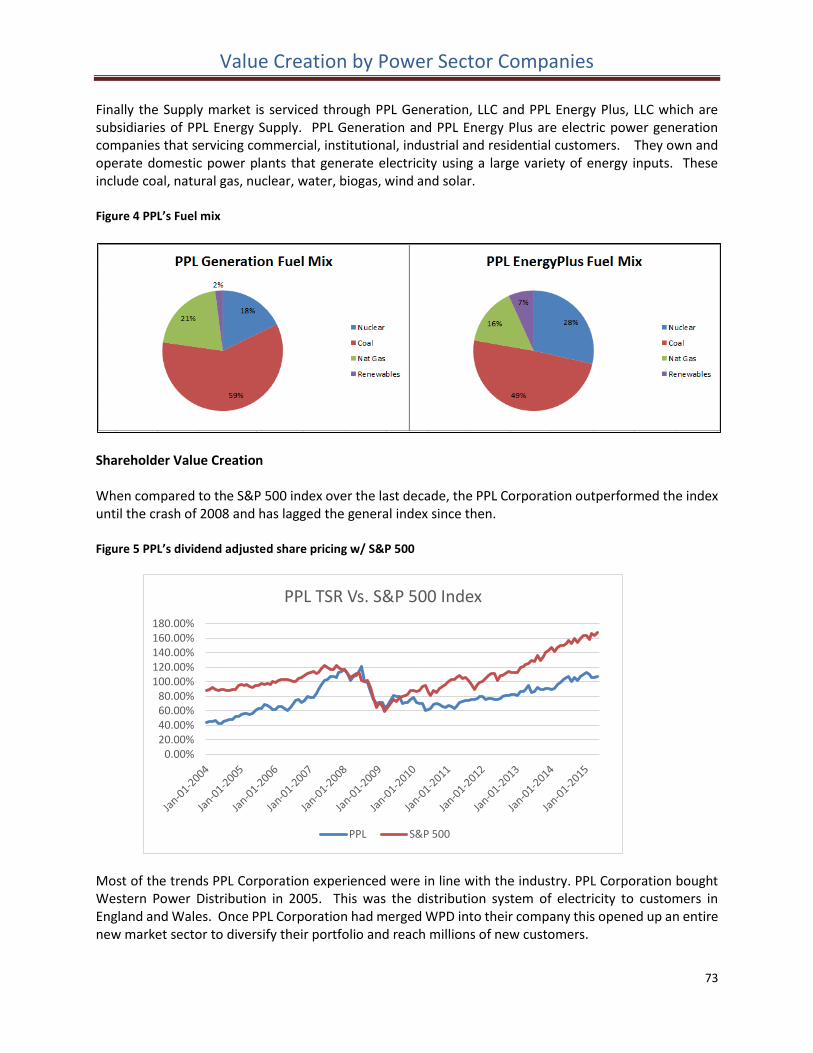
Value Creation by Power Sector Companies
73
Finally the Supply market is serviced through PPL Generation, LLC and PPL Energy Plus, LLC which are subsidiaries of PPL Energy Supply. PPL Generation and PPL Energy Plus are electric power generation companies that servicing commercial, institutional, industrial and residential customers. They own and operate domestic power plants that generate electricity using a large variety of energy inputs. These include coal, natural gas, nuclear, water, biogas, wind and solar. Figure 4 PPL’s Fuel mix
Shareholder Value Creation When compared to the S&P 500 index over the last decade, the PPL Corporation outperformed the index until the crash of 2008 and has lagged the general index since then. Figure 5 PPL’s dividend adjusted share pricing w/ S&P 500
Most of the trends PPL Corporation experienced were in line with the industry. PPL Corporation bought Western Power Distribution in 2005. This was the distribution system of electricity to customers in England and Wales. Once PPL Corporation had merged WPD into their company this opened up an entire new market sector to diversify their portfolio and reach millions of new customers.
0.00%20.00%40.00%60.00%80.00%
100.00%120.00%140.00%160.00%180.00%
PPL TSR Vs. S&P 500 Index
PPL S&P 500
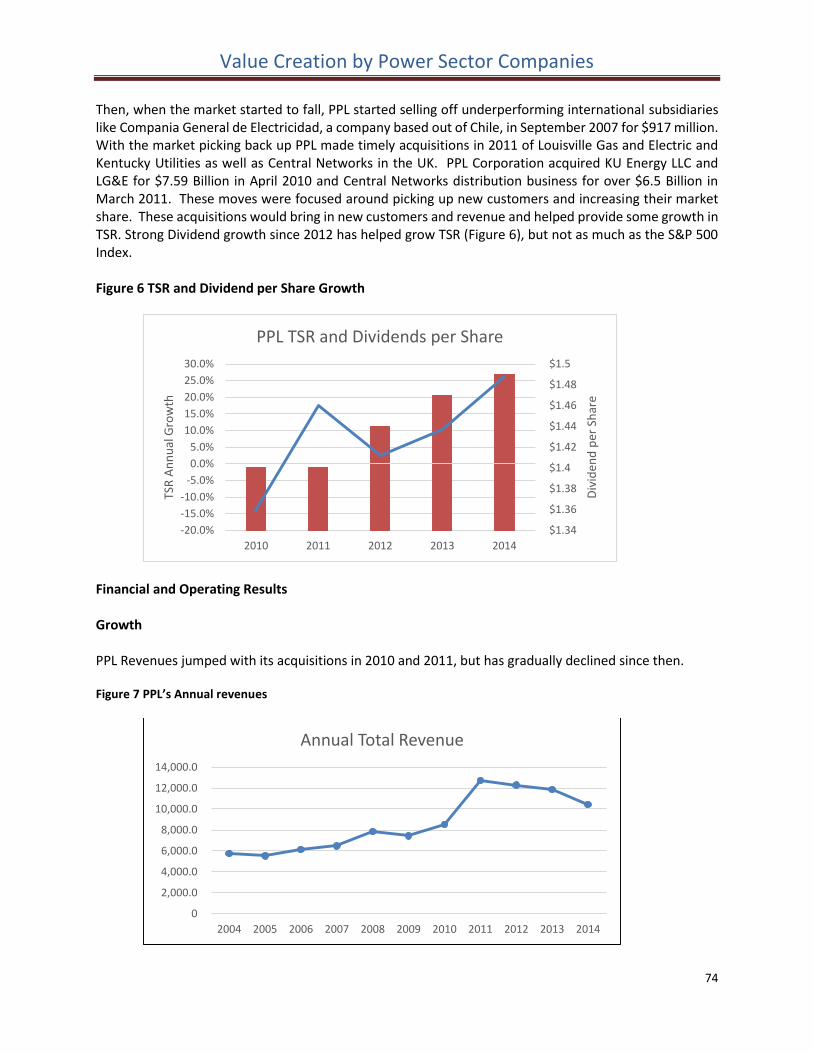
Value Creation by Power Sector Companies
74
Then, when the market started to fall, PPL started selling off underperforming international subsidiaries like Compania General de Electricidad, a company based out of Chile, in September 2007 for $917 million. With the market picking back up PPL made timely acquisitions in 2011 of Louisville Gas and Electric and Kentucky Utilities as well as Central Networks in the UK. PPL Corporation acquired KU Energy LLC and LG&E for $7.59 Billion in April 2010 and Central Networks distribution business for over $6.5 Billion in March 2011. These moves were focused around picking up new customers and increasing their market share. These acquisitions would bring in new customers and revenue and helped provide some growth in TSR. Strong Dividend growth since 2012 has helped grow TSR (Figure 6), but not as much as the S&P 500 Index. Figure 6 TSR and Dividend per Share Growth
Financial and Operating Results Growth PPL Revenues jumped with its acquisitions in 2010 and 2011, but has gradually declined since then. Figure 7 PPL’s Annual revenues
$1.34
$1.36
$1.38
$1.4
$1.42
$1.44
$1.46
$1.48
$1.5
-20.0%
-15.0%
-10.0%
-5.0%
0.0%
5.0%
10.0%
15.0%
20.0%
25.0%
30.0%
2010 2011 2012 2013 2014
Div
iden
d p
er S
har
e
TSR
An
nu
al G
row
th
PPL TSR and Dividends per Share
0
2,000.0
4,000.0
6,000.0
8,000.0
10,000.0
12,000.0
14,000.0
2004 2005 2006 2007 2008 2009 2010 2011 2012 2013 2014
Annual Total Revenue
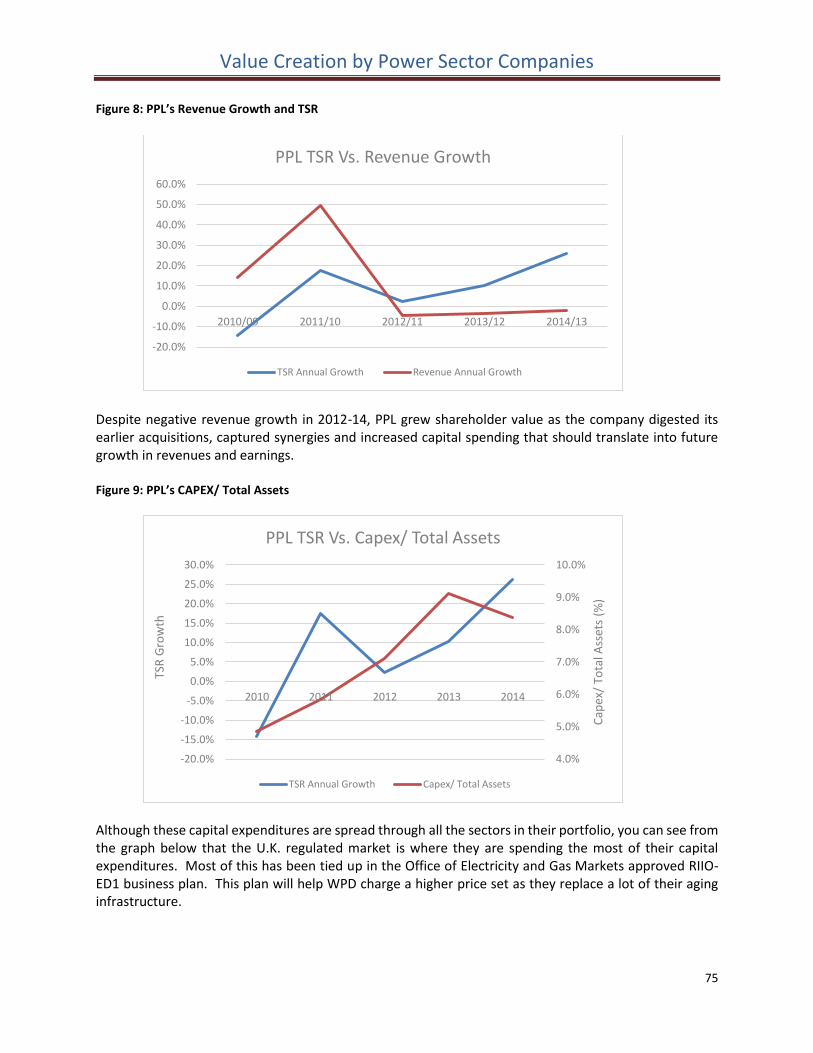
Value Creation by Power Sector Companies
75
Figure 8: PPL’s Revenue Growth and TSR
Despite negative revenue growth in 2012-14, PPL grew shareholder value as the company digested its earlier acquisitions, captured synergies and increased capital spending that should translate into future growth in revenues and earnings. Figure 9: PPL’s CAPEX/ Total Assets
Although these capital expenditures are spread through all the sectors in their portfolio, you can see from the graph below that the U.K. regulated market is where they are spending the most of their capital expenditures. Most of this has been tied up in the Office of Electricity and Gas Markets approved RIIO-ED1 business plan. This plan will help WPD charge a higher price set as they replace a lot of their aging infrastructure.
-20.0%
-10.0%
0.0%
10.0%
20.0%
30.0%
40.0%
50.0%
60.0%
2010/09 2011/10 2012/11 2013/12 2014/13
PPL TSR Vs. Revenue Growth
TSR Annual Growth Revenue Annual Growth
4.0%
5.0%
6.0%
7.0%
8.0%
9.0%
10.0%
-20.0%
-15.0%
-10.0%
-5.0%
0.0%
5.0%
10.0%
15.0%
20.0%
25.0%
30.0%
2010 2011 2012 2013 2014
Cap
ex/
Tota
l Ass
ets
(%)
TSR
Gro
wth
PPL TSR Vs. Capex/ Total Assets
TSR Annual Growth Capex/ Total Assets
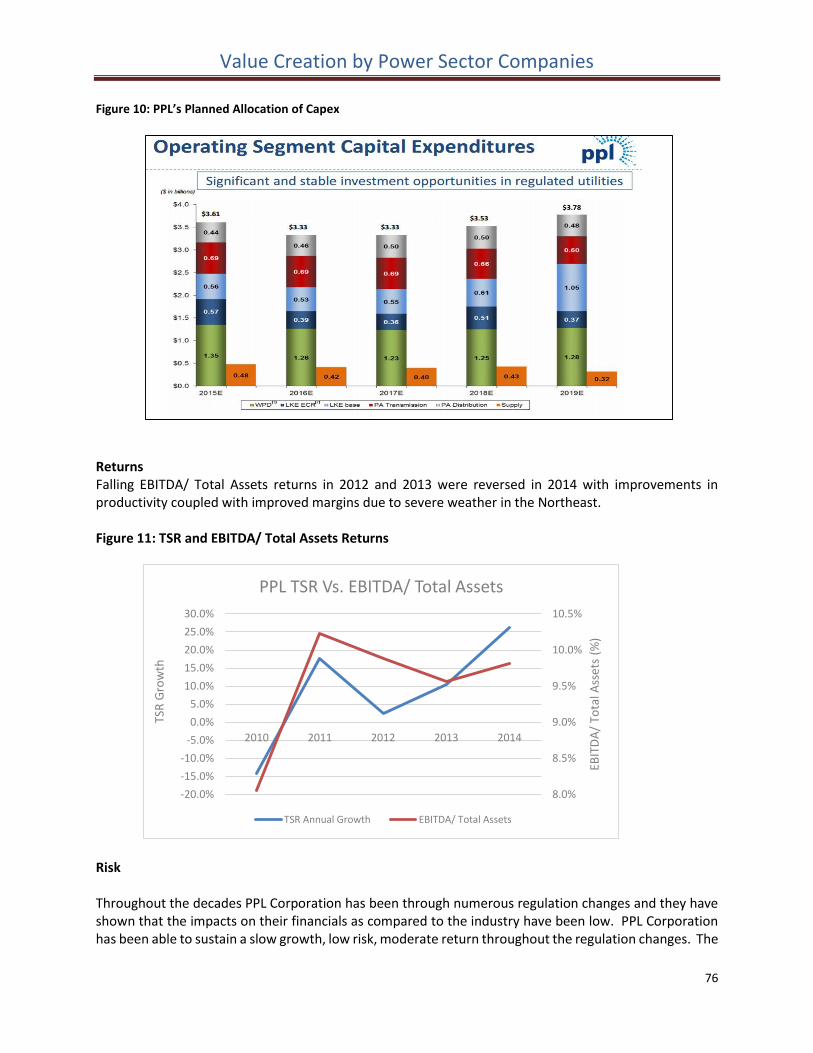
Value Creation by Power Sector Companies
76
Figure 10: PPL’s Planned Allocation of Capex
Returns Falling EBITDA/ Total Assets returns in 2012 and 2013 were reversed in 2014 with improvements in productivity coupled with improved margins due to severe weather in the Northeast. Figure 11: TSR and EBITDA/ Total Assets Returns
Risk Throughout the decades PPL Corporation has been through numerous regulation changes and they have shown that the impacts on their financials as compared to the industry have been low. PPL Corporation has been able to sustain a slow growth, low risk, moderate return throughout the regulation changes. The
8.0%
8.5%
9.0%
9.5%
10.0%
10.5%
-20.0%
-15.0%
-10.0%
-5.0%
0.0%
5.0%
10.0%
15.0%
20.0%
25.0%
30.0%
2010 2011 2012 2013 2014
EBIT
DA
/ To
tal A
sset
s (%
)
TSR
Gro
wth
PPL TSR Vs. EBITDA/ Total Assets
TSR Annual Growth EBITDA/ Total Assets
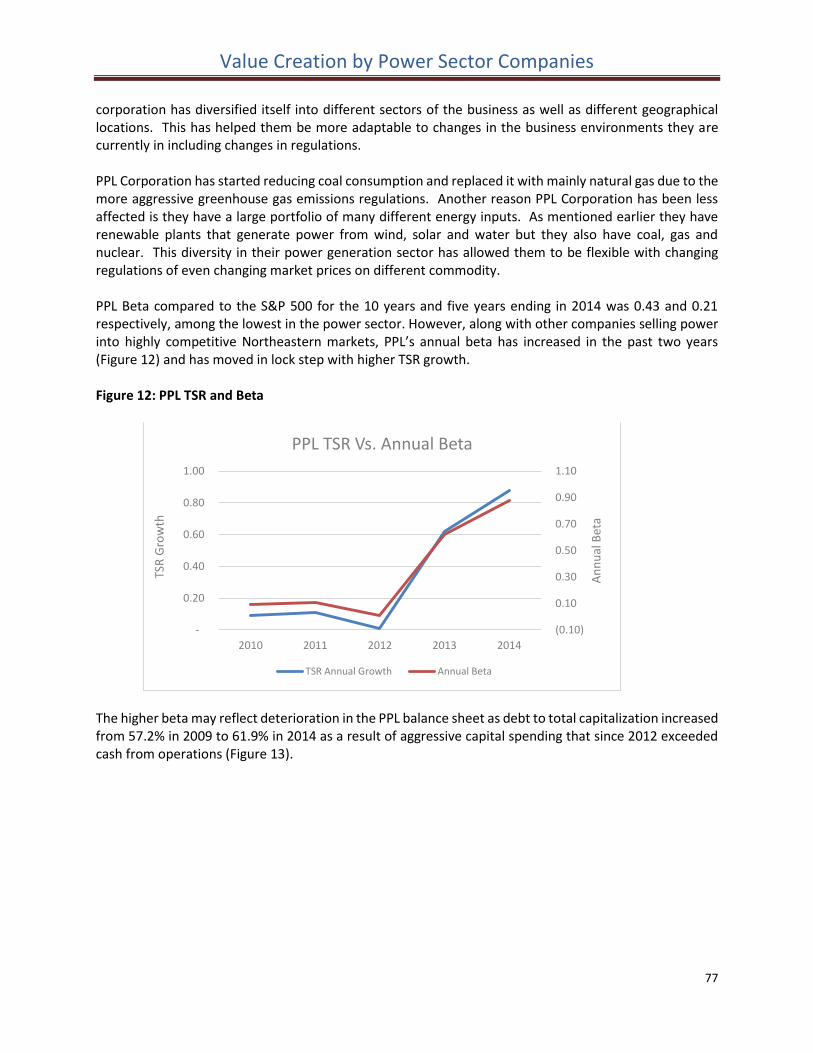
Value Creation by Power Sector Companies
77
corporation has diversified itself into different sectors of the business as well as different geographical locations. This has helped them be more adaptable to changes in the business environments they are currently in including changes in regulations. PPL Corporation has started reducing coal consumption and replaced it with mainly natural gas due to the more aggressive greenhouse gas emissions regulations. Another reason PPL Corporation has been less affected is they have a large portfolio of many different energy inputs. As mentioned earlier they have renewable plants that generate power from wind, solar and water but they also have coal, gas and nuclear. This diversity in their power generation sector has allowed them to be flexible with changing regulations of even changing market prices on different commodity. PPL Beta compared to the S&P 500 for the 10 years and five years ending in 2014 was 0.43 and 0.21 respectively, among the lowest in the power sector. However, along with other companies selling power into highly competitive Northeastern markets, PPL’s annual beta has increased in the past two years (Figure 12) and has moved in lock step with higher TSR growth. Figure 12: PPL TSR and Beta
The higher beta may reflect deterioration in the PPL balance sheet as debt to total capitalization increased from 57.2% in 2009 to 61.9% in 2014 as a result of aggressive capital spending that since 2012 exceeded cash from operations (Figure 13).
(0.10)
0.10
0.30
0.50
0.70
0.90
1.10
-
0.20
0.40
0.60
0.80
1.00
2010 2011 2012 2013 2014
An
nu
al B
eta
TSR
Gro
wth
PPL TSR Vs. Annual Beta
TSR Annual Growth Annual Beta
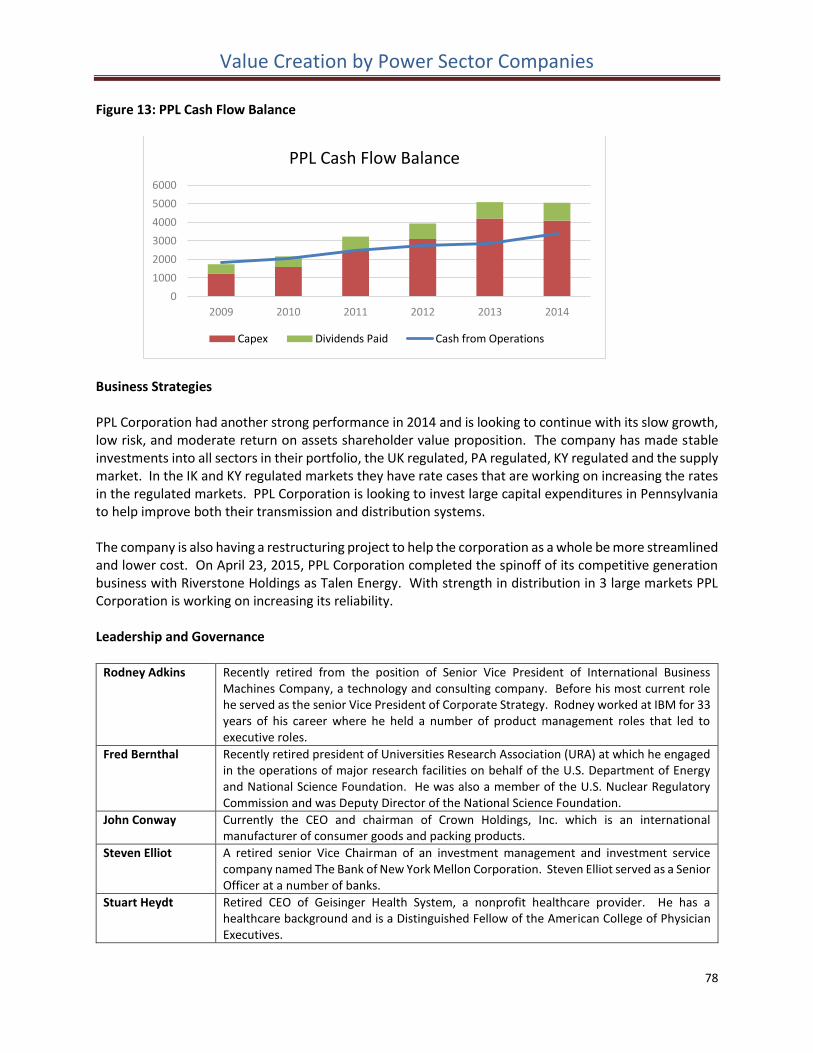
Value Creation by Power Sector Companies
78
Figure 13: PPL Cash Flow Balance
Business Strategies PPL Corporation had another strong performance in 2014 and is looking to continue with its slow growth, low risk, and moderate return on assets shareholder value proposition. The company has made stable investments into all sectors in their portfolio, the UK regulated, PA regulated, KY regulated and the supply market. In the IK and KY regulated markets they have rate cases that are working on increasing the rates in the regulated markets. PPL Corporation is looking to invest large capital expenditures in Pennsylvania to help improve both their transmission and distribution systems. The company is also having a restructuring project to help the corporation as a whole be more streamlined and lower cost. On April 23, 2015, PPL Corporation completed the spinoff of its competitive generation business with Riverstone Holdings as Talen Energy. With strength in distribution in 3 large markets PPL Corporation is working on increasing its reliability. Leadership and Governance
Rodney Adkins Recently retired from the position of Senior Vice President of International Business Machines Company, a technology and consulting company. Before his most current role he served as the senior Vice President of Corporate Strategy. Rodney worked at IBM for 33 years of his career where he held a number of product management roles that led to executive roles.
Fred Bernthal Recently retired president of Universities Research Association (URA) at which he engaged in the operations of major research facilities on behalf of the U.S. Department of Energy and National Science Foundation. He was also a member of the U.S. Nuclear Regulatory Commission and was Deputy Director of the National Science Foundation.
John Conway Currently the CEO and chairman of Crown Holdings, Inc. which is an international manufacturer of consumer goods and packing products.
Steven Elliot A retired senior Vice Chairman of an investment management and investment service company named The Bank of New York Mellon Corporation. Steven Elliot served as a Senior Officer at a number of banks.
Stuart Heydt Retired CEO of Geisinger Health System, a nonprofit healthcare provider. He has a healthcare background and is a Distinguished Fellow of the American College of Physician Executives.
0
1000
2000
3000
4000
5000
6000
2009 2010 2011 2012 2013 2014
PPL Cash Flow Balance
Capex Dividends Paid Cash from Operations
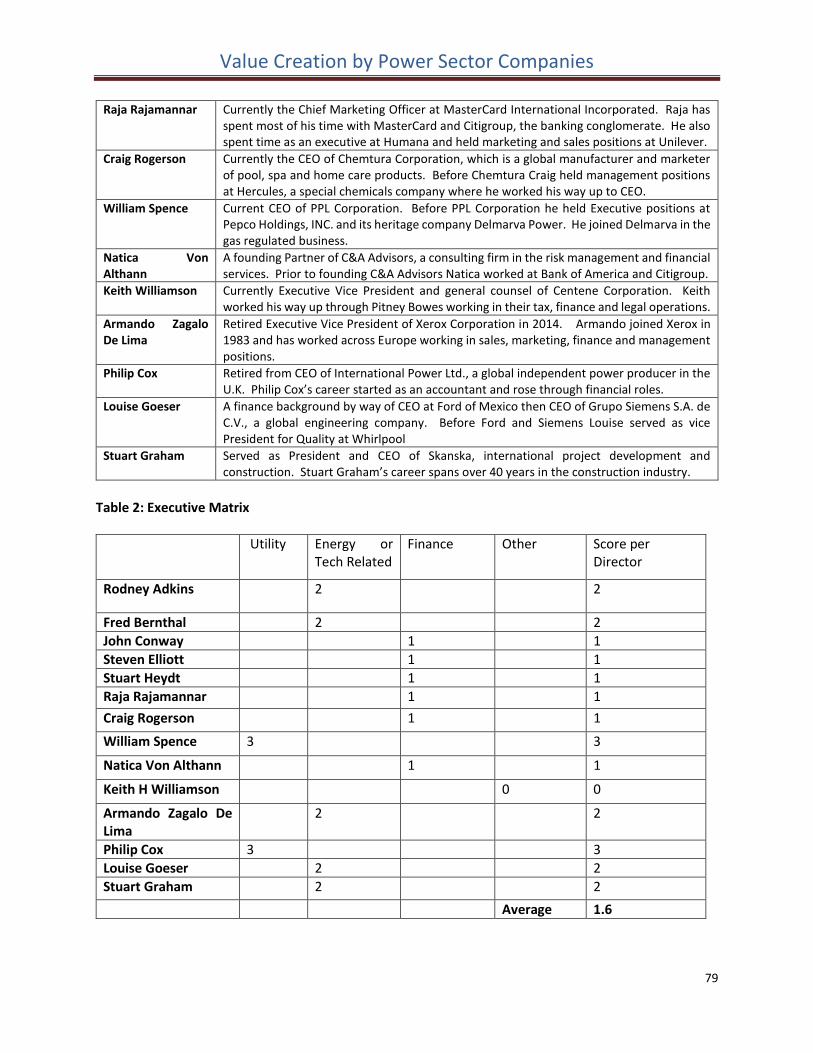
Value Creation by Power Sector Companies
79
Raja Rajamannar Currently the Chief Marketing Officer at MasterCard International Incorporated. Raja has spent most of his time with MasterCard and Citigroup, the banking conglomerate. He also spent time as an executive at Humana and held marketing and sales positions at Unilever.
Craig Rogerson Currently the CEO of Chemtura Corporation, which is a global manufacturer and marketer of pool, spa and home care products. Before Chemtura Craig held management positions at Hercules, a special chemicals company where he worked his way up to CEO.
William Spence Current CEO of PPL Corporation. Before PPL Corporation he held Executive positions at Pepco Holdings, INC. and its heritage company Delmarva Power. He joined Delmarva in the gas regulated business.
Natica Von Althann
A founding Partner of C&A Advisors, a consulting firm in the risk management and financial services. Prior to founding C&A Advisors Natica worked at Bank of America and Citigroup.
Keith Williamson Currently Executive Vice President and general counsel of Centene Corporation. Keith worked his way up through Pitney Bowes working in their tax, finance and legal operations.
Armando Zagalo De Lima
Retired Executive Vice President of Xerox Corporation in 2014. Armando joined Xerox in 1983 and has worked across Europe working in sales, marketing, finance and management positions.
Philip Cox Retired from CEO of International Power Ltd., a global independent power producer in the U.K. Philip Cox’s career started as an accountant and rose through financial roles.
Louise Goeser A finance background by way of CEO at Ford of Mexico then CEO of Grupo Siemens S.A. de C.V., a global engineering company. Before Ford and Siemens Louise served as vice President for Quality at Whirlpool
Stuart Graham Served as President and CEO of Skanska, international project development and construction. Stuart Graham’s career spans over 40 years in the construction industry.
Table 2: Executive Matrix
Utility Energy or Tech Related
Finance Other
Score per Director
Rodney Adkins 2 2
Fred Bernthal 2 2
John Conway 1 1
Steven Elliott 1 1
Stuart Heydt 1 1
Raja Rajamannar 1 1
Craig Rogerson 1 1
William Spence 3 3
Natica Von Althann 1 1
Keith H Williamson 0 0
Armando Zagalo De Lima
2 2
Philip Cox 3 3
Louise Goeser 2 2
Stuart Graham 2 2
Average 1.6
Value Creation by Power Sector Companies
80
As seen in the above chart the board of PPL Corporation is not well populated with Electric Utilities experts. There are some in energy generation but mostly the board is made up of finance experts or other CEOs of businesses not related to the energy industry. This allows a lot of power to the CEO William Spence as most of the board would be looking at his proposals from strictly a financial background. Valuation Our standard valuation model suggests an intrinsic value for PPL of $51 Billion, compared to an end 2014 enterprise value of $38 Billion or a market discount of 26%. This likely reflects market uncertainty on whether the PPL plan to spin off its competitive power generation business into Talen Energy will be accretive for PPL and whether the regulated PSEG can grow revenues at the model assumption of 2% pa.
Value Creation by Power Sector Companies
81
7. American Electric Power (AEP) Corporation
History American Electric Power (AEP) was originally founded December 20, 1906 and was formed from a utility holding company. In 1907 AEP first time acquired utility properties and started proving electric service, gas, water, transit, or ice service to people who lived in New Jersey, New York, Pennsylvania, West Virginia, Ohio, Indiana, and Illinois. In the beginning the company was known the American Gas and Electric Company but in 1958 it became American Electric Power. Table 1: Corporate Timeline
The Early Years: 1906-1921
AEP was a small struggling company stretching from the Atlantic Ocean to Illinois.
In 1911 AEP’s interconnected power system got its start.
In 1917 AEP’s first “super” power plant began operation on the Ohio River in Wheeling, West Virginia.
Expansion & Realignment: 1922-1940
In the 1920’s America was on the move and electricity became essential. AG&E (AEP) had one of the greatest expansion periods in the company’s history.
In 1923, AG&E began construction of three large generating stations in Indiana, Ohio, and Pennsylvania.
In 1924, AG&E purchased control of American Electric Power Company with no relation to present AEP.
In 1929, AG&E entered the Great Depression with good financial health and maintained its financial integrity though the period.
The Sporn Years: 1941-1961
From 1941 to 1961, AG&E built 36 new generating units at 14 locations in five states – with a generating capacity 6,000 megawatts. Much of the work during that era was led by Philip Sporn, who served as its President from 1947 until 1961.
In 1958, AG&E changed its name to AEP because the company had not provided gas service since the 1920s.
End of the 20th Century: 1976-2000
In 1980, AEP agreed to move its corporate headquarters to Columbus, Ohio.
In 1996, AEP’s sales of electricity to retail customers topped to 100 billion kilowatt hours for the first time in AEP’s history.
In 2000, AEP merged with Central and South West Corp. and created one of the largest utilities in the nation, with combined revenues of $12.5 billion, and $35 billion in assets.
Recent Years: 2001 – Present
In 2006, AEP celebrated its 100th anniversary.
In 2009, AEP formally commissioned the world’s first integrated carbon capture and storage project at a working power plant.
In 2010, AEP had paid $18.5 billion in dividends to its shareholders over 100 years. Only 23 companies in US had paid dividends to their shareholders consecutively.
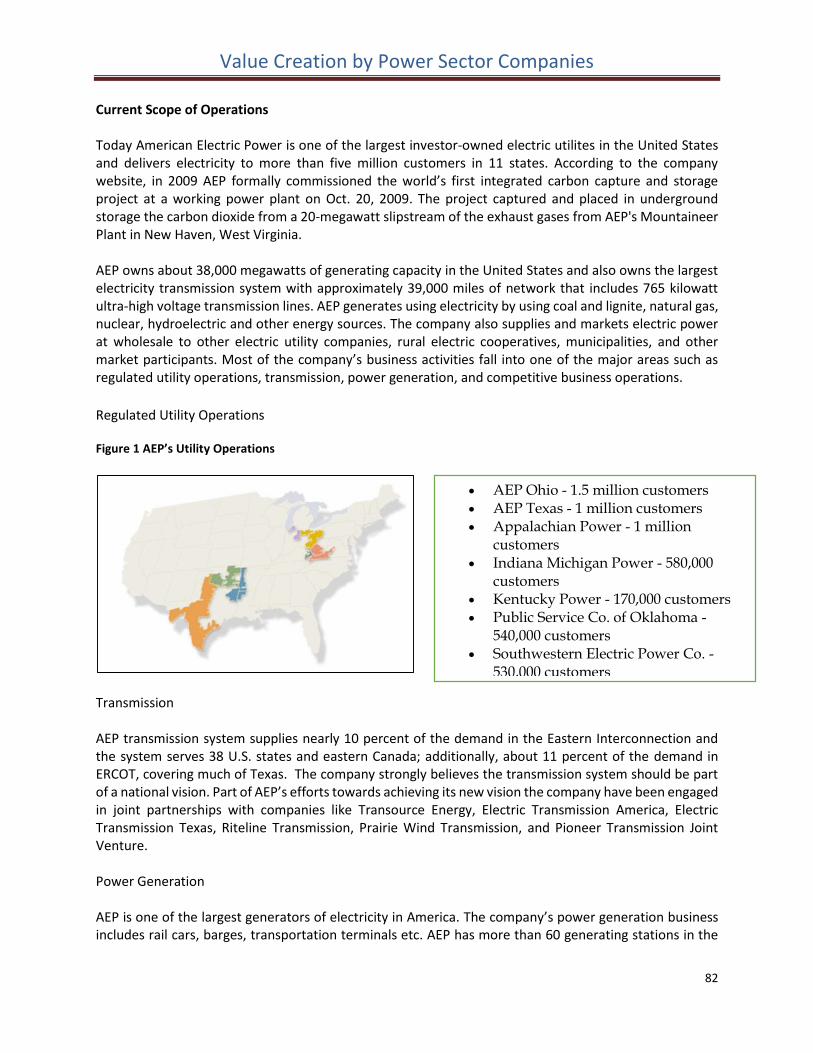
Value Creation by Power Sector Companies
82
Current Scope of Operations Today American Electric Power is one of the largest investor-owned electric utilites in the United States and delivers electricity to more than five million customers in 11 states. According to the company website, in 2009 AEP formally commissioned the world’s first integrated carbon capture and storage project at a working power plant on Oct. 20, 2009. The project captured and placed in underground storage the carbon dioxide from a 20-megawatt slipstream of the exhaust gases from AEP's Mountaineer Plant in New Haven, West Virginia. AEP owns about 38,000 megawatts of generating capacity in the United States and also owns the largest electricity transmission system with approximately 39,000 miles of network that includes 765 kilowatt ultra-high voltage transmission lines. AEP generates using electricity by using coal and lignite, natural gas, nuclear, hydroelectric and other energy sources. The company also supplies and markets electric power at wholesale to other electric utility companies, rural electric cooperatives, municipalities, and other market participants. Most of the company’s business activities fall into one of the major areas such as regulated utility operations, transmission, power generation, and competitive business operations.
Regulated Utility Operations Figure 1 AEP’s Utility Operations
Transmission AEP transmission system supplies nearly 10 percent of the demand in the Eastern Interconnection and the system serves 38 U.S. states and eastern Canada; additionally, about 11 percent of the demand in ERCOT, covering much of Texas. The company strongly believes the transmission system should be part of a national vision. Part of AEP’s efforts towards achieving its new vision the company have been engaged in joint partnerships with companies like Transource Energy, Electric Transmission America, Electric Transmission Texas, Riteline Transmission, Prairie Wind Transmission, and Pioneer Transmission Joint Venture. Power Generation AEP is one of the largest generators of electricity in America. The company’s power generation business includes rail cars, barges, transportation terminals etc. AEP has more than 60 generating stations in the
AEP Ohio - 1.5 million customers AEP Texas - 1 million customers Appalachian Power - 1 million
customers Indiana Michigan Power - 580,000
customers Kentucky Power - 170,000 customers Public Service Co. of Oklahoma -
540,000 customers Southwestern Electric Power Co. -
530,000 customers
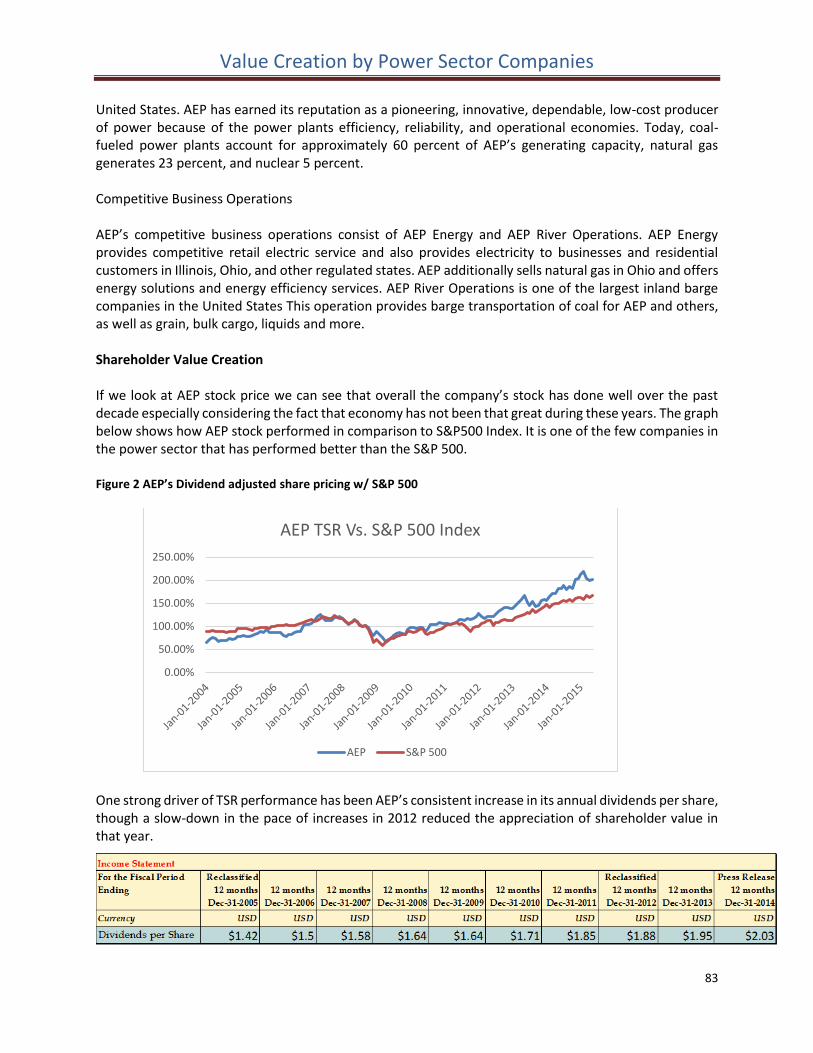
Value Creation by Power Sector Companies
83
United States. AEP has earned its reputation as a pioneering, innovative, dependable, low-cost producer of power because of the power plants efficiency, reliability, and operational economies. Today, coal-fueled power plants account for approximately 60 percent of AEP’s generating capacity, natural gas generates 23 percent, and nuclear 5 percent. Competitive Business Operations AEP’s competitive business operations consist of AEP Energy and AEP River Operations. AEP Energy provides competitive retail electric service and also provides electricity to businesses and residential customers in Illinois, Ohio, and other regulated states. AEP additionally sells natural gas in Ohio and offers energy solutions and energy efficiency services. AEP River Operations is one of the largest inland barge companies in the United States This operation provides barge transportation of coal for AEP and others, as well as grain, bulk cargo, liquids and more. Shareholder Value Creation If we look at AEP stock price we can see that overall the company’s stock has done well over the past decade especially considering the fact that economy has not been that great during these years. The graph below shows how AEP stock performed in comparison to S&P500 Index. It is one of the few companies in the power sector that has performed better than the S&P 500. Figure 2 AEP’s Dividend adjusted share pricing w/ S&P 500
One strong driver of TSR performance has been AEP’s consistent increase in its annual dividends per share, though a slow-down in the pace of increases in 2012 reduced the appreciation of shareholder value in that year.
0.00%
50.00%
100.00%
150.00%
200.00%
250.00%
AEP TSR Vs. S&P 500 Index
AEP S&P 500
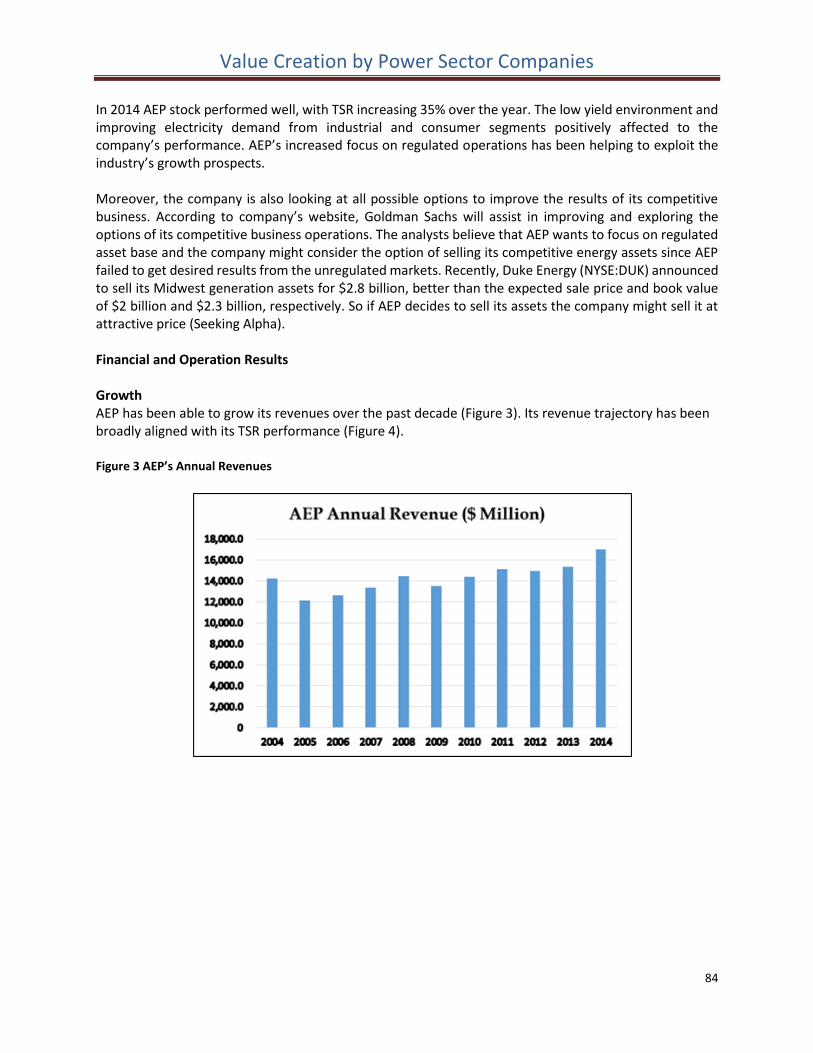
Value Creation by Power Sector Companies
84
In 2014 AEP stock performed well, with TSR increasing 35% over the year. The low yield environment and improving electricity demand from industrial and consumer segments positively affected to the company’s performance. AEP’s increased focus on regulated operations has been helping to exploit the industry’s growth prospects. Moreover, the company is also looking at all possible options to improve the results of its competitive business. According to company’s website, Goldman Sachs will assist in improving and exploring the options of its competitive business operations. The analysts believe that AEP wants to focus on regulated asset base and the company might consider the option of selling its competitive energy assets since AEP failed to get desired results from the unregulated markets. Recently, Duke Energy (NYSE:DUK) announced to sell its Midwest generation assets for $2.8 billion, better than the expected sale price and book value of $2 billion and $2.3 billion, respectively. So if AEP decides to sell its assets the company might sell it at attractive price (Seeking Alpha). Financial and Operation Results Growth AEP has been able to grow its revenues over the past decade (Figure 3). Its revenue trajectory has been broadly aligned with its TSR performance (Figure 4). Figure 3 AEP’s Annual Revenues
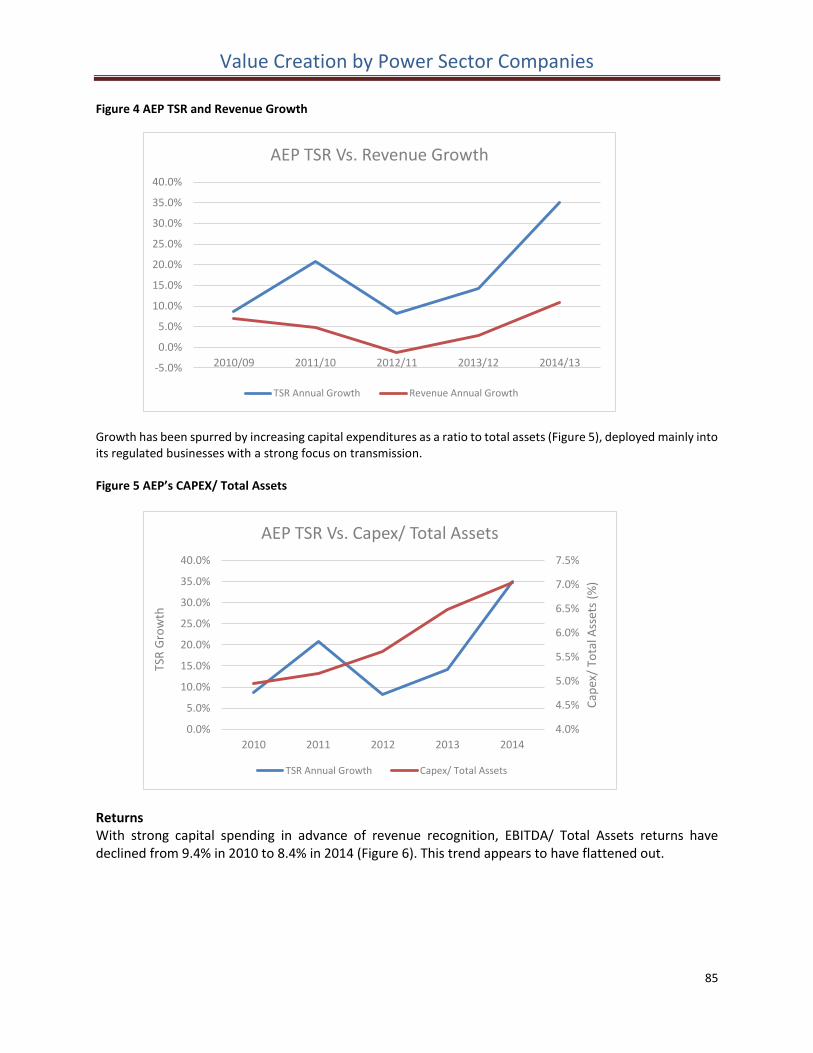
Value Creation by Power Sector Companies
85
Figure 4 AEP TSR and Revenue Growth
Growth has been spurred by increasing capital expenditures as a ratio to total assets (Figure 5), deployed mainly into its regulated businesses with a strong focus on transmission. Figure 5 AEP’s CAPEX/ Total Assets
Returns With strong capital spending in advance of revenue recognition, EBITDA/ Total Assets returns have declined from 9.4% in 2010 to 8.4% in 2014 (Figure 6). This trend appears to have flattened out.
-5.0%
0.0%
5.0%
10.0%
15.0%
20.0%
25.0%
30.0%
35.0%
40.0%
2010/09 2011/10 2012/11 2013/12 2014/13
AEP TSR Vs. Revenue Growth
TSR Annual Growth Revenue Annual Growth
4.0%
4.5%
5.0%
5.5%
6.0%
6.5%
7.0%
7.5%
0.0%
5.0%
10.0%
15.0%
20.0%
25.0%
30.0%
35.0%
40.0%
2010 2011 2012 2013 2014
Cap
ex/
Tota
l Ass
ets
(%)
TSR
Gro
wth
AEP TSR Vs. Capex/ Total Assets
TSR Annual Growth Capex/ Total Assets
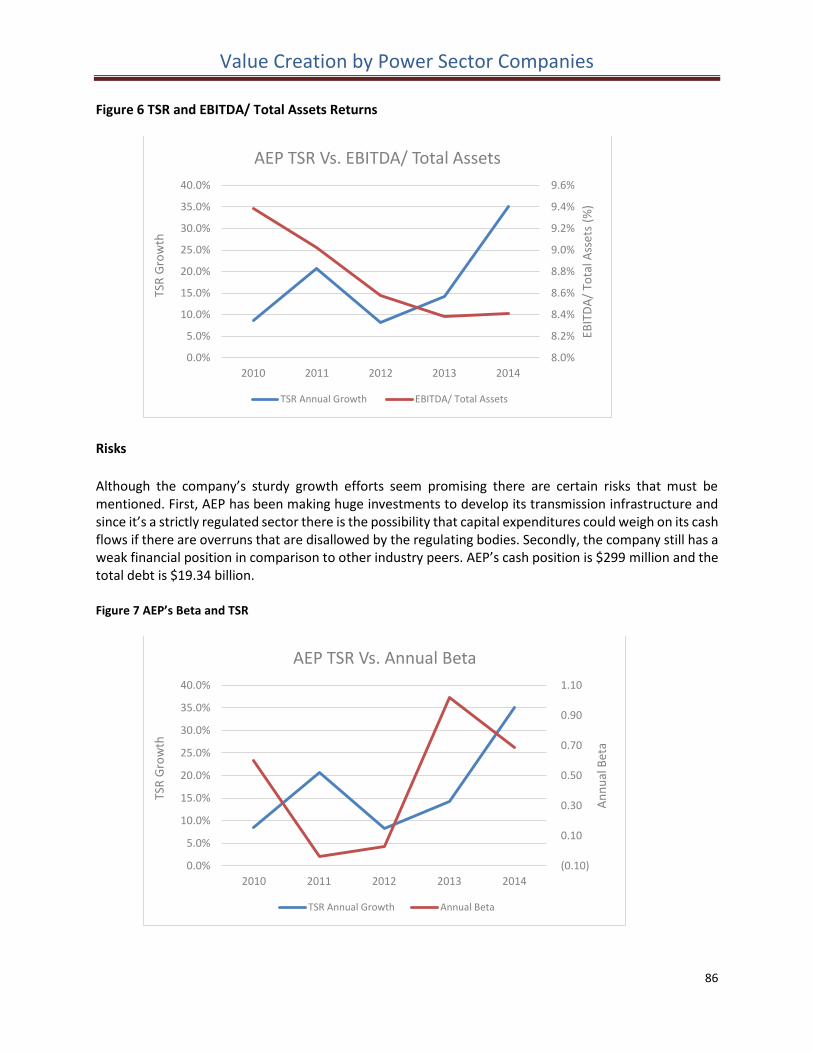
Value Creation by Power Sector Companies
86
Figure 6 TSR and EBITDA/ Total Assets Returns
Risks
Although the company’s sturdy growth efforts seem promising there are certain risks that must be mentioned. First, AEP has been making huge investments to develop its transmission infrastructure and since it’s a strictly regulated sector there is the possibility that capital expenditures could weigh on its cash flows if there are overruns that are disallowed by the regulating bodies. Secondly, the company still has a weak financial position in comparison to other industry peers. AEP’s cash position is $299 million and the total debt is $19.34 billion. Figure 7 AEP’s Beta and TSR
8.0%
8.2%
8.4%
8.6%
8.8%
9.0%
9.2%
9.4%
9.6%
0.0%
5.0%
10.0%
15.0%
20.0%
25.0%
30.0%
35.0%
40.0%
2010 2011 2012 2013 2014
EBIT
DA
/ To
tal A
sset
s (%
)
TSR
Gro
wth
AEP TSR Vs. EBITDA/ Total Assets
TSR Annual Growth EBITDA/ Total Assets
(0.10)
0.10
0.30
0.50
0.70
0.90
1.10
0.0%
5.0%
10.0%
15.0%
20.0%
25.0%
30.0%
35.0%
40.0%
2010 2011 2012 2013 2014
An
nu
al B
eta
TSR
Gro
wth
AEP TSR Vs. Annual Beta
TSR Annual Growth Annual Beta
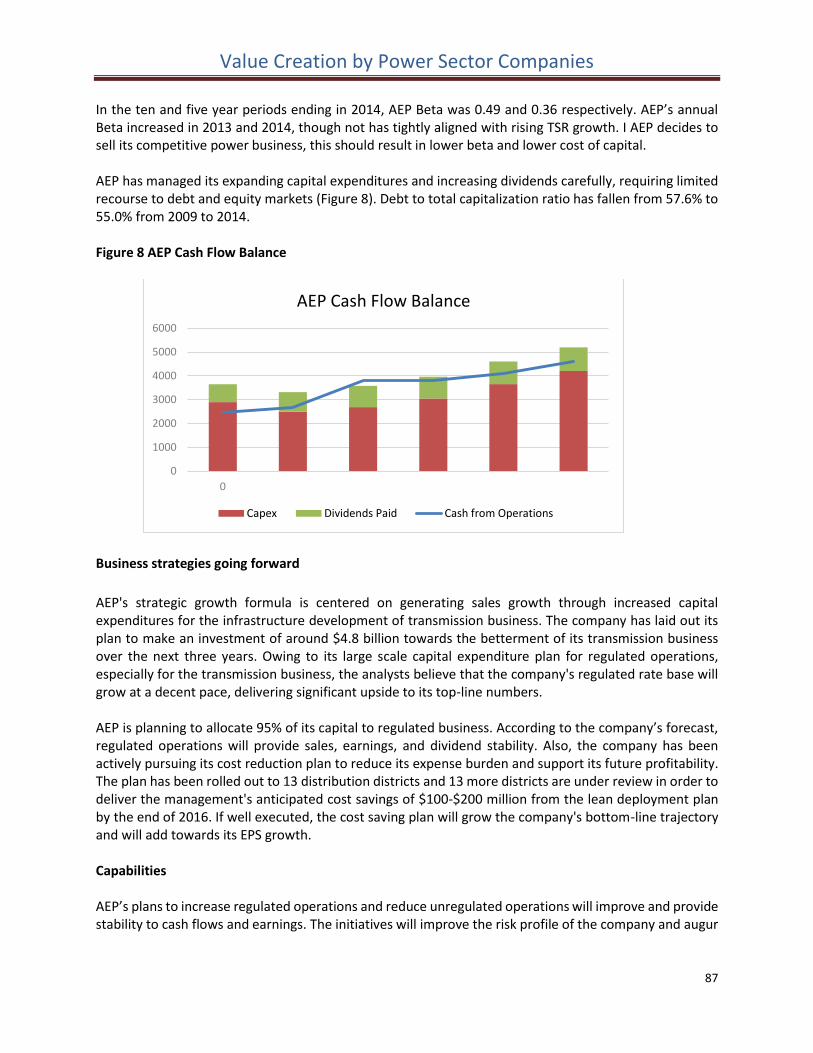
Value Creation by Power Sector Companies
87
In the ten and five year periods ending in 2014, AEP Beta was 0.49 and 0.36 respectively. AEP’s annual Beta increased in 2013 and 2014, though not has tightly aligned with rising TSR growth. I AEP decides to sell its competitive power business, this should result in lower beta and lower cost of capital. AEP has managed its expanding capital expenditures and increasing dividends carefully, requiring limited recourse to debt and equity markets (Figure 8). Debt to total capitalization ratio has fallen from 57.6% to 55.0% from 2009 to 2014. Figure 8 AEP Cash Flow Balance
Business strategies going forward
AEP's strategic growth formula is centered on generating sales growth through increased capital expenditures for the infrastructure development of transmission business. The company has laid out its plan to make an investment of around $4.8 billion towards the betterment of its transmission business over the next three years. Owing to its large scale capital expenditure plan for regulated operations, especially for the transmission business, the analysts believe that the company's regulated rate base will grow at a decent pace, delivering significant upside to its top-line numbers. AEP is planning to allocate 95% of its capital to regulated business. According to the company’s forecast, regulated operations will provide sales, earnings, and dividend stability. Also, the company has been actively pursuing its cost reduction plan to reduce its expense burden and support its future profitability. The plan has been rolled out to 13 distribution districts and 13 more districts are under review in order to deliver the management's anticipated cost savings of $100-$200 million from the lean deployment plan by the end of 2016. If well executed, the cost saving plan will grow the company's bottom-line trajectory and will add towards its EPS growth. Capabilities AEP’s plans to increase regulated operations and reduce unregulated operations will improve and provide stability to cash flows and earnings. The initiatives will improve the risk profile of the company and augur
0
1000
2000
3000
4000
5000
6000
0
AEP Cash Flow Balance
Capex Dividends Paid Cash from Operations
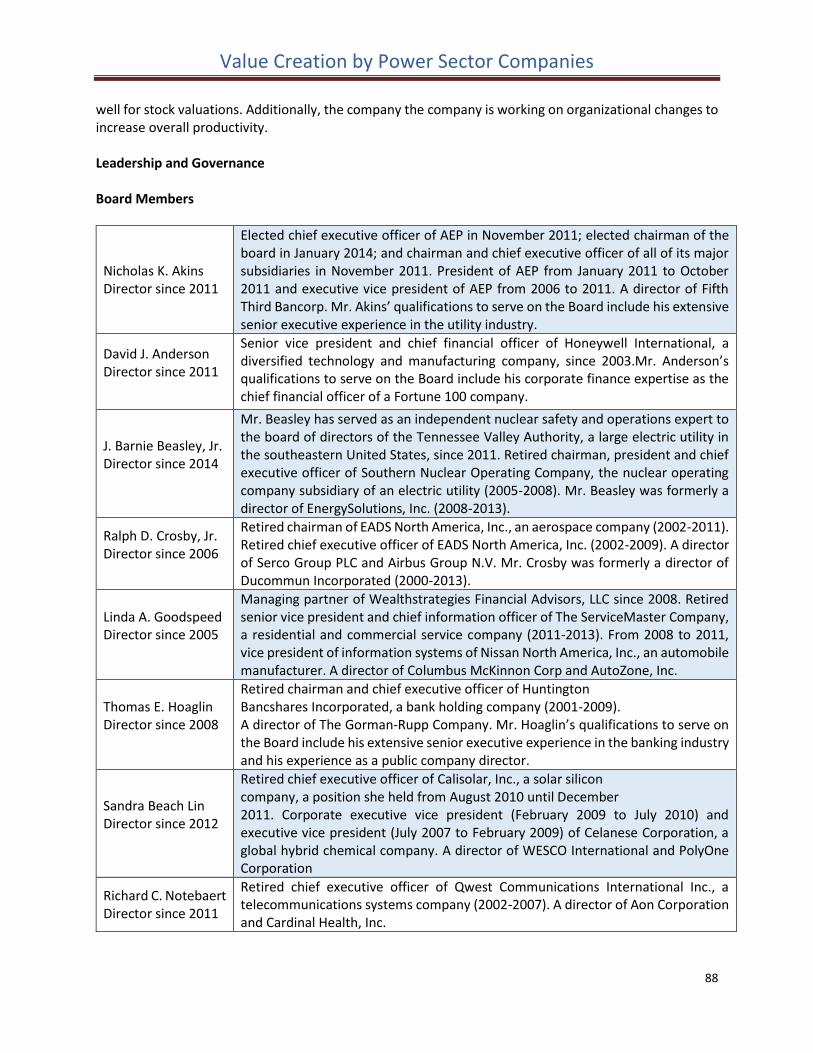
Value Creation by Power Sector Companies
88
well for stock valuations. Additionally, the company the company is working on organizational changes to increase overall productivity. Leadership and Governance Board Members
Nicholas K. Akins Director since 2011
Elected chief executive officer of AEP in November 2011; elected chairman of the board in January 2014; and chairman and chief executive officer of all of its major subsidiaries in November 2011. President of AEP from January 2011 to October 2011 and executive vice president of AEP from 2006 to 2011. A director of Fifth Third Bancorp. Mr. Akins’ qualifications to serve on the Board include his extensive senior executive experience in the utility industry.
David J. Anderson Director since 2011
Senior vice president and chief financial officer of Honeywell International, a diversified technology and manufacturing company, since 2003.Mr. Anderson’s qualifications to serve on the Board include his corporate finance expertise as the chief financial officer of a Fortune 100 company.
J. Barnie Beasley, Jr. Director since 2014
Mr. Beasley has served as an independent nuclear safety and operations expert to the board of directors of the Tennessee Valley Authority, a large electric utility in the southeastern United States, since 2011. Retired chairman, president and chief executive officer of Southern Nuclear Operating Company, the nuclear operating company subsidiary of an electric utility (2005-2008). Mr. Beasley was formerly a director of EnergySolutions, Inc. (2008-2013).
Ralph D. Crosby, Jr. Director since 2006
Retired chairman of EADS North America, Inc., an aerospace company (2002-2011). Retired chief executive officer of EADS North America, Inc. (2002-2009). A director of Serco Group PLC and Airbus Group N.V. Mr. Crosby was formerly a director of Ducommun Incorporated (2000-2013).
Linda A. Goodspeed Director since 2005
Managing partner of Wealthstrategies Financial Advisors, LLC since 2008. Retired senior vice president and chief information officer of The ServiceMaster Company, a residential and commercial service company (2011-2013). From 2008 to 2011, vice president of information systems of Nissan North America, Inc., an automobile manufacturer. A director of Columbus McKinnon Corp and AutoZone, Inc.
Thomas E. Hoaglin Director since 2008
Retired chairman and chief executive officer of Huntington Bancshares Incorporated, a bank holding company (2001-2009). A director of The Gorman-Rupp Company. Mr. Hoaglin’s qualifications to serve on the Board include his extensive senior executive experience in the banking industry and his experience as a public company director.
Sandra Beach Lin Director since 2012
Retired chief executive officer of Calisolar, Inc., a solar silicon company, a position she held from August 2010 until December 2011. Corporate executive vice president (February 2009 to July 2010) and executive vice president (July 2007 to February 2009) of Celanese Corporation, a global hybrid chemical company. A director of WESCO International and PolyOne Corporation
Richard C. Notebaert Director since 2011
Retired chief executive officer of Qwest Communications International Inc., a telecommunications systems company (2002-2007). A director of Aon Corporation and Cardinal Health, Inc.
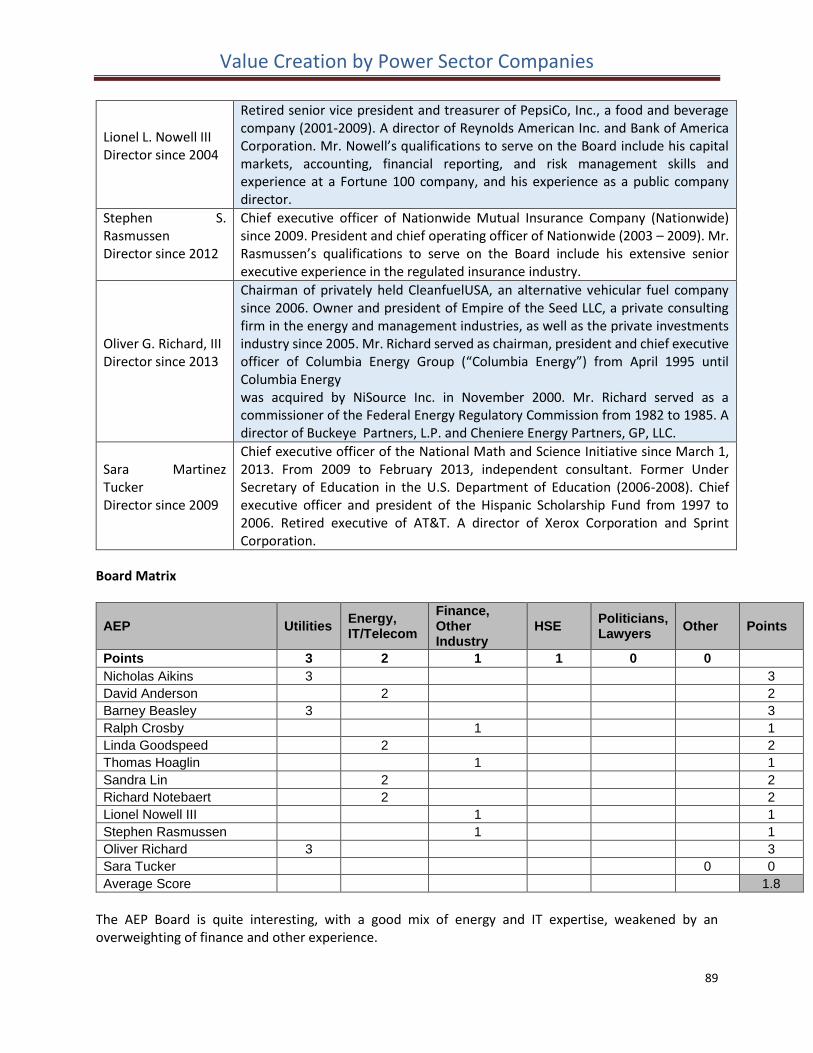
Value Creation by Power Sector Companies
89
Lionel L. Nowell III Director since 2004
Retired senior vice president and treasurer of PepsiCo, Inc., a food and beverage company (2001-2009). A director of Reynolds American Inc. and Bank of America Corporation. Mr. Nowell’s qualifications to serve on the Board include his capital markets, accounting, financial reporting, and risk management skills and experience at a Fortune 100 company, and his experience as a public company director.
Stephen S. Rasmussen Director since 2012
Chief executive officer of Nationwide Mutual Insurance Company (Nationwide) since 2009. President and chief operating officer of Nationwide (2003 – 2009). Mr. Rasmussen’s qualifications to serve on the Board include his extensive senior executive experience in the regulated insurance industry.
Oliver G. Richard, III Director since 2013
Chairman of privately held CleanfuelUSA, an alternative vehicular fuel company since 2006. Owner and president of Empire of the Seed LLC, a private consulting firm in the energy and management industries, as well as the private investments industry since 2005. Mr. Richard served as chairman, president and chief executive officer of Columbia Energy Group (“Columbia Energy”) from April 1995 until Columbia Energy was acquired by NiSource Inc. in November 2000. Mr. Richard served as a commissioner of the Federal Energy Regulatory Commission from 1982 to 1985. A director of Buckeye Partners, L.P. and Cheniere Energy Partners, GP, LLC.
Sara Martinez Tucker Director since 2009
Chief executive officer of the National Math and Science Initiative since March 1, 2013. From 2009 to February 2013, independent consultant. Former Under Secretary of Education in the U.S. Department of Education (2006-2008). Chief executive officer and president of the Hispanic Scholarship Fund from 1997 to 2006. Retired executive of AT&T. A director of Xerox Corporation and Sprint Corporation.
Board Matrix
AEP Utilities Energy, IT/Telecom
Finance, Other Industry
HSE Politicians, Lawyers
Other Points
Points 3 2 1 1 0 0
Nicholas Aikins 3 3
David Anderson 2 2
Barney Beasley 3 3
Ralph Crosby 1 1
Linda Goodspeed 2 2
Thomas Hoaglin 1 1
Sandra Lin 2 2
Richard Notebaert 2 2
Lionel Nowell III 1 1
Stephen Rasmussen 1 1
Oliver Richard 3 3
Sara Tucker 0 0
Average Score 1.8
The AEP Board is quite interesting, with a good mix of energy and IT expertise, weakened by an overweighting of finance and other experience.

Value Creation by Power Sector Companies
90
Valuation AEP Enterprise Value at the end of 2014 was $50.0 Billion; our standard model calculates an Intrinsic Value of $50.7 Billion, suggesting that AEP is fairly valued.
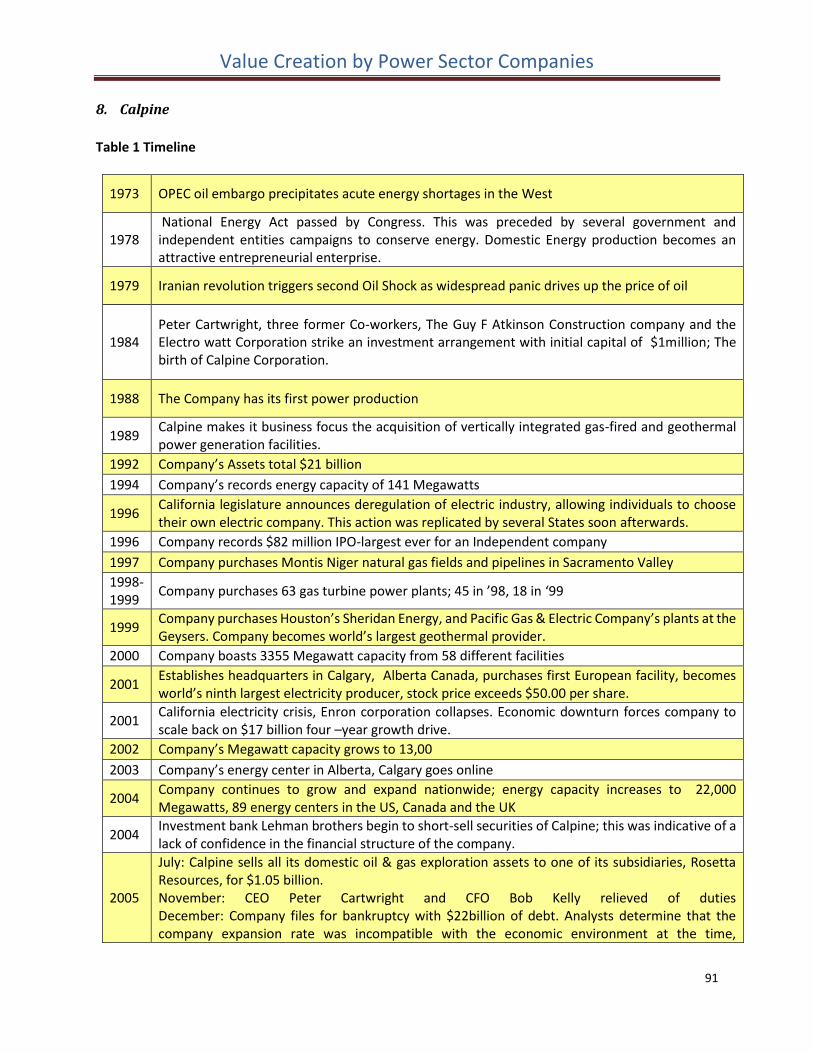
Value Creation by Power Sector Companies
91
8. Calpine
Table 1 Timeline
1973 OPEC oil embargo precipitates acute energy shortages in the West
1978 National Energy Act passed by Congress. This was preceded by several government and independent entities campaigns to conserve energy. Domestic Energy production becomes an attractive entrepreneurial enterprise.
1979 Iranian revolution triggers second Oil Shock as widespread panic drives up the price of oil
1984 Peter Cartwright, three former Co-workers, The Guy F Atkinson Construction company and the Electro watt Corporation strike an investment arrangement with initial capital of $1million; The birth of Calpine Corporation.
1988 The Company has its first power production
1989 Calpine makes it business focus the acquisition of vertically integrated gas-fired and geothermal power generation facilities.
1992 Company’s Assets total $21 billion
1994 Company’s records energy capacity of 141 Megawatts
1996 California legislature announces deregulation of electric industry, allowing individuals to choose their own electric company. This action was replicated by several States soon afterwards.
1996 Company records $82 million IPO-largest ever for an Independent company
1997 Company purchases Montis Niger natural gas fields and pipelines in Sacramento Valley
1998-1999
Company purchases 63 gas turbine power plants; 45 in ’98, 18 in ‘99
1999 Company purchases Houston’s Sheridan Energy, and Pacific Gas & Electric Company’s plants at the Geysers. Company becomes world’s largest geothermal provider.
2000 Company boasts 3355 Megawatt capacity from 58 different facilities
2001 Establishes headquarters in Calgary, Alberta Canada, purchases first European facility, becomes world’s ninth largest electricity producer, stock price exceeds $50.00 per share.
2001 California electricity crisis, Enron corporation collapses. Economic downturn forces company to scale back on $17 billion four –year growth drive.
2002 Company’s Megawatt capacity grows to 13,00
2003 Company’s energy center in Alberta, Calgary goes online
2004 Company continues to grow and expand nationwide; energy capacity increases to 22,000 Megawatts, 89 energy centers in the US, Canada and the UK
2004 Investment bank Lehman brothers begin to short-sell securities of Calpine; this was indicative of a lack of confidence in the financial structure of the company.
2005
July: Calpine sells all its domestic oil & gas exploration assets to one of its subsidiaries, Rosetta Resources, for $1.05 billion. November: CEO Peter Cartwright and CFO Bob Kelly relieved of duties December: Company files for bankruptcy with $22billion of debt. Analysts determine that the company expansion rate was incompatible with the economic environment at the time,
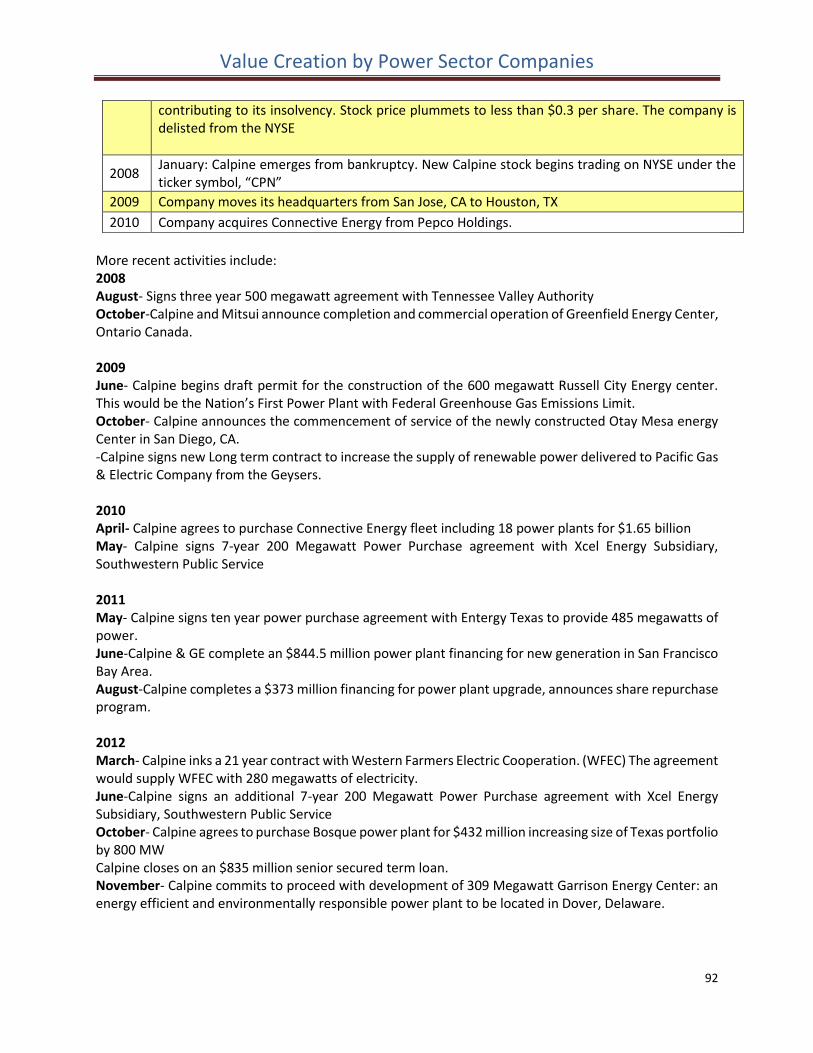
Value Creation by Power Sector Companies
92
contributing to its insolvency. Stock price plummets to less than $0.3 per share. The company is delisted from the NYSE
2008 January: Calpine emerges from bankruptcy. New Calpine stock begins trading on NYSE under the ticker symbol, “CPN”
2009 Company moves its headquarters from San Jose, CA to Houston, TX
2010 Company acquires Connective Energy from Pepco Holdings.
More recent activities include: 2008 August- Signs three year 500 megawatt agreement with Tennessee Valley Authority October-Calpine and Mitsui announce completion and commercial operation of Greenfield Energy Center, Ontario Canada. 2009 June- Calpine begins draft permit for the construction of the 600 megawatt Russell City Energy center. This would be the Nation’s First Power Plant with Federal Greenhouse Gas Emissions Limit. October- Calpine announces the commencement of service of the newly constructed Otay Mesa energy Center in San Diego, CA. -Calpine signs new Long term contract to increase the supply of renewable power delivered to Pacific Gas & Electric Company from the Geysers. 2010 April- Calpine agrees to purchase Connective Energy fleet including 18 power plants for $1.65 billion May- Calpine signs 7-year 200 Megawatt Power Purchase agreement with Xcel Energy Subsidiary, Southwestern Public Service 2011 May- Calpine signs ten year power purchase agreement with Entergy Texas to provide 485 megawatts of power. June-Calpine & GE complete an $844.5 million power plant financing for new generation in San Francisco Bay Area. August-Calpine completes a $373 million financing for power plant upgrade, announces share repurchase program. 2012 March- Calpine inks a 21 year contract with Western Farmers Electric Cooperation. (WFEC) The agreement would supply WFEC with 280 megawatts of electricity. June-Calpine signs an additional 7-year 200 Megawatt Power Purchase agreement with Xcel Energy Subsidiary, Southwestern Public Service October- Calpine agrees to purchase Bosque power plant for $432 million increasing size of Texas portfolio by 800 MW Calpine closes on an $835 million senior secured term loan. November- Calpine commits to proceed with development of 309 Megawatt Garrison Energy Center: an energy efficient and environmentally responsible power plant to be located in Dover, Delaware.
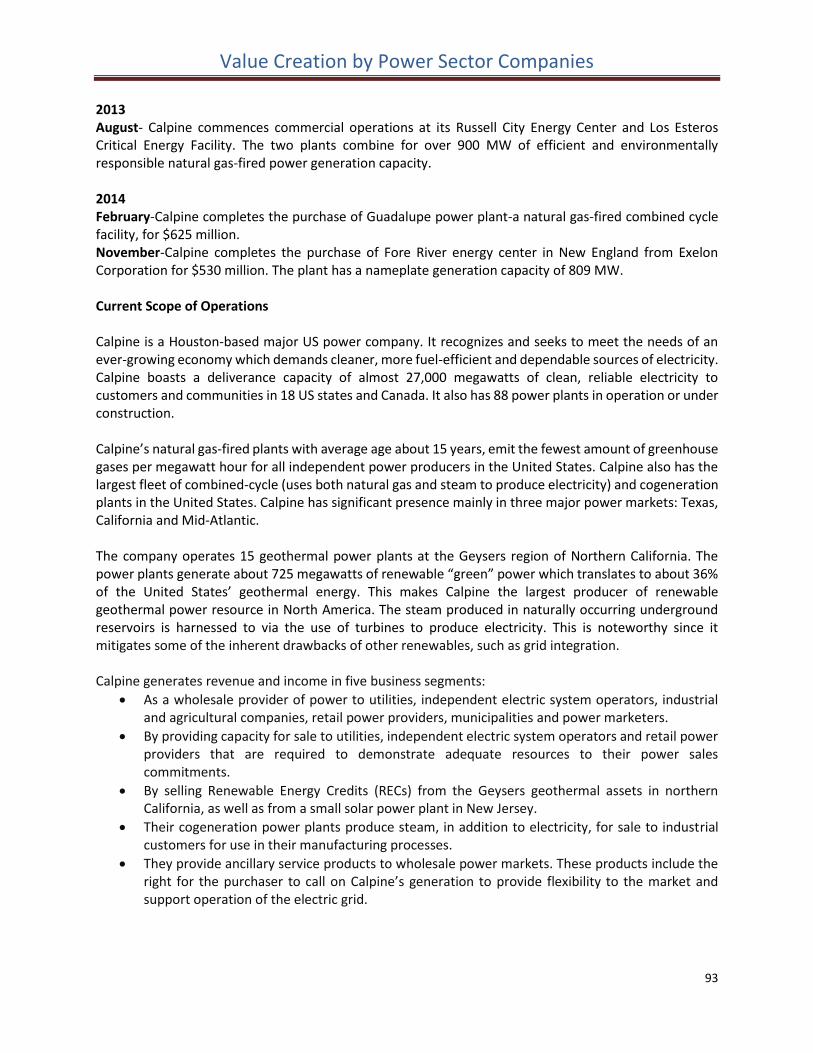
Value Creation by Power Sector Companies
93
2013 August- Calpine commences commercial operations at its Russell City Energy Center and Los Esteros Critical Energy Facility. The two plants combine for over 900 MW of efficient and environmentally responsible natural gas-fired power generation capacity. 2014 February-Calpine completes the purchase of Guadalupe power plant-a natural gas-fired combined cycle facility, for $625 million. November-Calpine completes the purchase of Fore River energy center in New England from Exelon Corporation for $530 million. The plant has a nameplate generation capacity of 809 MW. Current Scope of Operations Calpine is a Houston-based major US power company. It recognizes and seeks to meet the needs of an ever-growing economy which demands cleaner, more fuel-efficient and dependable sources of electricity. Calpine boasts a deliverance capacity of almost 27,000 megawatts of clean, reliable electricity to customers and communities in 18 US states and Canada. It also has 88 power plants in operation or under construction. Calpine’s natural gas-fired plants with average age about 15 years, emit the fewest amount of greenhouse gases per megawatt hour for all independent power producers in the United States. Calpine also has the largest fleet of combined-cycle (uses both natural gas and steam to produce electricity) and cogeneration plants in the United States. Calpine has significant presence mainly in three major power markets: Texas, California and Mid-Atlantic. The company operates 15 geothermal power plants at the Geysers region of Northern California. The power plants generate about 725 megawatts of renewable “green” power which translates to about 36% of the United States’ geothermal energy. This makes Calpine the largest producer of renewable geothermal power resource in North America. The steam produced in naturally occurring underground reservoirs is harnessed to via the use of turbines to produce electricity. This is noteworthy since it mitigates some of the inherent drawbacks of other renewables, such as grid integration. Calpine generates revenue and income in five business segments:
As a wholesale provider of power to utilities, independent electric system operators, industrial and agricultural companies, retail power providers, municipalities and power marketers.
By providing capacity for sale to utilities, independent electric system operators and retail power providers that are required to demonstrate adequate resources to their power sales commitments.
By selling Renewable Energy Credits (RECs) from the Geysers geothermal assets in northern California, as well as from a small solar power plant in New Jersey.
Their cogeneration power plants produce steam, in addition to electricity, for sale to industrial customers for use in their manufacturing processes.
They provide ancillary service products to wholesale power markets. These products include the right for the purchaser to call on Calpine’s generation to provide flexibility to the market and support operation of the electric grid.
Value Creation by Power Sector Companies
94
The most important segments are sales of wholesale power and capacity. Calpine has developed a business model adapted to deregulated energy markets as outlined in the company’s 10K: “We utilize long-term customer contracts for our power and steam sales where possible. For
power and capacity that are not sold under customer contracts or longer-dated capacity auctions, we use our hedging program and sell power into shorter term wholesale markets throughout the regions in which we participate. When selling power from our natural gas-fired fleet into the short-term or spot markets, we attempt to maximize our operations when the market Spark Spread is positive. Assuming rational economic behavior by market participants, generating units generally are dispatched in order of their variable costs, with lower cost units being dispatched first and units with higher costs dispatched as demand, or “load,” grows beyond the capacity of the lower cost units. For this reason, in a competitive market, the price of power typically is related to the variable operating costs of the marginal generator, which is the last unit to be dispatched in order to meet demand.”
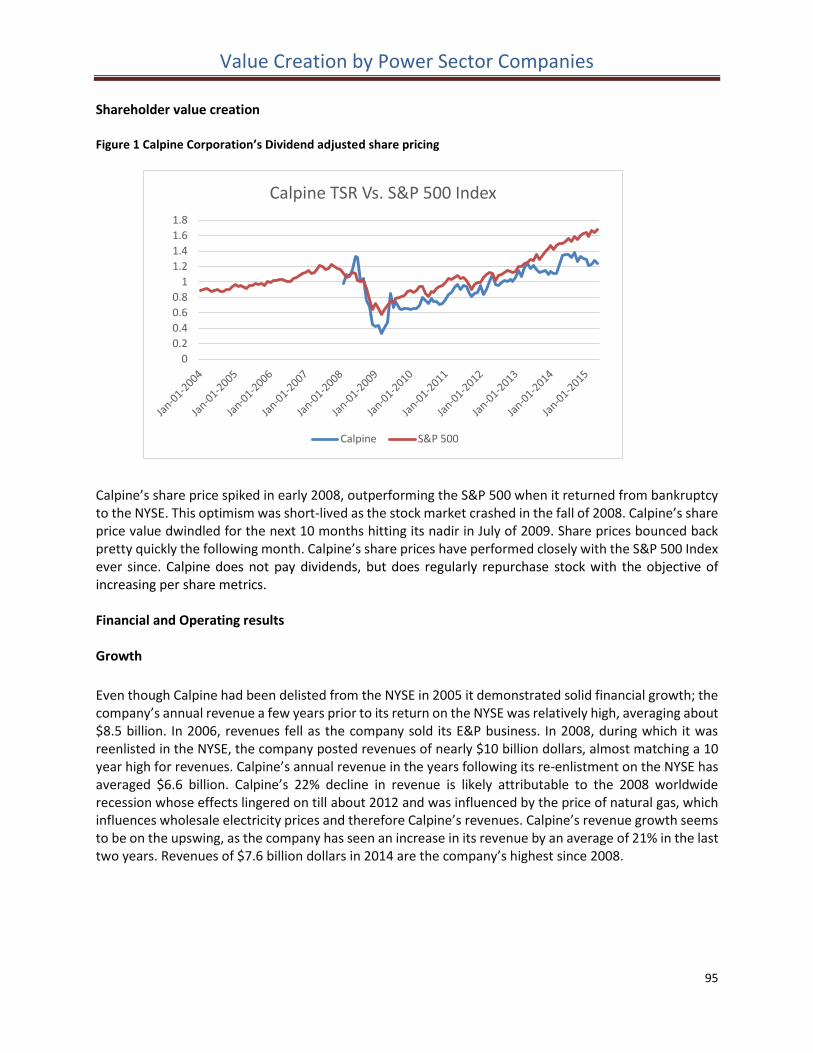
Value Creation by Power Sector Companies
95
Shareholder value creation Figure 1 Calpine Corporation’s Dividend adjusted share pricing
Calpine’s share price spiked in early 2008, outperforming the S&P 500 when it returned from bankruptcy to the NYSE. This optimism was short-lived as the stock market crashed in the fall of 2008. Calpine’s share price value dwindled for the next 10 months hitting its nadir in July of 2009. Share prices bounced back pretty quickly the following month. Calpine’s share prices have performed closely with the S&P 500 Index ever since. Calpine does not pay dividends, but does regularly repurchase stock with the objective of increasing per share metrics. Financial and Operating results Growth
Even though Calpine had been delisted from the NYSE in 2005 it demonstrated solid financial growth; the company’s annual revenue a few years prior to its return on the NYSE was relatively high, averaging about $8.5 billion. In 2006, revenues fell as the company sold its E&P business. In 2008, during which it was reenlisted in the NYSE, the company posted revenues of nearly $10 billion dollars, almost matching a 10 year high for revenues. Calpine’s annual revenue in the years following its re-enlistment on the NYSE has averaged $6.6 billion. Calpine’s 22% decline in revenue is likely attributable to the 2008 worldwide recession whose effects lingered on till about 2012 and was influenced by the price of natural gas, which influences wholesale electricity prices and therefore Calpine’s revenues. Calpine’s revenue growth seems to be on the upswing, as the company has seen an increase in its revenue by an average of 21% in the last two years. Revenues of $7.6 billion dollars in 2014 are the company’s highest since 2008.
0
0.2
0.4
0.6
0.8
1
1.2
1.4
1.6
1.8
Calpine TSR Vs. S&P 500 Index
Calpine S&P 500
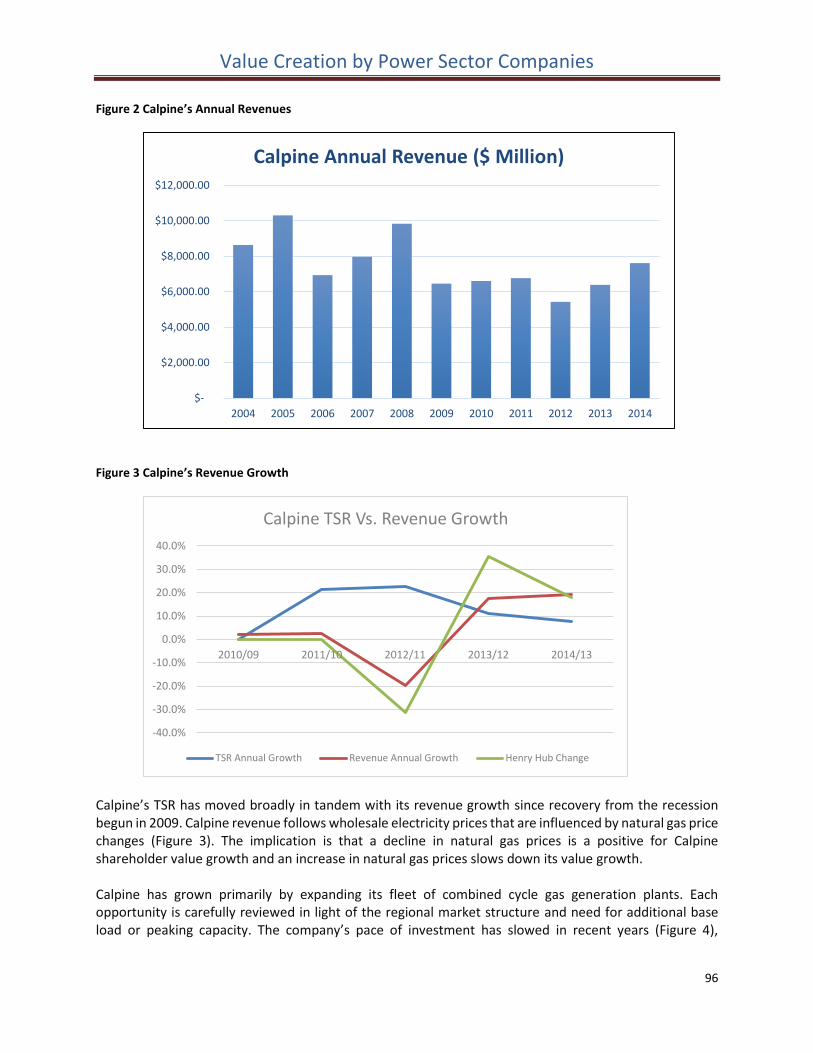
Value Creation by Power Sector Companies
96
Figure 2 Calpine’s Annual Revenues
Figure 3 Calpine’s Revenue Growth
Calpine’s TSR has moved broadly in tandem with its revenue growth since recovery from the recession begun in 2009. Calpine revenue follows wholesale electricity prices that are influenced by natural gas price changes (Figure 3). The implication is that a decline in natural gas prices is a positive for Calpine shareholder value growth and an increase in natural gas prices slows down its value growth. Calpine has grown primarily by expanding its fleet of combined cycle gas generation plants. Each opportunity is carefully reviewed in light of the regional market structure and need for additional base load or peaking capacity. The company’s pace of investment has slowed in recent years (Figure 4),
$-
$2,000.00
$4,000.00
$6,000.00
$8,000.00
$10,000.00
$12,000.00
2004 2005 2006 2007 2008 2009 2010 2011 2012 2013 2014
Calpine Annual Revenue ($ Million)
-40.0%
-30.0%
-20.0%
-10.0%
0.0%
10.0%
20.0%
30.0%
40.0%
2010/09 2011/10 2012/11 2013/12 2014/13
Calpine TSR Vs. Revenue Growth
TSR Annual Growth Revenue Annual Growth Henry Hub Change
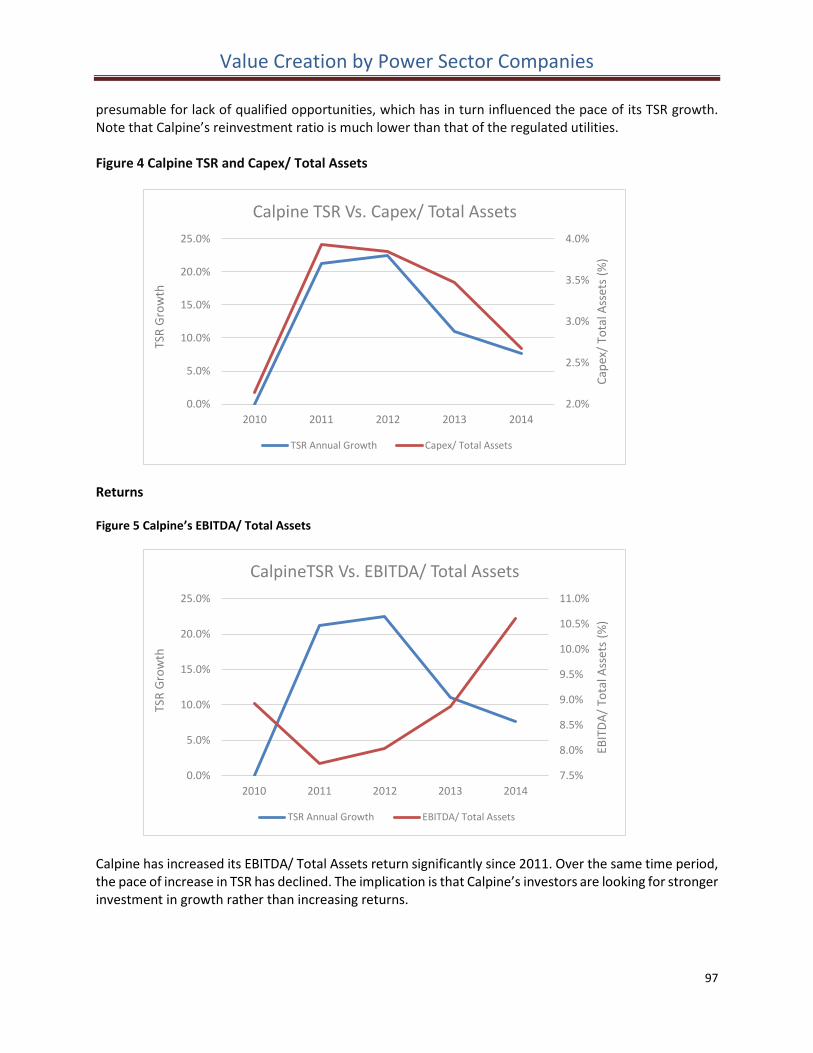
Value Creation by Power Sector Companies
97
presumable for lack of qualified opportunities, which has in turn influenced the pace of its TSR growth. Note that Calpine’s reinvestment ratio is much lower than that of the regulated utilities. Figure 4 Calpine TSR and Capex/ Total Assets
Returns Figure 5 Calpine’s EBITDA/ Total Assets
Calpine has increased its EBITDA/ Total Assets return significantly since 2011. Over the same time period, the pace of increase in TSR has declined. The implication is that Calpine’s investors are looking for stronger investment in growth rather than increasing returns.
2.0%
2.5%
3.0%
3.5%
4.0%
0.0%
5.0%
10.0%
15.0%
20.0%
25.0%
2010 2011 2012 2013 2014
Cap
ex/
Tota
l Ass
ets
(%)
TSR
Gro
wth
Calpine TSR Vs. Capex/ Total Assets
TSR Annual Growth Capex/ Total Assets
7.5%
8.0%
8.5%
9.0%
9.5%
10.0%
10.5%
11.0%
0.0%
5.0%
10.0%
15.0%
20.0%
25.0%
2010 2011 2012 2013 2014
EBIT
DA
/ To
tal A
sset
s (%
)
TSR
Gro
wth
CalpineTSR Vs. EBITDA/ Total Assets
TSR Annual Growth EBITDA/ Total Assets
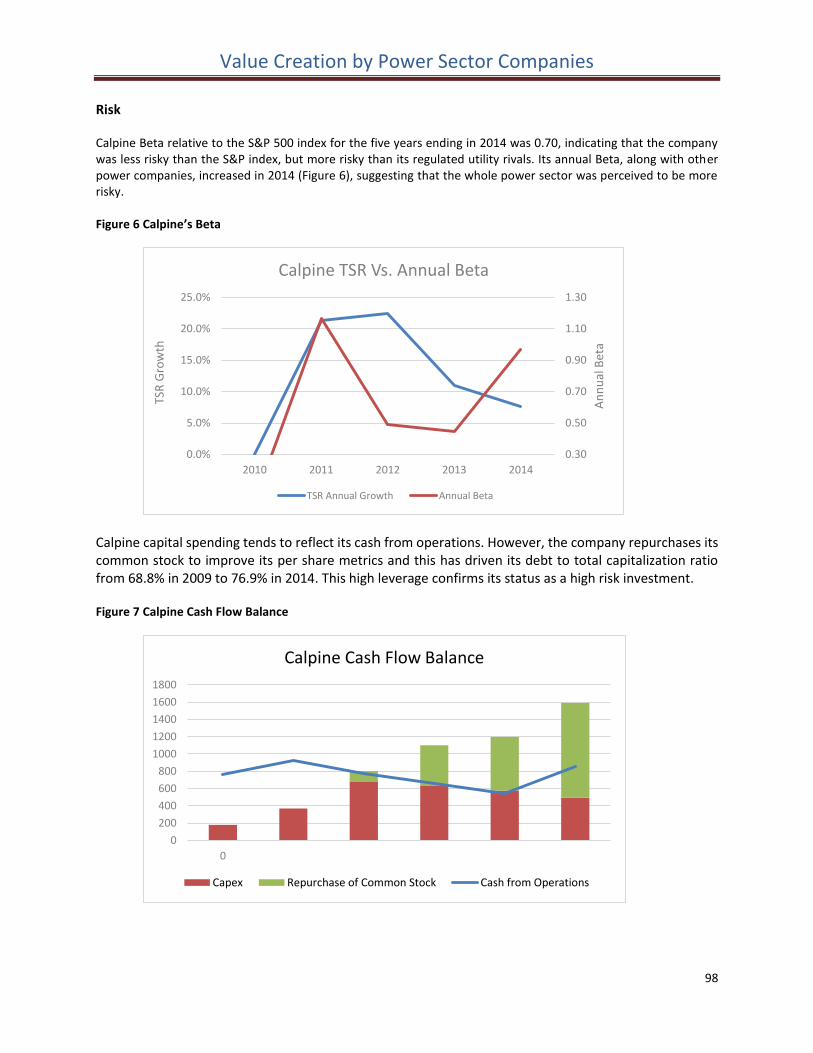
Value Creation by Power Sector Companies
98
Risk Calpine Beta relative to the S&P 500 index for the five years ending in 2014 was 0.70, indicating that the company was less risky than the S&P index, but more risky than its regulated utility rivals. Its annual Beta, along with other power companies, increased in 2014 (Figure 6), suggesting that the whole power sector was perceived to be more risky. Figure 6 Calpine’s Beta
Calpine capital spending tends to reflect its cash from operations. However, the company repurchases its common stock to improve its per share metrics and this has driven its debt to total capitalization ratio from 68.8% in 2009 to 76.9% in 2014. This high leverage confirms its status as a high risk investment. Figure 7 Calpine Cash Flow Balance
0.30
0.50
0.70
0.90
1.10
1.30
0.0%
5.0%
10.0%
15.0%
20.0%
25.0%
2010 2011 2012 2013 2014
An
nu
al B
eta
TSR
Gro
wth
Calpine TSR Vs. Annual Beta
TSR Annual Growth Annual Beta
0
200
400
600
800
1000
1200
1400
1600
1800
0
Calpine Cash Flow Balance
Capex Repurchase of Common Stock Cash from Operations
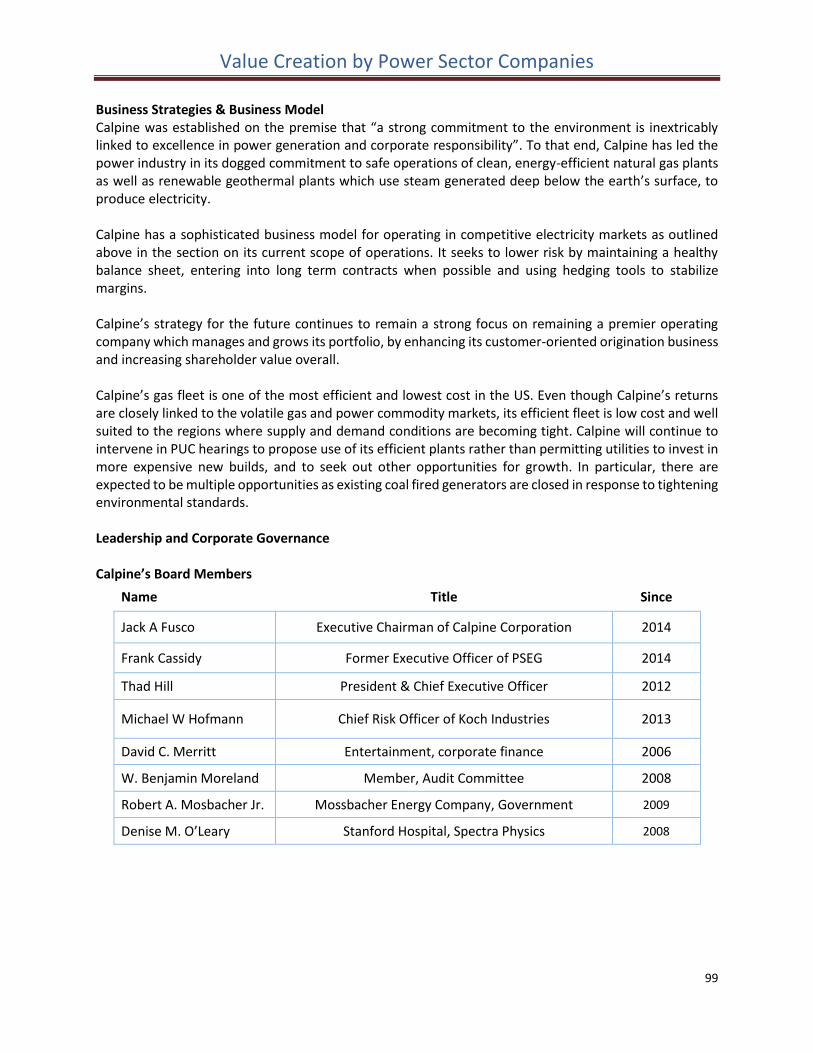
Value Creation by Power Sector Companies
99
Business Strategies & Business Model Calpine was established on the premise that “a strong commitment to the environment is inextricably linked to excellence in power generation and corporate responsibility”. To that end, Calpine has led the power industry in its dogged commitment to safe operations of clean, energy-efficient natural gas plants as well as renewable geothermal plants which use steam generated deep below the earth’s surface, to produce electricity. Calpine has a sophisticated business model for operating in competitive electricity markets as outlined above in the section on its current scope of operations. It seeks to lower risk by maintaining a healthy balance sheet, entering into long term contracts when possible and using hedging tools to stabilize margins. Calpine’s strategy for the future continues to remain a strong focus on remaining a premier operating company which manages and grows its portfolio, by enhancing its customer-oriented origination business and increasing shareholder value overall. Calpine’s gas fleet is one of the most efficient and lowest cost in the US. Even though Calpine’s returns are closely linked to the volatile gas and power commodity markets, its efficient fleet is low cost and well suited to the regions where supply and demand conditions are becoming tight. Calpine will continue to intervene in PUC hearings to propose use of its efficient plants rather than permitting utilities to invest in more expensive new builds, and to seek out other opportunities for growth. In particular, there are expected to be multiple opportunities as existing coal fired generators are closed in response to tightening environmental standards. Leadership and Corporate Governance Calpine’s Board Members
Name Title Since
Jack A Fusco Executive Chairman of Calpine Corporation 2014
Frank Cassidy Former Executive Officer of PSEG 2014
Thad Hill President & Chief Executive Officer 2012
Michael W Hofmann Chief Risk Officer of Koch Industries 2013
David C. Merritt Entertainment, corporate finance 2006
W. Benjamin Moreland Member, Audit Committee 2008
Robert A. Mosbacher Jr. Mossbacher Energy Company, Government 2009
Denise M. O’Leary Stanford Hospital, Spectra Physics 2008
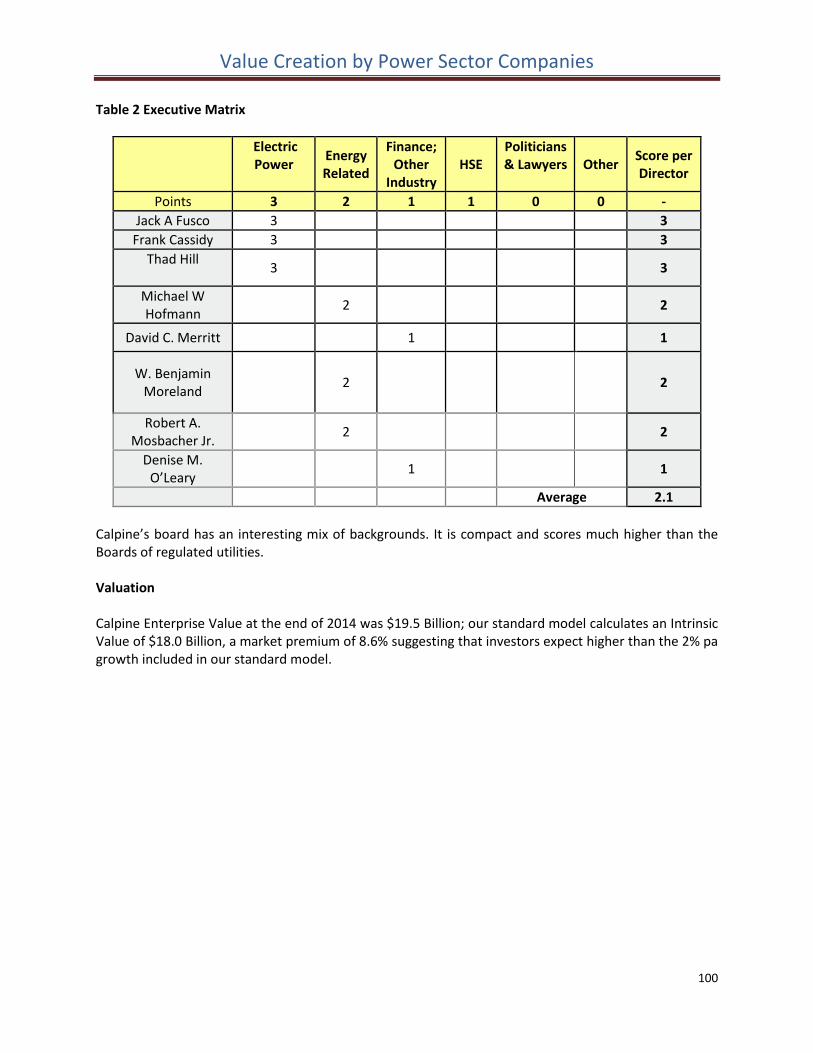
Value Creation by Power Sector Companies
100
Table 2 Executive Matrix
Electric Power
Energy Related
Finance; Other
Industry HSE
Politicians & Lawyers Other
Score per Director
Points 3 2 1 1 0 0 -
Jack A Fusco 3 3
Frank Cassidy 3 3
Thad Hill 3
3
Michael W Hofmann
2 2
David C. Merritt 1 1
W. Benjamin Moreland
2 2
Robert A. Mosbacher Jr.
2 2
Denise M. O’Leary
1 1
Average 2.1
Calpine’s board has an interesting mix of backgrounds. It is compact and scores much higher than the Boards of regulated utilities. Valuation Calpine Enterprise Value at the end of 2014 was $19.5 Billion; our standard model calculates an Intrinsic Value of $18.0 Billion, a market premium of 8.6% suggesting that investors expect higher than the 2% pa growth included in our standard model.
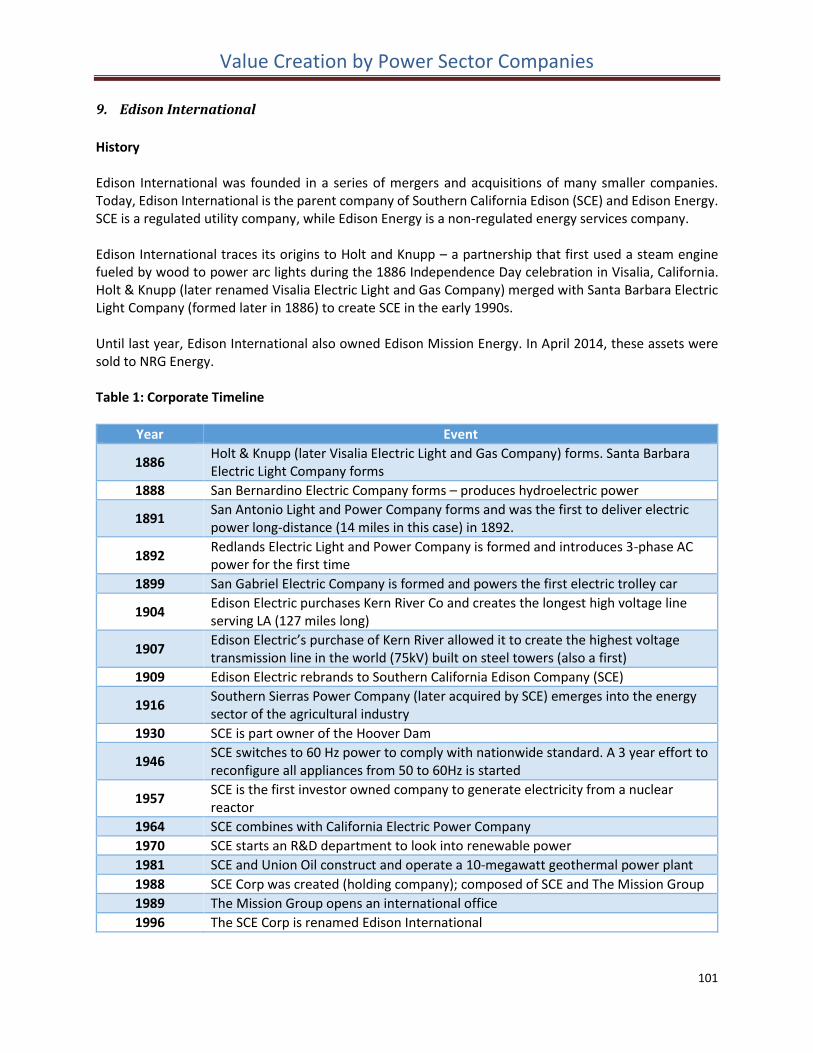
Value Creation by Power Sector Companies
101
9. Edison International
History Edison International was founded in a series of mergers and acquisitions of many smaller companies. Today, Edison International is the parent company of Southern California Edison (SCE) and Edison Energy. SCE is a regulated utility company, while Edison Energy is a non-regulated energy services company. Edison International traces its origins to Holt and Knupp – a partnership that first used a steam engine fueled by wood to power arc lights during the 1886 Independence Day celebration in Visalia, California. Holt & Knupp (later renamed Visalia Electric Light and Gas Company) merged with Santa Barbara Electric Light Company (formed later in 1886) to create SCE in the early 1990s. Until last year, Edison International also owned Edison Mission Energy. In April 2014, these assets were sold to NRG Energy. Table 1: Corporate Timeline
Year Event
1886 Holt & Knupp (later Visalia Electric Light and Gas Company) forms. Santa Barbara Electric Light Company forms
1888 San Bernardino Electric Company forms – produces hydroelectric power
1891 San Antonio Light and Power Company forms and was the first to deliver electric power long-distance (14 miles in this case) in 1892.
1892 Redlands Electric Light and Power Company is formed and introduces 3-phase AC power for the first time
1899 San Gabriel Electric Company is formed and powers the first electric trolley car
1904 Edison Electric purchases Kern River Co and creates the longest high voltage line serving LA (127 miles long)
1907 Edison Electric’s purchase of Kern River allowed it to create the highest voltage transmission line in the world (75kV) built on steel towers (also a first)
1909 Edison Electric rebrands to Southern California Edison Company (SCE)
1916 Southern Sierras Power Company (later acquired by SCE) emerges into the energy sector of the agricultural industry
1930 SCE is part owner of the Hoover Dam
1946 SCE switches to 60 Hz power to comply with nationwide standard. A 3 year effort to reconfigure all appliances from 50 to 60Hz is started
1957 SCE is the first investor owned company to generate electricity from a nuclear reactor
1964 SCE combines with California Electric Power Company
1970 SCE starts an R&D department to look into renewable power
1981 SCE and Union Oil construct and operate a 10-megawatt geothermal power plant
1988 SCE Corp was created (holding company); composed of SCE and The Mission Group
1989 The Mission Group opens an international office
1996 The SCE Corp is renamed Edison International
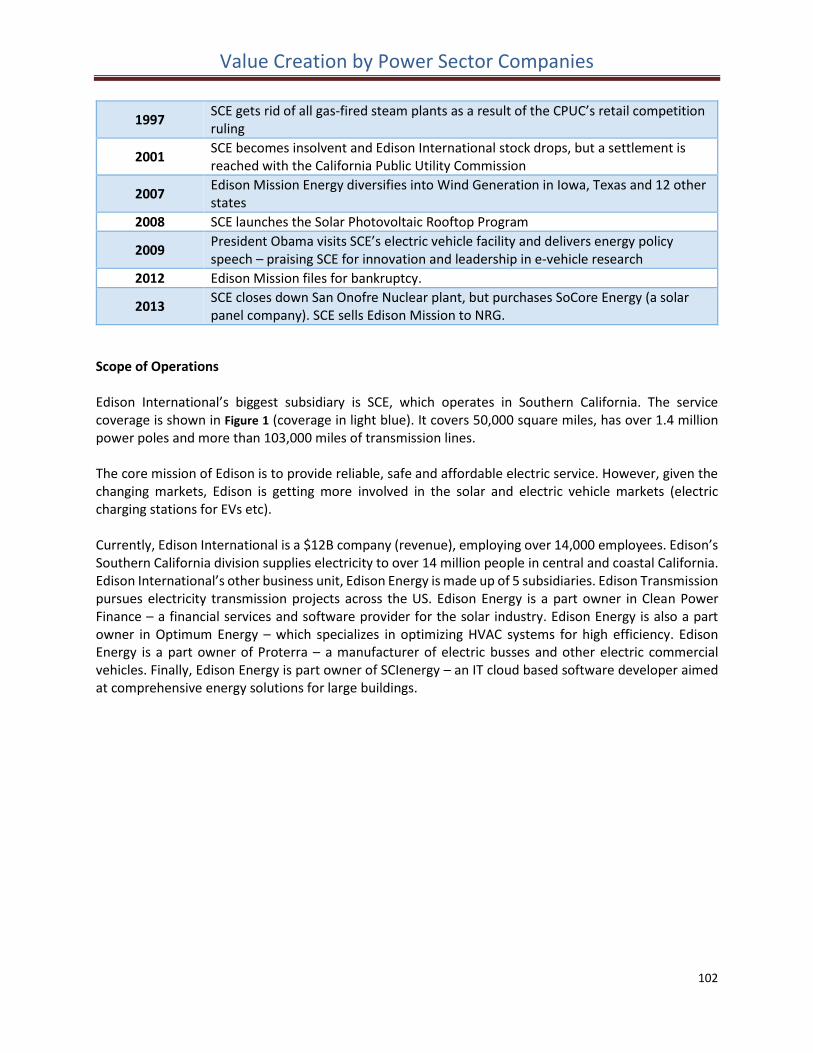
Value Creation by Power Sector Companies
102
1997 SCE gets rid of all gas-fired steam plants as a result of the CPUC’s retail competition ruling
2001 SCE becomes insolvent and Edison International stock drops, but a settlement is reached with the California Public Utility Commission
2007 Edison Mission Energy diversifies into Wind Generation in Iowa, Texas and 12 other states
2008 SCE launches the Solar Photovoltaic Rooftop Program
2009 President Obama visits SCE’s electric vehicle facility and delivers energy policy speech – praising SCE for innovation and leadership in e-vehicle research
2012 Edison Mission files for bankruptcy.
2013 SCE closes down San Onofre Nuclear plant, but purchases SoCore Energy (a solar panel company). SCE sells Edison Mission to NRG.
Scope of Operations Edison International’s biggest subsidiary is SCE, which operates in Southern California. The service coverage is shown in Figure 1 (coverage in light blue). It covers 50,000 square miles, has over 1.4 million power poles and more than 103,000 miles of transmission lines. The core mission of Edison is to provide reliable, safe and affordable electric service. However, given the changing markets, Edison is getting more involved in the solar and electric vehicle markets (electric charging stations for EVs etc). Currently, Edison International is a $12B company (revenue), employing over 14,000 employees. Edison’s Southern California division supplies electricity to over 14 million people in central and coastal California. Edison International’s other business unit, Edison Energy is made up of 5 subsidiaries. Edison Transmission pursues electricity transmission projects across the US. Edison Energy is a part owner in Clean Power Finance – a financial services and software provider for the solar industry. Edison Energy is also a part owner in Optimum Energy – which specializes in optimizing HVAC systems for high efficiency. Edison Energy is a part owner of Proterra – a manufacturer of electric busses and other electric commercial vehicles. Finally, Edison Energy is part owner of SCIenergy – an IT cloud based software developer aimed at comprehensive energy solutions for large buildings.
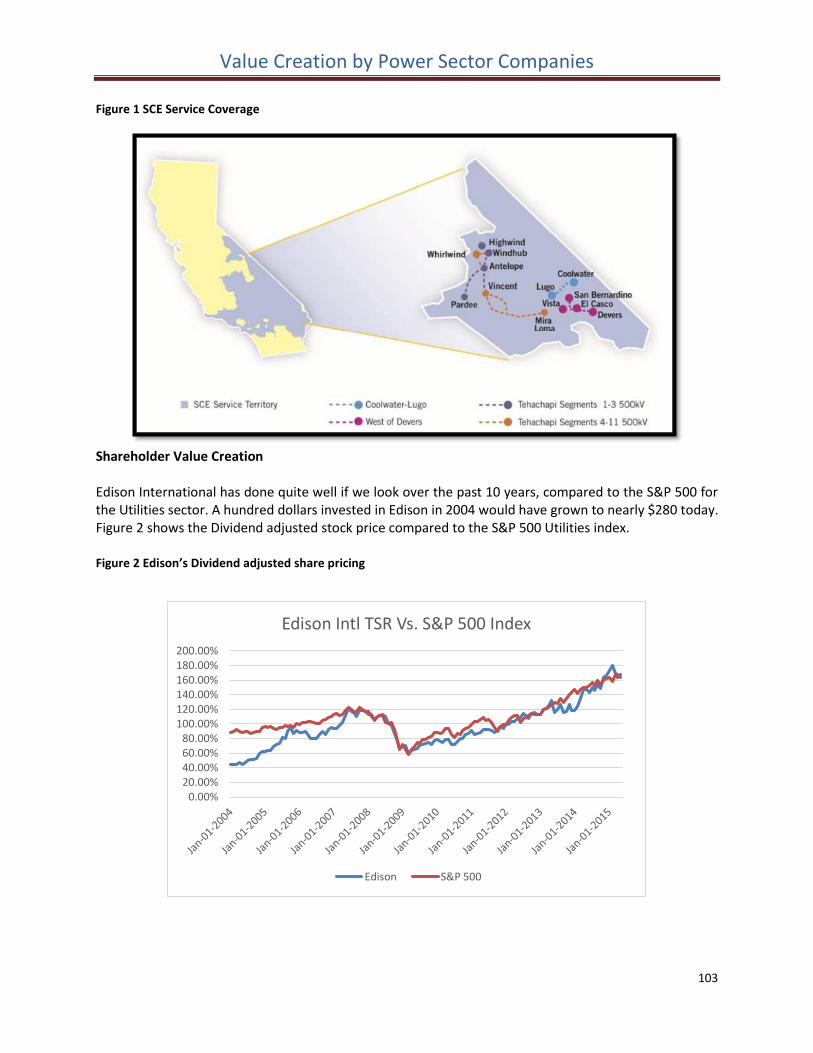
Value Creation by Power Sector Companies
103
Figure 1 SCE Service Coverage
Shareholder Value Creation Edison International has done quite well if we look over the past 10 years, compared to the S&P 500 for the Utilities sector. A hundred dollars invested in Edison in 2004 would have grown to nearly $280 today. Figure 2 shows the Dividend adjusted stock price compared to the S&P 500 Utilities index. Figure 2 Edison’s Dividend adjusted share pricing
0.00%20.00%40.00%60.00%80.00%
100.00%120.00%140.00%160.00%180.00%200.00%
Edison Intl TSR Vs. S&P 500 Index
Edison S&P 500
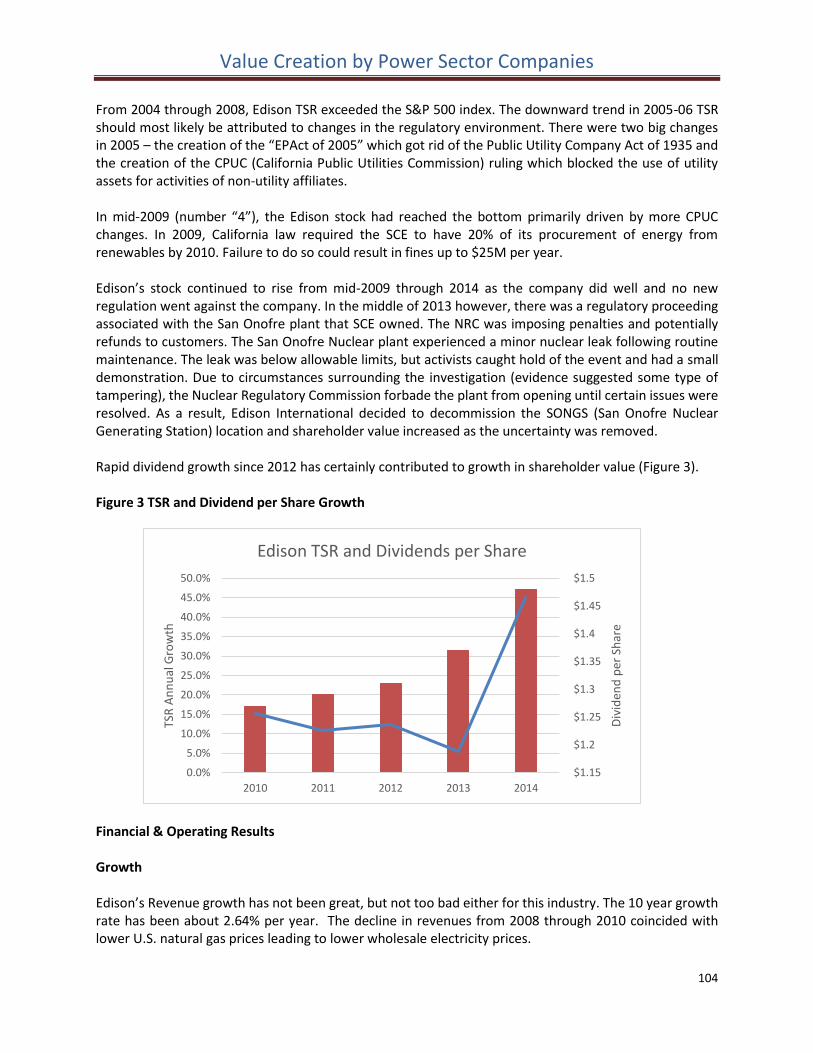
Value Creation by Power Sector Companies
104
From 2004 through 2008, Edison TSR exceeded the S&P 500 index. The downward trend in 2005-06 TSR should most likely be attributed to changes in the regulatory environment. There were two big changes in 2005 – the creation of the “EPAct of 2005” which got rid of the Public Utility Company Act of 1935 and the creation of the CPUC (California Public Utilities Commission) ruling which blocked the use of utility assets for activities of non-utility affiliates. In mid-2009 (number “4”), the Edison stock had reached the bottom primarily driven by more CPUC changes. In 2009, California law required the SCE to have 20% of its procurement of energy from renewables by 2010. Failure to do so could result in fines up to $25M per year. Edison’s stock continued to rise from mid-2009 through 2014 as the company did well and no new regulation went against the company. In the middle of 2013 however, there was a regulatory proceeding associated with the San Onofre plant that SCE owned. The NRC was imposing penalties and potentially refunds to customers. The San Onofre Nuclear plant experienced a minor nuclear leak following routine maintenance. The leak was below allowable limits, but activists caught hold of the event and had a small demonstration. Due to circumstances surrounding the investigation (evidence suggested some type of tampering), the Nuclear Regulatory Commission forbade the plant from opening until certain issues were resolved. As a result, Edison International decided to decommission the SONGS (San Onofre Nuclear Generating Station) location and shareholder value increased as the uncertainty was removed. Rapid dividend growth since 2012 has certainly contributed to growth in shareholder value (Figure 3). Figure 3 TSR and Dividend per Share Growth
Financial & Operating Results Growth Edison’s Revenue growth has not been great, but not too bad either for this industry. The 10 year growth rate has been about 2.64% per year. The decline in revenues from 2008 through 2010 coincided with lower U.S. natural gas prices leading to lower wholesale electricity prices.
$1.15
$1.2
$1.25
$1.3
$1.35
$1.4
$1.45
$1.5
0.0%
5.0%
10.0%
15.0%
20.0%
25.0%
30.0%
35.0%
40.0%
45.0%
50.0%
2010 2011 2012 2013 2014
Div
iden
d p
er S
har
e
TSR
An
nu
al G
row
th
Edison TSR and Dividends per Share
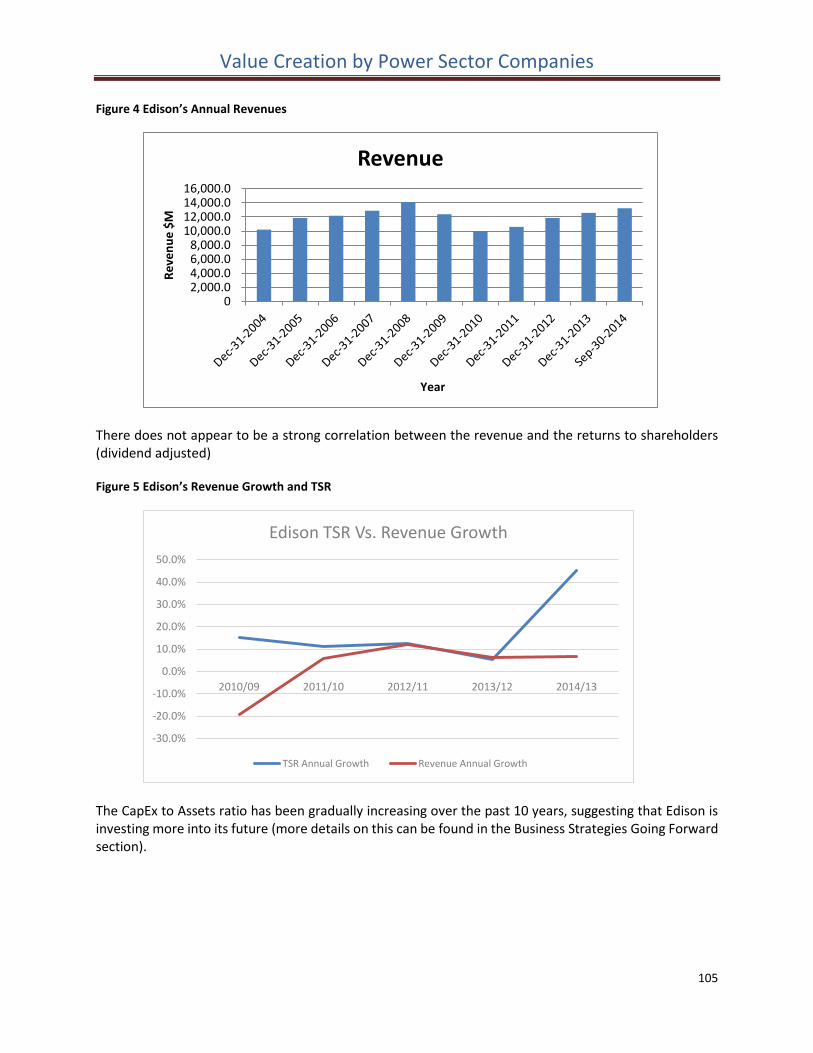
Value Creation by Power Sector Companies
105
Figure 4 Edison’s Annual Revenues
There does not appear to be a strong correlation between the revenue and the returns to shareholders (dividend adjusted) Figure 5 Edison’s Revenue Growth and TSR
The CapEx to Assets ratio has been gradually increasing over the past 10 years, suggesting that Edison is investing more into its future (more details on this can be found in the Business Strategies Going Forward section).
0 2,000.0 4,000.0 6,000.0 8,000.0
10,000.0 12,000.0 14,000.0 16,000.0
Re
ven
ue
$M
Year
Revenue
-30.0%
-20.0%
-10.0%
0.0%
10.0%
20.0%
30.0%
40.0%
50.0%
2010/09 2011/10 2012/11 2013/12 2014/13
Edison TSR Vs. Revenue Growth
TSR Annual Growth Revenue Annual Growth
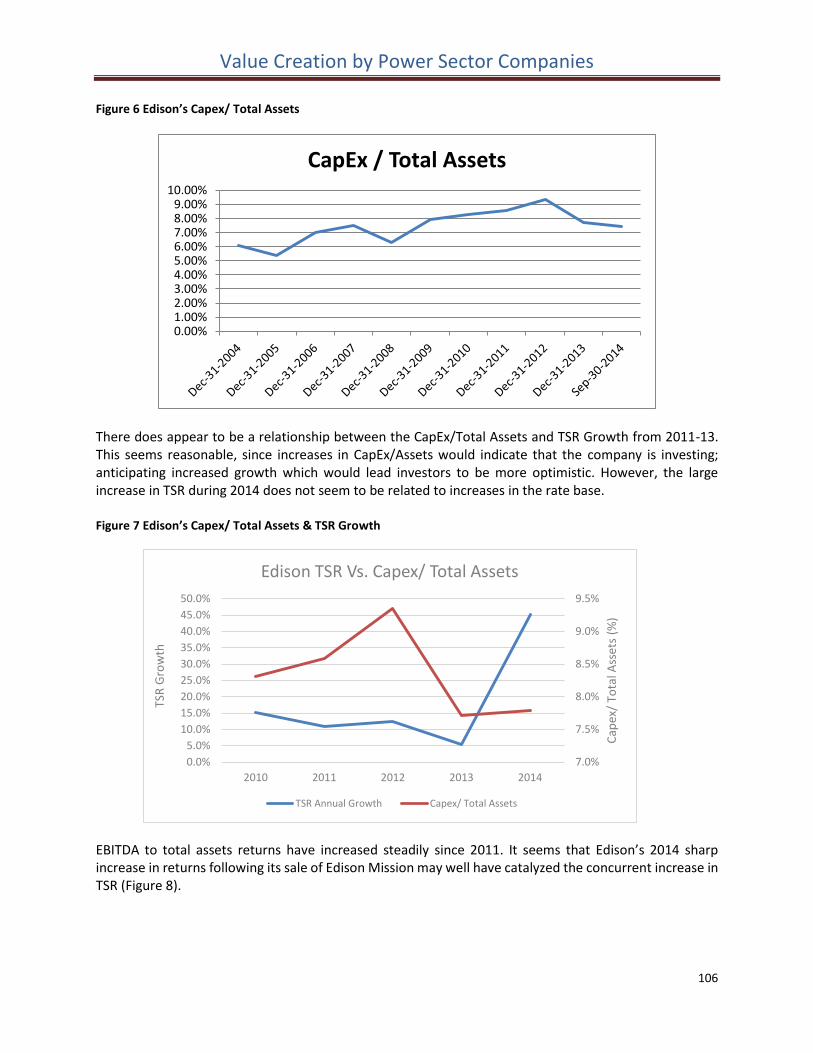
Value Creation by Power Sector Companies
106
Figure 6 Edison’s Capex/ Total Assets
There does appear to be a relationship between the CapEx/Total Assets and TSR Growth from 2011-13. This seems reasonable, since increases in CapEx/Assets would indicate that the company is investing; anticipating increased growth which would lead investors to be more optimistic. However, the large increase in TSR during 2014 does not seem to be related to increases in the rate base. Figure 7 Edison’s Capex/ Total Assets & TSR Growth
EBITDA to total assets returns have increased steadily since 2011. It seems that Edison’s 2014 sharp increase in returns following its sale of Edison Mission may well have catalyzed the concurrent increase in TSR (Figure 8).
0.00%1.00%2.00%3.00%4.00%5.00%6.00%7.00%8.00%9.00%
10.00%
CapEx / Total Assets
7.0%
7.5%
8.0%
8.5%
9.0%
9.5%
0.0%
5.0%
10.0%
15.0%
20.0%
25.0%
30.0%
35.0%
40.0%
45.0%
50.0%
2010 2011 2012 2013 2014
Cap
ex/
Tota
l Ass
ets
(%)
TSR
Gro
wth
Edison TSR Vs. Capex/ Total Assets
TSR Annual Growth Capex/ Total Assets
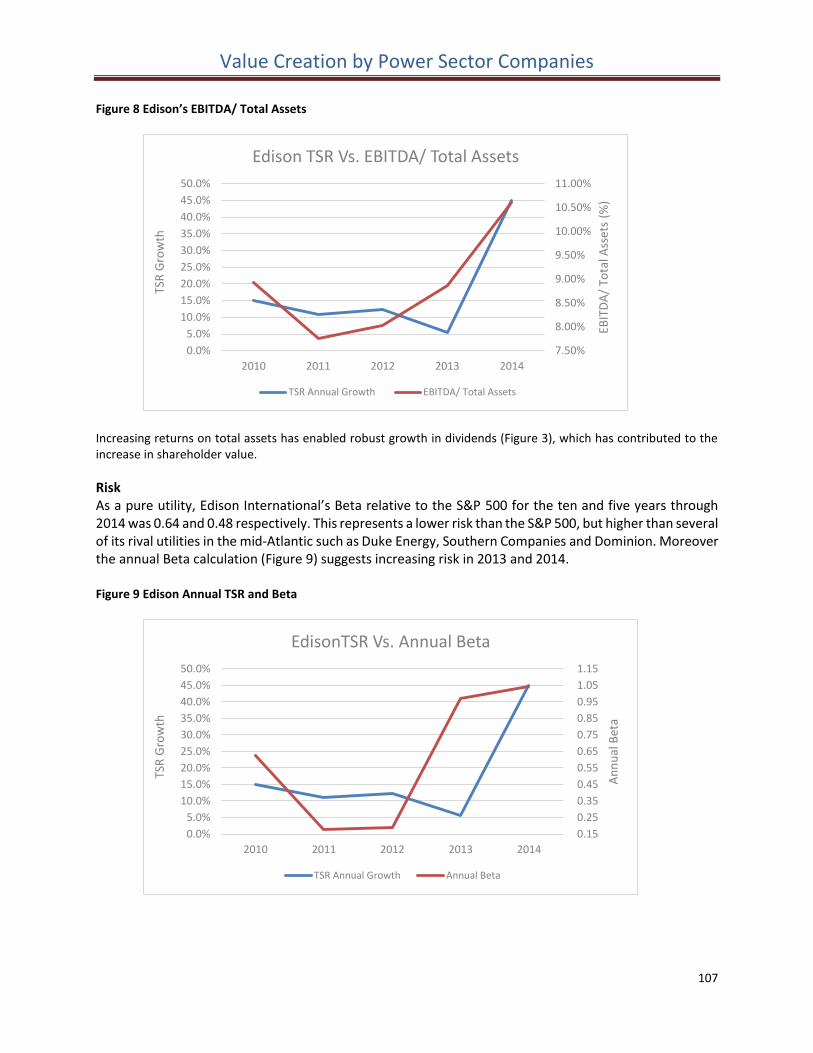
Value Creation by Power Sector Companies
107
Figure 8 Edison’s EBITDA/ Total Assets
Increasing returns on total assets has enabled robust growth in dividends (Figure 3), which has contributed to the increase in shareholder value.
Risk As a pure utility, Edison International’s Beta relative to the S&P 500 for the ten and five years through 2014 was 0.64 and 0.48 respectively. This represents a lower risk than the S&P 500, but higher than several of its rival utilities in the mid-Atlantic such as Duke Energy, Southern Companies and Dominion. Moreover the annual Beta calculation (Figure 9) suggests increasing risk in 2013 and 2014. Figure 9 Edison Annual TSR and Beta
7.50%
8.00%
8.50%
9.00%
9.50%
10.00%
10.50%
11.00%
0.0%
5.0%
10.0%
15.0%
20.0%
25.0%
30.0%
35.0%
40.0%
45.0%
50.0%
2010 2011 2012 2013 2014
EBIT
DA
/ To
tal A
sset
s (%
)
TSR
Gro
wth
Edison TSR Vs. EBITDA/ Total Assets
TSR Annual Growth EBITDA/ Total Assets
0.15
0.25
0.35
0.45
0.55
0.65
0.75
0.85
0.95
1.05
1.15
0.0%
5.0%
10.0%
15.0%
20.0%
25.0%
30.0%
35.0%
40.0%
45.0%
50.0%
2010 2011 2012 2013 2014
An
nu
al B
eta
TSR
Gro
wth
EdisonTSR Vs. Annual Beta
TSR Annual Growth Annual Beta
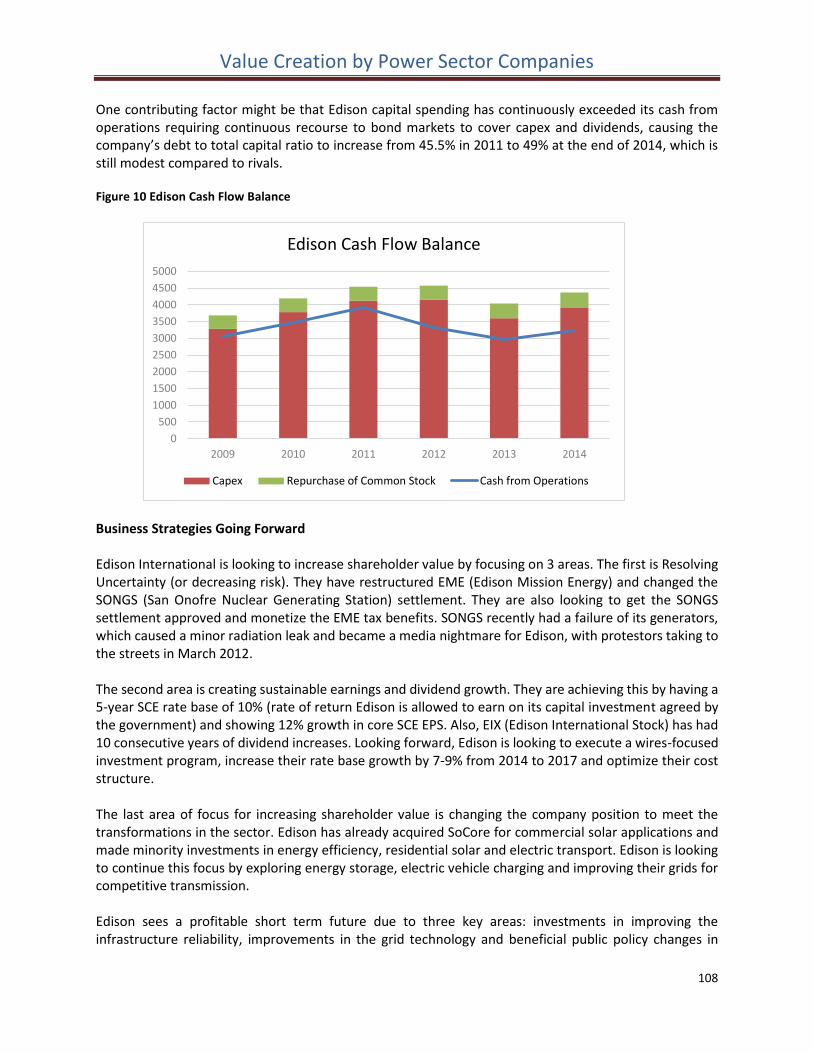
Value Creation by Power Sector Companies
108
One contributing factor might be that Edison capital spending has continuously exceeded its cash from operations requiring continuous recourse to bond markets to cover capex and dividends, causing the company’s debt to total capital ratio to increase from 45.5% in 2011 to 49% at the end of 2014, which is still modest compared to rivals. Figure 10 Edison Cash Flow Balance
Business Strategies Going Forward Edison International is looking to increase shareholder value by focusing on 3 areas. The first is Resolving Uncertainty (or decreasing risk). They have restructured EME (Edison Mission Energy) and changed the SONGS (San Onofre Nuclear Generating Station) settlement. They are also looking to get the SONGS settlement approved and monetize the EME tax benefits. SONGS recently had a failure of its generators, which caused a minor radiation leak and became a media nightmare for Edison, with protestors taking to the streets in March 2012. The second area is creating sustainable earnings and dividend growth. They are achieving this by having a 5-year SCE rate base of 10% (rate of return Edison is allowed to earn on its capital investment agreed by the government) and showing 12% growth in core SCE EPS. Also, EIX (Edison International Stock) has had 10 consecutive years of dividend increases. Looking forward, Edison is looking to execute a wires-focused investment program, increase their rate base growth by 7-9% from 2014 to 2017 and optimize their cost structure. The last area of focus for increasing shareholder value is changing the company position to meet the transformations in the sector. Edison has already acquired SoCore for commercial solar applications and made minority investments in energy efficiency, residential solar and electric transport. Edison is looking to continue this focus by exploring energy storage, electric vehicle charging and improving their grids for competitive transmission. Edison sees a profitable short term future due to three key areas: investments in improving the infrastructure reliability, improvements in the grid technology and beneficial public policy changes in
0
500
1000
1500
2000
2500
3000
3500
4000
4500
5000
2009 2010 2011 2012 2013 2014
Edison Cash Flow Balance
Capex Repurchase of Common Stock Cash from Operations
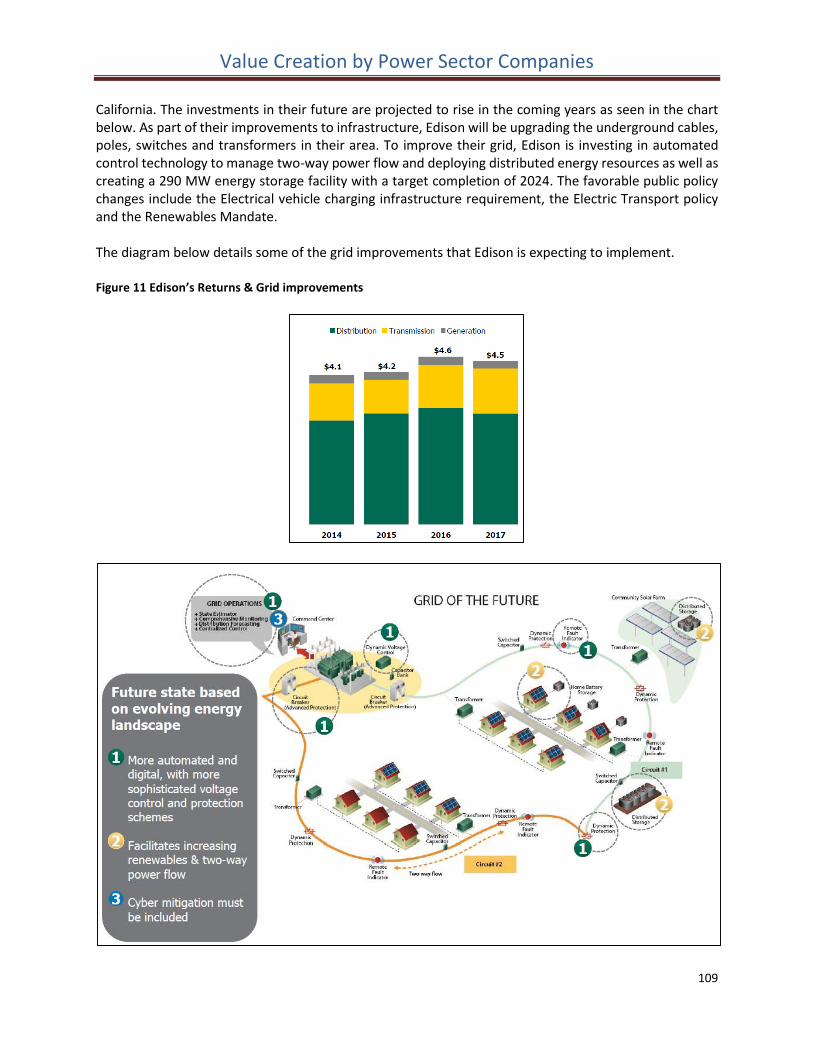
Value Creation by Power Sector Companies
109
California. The investments in their future are projected to rise in the coming years as seen in the chart below. As part of their improvements to infrastructure, Edison will be upgrading the underground cables, poles, switches and transformers in their area. To improve their grid, Edison is investing in automated control technology to manage two-way power flow and deploying distributed energy resources as well as creating a 290 MW energy storage facility with a target completion of 2024. The favorable public policy changes include the Electrical vehicle charging infrastructure requirement, the Electric Transport policy and the Renewables Mandate. The diagram below details some of the grid improvements that Edison is expecting to implement. Figure 11 Edison’s Returns & Grid improvements
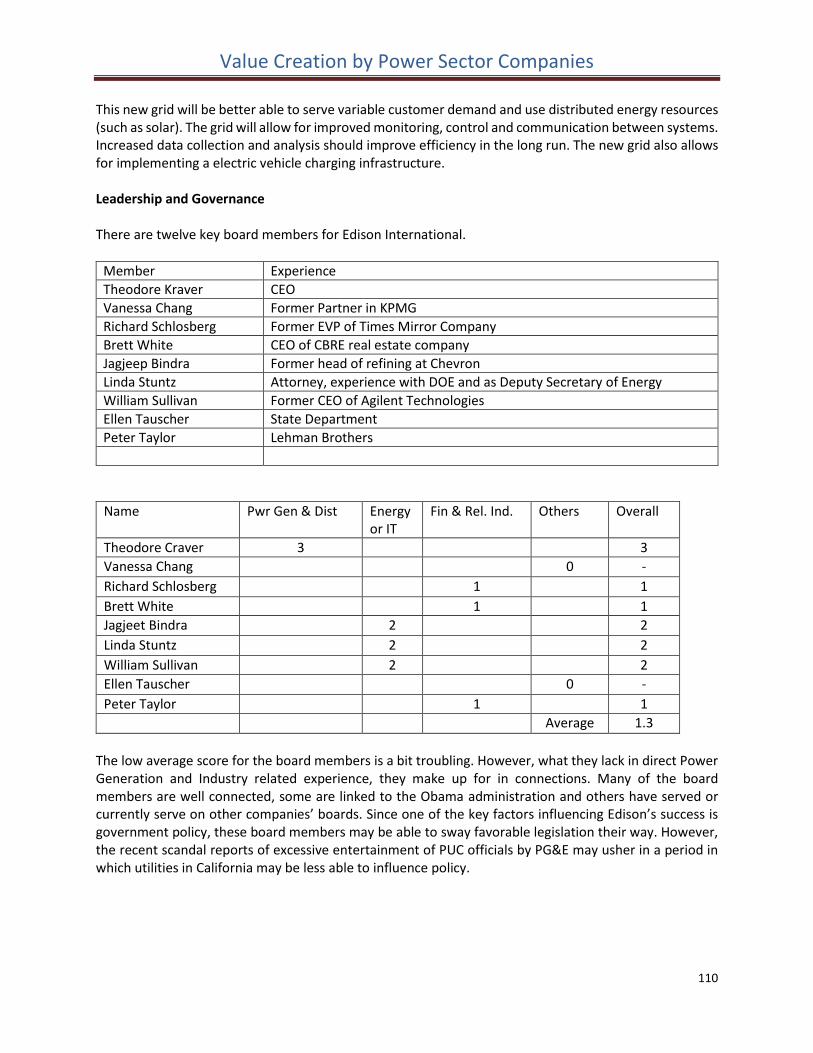
Value Creation by Power Sector Companies
110
This new grid will be better able to serve variable customer demand and use distributed energy resources (such as solar). The grid will allow for improved monitoring, control and communication between systems. Increased data collection and analysis should improve efficiency in the long run. The new grid also allows for implementing a electric vehicle charging infrastructure. Leadership and Governance There are twelve key board members for Edison International.
Member Experience
Theodore Kraver CEO
Vanessa Chang Former Partner in KPMG
Richard Schlosberg Former EVP of Times Mirror Company
Brett White CEO of CBRE real estate company
Jagjeep Bindra Former head of refining at Chevron
Linda Stuntz Attorney, experience with DOE and as Deputy Secretary of Energy
William Sullivan Former CEO of Agilent Technologies
Ellen Tauscher State Department
Peter Taylor Lehman Brothers
Name Pwr Gen & Dist Energy or IT
Fin & Rel. Ind. Others Overall
Theodore Craver 3 3
Vanessa Chang 0 -
Richard Schlosberg 1 1
Brett White 1 1
Jagjeet Bindra 2 2
Linda Stuntz 2 2
William Sullivan 2 2
Ellen Tauscher 0 -
Peter Taylor 1 1
Average 1.3
The low average score for the board members is a bit troubling. However, what they lack in direct Power Generation and Industry related experience, they make up for in connections. Many of the board members are well connected, some are linked to the Obama administration and others have served or currently serve on other companies’ boards. Since one of the key factors influencing Edison’s success is government policy, these board members may be able to sway favorable legislation their way. However, the recent scandal reports of excessive entertainment of PUC officials by PG&E may usher in a period in which utilities in California may be less able to influence policy.

Value Creation by Power Sector Companies
111
Valuation At the end of 2014, Edison Enterprise Value was $35.4 Billion, a 12.5% market discount from our standard model’s calculated Intrinsic Value of $40.5 Billion. Investors may be pricing in a higher cost of capital than that calculated with the 5 year Beta assumed in our standard model.
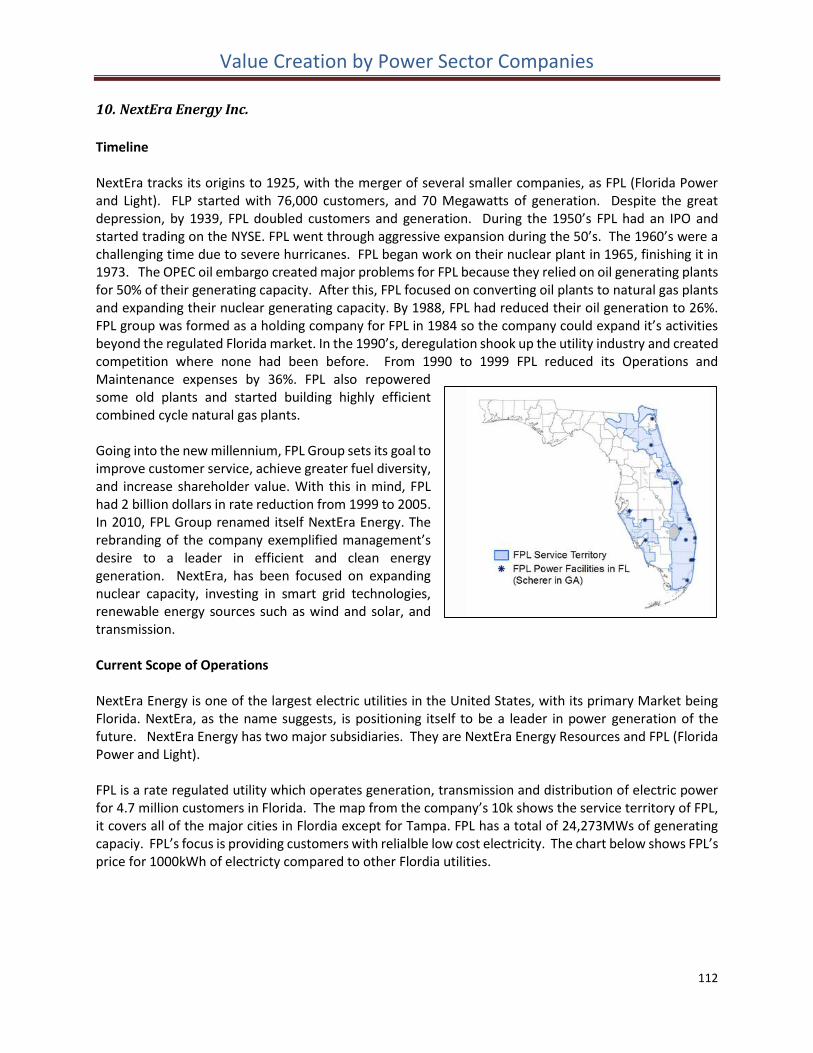
Value Creation by Power Sector Companies
112
10. NextEra Energy Inc.
Timeline NextEra tracks its origins to 1925, with the merger of several smaller companies, as FPL (Florida Power and Light). FLP started with 76,000 customers, and 70 Megawatts of generation. Despite the great depression, by 1939, FPL doubled customers and generation. During the 1950’s FPL had an IPO and started trading on the NYSE. FPL went through aggressive expansion during the 50’s. The 1960’s were a challenging time due to severe hurricanes. FPL began work on their nuclear plant in 1965, finishing it in 1973. The OPEC oil embargo created major problems for FPL because they relied on oil generating plants for 50% of their generating capacity. After this, FPL focused on converting oil plants to natural gas plants and expanding their nuclear generating capacity. By 1988, FPL had reduced their oil generation to 26%. FPL group was formed as a holding company for FPL in 1984 so the company could expand it’s activities beyond the regulated Florida market. In the 1990’s, deregulation shook up the utility industry and created competition where none had been before. From 1990 to 1999 FPL reduced its Operations and Maintenance expenses by 36%. FPL also repowered some old plants and started building highly efficient combined cycle natural gas plants. Going into the new millennium, FPL Group sets its goal to improve customer service, achieve greater fuel diversity, and increase shareholder value. With this in mind, FPL had 2 billion dollars in rate reduction from 1999 to 2005. In 2010, FPL Group renamed itself NextEra Energy. The rebranding of the company exemplified management’s desire to a leader in efficient and clean energy generation. NextEra, has been focused on expanding nuclear capacity, investing in smart grid technologies, renewable energy sources such as wind and solar, and transmission. Current Scope of Operations NextEra Energy is one of the largest electric utilities in the United States, with its primary Market being Florida. NextEra, as the name suggests, is positioning itself to be a leader in power generation of the future. NextEra Energy has two major subsidiaries. They are NextEra Energy Resources and FPL (Florida Power and Light). FPL is a rate regulated utility which operates generation, transmission and distribution of electric power for 4.7 million customers in Florida. The map from the company’s 10k shows the service territory of FPL, it covers all of the major cities in Flordia except for Tampa. FPL has a total of 24,273MWs of generating capaciy. FPL’s focus is providing customers with relialble low cost electricity. The chart below shows FPL’s price for 1000kWh of electricty compared to other Flordia utilities.
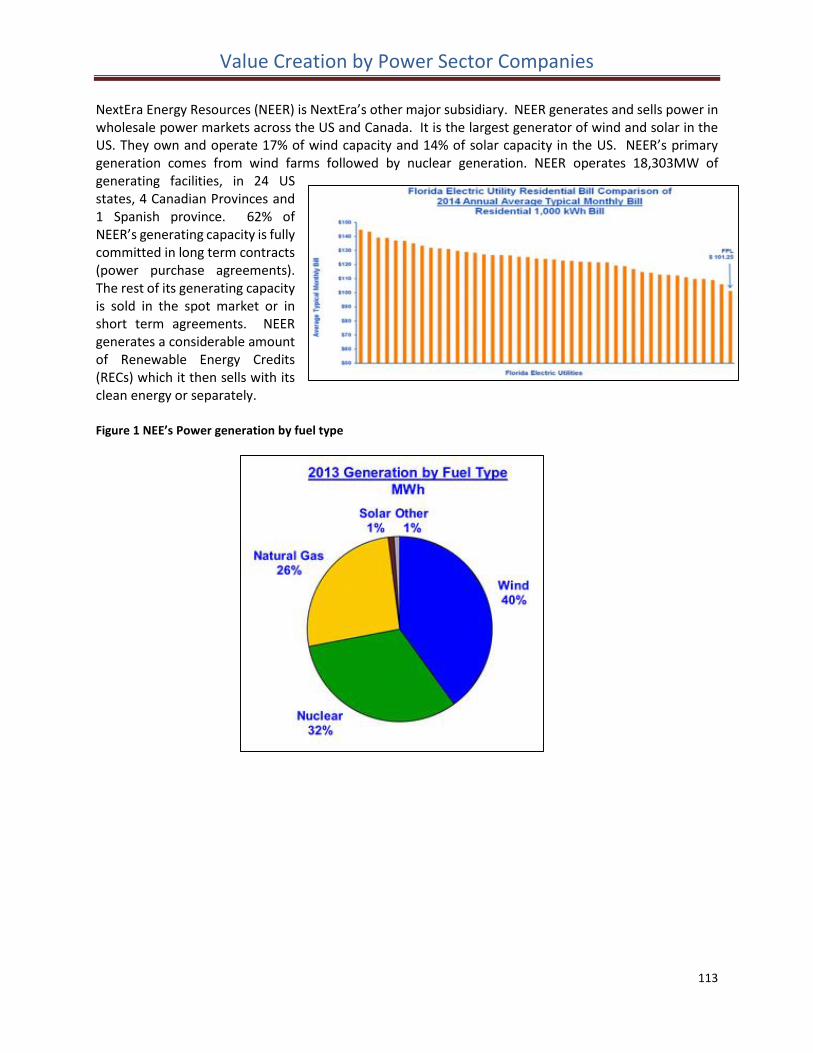
Value Creation by Power Sector Companies
113
NextEra Energy Resources (NEER) is NextEra’s other major subsidiary. NEER generates and sells power in wholesale power markets across the US and Canada. It is the largest generator of wind and solar in the US. They own and operate 17% of wind capacity and 14% of solar capacity in the US. NEER’s primary generation comes from wind farms followed by nuclear generation. NEER operates 18,303MW of generating facilities, in 24 US states, 4 Canadian Provinces and 1 Spanish province. 62% of NEER’s generating capacity is fully committed in long term contracts (power purchase agreements). The rest of its generating capacity is sold in the spot market or in short term agreements. NEER generates a considerable amount of Renewable Energy Credits (RECs) which it then sells with its clean energy or separately. Figure 1 NEE’s Power generation by fuel type
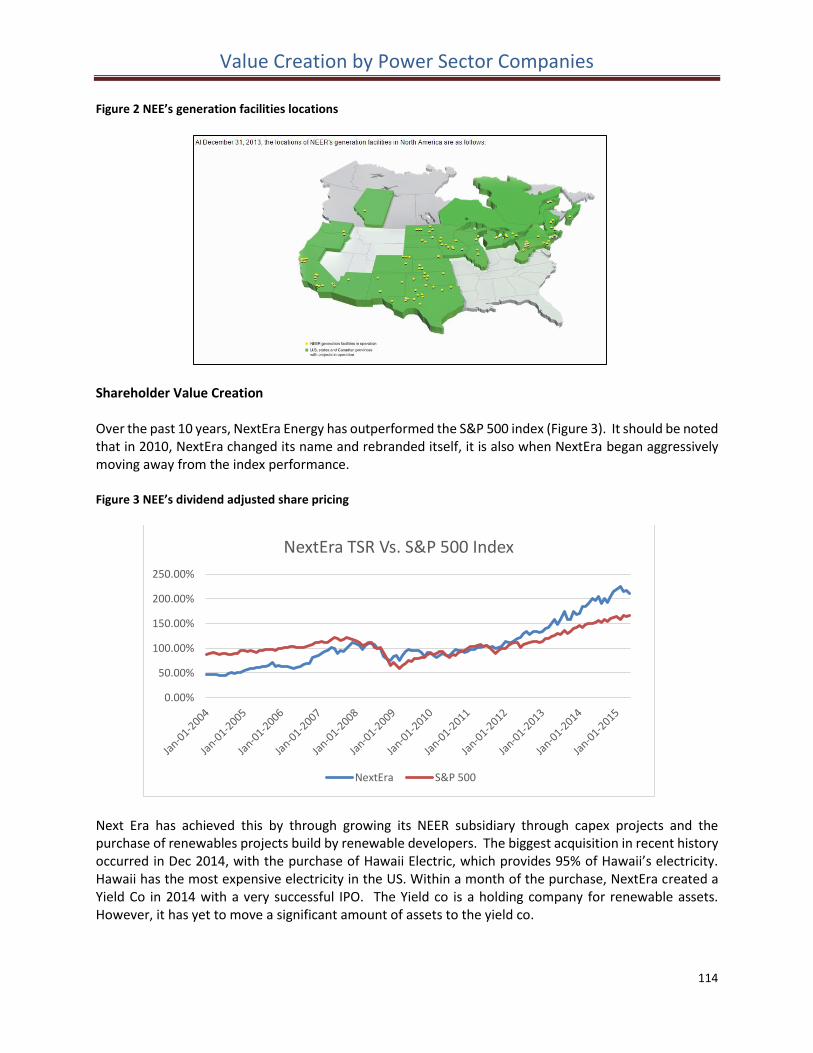
Value Creation by Power Sector Companies
114
Figure 2 NEE’s generation facilities locations
Shareholder Value Creation Over the past 10 years, NextEra Energy has outperformed the S&P 500 index (Figure 3). It should be noted that in 2010, NextEra changed its name and rebranded itself, it is also when NextEra began aggressively moving away from the index performance. Figure 3 NEE’s dividend adjusted share pricing
Next Era has achieved this by through growing its NEER subsidiary through capex projects and the purchase of renewables projects build by renewable developers. The biggest acquisition in recent history occurred in Dec 2014, with the purchase of Hawaii Electric, which provides 95% of Hawaii’s electricity. Hawaii has the most expensive electricity in the US. Within a month of the purchase, NextEra created a Yield Co in 2014 with a very successful IPO. The Yield co is a holding company for renewable assets. However, it has yet to move a significant amount of assets to the yield co.
0.00%
50.00%
100.00%
150.00%
200.00%
250.00%
NextEra TSR Vs. S&P 500 Index
NextEra S&P 500
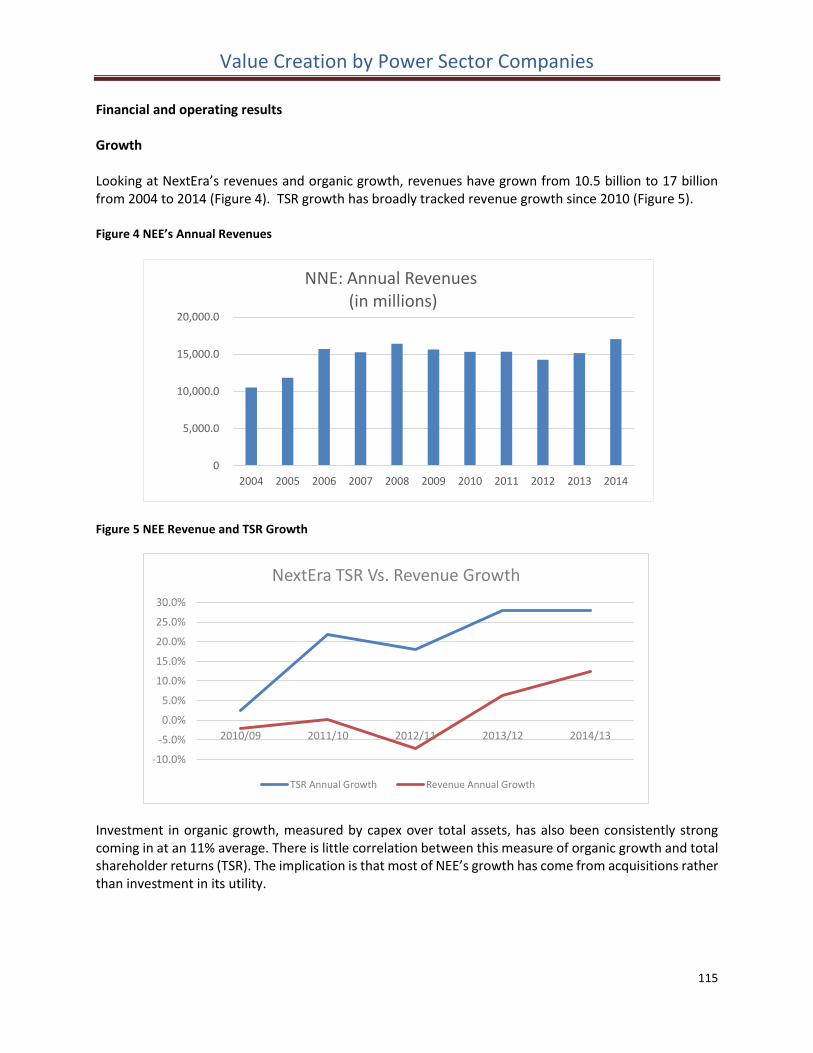
Value Creation by Power Sector Companies
115
Financial and operating results Growth Looking at NextEra’s revenues and organic growth, revenues have grown from 10.5 billion to 17 billion from 2004 to 2014 (Figure 4). TSR growth has broadly tracked revenue growth since 2010 (Figure 5). Figure 4 NEE’s Annual Revenues
Figure 5 NEE Revenue and TSR Growth
Investment in organic growth, measured by capex over total assets, has also been consistently strong coming in at an 11% average. There is little correlation between this measure of organic growth and total shareholder returns (TSR). The implication is that most of NEE’s growth has come from acquisitions rather than investment in its utility.
0
5,000.0
10,000.0
15,000.0
20,000.0
2004 2005 2006 2007 2008 2009 2010 2011 2012 2013 2014
NNE: Annual Revenues(in millions)
-10.0%
-5.0%
0.0%
5.0%
10.0%
15.0%
20.0%
25.0%
30.0%
2010/09 2011/10 2012/11 2013/12 2014/13
NextEra TSR Vs. Revenue Growth
TSR Annual Growth Revenue Annual Growth
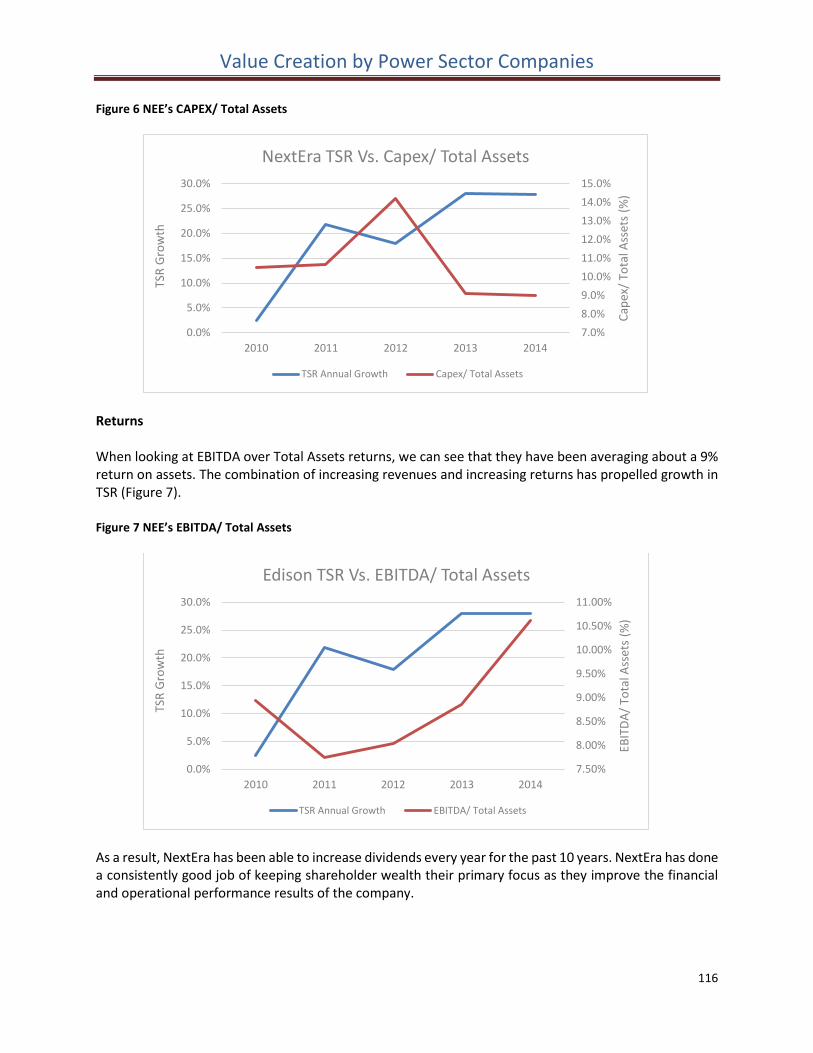
Value Creation by Power Sector Companies
116
Figure 6 NEE’s CAPEX/ Total Assets
Returns When looking at EBITDA over Total Assets returns, we can see that they have been averaging about a 9% return on assets. The combination of increasing revenues and increasing returns has propelled growth in TSR (Figure 7). Figure 7 NEE’s EBITDA/ Total Assets
As a result, NextEra has been able to increase dividends every year for the past 10 years. NextEra has done a consistently good job of keeping shareholder wealth their primary focus as they improve the financial and operational performance results of the company.
7.0%
8.0%
9.0%
10.0%
11.0%
12.0%
13.0%
14.0%
15.0%
0.0%
5.0%
10.0%
15.0%
20.0%
25.0%
30.0%
2010 2011 2012 2013 2014
Cap
ex/
Tota
l Ass
ets
(%)
TSR
Gro
wth
NextEra TSR Vs. Capex/ Total Assets
TSR Annual Growth Capex/ Total Assets
7.50%
8.00%
8.50%
9.00%
9.50%
10.00%
10.50%
11.00%
0.0%
5.0%
10.0%
15.0%
20.0%
25.0%
30.0%
2010 2011 2012 2013 2014
EBIT
DA
/ To
tal A
sset
s (%
)
TSR
Gro
wth
Edison TSR Vs. EBITDA/ Total Assets
TSR Annual Growth EBITDA/ Total Assets
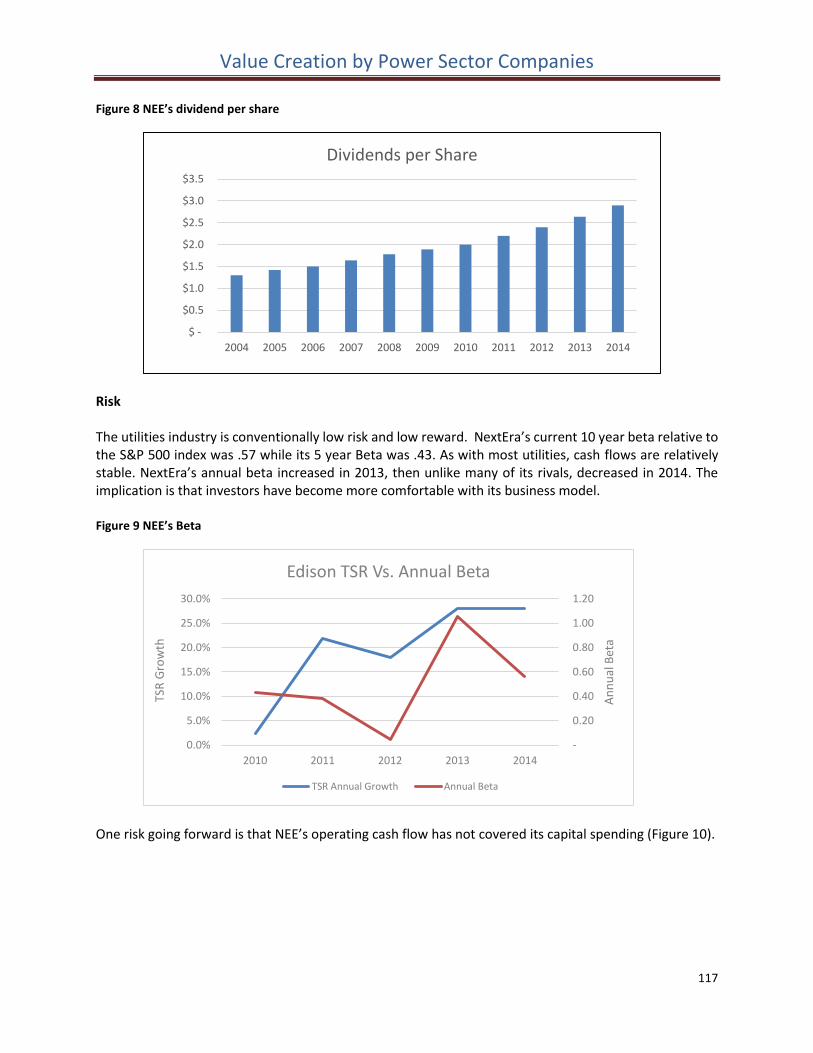
Value Creation by Power Sector Companies
117
Figure 8 NEE’s dividend per share
Risk The utilities industry is conventionally low risk and low reward. NextEra’s current 10 year beta relative to the S&P 500 index was .57 while its 5 year Beta was .43. As with most utilities, cash flows are relatively stable. NextEra’s annual beta increased in 2013, then unlike many of its rivals, decreased in 2014. The implication is that investors have become more comfortable with its business model. Figure 9 NEE’s Beta
One risk going forward is that NEE’s operating cash flow has not covered its capital spending (Figure 10).
$ -
$0.5
$1.0
$1.5
$2.0
$2.5
$3.0
$3.5
2004 2005 2006 2007 2008 2009 2010 2011 2012 2013 2014
Dividends per Share
-
0.20
0.40
0.60
0.80
1.00
1.20
0.0%
5.0%
10.0%
15.0%
20.0%
25.0%
30.0%
2010 2011 2012 2013 2014
An
nu
al B
eta
TSR
Gro
wth
Edison TSR Vs. Annual Beta
TSR Annual Growth Annual Beta
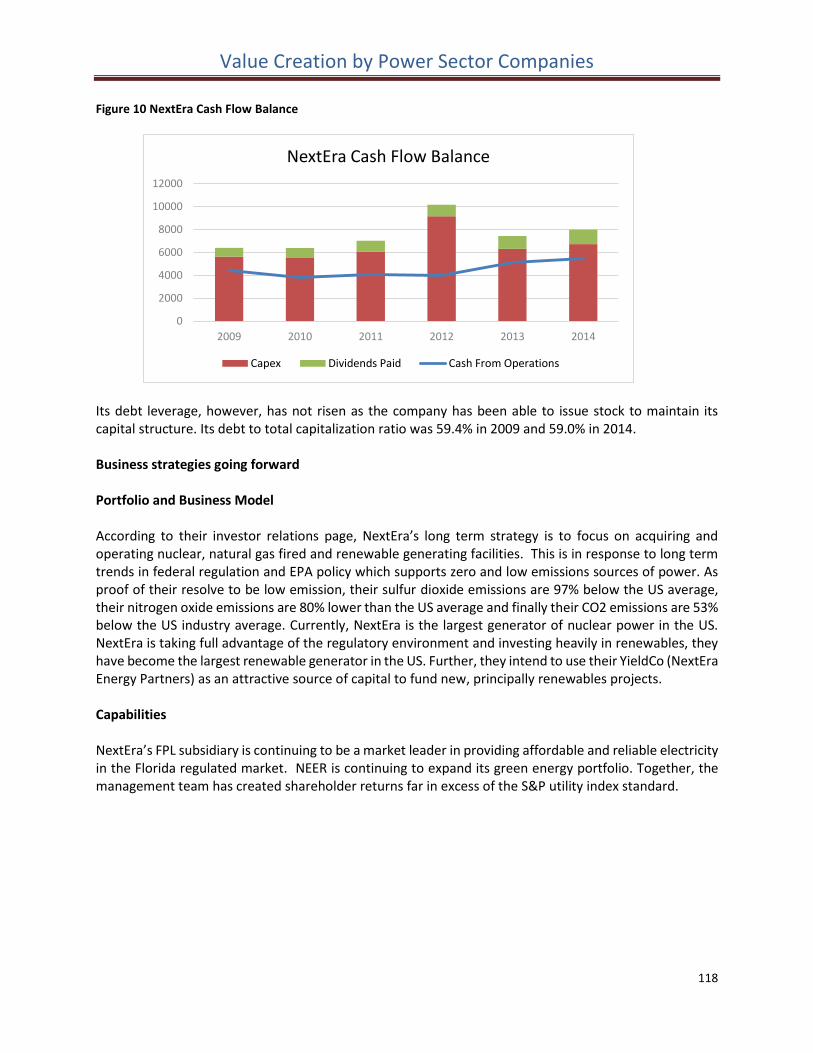
Value Creation by Power Sector Companies
118
Figure 10 NextEra Cash Flow Balance
Its debt leverage, however, has not risen as the company has been able to issue stock to maintain its capital structure. Its debt to total capitalization ratio was 59.4% in 2009 and 59.0% in 2014. Business strategies going forward Portfolio and Business Model According to their investor relations page, NextEra’s long term strategy is to focus on acquiring and operating nuclear, natural gas fired and renewable generating facilities. This is in response to long term trends in federal regulation and EPA policy which supports zero and low emissions sources of power. As proof of their resolve to be low emission, their sulfur dioxide emissions are 97% below the US average, their nitrogen oxide emissions are 80% lower than the US average and finally their CO2 emissions are 53% below the US industry average. Currently, NextEra is the largest generator of nuclear power in the US. NextEra is taking full advantage of the regulatory environment and investing heavily in renewables, they have become the largest renewable generator in the US. Further, they intend to use their YieldCo (NextEra Energy Partners) as an attractive source of capital to fund new, principally renewables projects.
Capabilities NextEra’s FPL subsidiary is continuing to be a market leader in providing affordable and reliable electricity in the Florida regulated market. NEER is continuing to expand its green energy portfolio. Together, the management team has created shareholder returns far in excess of the S&P utility index standard.
0
2000
4000
6000
8000
10000
12000
2009 2010 2011 2012 2013 2014
NextEra Cash Flow Balance
Capex Dividends Paid Cash From Operations
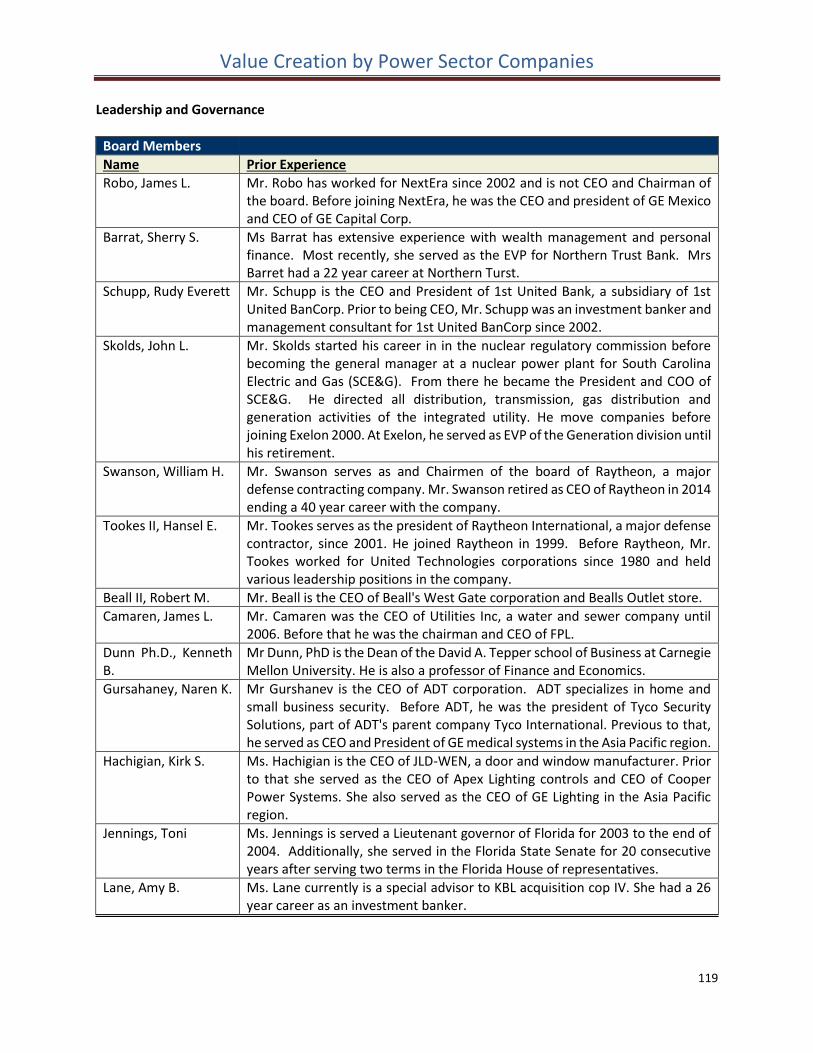
Value Creation by Power Sector Companies
119
Leadership and Governance
Board Members
Name Prior Experience
Robo, James L. Mr. Robo has worked for NextEra since 2002 and is not CEO and Chairman of the board. Before joining NextEra, he was the CEO and president of GE Mexico and CEO of GE Capital Corp.
Barrat, Sherry S. Ms Barrat has extensive experience with wealth management and personal finance. Most recently, she served as the EVP for Northern Trust Bank. Mrs Barret had a 22 year career at Northern Turst.
Schupp, Rudy Everett Mr. Schupp is the CEO and President of 1st United Bank, a subsidiary of 1st United BanCorp. Prior to being CEO, Mr. Schupp was an investment banker and management consultant for 1st United BanCorp since 2002.
Skolds, John L. Mr. Skolds started his career in in the nuclear regulatory commission before becoming the general manager at a nuclear power plant for South Carolina Electric and Gas (SCE&G). From there he became the President and COO of SCE&G. He directed all distribution, transmission, gas distribution and generation activities of the integrated utility. He move companies before joining Exelon 2000. At Exelon, he served as EVP of the Generation division until his retirement.
Swanson, William H. Mr. Swanson serves as and Chairmen of the board of Raytheon, a major defense contracting company. Mr. Swanson retired as CEO of Raytheon in 2014 ending a 40 year career with the company.
Tookes II, Hansel E. Mr. Tookes serves as the president of Raytheon International, a major defense contractor, since 2001. He joined Raytheon in 1999. Before Raytheon, Mr. Tookes worked for United Technologies corporations since 1980 and held various leadership positions in the company.
Beall II, Robert M. Mr. Beall is the CEO of Beall's West Gate corporation and Bealls Outlet store.
Camaren, James L. Mr. Camaren was the CEO of Utilities Inc, a water and sewer company until 2006. Before that he was the chairman and CEO of FPL.
Dunn Ph.D., Kenneth B.
Mr Dunn, PhD is the Dean of the David A. Tepper school of Business at Carnegie Mellon University. He is also a professor of Finance and Economics.
Gursahaney, Naren K. Mr Gurshanev is the CEO of ADT corporation. ADT specializes in home and small business security. Before ADT, he was the president of Tyco Security Solutions, part of ADT's parent company Tyco International. Previous to that, he served as CEO and President of GE medical systems in the Asia Pacific region.
Hachigian, Kirk S. Ms. Hachigian is the CEO of JLD-WEN, a door and window manufacturer. Prior to that she served as the CEO of Apex Lighting controls and CEO of Cooper Power Systems. She also served as the CEO of GE Lighting in the Asia Pacific region.
Jennings, Toni Ms. Jennings is served a Lieutenant governor of Florida for 2003 to the end of 2004. Additionally, she served in the Florida State Senate for 20 consecutive years after serving two terms in the Florida House of representatives.
Lane, Amy B. Ms. Lane currently is a special advisor to KBL acquisition cop IV. She had a 26 year career as an investment banker.
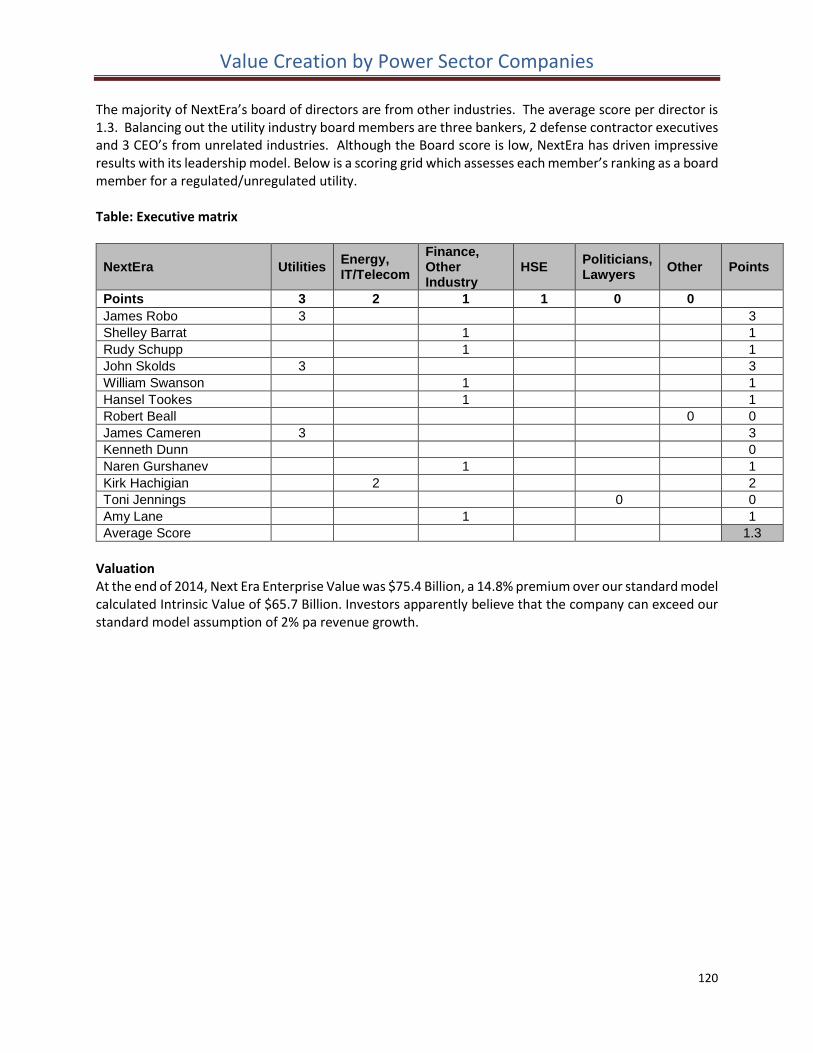
Value Creation by Power Sector Companies
120
The majority of NextEra’s board of directors are from other industries. The average score per director is 1.3. Balancing out the utility industry board members are three bankers, 2 defense contractor executives and 3 CEO’s from unrelated industries. Although the Board score is low, NextEra has driven impressive results with its leadership model. Below is a scoring grid which assesses each member’s ranking as a board member for a regulated/unregulated utility. Table: Executive matrix
NextEra Utilities Energy, IT/Telecom
Finance, Other Industry
HSE Politicians, Lawyers
Other Points
Points 3 2 1 1 0 0
James Robo 3 3
Shelley Barrat 1 1
Rudy Schupp 1 1
John Skolds 3 3
William Swanson 1 1
Hansel Tookes 1 1
Robert Beall 0 0
James Cameren 3 3
Kenneth Dunn 0
Naren Gurshanev 1 1
Kirk Hachigian 2 2
Toni Jennings 0 0
Amy Lane 1 1
Average Score 1.3
Valuation At the end of 2014, Next Era Enterprise Value was $75.4 Billion, a 14.8% premium over our standard model calculated Intrinsic Value of $65.7 Billion. Investors apparently believe that the company can exceed our standard model assumption of 2% pa revenue growth.
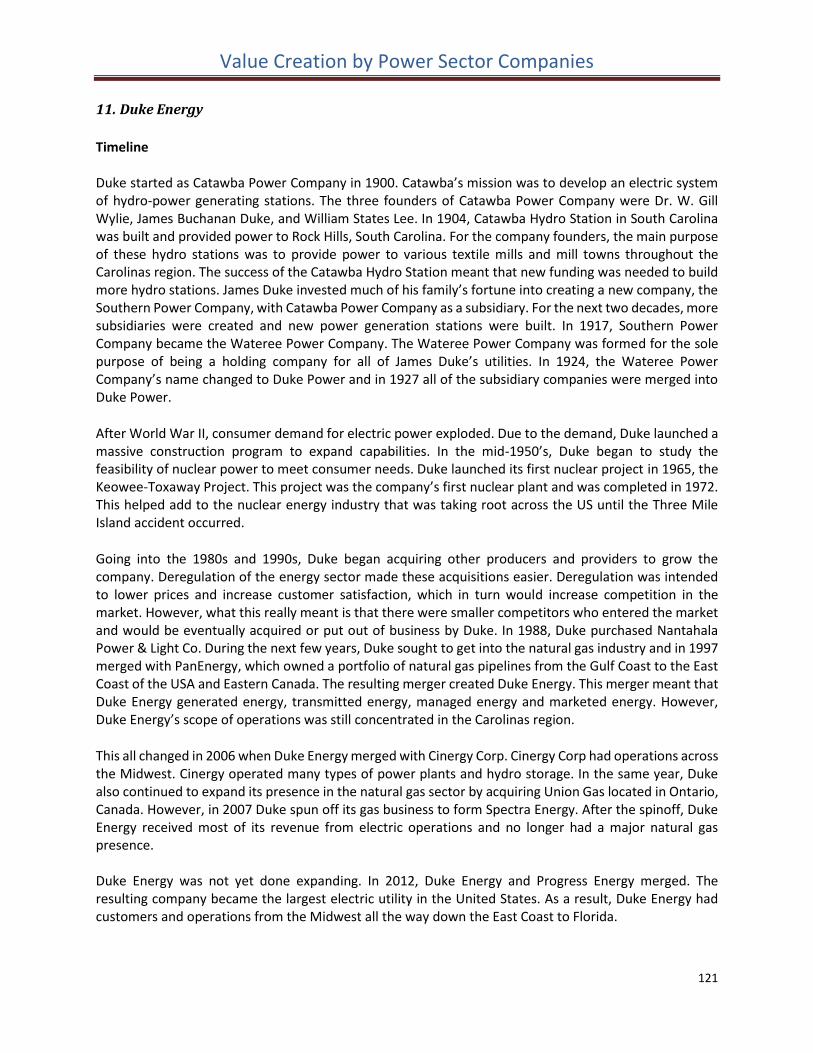
Value Creation by Power Sector Companies
121
11. Duke Energy
Timeline Duke started as Catawba Power Company in 1900. Catawba’s mission was to develop an electric system of hydro-power generating stations. The three founders of Catawba Power Company were Dr. W. Gill Wylie, James Buchanan Duke, and William States Lee. In 1904, Catawba Hydro Station in South Carolina was built and provided power to Rock Hills, South Carolina. For the company founders, the main purpose of these hydro stations was to provide power to various textile mills and mill towns throughout the Carolinas region. The success of the Catawba Hydro Station meant that new funding was needed to build more hydro stations. James Duke invested much of his family’s fortune into creating a new company, the Southern Power Company, with Catawba Power Company as a subsidiary. For the next two decades, more subsidiaries were created and new power generation stations were built. In 1917, Southern Power Company became the Wateree Power Company. The Wateree Power Company was formed for the sole purpose of being a holding company for all of James Duke’s utilities. In 1924, the Wateree Power Company’s name changed to Duke Power and in 1927 all of the subsidiary companies were merged into Duke Power.
After World War II, consumer demand for electric power exploded. Due to the demand, Duke launched a massive construction program to expand capabilities. In the mid-1950’s, Duke began to study the feasibility of nuclear power to meet consumer needs. Duke launched its first nuclear project in 1965, the Keowee-Toxaway Project. This project was the company’s first nuclear plant and was completed in 1972. This helped add to the nuclear energy industry that was taking root across the US until the Three Mile Island accident occurred.
Going into the 1980s and 1990s, Duke began acquiring other producers and providers to grow the company. Deregulation of the energy sector made these acquisitions easier. Deregulation was intended to lower prices and increase customer satisfaction, which in turn would increase competition in the market. However, what this really meant is that there were smaller competitors who entered the market and would be eventually acquired or put out of business by Duke. In 1988, Duke purchased Nantahala Power & Light Co. During the next few years, Duke sought to get into the natural gas industry and in 1997 merged with PanEnergy, which owned a portfolio of natural gas pipelines from the Gulf Coast to the East Coast of the USA and Eastern Canada. The resulting merger created Duke Energy. This merger meant that Duke Energy generated energy, transmitted energy, managed energy and marketed energy. However, Duke Energy’s scope of operations was still concentrated in the Carolinas region.
This all changed in 2006 when Duke Energy merged with Cinergy Corp. Cinergy Corp had operations across the Midwest. Cinergy operated many types of power plants and hydro storage. In the same year, Duke also continued to expand its presence in the natural gas sector by acquiring Union Gas located in Ontario, Canada. However, in 2007 Duke spun off its gas business to form Spectra Energy. After the spinoff, Duke Energy received most of its revenue from electric operations and no longer had a major natural gas presence. Duke Energy was not yet done expanding. In 2012, Duke Energy and Progress Energy merged. The resulting company became the largest electric utility in the United States. As a result, Duke Energy had customers and operations from the Midwest all the way down the East Coast to Florida.
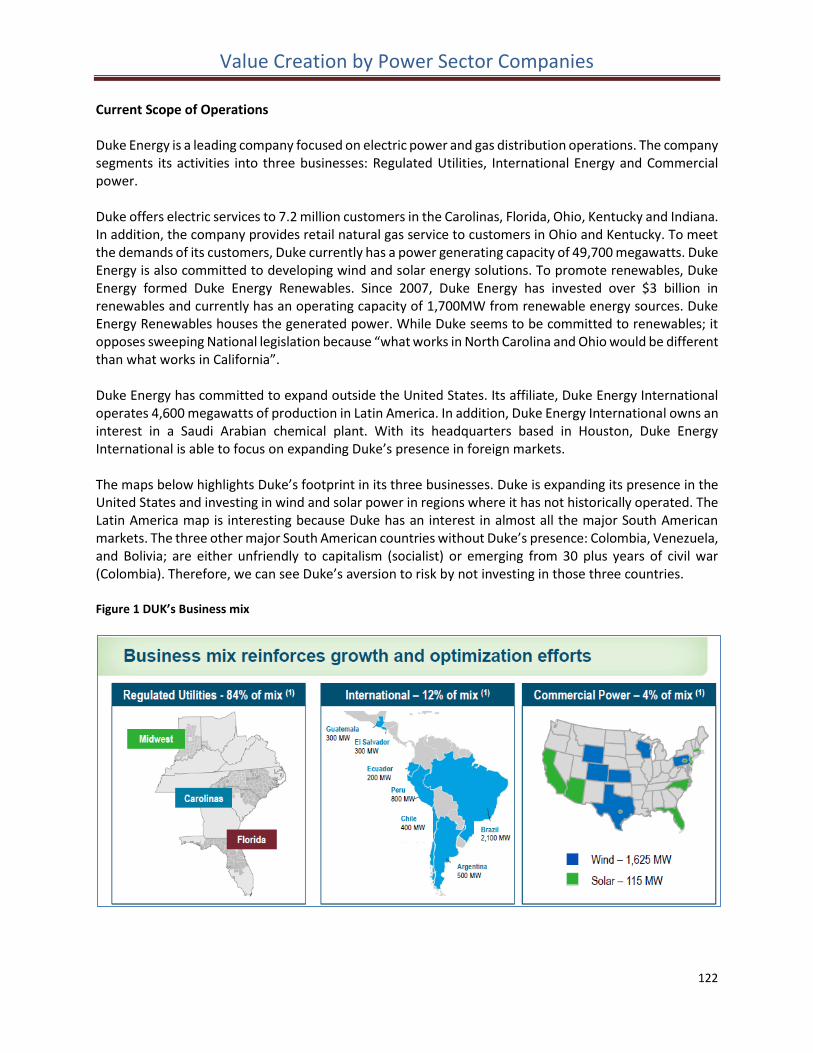
Value Creation by Power Sector Companies
122
Current Scope of Operations
Duke Energy is a leading company focused on electric power and gas distribution operations. The company segments its activities into three businesses: Regulated Utilities, International Energy and Commercial power. Duke offers electric services to 7.2 million customers in the Carolinas, Florida, Ohio, Kentucky and Indiana. In addition, the company provides retail natural gas service to customers in Ohio and Kentucky. To meet the demands of its customers, Duke currently has a power generating capacity of 49,700 megawatts. Duke Energy is also committed to developing wind and solar energy solutions. To promote renewables, Duke Energy formed Duke Energy Renewables. Since 2007, Duke Energy has invested over $3 billion in renewables and currently has an operating capacity of 1,700MW from renewable energy sources. Duke Energy Renewables houses the generated power. While Duke seems to be committed to renewables; it opposes sweeping National legislation because “what works in North Carolina and Ohio would be different than what works in California”. Duke Energy has committed to expand outside the United States. Its affiliate, Duke Energy International operates 4,600 megawatts of production in Latin America. In addition, Duke Energy International owns an interest in a Saudi Arabian chemical plant. With its headquarters based in Houston, Duke Energy International is able to focus on expanding Duke’s presence in foreign markets. The maps below highlights Duke’s footprint in its three businesses. Duke is expanding its presence in the United States and investing in wind and solar power in regions where it has not historically operated. The Latin America map is interesting because Duke has an interest in almost all the major South American markets. The three other major South American countries without Duke’s presence: Colombia, Venezuela, and Bolivia; are either unfriendly to capitalism (socialist) or emerging from 30 plus years of civil war (Colombia). Therefore, we can see Duke’s aversion to risk by not investing in those three countries. Figure 1 DUK’s Business mix
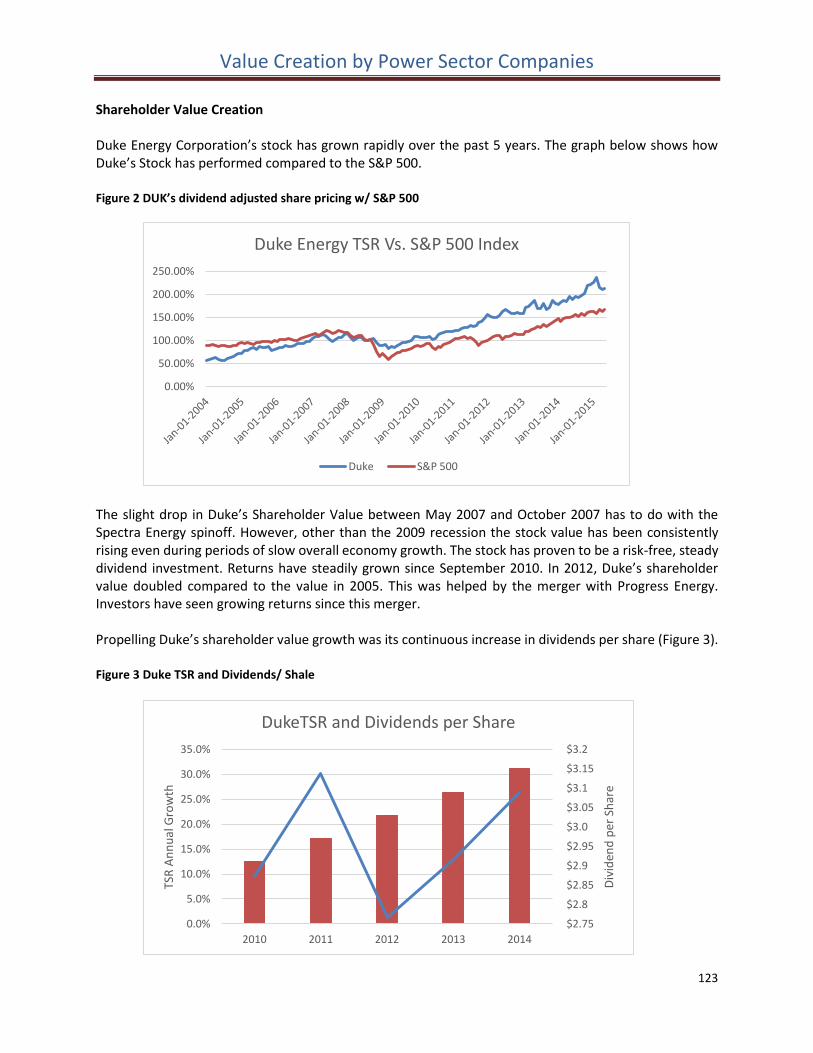
Value Creation by Power Sector Companies
123
Shareholder Value Creation Duke Energy Corporation’s stock has grown rapidly over the past 5 years. The graph below shows how Duke’s Stock has performed compared to the S&P 500. Figure 2 DUK’s dividend adjusted share pricing w/ S&P 500
The slight drop in Duke’s Shareholder Value between May 2007 and October 2007 has to do with the Spectra Energy spinoff. However, other than the 2009 recession the stock value has been consistently rising even during periods of slow overall economy growth. The stock has proven to be a risk-free, steady dividend investment. Returns have steadily grown since September 2010. In 2012, Duke’s shareholder value doubled compared to the value in 2005. This was helped by the merger with Progress Energy. Investors have seen growing returns since this merger. Propelling Duke’s shareholder value growth was its continuous increase in dividends per share (Figure 3). Figure 3 Duke TSR and Dividends/ Shale
0.00%
50.00%
100.00%
150.00%
200.00%
250.00%
Duke Energy TSR Vs. S&P 500 Index
Duke S&P 500
$2.75
$2.8
$2.85
$2.9
$2.95
$3.0
$3.05
$3.1
$3.15
$3.2
0.0%
5.0%
10.0%
15.0%
20.0%
25.0%
30.0%
35.0%
2010 2011 2012 2013 2014
Div
iden
d p
er S
har
e
TSR
An
nu
al G
row
th
DukeTSR and Dividends per Share
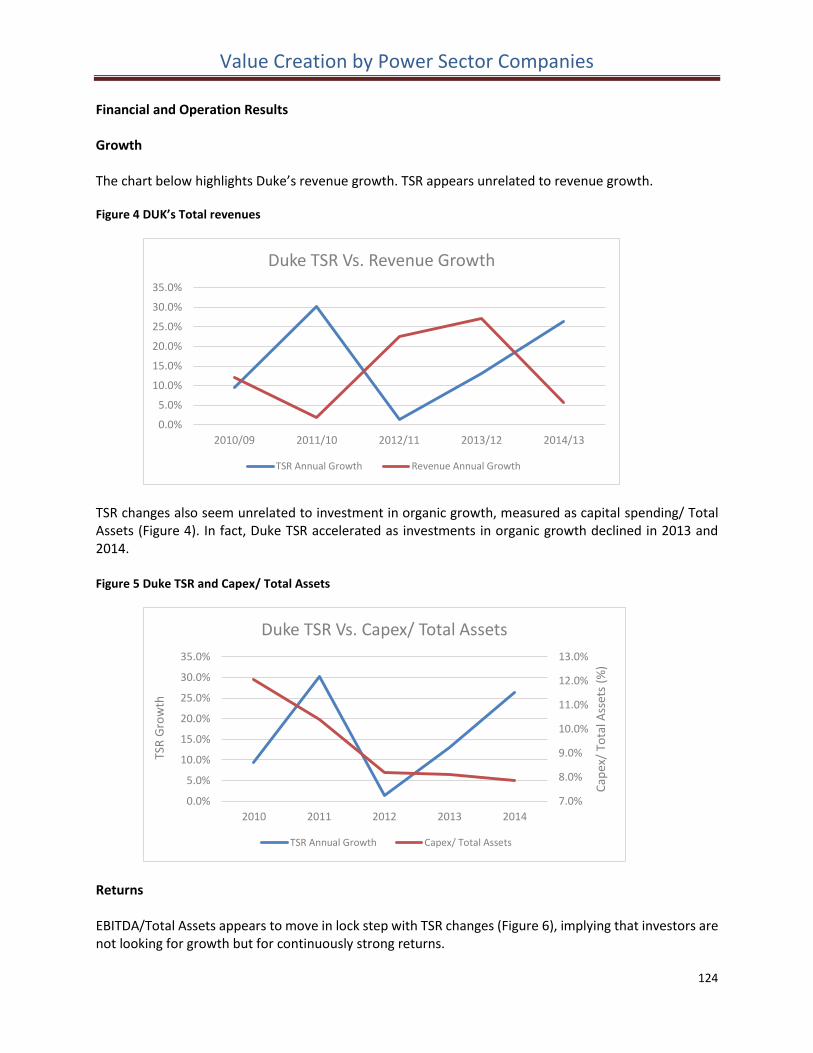
Value Creation by Power Sector Companies
124
Financial and Operation Results Growth The chart below highlights Duke’s revenue growth. TSR appears unrelated to revenue growth. Figure 4 DUK’s Total revenues
TSR changes also seem unrelated to investment in organic growth, measured as capital spending/ Total Assets (Figure 4). In fact, Duke TSR accelerated as investments in organic growth declined in 2013 and 2014. Figure 5 Duke TSR and Capex/ Total Assets
Returns EBITDA/Total Assets appears to move in lock step with TSR changes (Figure 6), implying that investors are not looking for growth but for continuously strong returns.
0.0%
5.0%
10.0%
15.0%
20.0%
25.0%
30.0%
35.0%
2010/09 2011/10 2012/11 2013/12 2014/13
Duke TSR Vs. Revenue Growth
TSR Annual Growth Revenue Annual Growth
7.0%
8.0%
9.0%
10.0%
11.0%
12.0%
13.0%
0.0%
5.0%
10.0%
15.0%
20.0%
25.0%
30.0%
35.0%
2010 2011 2012 2013 2014
Cap
ex/
Tota
l Ass
ets
(%)
TSR
Gro
wth
Duke TSR Vs. Capex/ Total Assets
TSR Annual Growth Capex/ Total Assets
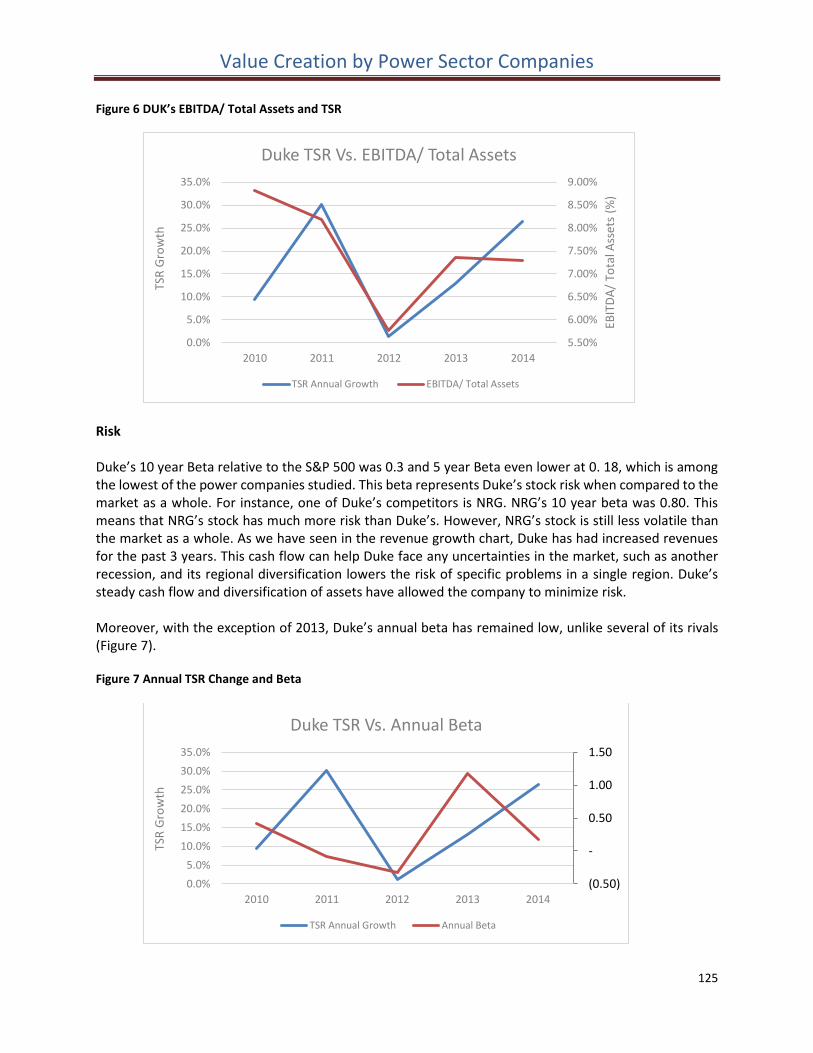
Value Creation by Power Sector Companies
125
Figure 6 DUK’s EBITDA/ Total Assets and TSR
Risk Duke’s 10 year Beta relative to the S&P 500 was 0.3 and 5 year Beta even lower at 0. 18, which is among the lowest of the power companies studied. This beta represents Duke’s stock risk when compared to the market as a whole. For instance, one of Duke’s competitors is NRG. NRG’s 10 year beta was 0.80. This means that NRG’s stock has much more risk than Duke’s. However, NRG’s stock is still less volatile than the market as a whole. As we have seen in the revenue growth chart, Duke has had increased revenues for the past 3 years. This cash flow can help Duke face any uncertainties in the market, such as another recession, and its regional diversification lowers the risk of specific problems in a single region. Duke’s steady cash flow and diversification of assets have allowed the company to minimize risk. Moreover, with the exception of 2013, Duke’s annual beta has remained low, unlike several of its rivals (Figure 7). Figure 7 Annual TSR Change and Beta
5.50%
6.00%
6.50%
7.00%
7.50%
8.00%
8.50%
9.00%
0.0%
5.0%
10.0%
15.0%
20.0%
25.0%
30.0%
35.0%
2010 2011 2012 2013 2014
EBIT
DA
/ To
tal A
sset
s (%
)
TSR
Gro
wth
Duke TSR Vs. EBITDA/ Total Assets
TSR Annual Growth EBITDA/ Total Assets
(0.50)
-
0.50
1.00
1.50
0.0%
5.0%
10.0%
15.0%
20.0%
25.0%
30.0%
35.0%
2010 2011 2012 2013 2014
TSR
Gro
wth
Duke TSR Vs. Annual Beta
TSR Annual Growth Annual Beta
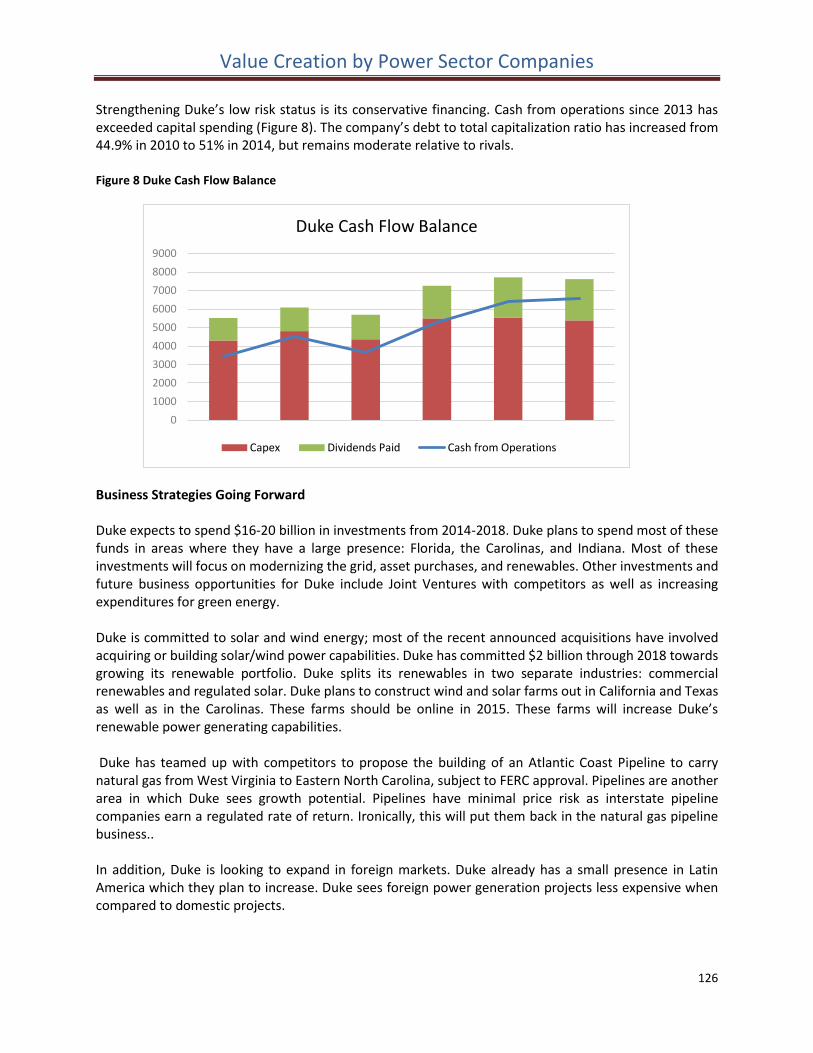
Value Creation by Power Sector Companies
126
Strengthening Duke’s low risk status is its conservative financing. Cash from operations since 2013 has exceeded capital spending (Figure 8). The company’s debt to total capitalization ratio has increased from 44.9% in 2010 to 51% in 2014, but remains moderate relative to rivals. Figure 8 Duke Cash Flow Balance
Business Strategies Going Forward Duke expects to spend $16-20 billion in investments from 2014-2018. Duke plans to spend most of these funds in areas where they have a large presence: Florida, the Carolinas, and Indiana. Most of these investments will focus on modernizing the grid, asset purchases, and renewables. Other investments and future business opportunities for Duke include Joint Ventures with competitors as well as increasing expenditures for green energy. Duke is committed to solar and wind energy; most of the recent announced acquisitions have involved acquiring or building solar/wind power capabilities. Duke has committed $2 billion through 2018 towards growing its renewable portfolio. Duke splits its renewables in two separate industries: commercial renewables and regulated solar. Duke plans to construct wind and solar farms out in California and Texas as well as in the Carolinas. These farms should be online in 2015. These farms will increase Duke’s renewable power generating capabilities. Duke has teamed up with competitors to propose the building of an Atlantic Coast Pipeline to carry natural gas from West Virginia to Eastern North Carolina, subject to FERC approval. Pipelines are another area in which Duke sees growth potential. Pipelines have minimal price risk as interstate pipeline companies earn a regulated rate of return. Ironically, this will put them back in the natural gas pipeline business.. In addition, Duke is looking to expand in foreign markets. Duke already has a small presence in Latin America which they plan to increase. Duke sees foreign power generation projects less expensive when compared to domestic projects.
0
1000
2000
3000
4000
5000
6000
7000
8000
9000
Duke Cash Flow Balance
Capex Dividends Paid Cash from Operations
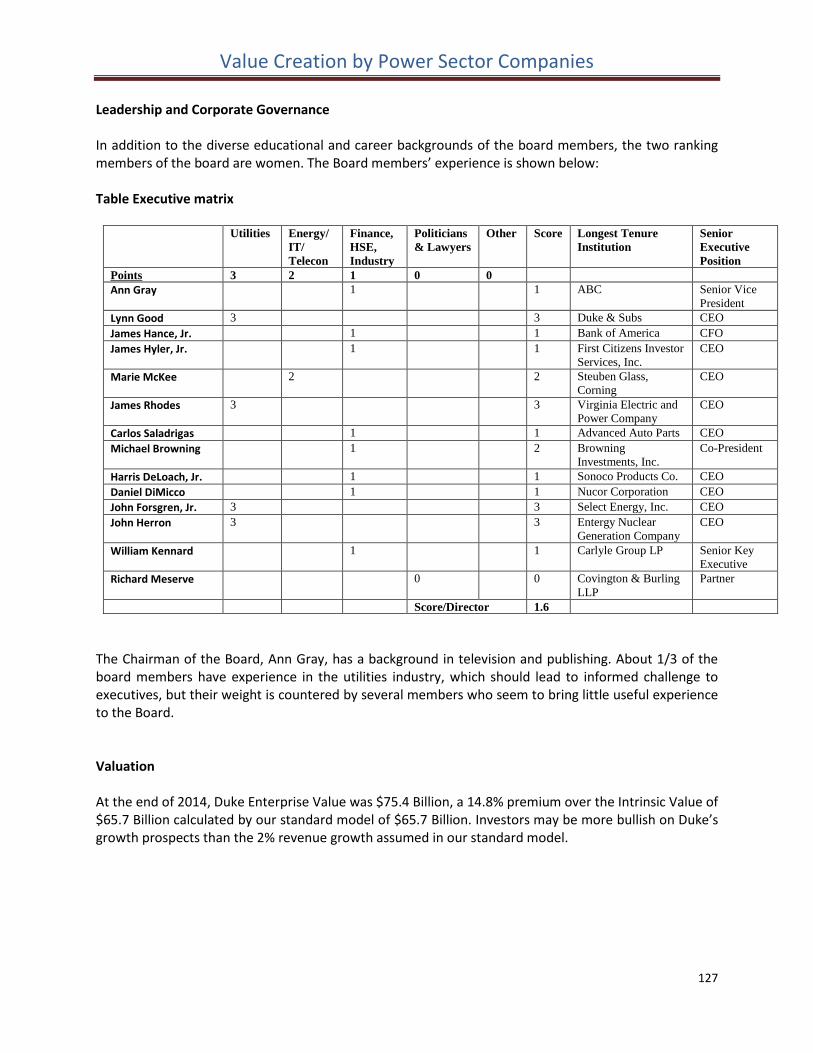
Value Creation by Power Sector Companies
127
Leadership and Corporate Governance In addition to the diverse educational and career backgrounds of the board members, the two ranking members of the board are women. The Board members’ experience is shown below: Table Executive matrix
Utilities Energy/
IT/
Telecon
Finance,
HSE,
Industry
Politicians
& Lawyers
Other Score Longest Tenure
Institution
Senior
Executive
Position
Points 3 2 1 0 0
Ann Gray 1 1 ABC Senior Vice
President
Lynn Good 3 3 Duke & Subs CEO
James Hance, Jr. 1 1 Bank of America CFO
James Hyler, Jr. 1 1 First Citizens Investor
Services, Inc.
CEO
Marie McKee 2 2 Steuben Glass,
Corning
CEO
James Rhodes 3 3 Virginia Electric and
Power Company
CEO
Carlos Saladrigas 1 1 Advanced Auto Parts CEO
Michael Browning 1 2 Browning
Investments, Inc.
Co-President
Harris DeLoach, Jr. 1 1 Sonoco Products Co. CEO
Daniel DiMicco 1 1 Nucor Corporation CEO
John Forsgren, Jr. 3 3 Select Energy, Inc. CEO
John Herron 3 3 Entergy Nuclear
Generation Company
CEO
William Kennard 1 1 Carlyle Group LP Senior Key
Executive
Richard Meserve 0 0 Covington & Burling
LLP
Partner
Score/Director 1.6
The Chairman of the Board, Ann Gray, has a background in television and publishing. About 1/3 of the board members have experience in the utilities industry, which should lead to informed challenge to executives, but their weight is countered by several members who seem to bring little useful experience to the Board.
Valuation
At the end of 2014, Duke Enterprise Value was $75.4 Billion, a 14.8% premium over the Intrinsic Value of $65.7 Billion calculated by our standard model of $65.7 Billion. Investors may be more bullish on Duke’s growth prospects than the 2% revenue growth assumed in our standard model.
Value Creation by Power Sector Companies
128
12. Southern Company
History
The Southern Company we know today was founded in 1945, but its roots can be traced back to 1924 when a small electric company by the name of Alabama Traction L&P formed a holding company by the name of Southeastern Company. In the next couple of years subsidiaries were established under Southeastern Company’s portfolio, Mississippi Power in 1924, and Gulf Power in 1925. A year later, in 1926, Southeastern Company merged with Georgia Power in a deal that would benefit both parties. Southeastern saw an opportunity for growth and expansion when it merged into the Commonwealth and Southern Company (CSC) in 1930. However, just a few years later in 1935, the CSC, which supplied a barrage of electrical and energy services to much of the southeastern United States, was forced to disassemble to meet the requirements of the Public Utility Company Holding Act of 1935. The law was signed into law by, then President, Franklin D. Roosevelt. “PUCHA required utility parent companies to incorporate in the same state where the utility operates, so that the state can regulate them, or to be regulated by the Securities and Exchange Commission (SEC) if they operated in several states. PUHCA does not allow non-utilities, such as oil companies or investment banks, to own utilities” (Citizens). This became a problem for the utility companies that crossed state lines but the government found that, after years of court litigation, four of the companies- Alabama Power, Georgia Power, Gulf Power, and Mississippi Power, were an “integrated system” and thus they were allowed to remain under common ownership. This was the beginning of the company that would become known as the Southern Company. 1981 was the year that Southern Company became the first company in over 4 decades to form and unregulated subsidiary with the formation of Southern Energy Incorporated. This was Southern Companies attempt as a service company with global reach. They were able to serve over 10 different countries on 4 continents. In 2001, Southern Energy was spun-off as Mirant Corporation. Luckily for them Mirant was sold off when it was, as it finally went bankrupt in 2009 (Mirant). Just recently, on February 20, 2015, Southern Company subsidiary, Southern Power, “announced the acquisition of two photovoltaic (PV) solar projects totaling 99 megawatts (MW) in Georgia – the 80-MW Decatur Parkway Solar Project and the 19-MW Decatur County Solar Project – from Tradewind Energy, Inc.” (CNN Money). Current Scope of Operations
The company presently is involved in the generation, transmission, and distribution of electricity through coal, nuclear, oil and gas, and hydro resources in the states of Alabama, Georgia, Florida, and Mississippi. It constructs, acquires, owns, and manages generation assets, including renewable energy projects. As of December 31, 2013, the company owned and/or operated 33 hydroelectric generating stations, 32 fossil fuel generating stations, 3 nuclear generating stations, 13 combined cycle/cogeneration stations, 6 solar facilities, 1 landfill gas facility, and 1 biomass facility. The company also provides digital wireless communications services with various communication options, including push to talk, cellular service, text messaging, wireless Internet access, and wireless data; and wholesale fiber optic solutions to telecommunication providers in the Southeast under the Southern Telecom name. In its year-end report, closing on December 31, 2014, the company reported revenues of $ 18.499 Mil, up 8.26% from the previous year.
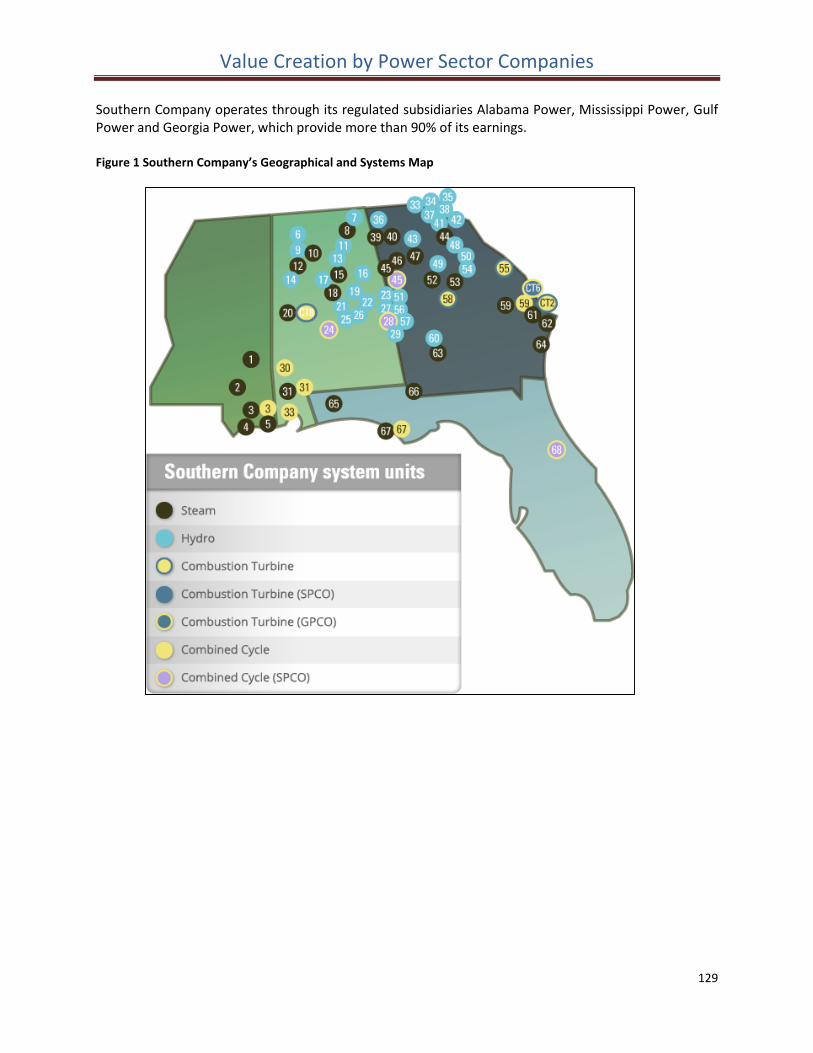
Value Creation by Power Sector Companies
129
Southern Company operates through its regulated subsidiaries Alabama Power, Mississippi Power, Gulf Power and Georgia Power, which provide more than 90% of its earnings. Figure 1 Southern Company’s Geographical and Systems Map
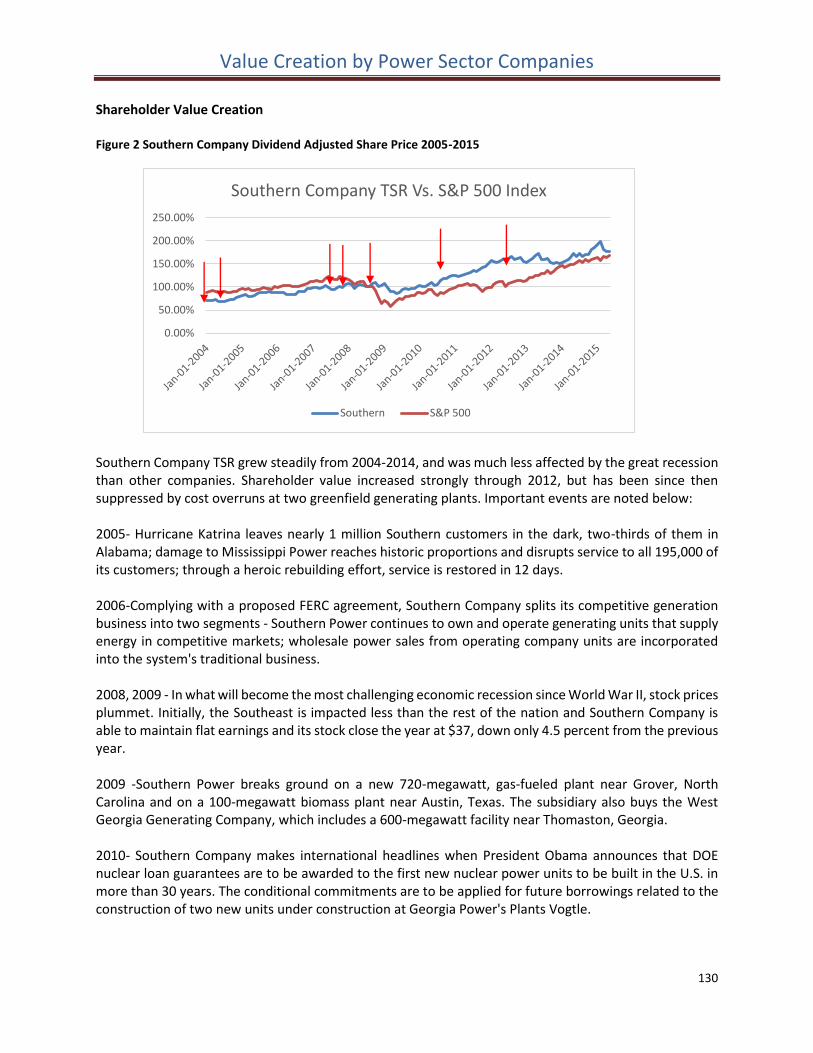
Value Creation by Power Sector Companies
130
Shareholder Value Creation Figure 2 Southern Company Dividend Adjusted Share Price 2005-2015
Southern Company TSR grew steadily from 2004-2014, and was much less affected by the great recession than other companies. Shareholder value increased strongly through 2012, but has been since then suppressed by cost overruns at two greenfield generating plants. Important events are noted below: 2005- Hurricane Katrina leaves nearly 1 million Southern customers in the dark, two-thirds of them in Alabama; damage to Mississippi Power reaches historic proportions and disrupts service to all 195,000 of its customers; through a heroic rebuilding effort, service is restored in 12 days. 2006-Complying with a proposed FERC agreement, Southern Company splits its competitive generation business into two segments - Southern Power continues to own and operate generating units that supply energy in competitive markets; wholesale power sales from operating company units are incorporated into the system's traditional business. 2008, 2009 - In what will become the most challenging economic recession since World War II, stock prices plummet. Initially, the Southeast is impacted less than the rest of the nation and Southern Company is able to maintain flat earnings and its stock close the year at $37, down only 4.5 percent from the previous year. 2009 -Southern Power breaks ground on a new 720-megawatt, gas-fueled plant near Grover, North Carolina and on a 100-megawatt biomass plant near Austin, Texas. The subsidiary also buys the West Georgia Generating Company, which includes a 600-megawatt facility near Thomaston, Georgia. 2010- Southern Company makes international headlines when President Obama announces that DOE nuclear loan guarantees are to be awarded to the first new nuclear power units to be built in the U.S. in more than 30 years. The conditional commitments are to be applied for future borrowings related to the construction of two new units under construction at Georgia Power's Plants Vogtle.
0.00%
50.00%
100.00%
150.00%
200.00%
250.00%
Southern Company TSR Vs. S&P 500 Index
Southern S&P 500
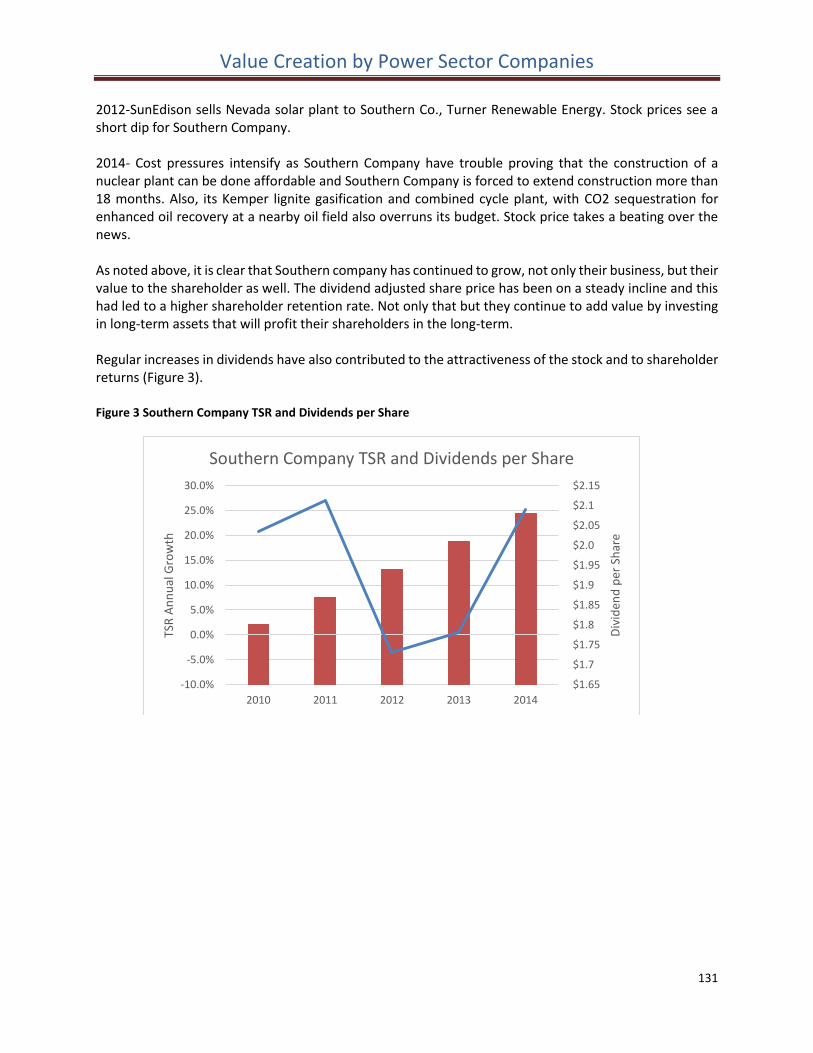
Value Creation by Power Sector Companies
131
2012-SunEdison sells Nevada solar plant to Southern Co., Turner Renewable Energy. Stock prices see a short dip for Southern Company. 2014- Cost pressures intensify as Southern Company have trouble proving that the construction of a nuclear plant can be done affordable and Southern Company is forced to extend construction more than 18 months. Also, its Kemper lignite gasification and combined cycle plant, with CO2 sequestration for enhanced oil recovery at a nearby oil field also overruns its budget. Stock price takes a beating over the news. As noted above, it is clear that Southern company has continued to grow, not only their business, but their value to the shareholder as well. The dividend adjusted share price has been on a steady incline and this had led to a higher shareholder retention rate. Not only that but they continue to add value by investing in long-term assets that will profit their shareholders in the long-term. Regular increases in dividends have also contributed to the attractiveness of the stock and to shareholder returns (Figure 3). Figure 3 Southern Company TSR and Dividends per Share
$1.65
$1.7
$1.75
$1.8
$1.85
$1.9
$1.95
$2.0
$2.05
$2.1
$2.15
-10.0%
-5.0%
0.0%
5.0%
10.0%
15.0%
20.0%
25.0%
30.0%
2010 2011 2012 2013 2014
Div
iden
d p
er S
har
e
TSR
An
nu
al G
row
th
Southern Company TSR and Dividends per Share
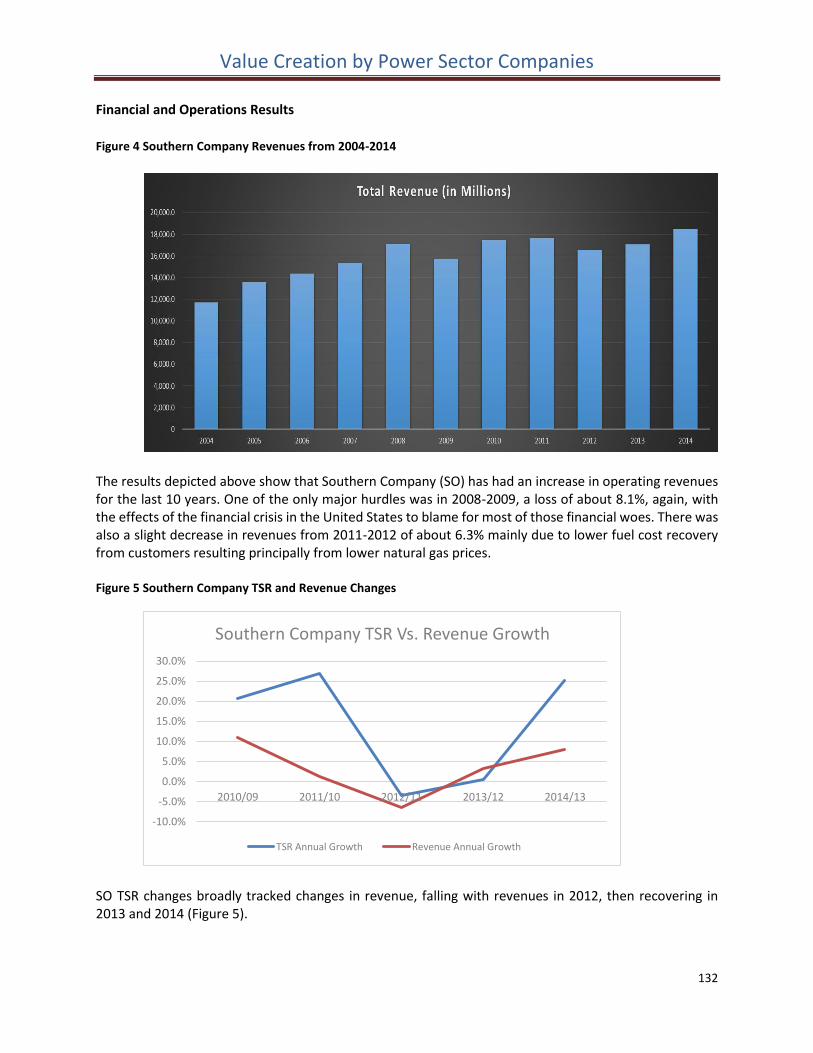
Value Creation by Power Sector Companies
132
Financial and Operations Results
Figure 4 Southern Company Revenues from 2004-2014
The results depicted above show that Southern Company (SO) has had an increase in operating revenues for the last 10 years. One of the only major hurdles was in 2008-2009, a loss of about 8.1%, again, with the effects of the financial crisis in the United States to blame for most of those financial woes. There was also a slight decrease in revenues from 2011-2012 of about 6.3% mainly due to lower fuel cost recovery from customers resulting principally from lower natural gas prices. Figure 5 Southern Company TSR and Revenue Changes
SO TSR changes broadly tracked changes in revenue, falling with revenues in 2012, then recovering in 2013 and 2014 (Figure 5).
-10.0%
-5.0%
0.0%
5.0%
10.0%
15.0%
20.0%
25.0%
30.0%
2010/09 2011/10 2012/11 2013/12 2014/13
Southern Company TSR Vs. Revenue Growth
TSR Annual Growth Revenue Annual Growth
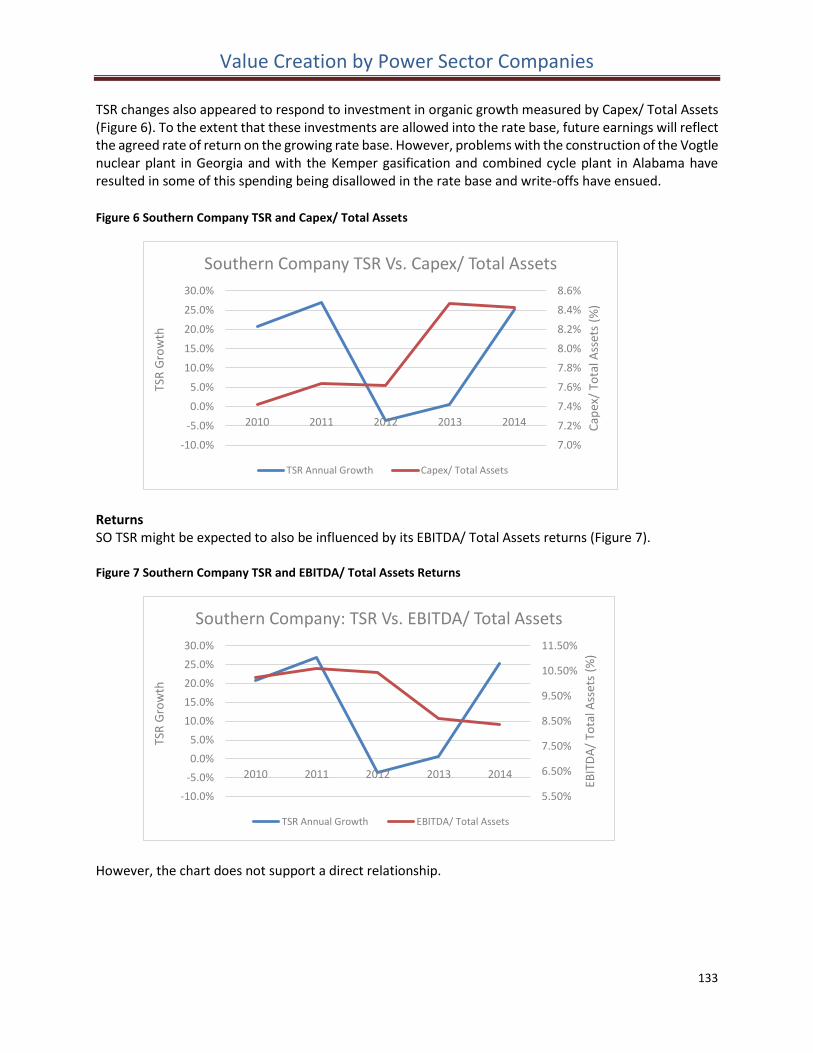
Value Creation by Power Sector Companies
133
TSR changes also appeared to respond to investment in organic growth measured by Capex/ Total Assets (Figure 6). To the extent that these investments are allowed into the rate base, future earnings will reflect the agreed rate of return on the growing rate base. However, problems with the construction of the Vogtle nuclear plant in Georgia and with the Kemper gasification and combined cycle plant in Alabama have resulted in some of this spending being disallowed in the rate base and write-offs have ensued.
Figure 6 Southern Company TSR and Capex/ Total Assets
Returns SO TSR might be expected to also be influenced by its EBITDA/ Total Assets returns (Figure 7). Figure 7 Southern Company TSR and EBITDA/ Total Assets Returns
However, the chart does not support a direct relationship.
7.0%
7.2%
7.4%
7.6%
7.8%
8.0%
8.2%
8.4%
8.6%
-10.0%
-5.0%
0.0%
5.0%
10.0%
15.0%
20.0%
25.0%
30.0%
2010 2011 2012 2013 2014 Cap
ex/
Tota
l Ass
ets
(%)
TSR
Gro
wth
Southern Company TSR Vs. Capex/ Total Assets
TSR Annual Growth Capex/ Total Assets
5.50%
6.50%
7.50%
8.50%
9.50%
10.50%
11.50%
-10.0%
-5.0%
0.0%
5.0%
10.0%
15.0%
20.0%
25.0%
30.0%
2010 2011 2012 2013 2014
EBIT
DA
/ To
tal A
sset
s (%
)
TSR
Gro
wth
Southern Company: TSR Vs. EBITDA/ Total Assets
TSR Annual Growth EBITDA/ Total Assets
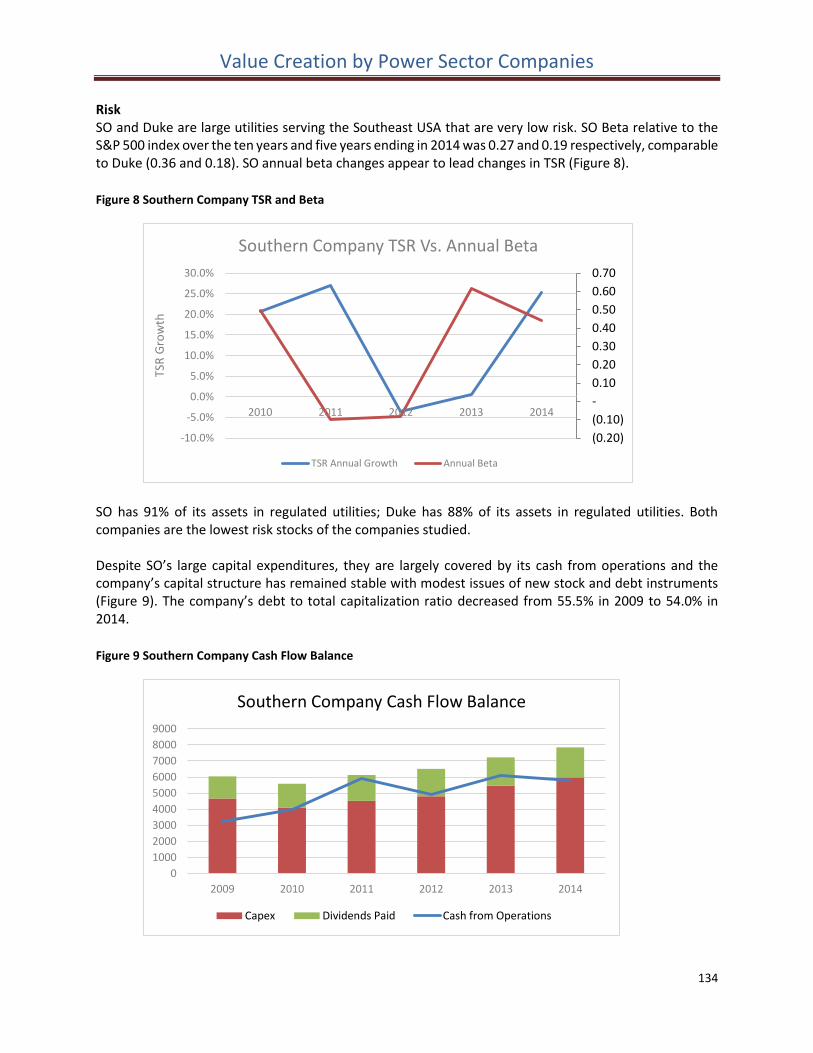
Value Creation by Power Sector Companies
134
Risk SO and Duke are large utilities serving the Southeast USA that are very low risk. SO Beta relative to the S&P 500 index over the ten years and five years ending in 2014 was 0.27 and 0.19 respectively, comparable to Duke (0.36 and 0.18). SO annual beta changes appear to lead changes in TSR (Figure 8).
Figure 8 Southern Company TSR and Beta
SO has 91% of its assets in regulated utilities; Duke has 88% of its assets in regulated utilities. Both companies are the lowest risk stocks of the companies studied. Despite SO’s large capital expenditures, they are largely covered by its cash from operations and the company’s capital structure has remained stable with modest issues of new stock and debt instruments (Figure 9). The company’s debt to total capitalization ratio decreased from 55.5% in 2009 to 54.0% in 2014.
Figure 9 Southern Company Cash Flow Balance
(0.20)
(0.10)
-
0.10
0.20
0.30
0.40
0.50
0.60
0.70
-10.0%
-5.0%
0.0%
5.0%
10.0%
15.0%
20.0%
25.0%
30.0%
2010 2011 2012 2013 2014
TSR
Gro
wth
Southern Company TSR Vs. Annual Beta
TSR Annual Growth Annual Beta
0
1000
2000
3000
4000
5000
6000
7000
8000
9000
2009 2010 2011 2012 2013 2014
Southern Company Cash Flow Balance
Capex Dividends Paid Cash from Operations
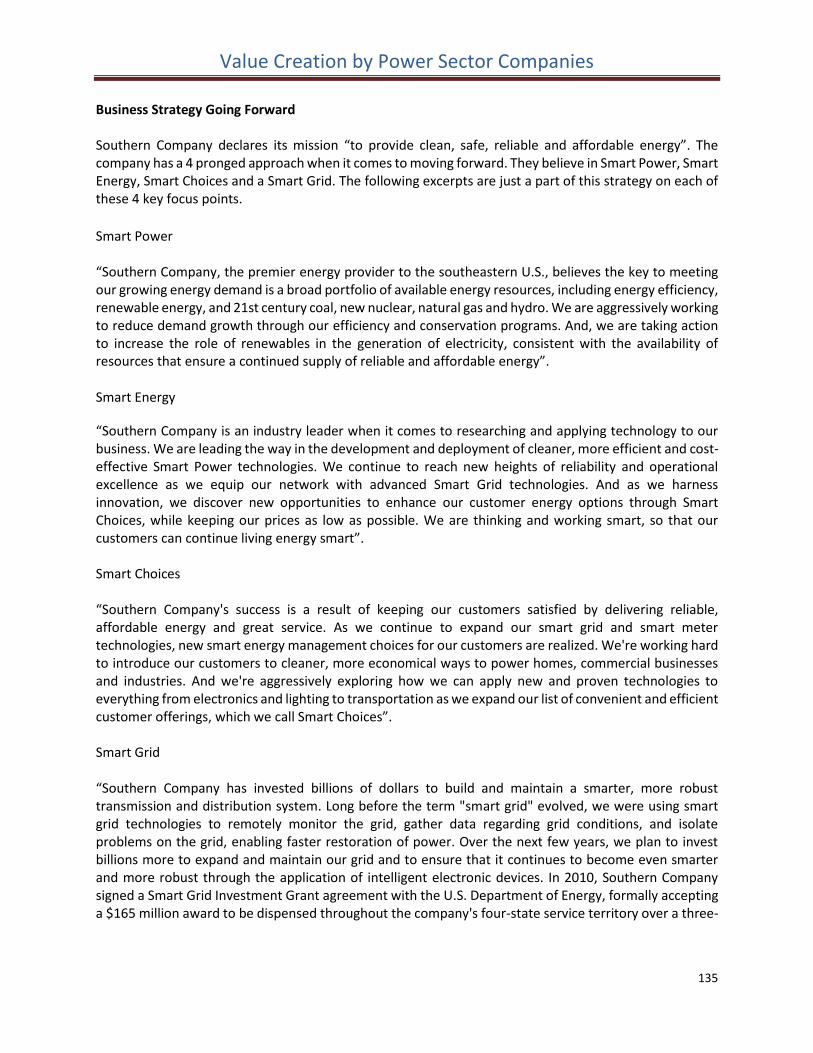
Value Creation by Power Sector Companies
135
Business Strategy Going Forward Southern Company declares its mission “to provide clean, safe, reliable and affordable energy”. The company has a 4 pronged approach when it comes to moving forward. They believe in Smart Power, Smart Energy, Smart Choices and a Smart Grid. The following excerpts are just a part of this strategy on each of these 4 key focus points.
Smart Power “Southern Company, the premier energy provider to the southeastern U.S., believes the key to meeting our growing energy demand is a broad portfolio of available energy resources, including energy efficiency, renewable energy, and 21st century coal, new nuclear, natural gas and hydro. We are aggressively working to reduce demand growth through our efficiency and conservation programs. And, we are taking action to increase the role of renewables in the generation of electricity, consistent with the availability of resources that ensure a continued supply of reliable and affordable energy”.
Smart Energy
“Southern Company is an industry leader when it comes to researching and applying technology to our business. We are leading the way in the development and deployment of cleaner, more efficient and cost-effective Smart Power technologies. We continue to reach new heights of reliability and operational excellence as we equip our network with advanced Smart Grid technologies. And as we harness innovation, we discover new opportunities to enhance our customer energy options through Smart Choices, while keeping our prices as low as possible. We are thinking and working smart, so that our customers can continue living energy smart”. Smart Choices “Southern Company's success is a result of keeping our customers satisfied by delivering reliable, affordable energy and great service. As we continue to expand our smart grid and smart meter technologies, new smart energy management choices for our customers are realized. We're working hard to introduce our customers to cleaner, more economical ways to power homes, commercial businesses and industries. And we're aggressively exploring how we can apply new and proven technologies to everything from electronics and lighting to transportation as we expand our list of convenient and efficient customer offerings, which we call Smart Choices”. Smart Grid “Southern Company has invested billions of dollars to build and maintain a smarter, more robust transmission and distribution system. Long before the term "smart grid" evolved, we were using smart grid technologies to remotely monitor the grid, gather data regarding grid conditions, and isolate problems on the grid, enabling faster restoration of power. Over the next few years, we plan to invest billions more to expand and maintain our grid and to ensure that it continues to become even smarter and more robust through the application of intelligent electronic devices. In 2010, Southern Company signed a Smart Grid Investment Grant agreement with the U.S. Department of Energy, formally accepting a $165 million award to be dispensed throughout the company's four-state service territory over a three-
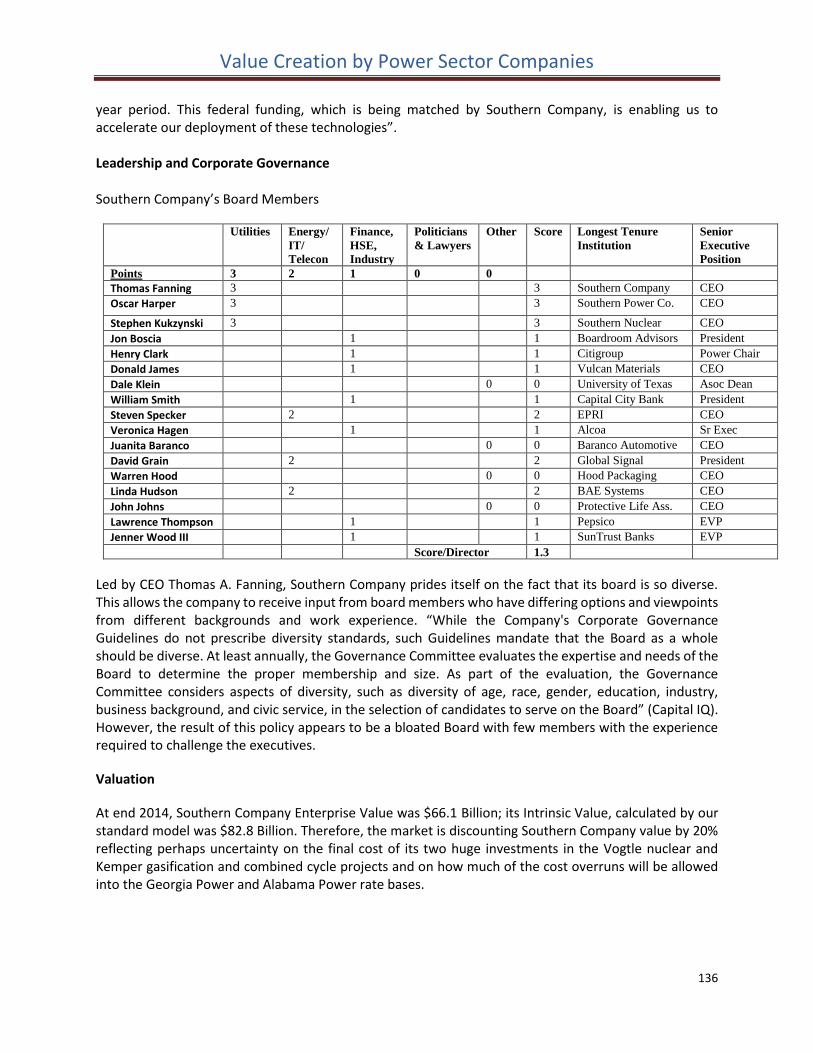
Value Creation by Power Sector Companies
136
year period. This federal funding, which is being matched by Southern Company, is enabling us to accelerate our deployment of these technologies”. Leadership and Corporate Governance
Southern Company’s Board Members
Utilities Energy/
IT/
Telecon
Finance,
HSE,
Industry
Politicians
& Lawyers
Other Score Longest Tenure
Institution
Senior
Executive
Position
Points 3 2 1 0 0
Thomas Fanning 3 3 Southern Company CEO
Oscar Harper 3 3 Southern Power Co. CEO
Stephen Kukzynski 3 3 Southern Nuclear CEO
Jon Boscia 1 1 Boardroom Advisors President
Henry Clark 1 1 Citigroup Power Chair
Donald James 1 1 Vulcan Materials CEO
Dale Klein 0 0 University of Texas Asoc Dean
William Smith 1 1 Capital City Bank President
Steven Specker 2 2 EPRI CEO
Veronica Hagen 1 1 Alcoa Sr Exec
Juanita Baranco 0 0 Baranco Automotive CEO
David Grain 2 2 Global Signal President
Warren Hood 0 0 Hood Packaging CEO
Linda Hudson 2 2 BAE Systems CEO
John Johns 0 0 Protective Life Ass. CEO
Lawrence Thompson 1 1 Pepsico EVP
Jenner Wood III 1 1 SunTrust Banks EVP
Score/Director 1.3
Led by CEO Thomas A. Fanning, Southern Company prides itself on the fact that its board is so diverse. This allows the company to receive input from board members who have differing options and viewpoints from different backgrounds and work experience. “While the Company's Corporate Governance Guidelines do not prescribe diversity standards, such Guidelines mandate that the Board as a whole should be diverse. At least annually, the Governance Committee evaluates the expertise and needs of the Board to determine the proper membership and size. As part of the evaluation, the Governance Committee considers aspects of diversity, such as diversity of age, race, gender, education, industry, business background, and civic service, in the selection of candidates to serve on the Board” (Capital IQ). However, the result of this policy appears to be a bloated Board with few members with the experience required to challenge the executives.
Valuation
At end 2014, Southern Company Enterprise Value was $66.1 Billion; its Intrinsic Value, calculated by our standard model was $82.8 Billion. Therefore, the market is discounting Southern Company value by 20% reflecting perhaps uncertainty on the final cost of its two huge investments in the Vogtle nuclear and Kemper gasification and combined cycle projects and on how much of the cost overruns will be allowed into the Georgia Power and Alabama Power rate bases.
Value Creation by Power Sector Companies
137
13. ENGIE (formerly GDF Suez)
History
ENGIE SA (formerly GdF Suez) is a global energy player and an expert operator in three key sectors - electricity, natural gas and energy services. GDF SUEZ S.A. was founded on July 16th 2008 thru the merger of Gaz de France, Europe’s largest natural gas operator, and Suez S.A, a Franco-Belgium utility group, in the hope to become the world's largest liquefied natural gas company. Before the 2008 merger, the state of France owned 80% of Gaz de France and as a result of the merger now owns 35% of GDF Suez, strongly influencing the Group’s strategy.
Gaz de France (GDF) and its sister company Electricity de France (EDF) were formed in 1946 by the France government. GDF produced, transported and sold natural gas around the world, especially in France, its main market. The company was also particularly active in Belgium, the United Kingdom, Germany and other European countries. In 2005, GDF’s capital was partially floated on the Paris Stock Exchange raising €2.5 Bn for the France Government which still continued to own 80% of the company until 2008 when GDF merged with Suez. Suez S.A. was formed in 1997 as a merger between Compagnie de Suez and Lyonnaise des Eaux. The scope of the merger was to group into a single business line the water management operations in France. The goal was accomplished in 2003 when the water management, waste management and energy division were consolidated in a separate entity named SUEZ Environment Group. After the GDF and Suez merger in 2008, the GDF Suez spun off SUEZ Environment Group which was valued at € 20 Bn, leaving GDF Suez with assets valuing more than € 90 Bn. Suez history goes back to the 1822 foundation of Societe Generale des Pays-Bas by William of Orange and the 1858 creation in Paris by Ferdinand de Lesseps of the Universal Company for the Maritime Channel of Suez. Suez was one of the oldest multinational corporations in the world as the result of nearly two centuries of reorganization and corporate mergers. The origin of its name 'Suez' traces back to its founding entity – the Compagnie Universelle du Canal Maritime de Suez founded in 1858 to build the Suez Canal. In 1860, GDF SUEZ took its first steps in international business by obtaining concessions for gas street lighting and urban transport electrification – a marriage of gas and electricity which typifies the Group to this day. The Group pioneered the development of LNG (liquefied natural gas) chains and in the 1960s created the very first LNG transport shipping line set up between Algeria and France. In order to ensure the security of its natural gas portfolio, in the second half of the 20th century GDF SUEZ set out to diversify its supply sources. This determination gradually bore fruit: Algeria in 1965, the Netherlands in 1967, Russia in 1975 and Norway from 1977 became the Group’s major suppliers. Other countries taking part in this geographic diversification of supply sources included the United Kingdom, Egypt, Qatar, Trinidad & Tobago and Azerbaijan. In 2000, GDF SUEZ took over the running of the oldest operational LNG terminal in the USA (in Boston) and in 2007 helped strengthen security of supply in the north of Chile, building a natural gas terminal. The Group has also held a stake in two Indian terminals since 2006. GDF SUEZ got involved in exploration-production at the end of the 1990s, first of all in Germany and the British North Sea, then via new sites in Africa/M-E (Egypt, Algeria, Qatar), Europe (the Netherlands,
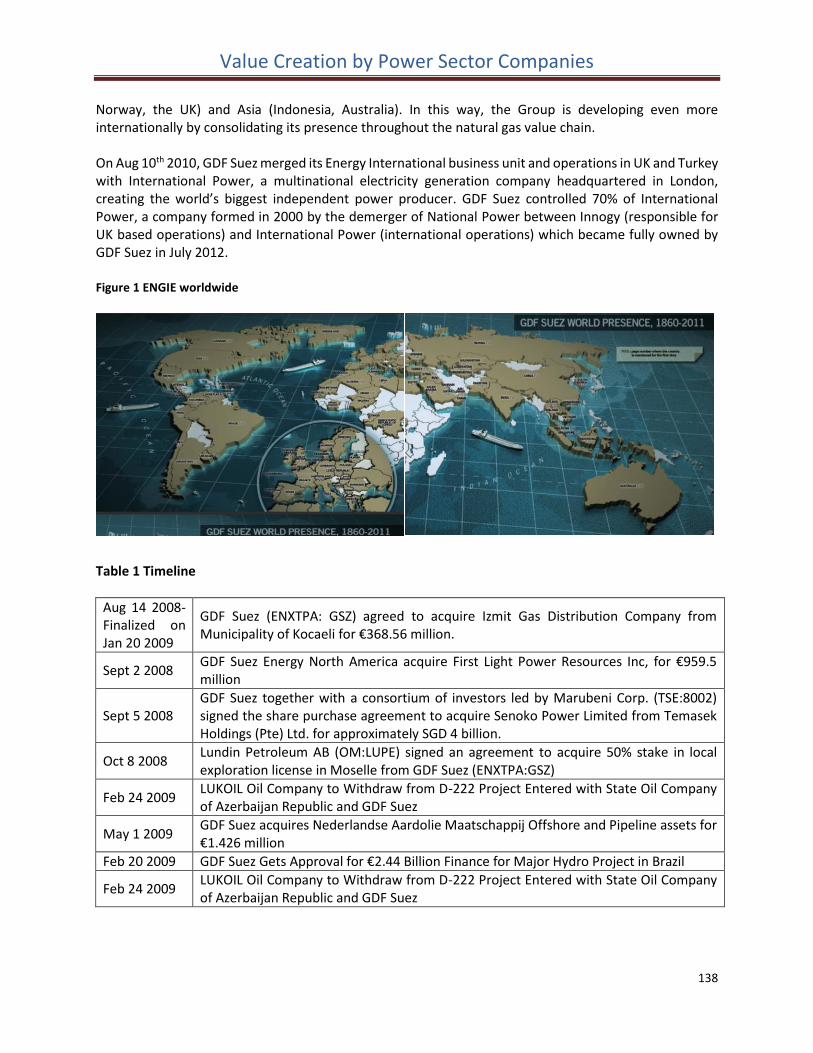
Value Creation by Power Sector Companies
138
Norway, the UK) and Asia (Indonesia, Australia). In this way, the Group is developing even more internationally by consolidating its presence throughout the natural gas value chain. On Aug 10th 2010, GDF Suez merged its Energy International business unit and operations in UK and Turkey with International Power, a multinational electricity generation company headquartered in London, creating the world’s biggest independent power producer. GDF Suez controlled 70% of International Power, a company formed in 2000 by the demerger of National Power between Innogy (responsible for UK based operations) and International Power (international operations) which became fully owned by GDF Suez in July 2012. Figure 1 ENGIE worldwide
Table 1 Timeline
Aug 14 2008- Finalized on Jan 20 2009
GDF Suez (ENXTPA: GSZ) agreed to acquire Izmit Gas Distribution Company from Municipality of Kocaeli for €368.56 million.
Sept 2 2008 GDF Suez Energy North America acquire First Light Power Resources Inc, for €959.5 million
Sept 5 2008 GDF Suez together with a consortium of investors led by Marubeni Corp. (TSE:8002) signed the share purchase agreement to acquire Senoko Power Limited from Temasek Holdings (Pte) Ltd. for approximately SGD 4 billion.
Oct 8 2008 Lundin Petroleum AB (OM:LUPE) signed an agreement to acquire 50% stake in local exploration license in Moselle from GDF Suez (ENXTPA:GSZ)
Feb 24 2009 LUKOIL Oil Company to Withdraw from D-222 Project Entered with State Oil Company of Azerbaijan Republic and GDF Suez
May 1 2009 GDF Suez acquires Nederlandse Aardolie Maatschappij Offshore and Pipeline assets for €1.426 million
Feb 20 2009 GDF Suez Gets Approval for €2.44 Billion Finance for Major Hydro Project in Brazil
Feb 24 2009 LUKOIL Oil Company to Withdraw from D-222 Project Entered with State Oil Company of Azerbaijan Republic and GDF Suez
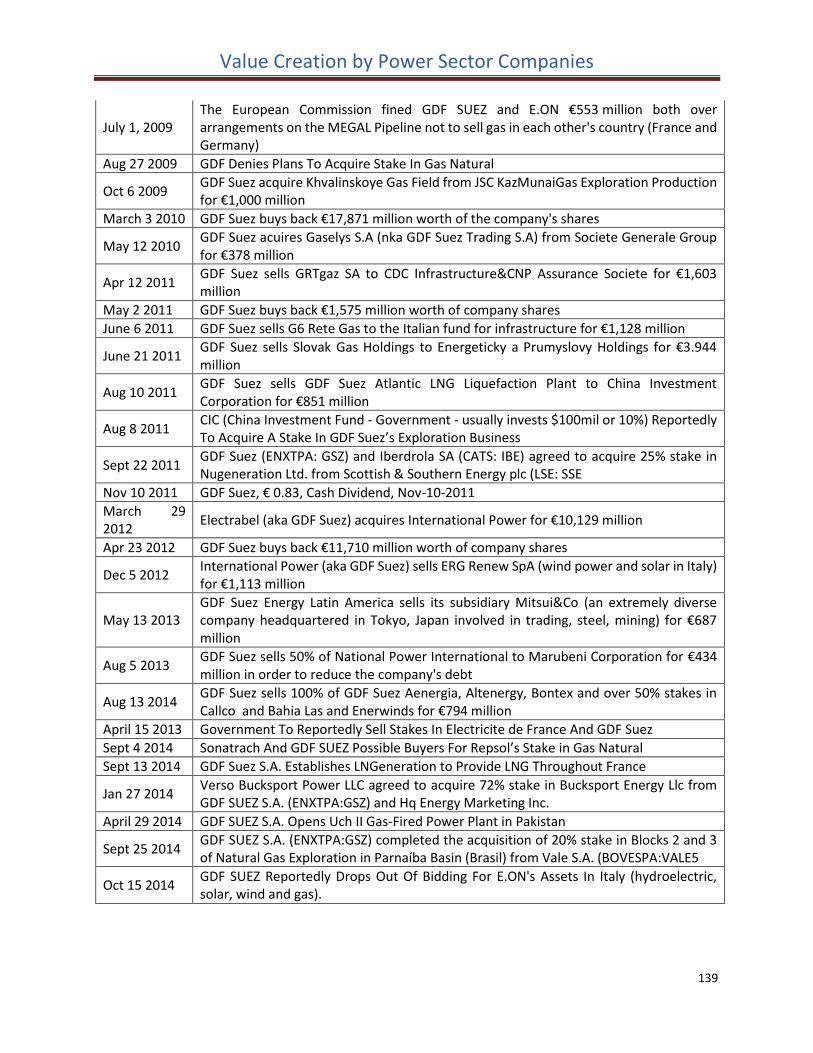
Value Creation by Power Sector Companies
139
July 1, 2009 The European Commission fined GDF SUEZ and E.ON €553 million both over arrangements on the MEGAL Pipeline not to sell gas in each other's country (France and Germany)
Aug 27 2009 GDF Denies Plans To Acquire Stake In Gas Natural
Oct 6 2009 GDF Suez acquire Khvalinskoye Gas Field from JSC KazMunaiGas Exploration Production for €1,000 million
March 3 2010 GDF Suez buys back €17,871 million worth of the company's shares
May 12 2010 GDF Suez acuires Gaselys S.A (nka GDF Suez Trading S.A) from Societe Generale Group for €378 million
Apr 12 2011 GDF Suez sells GRTgaz SA to CDC Infrastructure&CNP Assurance Societe for €1,603 million
May 2 2011 GDF Suez buys back €1,575 million worth of company shares
June 6 2011 GDF Suez sells G6 Rete Gas to the Italian fund for infrastructure for €1,128 million
June 21 2011 GDF Suez sells Slovak Gas Holdings to Energeticky a Prumyslovy Holdings for €3.944 million
Aug 10 2011 GDF Suez sells GDF Suez Atlantic LNG Liquefaction Plant to China Investment Corporation for €851 million
Aug 8 2011 CIC (China Investment Fund - Government - usually invests $100mil or 10%) Reportedly To Acquire A Stake In GDF Suez’s Exploration Business
Sept 22 2011 GDF Suez (ENXTPA: GSZ) and Iberdrola SA (CATS: IBE) agreed to acquire 25% stake in Nugeneration Ltd. from Scottish & Southern Energy plc (LSE: SSE
Nov 10 2011 GDF Suez, € 0.83, Cash Dividend, Nov-10-2011
March 29 2012
Electrabel (aka GDF Suez) acquires International Power for €10,129 million
Apr 23 2012 GDF Suez buys back €11,710 million worth of company shares
Dec 5 2012 International Power (aka GDF Suez) sells ERG Renew SpA (wind power and solar in Italy) for €1,113 million
May 13 2013 GDF Suez Energy Latin America sells its subsidiary Mitsui&Co (an extremely diverse company headquartered in Tokyo, Japan involved in trading, steel, mining) for €687 million
Aug 5 2013 GDF Suez sells 50% of National Power International to Marubeni Corporation for €434 million in order to reduce the company's debt
Aug 13 2014 GDF Suez sells 100% of GDF Suez Aenergia, Altenergy, Bontex and over 50% stakes in Callco and Bahia Las and Enerwinds for €794 million
April 15 2013 Government To Reportedly Sell Stakes In Electricite de France And GDF Suez
Sept 4 2014 Sonatrach And GDF SUEZ Possible Buyers For Repsol’s Stake in Gas Natural
Sept 13 2014 GDF Suez S.A. Establishes LNGeneration to Provide LNG Throughout France
Jan 27 2014 Verso Bucksport Power LLC agreed to acquire 72% stake in Bucksport Energy Llc from GDF SUEZ S.A. (ENXTPA:GSZ) and Hq Energy Marketing Inc.
April 29 2014 GDF SUEZ S.A. Opens Uch II Gas-Fired Power Plant in Pakistan
Sept 25 2014 GDF SUEZ S.A. (ENXTPA:GSZ) completed the acquisition of 20% stake in Blocks 2 and 3 of Natural Gas Exploration in Parnaíba Basin (Brasil) from Vale S.A. (BOVESPA:VALE5
Oct 15 2014 GDF SUEZ Reportedly Drops Out Of Bidding For E.ON's Assets In Italy (hydroelectric, solar, wind and gas).
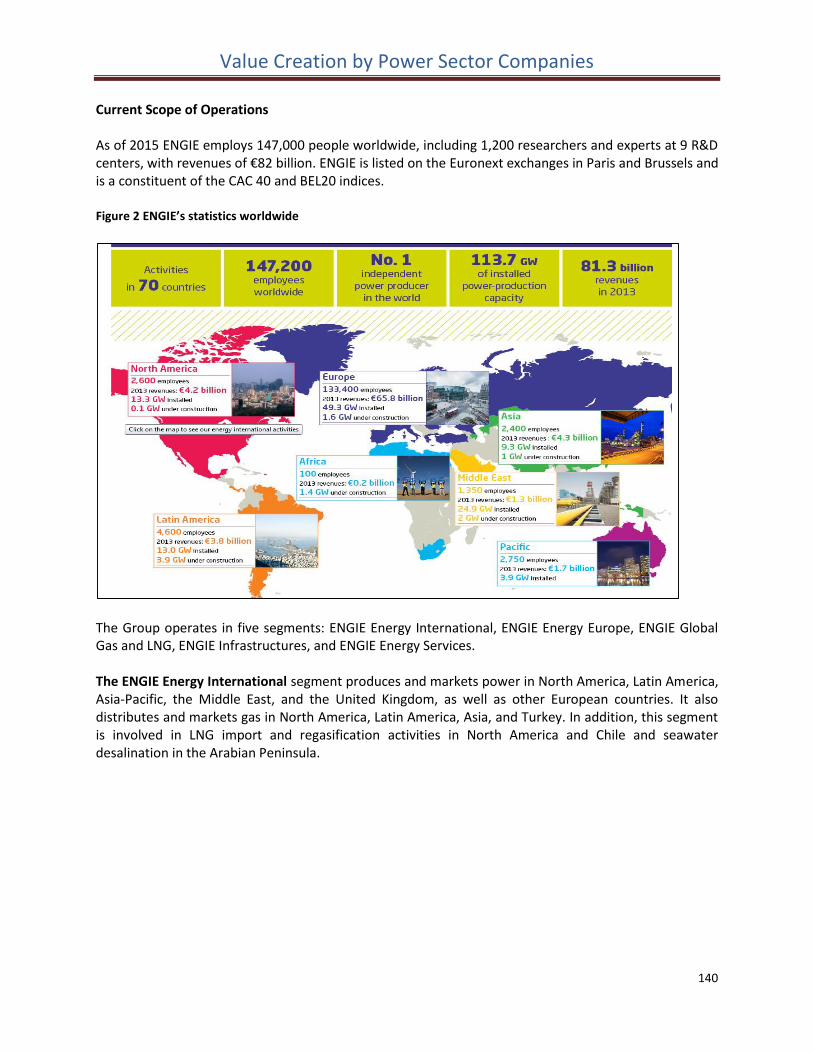
Value Creation by Power Sector Companies
140
Current Scope of Operations As of 2015 ENGIE employs 147,000 people worldwide, including 1,200 researchers and experts at 9 R&D centers, with revenues of €82 billion. ENGIE is listed on the Euronext exchanges in Paris and Brussels and is a constituent of the CAC 40 and BEL20 indices. Figure 2 ENGIE’s statistics worldwide
The Group operates in five segments: ENGIE Energy International, ENGIE Energy Europe, ENGIE Global Gas and LNG, ENGIE Infrastructures, and ENGIE Energy Services. The ENGIE Energy International segment produces and markets power in North America, Latin America, Asia-Pacific, the Middle East, and the United Kingdom, as well as other European countries. It also distributes and markets gas in North America, Latin America, Asia, and Turkey. In addition, this segment is involved in LNG import and regasification activities in North America and Chile and seawater desalination in the Arabian Peninsula.
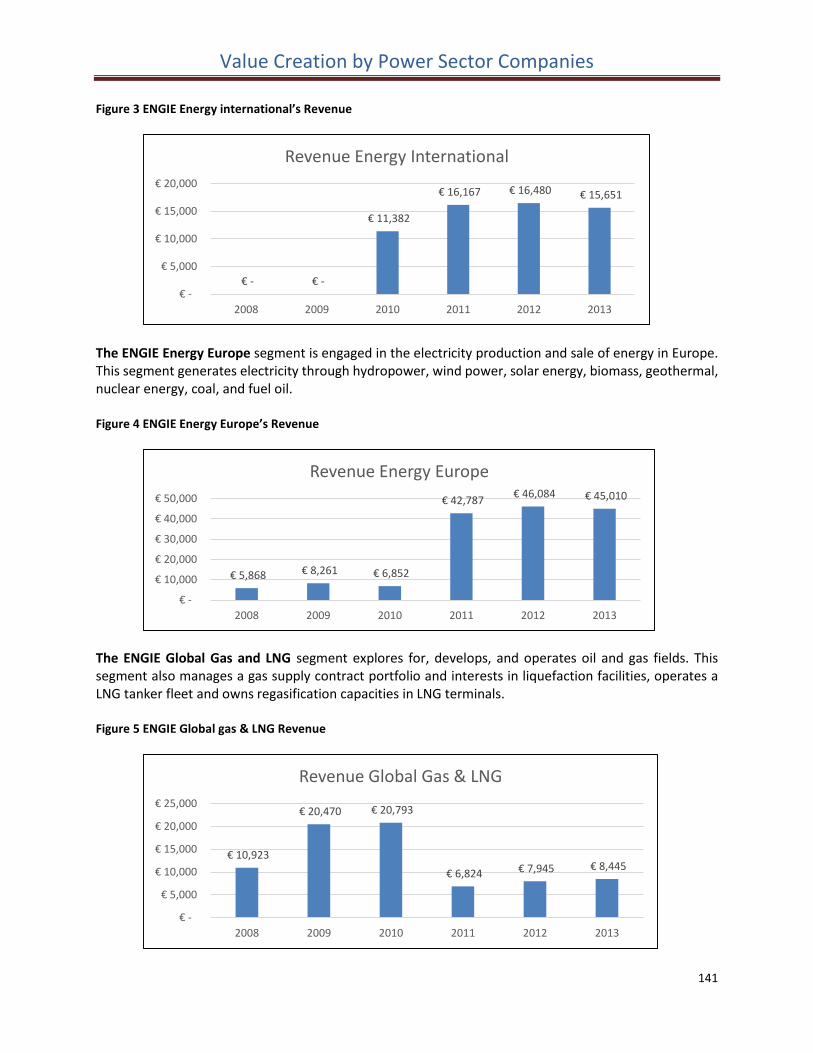
Value Creation by Power Sector Companies
141
Figure 3 ENGIE Energy international’s Revenue
The ENGIE Energy Europe segment is engaged in the electricity production and sale of energy in Europe. This segment generates electricity through hydropower, wind power, solar energy, biomass, geothermal, nuclear energy, coal, and fuel oil. Figure 4 ENGIE Energy Europe’s Revenue
The ENGIE Global Gas and LNG segment explores for, develops, and operates oil and gas fields. This segment also manages a gas supply contract portfolio and interests in liquefaction facilities, operates a LNG tanker fleet and owns regasification capacities in LNG terminals. Figure 5 ENGIE Global gas & LNG Revenue
€ - € -
€ 11,382
€ 16,167 € 16,480 € 15,651
€ -
€ 5,000
€ 10,000
€ 15,000
€ 20,000
2008 2009 2010 2011 2012 2013
Revenue Energy International
€ 5,868 € 8,261 € 6,852
€ 42,787 € 46,084 € 45,010
€ -
€ 10,000
€ 20,000
€ 30,000
€ 40,000
€ 50,000
2008 2009 2010 2011 2012 2013
Revenue Energy Europe
€ 10,923
€ 20,470 € 20,793
€ 6,824 € 7,945 € 8,445
€ -
€ 5,000
€ 10,000
€ 15,000
€ 20,000
€ 25,000
2008 2009 2010 2011 2012 2013
Revenue Global Gas & LNG
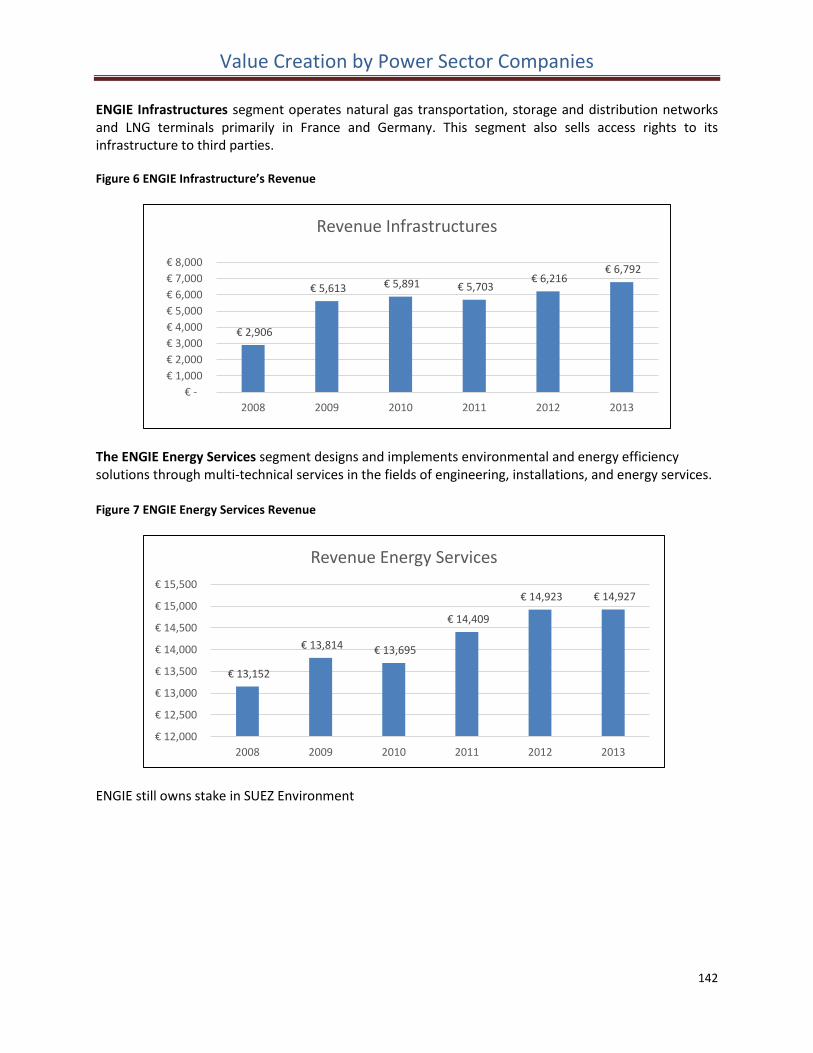
Value Creation by Power Sector Companies
142
ENGIE Infrastructures segment operates natural gas transportation, storage and distribution networks and LNG terminals primarily in France and Germany. This segment also sells access rights to its infrastructure to third parties. Figure 6 ENGIE Infrastructure’s Revenue
The ENGIE Energy Services segment designs and implements environmental and energy efficiency solutions through multi-technical services in the fields of engineering, installations, and energy services. Figure 7 ENGIE Energy Services Revenue
ENGIE still owns stake in SUEZ Environment
€ 2,906
€ 5,613 € 5,891 € 5,703 € 6,216
€ 6,792
€ -
€ 1,000
€ 2,000
€ 3,000
€ 4,000
€ 5,000
€ 6,000
€ 7,000
€ 8,000
2008 2009 2010 2011 2012 2013
Revenue Infrastructures
€ 13,152
€ 13,814 € 13,695
€ 14,409
€ 14,923 € 14,927
€ 12,000
€ 12,500
€ 13,000
€ 13,500
€ 14,000
€ 14,500
€ 15,000
€ 15,500
2008 2009 2010 2011 2012 2013
Revenue Energy Services
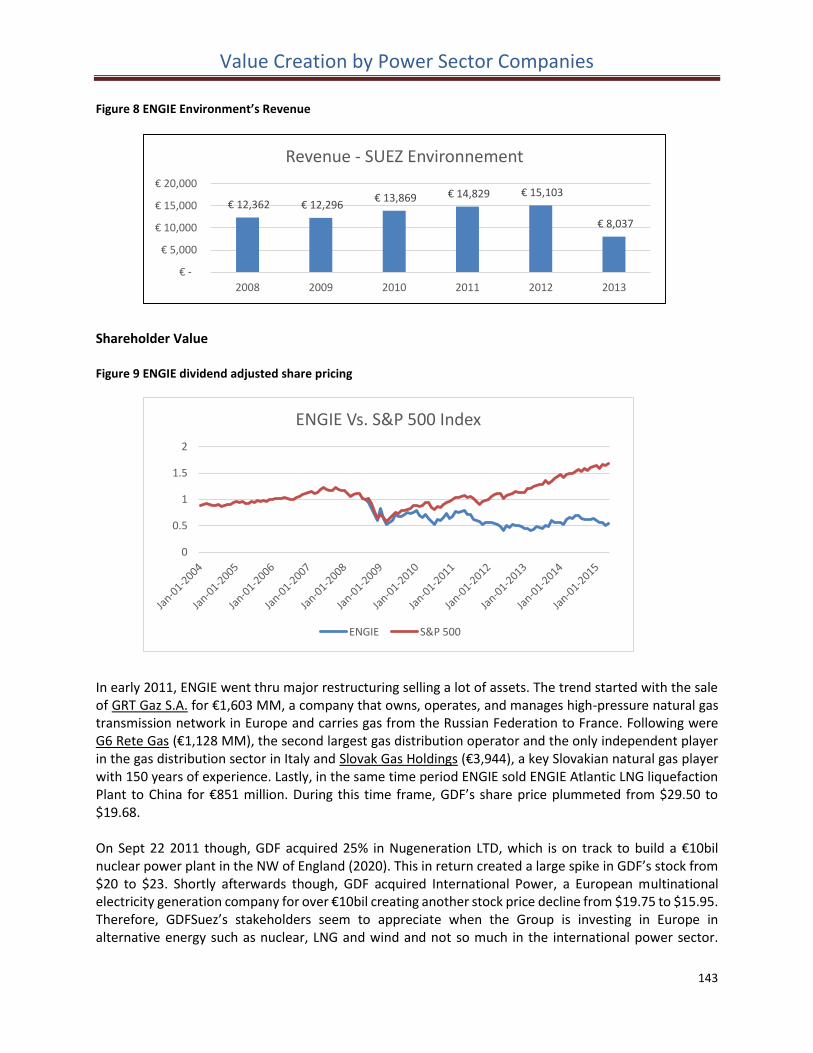
Value Creation by Power Sector Companies
143
Figure 8 ENGIE Environment’s Revenue
Shareholder Value Figure 9 ENGIE dividend adjusted share pricing
In early 2011, ENGIE went thru major restructuring selling a lot of assets. The trend started with the sale of GRT Gaz S.A. for €1,603 MM, a company that owns, operates, and manages high-pressure natural gas transmission network in Europe and carries gas from the Russian Federation to France. Following were G6 Rete Gas (€1,128 MM), the second largest gas distribution operator and the only independent player in the gas distribution sector in Italy and Slovak Gas Holdings (€3,944), a key Slovakian natural gas player with 150 years of experience. Lastly, in the same time period ENGIE sold ENGIE Atlantic LNG liquefaction Plant to China for €851 million. During this time frame, GDF’s share price plummeted from $29.50 to $19.68. On Sept 22 2011 though, GDF acquired 25% in Nugeneration LTD, which is on track to build a €10bil nuclear power plant in the NW of England (2020). This in return created a large spike in GDF’s stock from $20 to $23. Shortly afterwards though, GDF acquired International Power, a European multinational electricity generation company for over €10bil creating another stock price decline from $19.75 to $15.95. Therefore, GDFSuez’s stakeholders seem to appreciate when the Group is investing in Europe in alternative energy such as nuclear, LNG and wind and not so much in the international power sector.
€ 12,362 € 12,296 € 13,869 € 14,829 € 15,103
€ 8,037
€ -
€ 5,000
€ 10,000
€ 15,000
€ 20,000
2008 2009 2010 2011 2012 2013
Revenue - SUEZ Environnement
0
0.5
1
1.5
2
ENGIE Vs. S&P 500 Index
ENGIE S&P 500
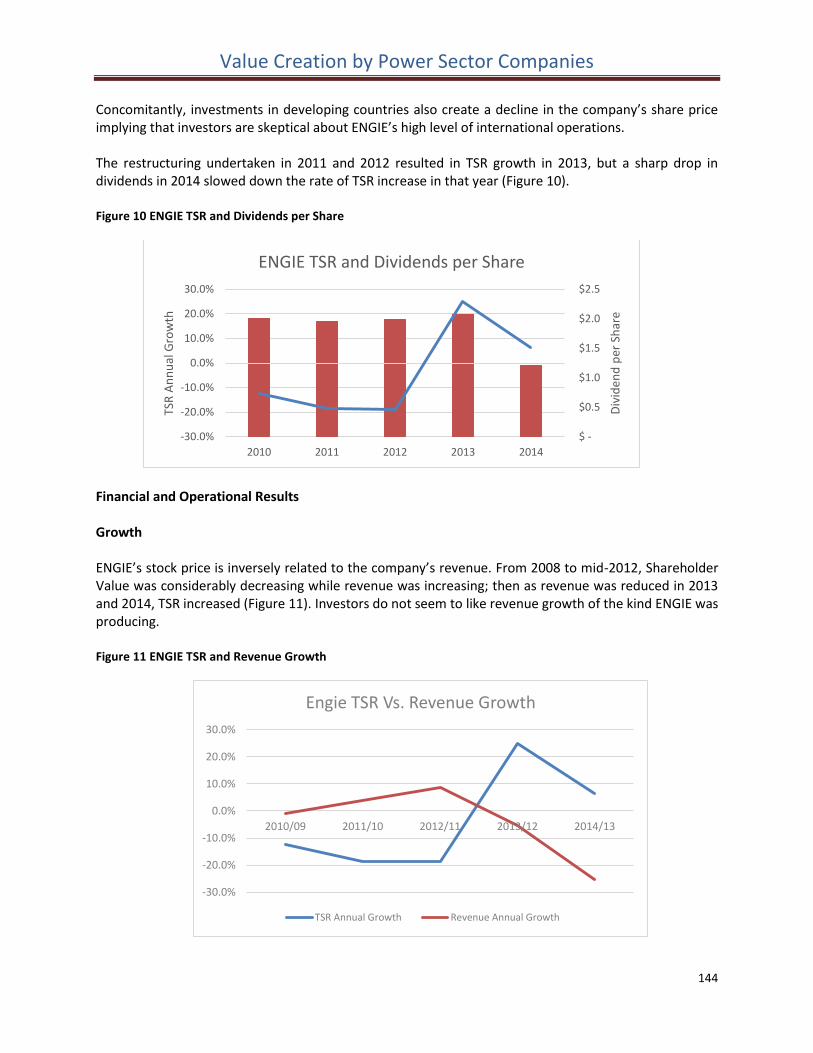
Value Creation by Power Sector Companies
144
Concomitantly, investments in developing countries also create a decline in the company’s share price implying that investors are skeptical about ENGIE’s high level of international operations. The restructuring undertaken in 2011 and 2012 resulted in TSR growth in 2013, but a sharp drop in dividends in 2014 slowed down the rate of TSR increase in that year (Figure 10). Figure 10 ENGIE TSR and Dividends per Share
Financial and Operational Results Growth ENGIE’s stock price is inversely related to the company’s revenue. From 2008 to mid-2012, Shareholder Value was considerably decreasing while revenue was increasing; then as revenue was reduced in 2013 and 2014, TSR increased (Figure 11). Investors do not seem to like revenue growth of the kind ENGIE was producing. Figure 11 ENGIE TSR and Revenue Growth
$ -
$0.5
$1.0
$1.5
$2.0
$2.5
-30.0%
-20.0%
-10.0%
0.0%
10.0%
20.0%
30.0%
2010 2011 2012 2013 2014
Div
iden
d p
er S
har
e
TSR
An
nu
al G
row
th
ENGIE TSR and Dividends per Share
-30.0%
-20.0%
-10.0%
0.0%
10.0%
20.0%
30.0%
2010/09 2011/10 2012/11 2013/12 2014/13
Engie TSR Vs. Revenue Growth
TSR Annual Growth Revenue Annual Growth
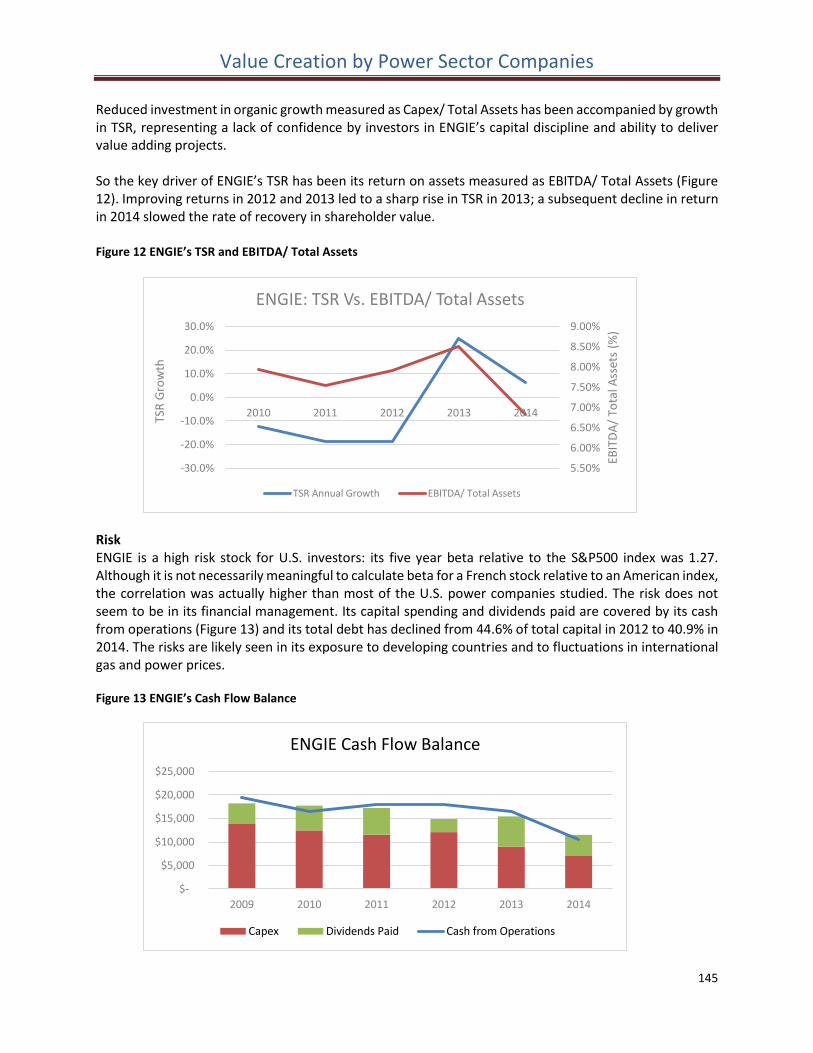
Value Creation by Power Sector Companies
145
Reduced investment in organic growth measured as Capex/ Total Assets has been accompanied by growth in TSR, representing a lack of confidence by investors in ENGIE’s capital discipline and ability to deliver value adding projects. So the key driver of ENGIE’s TSR has been its return on assets measured as EBITDA/ Total Assets (Figure 12). Improving returns in 2012 and 2013 led to a sharp rise in TSR in 2013; a subsequent decline in return in 2014 slowed the rate of recovery in shareholder value. Figure 12 ENGIE’s TSR and EBITDA/ Total Assets
Risk ENGIE is a high risk stock for U.S. investors: its five year beta relative to the S&P500 index was 1.27. Although it is not necessarily meaningful to calculate beta for a French stock relative to an American index, the correlation was actually higher than most of the U.S. power companies studied. The risk does not seem to be in its financial management. Its capital spending and dividends paid are covered by its cash from operations (Figure 13) and its total debt has declined from 44.6% of total capital in 2012 to 40.9% in 2014. The risks are likely seen in its exposure to developing countries and to fluctuations in international gas and power prices. Figure 13 ENGIE’s Cash Flow Balance
5.50%
6.00%
6.50%
7.00%
7.50%
8.00%
8.50%
9.00%
-30.0%
-20.0%
-10.0%
0.0%
10.0%
20.0%
30.0%
2010 2011 2012 2013 2014
EBIT
DA
/ To
tal A
sset
s (%
)
TSR
Gro
wth
ENGIE: TSR Vs. EBITDA/ Total Assets
TSR Annual Growth EBITDA/ Total Assets
$-
$5,000
$10,000
$15,000
$20,000
$25,000
2009 2010 2011 2012 2013 2014
ENGIE Cash Flow Balance
Capex Dividends Paid Cash from Operations
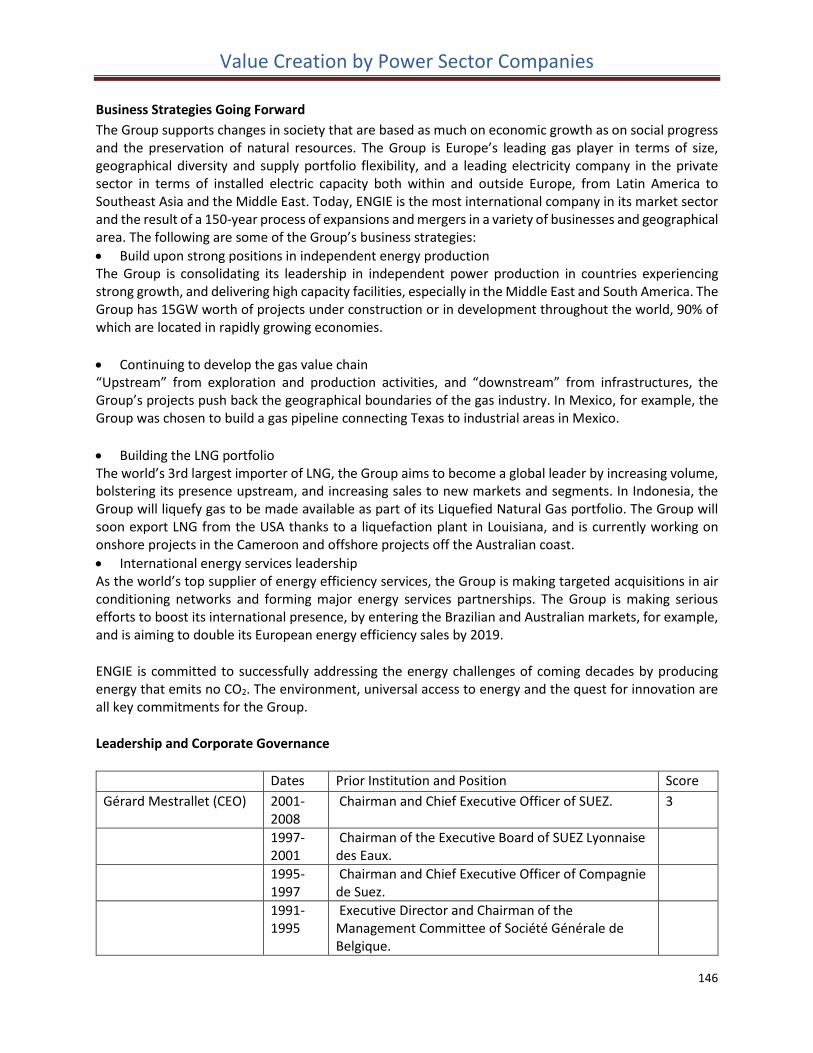
Value Creation by Power Sector Companies
146
Business Strategies Going Forward
The Group supports changes in society that are based as much on economic growth as on social progress and the preservation of natural resources. The Group is Europe’s leading gas player in terms of size, geographical diversity and supply portfolio flexibility, and a leading electricity company in the private sector in terms of installed electric capacity both within and outside Europe, from Latin America to Southeast Asia and the Middle East. Today, ENGIE is the most international company in its market sector and the result of a 150-year process of expansions and mergers in a variety of businesses and geographical area. The following are some of the Group’s business strategies:
Build upon strong positions in independent energy production The Group is consolidating its leadership in independent power production in countries experiencing strong growth, and delivering high capacity facilities, especially in the Middle East and South America. The Group has 15GW worth of projects under construction or in development throughout the world, 90% of which are located in rapidly growing economies.
Continuing to develop the gas value chain “Upstream” from exploration and production activities, and “downstream” from infrastructures, the Group’s projects push back the geographical boundaries of the gas industry. In Mexico, for example, the Group was chosen to build a gas pipeline connecting Texas to industrial areas in Mexico.
Building the LNG portfolio The world’s 3rd largest importer of LNG, the Group aims to become a global leader by increasing volume, bolstering its presence upstream, and increasing sales to new markets and segments. In Indonesia, the Group will liquefy gas to be made available as part of its Liquefied Natural Gas portfolio. The Group will soon export LNG from the USA thanks to a liquefaction plant in Louisiana, and is currently working on onshore projects in the Cameroon and offshore projects off the Australian coast.
International energy services leadership As the world’s top supplier of energy efficiency services, the Group is making targeted acquisitions in air conditioning networks and forming major energy services partnerships. The Group is making serious efforts to boost its international presence, by entering the Brazilian and Australian markets, for example, and is aiming to double its European energy efficiency sales by 2019.
ENGIE is committed to successfully addressing the energy challenges of coming decades by producing energy that emits no CO2. The environment, universal access to energy and the quest for innovation are all key commitments for the Group.
Leadership and Corporate Governance
Dates Prior Institution and Position Score
Gérard Mestrallet (CEO) 2001-2008
Chairman and Chief Executive Officer of SUEZ. 3
1997-2001
Chairman of the Executive Board of SUEZ Lyonnaise des Eaux.
1995-1997
Chairman and Chief Executive Officer of Compagnie de Suez.
1991-1995
Executive Director and Chairman of the Management Committee of Société Générale de Belgique.
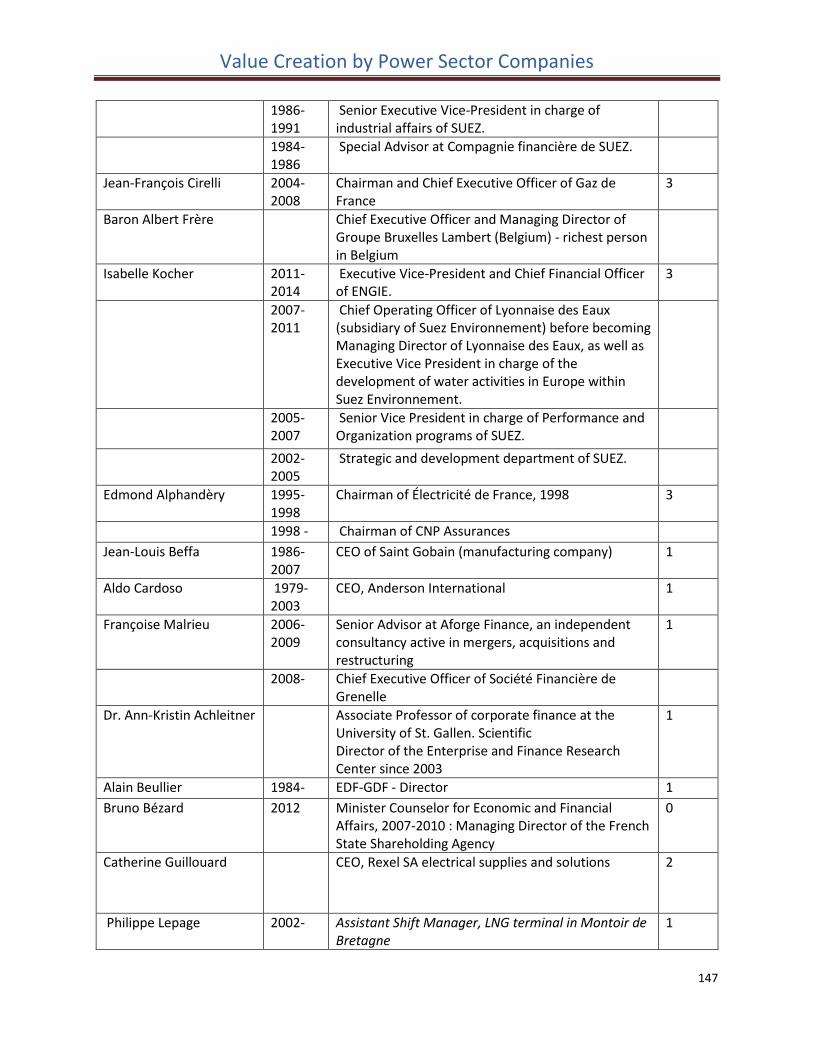
Value Creation by Power Sector Companies
147
1986-1991
Senior Executive Vice-President in charge of industrial affairs of SUEZ.
1984-1986
Special Advisor at Compagnie financière de SUEZ.
Jean-François Cirelli 2004-2008
Chairman and Chief Executive Officer of Gaz de France
3
Baron Albert Frère Chief Executive Officer and Managing Director of Groupe Bruxelles Lambert (Belgium) - richest person in Belgium
Isabelle Kocher 2011-2014
Executive Vice-President and Chief Financial Officer of ENGIE.
3
2007-2011
Chief Operating Officer of Lyonnaise des Eaux (subsidiary of Suez Environnement) before becoming Managing Director of Lyonnaise des Eaux, as well as Executive Vice President in charge of the development of water activities in Europe within Suez Environnement.
2005-2007
Senior Vice President in charge of Performance and Organization programs of SUEZ.
2002-2005
Strategic and development department of SUEZ.
Edmond Alphandèry 1995-1998
Chairman of Électricité de France, 1998 3
1998 - Chairman of CNP Assurances
Jean-Louis Beffa 1986-2007
CEO of Saint Gobain (manufacturing company) 1
Aldo Cardoso 1979-2003
CEO, Anderson International 1
Françoise Malrieu 2006-2009
Senior Advisor at Aforge Finance, an independent consultancy active in mergers, acquisitions and restructuring
1
2008- Chief Executive Officer of Société Financière de Grenelle
Dr. Ann-Kristin Achleitner Associate Professor of corporate finance at the University of St. Gallen. Scientific Director of the Enterprise and Finance Research Center since 2003
1
Alain Beullier 1984- EDF-GDF - Director 1
Bruno Bézard 2012 Minister Counselor for Economic and Financial Affairs, 2007-2010 : Managing Director of the French State Shareholding Agency
0
Catherine Guillouard CEO, Rexel SA electrical supplies and solutions 2
Philippe Lepage 2002- Assistant Shift Manager, LNG terminal in Montoir de Bretagne
1
Value Creation by Power Sector Companies
148
Mari-Noelle Jego-Laveissiere
Senior Executive of Orange 2
Barbara Kux Phillips Electronics, previously with Siemens 2
Astrid Milsan Deputy Director of Services, Aerospace and Defense sub-division of APE since 2011, Deputy Director of Energy and other investments at the State Investment Agency (APE) since 2009
1
Marie-Jose Nadeau 2006- EVP Rolland Enterprises, previously EVP Hydro-Quebec
2
Anne-Marie Mourer 1996- GDF - Sales, Marketing Manager then Program Manager Natural Gas
3
Stéphane Pallez 2004- Deputy Chief Financial Officer of France Telecom-Orange, before becoming Chairman and Chief Executive Officer of the Caisse Centrale de Réassurances
2
Caroline Simon 1997- GDF - Purchasing Position - Union Representative 1
David Simon Chief executive of BP from 1992 to 1995 and chairman from 1995 to 1997
3
Average score/ director 1.9
GDF’s Board of Directors is a diverse and balanced group of individuals coming mostly from the energy field, electronics and finance. A number of board members previously worked for Gaz de France in the last decade or so. However, the nineteen member Board appears cumbersome and it is difficult to imagine it working effectively to debate critical strategic issues. Nevertheless, the Board has worked with management to restructure the company and increase dollar denominated shareholder value in 2013 and 2014 despite weakness in the Euro.
Valuation
At the end of 2014, ENGIE Enterprise value was $116 Billion, while our standard model calculated an intrinsic value of $89 Billion, representing a 30% market premium. Investors apparently believe that there is more growth, more synergies and/or lower risk in the EGIE portfolio that the assumptions incorporated in our model.
Value Creation by Power Sector Companies
149
14. Dominion Resources Inc.
Timeline
Dominion Resources Inc. is a power and energy company based in Richmond Virginia. Through its subsidiaries the company primarily supplies electricity to North Carolina as well as supplying natural gas to Ohio, West Virginia and North Carolina. Dominion’s corporate history can be traced back to industrial era ‘predecessor’ companies. These companies held interests in railways, electric lighting and canal barges. As early as 1909 what is now Dominion began operations under the name Virginia Railway & Power Company. VRPC initially operated as an investor owned electric utility company. Dominion operated as such until 1925, when the company name was changed from Virginia Railway & Power Company to Virginia Electric & Power Co. During this period the company operated as a regulated monopoly. Dominion eventually merged with the Virginia Public Services Company in 1940 effectively doubling its service territory. Dominion Resources Inc. was then incorporated in 1980 as the holding company for Virginia Electric & Power Co. In the mid-1980s Virginia Electric & Power Co. was divided into three separate operational divisions, North Carolina Power, West Virginia Power and Virginia Power. In the late 80s these operational divisions came under cost benefit scrutiny with West Virginia Power ultimately being sold in 1987. The 1990’s saw a series of expansions by Dominion into both regulated and unregulated energy businesses. These expansions included Dominion establishing itself as a Nuclear Power operator, with an eye to the future (today approximately 41% of Dominion’s power generation comes from nuclear). In the early 2000’s in a continuation of their expansion, Dominion purchased Consolidated Natural Gas Company. Additionally, Dominion purchased Louis Dreyfus Natural Gas Company. Both acquisition substantially increased Dominion’s capacity for natural gas delivery in the North-Eastern United States. In 2000 Dominion Resources Inc. re-branded all of its operations ‘Dominion’ in an effort to create the perception of a more unified energy company. 2007 saw Dominion consolidate its core business strengths (gas and electric operations) by divesting of its oil and natural gas exploration and production facilities both onshore and in the Gulf of Mexico. In Late 2012, Dominion entered into a joint venture with Caiman Energy II, LLC. The joint venture, Blue Racer Midstream, LLC aims to provide midstream services to natural gas producers located in the Utica shale, primarily in Pennsylvania and Ohio regions. Blue Racer partners with those producers to provide gathering, processing and fractionation services. After winning final federal approval in September 2014, Dominion, via an MLP announced plans to begin development of its Cove Point facility into a Liquefied Natural Gas export hub. Construction related activities at Cove Point began in October 2014 and is aimed at converting the existing site from a natural gas import to export facility. Dominion has invested approximately $3.8 billion dollars in the project. The primary aim of the project is to exploit the United States’ natural gas surplus as a result for the fracking boom and export into foreign markets. Cove Point is scheduled to begin shipments of LNG from the facility in 2017 and is estimated to have 5.25 million tons per year capacity. Current Scope of Operations Dominion currently operates via three operating business segments, Dominion Generation, Dominion Virginia Power and Dominion Energy spread across the North East United States. The company is
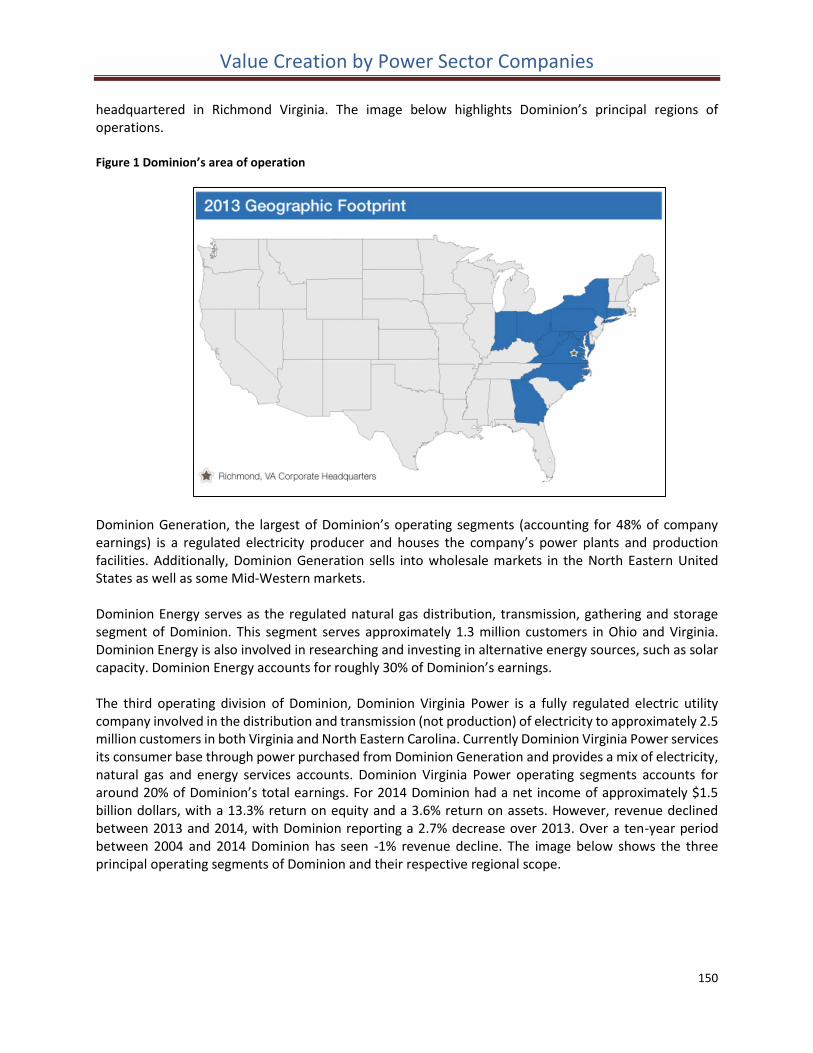
Value Creation by Power Sector Companies
150
headquartered in Richmond Virginia. The image below highlights Dominion’s principal regions of operations. Figure 1 Dominion’s area of operation
Dominion Generation, the largest of Dominion’s operating segments (accounting for 48% of company earnings) is a regulated electricity producer and houses the company’s power plants and production facilities. Additionally, Dominion Generation sells into wholesale markets in the North Eastern United States as well as some Mid-Western markets. Dominion Energy serves as the regulated natural gas distribution, transmission, gathering and storage segment of Dominion. This segment serves approximately 1.3 million customers in Ohio and Virginia. Dominion Energy is also involved in researching and investing in alternative energy sources, such as solar capacity. Dominion Energy accounts for roughly 30% of Dominion’s earnings. The third operating division of Dominion, Dominion Virginia Power is a fully regulated electric utility company involved in the distribution and transmission (not production) of electricity to approximately 2.5 million customers in both Virginia and North Eastern Carolina. Currently Dominion Virginia Power services its consumer base through power purchased from Dominion Generation and provides a mix of electricity, natural gas and energy services accounts. Dominion Virginia Power operating segments accounts for around 20% of Dominion’s total earnings. For 2014 Dominion had a net income of approximately $1.5 billion dollars, with a 13.3% return on equity and a 3.6% return on assets. However, revenue declined between 2013 and 2014, with Dominion reporting a 2.7% decrease over 2013. Over a ten-year period between 2004 and 2014 Dominion has seen -1% revenue decline. The image below shows the three principal operating segments of Dominion and their respective regional scope.
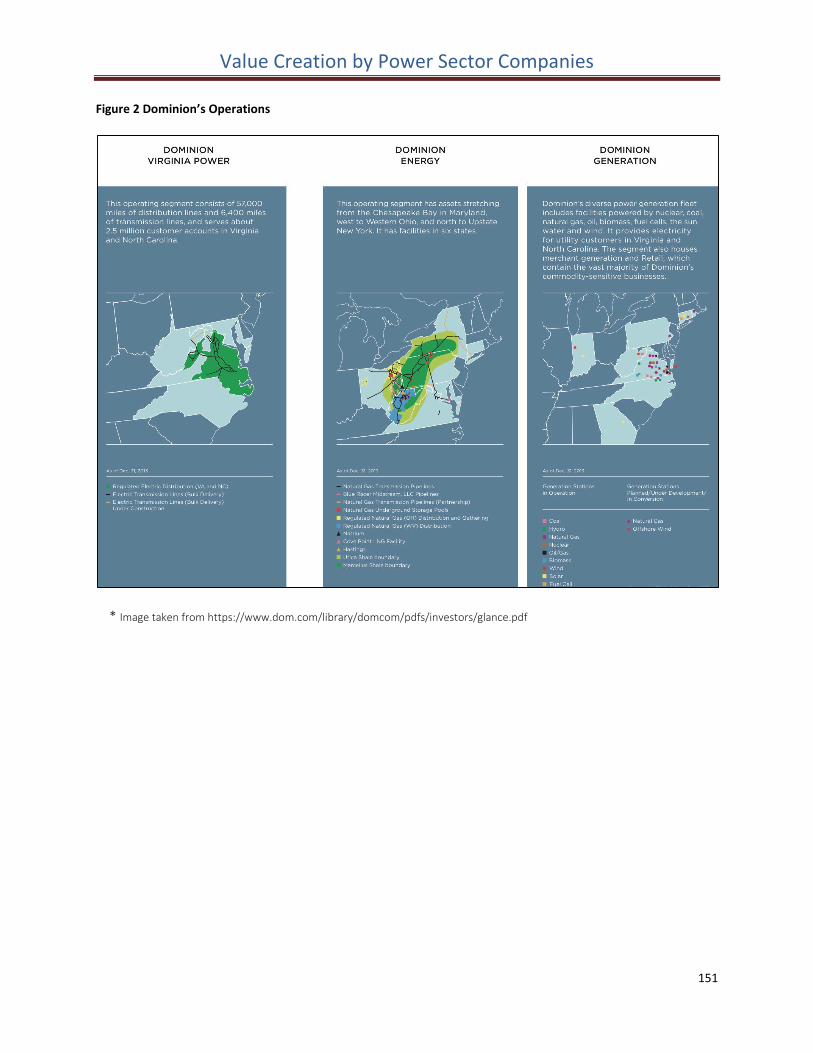
Value Creation by Power Sector Companies
151
Figure 2 Dominion’s Operations
* Image taken from https://www.dom.com/library/domcom/pdfs/investors/glance.pdf
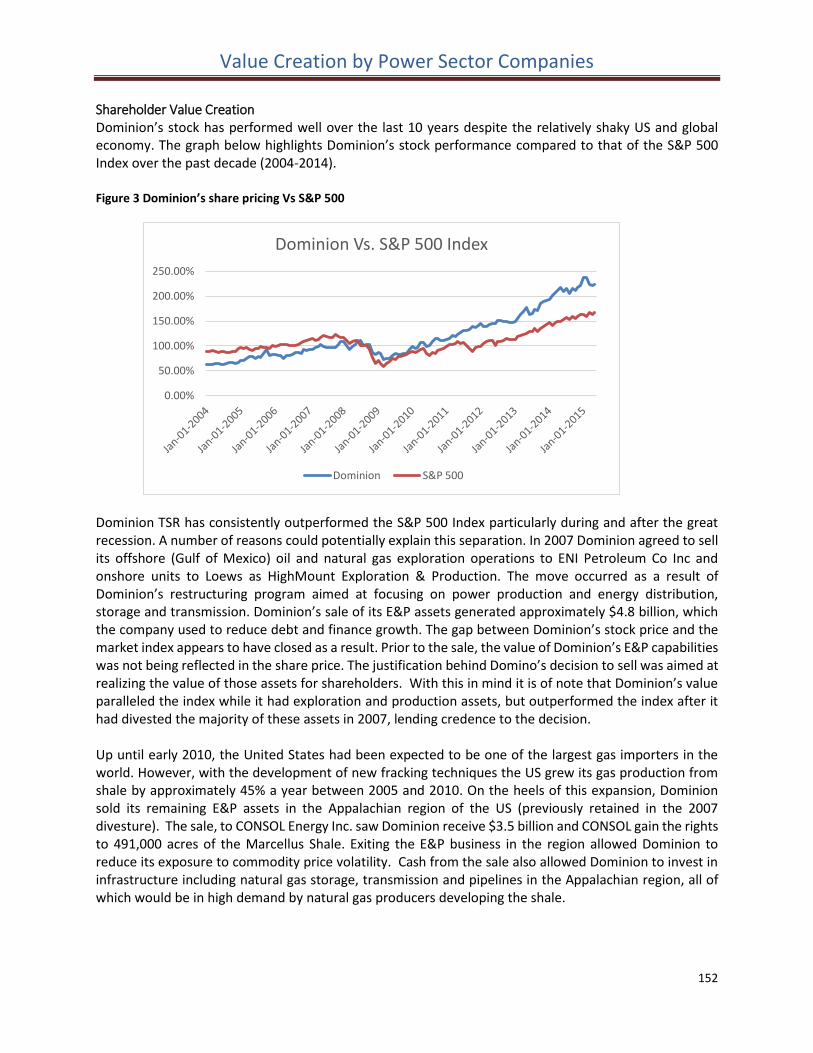
Value Creation by Power Sector Companies
152
Shareholder Value Creation Dominion’s stock has performed well over the last 10 years despite the relatively shaky US and global economy. The graph below highlights Dominion’s stock performance compared to that of the S&P 500 Index over the past decade (2004-2014). Figure 3 Dominion’s share pricing Vs S&P 500
Dominion TSR has consistently outperformed the S&P 500 Index particularly during and after the great recession. A number of reasons could potentially explain this separation. In 2007 Dominion agreed to sell its offshore (Gulf of Mexico) oil and natural gas exploration operations to ENI Petroleum Co Inc and onshore units to Loews as HighMount Exploration & Production. The move occurred as a result of Dominion’s restructuring program aimed at focusing on power production and energy distribution, storage and transmission. Dominion’s sale of its E&P assets generated approximately $4.8 billion, which the company used to reduce debt and finance growth. The gap between Dominion’s stock price and the market index appears to have closed as a result. Prior to the sale, the value of Dominion’s E&P capabilities was not being reflected in the share price. The justification behind Domino’s decision to sell was aimed at realizing the value of those assets for shareholders. With this in mind it is of note that Dominion’s value paralleled the index while it had exploration and production assets, but outperformed the index after it had divested the majority of these assets in 2007, lending credence to the decision. Up until early 2010, the United States had been expected to be one of the largest gas importers in the world. However, with the development of new fracking techniques the US grew its gas production from shale by approximately 45% a year between 2005 and 2010. On the heels of this expansion, Dominion sold its remaining E&P assets in the Appalachian region of the US (previously retained in the 2007 divesture). The sale, to CONSOL Energy Inc. saw Dominion receive $3.5 billion and CONSOL gain the rights to 491,000 acres of the Marcellus Shale. Exiting the E&P business in the region allowed Dominion to reduce its exposure to commodity price volatility. Cash from the sale also allowed Dominion to invest in infrastructure including natural gas storage, transmission and pipelines in the Appalachian region, all of which would be in high demand by natural gas producers developing the shale.
0.00%
50.00%
100.00%
150.00%
200.00%
250.00%
Dominion Vs. S&P 500 Index
Dominion S&P 500
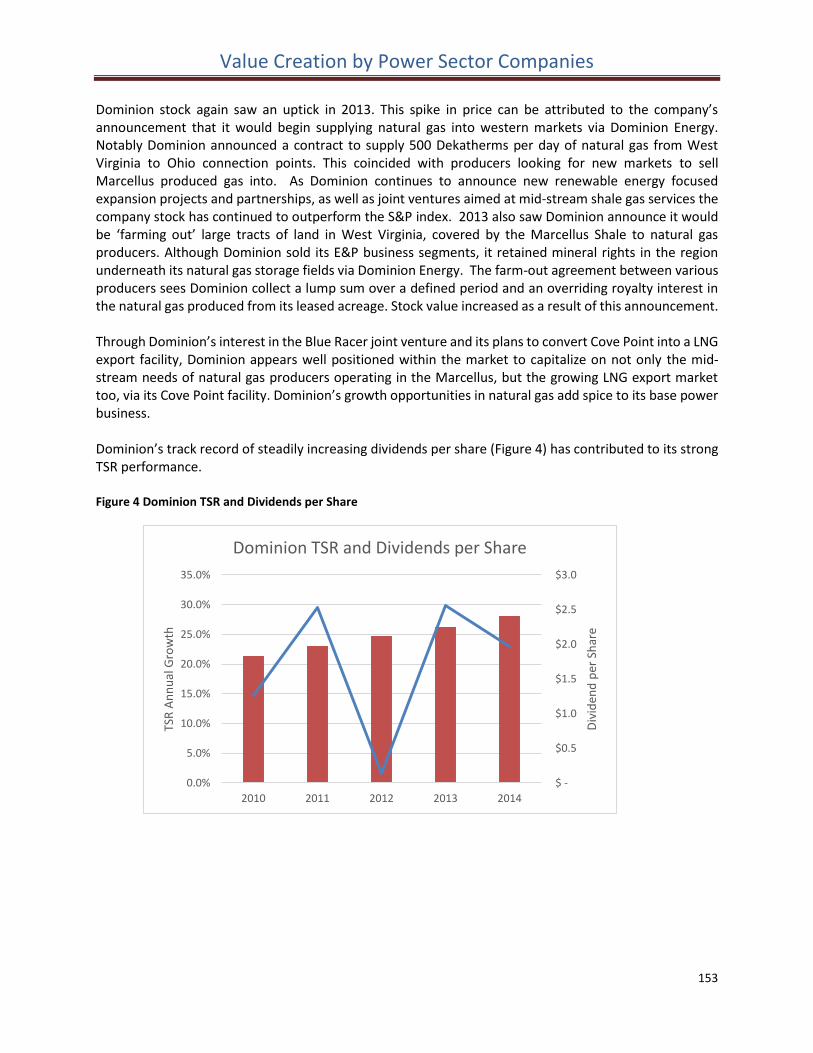
Value Creation by Power Sector Companies
153
Dominion stock again saw an uptick in 2013. This spike in price can be attributed to the company’s announcement that it would begin supplying natural gas into western markets via Dominion Energy. Notably Dominion announced a contract to supply 500 Dekatherms per day of natural gas from West Virginia to Ohio connection points. This coincided with producers looking for new markets to sell Marcellus produced gas into. As Dominion continues to announce new renewable energy focused expansion projects and partnerships, as well as joint ventures aimed at mid-stream shale gas services the company stock has continued to outperform the S&P index. 2013 also saw Dominion announce it would be ‘farming out’ large tracts of land in West Virginia, covered by the Marcellus Shale to natural gas producers. Although Dominion sold its E&P business segments, it retained mineral rights in the region underneath its natural gas storage fields via Dominion Energy. The farm-out agreement between various producers sees Dominion collect a lump sum over a defined period and an overriding royalty interest in the natural gas produced from its leased acreage. Stock value increased as a result of this announcement. Through Dominion’s interest in the Blue Racer joint venture and its plans to convert Cove Point into a LNG export facility, Dominion appears well positioned within the market to capitalize on not only the mid-stream needs of natural gas producers operating in the Marcellus, but the growing LNG export market too, via its Cove Point facility. Dominion’s growth opportunities in natural gas add spice to its base power business. Dominion’s track record of steadily increasing dividends per share (Figure 4) has contributed to its strong TSR performance. Figure 4 Dominion TSR and Dividends per Share
$ -
$0.5
$1.0
$1.5
$2.0
$2.5
$3.0
0.0%
5.0%
10.0%
15.0%
20.0%
25.0%
30.0%
35.0%
2010 2011 2012 2013 2014
Div
iden
d p
er S
har
e
TSR
An
nu
al G
row
th
Dominion TSR and Dividends per Share
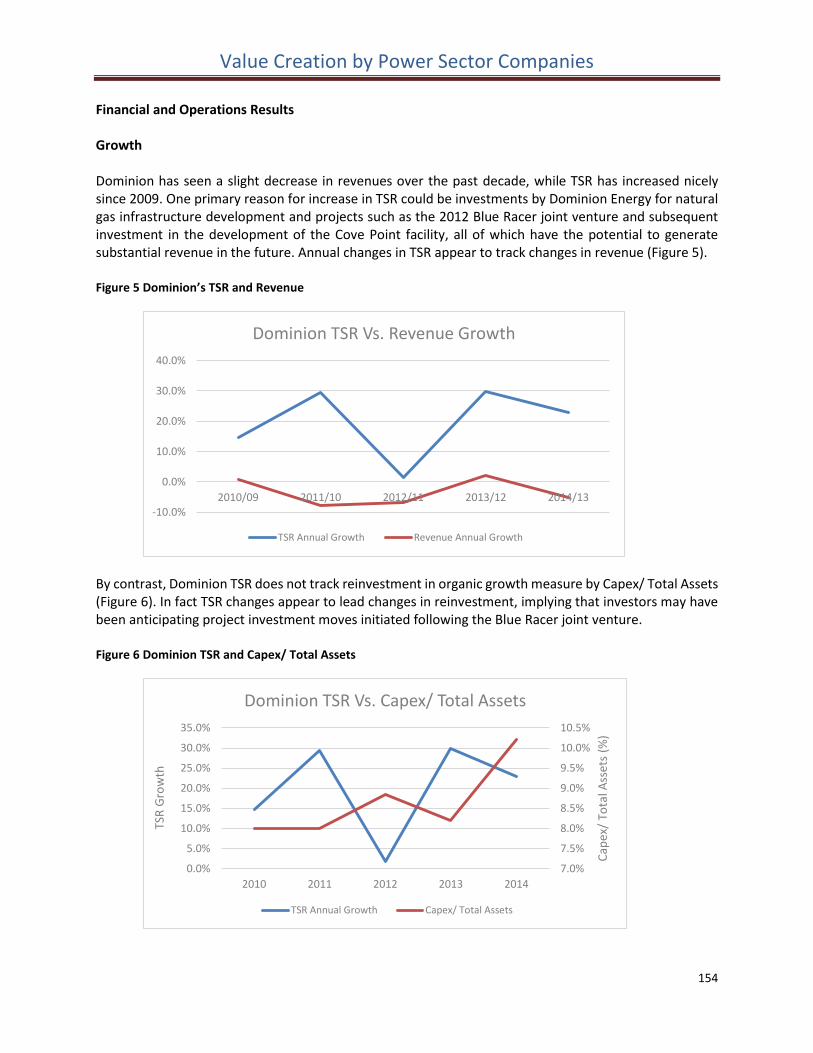
Value Creation by Power Sector Companies
154
Financial and Operations Results
Growth
Dominion has seen a slight decrease in revenues over the past decade, while TSR has increased nicely since 2009. One primary reason for increase in TSR could be investments by Dominion Energy for natural gas infrastructure development and projects such as the 2012 Blue Racer joint venture and subsequent investment in the development of the Cove Point facility, all of which have the potential to generate substantial revenue in the future. Annual changes in TSR appear to track changes in revenue (Figure 5). Figure 5 Dominion’s TSR and Revenue
By contrast, Dominion TSR does not track reinvestment in organic growth measure by Capex/ Total Assets (Figure 6). In fact TSR changes appear to lead changes in reinvestment, implying that investors may have been anticipating project investment moves initiated following the Blue Racer joint venture. Figure 6 Dominion TSR and Capex/ Total Assets
-10.0%
0.0%
10.0%
20.0%
30.0%
40.0%
2010/09 2011/10 2012/11 2013/12 2014/13
Dominion TSR Vs. Revenue Growth
TSR Annual Growth Revenue Annual Growth
7.0%
7.5%
8.0%
8.5%
9.0%
9.5%
10.0%
10.5%
0.0%
5.0%
10.0%
15.0%
20.0%
25.0%
30.0%
35.0%
2010 2011 2012 2013 2014
Cap
ex/
Tota
l Ass
ets
(%)
TSR
Gro
wth
Dominion TSR Vs. Capex/ Total Assets
TSR Annual Growth Capex/ Total Assets
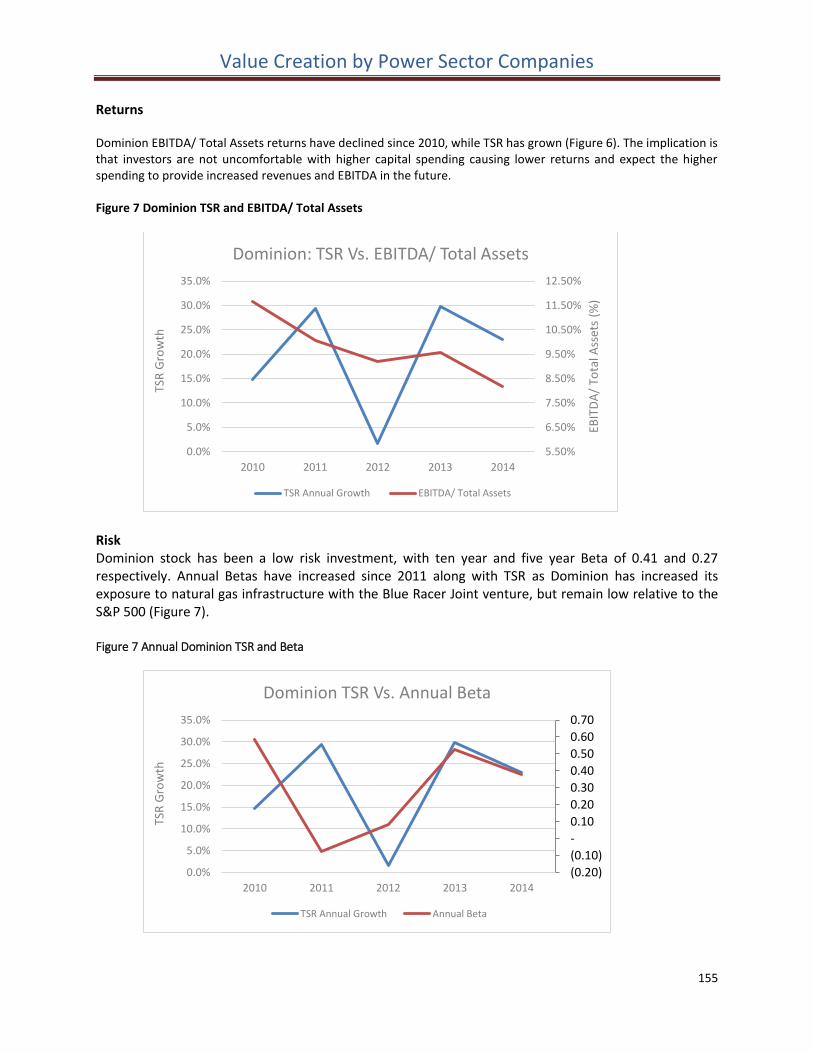
Value Creation by Power Sector Companies
155
Returns Dominion EBITDA/ Total Assets returns have declined since 2010, while TSR has grown (Figure 6). The implication is that investors are not uncomfortable with higher capital spending causing lower returns and expect the higher spending to provide increased revenues and EBITDA in the future. Figure 7 Dominion TSR and EBITDA/ Total Assets
Risk Dominion stock has been a low risk investment, with ten year and five year Beta of 0.41 and 0.27 respectively. Annual Betas have increased since 2011 along with TSR as Dominion has increased its exposure to natural gas infrastructure with the Blue Racer Joint venture, but remain low relative to the S&P 500 (Figure 7). Figure 7 Annual Dominion TSR and Beta
5.50%
6.50%
7.50%
8.50%
9.50%
10.50%
11.50%
12.50%
0.0%
5.0%
10.0%
15.0%
20.0%
25.0%
30.0%
35.0%
2010 2011 2012 2013 2014
EBIT
DA
/ To
tal A
sset
s (%
)
TSR
Gro
wth
Dominion: TSR Vs. EBITDA/ Total Assets
TSR Annual Growth EBITDA/ Total Assets
(0.20)
(0.10)
-
0.10
0.20
0.30
0.40
0.50
0.60
0.70
0.0%
5.0%
10.0%
15.0%
20.0%
25.0%
30.0%
35.0%
2010 2011 2012 2013 2014
TSR
Gro
wth
Dominion TSR Vs. Annual Beta
TSR Annual Growth Annual Beta
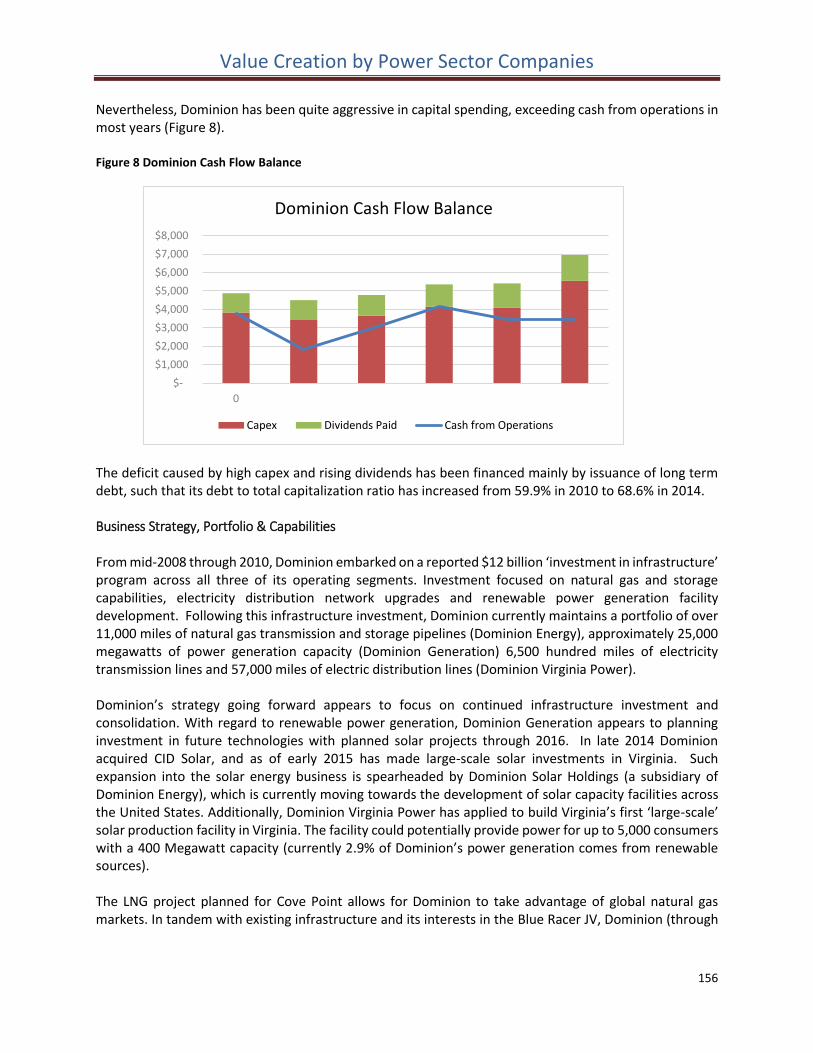
Value Creation by Power Sector Companies
156
Nevertheless, Dominion has been quite aggressive in capital spending, exceeding cash from operations in most years (Figure 8). Figure 8 Dominion Cash Flow Balance
The deficit caused by high capex and rising dividends has been financed mainly by issuance of long term debt, such that its debt to total capitalization ratio has increased from 59.9% in 2010 to 68.6% in 2014. Business Strategy, Portfolio & Capabilities From mid-2008 through 2010, Dominion embarked on a reported $12 billion ‘investment in infrastructure’ program across all three of its operating segments. Investment focused on natural gas and storage capabilities, electricity distribution network upgrades and renewable power generation facility development. Following this infrastructure investment, Dominion currently maintains a portfolio of over 11,000 miles of natural gas transmission and storage pipelines (Dominion Energy), approximately 25,000 megawatts of power generation capacity (Dominion Generation) 6,500 hundred miles of electricity transmission lines and 57,000 miles of electric distribution lines (Dominion Virginia Power). Dominion’s strategy going forward appears to focus on continued infrastructure investment and consolidation. With regard to renewable power generation, Dominion Generation appears to planning investment in future technologies with planned solar projects through 2016. In late 2014 Dominion acquired CID Solar, and as of early 2015 has made large-scale solar investments in Virginia. Such expansion into the solar energy business is spearheaded by Dominion Solar Holdings (a subsidiary of Dominion Energy), which is currently moving towards the development of solar capacity facilities across the United States. Additionally, Dominion Virginia Power has applied to build Virginia’s first ‘large-scale’ solar production facility in Virginia. The facility could potentially provide power for up to 5,000 consumers with a 400 Megawatt capacity (currently 2.9% of Dominion’s power generation comes from renewable sources). The LNG project planned for Cove Point allows for Dominion to take advantage of global natural gas markets. In tandem with existing infrastructure and its interests in the Blue Racer JV, Dominion (through
$-
$1,000
$2,000
$3,000
$4,000
$5,000
$6,000
$7,000
$8,000
0
Dominion Cash Flow Balance
Capex Dividends Paid Cash from Operations
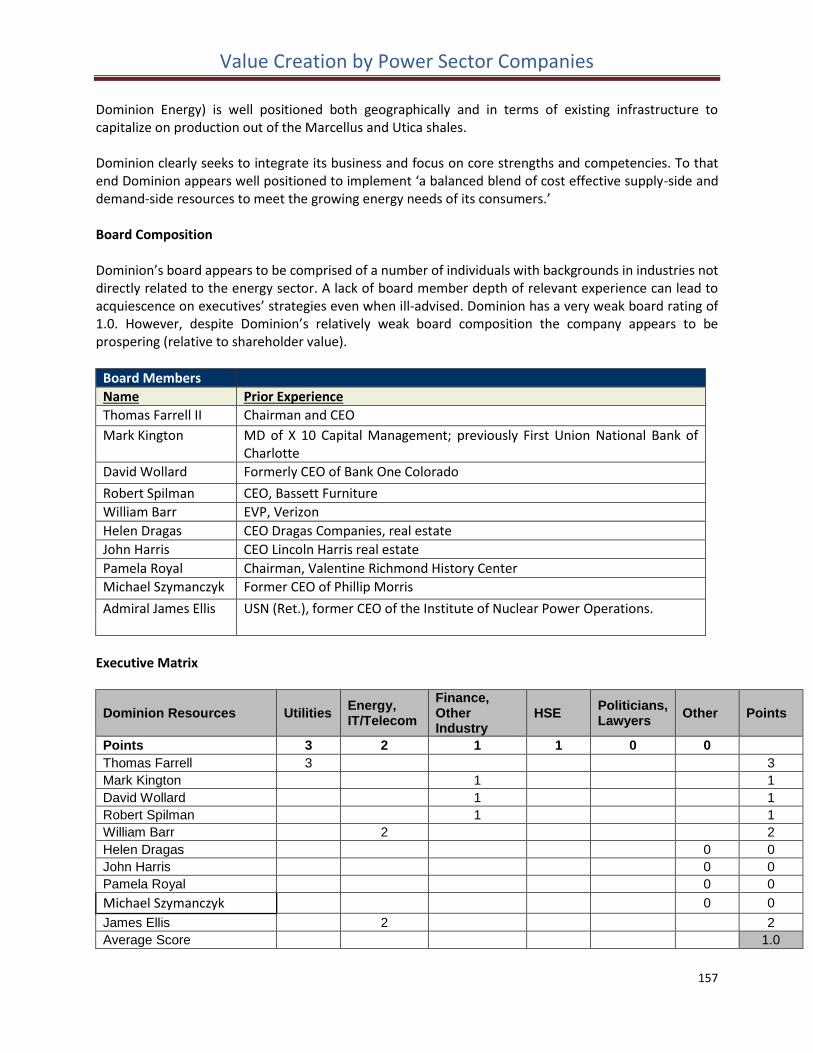
Value Creation by Power Sector Companies
157
Dominion Energy) is well positioned both geographically and in terms of existing infrastructure to capitalize on production out of the Marcellus and Utica shales. Dominion clearly seeks to integrate its business and focus on core strengths and competencies. To that end Dominion appears well positioned to implement ‘a balanced blend of cost effective supply-side and demand-side resources to meet the growing energy needs of its consumers.’ Board Composition
Dominion’s board appears to be comprised of a number of individuals with backgrounds in industries not directly related to the energy sector. A lack of board member depth of relevant experience can lead to acquiescence on executives’ strategies even when ill-advised. Dominion has a very weak board rating of 1.0. However, despite Dominion’s relatively weak board composition the company appears to be prospering (relative to shareholder value).
Board Members
Name Prior Experience
Thomas Farrell II Chairman and CEO
Mark Kington MD of X 10 Capital Management; previously First Union National Bank of Charlotte
David Wollard Formerly CEO of Bank One Colorado
Robert Spilman CEO, Bassett Furniture
William Barr EVP, Verizon
Helen Dragas CEO Dragas Companies, real estate
John Harris CEO Lincoln Harris real estate
Pamela Royal Chairman, Valentine Richmond History Center
Michael Szymanczyk Former CEO of Phillip Morris
Admiral James Ellis USN (Ret.), former CEO of the Institute of Nuclear Power Operations.
Executive Matrix
Dominion Resources Utilities Energy, IT/Telecom
Finance, Other Industry
HSE Politicians, Lawyers
Other Points
Points 3 2 1 1 0 0
Thomas Farrell 3 3
Mark Kington 1 1
David Wollard 1 1
Robert Spilman 1 1
William Barr 2 2
Helen Dragas 0 0
John Harris 0 0
Pamela Royal 0 0
Michael Szymanczyk 0 0
James Ellis 2 2
Average Score 1.0
Value Creation by Power Sector Companies
158
Valuation
At end 2014, Dominion’s Enterprise Value was $71.2 Billion, representing a market premium of 23.5% compared to our standard model’s calculated intrinsic value of $57.6 Billion. This premium most likely reflects the growth potential of Dominion’s natural gas infrastructure business by virtue of its large footprint in Appalachia and access to Marcellus and Utica natural gas production, an opportunity not available to the other power companies studied.
Value Creation by Power Sector Companies
159
15. AES Corporation
Timeline Roger Sant and Dennis Bakke as Applied Energy Services, an energy-consulting firm, founded the AES Corporation in 1981. Bakke and Sant met in the Carter administration while working on utility deregulation policies. Both men saw business opportunities arise from the deregulation of the utilities sector in the US and the privatization of state owned utilities internationally. Bakke and Sant kept Applied Energy Services private until 1991, when they chose to take what had then become AES Corporation public. Under Bakke and Sant AES experienced rapid growth with construction of power plants in 25 countries and an expansion of the labor force to 50,000 employees. With the fall of Enron in 2002 AES faced a significant liquidity crisis, because of their position in the utilities sector and the reputation of Enron no banks would lend to them. The stock price fell from $70 in 2000 to less than $1 at the height of the Enron crisis in 2002. In June of that year AES’s founders promoted from within a Naval Academy graduate named Paul Hanrahan to “right the ship”. After the painful next eight years AES was back on more solid footing with a total revenue growth of 16% from 2008 to 2009. In 2008 AES announced it was compliant with the Sarbanes-Oxley act. AES would continue to expand its operations with power plants on five continents and operations in more than 25 countries. In addition they are expanding their power generation capacity to utilize new and exciting energy sources such as wind, solar, and other alternative energy fuels. In April 2010 AES acquired a UK wind developer then named Your Energy Limited (YEL), and which is now AES Wind Generation Ltd. AES also agreed to buy a 51% stake in a wind generation portfolio from Polish company 3E. In addition they are continuing to grow their core business with a 2011 expansion into Vietnam where AES is building a 1200 MW coal fired power plant, in which they own a 51% stake. Current Scope of Operations AES is a globally diversified power generation and utility company headquartered in Arlington Virgina. With 71 operations including nine utilities, as of 2012 AES operates in more than 25 countries. They continue to focus on power generation using traditional sources such as coal and natural gas, while they diversify into new alternative energy sources such as wind and solar. AES maintains over 39,000 MW of installed power generation capacity globally with over $41.8 billion in total assets. Roughly one third of the generation capacity is natural gas fueled with another one-third coal driven. The remaining third of capacity is approximately 75% (25% of total) renewables and the remaining five percent of total capacity is oil, diesel, and pet coke. As of 2012 AES had six major areas of operation or Strategic Business Units (SBUs) figure 2 shows the pre-tax contribution from each of these units. Within each of the SBUs AES faces unique challenges and opportunities to adjust to dynamic and changing environments. In addition to the power generation capacity AES operates nine utilities in four countries, including Indianapolis power and light (IPL) and Dayton power and light (DPL) between them serving more than 1 million customers in the Midwest of the United States. AES is the largest utility provider in Latin America, and in El Salvador four utilities operated by AES serve more than 1 million customers in 80% of the country. While in Brazil AES Electropaulo is the largest single utility serving more than six million customers. The business is managed in six geographical regions (Figure 1) a simple and more coherent portfolio following its withdrawal from ten countries since 2011.
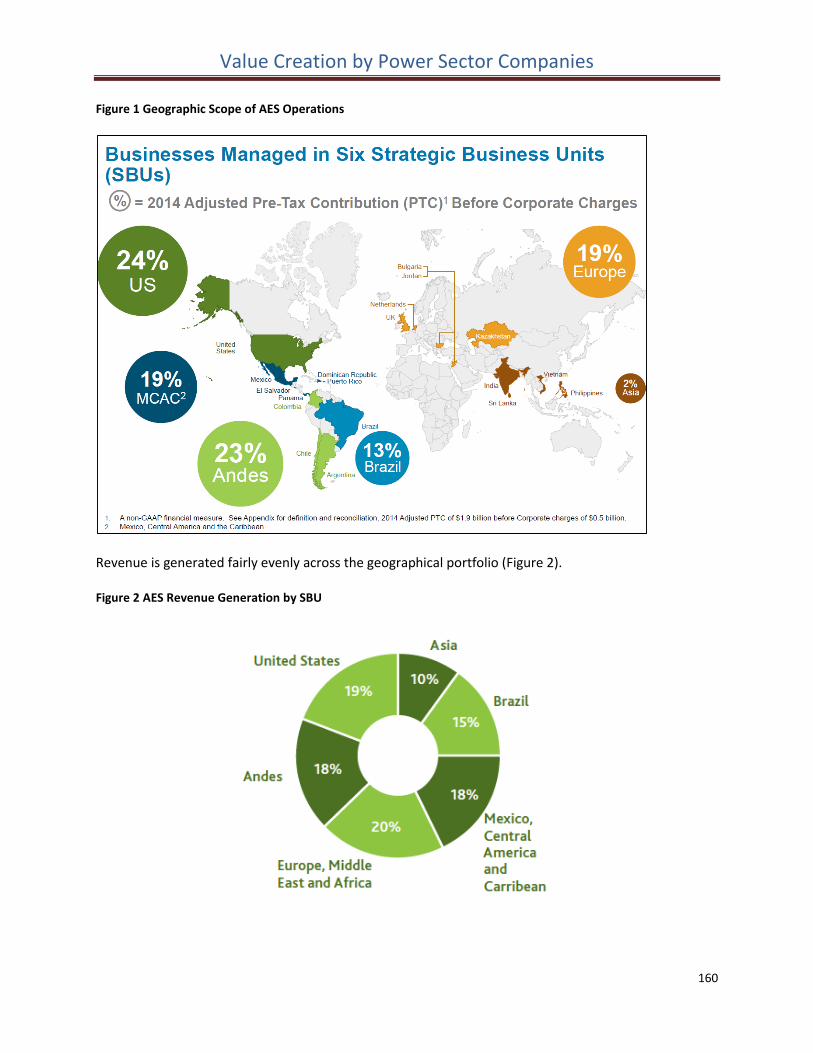
Value Creation by Power Sector Companies
160
Figure 1 Geographic Scope of AES Operations
Revenue is generated fairly evenly across the geographical portfolio (Figure 2). Figure 2 AES Revenue Generation by SBU
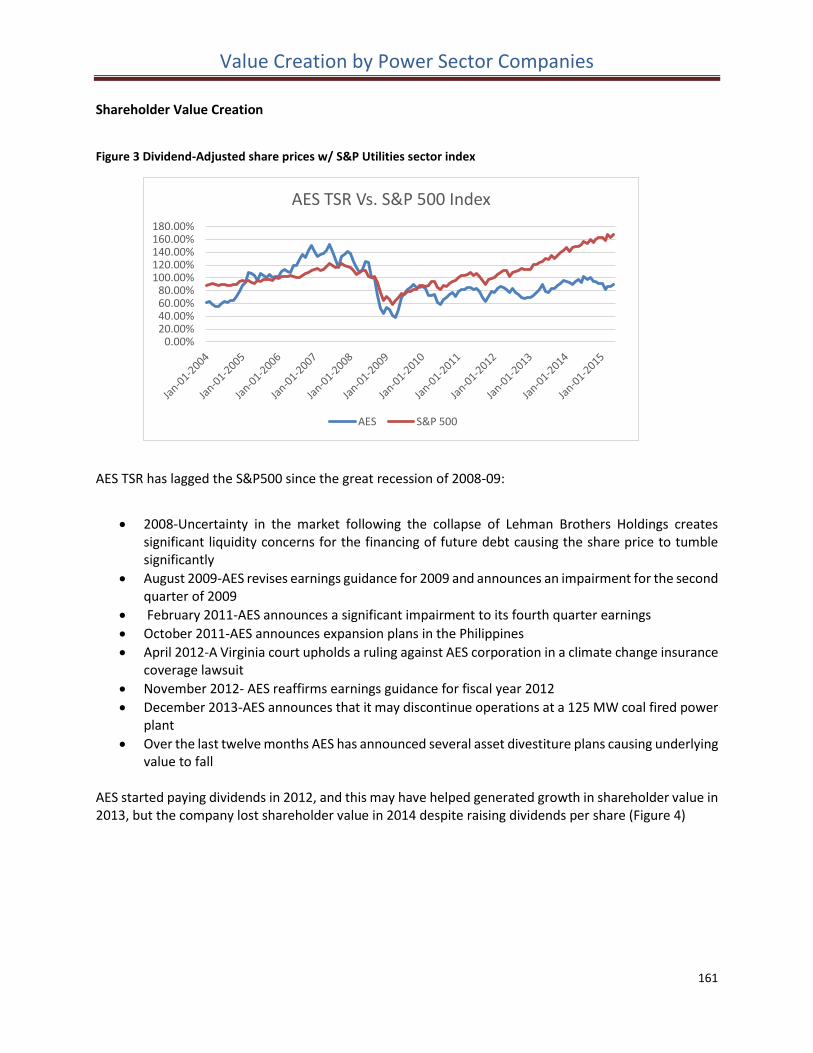
Value Creation by Power Sector Companies
161
Shareholder Value Creation
Figure 3 Dividend-Adjusted share prices w/ S&P Utilities sector index
AES TSR has lagged the S&P500 since the great recession of 2008-09:
2008-Uncertainty in the market following the collapse of Lehman Brothers Holdings creates significant liquidity concerns for the financing of future debt causing the share price to tumble significantly
August 2009-AES revises earnings guidance for 2009 and announces an impairment for the second quarter of 2009
February 2011-AES announces a significant impairment to its fourth quarter earnings
October 2011-AES announces expansion plans in the Philippines
April 2012-A Virginia court upholds a ruling against AES corporation in a climate change insurance coverage lawsuit
November 2012- AES reaffirms earnings guidance for fiscal year 2012
December 2013-AES announces that it may discontinue operations at a 125 MW coal fired power plant
Over the last twelve months AES has announced several asset divestiture plans causing underlying value to fall
AES started paying dividends in 2012, and this may have helped generated growth in shareholder value in 2013, but the company lost shareholder value in 2014 despite raising dividends per share (Figure 4)
0.00%20.00%40.00%60.00%80.00%
100.00%120.00%140.00%160.00%180.00%
AES TSR Vs. S&P 500 Index
AES S&P 500
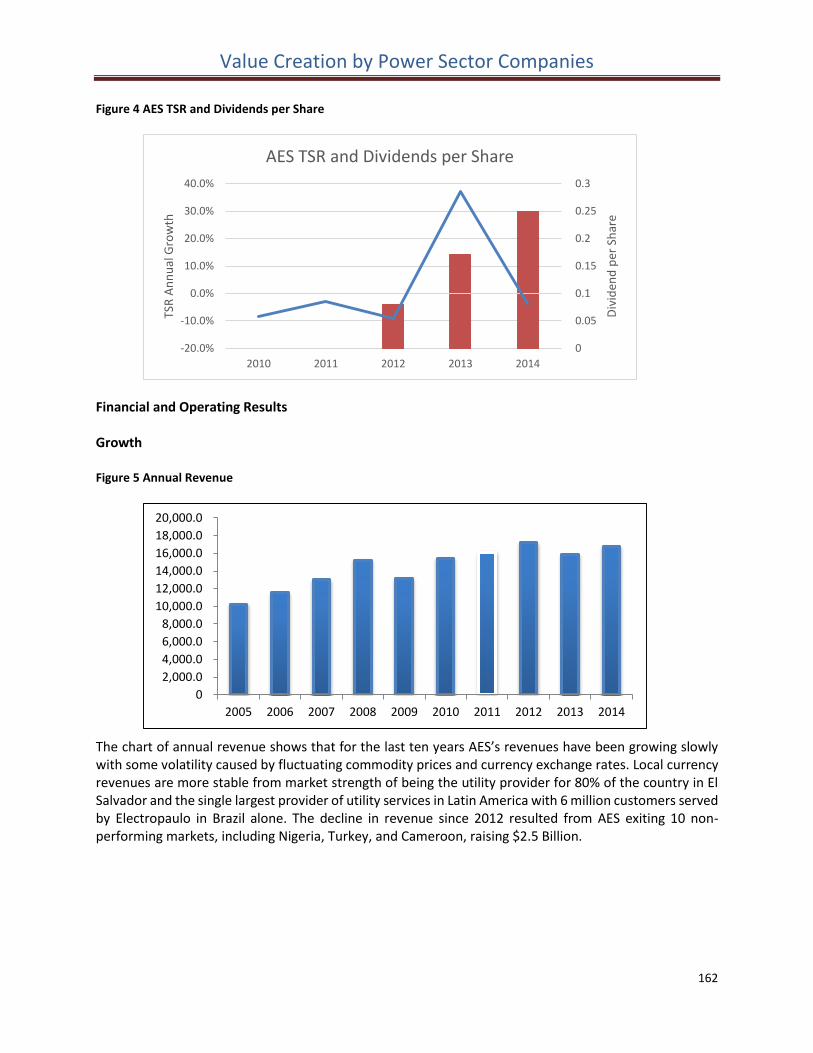
Value Creation by Power Sector Companies
162
Figure 4 AES TSR and Dividends per Share
Financial and Operating Results Growth Figure 5 Annual Revenue
The chart of annual revenue shows that for the last ten years AES’s revenues have been growing slowly with some volatility caused by fluctuating commodity prices and currency exchange rates. Local currency revenues are more stable from market strength of being the utility provider for 80% of the country in El Salvador and the single largest provider of utility services in Latin America with 6 million customers served by Electropaulo in Brazil alone. The decline in revenue since 2012 resulted from AES exiting 10 non-performing markets, including Nigeria, Turkey, and Cameroon, raising $2.5 Billion.
0
0.05
0.1
0.15
0.2
0.25
0.3
-20.0%
-10.0%
0.0%
10.0%
20.0%
30.0%
40.0%
2010 2011 2012 2013 2014
Div
iden
d p
er S
har
e
TSR
An
nu
al G
row
thAES TSR and Dividends per Share
0
2,000.0
4,000.0
6,000.0
8,000.0
10,000.0
12,000.0
14,000.0
16,000.0
18,000.0
20,000.0
2005 2006 2007 2008 2009 2010 2011 2012 2013 2014
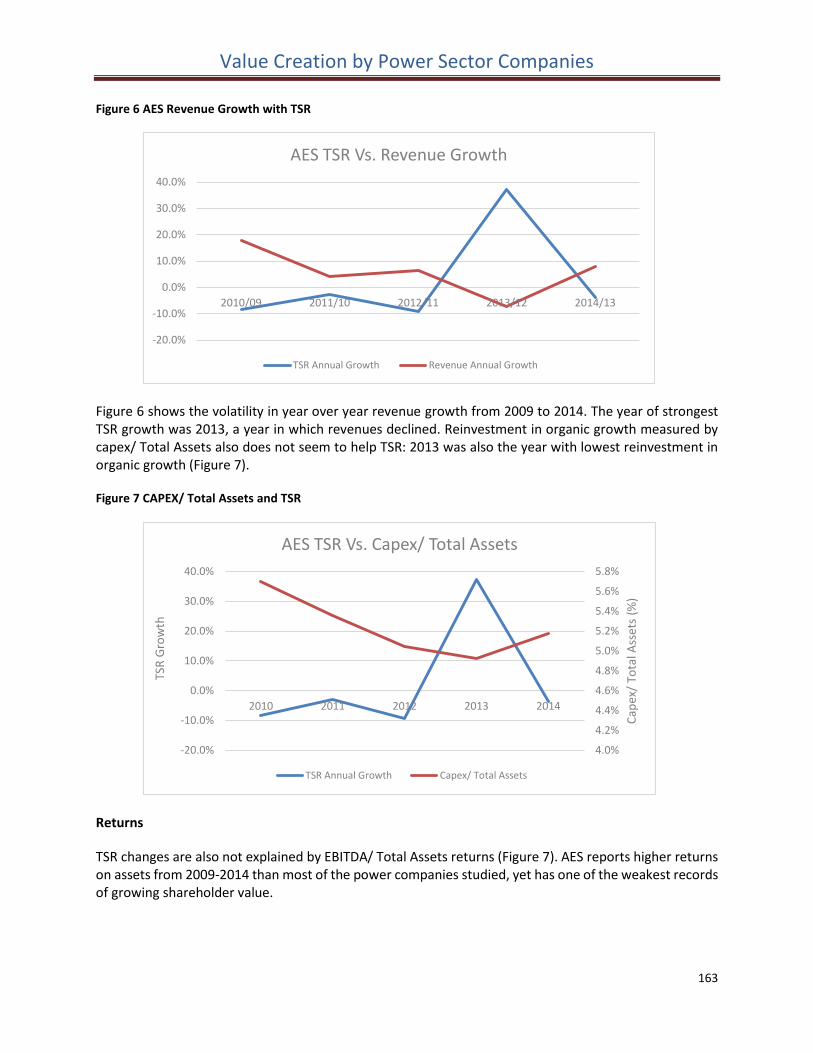
Value Creation by Power Sector Companies
163
Figure 6 AES Revenue Growth with TSR
Figure 6 shows the volatility in year over year revenue growth from 2009 to 2014. The year of strongest TSR growth was 2013, a year in which revenues declined. Reinvestment in organic growth measured by capex/ Total Assets also does not seem to help TSR: 2013 was also the year with lowest reinvestment in organic growth (Figure 7). Figure 7 CAPEX/ Total Assets and TSR
Returns
TSR changes are also not explained by EBITDA/ Total Assets returns (Figure 7). AES reports higher returns on assets from 2009-2014 than most of the power companies studied, yet has one of the weakest records of growing shareholder value.
-20.0%
-10.0%
0.0%
10.0%
20.0%
30.0%
40.0%
2010/09 2011/10 2012/11 2013/12 2014/13
AES TSR Vs. Revenue Growth
TSR Annual Growth Revenue Annual Growth
4.0%
4.2%
4.4%
4.6%
4.8%
5.0%
5.2%
5.4%
5.6%
5.8%
-20.0%
-10.0%
0.0%
10.0%
20.0%
30.0%
40.0%
2010 2011 2012 2013 2014
Cap
ex/
Tota
l Ass
ets
(%)
TSR
Gro
wth
AES TSR Vs. Capex/ Total Assets
TSR Annual Growth Capex/ Total Assets
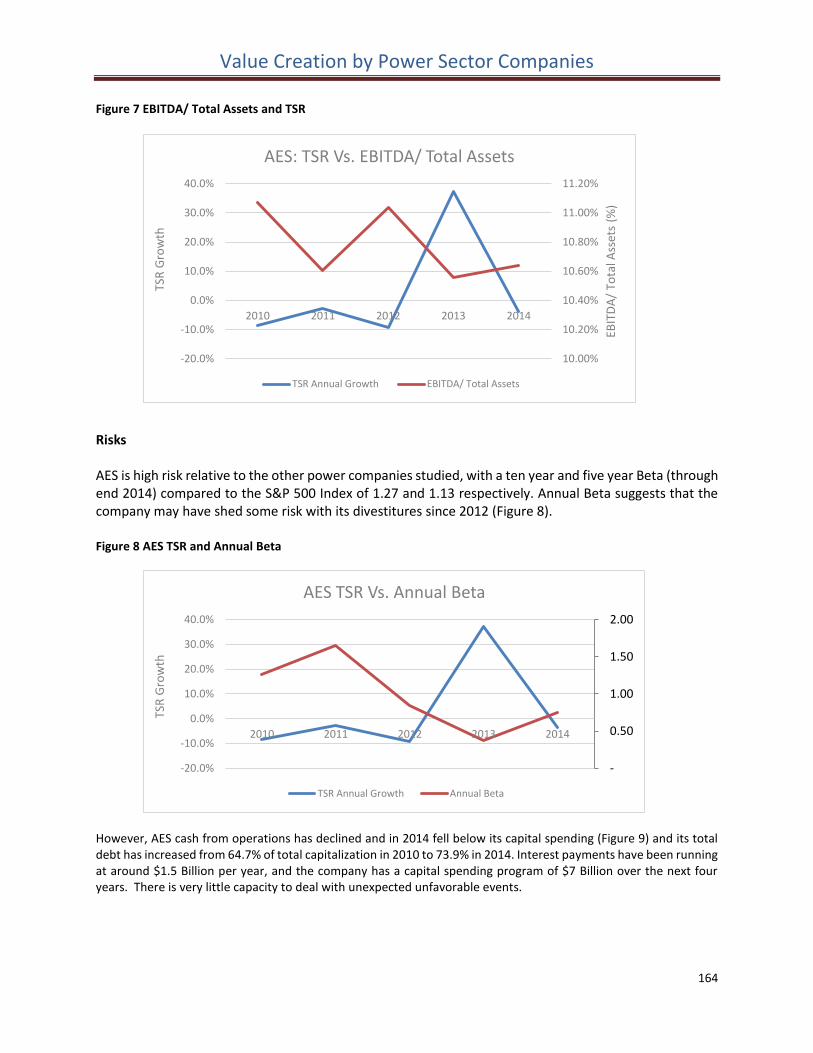
Value Creation by Power Sector Companies
164
Figure 7 EBITDA/ Total Assets and TSR
Risks AES is high risk relative to the other power companies studied, with a ten year and five year Beta (through end 2014) compared to the S&P 500 Index of 1.27 and 1.13 respectively. Annual Beta suggests that the company may have shed some risk with its divestitures since 2012 (Figure 8). Figure 8 AES TSR and Annual Beta
However, AES cash from operations has declined and in 2014 fell below its capital spending (Figure 9) and its total debt has increased from 64.7% of total capitalization in 2010 to 73.9% in 2014. Interest payments have been running at around $1.5 Billion per year, and the company has a capital spending program of $7 Billion over the next four years. There is very little capacity to deal with unexpected unfavorable events.
10.00%
10.20%
10.40%
10.60%
10.80%
11.00%
11.20%
-20.0%
-10.0%
0.0%
10.0%
20.0%
30.0%
40.0%
2010 2011 2012 2013 2014
EBIT
DA
/ To
tal A
sset
s (%
)
TSR
Gro
wth
AES: TSR Vs. EBITDA/ Total Assets
TSR Annual Growth EBITDA/ Total Assets
-
0.50
1.00
1.50
2.00
-20.0%
-10.0%
0.0%
10.0%
20.0%
30.0%
40.0%
2010 2011 2012 2013 2014
TSR
Gro
wth
AES TSR Vs. Annual Beta
TSR Annual Growth Annual Beta
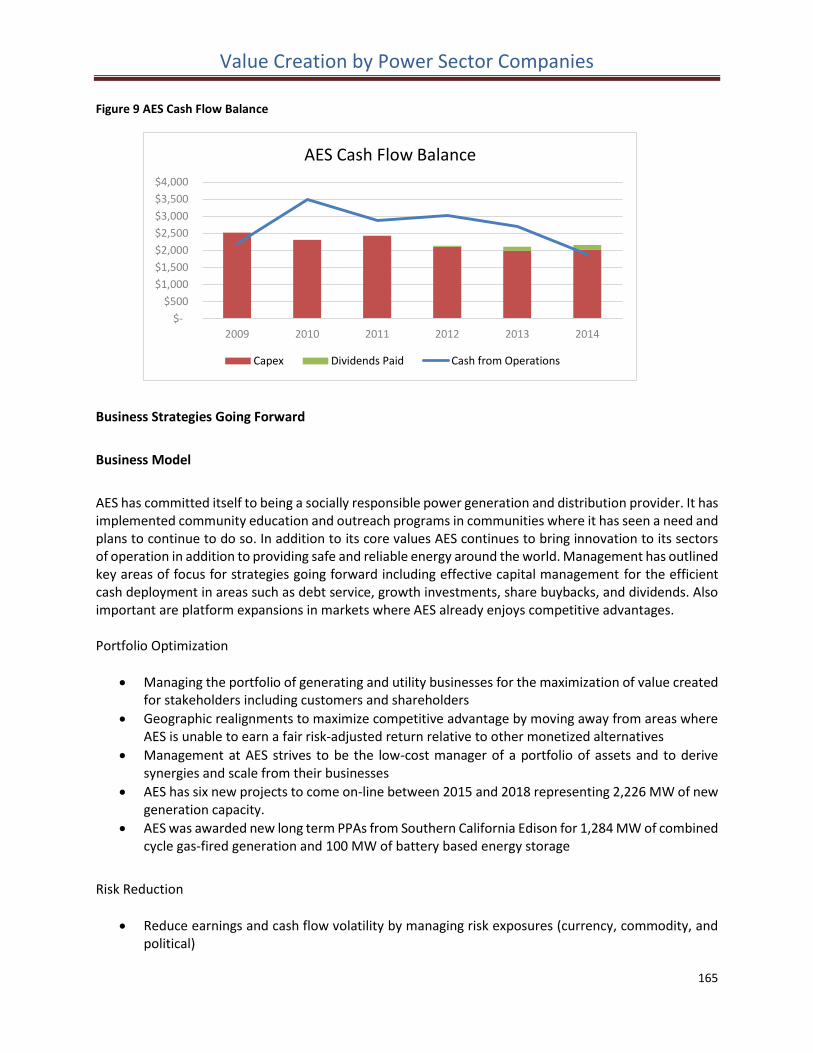
Value Creation by Power Sector Companies
165
Figure 9 AES Cash Flow Balance
Business Strategies Going Forward
Business Model
AES has committed itself to being a socially responsible power generation and distribution provider. It has implemented community education and outreach programs in communities where it has seen a need and plans to continue to do so. In addition to its core values AES continues to bring innovation to its sectors of operation in addition to providing safe and reliable energy around the world. Management has outlined key areas of focus for strategies going forward including effective capital management for the efficient cash deployment in areas such as debt service, growth investments, share buybacks, and dividends. Also important are platform expansions in markets where AES already enjoys competitive advantages. Portfolio Optimization
Managing the portfolio of generating and utility businesses for the maximization of value created for stakeholders including customers and shareholders
Geographic realignments to maximize competitive advantage by moving away from areas where AES is unable to earn a fair risk-adjusted return relative to other monetized alternatives
Management at AES strives to be the low-cost manager of a portfolio of assets and to derive synergies and scale from their businesses
AES has six new projects to come on-line between 2015 and 2018 representing 2,226 MW of new generation capacity.
AES was awarded new long term PPAs from Southern California Edison for 1,284 MW of combined cycle gas-fired generation and 100 MW of battery based energy storage
Risk Reduction
Reduce earnings and cash flow volatility by managing risk exposures (currency, commodity, and political)
$-
$500
$1,000
$1,500
$2,000
$2,500
$3,000
$3,500
$4,000
2009 2010 2011 2012 2013 2014
AES Cash Flow Balance
Capex Dividends Paid Cash from Operations
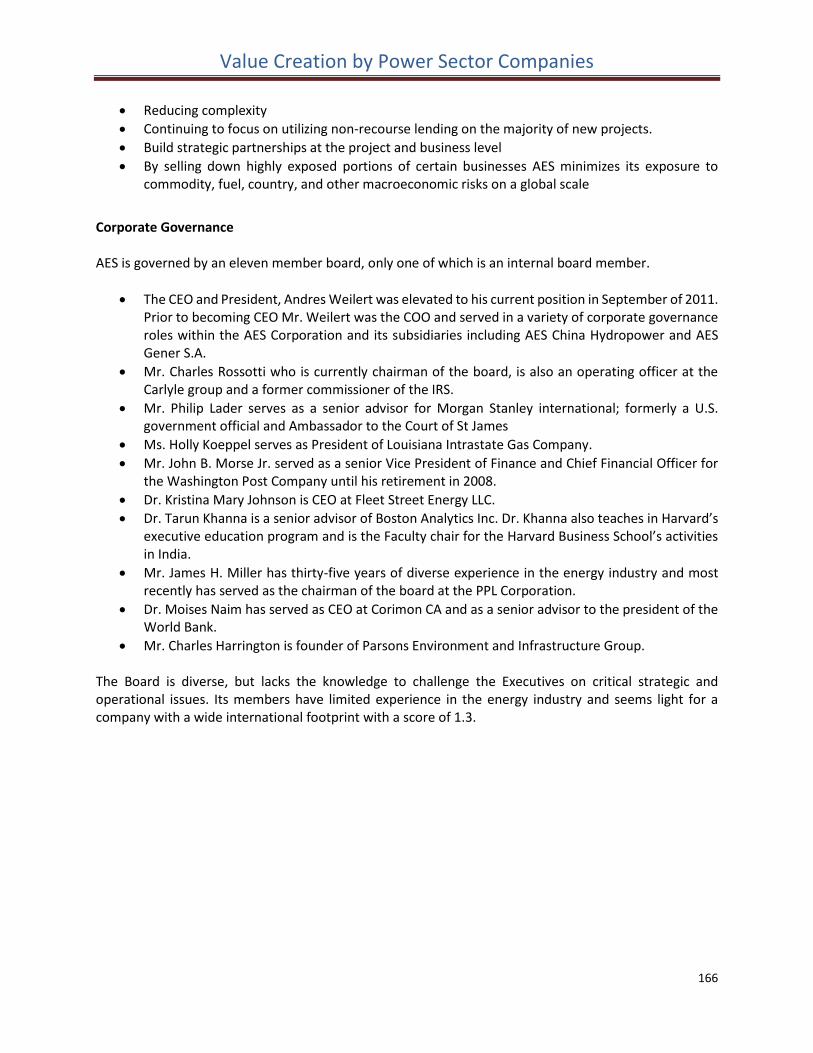
Value Creation by Power Sector Companies
166
Reducing complexity
Continuing to focus on utilizing non-recourse lending on the majority of new projects.
Build strategic partnerships at the project and business level
By selling down highly exposed portions of certain businesses AES minimizes its exposure to commodity, fuel, country, and other macroeconomic risks on a global scale
Corporate Governance AES is governed by an eleven member board, only one of which is an internal board member.
The CEO and President, Andres Weilert was elevated to his current position in September of 2011. Prior to becoming CEO Mr. Weilert was the COO and served in a variety of corporate governance roles within the AES Corporation and its subsidiaries including AES China Hydropower and AES Gener S.A.
Mr. Charles Rossotti who is currently chairman of the board, is also an operating officer at the Carlyle group and a former commissioner of the IRS.
Mr. Philip Lader serves as a senior advisor for Morgan Stanley international; formerly a U.S. government official and Ambassador to the Court of St James
Ms. Holly Koeppel serves as President of Louisiana Intrastate Gas Company.
Mr. John B. Morse Jr. served as a senior Vice President of Finance and Chief Financial Officer for the Washington Post Company until his retirement in 2008.
Dr. Kristina Mary Johnson is CEO at Fleet Street Energy LLC.
Dr. Tarun Khanna is a senior advisor of Boston Analytics Inc. Dr. Khanna also teaches in Harvard’s executive education program and is the Faculty chair for the Harvard Business School’s activities in India.
Mr. James H. Miller has thirty-five years of diverse experience in the energy industry and most recently has served as the chairman of the board at the PPL Corporation.
Dr. Moises Naim has served as CEO at Corimon CA and as a senior advisor to the president of the World Bank.
Mr. Charles Harrington is founder of Parsons Environment and Infrastructure Group. The Board is diverse, but lacks the knowledge to challenge the Executives on critical strategic and operational issues. Its members have limited experience in the energy industry and seems light for a company with a wide international footprint with a score of 1.3.
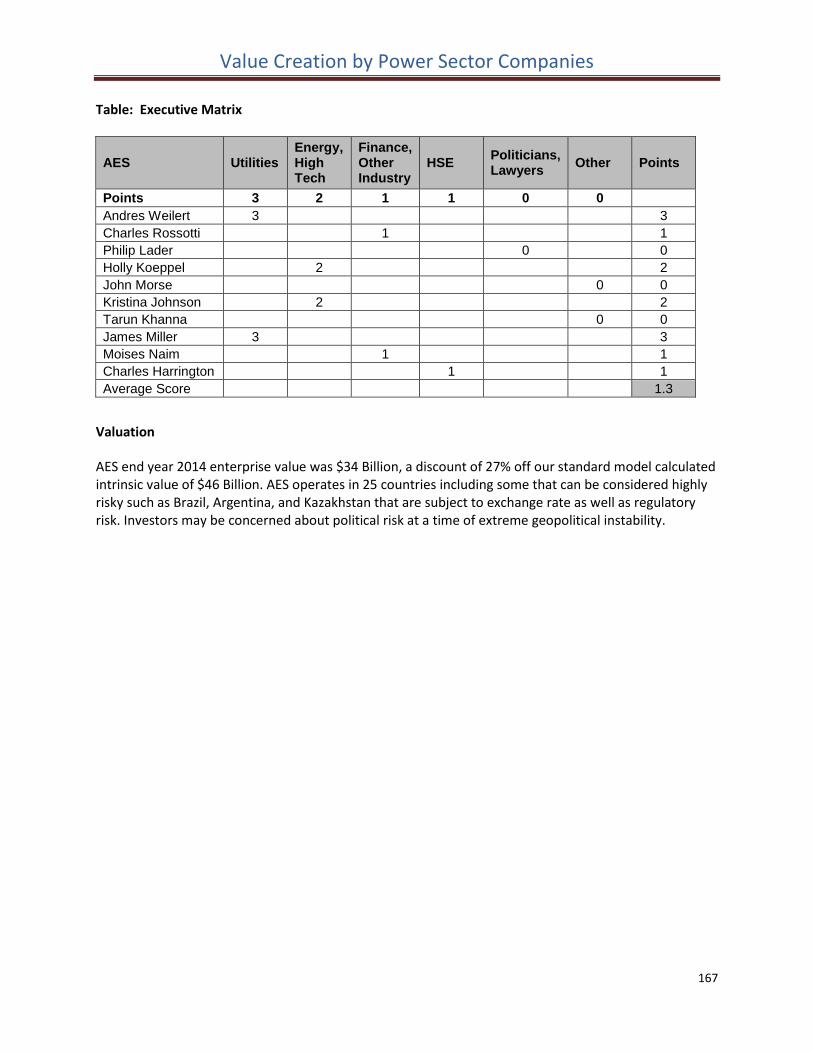
Value Creation by Power Sector Companies
167
Table: Executive Matrix
AES Utilities Energy, High Tech
Finance, Other Industry
HSE Politicians, Lawyers
Other Points
Points 3 2 1 1 0 0
Andres Weilert 3 3
Charles Rossotti 1 1
Philip Lader 0 0
Holly Koeppel 2 2
John Morse 0 0
Kristina Johnson 2 2
Tarun Khanna 0 0
James Miller 3 3
Moises Naim 1 1
Charles Harrington 1 1
Average Score 1.3
Valuation
AES end year 2014 enterprise value was $34 Billion, a discount of 27% off our standard model calculated intrinsic value of $46 Billion. AES operates in 25 countries including some that can be considered highly risky such as Brazil, Argentina, and Kazakhstan that are subject to exchange rate as well as regulatory risk. Investors may be concerned about political risk at a time of extreme geopolitical instability.