hawaii’s creative industriesfiles.hawaii.gov/dbedt/economic/data_reports/...hawaii’s creative...
TRANSCRIPT

Hawaii’sCreativeIndustries
Update Report 2016
Department of Business, Economic Development and Tourism
June 2016

2|P a g e
Hawaii’sCreativeIndustries:UpdateJune2016
Hawaii Department of Business, Economic Development & Tourism
June 2016

P a g e |3
June2016
TableofContents
EXECUTIVESUMMARY 5
I. INTRODUCTION 11 TheDefinitionoftheCreativeSector 11 DataSources 13
II. OVERVIEWOFHAWAII’SCREATIVEINDUSTRIESPORTFOLIO 14CreativeSectorJobGrowth 15NationalCompetitivenessoftheCreativeSector 18IndustryConcentration–Hawaii’sCreativeSpecialties 19PerformanceMapFramework:IdentifyingEmergingCreativeIndustries 21
III. CREATIVEINDUSTRYPORTFOLIOPERFORMANCE 23HighPerformingCreativeIndustryGroups 23OtherCreativeIndustries’Performance 24Hard‐To‐MeasureActivities 24
IV. CREATIVEINDUSTRYPERFORMANCEBYCOUNTY 25City&CountyofHonolulu 25HawaiiCounty 26MauiCounty 28KauaiCounty 30
V. CREATIVEINDUSTRYPERFORMANCEBYMAJORGROUP 33
Performing&CreativeArts 34Engineering/ScientificResearch&Development 34Computer&DigitalMedia 35Marketing&RelatedActivities 36BusinessConsulting 37Publishing&Information 37CulturalActivities 38Architecture 38DesignServices 38Radio&TVBroadcasting 38Film,TV,andVideoProduction 39Music 41ArtsEducation 43
VI. CONCLUSIONS&NEXTSTEPS 45APPENDIX:DETAILEDDATA 46

4|P a g e
Hawaii’sCreativeIndustries:UpdateJune2016
CREATIVE INDUSTRIES HAWAII OVERVIEW
The State of Hawaii’s Creative Industries Division (CID) is the lead agency dedicated to advocating for Hawaii’s creative entrepreneurs which in turn accelerates the growth of Hawaii’s Creative Economy.
Comprised of the Hawaii Film Office (HFO) responsible for the overall management of the state’s off-shore and local film industry development and Creative and Cultural Industries Office (CCIO), CID is responsible for initiatives which support talent, infrastructure, policy development and investment strategies for the statewide creative industries spectrum, increasing the capacity for entrepreneurial success while maintaining the State’s global reputation as a premiere location filming destination.
Through CID initiatives such as Creative Lab, coupled with state-of-the-art infrastructure development, the division is further strengthening the State’s creative clusters in film, arts, culture, music, design, literary arts, publishing, creative and interactive media – all integral components of Hawaii’s creative and innovation economy.
Hawaii’s Creative Industries Metrics 2015:
49,597 jobs, 3,615 businesses 5.9% of the state total civilian jobs $3.3 billion Gross Domestic Product (GDP) = 4.2% of total State of Hawaii GDP + 8.9% growth between 2005 and 2015
Hawaii Film Industry Metrics:
From 2006 to 2015 estimated production expenditures reached $2.2 billion, a cumulative total of $3.8 billion of output during this period.
2015 calendar year, $243.5 million in estimated production expenditures generated $422.2 million of total output, $26.7 million in state taxes and 2,668 jobs statewide.
$500,000 per year in revenues generated through lease rents of Hawaii Film Studio deposited into the General Fund = $5 million from 2005-2015.
Through establishing these metrics in film and the creative sectors, CID and DBEDT’s Research and Economic Analysis Division (READ) defined the base, emerging, declining and transitioning sectors performance from 2005-2015, helping to guide a statewide programmatic and overall policy direction.
Hawaii’s creative portfolio, coupled with its long standing reputation as a film production destination, is the foundation on which Hawaii’s creative economy is built. CID is positioning the state to be a national and global leader in creative sector development as well as a hub for creative media and production in the Pacific.
P a g e |5
June2016
EXECUTIVESUMMARY
Developing Hawaii’s creative industries has become an important economic development strategy. Hawaii’s cultural diversity and its Hawaiian host culture are brand differentiators, attracting millions of visitors to our destination, while supporting a thriving creative industries cluster. The uniqueness of Hawaii’s creative, artistic and cultural sectors helps Hawaii’s creative products compete in worldwide markets, while also supporting visitor spending and developing the foundation of Hawaii’s creative economy. In addition, the creative industries and their workforce represent key sources of ideas, content creation for global export and provide the talent for Hawaii’s emerging technology and knowledge based industry sectors.
In order to capture and track data on the range of activities that can address the broader relationship between creative industries and emerging markets for technology and entertainment, the Research and Economic Analysis Division teamed up with the DBEDT Creative Industries Division to review more current definitions of creative industries and revise the scope of the activities in Hawaii’s creative sector, based in larger part on similar work in Massachusetts. This update adopted the same definition of the creative industries as defined in the July 2012 report. The creative sector now overlaps some elements of the technology sector.
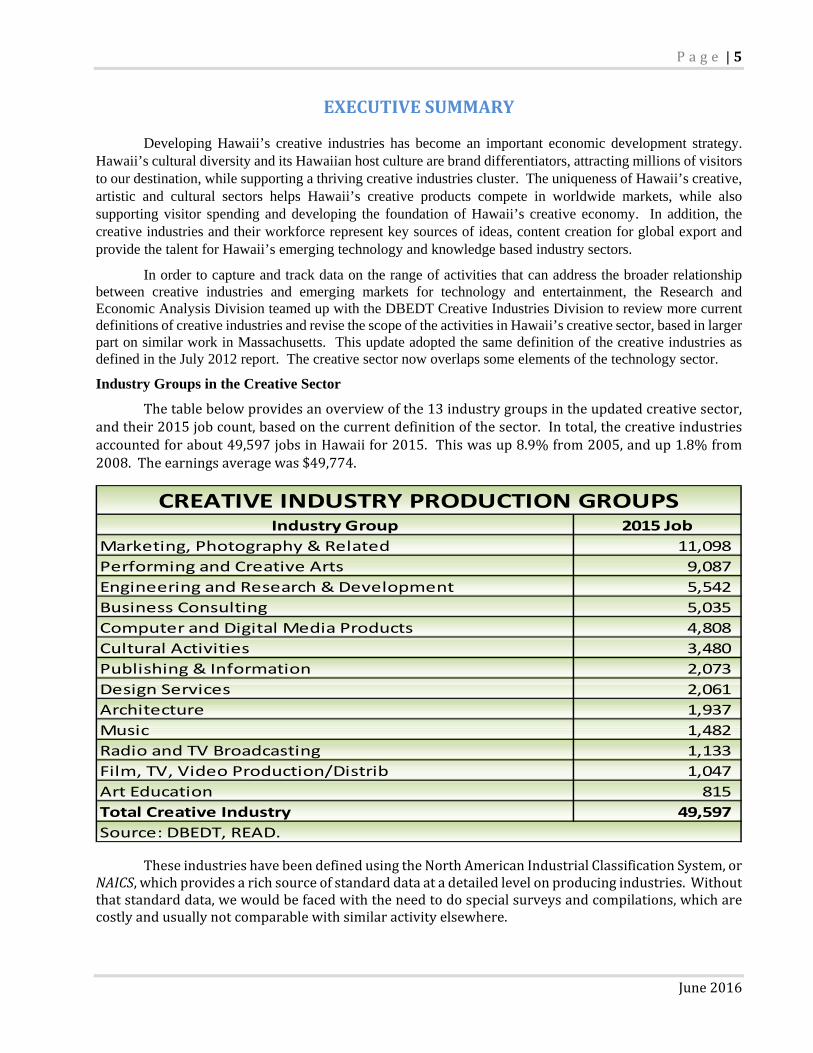
Industry Groups in the Creative Sector
Thetablebelowprovidesanoverviewofthe13industrygroupsintheupdatedcreativesector,andtheir2015jobcount,basedonthecurrentdefinitionofthesector.Intotal,thecreativeindustriesaccountedforabout49,597jobsinHawaiifor2015.Thiswasup8.9%from2005,andup1.8%from2008.Theearningsaveragewas$49,774.
TheseindustrieshavebeendefinedusingtheNorthAmericanIndustrialClassificationSystem,orNAICS,whichprovidesarichsourceofstandarddataatadetailedlevelonproducingindustries.Withoutthatstandarddata,wewouldbefacedwiththeneedtodospecialsurveysandcompilations,whicharecostlyandusuallynotcomparablewithsimilaractivityelsewhere.
Industry Group 2015 Job
Marketing, Photography & Related 11,098
Performing and Creative Arts 9,087
Engineering and Research & Development 5,542
Business Consulting 5,035
Computer and Digital Media Products 4,808
Cultural Activities 3,480
Publishing & Information 2,073
Design Services 2,061
Architecture 1,937
Music 1,482
Radio and TV Broadcasting 1,133
Film, TV, Video Production/Distrib 1,047
Art Education 815
Total Creative Industry 49,597
CREATIVE INDUSTRY PRODUCTION GROUPS
Source: DBEDT, READ.
6|P a g e
Hawaii’sCreativeIndustries:UpdateJune2016
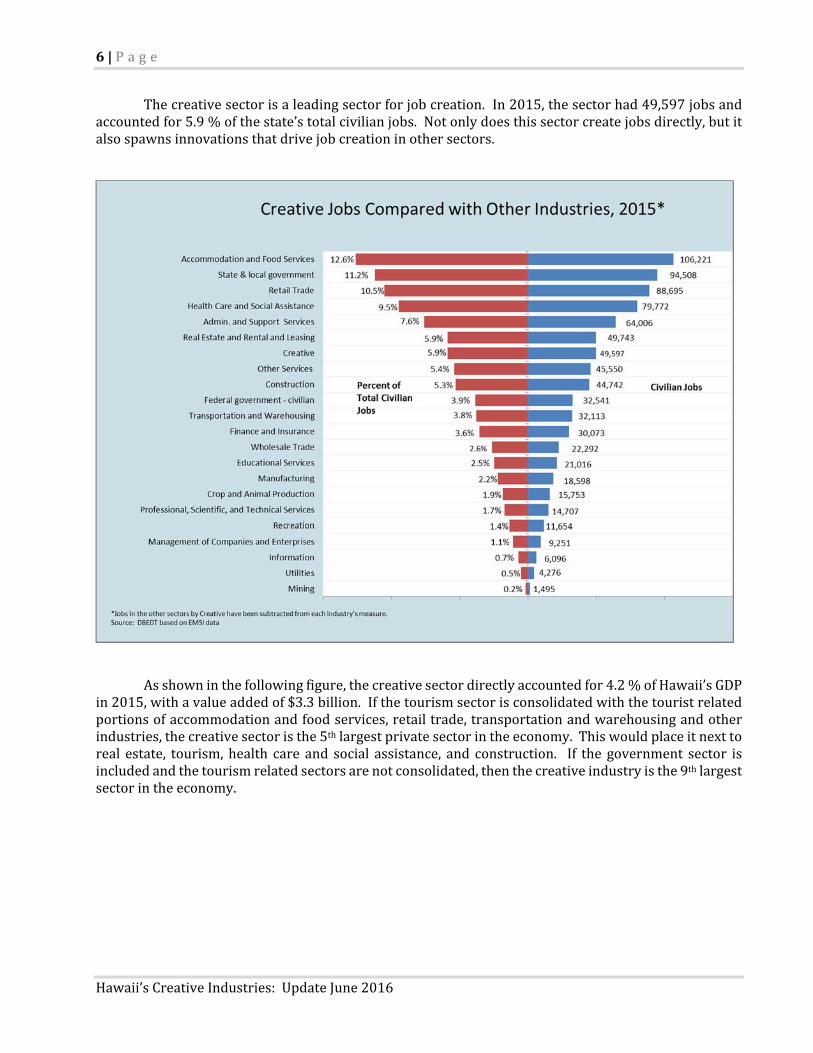
Thecreativesectorisaleadingsectorforjobcreation.In2015,thesectorhad49,597jobsandaccountedfor5.9%ofthestate’stotalcivilianjobs.Notonlydoesthissectorcreatejobsdirectly,butitalsospawnsinnovationsthatdrivejobcreationinothersectors.
Asshowninthefollowingfigure,thecreativesectordirectlyaccountedfor4.2%ofHawaii’sGDPin2015,withavalueaddedof$3.3billion.Ifthetourismsectorisconsolidatedwiththetouristrelatedportionsofaccommodationandfoodservices,retailtrade,transportationandwarehousingandotherindustries,thecreativesectoristhe5thlargestprivatesectorintheeconomy.Thiswouldplaceitnexttoreal estate, tourism, health care and social assistance, and construction. If the government sector isincludedandthetourismrelatedsectorsarenotconsolidated,thenthecreativeindustryisthe9thlargestsectorintheeconomy.

P a g e |7
June2016
Source:DBEDT,READ
PerformanceoftheCreativeIndustriesPortfolio
Theprimarypurposeofthisreportistomeasuretheperformanceoftheindustrygroupswithinthecreativeindustriesportfolio.ForeachoftheNAICS‐measurablegroupsinthecreativesectorindustryportfolio, a performance profile was constructed that was composed of three primary performancemeasures: job growth, change in competitive national industry share, and level of concentration (orspecialization) in Hawaii’s economy. The first two measures help assess the strength andcompetitivenessoftheactivity,whilethethirdidentifieslikelyexportindustriesintheportfolio.
Combining the measures into a common framework called a performance map allows thecreativesector industrygroupstobeplaced in fourperformancecategoriesasshowin the followingfigure(thefullreportexplainsthismappingprocessinmoredetail).
8|P a g e
Hawaii’sCreativeIndustries:UpdateJune2016
Source:DBEDTcompilationbasedonEMSIdata.
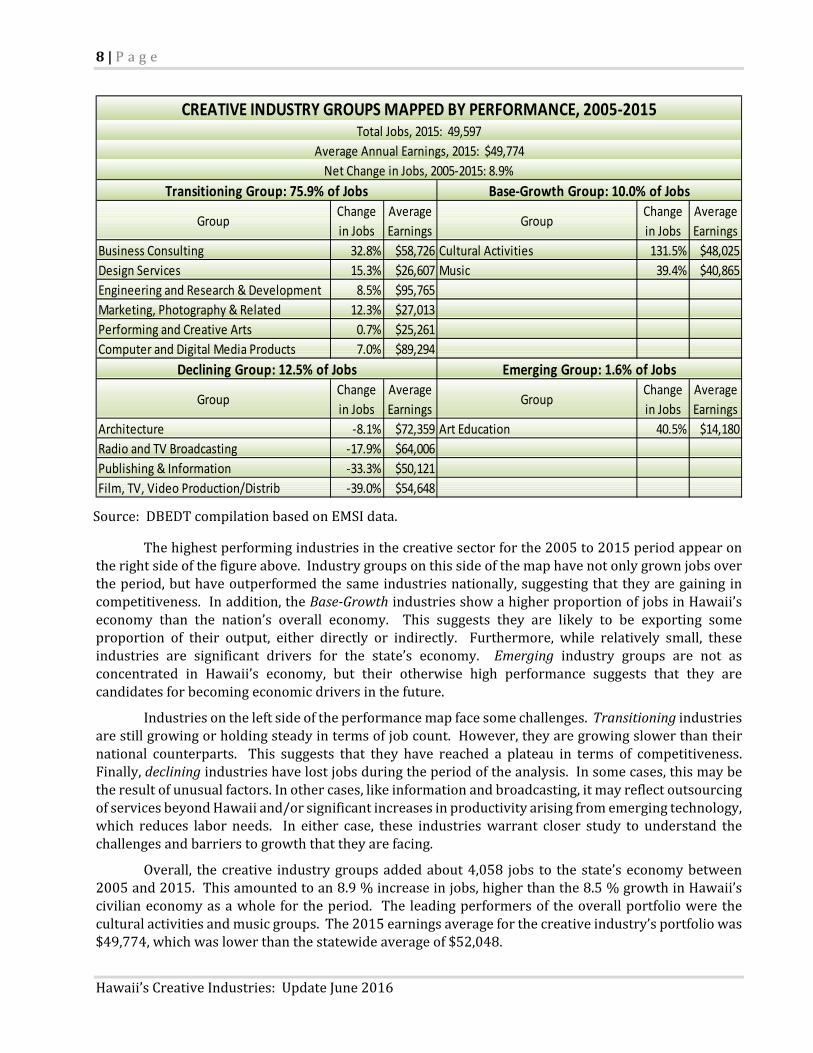
Thehighestperformingindustriesinthecreativesectorforthe2005to2015periodappearontherightsideofthefigureabove.Industrygroupsonthissideofthemaphavenotonlygrownjobsovertheperiod,buthaveoutperformedthesameindustriesnationally,suggestingthattheyaregaining incompetitiveness.Inaddition,theBase‐GrowthindustriesshowahigherproportionofjobsinHawaii’seconomy than the nation’s overall economy. This suggests they are likely to be exporting someproportion of their output, either directly or indirectly. Furthermore, while relatively small, theseindustries are significant drivers for the state’s economy. Emerging industry groups are not asconcentrated in Hawaii’s economy, but their otherwise high performance suggests that they arecandidatesforbecomingeconomicdriversinthefuture.
Industriesontheleftsideoftheperformancemapfacesomechallenges.Transitioningindustriesarestillgrowingorholdingsteadyintermsofjobcount.However,theyaregrowingslowerthantheirnational counterparts. This suggests that they have reached a plateau in terms of competitiveness.Finally,decliningindustrieshavelostjobsduringtheperiodoftheanalysis.Insomecases,thismaybetheresultofunusualfactors.Inothercases,likeinformationandbroadcasting,itmayreflectoutsourcingofservicesbeyondHawaiiand/orsignificantincreasesinproductivityarisingfromemergingtechnology,which reduces labor needs. In either case, these industrieswarrant closer study to understand thechallengesandbarrierstogrowththattheyarefacing.
Overall, the creative industrygroupsaddedabout4,058 jobs to thestate’seconomybetween2005and2015.Thisamountedtoan8.9%increaseinjobs,higherthanthe8.5%growthinHawaii’scivilianeconomyasawhole fortheperiod. The leadingperformersof theoverallportfolioweretheculturalactivitiesandmusicgroups.The2015earningsaverageforthecreativeindustry’sportfoliowas$49,774,whichwaslowerthanthestatewideaverageof$52,048.
GroupChange
in Jobs
Average
EarningsGroup
Change
in Jobs
Average
Earnings
Business Consulting 32.8% $58,726 Cultural Activities 131.5% $48,025
Design Services 15.3% $26,607 Music 39.4% $40,865
Engineering and Research & Development 8.5% $95,765
Marketing, Photography & Related 12.3% $27,013
Performing and Creative Arts 0.7% $25,261
Computer and Digital Media Products 7.0% $89,294
GroupChange
in Jobs
Average
EarningsGroup
Change
in Jobs
Average
Earnings
Architecture ‐8.1% $72,359 Art Education 40.5% $14,180
Radio and TV Broadcasting ‐17.9% $64,006
Publishing & Information ‐33.3% $50,121
Film, TV, Video Production/Distrib ‐39.0% $54,648
Declining Group: 12.5% of Jobs Emerging Group: 1.6% of Jobs
CREATIVE INDUSTRY GROUPS MAPPED BY PERFORMANCE, 2005‐2015Total Jobs, 2015: 49,597
Average Annual Earnings, 2015: $49,774
Net Change in Jobs, 2005‐2015: 8.9%
Transitioning Group: 75.9% of Jobs Base‐Growth Group: 10.0% of Jobs

P a g e |9
June2016
HighPerformingCreativeIndustryGroups
Onlytwocreativeindustrygroups,culturalactivitiesandmusic,registeredashighperformingbase‐growthindustriesforthe2005to2015period.
Onlyonegroup,arteducation,fellsintotheemergingcategory.Thisgroupalsoperformedwellinjobcreation.
2015NaHokuHanohanoAwardsAlternativeAlbumoftheYear,StreelightCadence,HawaiiMusician/Band.PhotocreditSoulSessionUSA
OtherCreativeIndustries’Performance
Sixofthecreativesectorindustrygroupsfellintothetransitioningcategoryforthe2005to2015period.Theserangedfromtheperformingandcreativearts,whichincreased0.7%injobstobusinessconsulting,whichgrewjobsby32.8%.However,whiletheseindustrygroupsgrew,theirgrowthratewasbelowthesameindustriesnationally.Asaresult,theylostsomegroundtothenationintermsofcompetitiveindustryshare.
Finally,thefourcreativeindustrygroupsthatlostjobsduringthe2005to2015periodfellintothe declining quadrant of the performancemaps; thesewere radio& TV broadcasting, publishing&information,film,TV,videoproduction/distribution,andarchitecture.
It is important to note that the independence of these creative groups is not yet clear. Theperformanceofsomegroupsmayreflectstrongorweakmarketsdrivingotherindustriesforwhichthecreative target is simply a supplier. For instance, the high performance of cultural activities in theperformancemapprobablyreflectsthestrongtourismdemandovertheperiod,ratherthanaspecificlocalorexportmarketforculturalproducts.Likewise,sometargetsmayperformpoorlybecausetheyaretiedtoanotherindustrythathasexperienceddifficulties.

10|P a g e
Hawaii’sCreativeIndustries:UpdateJune2016
ConclusionsandNextSteps
WorkshouldcontinuetofleshoutthedimensionsandopportunitiesofthecommercialmarketsservedbytheNAICS‐basedcreativeindustrygroups.Thisisespeciallyimportantforthedigitalmediaandthebroaderfilmindustry,whichareonlypartiallycapturedintheNAICSfilmproductionindustry.Alsoneeding closer study is the linkbetween specific creative activity andemerging technologies ininformation,communications,entertainment,andthebroadrangeofcommercialapplicationsthatarebeingdrivenbyinnovation.LearninghowcreativeactivitysupportsandutilizesemergingtechnologycanhelpclarifytheskillsetsandeducationalelementsthatwillhelpmakeHawaiialeaderininnovation.
GVSConnectannouncedthenewbroadbandfiberservicewithalivereal‐timedemonstrationfromKona,Hawaii,toascreeningroomfilledwithHollywoodstudioexecutivesatWarnerBros.StudiosinLosAngeles.PhotoCreditPsalmOines

P a g e |11
June2016
I. INTRODUCTION
Development of Hawaii’s key creative activities has become an important focus of the State’s economic development efforts in recent years for several reasons. First, Hawaii’s cultural diversity and the unique heritage of its Hawaiian host culture are major attractions for the millions of visitors that inject billions of dollars into Hawaii’s economy each year. Without this cultural component to the visitor experience, Hawaii is mostly a sun and surf destination like many of its competitors.
Second, the depth of Hawaii’s creative and cultural talent and unique artistic content helps Hawaii’s creative products compete in global markets. Supporting this asset is a market of millions of visitors to the state each year, which helps the arts and culture sector maintain critical mass. Furthermore, visitors absorb the creative products of Hawaii in context and share their discovery in the many markets from which they have come.
Third, the creative industries and their workforce are key sources of ideas, content and talent for Hawaii’s emerging technology sector. Advancement in science and technology has made it possible for the development and delivery of new and valuable intellectual property, such as computer animation, mini-applications for mobile devices and even 3D modeling of potential new products. While the property rights to new technologies like smart phone, tablet, and 3D TV may be owned and licensed by a few, or even just a single company, content development stemming from, or using these technologies has no limit in terms of products and number of companies that can benefit from content development.
The Definition of the Creative Sector
In 2007 DBEDT’s Research and Economic Analysis Division (READ), in conjunction with DBEDT’s Creative Industries Division (CID) developed a measure for the creative sector that focused on a number of key industry groups, highlighted by film and TV, music, and performing arts.1
CIDweavesclustersofmusic, filmand television together tosupportcrosspromotionandmonetizationbetween sectors such as Hawaii artists inclusion in CBS TV’s Hawaii 5‐0 on screen, soundtrack andCD/downloads.PhotocreditCBS.
1TheCreativeIndustryinHawaii,April2007,DBEDT.
12|P a g e
Hawaii’sCreativeIndustries:UpdateJune2016
However, since that report, several emerging areas have been added to that focus of interest, particularly emerging types of intellectual property based on new technologies for developing and delivering content through digital media and the internet. The priority focus by the State on the creative sector is now on a number of key activities for which Hawaii has an established competitive advantage as well as areas based on emerging technology that can generate valuable exports and high paying jobs including:
Film and TV Music Digital media products (such as games and mobile applications) Animation Workforce development in these focus activities
To support the evolving development focus, CID and READ determined that a broader definition of the sector was needed. More current definitions of the creative sector were reviewed and the scope of the activities was revised based in large part on a similar study in Massachusetts.2
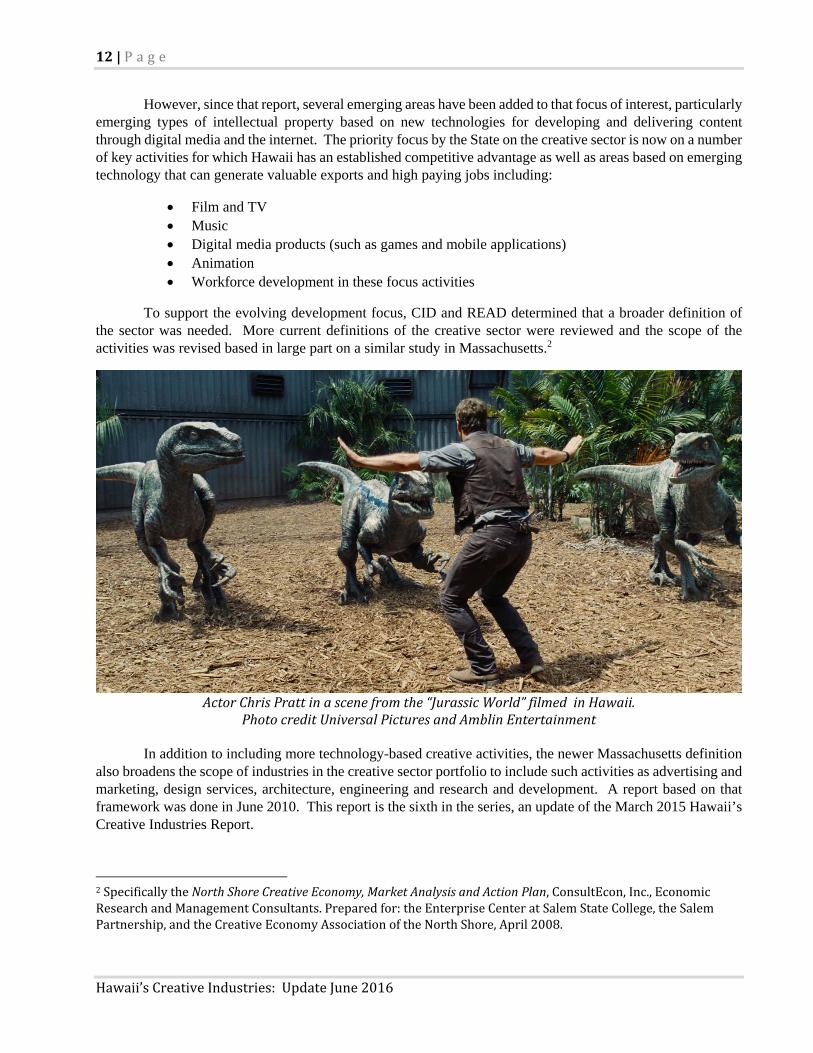
ActorChrisPrattinascenefromthe“JurassicWorld”filmedinHawaii.PhotocreditUniversalPicturesandAmblinEntertainment
In addition to including more technology-based creative activities, the newer Massachusetts definition
also broadens the scope of industries in the creative sector portfolio to include such activities as advertising and marketing, design services, architecture, engineering and research and development. A report based on that framework was done in June 2010. This report is the sixth in the series, an update of the March 2015 Hawaii’s Creative Industries Report.
2SpecificallytheNorthShoreCreativeEconomy,MarketAnalysisandActionPlan,ConsultEcon,Inc.,EconomicResearchandManagementConsultants.Preparedfor:theEnterpriseCenteratSalemStateCollege,theSalemPartnership,andtheCreativeEconomyAssociationoftheNorthShore,April2008.

P a g e |13
June2016
DataSources
A major feature of the 2007, 2010, 2012, 2014, 2015 and current update of the creative sector is measurability and comparability. Where possible, the industries in the creative sector are selected from the very detailed North American Industrial Classification System (NAICS). A rich and reliable array of data is available on economic activity based on NAICS. NAICS data also permit the comparison of Hawaii industries against the same activities nationally, allowing better measures of performance.3 Thedata forthisreportweredevelopedforarecentDBEDTstudyoninnovationindustries,whichincludedthecreativesector.Theyconsistprimarilyof jobsand laborearningsthatareavailableannually fordetailed industries.4Othermeasuressuchassales,outputandgrossproductarenotavailableasfrequentlyorinasmuchdetail.Morediscussiononthedataiscontainedinthefollowingsection.
MegLeFauve,screenwriteroftheAcademyAwardwinninganimatedfilm“InsideOut”atCreativeLab
Hawaii@HIFF2016withMichaelPalmieri,ExecutiveDirectorofCreativeLabHawaii.PhotocreditKardanPhotography
3The framework was developed by DBEDT in another recent study for the evaluation of emerging industry performanceSeeBenchmarkingHawaii’sEmergingIndustries,http://hawaii.gov/dbedt/info/economic/data_reports/emerging‐industries/.
4ThebasicdataarecompiledbyEconomicModelingSpecialists,Inc.(EMSI)andprocessedbyDBEDT.EMSIsupplementsdatafromtheFederalDepartmentsofLaborandCommercebyincludingestimatesofproprietorsandself‐employedjobs,andbyestimatingdataforverysmallindustriesthatarenotreportedbytheFederalagenciesduetodisclosureissues.

14|P a g e
Hawaii’sCreativeIndustries:UpdateJune2016
II.OVERVIEWOFHAWAII’SCREATIVEINDUSTRIESPORTFOLIO
Table1providesanoverviewofthe13industrygroupsinthecreativesector,andtheir2015jobcount,basedonthecurrentdefinitionofthesector.Intotal,thecreativeindustriesaccountedforabout49,597jobsinHawaiifor2015.Thiswasup8.9%from2005,andup1.8%from2008.Theearningsaveragewas$49,774.
TheseindustrieshavebeendefinedusingtheNorthAmericanIndustrialClassificationSystem,orNAICS,whichprovidesarichsourceofstandarddataatadetailedlevelonproducingindustries.Withoutthatstandarddata,wewouldbefacedwiththeneedtodospecialsurveysandcompilations,whicharecostlyandusuallynotcomparablewithsimilaractivityelsewhere.
Unfortunately, NAICS is strictly a production‐oriented, supply‐side classification system,meaningthat it is focusedonfirmsandindustriesnotmarkets. ForthatreasonNAICSdatadoesnotclearlyidentifymajorcommercialmarketsforcreativesectorproductssuchasdigitalmedia,computeranimationandgames.NAICSdoesmeasuremanyofthelikelyindustriesthatproduceproductsforthesemarkets,suchascomputerprogramming,engineeringandfilm&videoproduction.
Whiletheproduction‐basedNAICSdatadoesnotprovideallthedatawewouldlike, it ishighqualityinformationandcomparablewithnationaldata.Also,thejobsassociatedwiththecommercialmarketactivityarecontained,forthemostpart,intheproductionsideindustrygroups.WiththeNAICSdataasabase,furthereffortscanbemadetobetterunderstandthecommercialmarketsandHawaii’scompetitivenessinservingthem.
Industry Group 2015 Job
Marketing, Photography & Related 11,098
Performing and Creative Arts 9,087
Engineering and Research & Development 5,542
Business Consulting 5,035
Computer and Digital Media Products 4,808
Cultural Activities 3,480
Publishing & Information 2,073
Design Services 2,061
Architecture 1,937
Music 1,482
Radio and TV Broadcasting 1,133
Film, TV, Video Production/Distrib 1,047
Art Education 815
Total Creative Industry 49,597
CREATIVE INDUSTRY PRODUCTION GROUPS
Source: DBEDT, READ.
TABLE1

P a g e |15
June2016
Itshouldbenotedthatnotalloftheindustrygroupsinthecreativesectorportfolioarethesubjectof active assistance by the State or local economic development organizations. Themain groups ofinterest include film/TV,music, cultural activities, performing arts and computer services related todigitalmedia.
However,othergroupslikebusinessconsulting,publishingandinformation,broadcastingandarchitecture,tonameafew,havenotyetbeenthefocusofdevelopmentefforts.Thisismainlybecausetheyhavejustrecentlybeenaddedtothecreativeindustryportfoliothroughtheadoptionofthenew,broaderdefinitionofthecreativesector.Theresultsoftheirperformanceinthisstudywillneedtobeevaluated,aswellasfurtherinvestigated,todeterminetheintensityofdevelopmentfocusthatwouldbeappropriatefortheseadditionalcreativeindustrygroups.
CreativeSectorJobGrowth
Intermsofjobgrowth,thecreativeindustriesportfolioseemstohaveperformedslightlyabovetheaverageoverthe2005to2015period(Figure1).NineofthethirteenNAICS‐based,targetindustrygroupsshowednetjobgrowthovertheperiod.Sevengroupsoutperformedtheoverallstatejobsannualgrowthrateof0.82%.Culturalactivitiestoppedthelistwith8.76%annualgrowth.Thiswasfollowedby art education,music, business consulting, design services,marketing, photography& related, andengineering/R&Dservices.
The four industry groups that lost jobs over the period were film, TV, videoproduction/distribution,publishing&information,radio/TVbroadcasting,andarchitecture.
Settingthestageforcreativeentrepreneurs,theparticipantsinCID/DBEDT’s
CreativeLabHawaii2013‐15gatheratthefamedHawaiiTheatreforHawaiiBusinessMagazine,2016.PhotocreditTommyShihandHawaiiBusinessMagazine.

16|P a g e
Hawaii’sCreativeIndustries:UpdateJune2016
FIGURE1
Source:DBEDTcompilationbasedonEMSIdata.
Whilethisstudyisfocusedmoreonthelongertermtrendsinthecreativesector,itisofinteresttolookathowjobsinthesectorhavebeenimpactedsofarbythecurrenteconomicdownturn.Figure2showshowthecreativeindustrygroupsperformedintermsofjobchangeforthe2008to2015period.
Thecreativesector,likenearlyallofHawaii’sindustries,hasexperiencedsetbacksduetotheveryseverenationalrecessionthatbeganin late2007. Onlysixcreativegroupsmanagedpositivegrowthduring2008‐2015period.Thestrongestperformersintermsofjobgrowthduring2008‐2015periodwereculturalactivities,music,arteducation,andbusinessconsulting.
‐4.82%
‐3.97%
‐1.96%
‐0.84%
0.07%
0.68%
0.82%
0.82%
0.86%
1.17%
1.43%
2.88%
3.38%
3.46%
8.76%
‐7.00% ‐5.00% ‐3.00% ‐1.00% 1.00% 3.00% 5.00% 7.00% 9.00% 11.00%
Film, TV, Video Production/Distrib
Publishing & Information
Radio and TV Broadcasting
Architecture
Performing and Creative Arts
Computer and Digital Media Products
All Industry Total
Engineering and Research & Development
Total Creative Industry
Marketing, Photography & Related
Design Services
Business Consulting
Music
Art Education
Cultural Activities
CREATIVE SECTOR AVERAGE ANNUAL JOB GROWTH RATE, 2005‐2015
P a g e |17
June2016
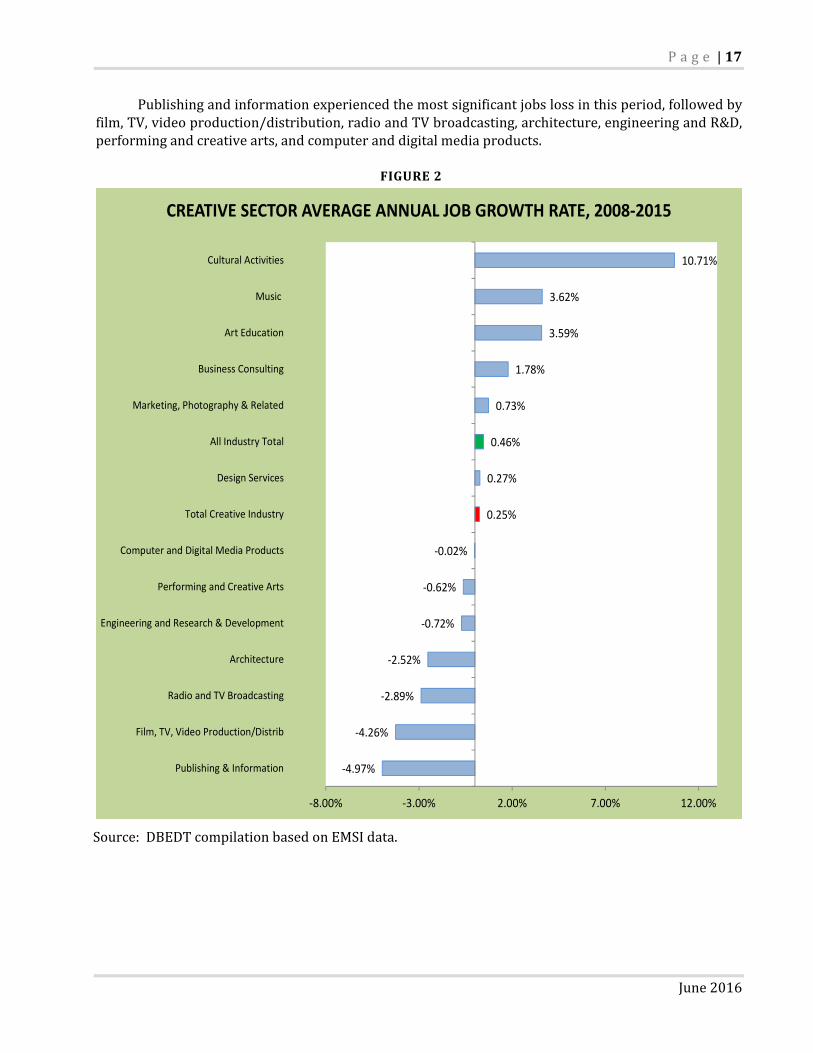
Publishingandinformationexperiencedthemostsignificantjobslossinthisperiod,followedbyfilm,TV,videoproduction/distribution,radioandTVbroadcasting,architecture,engineeringandR&D,performingandcreativearts,andcomputeranddigitalmediaproducts.
Source:DBEDTcompilationbasedonEMSIdata.
‐4.97%
‐4.26%
‐2.89%
‐2.52%
‐0.72%
‐0.62%
‐0.02%
0.25%
0.27%
0.46%
0.73%
1.78%
3.59%
3.62%
10.71%
‐8.00% ‐3.00% 2.00% 7.00% 12.00%
Publishing & Information
Film, TV, Video Production/Distrib
Radio and TV Broadcasting
Architecture
Engineering and Research & Development
Performing and Creative Arts
Computer and Digital Media Products
Total Creative Industry
Design Services
All Industry Total
Marketing, Photography & Related
Business Consulting
Art Education
Music
Cultural Activities
CREATIVE SECTOR AVERAGE ANNUAL JOB GROWTH RATE, 2008‐2015
FIGURE2

18|P a g e
Hawaii’sCreativeIndustries:UpdateJune2016
NationalCompetitivenessoftheCreativeSector
Job growth helps show the creative industries’ competitiveness within Hawaii’s economy.Anothermeasurethatcanhelpshedlightoncreativesectorindustriesistheirperformancecomparedtothesamenationalindustry.IfHawaii’screativeindustrygrowthrateishigherthanthenationalgrowthrate,Hawaii’screativeindustryiseffectivelyincreasingitscompetitiveshareofthenationalindustry.IftheindustryisgrowingmoreslowlyinHawaiiitsnationalindustryshareisdeclining.5
Figure3showshowmuchmoreorlessHawaii’screativeindustriesgrewperyearonaveragethanthesameindustriesnationally.Forinstance,overthe2005to2015period,jobsintheculturalactivitiesindustrygroupgrewanaverageof6.0%moreannuallyinHawaiithanthesameindustrynationwide.Thus,Hawaii’s cultural activities industry group gained competitive national industry share. On theotherhand,eventhoughthecomputeranddigitalmediaproductsindustrygroupgrewjobsoverthisperiod, it lostnationalindustryshareduetoanaverageannualgrowthratethatwas3.3%belowthenationalindustrygrowthrate.
Industries like business consulting, design services, engineering and research & development,performing and creative arts, and marketing, photography & related also lost competitive nationalmarketshareeventhoughtheyincreasedtheirstatewidejobcounts.Industriesthathavebothpositivejob growth and an increase in competitive national industry share, represent the best performingindustrygroupsoveragivenperiodoftime.Industrygroupswiththehighercompetitivesharemetricareprobablyshowingahighercomparativeadvantagecomparedwiththenationalindustry.
Hawaii’sCreative IndustriesDivisionCo‐Sponsors thetelevisionand internetprogramShowcaseHawaiifeaturingsegmentsinterviewingbusinessmentorsinfashion,music,art,publishing&interactivemedia.
5AmorecompletediscussionoftheperformancemetricsandframeworkforanalysisiscontainedintheDBEDTreportBenchmarkingHawaii’sEmergingIndustries,availablefordownloadathttp://hawaii.gov/dbedt/info/economic/data_reports/emerging‐industries/.

P a g e |19
June2016
FIGURE3
Source:DBEDTcompilationbasedonEMSIdata.
IndustryConcentration–Hawaii’sCreativeSpecialties
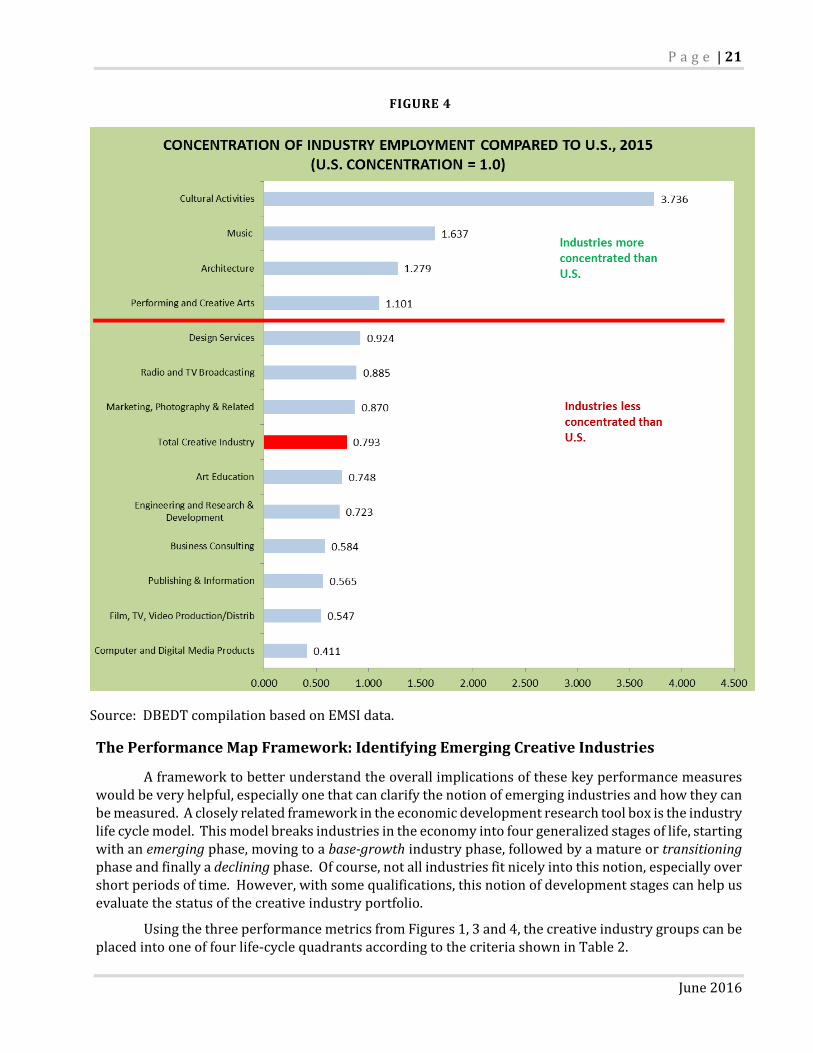
A third performance metric that helps in the evaluation of the creative industry portfolio isindustryjobconcentration(Figure4).ThisisameasureofhowmuchHawaiispecializesintheindustryandithelpsshedlightontheindustries’exportorientation.
Export activity brings newmoney into the state and is a basis for long‐term industry growth.Unfortunately,estimatesofindustryexportsarenotpartofstandardindustrydataprograms.Thus,itisnotclearhowmuchoutputinagivencreativeindustryisexported.
However,itispossibletoidentifylikelyexportindustriesbymeasuringtheconcentrationoftheiremploymentinthestate’seconomy.AnindustrythatemploysasignificantlyhigherproportionofjobsinHawaii thandoes the same industry nationally is relativelymore concentrated and is likely to beexportingatleastsomeofitsoutput.
‐4.8%
‐3.3%
‐2.6%
‐2.3%
‐1.5%
‐1.1%
‐0.7%
‐0.4%
‐0.3%
‐0.2%
0.0%
0.5%
1.1%
6.0%
‐6.0% ‐4.0% ‐2.0% 0.0% 2.0% 4.0% 6.0%
Film, TV, Video Production/Distrib
Computer and Digital Media Products
Publishing & Information
Performing and Creative Arts
Radio and TV Broadcasting
Total Creative Industry
Marketing, Photography & Related
Engineering and Research & Development
Design Services
Business Consulting
Architecture
Art Education
Music
Cultural Activities
GAIN OR LOSS OF NATIONAL COMPETITIVE INDUSTRY SHARE, 2005‐2015
Gaining national competitive share
Losing national competitive share

20|P a g e
Hawaii’sCreativeIndustries:UpdateJune2016
IndustryconcentrationismeasuredbyametriccalledtheLocationQuotient,orLQforshort.TheLQforanindustryattheU.S.levelisfixedat1.0.HawaiiindustrieswithanLQmeasuremorethan1.0aremoreconcentratedintheeconomythanthesameindustryfortheU.S.asawhole.Thosebelow1.0arelessconcentrated.
Forinstance,themeasureforculturalactivitiesinFigure4meansthatemploymentinHawaii’sculturalindustrygroupis3.7timesmoreconcentratedthanfortheU.S.asawhole.Thissuggeststhatcultural activities are relatively more important to Hawaii and that the state may be exporting asignificantamountoftheindustry’soutput.Ontheotherhand,businessconsultinginHawaiiwith,anLQofjust0.6,hasonlyabouthalftheemploymentconcentrationofthesameindustrygroupfortheU.S.asawhole.Itispossiblethatbusinessconsultingmaybeexportingsomeofitsoutput.Butithasalongwaytogotodemonstratethestrongcomparativeadvantageshownbythemoreconcentratedindustriesabovethe1.0level.
In addition to cultural activities, music, architecture, and performing/creative arts hadconcentrationsinHawaii’seconomythatwerehigherthanthesameindustriesnationally.Thesemoreconcentrated industries are probably helping to driveHawaii’s economy. Industries that are not asconcentratedinHawaiiastheyarenationallymayalsobeexportingsomeoftheiroutput.However,theyareprobablyservingmainlylocaldemand.
CreativeLabHawaii,foundedin2012bytheHawaiiStateDepartmentofBusiness,EconomicDevelopment,andTourism’sCreativeIndustriesDivision(CID),isakeyfacetofDBEDT’sHIGrowthInitiative,CreativeLabfostersthetalentdevelopmentinHawaii’sinnovationecosystemtoincreaseexport,attractinvestmentandbuildthestate’screativeentrepreneurialcapacity.
P a g e |21
June2016
Source:DBEDTcompilationbasedonEMSIdata.
ThePerformanceMapFramework:IdentifyingEmergingCreativeIndustries
Aframeworktobetterunderstandtheoverallimplicationsofthesekeyperformancemeasureswouldbeveryhelpful,especiallyonethatcanclarifythenotionofemergingindustriesandhowtheycanbemeasured.Acloselyrelatedframeworkintheeconomicdevelopmentresearchtoolboxistheindustrylifecyclemodel.Thismodelbreaksindustriesintheeconomyintofourgeneralizedstagesoflife,startingwithanemergingphase,movingtoabase‐growthindustryphase,followedbyamatureortransitioningphaseandfinallyadecliningphase.Ofcourse,notallindustriesfitnicelyintothisnotion,especiallyovershortperiodsoftime.However,withsomequalifications,thisnotionofdevelopmentstagescanhelpusevaluatethestatusofthecreativeindustryportfolio.
UsingthethreeperformancemetricsfromFigures1,3and4,thecreativeindustrygroupscanbeplacedintooneoffourlife‐cyclequadrantsaccordingtothecriteriashowninTable2.
FIGURE4

22|P a g e
Hawaii’sCreativeIndustries:UpdateJune2016
TABLE2.PERFORMANCEMAPCRITERIATRANSITIONING BASE‐GROWTH
Positivejobgrowth Losingcompetitivenationalindustryshare
Positivejobgrowth Highlyconcentratedintheeconomy Increasingcompetitivenationalindustryshare
DECLINING EMERGING
Losingjobsoverperiod
Positivejobgrowth Currentlowconcentrationintheeconomy Increasingcompetitivenationalindustryshare
EmergingQuadrant:Theseareindustriesthatarepotentiallyintheearly,take‐offstage. Theyhavebeenperformingwell by showingboth job growthandan increase in their competitive shareof thenationalindustry.However,theseindustrieshaveyettoachieveaconcentrationinthestate’seconomyequaltothesameindustryfortheU.S.asawhole.Anemergingcreativeindustryisonethathasfoundacompetitivenicheintheeconomyandisgainingincompetitivenationalindustryshare.Atsomepoint,if theprocesscontinues, the industry’sconcentrationwillexceedthenational levelandtheemergingindustrywillgraduatetoabase‐growthindustryinthestate’seconomy.
Base‐GrowthQuadrant:Theseareindustriesthathavebecomepotentialeconomicdrivers.Theyaregrowingtheirjobcountsandareincreasingtheircompetitivenationalindustryshare.Moreover,theyhaveexceededthenationallevelofindustryconcentrationintheeconomyandareprobablyexportingatleastaproportionoftheiroutput.
Transitioning Quadrant: Transitioning creative industries are still maintaining or growing theirworkforce,howevertheyarelosingcompetitivenationalindustryshare(growingmoreslowlythanthesameindustrynationally).Thisistypicalofmatureindustriesthatarestillimportanttotheeconomybutarehavingdifficultymaintainingnationalmarketshare.Theyareconsideredtransitioningbecausethey could either continue to lose industry share and eventually fall into decline, or reinvigoratethemselves andbegin to regain industry share and continue growing. Also in this quadrantmaybeformeremergingindustriesthatneverreachedbase‐growthstatusbeforelosingcompetitivenationalindustryshareandsomepreviouslydecliningindustriesthatarefightingbackintocompetitiveness.
DecliningQuadrant: Thedecliningquadrant contains industry groups showing job losses over theperiod.Allofthesecreativeindustrygroupshavelostjobstosomeextentbetween2004and2014.Mostindustriesthatarelosingjobsarealsolosingcompetitivenationalindustryshare.However,whiletheyaredeclininginjobsfortheperiod,theseindustriesarenotnecessarilydyingindustries.AnumberoftemporarycircumstancesmayhaveputsomeofHawaii’screativeindustriesintothedecliningquadrantfor theperiod studied. Their appearance in thedecliningquadrant is a red flag thatwarrantsmorecarefulanalysistounderstandtheproblem.
Itmustbeemphasizedthattheperformancemapframeworkismoreofaguidetounderstandanindustry’ssituationratherthanaconclusionaboutthevalueoftheindustrytothestate.Itprovidesastartingpointforassessingthestrengthsandweaknessesoftheindustriesintheportfolio.Also,withinindustries thatareexperiencingmixedorpoorperformance theremaybepocketsofverysuccessfulfirms.

P a g e |23
June2016
III. CREATIVEINDUSTRYPORTFOLIOPERFORMANCE
Table3showshowtheindividual,NAICS‐basedcreativeindustrygroupsfellontheperformancemapbasedonthe2005to2015performancemeasures.Combined,theNAICS‐basedcreativeindustrygroupsaccountedforabout49,597jobsinHawaii’seconomyduring2015.
Source:DBEDTcompilationbasedonEMSIdata.
Overall, the creative industrygroupsaddedabout4,058 jobs to thestate’seconomybetween2005and2015.Thisamountedtoan8.9%increaseinjobs,slightlyhigherthanthe8.5%growthinHawaii’scivilianeconomyasawholefortheperiod.Theleadingperformersoftheoverallportfolioweretheculturalactivitiesandmusicgroups.The2015earningsaverageofthecreativeindustryportfolioof$49,774waslowerthanthestatewideaverageof$52,048.
HighPerformingCreativeIndustryGroups
Twocreativeindustrygroups,culturalactivitiesandmusic,registeredashighperformingbase‐growthindustriesforthe2005to2015period.
Onlyonegroup,arteducation,fellsintotheemergingcategory.Thisgroupalsoperformedwellinjobcreation.
GroupChange
in Jobs
Average
EarningsGroup
Change
in Jobs
Average
Earnings
Business Consulting 32.8% $58,726 Cultural Activities 131.5% $48,025
Design Services 15.3% $26,607 Music 39.4% $40,865
Engineering and Research & Development 8.5% $95,765
Marketing, Photography & Related 12.3% $27,013
Performing and Creative Arts 0.7% $25,261
Computer and Digital Media Products 7.0% $89,294
GroupChange
in Jobs
Average
EarningsGroup
Change
in Jobs
Average
Earnings
Architecture ‐8.1% $72,359 Art Education 40.5% $14,180
Radio and TV Broadcasting ‐17.9% $64,006
Publishing & Information ‐33.3% $50,121
Film, TV, Video Production/Distrib ‐39.0% $54,648
Declining Group: 12.5% of Jobs Emerging Group: 1.6% of Jobs
CREATIVE INDUSTRY GROUPS MAPPED BY PERFORMANCE, 2005‐2015Total Jobs, 2015: 49,597
Average Annual Earnings, 2015: $49,774
Net Change in Jobs, 2005‐2015: 8.9%
Transitioning Group: 75.9% of Jobs Base‐Growth Group: 10.0% of Jobs
TABLE3

24|P a g e
Hawaii’sCreativeIndustries:UpdateJune2016
OtherCreativeIndustries’Performance
Sixofthecreativesectorindustrygroupsfellintothetransitioningcategoryforthe2005to2015period.Theserangedfromtheperformingandcreativeartswhichincreased0.7%injobstobusinessconsulting,whichgrewjobsby32.8%.However,whiletheseindustrygroupsgrew,itwasnotasvigorousasthesameindustriesnationally.Asaresult,theylostsomegroundtothenationintermsofcompetitiveindustryshare.
Finally, four creative industry groups that lost jobs in the 2005 to 2015 period fell into thedecliningquadrantoftheperformancemap.Radio&TVbroadcasting,publishing&information,film,TV,videoproduction/distribution,andarchitecturealllostjobsfortheperiod.Itisimportanttonotethattheindependenceofthesecreativegroupsisnotyetclear.Theperformanceofsomegroupsmayreflectstrongorweakmarketsdrivingotherindustriesforwhichthecreativetargetissimplyasupplier.Forinstance,thehighperformanceofculturalactivitiesintheperformancemapprobablyreflectsthestrong tourism demand over the period, rather than a specific local or export market for culturalproducts.Likewise,sometargetsmayperformpoorlybecausetheyaretiedtoanotherindustrythathasexperienceddifficulties.
Hard‐to‐MeasureCreativeActivities
Asdiscussedearlier,anumberofcreativeactivitiescannotbeeasilyormeaningfullydefinedintheNAICSindustrysystem.Theseactivities—mainlythedigitalmediaandbroaderfilmindustry—representeithermarkets,oraseriesofpartialNAICSindustries.InSectionV,theavailableinformationfor thesehard‐to‐measureactivitieswill bepresented to theextent available. However,mostof theemploymentengagedinthesemarketactivitiesisprobablycapturedinoneormoreoftheproducingindustriesthatweareabletodefineandmeasure.Thegoalwillbetoeventuallyparsetheproducingindustryemploymentintotheimportantmarketsectorstheysupport.
NaHokuHanohanoAwards:FavoriteEntertaineroftheYear,JakeShimabukuro,UkulelevirtuosoandcomposerandoneoftheNation’sTurnaroundSchoolsHawaiiArtists
inspiringstudentsatthreeOahuelementaryschools.
P a g e |25
June2016
IV. CREATIVEINDUSTRYPERFORMANCEBYCOUNTYThefollowingtablessummarizethe2005to2015countyperformanceofthestatewidecreative
industries(paidemploymentandself‐employed/soleproprietors).PerformancehasbeenorganizedbyBestPerformingTargets(registeringasbase‐growth&emergingindustrygroups)andOtherTargetedIndustryPerformance(thosethatfellintothetransitioninganddecliningcategories).
City&CountyofHonolulu
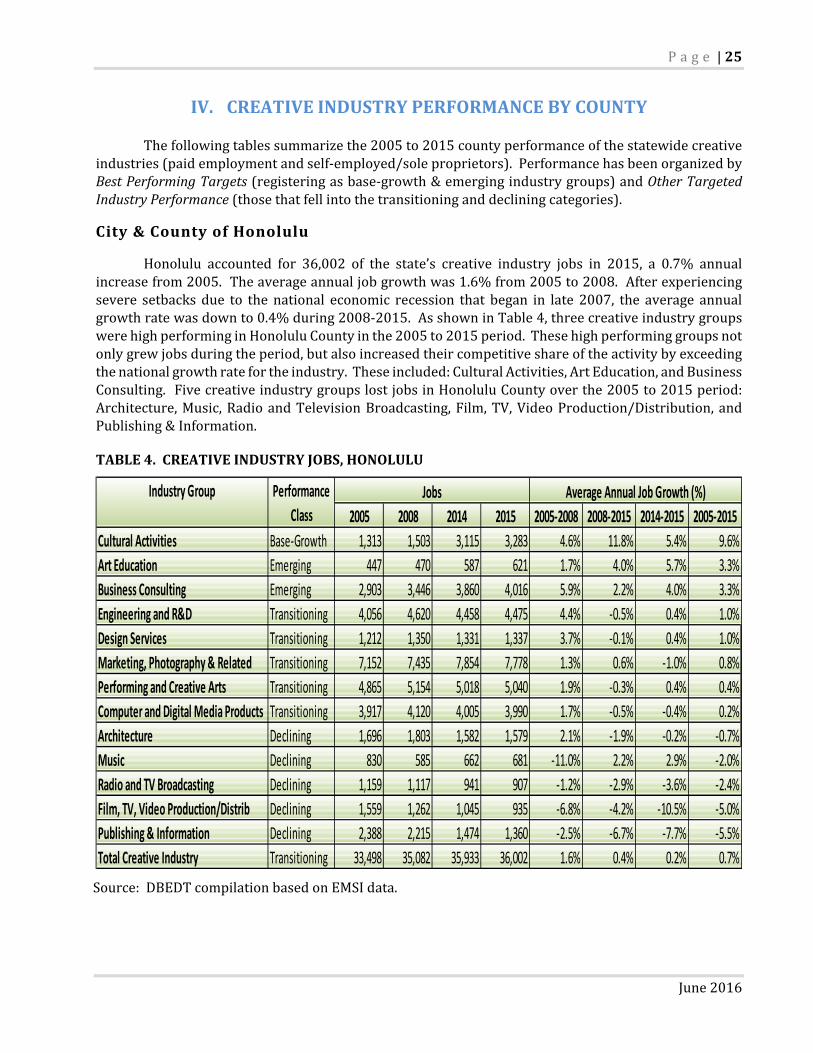
Honolulu accounted for 36,002 of the state’s creative industry jobs in 2015, a 0.7% annualincreasefrom2005.Theaverageannualjobgrowthwas1.6%from2005to2008.Afterexperiencingsevere setbacks due to the national economic recession that began in late 2007, the average annualgrowthratewasdownto0.4%during2008‐2015.AsshowninTable4,threecreativeindustrygroupswerehighperforminginHonoluluCountyinthe2005to2015period.Thesehighperforminggroupsnotonlygrewjobsduringtheperiod,butalsoincreasedtheircompetitiveshareoftheactivitybyexceedingthenationalgrowthratefortheindustry.Theseincluded:CulturalActivities,ArtEducation,andBusinessConsulting.FivecreativeindustrygroupslostjobsinHonoluluCountyoverthe2005to2015period:Architecture,Music,RadioandTelevisionBroadcasting,Film,TV,VideoProduction/Distribution,andPublishing&Information.
TABLE4.CREATIVEINDUSTRYJOBS,HONOLULU
Source:DBEDTcompilationbasedonEMSIdata.
2005 2008 2014 2015 2005‐2008 2008‐2015 2014‐2015 2005‐2015
Cultural Activities Base‐Growth 1,313 1,503 3,115 3,283 4.6% 11.8% 5.4% 9.6%
Art Education Emerging 447 470 587 621 1.7% 4.0% 5.7% 3.3%
Business Consulting Emerging 2,903 3,446 3,860 4,016 5.9% 2.2% 4.0% 3.3%
Engineering and R&D Transitioning 4,056 4,620 4,458 4,475 4.4% ‐0.5% 0.4% 1.0%
Design Services Transitioning 1,212 1,350 1,331 1,337 3.7% ‐0.1% 0.4% 1.0%
Marketing, Photography & Related Transitioning 7,152 7,435 7,854 7,778 1.3% 0.6% ‐1.0% 0.8%
Performing and Creative Arts Transitioning 4,865 5,154 5,018 5,040 1.9% ‐0.3% 0.4% 0.4%
Computer and Digital Media Products Transitioning 3,917 4,120 4,005 3,990 1.7% ‐0.5% ‐0.4% 0.2%
Architecture Declining 1,696 1,803 1,582 1,579 2.1% ‐1.9% ‐0.2% ‐0.7%
Music Declining 830 585 662 681 ‐11.0% 2.2% 2.9% ‐2.0%
Radio and TV Broadcasting Declining 1,159 1,117 941 907 ‐1.2% ‐2.9% ‐3.6% ‐2.4%
Film, TV, Video Production/Distrib Declining 1,559 1,262 1,045 935 ‐6.8% ‐4.2% ‐10.5% ‐5.0%
Publishing & Information Declining 2,388 2,215 1,474 1,360 ‐2.5% ‐6.7% ‐7.7% ‐5.5%
Total Creative Industry Transitioning 33,498 35,082 35,933 36,002 1.6% 0.4% 0.2% 0.7%
Industry Group Performance
Class
Jobs Average Annual Job Growth (%)
26|P a g e
Hawaii’sCreativeIndustries:UpdateJune2016
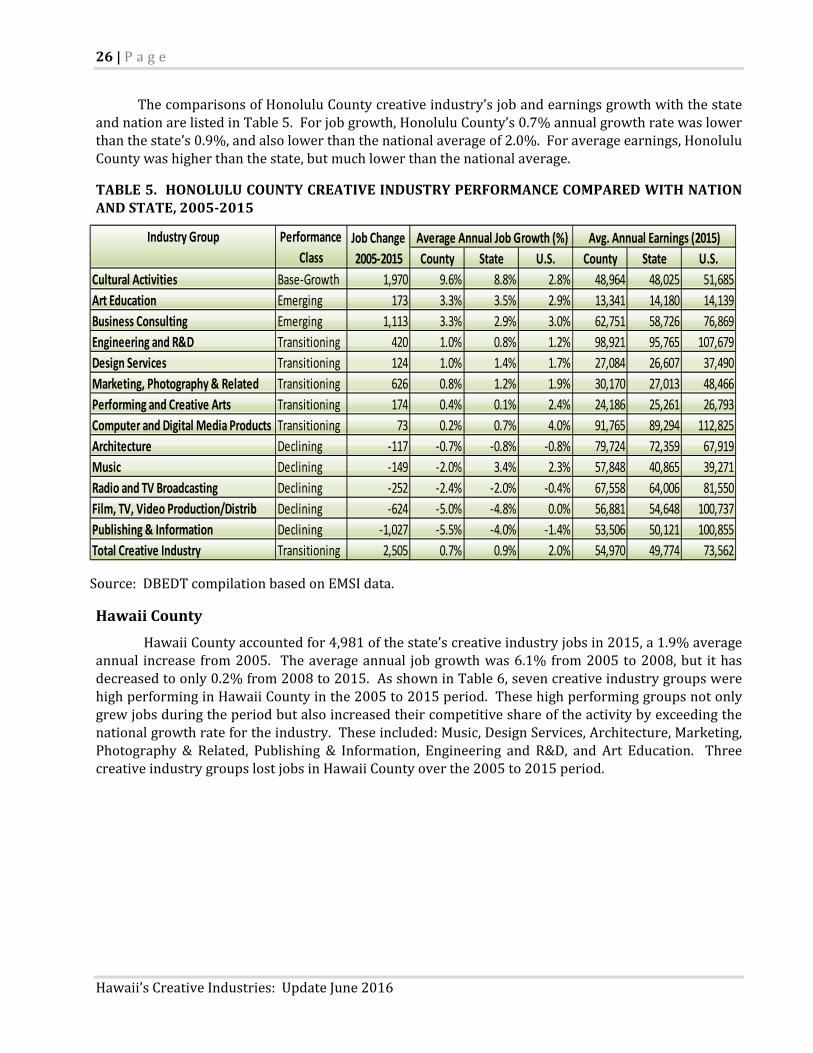
ThecomparisonsofHonoluluCountycreativeindustry’sjobandearningsgrowthwiththestateandnationarelistedinTable5.Forjobgrowth,HonoluluCounty’s0.7%annualgrowthratewaslowerthanthestate’s0.9%,andalsolowerthanthenationalaverageof2.0%.Foraverageearnings,HonoluluCountywashigherthanthestate,butmuchlowerthanthenationalaverage.
TABLE5. HONOLULUCOUNTYCREATIVEINDUSTRYPERFORMANCECOMPAREDWITHNATIONANDSTATE,2005‐2015
Source:DBEDTcompilationbasedonEMSIdata.
HawaiiCounty
HawaiiCountyaccountedfor4,981ofthestate’screativeindustryjobsin2015,a1.9%averageannual increase from2005. Theaverageannual jobgrowthwas6.1%from2005to2008,but ithasdecreasedtoonly0.2%from2008to2015.AsshowninTable6,sevencreativeindustrygroupswerehighperforminginHawaiiCountyinthe2005to2015period.Thesehighperforminggroupsnotonlygrewjobsduringtheperiodbutalsoincreasedtheircompetitiveshareoftheactivitybyexceedingthenationalgrowthratefortheindustry.Theseincluded:Music,DesignServices,Architecture,Marketing,Photography& Related, Publishing & Information, Engineering and R&D, and Art Education. ThreecreativeindustrygroupslostjobsinHawaiiCountyoverthe2005to2015period.
Average Annual Job Growth (%)
County State U.S. County State U.S.
Cultural Activities Base‐Growth 1,970 9.6% 8.8% 2.8% 48,964 48,025 51,685
Art Education Emerging 173 3.3% 3.5% 2.9% 13,341 14,180 14,139
Business Consulting Emerging 1,113 3.3% 2.9% 3.0% 62,751 58,726 76,869
Engineering and R&D Transitioning 420 1.0% 0.8% 1.2% 98,921 95,765 107,679
Design Services Transitioning 124 1.0% 1.4% 1.7% 27,084 26,607 37,490
Marketing, Photography & Related Transitioning 626 0.8% 1.2% 1.9% 30,170 27,013 48,466
Performing and Creative Arts Transitioning 174 0.4% 0.1% 2.4% 24,186 25,261 26,793
Computer and Digital Media Products Transitioning 73 0.2% 0.7% 4.0% 91,765 89,294 112,825
Architecture Declining ‐117 ‐0.7% ‐0.8% ‐0.8% 79,724 72,359 67,919
Music Declining ‐149 ‐2.0% 3.4% 2.3% 57,848 40,865 39,271
Radio and TV Broadcasting Declining ‐252 ‐2.4% ‐2.0% ‐0.4% 67,558 64,006 81,550
Film, TV, Video Production/Distrib Declining ‐624 ‐5.0% ‐4.8% 0.0% 56,881 54,648 100,737
Publishing & Information Declining ‐1,027 ‐5.5% ‐4.0% ‐1.4% 53,506 50,121 100,855
Total Creative Industry Transitioning 2,505 0.7% 0.9% 2.0% 54,970 49,774 73,562
Job Change
2005‐2015
Avg. Annual Earnings (2015)Industry Group Performance
Class

P a g e |27
June2016
TABLE6.CREATIVEINDUSTRYJOBS,HAWAIICOUNTY
Source:DBEDTcompilationbasedonEMSIdata.
ThecomparisonsofHawaiiCountycreativeindustry’sjobandearningsgrowthwiththestateandnationarelistedinTable7.Forjobgrowth,HawaiiCounty’s1.9%annualgrowthratewashigherthanthestate’s0.9%butlowerthanthenationalaverageof2.0%.Foraverageearnings,HawaiiCountywaslowerthanthestate,andmuchlowerthanthenationalaverage.
TABLE7.HAWAIICOUNTYCREATIVEINDUSTRYPERFORMANCECOMPAREDWITHNATIONANDSTATE,2005‐2015
Source:DBEDTcompilationbasedonEMSIdata.
2005 2008 2014 2015 2005‐2008 2008‐2015 2014‐2015 2005‐2015
Music Base‐Growth 57 164 185 196 42.6% 2.6% 5.9% 13.2%
Design Services Base‐Growth 222 275 272 282 7.4% 0.4% 3.7% 2.4%
Architecture Emerging 137 173 145 149 8.2% ‐2.2% 2.3% 0.8%
Marketing, Photography & Related Emerging 918 1,150 1,166 1,189 7.8% 0.5% 2.0% 2.6%
Publishing & Information Emerging 251 297 297 293 5.8% ‐0.2% ‐1.3% 1.6%
Engineering and R&D Emerging 493 571 593 602 5.0% 0.8% 1.5% 2.0%
Art Education Emerging 42 53 71 72 8.4% 4.4% 1.5% 5.6%
Computer and Digital Media Products Transitioning 196 247 263 268 7.9% 1.2% 1.9% 3.2%
Business Consulting Transitioning 403 506 463 481 7.9% ‐0.7% 3.9% 1.8%
Performing and Creative Arts Transitioning 1,167 1,239 1,248 1,263 2.0% 0.3% 1.2% 0.8%
Film, TV, Video Production/Distrib Declining 53 68 52 51 9.1% ‐4.0% ‐1.0% ‐0.2%
Cultural Activities Declining 96 106 80 76 3.5% ‐4.6% ‐4.3% ‐2.3%
Radio and TV Broadcasting Declining 93 78 58 59 ‐5.9% ‐3.9% 1.6% ‐4.5%
Total Creative Industry Transitioning 4,128 4,927 4,892 4,981 6.1% 0.2% 1.8% 1.9%
Industry Group Performance
Class
Jobs Average Annual Job Growth (%)
Average Annual Job Growth (%)
County State U.S. County State U.S.
Music Base‐Growth 139 13.2% 3.4% 2.3% 27,732 40,865 39,271
Design Services Base‐Growth 60 2.4% 1.4% 1.7% 23,150 26,607 37,490
Architecture Emerging 12 0.8% ‐0.8% ‐0.8% 43,576 72,359 67,919
Marketing, Photography & Related Emerging 270 2.6% 1.2% 1.9% 17,558 27,013 48,466
Publishing & Information Emerging 42 1.6% ‐4.0% ‐1.4% 38,939 50,121 100,855
Engineering and R&D Emerging 109 2.0% 0.8% 1.2% 83,924 95,765 107,679
Art Education Emerging 30 5.6% 3.5% 2.9% 15,927 14,180 14,139
Computer and Digital Media Products Transitioning 72 3.2% 0.7% 4.0% 69,084 89,294 112,825
Business Consulting Transitioning 78 1.8% 2.9% 3.0% 38,115 58,726 76,869
Performing and Creative Arts Transitioning 96 0.8% 0.1% 2.4% 21,334 25,261 26,793
Film, TV, Video Production/Distrib Declining ‐1 ‐0.2% ‐4.8% 0.0% 42,783 54,648 100,737
Cultural Activities Declining ‐19 ‐2.3% 8.8% 2.8% 29,779 48,025 51,685
Radio and TV Broadcasting Declining ‐35 ‐4.5% ‐2.0% ‐0.4% 35,365 64,006 81,550
Total Creative Industry Transitioning 854 1.9% 0.9% 2.0% 35,314 49,774 73,562
Job Change
2005‐2015
Avg. Annual Earnings (2015)Industry Group Performance
Class

28|P a g e
Hawaii’sCreativeIndustries:UpdateJune2016
MauiCounty
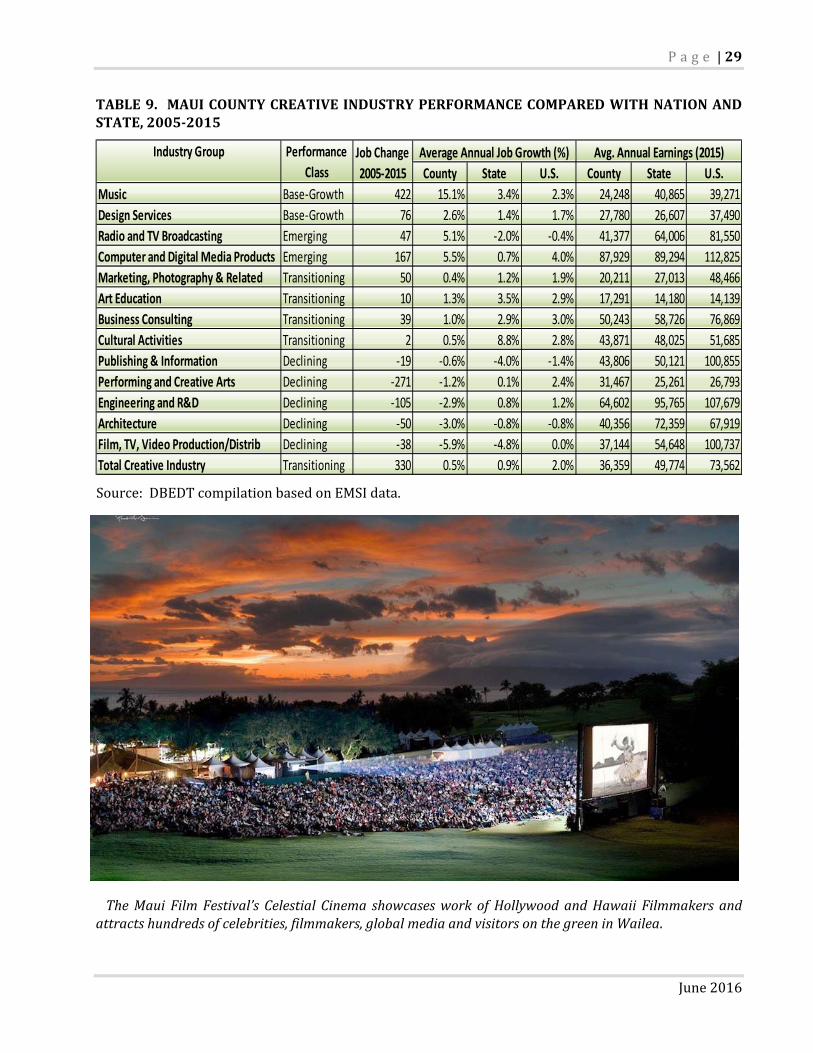
MauiCountyaccountedfor6,224ofthestate’screativeindustryjobsin2015,a0.5%averageannual increase from 2005. The average annual job growth was 2.8% from 2005 to 2008. Afterexperiencingseveresetbacksduetothenationaleconomicrecessionthatbeganinlate2007,theaverageannualgrowthratewasdowntonegative0.4%during2008‐2015.AsshowninTable8,fourcreativeindustrygroupswerehighperforminginMauiCountyinthe2005to2015period.Thesehighperforminggroupsnotonlygrewjobsduringtheperiodbutalsoincreasedtheircompetitiveshareoftheactivitybyexceedingnationalgrowthfortheindustry.Theseincluded:Music,DesignServices,RadioandTelevisionBroadcasting,andComputerandDigitalMediaProducts.FivecreativeindustrygroupslostjobsinMauiCounty over the 2005 to 2015 period, Publishing & Information, Performing and Creative Arts,EngineeringandR&D,Architecture,andFilm,TV,VideoProduction/Distribution.
TABLE8.CREATIVEINDUSTRYJOBS,MAUICOUNTY
Source:DBEDTcompilationbasedonEMSIdata.
ThecomparisonsofMauiCountycreativeindustry’sjobandearningsgrowthwiththestateandnationarelistedinTable9.Forjobgrowth,MauiCounty’s0.5%annualgrowthratewaslowerthanthestate’s0.9%andthenationalaverageof2.0%.Foraverageearnings,MauiCountywaslowerthanthestate,andmuchlowerthanthenationalaverage.
2005 2008 2014 2015 2005‐2008 2008‐2015 2014‐2015 2005‐2015
Music Base‐Growth 137 399 473 559 42.8% 4.9% 18.4% 15.1%
Design Services Base‐Growth 260 296 328 336 4.3% 1.8% 2.4% 2.6%
Radio and TV Broadcasting Emerging 72 140 117 120 24.7% ‐2.3% 2.6% 5.1%
Computer and Digital Media Products Emerging 238 275 392 406 4.8% 5.7% 3.5% 5.5%
Marketing, Photography & Related Transitioning 1,330 1,339 1,392 1,380 0.2% 0.4% ‐0.9% 0.4%
Art Education Transitioning 74 88 86 84 6.1% ‐0.6% ‐1.9% 1.3%
Business Consulting Transitioning 358 352 384 396 ‐0.6% 1.7% 3.3% 1.0%
Cultural Activities Transitioning 42 41 48 44 ‐0.4% 0.9% ‐8.5% 0.5%
Publishing & Information Declining 342 344 329 324 0.1% ‐0.9% ‐1.7% ‐0.6%
Performing and Creative Arts Declining 2,352 2,424 2,036 2,080 1.0% ‐2.2% 2.2% ‐1.2%
Engineering and R&D Declining 413 434 314 308 1.7% ‐4.8% ‐2.0% ‐2.9%
Architecture Declining 193 228 147 143 5.7% ‐6.4% ‐2.5% ‐3.0%
Film, TV, Video Production/Distrib Declining 82 53 51 45 ‐13.5% ‐2.5% ‐12.0% ‐5.9%
Total Creative Industry Transitioning 5,894 6,412 6,096 6,224 2.8% ‐0.4% 2.1% 0.5%
Industry Group Performance
Class
Jobs Average Annual Job Growth (%)
P a g e |29
June2016
TABLE9. MAUICOUNTYCREATIVEINDUSTRYPERFORMANCECOMPAREDWITHNATIONANDSTATE,2005‐2015
Source:DBEDTcompilationbasedonEMSIdata.
TheMauiFilmFestival’sCelestialCinema showcasesworkofHollywoodandHawaiiFilmmakersandattractshundredsofcelebrities,filmmakers,globalmediaandvisitorsonthegreeninWailea.
Average Annual Job Growth (%)
County State U.S. County State U.S.
Music Base‐Growth 422 15.1% 3.4% 2.3% 24,248 40,865 39,271
Design Services Base‐Growth 76 2.6% 1.4% 1.7% 27,780 26,607 37,490
Radio and TV Broadcasting Emerging 47 5.1% ‐2.0% ‐0.4% 41,377 64,006 81,550
Computer and Digital Media Products Emerging 167 5.5% 0.7% 4.0% 87,929 89,294 112,825
Marketing, Photography & Related Transitioning 50 0.4% 1.2% 1.9% 20,211 27,013 48,466
Art Education Transitioning 10 1.3% 3.5% 2.9% 17,291 14,180 14,139
Business Consulting Transitioning 39 1.0% 2.9% 3.0% 50,243 58,726 76,869
Cultural Activities Transitioning 2 0.5% 8.8% 2.8% 43,871 48,025 51,685
Publishing & Information Declining ‐19 ‐0.6% ‐4.0% ‐1.4% 43,806 50,121 100,855
Performing and Creative Arts Declining ‐271 ‐1.2% 0.1% 2.4% 31,467 25,261 26,793
Engineering and R&D Declining ‐105 ‐2.9% 0.8% 1.2% 64,602 95,765 107,679
Architecture Declining ‐50 ‐3.0% ‐0.8% ‐0.8% 40,356 72,359 67,919
Film, TV, Video Production/Distrib Declining ‐38 ‐5.9% ‐4.8% 0.0% 37,144 54,648 100,737
Total Creative Industry Transitioning 330 0.5% 0.9% 2.0% 36,359 49,774 73,562
Job Change
2005‐2015
Avg. Annual Earnings (2015)Industry Group Performance
Class
30|P a g e
Hawaii’sCreativeIndustries:UpdateJune2016
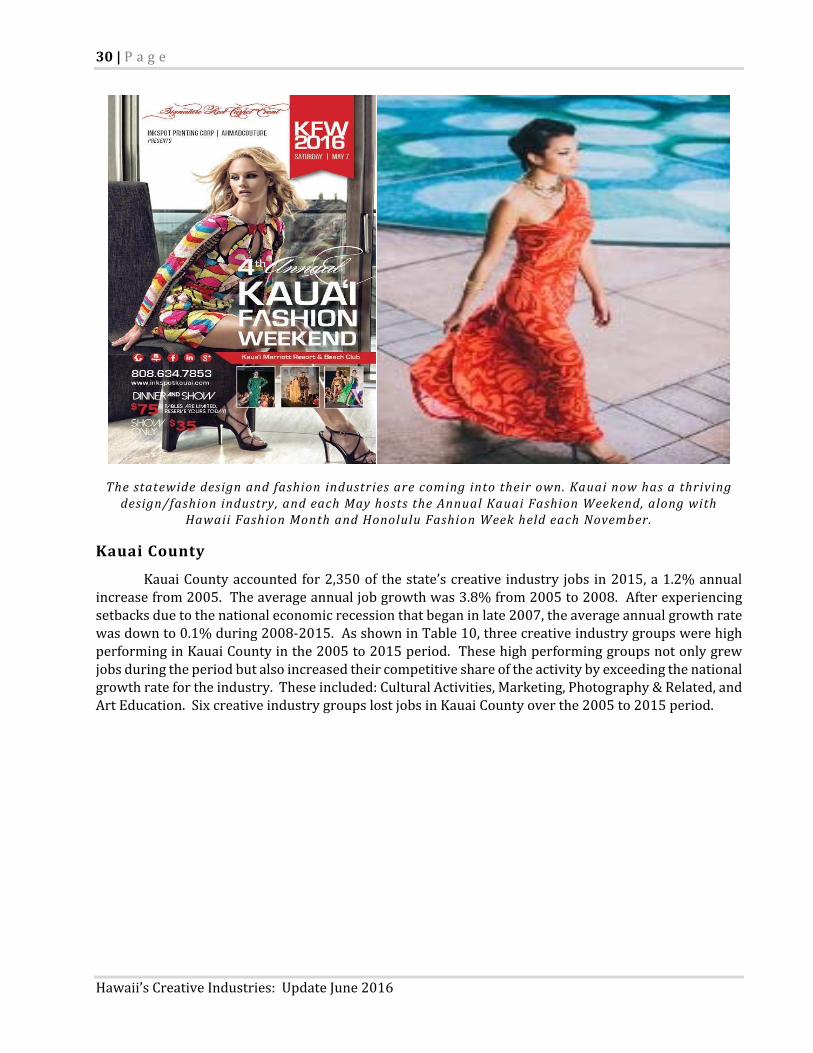
The statewide design and fashion industries are coming into their own. Kauai now has a thriving design/fashionindustry, and each May hosts the Annual Kauai Fashion Weekend, along with
Hawaii Fashion Month and Honolulu Fashion Week held each November.
Kauai County
KauaiCountyaccountedfor2,350of thestate’screativeindustry jobsin2015,a1.2%annualincreasefrom2005.Theaverageannualjobgrowthwas3.8%from2005to2008.Afterexperiencingsetbacksduetothenationaleconomicrecessionthatbeganinlate2007,theaverageannualgrowthratewasdownto0.1%during2008‐2015.AsshowninTable10,threecreativeindustrygroupswerehighperforminginKauaiCountyinthe2005to2015period.Thesehighperforminggroupsnotonlygrewjobsduringtheperiodbutalsoincreasedtheircompetitiveshareoftheactivitybyexceedingthenationalgrowthratefortheindustry.Theseincluded:CulturalActivities,Marketing,Photography&Related,andArtEducation.SixcreativeindustrygroupslostjobsinKauaiCountyoverthe2005to2015period.

P a g e |31
June2016
TABLE10.CREATIVEINDUSTRYJOBS,KAUAICOUNTY
Source:DBEDTcompilationbasedonEMSIdata.
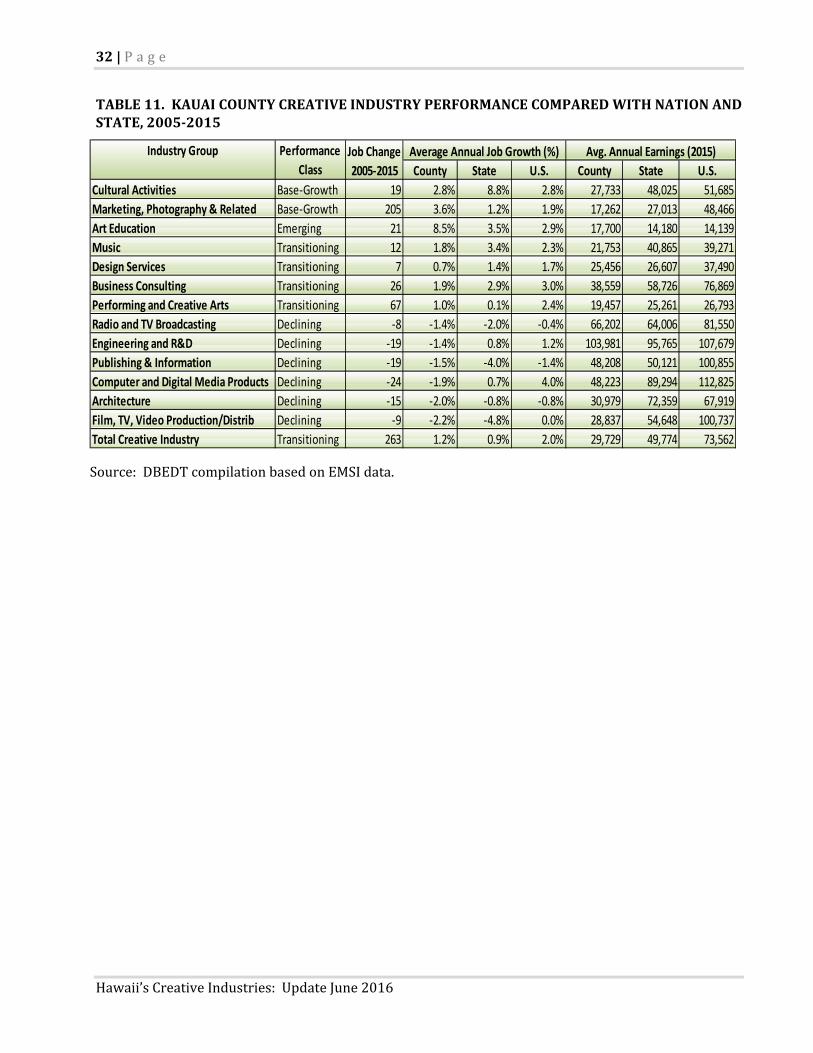
ThecomparisonsofKauaiCountycreativeindustry’sjobandearningsgrowthwiththestateandnationarelistedinTable11.Forjobgrowth,KauaiCounty’s1.2averageannualgrowthratewashigherthanthestate’s0.9%butlowerthanthenationalaverageof2.0%.Foraverageearnings,KauaiCountywaslowerthanthestateandmuchlowerthanthenationalaverage.
TheDescendants,basedonabookbyHawaiiauthorKauiHartHemmings,filmedonlocationonKauaiandOahu,featuredanallHawaiianmusicsoundtrack.
ImageCourtesyofFoxSearchlight
2005 2008 2014 2015 2005‐2008 2008‐2015 2014‐2015 2005‐2015
Cultural Activities Base‐Growth 59 57 78 77 ‐0.7% 4.4% ‐1.1% 2.8%
Marketing, Photography & Related Base‐Growth 485 621 676 689 8.6% 1.5% 2.1% 3.6%
Art Education Emerging 17 25 36 38 13.8% 6.2% 6.3% 8.5%
Music Transitioning 60 36 66 72 ‐15.7% 10.4% 9.2% 1.8%
Design Services Transitioning 102 103 108 110 0.0% 1.0% 1.9% 0.7%
Business Consulting Transitioning 121 141 147 146 5.2% 0.6% ‐0.5% 1.9%
Performing and Creative Arts Transitioning 638 674 704 705 1.8% 0.6% 0.1% 1.0%
Radio and TV Broadcasting Declining 63 55 55 55 ‐4.2% ‐0.1% 0.5% ‐1.4%
Engineering and R&D Declining 147 187 128 128 8.4% ‐5.3% ‐0.3% ‐1.4%
Publishing & Information Declining 133 104 111 114 ‐7.9% 1.4% 3.5% ‐1.5%
Computer and Digital Media Products Declining 139 168 124 115 6.6% ‐5.3% ‐7.2% ‐1.9%
Architecture Declining 80 111 67 65 11.4% ‐7.3% ‐2.5% ‐2.0%
Film, TV, Video Production/Distrib Declining 44 54 37 35 7.4% ‐6.1% ‐5.9% ‐2.2%
Total Creative Industry Transitioning 2,088 2,337 2,336 2,350 3.8% 0.1% 0.6% 1.2%
Industry Group Performance
Class
Jobs Average Annual Job Growth (%)
32|P a g e
Hawaii’sCreativeIndustries:UpdateJune2016
TABLE11.KAUAICOUNTYCREATIVEINDUSTRYPERFORMANCECOMPAREDWITHNATIONANDSTATE,2005‐2015
Source:DBEDTcompilationbasedonEMSIdata.
Average Annual Job Growth (%)
County State U.S. County State U.S.
Cultural Activities Base‐Growth 19 2.8% 8.8% 2.8% 27,733 48,025 51,685
Marketing, Photography & Related Base‐Growth 205 3.6% 1.2% 1.9% 17,262 27,013 48,466
Art Education Emerging 21 8.5% 3.5% 2.9% 17,700 14,180 14,139
Music Transitioning 12 1.8% 3.4% 2.3% 21,753 40,865 39,271
Design Services Transitioning 7 0.7% 1.4% 1.7% 25,456 26,607 37,490
Business Consulting Transitioning 26 1.9% 2.9% 3.0% 38,559 58,726 76,869
Performing and Creative Arts Transitioning 67 1.0% 0.1% 2.4% 19,457 25,261 26,793
Radio and TV Broadcasting Declining ‐8 ‐1.4% ‐2.0% ‐0.4% 66,202 64,006 81,550
Engineering and R&D Declining ‐19 ‐1.4% 0.8% 1.2% 103,981 95,765 107,679
Publishing & Information Declining ‐19 ‐1.5% ‐4.0% ‐1.4% 48,208 50,121 100,855
Computer and Digital Media Products Declining ‐24 ‐1.9% 0.7% 4.0% 48,223 89,294 112,825
Architecture Declining ‐15 ‐2.0% ‐0.8% ‐0.8% 30,979 72,359 67,919
Film, TV, Video Production/Distrib Declining ‐9 ‐2.2% ‐4.8% 0.0% 28,837 54,648 100,737
Total Creative Industry Transitioning 263 1.2% 0.9% 2.0% 29,729 49,774 73,562
Job Change
2005‐2015
Avg. Annual Earnings (2015)Industry Group Performance
Class
P a g e |33
June2016
V. CREATIVEINDUSTRYPERFORMANCEBYMAJORGROUPS
This section takes a closer look at the performance of the industry groups in the creativeindustriesportfolio. Detaileddataare shown for selected industrygroups in this section. However,completedataforallgroupsmaybefoundintheappendixtothisreport.
Stateshaveincreasinglycometorealizeinrecentyearsthatsolelypromotingtechnologydoesnotnecessarilygeneratethecreativeinnovationuponwhichtechnologydepends.Itisthecreativeinputthathelpsfocusthecommercialdevelopmentandapplicationtechnology,aswellasprovidingcontent,suchasindigitalentertainment.Beyondtechnology,creativeactivitygeneratesmajorexportproductsandservicesinitsownrightandisessentialtodifferentiatingHawaii’svisitorproductfromothersunandsurfdestinations.
Thediversityofcreativeactivityhasmadethesectoradifficultonetodefineformeasurementpurposes. As discussed earlier, an effort to establish an improved definition, the DBEDT ResearchDivisionworkedwiththeCreativeIndustriesDivisionin2009tobettermeasurethesectorinlightofsimilareffortsinotherstates.Basedonthiscollaboration,anupdatedmeasurementforthesectorwasdevelopedusingthedefinitionestablishedinMassachusettsasamodel.
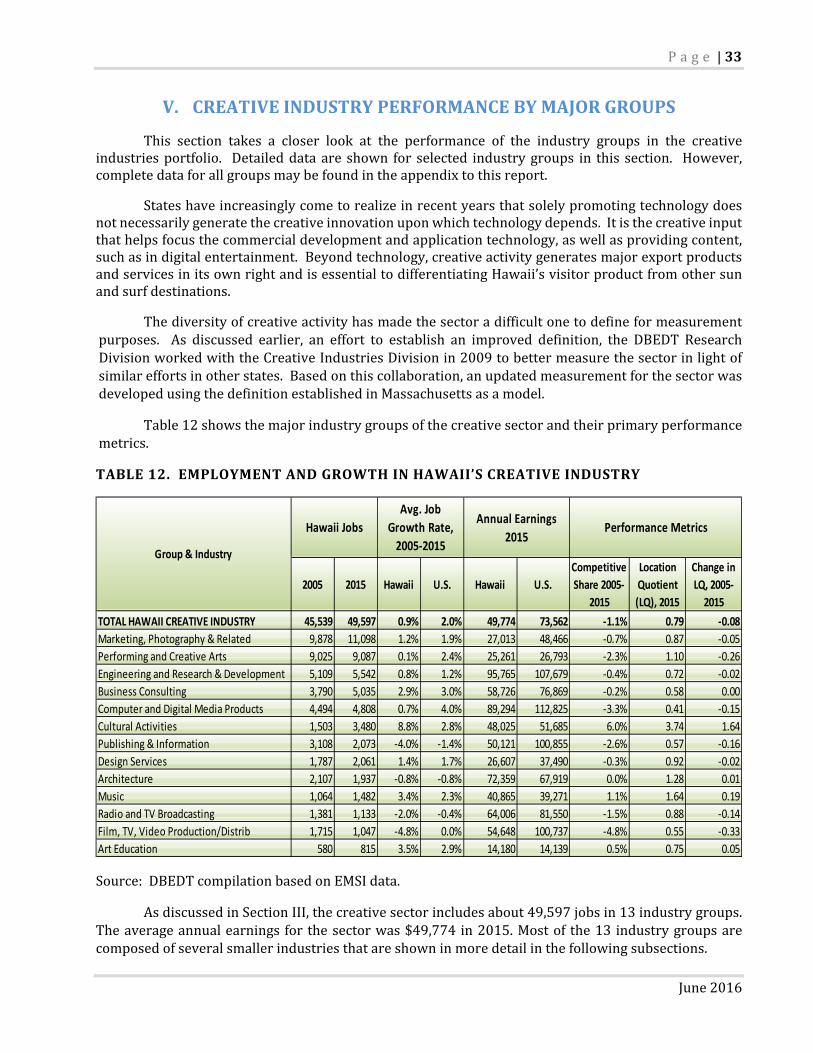
Table12showsthemajorindustrygroupsofthecreativesectorandtheirprimaryperformancemetrics.
TABLE12.EMPLOYMENTANDGROWTHINHAWAII’SCREATIVEINDUSTRY
Source:DBEDTcompilationbasedonEMSIdata.
AsdiscussedinSectionIII,thecreativesectorincludesabout49,597jobsin13industrygroups.Theaverageannualearnings forthesectorwas$49,774in2015.Mostof the13 industrygroupsarecomposedofseveralsmallerindustriesthatareshowninmoredetailinthefollowingsubsections.
2005 2015 Hawaii U.S. Hawaii U.S.
Competitive
Share 2005‐
2015
Location
Quotient
(LQ), 2015
Change in
LQ, 2005‐
2015
TOTAL HAWAII CREATIVE INDUSTRY 45,539 49,597 0.9% 2.0% 49,774 73,562 ‐1.1% 0.79 ‐0.08
Marketing, Photography & Related 9,878 11,098 1.2% 1.9% 27,013 48,466 ‐0.7% 0.87 ‐0.05
Performing and Creative Arts 9,025 9,087 0.1% 2.4% 25,261 26,793 ‐2.3% 1.10 ‐0.26
Engineering and Research & Development 5,109 5,542 0.8% 1.2% 95,765 107,679 ‐0.4% 0.72 ‐0.02
Business Consulting 3,790 5,035 2.9% 3.0% 58,726 76,869 ‐0.2% 0.58 0.00
Computer and Digital Media Products 4,494 4,808 0.7% 4.0% 89,294 112,825 ‐3.3% 0.41 ‐0.15
Cultural Activities 1,503 3,480 8.8% 2.8% 48,025 51,685 6.0% 3.74 1.64
Publishing & Information 3,108 2,073 ‐4.0% ‐1.4% 50,121 100,855 ‐2.6% 0.57 ‐0.16
Design Services 1,787 2,061 1.4% 1.7% 26,607 37,490 ‐0.3% 0.92 ‐0.02
Architecture 2,107 1,937 ‐0.8% ‐0.8% 72,359 67,919 0.0% 1.28 0.01
Music 1,064 1,482 3.4% 2.3% 40,865 39,271 1.1% 1.64 0.19
Radio and TV Broadcasting 1,381 1,133 ‐2.0% ‐0.4% 64,006 81,550 ‐1.5% 0.88 ‐0.14
Film, TV, Video Production/Distrib 1,715 1,047 ‐4.8% 0.0% 54,648 100,737 ‐4.8% 0.55 ‐0.33
Art Education 580 815 3.5% 2.9% 14,180 14,139 0.5% 0.75 0.05
Group & Industry
Hawaii Jobs
Avg. Job
Growth Rate,
2005‐2015
Annual Earnings
2015Performance Metrics

34|P a g e
Hawaii’sCreativeIndustries:UpdateJune2016
PerformingandCreativeArts
Thisgroupiscomposedofseveralareasoftheartsincludingselectedperformingarts,creativearts(visualandliterary),andsupportingindustriessuchaspromoters,agents,managersandartdealers.Thegroupdoesnotincludemusicians,whoareincludedwiththemusicindustrygroupandmuseums,whichareincludedinculturalactivitiesgroup.Bothofthesegroupsarediscussedlateron.
Performingandcreativeartsisthesecondlargestsingleindustrygroupinthecreativesectorwithabout9,087employeesin2015,includingself‐employedworkers.Declinesinjobswerecenteredamong agents andmanagers for artists, athletes, and entertainers, independent artists, writers, andperformers,artdealers,anddancecompanies.Gainsinjobsovertheperiodweremadeinpromoters,andotherperformingartscompanies.Theearningsaverageforworkersintheperformingandcreativeartsgroupwasonly$25,261in2015. Sincemanyofthejobsinthisgroupareparttime,theaverageearningsdonotrepresentafull‐timelaborforce.
TheperformingandcreativeartsgroupisveryconcentratedinHawaii,withabout10%morejobs proportionately than for the industry nationally. This probably reflects the interdependencebetweenHawaii’s rich artistic andcultural resourcesand the tourismsector. That interdependenceprobablyalsoexplainspartoftheunder‐performanceof theindustrygroupinthelastseveralyears,duringwhichthetourismcyclepeakedandbegantodecline.Beyondtourism,thissectoralsoprovidesa channel for the input of artistic creativity to a range of other innovation activities, including film,variousformsofdigitalmedia,architectureandapplieddesign.
Engineering/ScientificResearchandDevelopment
OneoftheleadingcomponentsofHawaii’screativesectorisengineeringandscientificresearchanddevelopment,withabout5,542jobs.Thisgroupoverlapsthetechnologyandthecreativesectors.Itisincludedinthecreativesectorbecauseinnovationandcreativityaremajordriversintheapplicationofengineeringandintransformingemergingtechnologiesintocommercialproductsandservices.Asintechnology,socialscienceresearchisalsoanactivityincreativeR&D.
Co‐Principal Investigator Jason Leigh, director of theUniversity ofHawai‘i atMānoaʻs Laboratory forAdvancedVisualizationandApplications(LAVA).PhotocreditLAVA,UHMānoa.

P a g e |35
June2016
Asinthetechnologysector,engineering/R&Dasacreativegroupperformedwelloverthe2005to2015period.Jobsincreasedby0.8%annually.Theonlylaggingactivityintheindustrygroupwassocialscienceandhumanitiesresearch,inwhichjobsdeclined.Theaverageannualearningsofthisgroupwas$95,765,thehighestamongthewholecreativeindustrysector.DetaileddatacanbefoundintheAppendix.
ComputerandDigitalMedia
Thecomputeranddigitalmediaindustrygroupalsoincludesmanyofthesameactivitiesasinthe computer services group in the technology sector. However, in addition to the core computertechnologyservices,thecreativesectorplacesheavyemphasisontherapidlydevelopingandevolvingmarriage of digital technology with traditional entertainment, cultural and artistic content. Thismarriageisvariouslyreferredtoasdigitalmedia,creativemediaandsometimesnewmedia. Evolvingdigitaltechnologynotonlyrevolutionizesthedeliveryoftraditionalcontentsuchasmusicandmovies,italsopushestheboundsofpossiblecontentwellbeyondthosetraditionalformatsintoanimation,gamesand a myriad of internet based services. This in turn creates new commercial opportunities forprogrammers,artists,designers,musiciansandauthors.
As Table 13 shows, the computer and digitalmedia sector overlaps the similar group in thetechnology sector, varying by only the inclusion of software publishers. The group includes bothprogramming and software activities and support activities such as systems design and computerfacilities.
TABLE13.COMPUTERANDDIGITALMEDIAINDUSTRYGROUPEMPLOYMENT
Source:DBEDTcompilationbasedonEMSIdata.
Asawhole, jobs inthissectorgrewatanaverageannualrateof0.7%overthe2005to2015period.Overall,thegrouplostintermsofcompetitivenationalshare.Allthesub‐sectorslostintermsofcompetitivenationalshare.
Theaverageearningsinthesectorwererelativelyhigh,at$89,294in2015.Thelowestpayingactivity, software publishers, averaged $79,947,while the highest, computer systemdesign services,averaged$92,146.
2005 2015 Hawaii U.S. Hawaii U.S.
Competitive
Share 2005‐
2015
Location
Quotient
(LQ), 2015
Change in
LQ, 2005‐
2015
Computer and Digital Media Products 4,494 4,808 0.7% 4.0% 89,294 112,825 ‐3.3% 0.41 ‐0.15
Software Publishers 190 210 1.0% 3.0% 79,747 151,134 ‐2.0% 0.12 ‐0.02
Custom Computer Programming Services 1,904 1,855 ‐0.3% 3.9% 86,292 105,681 ‐4.1% 0.38 ‐0.18
Computer Systems Design Services 2,399 2,743 1.3% 4.5% 92,146 106,382 ‐3.2% 0.55 ‐0.19
Hawaii JobsAvg. Job Growth
Rate, 2005‐2015
Annual Earnings,
2015Performance Metrics
Group & Industry

36|P a g e
Hawaii’sCreativeIndustries:UpdateJune2016
Whilenotameasurableactivitywithinthisindustrygroup,digitalmediaisadirectandindirectproductofcomputeractivity.Directly,computerprogrammingandsupportactivitiesintegratecontentfrom various sources into entertainment and information packages. Indirectly, computer activityprovidesspecializedinputintootherproductslikefilmandsoundrecordings.
Aswillbenotedinthemusicindustrygroupsection,evolvingdigitaltechnologyisanopportunityforartistsandsmallprogramming/contentdevelopers tocompete inamarket thathasbeenusuallydominated by large firms. Using digital technology, video, music, speech, literature, historicaldocumentation, games, educational instruction, aswell as computer programs anddata, can share asimilar,digitizedformatandbedistributedandconsumedoncommonplatforms.Theseplatformsarequicklyevolvingbeyondcomputerstosmartphones,tablets,smartTVanddirectinternetbroadcasts.Newproductsforthismarketareevolvingasfastasnewplatformsaredeveloped. ExamplesofsuchproductsareshowninTable14.
TABLE14.EXAMPLESOFDIGITALMEDIAPRODUCTS
Video games and interactive media (including alternative
reality games, augmented & virtual reality)
Internet of things (wearables, appliances, connected
cars, food tech)
Mobile & social games Video content for online sharing
Digital music publishing and distribution Social media content
Application development for mobile and web Transmedia content
Electronic books Podcasting and episodic content
Computer animation and graphics Hypertext fiction
Digital marketing and communications Multimedia publishing
Medical imaging /animation Live streaming events
Location/GPS and venue‐based interactive media Digital & motion comics/graphic novels
Digital first‐run series iTV (interactive TV, second screen synched content)
Mobile videography/filmmaking (e.g. smartphone,
drone‐based) Web site development and design
Rendering services Visual effects
Measuringdigitalmediaissimilarindifficultytomeasuringemergingenergyactivity.Thereare
amultitudeoffirmsinnumerousindustriesthatdedicatesomefractionoftheirworktothatparticularmarket.ItislikelythattheNAICScomputerservicesindustrywillcontainmoreofthesefirmsthanotherindustries.ButthereareprobablyfirmsservingthismarketinotherNAICSindustriessuchasthemusic,filmproduction,andinformationindustries.Workisneededtobetteridentifyandmeasurethemixandscopeofthesefirmsacrossindustriesanddigitalmarkets.
Marketing,PhotographyandRelatedActivities
Marketing, photography and related activities in Hawaii play an important role in bringingHawaii’s goods and services to the attention of national and international markets. Marketing,advertising,publicrelations,mediaspecialists,andotherprofessional,scientific,andtechnicalservicesaccountformostofthissector’sworkforceofabout11,098.AsthelargestsectorinHawaii’screativeindustries,thissector’sjobsincreased1.2%annuallyfrom2005to2015,comparedtothe1.9%annualgrowthinthenationalworkforceofthisindustrygroup.Jobsinsomeareassuchasdisplayadvertisingand commercial photography grew faster than their national counterparts and faster than Hawaii’s

P a g e |37
June2016
economy as awhole. However, losses of jobs in advertising (especially directmail) andmarketingresearchreducedtheoverallgrowthrate.
The slower growth for Hawaii’s marketing and related activities compared with the sameactivitiesnationallyresultedinadeclineinoverallcompetitivenationalindustryshare.However,thankstotheirhighergrowth,photographystudios,portrait,commercialphotography,anddisplayadvertisingshowedgainsinnationalindustryshare.
The annual earnings average for the industry group was $27,013, below the state average.Earnings ranged froman average$78,737 inpublic relations agencies to $11,916 in the commercialphotography.
Themarketingandrelatedactivitiesgroupisaverycompetitivebusinessfrombothacreativeandbusinessdevelopmentperspective.Sincegeographyislessofanadvantageintheseactivities,Hawaiicompanies in the marketing and related group must continuously show that their creativity andknowledge of the Hawaii product outweighs the greater reach and possible economies held bynationwideadvertisingandrelatedfirms.
BusinessConsulting
Businessconsultingwasathrivingactivityoverthe2005to2015periodwith5,035jobsin2015,up2.9%annuallyfrom2005.ThiswasmorethanthreetimesthegrowthrateofHawaii’soveralljobcountandveryclosetothegrowthrateforbusinessconsultingnationally.
Management,environmentalconsulting,andotherscientificandtechnicalconsultingservicesarethethreelargestcomponentsofthebusinessconsultingindustrygroup,accountingforabout83%ofthegroup’sjobs.Managementwasoneofthefastestgrowingactivitiesinthegroup,withjobgrowthof4.8%for the period. Administrativemanagement and generalmanagement consulting services and othermanagementconsultingservicesbothgrewmorethan3.0%annuallyinjobsovertheperiod.
Theannualearningsaverageforbusinessconsultingwas$58,726.Thisrangedfrom$69,160forother management consulting services to $43,132 for process, physical distribution, and logisticsconsultingservices.
PublishingandInformation
Asawhole,publishingandinformationshoweda4.0%annualdeclineinjobsfrom2005to2015,whichwasworsethanthenationallevel.Thisindustrygroupisdominatedbynewspaperpublishing,whichaccountedforalmostone‐halfoftheindustrygroup’sjobsin2015.Newspaperpublishingshoweda6.2%annualdeclineinjobsovertheperiod,andthiswasbelowthe5.8%annualdeclinenationally.Theriseoftheinternetasasourceofinformationiscertainlyamajorfactorinthedeclineoftraditionalpublishing.InHawaii,internetpublishingandbroadcastingincreasedjobsby6.9%annuallyfrom2005to2015,with228employeesin2015.
TheannualearningsaverageforpublishingandinformationinHawaiiwas$50,121in2015.Thisranged from $102,096 for all other publishers to $26,468 for all other information services. Thenewspaper publishing earnings average was $60,256 in 2015, while the average for internetbroadcastingwas$55,883.

38|P a g e
Hawaii’sCreativeIndustries:UpdateJune2016
CulturalActivities
Theculturalactivitiesindustrygroupaccountedfor3,480jobsin2015andincludedmuseums,historicalsites,natureparksandothersimilarInstitutions,andgrantmakingfoundations.Asagroup,culturalactivitiesregisteredan8.8%annualincreaseinjobsoverthe2005to2015period,muchbetterthanthestate’seconomyasawholeandthesamesetofactivitiesnationally. Asaresulttheculturalindustrygroupgainedcompetitivenationalindustryshare.Theannualearningsaveragefortheculturalactivities groupwas $48,025 in 2015. This ranged from$26,278 formuseums to $85,709 for grantmakingestablishments.
Architecture
Architecture isoneof themorevisibleexamplesofthecreativesector.Inparticular,auniquestyleofHawaiianarchitecture has developed over the last several decades,weavingthemesfromoldandnewHawaiiintodesignssuitedfor the state’s climate and life style. More recently,architecture has become a leading source of creativity inaddressing the need to conserve energy and provide foralternative energy sources in Hawaii’s residential andcommercialstructures.
Architectureemployed1,937peoplein2015andhadanegative0.8%annualgrowthsince2005.Thiswasbelowtheaveragegrowthforthestate’sworkforceasawhole,butsame as the negative 0.8% annual growth for thearchitecture industry nationally. Most of the industrygroup’s jobswere among structural architectural services,while the remainder of the jobs was in landscapearchitecture. Landscape architecture registered a 1.0%annualjobgrowthfrom2005to2015.
The annual earnings average in architecture was$72,359in2015,withstructuralarchitectureat$78,373andlandscapearchitectureaveraging$47,762.
DesignServices
Designservicesemployedabout2,061peoplein2015. About50%ofthesejobswereamonggraphicdesignfirms,whileanother30%wereininteriordesign.Overall,jobsgrewby1.4%annuallyinthedesignindustrygroupsince2005.Interiordesignjobsgrew3.8%andgraphicdesignjobsgrew1.3%annually.
Theannualearningsaverageforthedesigngroupwas$26,607in2015.Draftingserviceshadthe lowestaverageat$17,137, followedbyotherspecializeddesignservicesat$20,437,andgraphicdesignservicesatanaverageof$24,435.
Radio&TVBroadcasting
Likepublishing,broadcastinghasbeenimpactedbytheriseoftheinternetasaninformationandentertainmentalternative.RadioandTVbroadcastingshrankby2.0%annuallytoabout1,133jobsoverthe2005to2015period.Nationally,theindustrygroupdidbetter,managinga0.4%annualdeclinein
“TheWaterGiver”byMauiartistShigeYamadaatHawaiiConventionCenter.
PhotocreditHVCB
P a g e |39
June2016
jobs.Televisionbroadcastinglost2.5%ofitsworkforceannuallyovertheperiodtojust529jobsin2015.Radiostationslost0.2%annuallyovertheperiodwithabout507jobsin2015.Radionetworks,theonlyotheractivityintheindustrygrouplost6.0%peryear.Theannualearningsaverageforbroadcastingwasabout$64,006in2015.Thisrangedfrom$85,014fortelevisionbroadcasting,to$43,737forradiostations.
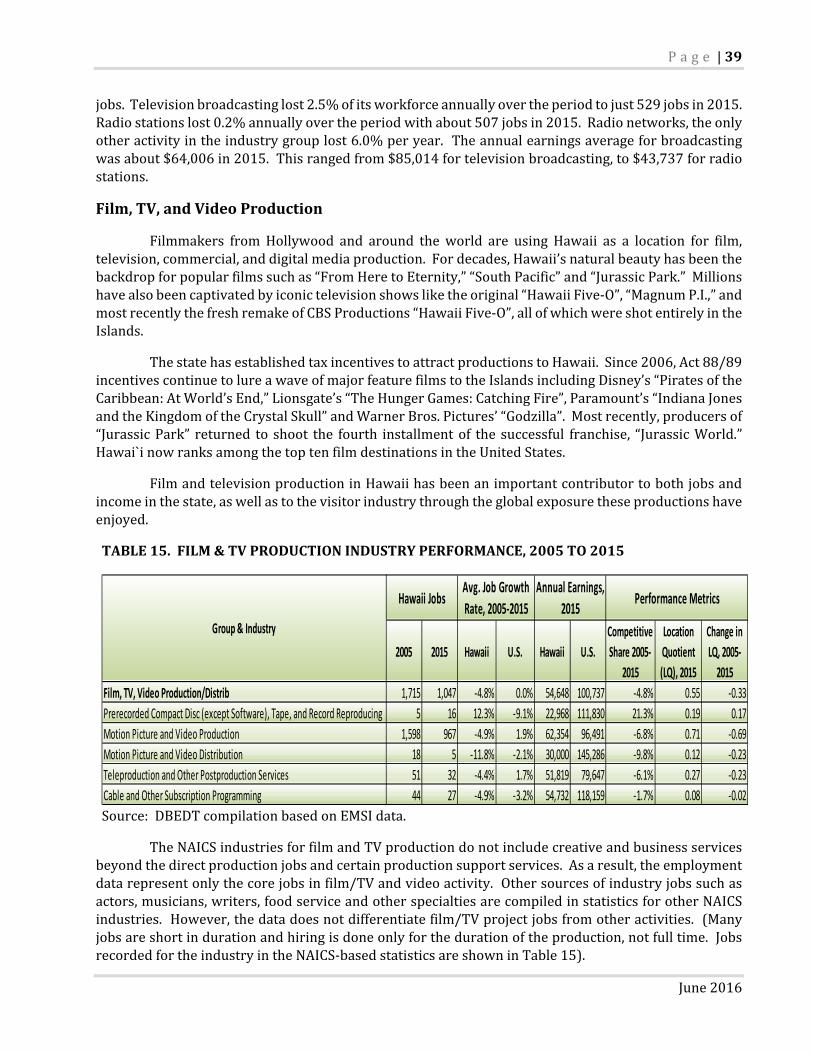
Film,TV,andVideoProduction
Filmmakers fromHollywood and around theworld are using Hawaii as a location for film,television,commercial,anddigitalmediaproduction.Fordecades,Hawaii’snaturalbeautyhasbeenthebackdropforpopularfilmssuchas“FromHeretoEternity,”“SouthPacific”and“JurassicPark.”Millionshavealsobeencaptivatedbyiconictelevisionshowsliketheoriginal“HawaiiFive‐O”,“MagnumP.I.,”andmostrecentlythefreshremakeofCBSProductions“HawaiiFive‐O”,allofwhichwereshotentirelyintheIslands.
ThestatehasestablishedtaxincentivestoattractproductionstoHawaii.Since2006,Act88/89incentivescontinuetolureawaveofmajorfeaturefilmstotheIslandsincludingDisney’s“PiratesoftheCaribbean:AtWorld’sEnd,”Lionsgate’s“TheHungerGames:CatchingFire”,Paramount’s“IndianaJonesandtheKingdomoftheCrystalSkull”andWarnerBros.Pictures’“Godzilla”.Mostrecently,producersof“JurassicPark” returned to shoot the fourth installmentof the successful franchise, “JurassicWorld.”Hawai`inowranksamongthetoptenfilmdestinationsintheUnitedStates.
FilmandtelevisionproductioninHawaiihasbeenanimportantcontributortobothjobsandincomeinthestate,aswellastothevisitorindustrythroughtheglobalexposuretheseproductionshaveenjoyed.
TABLE15.FILM&TVPRODUCTIONINDUSTRYPERFORMANCE,2005TO2015
Source:DBEDTcompilationbasedonEMSIdata.
TheNAICSindustriesforfilmandTVproductiondonotincludecreativeandbusinessservicesbeyondthedirectproductionjobsandcertainproductionsupportservices.Asaresult,theemploymentdatarepresentonlythecorejobsinfilm/TVandvideoactivity.Othersourcesofindustryjobssuchasactors,musicians,writers,foodserviceandotherspecialtiesarecompiledinstatisticsforotherNAICSindustries.However,thedatadoesnotdifferentiatefilm/TVprojectjobsfromotheractivities.(Manyjobsareshortindurationandhiringisdoneonlyforthedurationoftheproduction,notfulltime.JobsrecordedfortheindustryintheNAICS‐basedstatisticsareshowninTable15).
2005 2015 Hawaii U.S. Hawaii U.S.
Competitive
Share 2005‐
2015
Location
Quotient
(LQ), 2015
Change in
LQ, 2005‐
2015
Film, TV, Video Production/Distrib 1,715 1,047 ‐4.8% 0.0% 54,648 100,737 ‐4.8% 0.55 ‐0.33
Prerecorded Compact Disc (except Software), Tape, and Record Reproducing 5 16 12.3% ‐9.1% 22,968 111,830 21.3% 0.19 0.17
Motion Picture and Video Production 1,598 967 ‐4.9% 1.9% 62,354 96,491 ‐6.8% 0.71 ‐0.69
Motion Picture and Video Distribution 18 5 ‐11.8% ‐2.1% 30,000 145,286 ‐9.8% 0.12 ‐0.23
Teleproduction and Other Postproduction Services 51 32 ‐4.4% 1.7% 51,819 79,647 ‐6.1% 0.27 ‐0.23
Cable and Other Subscription Programming 44 27 ‐4.9% ‐3.2% 54,732 118,159 ‐1.7% 0.08 ‐0.02
Group & Industry
Hawaii JobsAvg. Job Growth
Rate, 2005‐2015
Annual Earnings,
2015Performance Metrics

40|P a g e
Hawaii’sCreativeIndustries:UpdateJune2016
These represent jobs among Hawaii companies and enterprises involved in the directproductionofHawaiifilmandTVproducts.DirectfilmandTVproductionactivitiesinvolvedabout1,047jobsin2015anddecreased4.8%annuallyfrom2005.Nationally,jobsinthisgroupremainedaboutthesameovertheperiod,withmotionpictureandvideoproductionshowinga1.9%gain.
Volatilityintheyeartoyearfilmproductionemploymentisamajorfactor.Thecombinationoflimiteddataandextremevolatilityfromyeartoyearmakethisaverydifficultindustrytoassessoverashortperiodoftime. Basedonfilmpermitsandtaxcreditapplications,andadditionaldata fromtheHawaiiFilmOffice,Table16showstheestimated jobsgenerated,aswellaseconomic impactsof theindustryfrom2006to2015.TABLE16.ESTIMATEDFILMANDTELEVISIONPRODUCTION:ECONOMICIMPACT2006TO2015[Inmillionsofdollars,exceptforemploymentwhichisinnumberofjobs]
Source:DBEDTResearchandEconomicAnalysisDivisionandCreativeIndustryDivision,records
CreativemediacompanieslikeHyperspectiveStudios,developapps,branding,software,visualeffects,filmandeditingresourcesattheirfacilitiesbasedinManoaInnovationCenter,Oahu.
PhotocourtesyofHyperspectiveStudios
Category 2006 2007 2008 2009 2010 2011 2012 2013 2014 2015
Total production expenditures 107.2 225.0 168.2 173.2 384.1 184.9 245.6 228.5 221.5 243.5
Expenditures qualified for tax credit 37.4 128.2 81.2 86.2 292.1 127.7 189.1 163.7 162.3 199.6
Expenditures not qualified for tax credit 69.8 96.8 87.0 87.0 92.0 57.2 56.5 64.8 59.2 43.9
Economic Impact
Output 185.9 390.1 291.6 300.3 665.9 320.6 425.8 396.2 384.0 422.2
Earnings 43.0 90.2 67.4 69.4 153.9 74.1 98.4 91.6 88.8 97.6
State taxes 11.8 24.7 18.4 19.0 42.1 20.3 26.9 25.1 24.3 26.7
Employment 1,569 3,188 2,308 2,301 4,942 2,304 2,963 2,670 2,506 2,668
P a g e |41
June2016
MusicHawaii has always had a unique music arts culture based on Hawaiian heritage, but it has
expandedtoembracetrendsinmusicworldwide.TherangeoftalentedmusiciansinHawaiihasbeenanimportantattractionforvisitorsaswellasastapleoftheisland’sculture.Untilthedigitalage,theproblemoftakingHawaii’suniquemusictotheworldatlargehadbeenthedifficultiesofbreakingintoanationalrecordingindustrythatwasmainstream‐orientedandthehighinvestmentcostofproducinganddistributingrecordedmusicwithoutthebackingofmajormusiclabels.
HawaiiSongwritingFestivalattractsartists,musicians,songwritersandmusicsupervisorsfromaroundtheworldtoHawaiiIsland,andhostthefirstCreativeLabMusicImmersive,June2016.
Thedynamicschangedwiththedigitalage,whichhasmadeproductionofhighqualityrecordingaffordabletoindividualartistsandnewdistributionsystemsthatallowartiststopromoteandselltheirmusicthroughtheinternetandmusicdownloadingservices.
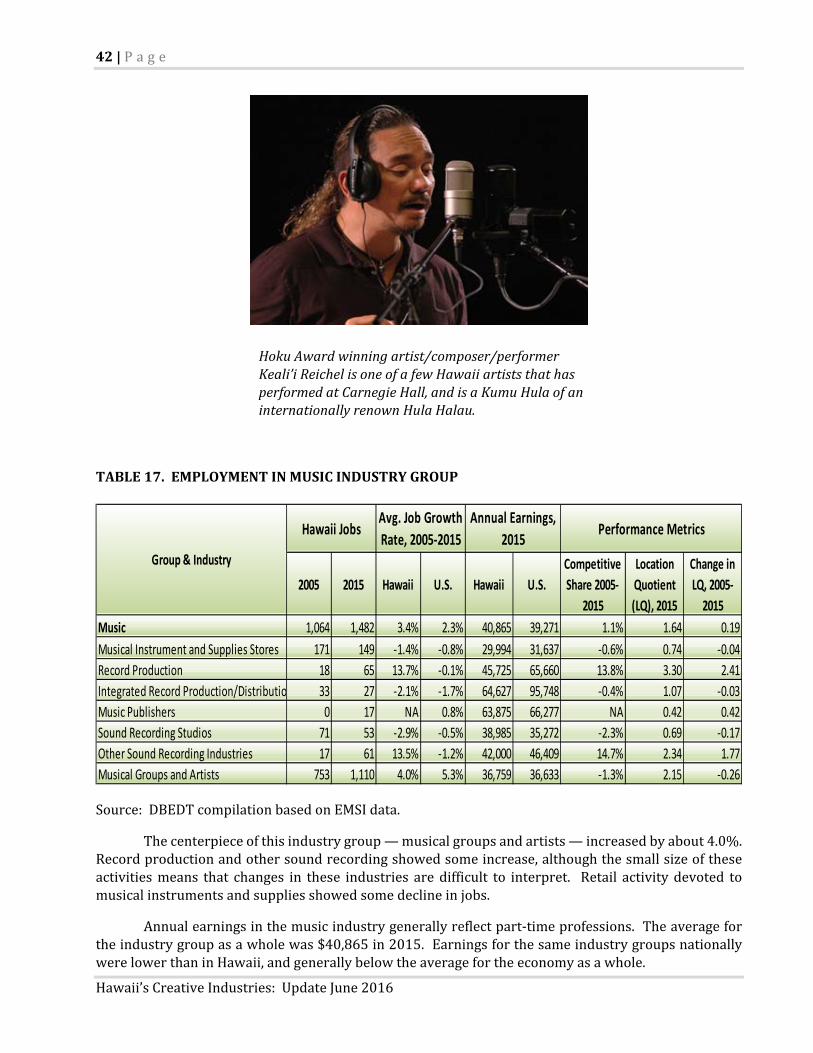
Therewereabout1,482employedandself‐employedworkersinHawaii’smusicindustryin2015,mostofthemperformers.AsTable17shows,employmentinHawaii’smusicindustryincreased3.4%peryearonaverageoverthe2005to2015period.Bycontrast,jobsinthisindustrygroupnationallygrewby2.3%.
42|P a g e
Hawaii’sCreativeIndustries:UpdateJune2016
TABLE17.EMPLOYMENTINMUSICINDUSTRYGROUP
Source:DBEDTcompilationbasedonEMSIdata.
Thecenterpieceofthisindustrygroup—musicalgroupsandartists—increasedbyabout4.0%.Recordproductionandothersoundrecordingshowedsomeincrease,althoughthesmallsizeoftheseactivitiesmeans that changes in these industries aredifficult to interpret. Retail activitydevoted tomusicalinstrumentsandsuppliesshowedsomedeclineinjobs.
Annualearningsinthemusicindustrygenerallyreflectpart‐timeprofessions.Theaveragefortheindustrygroupasawholewas$40,865in2015.EarningsforthesameindustrygroupsnationallywerelowerthaninHawaii,andgenerallybelowtheaveragefortheeconomyasawhole.
2005 2015 Hawaii U.S. Hawaii U.S.
Competitive
Share 2005‐
2015
Location
Quotient
(LQ), 2015
Change in
LQ, 2005‐
2015
Music 1,064 1,482 3.4% 2.3% 40,865 39,271 1.1% 1.64 0.19
Musical Instrument and Supplies Stores 171 149 ‐1.4% ‐0.8% 29,994 31,637 ‐0.6% 0.74 ‐0.04
Record Production 18 65 13.7% ‐0.1% 45,725 65,660 13.8% 3.30 2.41
Integrated Record Production/Distributio 33 27 ‐2.1% ‐1.7% 64,627 95,748 ‐0.4% 1.07 ‐0.03
Music Publishers 0 17 NA 0.8% 63,875 66,277 NA 0.42 0.42
Sound Recording Studios 71 53 ‐2.9% ‐0.5% 38,985 35,272 ‐2.3% 0.69 ‐0.17
Other Sound Recording Industries 17 61 13.5% ‐1.2% 42,000 46,409 14.7% 2.34 1.77
Musical Groups and Artists 753 1,110 4.0% 5.3% 36,759 36,633 ‐1.3% 2.15 ‐0.26
Hawaii JobsAvg. Job Growth
Rate, 2005‐2015
Annual Earnings,
2015Performance Metrics
Group & Industry
HokuAwardwinningartist/composer/performerKeali’iReichelisoneofafewHawaiiartiststhathasperformedatCarnegieHall,andisaKumuHulaofaninternationallyrenownHulaHalau.
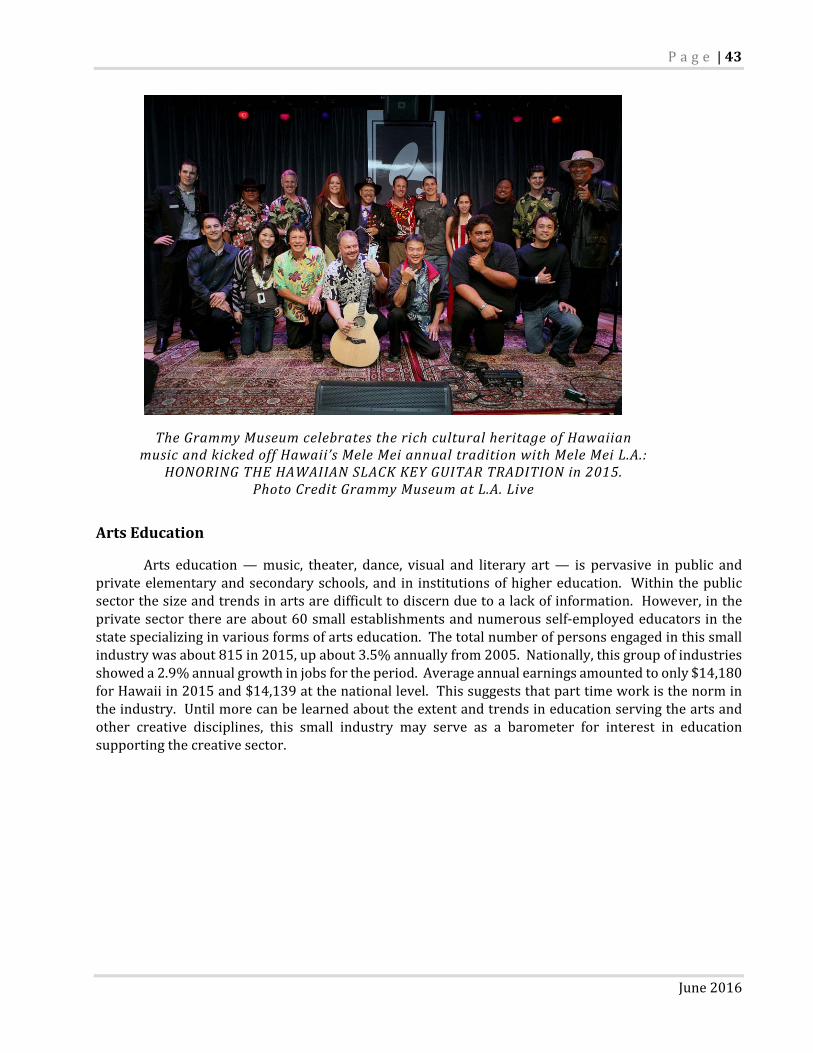
P a g e |43
June2016
ArtsEducation
Arts education—music, theater, dance, visual and literary art— is pervasive in public andprivateelementaryandsecondaryschools,and in institutionsofhighereducation. Within thepublicsectorthesizeandtrendsinartsaredifficulttodiscernduetoalackofinformation.However,intheprivatesectorthereareabout60smallestablishmentsandnumerousself‐employededucatorsinthestatespecializinginvariousformsofartseducation.Thetotalnumberofpersonsengagedinthissmallindustrywasabout815in2015,upabout3.5%annuallyfrom2005.Nationally,thisgroupofindustriesshoweda2.9%annualgrowthinjobsfortheperiod.Averageannualearningsamountedtoonly$14,180forHawaiiin2015and$14,139atthenationallevel.Thissuggeststhatparttimeworkisthenormintheindustry.Untilmorecanbelearnedabouttheextentandtrendsineducationservingtheartsandother creative disciplines, this small industry may serve as a barometer for interest in educationsupportingthecreativesector.
TheGrammyMuseumcelebrates therichculturalheritageofHawaiianmusicandkickedoffHawaii’sMeleMeiannualtraditionwithMeleMeiL.A.:
HONORINGTHEHAWAIIANSLACKKEYGUITARTRADITIONin2015.PhotoCreditGrammyMuseumatL.A.Live

44|P a g e
Hawaii’sCreativeIndustries:UpdateJune2016
Classroomteachersatthe2015ARTSFIRSTSummerInstituteonOahulearnaboutartsintegration
throughactiveparticipation.PhotocreditVivienLeeandSFCA
SFCAHawaiiisoneoftheorganizationsproviding artseducationinHawaiithroughacollaborationwithDepartmentofEducationtheHawaiiArtsAllianceandUniversityofHawaiiaspartoftheARTSFirstProgram
CID/DBEDTdevelopedarelationshipwithPixarandsetupaprogramwithDOEteacherstofieldtestthenewPixarinaBoxcurriculumwhichshowcasesthemathematics,scienceand
engineeringbehindPixar’scharactersandaward‐winningfilms.PhotocourtesyofPixar/Disney
P a g e |45
June2016
VI. CONCLUSIONSANDNEXTSTEPS
DevelopmentofHawaii’skeycreativeactivities isavaluableeconomicdevelopmentstrategy.Hawaii’sculturaldiversityanditsHawaiianhostculturearemajorattractionsformillionsofvisitorsandtheirspending.TheuniquenessofHawaii’screative,artisticandculturalcontenthelpsHawaii’screativeproductscompeteinworldwidemarkets.Additionally,thecreativeindustriesandtheirworkforcearekeysourcesofideas,contentandtalentforHawaii’semergingtechnologysector.
Thefour‐quadrantperformancemaphashelpedtoorganizetheindustrygroupsoftheupdatedcreativesectorbytheirgrowth,competitiveness,andconcentrationintheeconomy.
Three industry groups ranked as emerging and base‐growth activities in the creative sector.Thesegrowthindustriesincludedculturalactivities,music,anddesignservices.
Sixotherindustrygroupswererankedastransitioning.Thesegroupshavebeengrowingjobsbutataslowerrate thanthenation. This indicates therecouldbeperformance issueshinderingthecompetitivenessoftheseactivities.Thetransitioninggroupswerebusinessconsulting,designservices,engineering/scientificR&D,marketing,performingandcreativearts,andcomputeranddigitalmediaproducts.
Finally,fourindustrygroupslostjobsoverthe2005‐2015periodandconsequentlyfellintothedecliningquadrantforthistimeperiod.Thesewerearchitecture,radioandTVbroadcasting,film,TV,video production and distribution, and publishing & information. In broadcasting and information,productivitymaybeplayingaroleinreducingtheneedforlabortodeliverthesamelevelofserviceasinyearspast.
FutureresearchshouldexaminethedimensionsandopportunitiesofthecommercialmarketsservedbytheNAICS‐basedcreativeindustrygroups. Thisparticularlyincludesdigitalmediaandthebroader film industry,which is only partially captured in theNAICS film production industry. Alsoneeding closer study is the link between specific creative activity and emerging technologies ininformation,communications,entertainment,andthebroadrangeofcommercialapplicationsthatarebeingdrivenbyinnovation.LearninghowcreativeactivityutilizesandsupportsemergingtechnologycanhelpclarifytheskillsetsandeducationalelementsthatwillhelpmakeHawaiialeaderininnovation.
Creative Industries,HawaiiFilmOfficeandCreativeLabarekey facetsofDBEDT’sHIGrowth Initiativebuildingacontinuumoftalent,infrastructureandinvestmenttotransformHawaii’seconomytoonebasedoninnovationandcreativeeconomy.

46|P a g e
Hawaii’sCreativeIndustries:UpdateJune2016
APPENDIX:DETAILEDINDUSTRYDATA