measuring the shadow banking sector · measuring the shadow banking sector bruno tissot ... ef4...
TRANSCRIPT

Restricted
Measuring the shadow banking sector
Bruno TISSOTHead of Statistics and Research Support, BIS
Workshop on “Developing and Improving Sectoral Financial Accounts” Session 2: “The financial sector”
Bank of Algeria / Irving Fisher Committee on Central Bank Statistics20-21 January 2016, Algiers, Algeria
The views expressed are those of the author and do not necessarily reflect those of the BIS or the IFC.

Restricted 2
Policy relevance of shadow banking
Shadow banking system: credit intermediation involving entitiesand activities outside the regular banking system
Importance of the expansion of credit provided by the non-bank sector Monitoring broad financial intermediation Linkages: transmission of stress in one sector to the other Potential systemic risks: maturity/liquidity transformation,
imperfect credit risk transfer, leverage Influence of regulatory arbitrage
Restricted 3
FSB work on shadow banks
FSB Global Shadow Banking Monitoring Report, 2015 Data: 26 jurisdictions, covering 80% of global GDP and 90% of
global financial system assets Offshore centres not captured
G20 Data Gaps Initiative Phase II (2016-20): Recommendation 5 “The G-20 economies to enhance data collection on the shadow
banking system by contributing to the FSB monitoring process,including through the provision of sectoral accounts data…
…FSB to work on further improvements of the conceptualframework and developing standards and processes forcollecting and aggregating consistent data at the global level”.

Restricted 4
From the broad measure…
Broad “Macro-mapping” Conservative estimate: Monitoring Universe of Nonbank Financial
Intermediation (MUNFI) Based on national Flow of Funds (balance sheet data, on an entity
residence basis) Focus on “Other Financial Intermediaries” (OFIs) and insurance
companies and pension funds
Purposes Monitoring trends outside of the banking sector Detecting where shadow banking risks may arise Detecting adaptations and cross-border regulatory arbitrage

Restricted 5
Share of subsector assets of OFIs in 2014 (26 jurisdictions)
Sources: National flow of funds data; other national sources; FSB calculations.
… which primarily relies on OFIs…
Largest sector: other investment funds (eg equity, fixed income)
Main others: Broker dealers, structured finance vehicles, finance companies and money market funds
Hedge funds underestimated (limited granular FoF data, offshore centres)

Restricted 6
… narrowed down …
“Narrowing down” methodology involves the followingdeductions: Pension funds (all) and those insurance companies not involved in
the facilitation of credit creation
OFIs not directly engaged in credit intermediation or notexhibiting shadow banking risks (eg equity investment funds)
Entities already prudentially consolidated into banking groups: egfinance companies that are subsidiary of a banking group forwhich capital buffers are set on a consolidated basis, structuredfinance companies
Restricted 7
… to the “economic function-based” narrow measure of shadow banking Identification of the sources of shadow banking risks in non-
bank financial entities Based on 5 economic functions:
1. Management of client cash pools with features that makethem susceptible to runs
2. Loan provision dependent on short-term funding 3. Intermediation of market activities dependent on short-
term funding / secured funding of client assets 4. Facilitation of credit creation 5. Securitisation-based credit intermediation and funding of
financial entities
Restricted 8
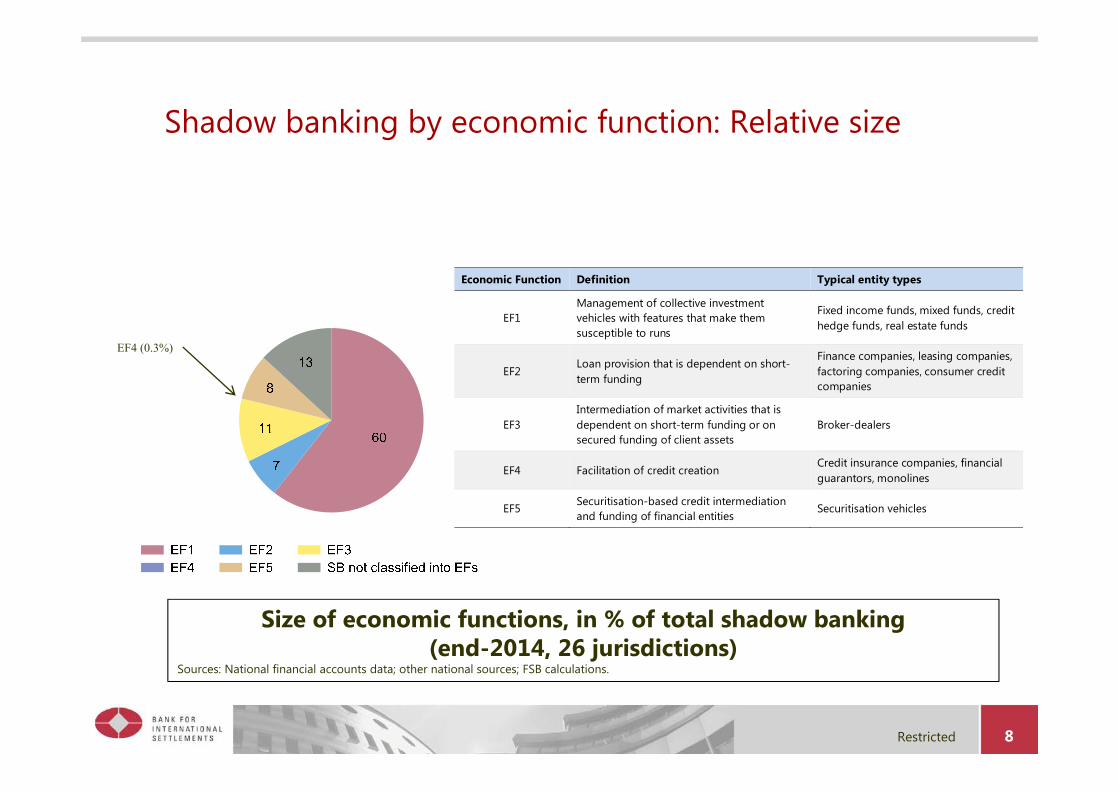
Size of economic functions, in % of total shadow banking(end-2014, 26 jurisdictions)
Sources: National financial accounts data; other national sources; FSB calculations.
Economic Function Definition Typical entity types
EF1 Management of collective investment vehicles with features that make them susceptible to runs
Fixed income funds, mixed funds, credit hedge funds, real estate funds
EF2 Loan provision that is dependent on short-term funding
Finance companies, leasing companies, factoring companies, consumer credit companies
EF3 Intermediation of market activities that is dependent on short-term funding or on secured funding of client assets
Broker-dealers
EF4 Facilitation of credit creation Credit insurance companies, financial guarantors, monolines
EF5 Securitisation-based credit intermediation and funding of financial entities
Securitisation vehicles
Shadow banking by economic function: Relative size
EF4 (0.3%)
Restricted 9
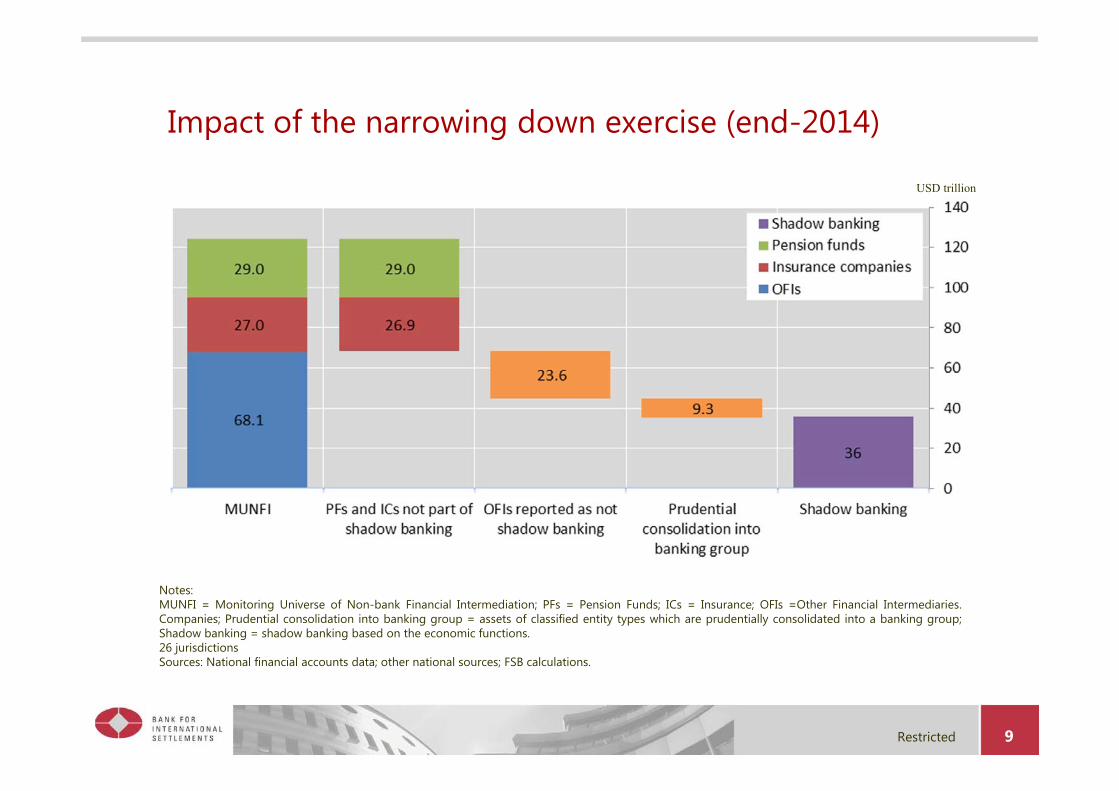
USD trillion
Notes:MUNFI = Monitoring Universe of Non-bank Financial Intermediation; PFs = Pension Funds; ICs = Insurance; OFIs =Other Financial Intermediaries.Companies; Prudential consolidation into banking group = assets of classified entity types which are prudentially consolidated into a banking group;Shadow banking = shadow banking based on the economic functions.26 jurisdictions Sources: National financial accounts data; other national sources; FSB calculations.
Impact of the narrowing down exercise (end-2014)
Restricted 10
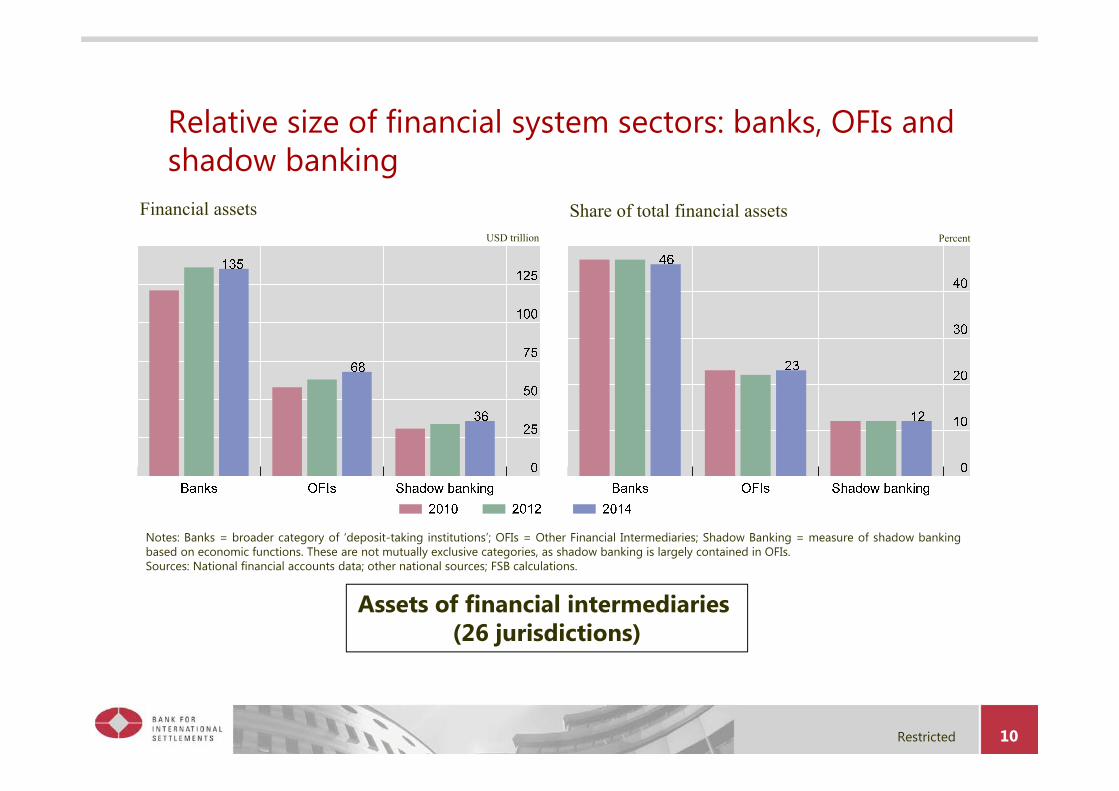
Financial assets Share of total financial assetsUSD trillion Percent
Assets of financial intermediaries (26 jurisdictions)
Notes: Banks = broader category of ‘deposit-taking institutions’; OFIs = Other Financial Intermediaries; Shadow Banking = measure of shadow bankingbased on economic functions. These are not mutually exclusive categories, as shadow banking is largely contained in OFIs.Sources: National financial accounts data; other national sources; FSB calculations.
Relative size of financial system sectors: banks, OFIs and shadow banking

Restricted 11
At end-2010 At end-2014
Note: CA = Canada; CN = China; DE = Germany; EMEs ex CN = Argentina, Brazil, Chile, India, Indonesia, Mexico, Russia, Turkey, SaudiArabia, South Africa; FR = France; IE = Ireland; JP = Japan; KR = Korea; NL = Netherland; UK = United Kingdom; US = United States.
Sources: National financial accounts data; other national sources; FSB calculations.
Shadow banking: geographic repartition
Restricted 12
Shadow
banking growth
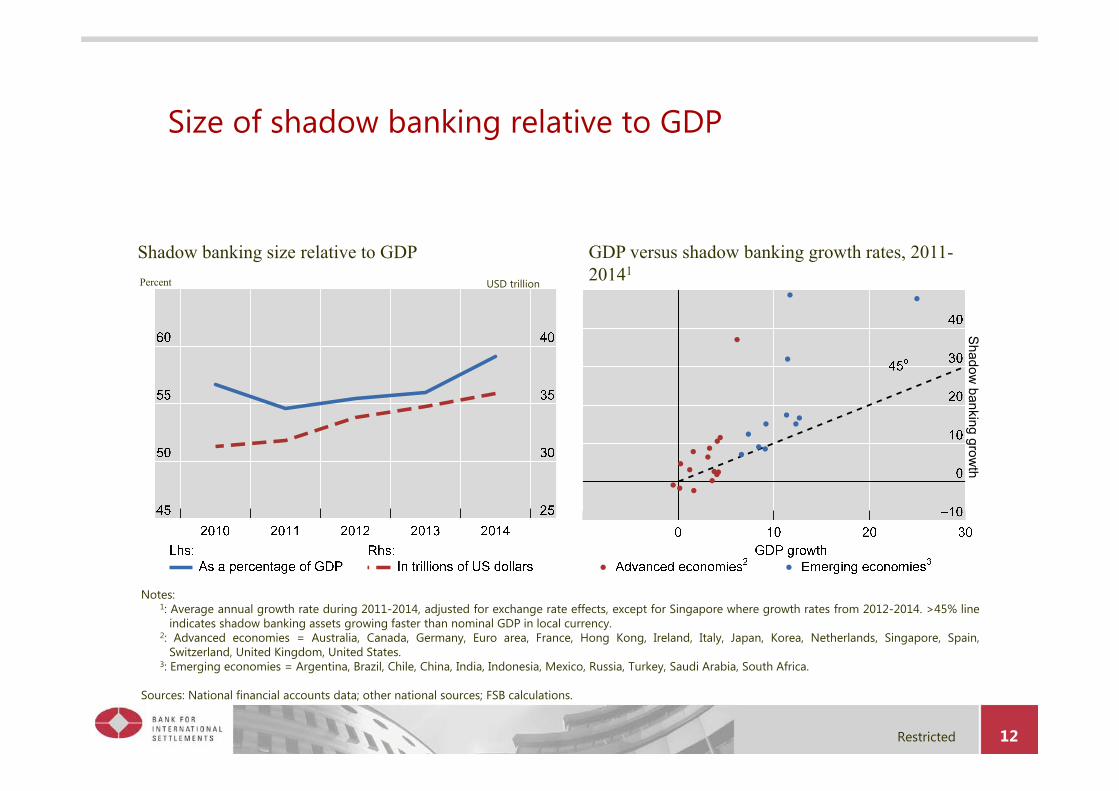
Shadow banking size relative to GDP GDP versus shadow banking growth rates, 2011-20141
Percent USD trillion
Notes:1: Average annual growth rate during 2011-2014, adjusted for exchange rate effects, except for Singapore where growth rates from 2012-2014. >45% line
indicates shadow banking assets growing faster than nominal GDP in local currency.2: Advanced economies = Australia, Canada, Germany, Euro area, France, Hong Kong, Ireland, Italy, Japan, Korea, Netherlands, Singapore, Spain,
Switzerland, United Kingdom, United States.3: Emerging economies = Argentina, Brazil, Chile, China, India, Indonesia, Mexico, Russia, Turkey, Saudi Arabia, South Africa.
Sources: National financial accounts data; other national sources; FSB calculations.
Size of shadow banking relative to GDP
Restricted 13
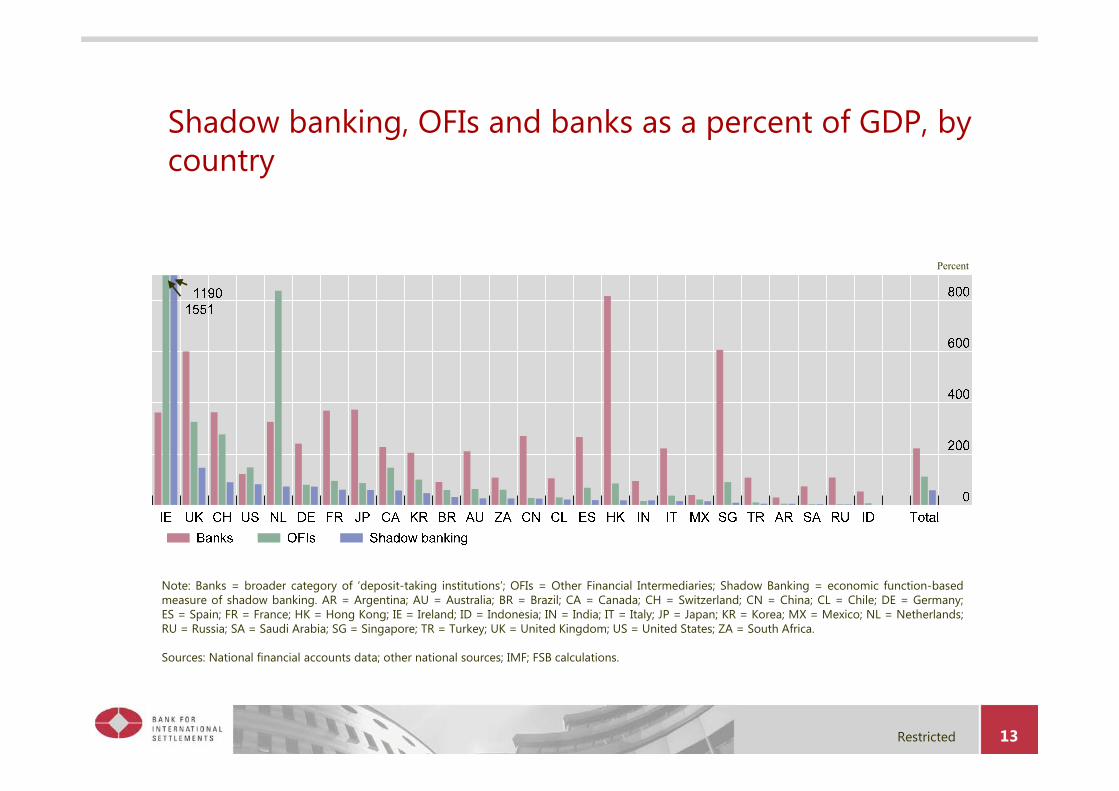
Percent
Note: Banks = broader category of ‘deposit-taking institutions’; OFIs = Other Financial Intermediaries; Shadow Banking = economic function-basedmeasure of shadow banking. AR = Argentina; AU = Australia; BR = Brazil; CA = Canada; CH = Switzerland; CN = China; CL = Chile; DE = Germany;ES = Spain; FR = France; HK = Hong Kong; IE = Ireland; ID = Indonesia; IN = India; IT = Italy; JP = Japan; KR = Korea; MX = Mexico; NL = Netherlands;RU = Russia; SA = Saudi Arabia; SG = Singapore; TR = Turkey; UK = United Kingdom; US = United States; ZA = South Africa.
Sources: National financial accounts data; other national sources; IMF; FSB calculations.
Shadow banking, OFIs and banks as a percent of GDP, by country
Restricted 14
Percent
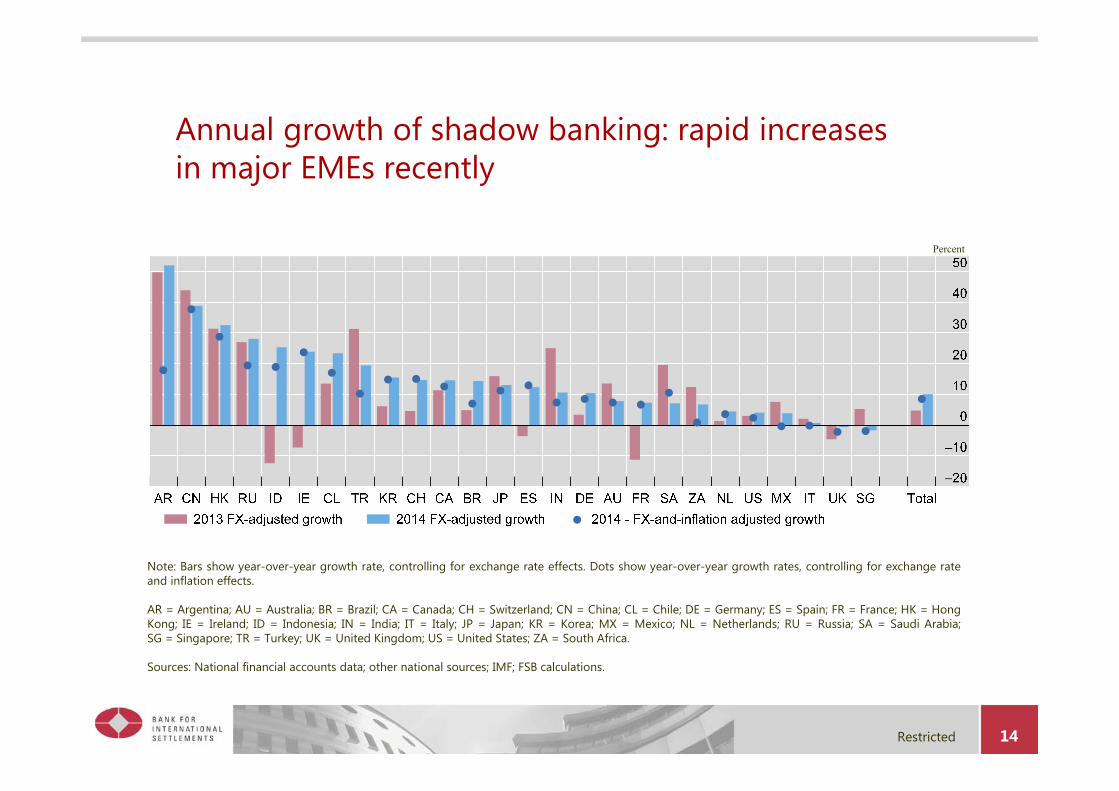
Note: Bars show year-over-year growth rate, controlling for exchange rate effects. Dots show year-over-year growth rates, controlling for exchange rateand inflation effects.
AR = Argentina; AU = Australia; BR = Brazil; CA = Canada; CH = Switzerland; CN = China; CL = Chile; DE = Germany; ES = Spain; FR = France; HK = HongKong; IE = Ireland; ID = Indonesia; IN = India; IT = Italy; JP = Japan; KR = Korea; MX = Mexico; NL = Netherlands; RU = Russia; SA = Saudi Arabia;SG = Singapore; TR = Turkey; UK = United Kingdom; US = United States; ZA = South Africa.
Sources: National financial accounts data; other national sources; IMF; FSB calculations.
Annual growth of shadow banking: rapid increasesin major EMEs recently
Restricted 15
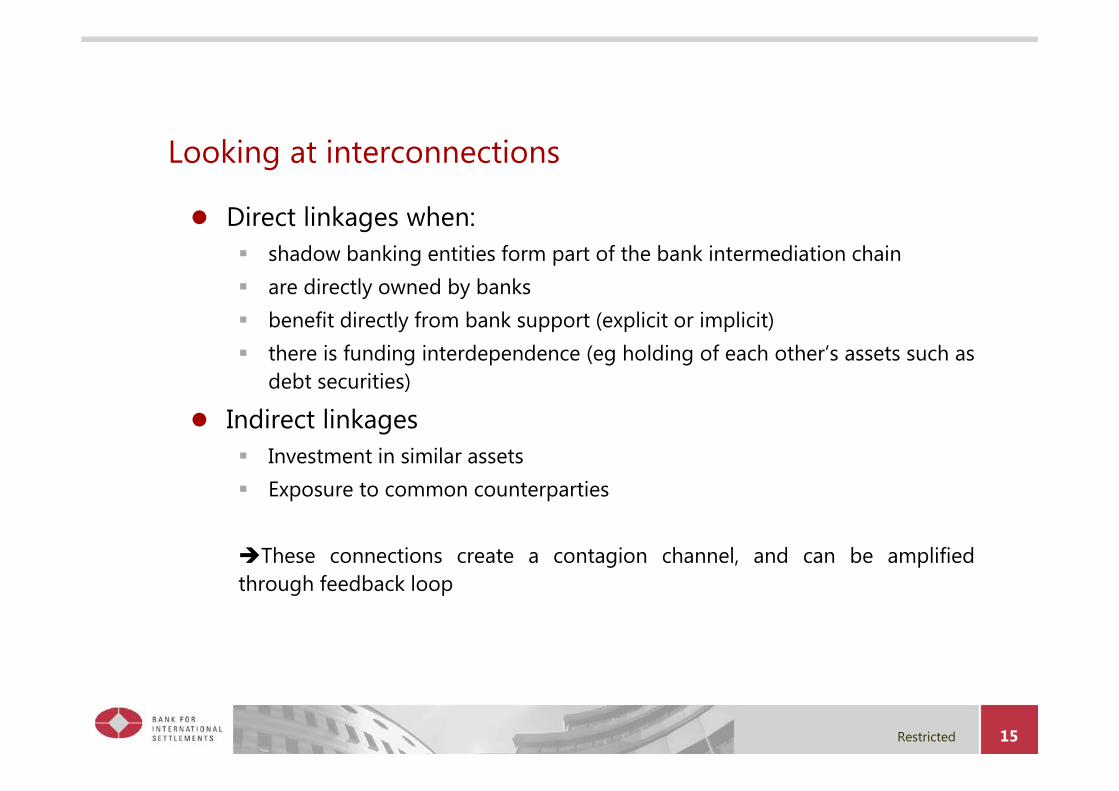
Looking at interconnections
Direct linkages when: shadow banking entities form part of the bank intermediation chain are directly owned by banks benefit directly from bank support (explicit or implicit) there is funding interdependence (eg holding of each other’s assets such as
debt securities)
Indirect linkages Investment in similar assets Exposure to common counterparties
These connections create a contagion channel, and can be amplifiedthrough feedback loop

Restricted 16
BANK OFI
a (Assets of bank to OFI)
Bank assets = BA OFI assets = OA
aBA
Credit risk for bank
bBA
aOA
bOA
Funding risk for bank
Funding risk for OFI
Credit risk for OFI
High-level risk measures:
b (Liabilities of bank to OFI)
A risk analysis framework of interconnectedness between banks and OFIs
Restricted 17
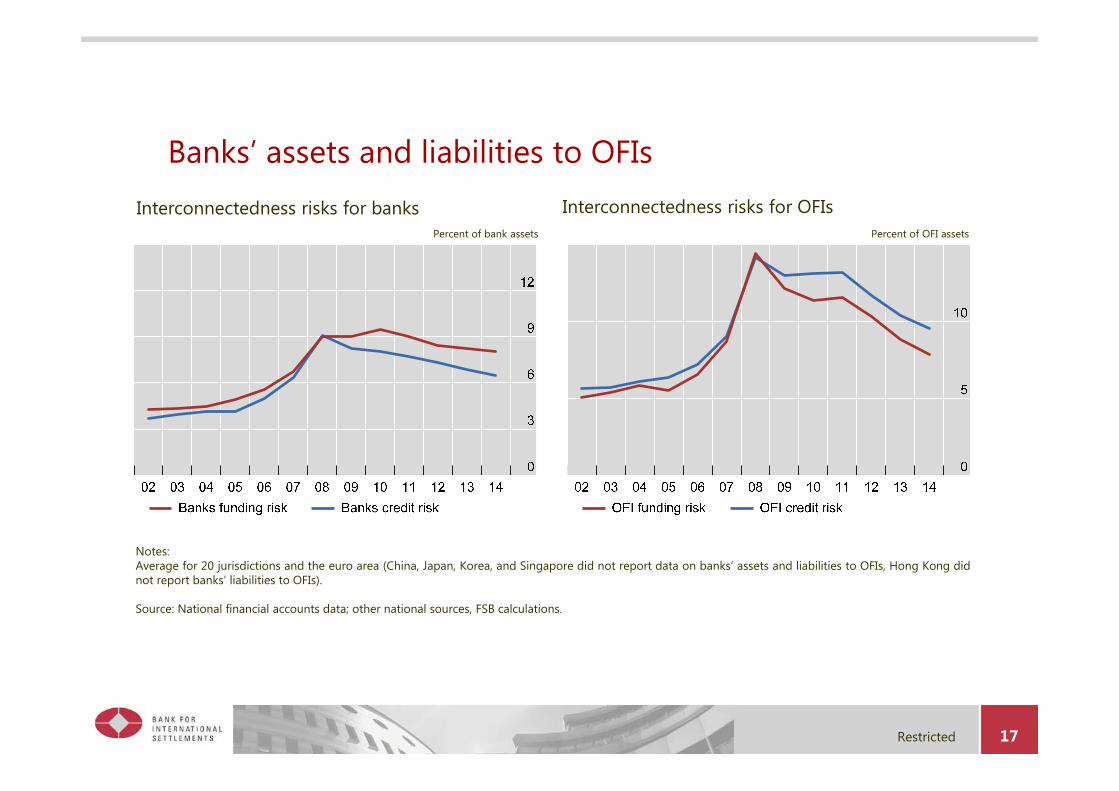
Percent of OFI assetsPercent of bank assets
Notes:Average for 20 jurisdictions and the euro area (China, Japan, Korea, and Singapore did not report data on banks’ assets and liabilities to OFIs, Hong Kong didnot report banks’ liabilities to OFIs).
Source: National financial accounts data; other national sources, FSB calculations.
Interconnectedness risks for banks Interconnectedness risks for OFIs
Banks’ assets and liabilities to OFIs