effects of temperature and particle size … to asme journal of engineering for gas turbines and...
TRANSCRIPT

DRAFT
1
Submitted to ASME Journal of Engineering for Gas Turbines and Power
EFFECTS OF TEMPERATURE AND PARTICLE SIZE ON DEPOSITION IN LAND BASED TURBINES
Jared M. Crosby, Scott Lewis, Jeffrey P. Bons Department of Mechanical Engineering, Brigham Young University, Provo, UT 84602
Weiguo Ai and Thomas H. Fletcher
Department of Chemical Engineering, Brigham Young University, Provo, UT 84602
Abstract Four series of tests were performed in an accelerated
deposition test facility to study the independent effects of
particle size, gas temperature, and metal temperature on ash
deposits from two candidate power turbine synfuels (coal and
petcoke). The facility matches the gas temperature and
velocity of modern first stage high pressure turbine vanes
while accelerating the deposition process. Particle size was
found to have a significant effect on capture efficiency with
larger particles causing significant TBC spallation during a 4-
hour accelerated test. In the second series of tests, particle
deposition rate was found to decrease with decreasing gas
temperature. The threshold gas temperature for deposition
was approximately 960°C. In the third and fourth test series
impingement cooling was applied to the backside of the target
coupon to simulate internal vane cooling. Capture efficiency
was reduced with increasing massflow of coolant air, however
at low levels of cooling the deposits attached more tenaciously
to the TBC layer. Post exposure analyses of the third test
series (scanning electron microscopy and x-ray spectroscopy)
show decreasing TBC damage with increased cooling levels.
[Keywords: deposition, syngas, turbines]
Nomenclature ESEM environmental scanning electron microscope
M Mach number
Q heat flux [W]
Ra centerline average roughness
Rt peak roughness
Rz average peak roughness
T temperature
TBC thermal barrier coating
cp specific heat at constant pressure [J/kgK]
m massflow rate [kg/s]
Introduction The effects of solid particles ingested into gas turbines are
a universal problem shared by both land based and aircraft
turbines. Due to the large air flow that gas turbines require,
these particles cannot economically be entirely eliminated
from the inlet air flow even with the best filtration and clean-
up systems. Internal particulate sources include combustion
products of fossil fuels, eroded turbomachinery components,
and secondary chemical reactions. External particulate
sources vary widely depending on operating environment
(marine, desert, industrial) and level of filtration (aero engine,
remote power microturbine, or large industrial power plant).
These contaminants are heated in the combustor and either
follow the flow out of the engine or impact against the turbine
blades, which results in erosion, corrosion, and deposition.
Erosion and deposition are competing phenomena and depend
on the phase of the particulate impacting the blade surfaces.
While there are numerous secondary parameters influencing
these processes, generally the particulate erodes the blades
when it is below the softening temperature and adheres to the
blades when above the softening temperature. This threshold
temperature depends on the particulate type, but has been
shown to occur between 980 and 1150°C [1-5].
The primary factors affecting the extent of deposition on
turbine blades include: gas temperature, turbine surface
temperature, net particle loading, particulate chemical
composition, turbine blade exposure time, and geometric
boundaries imposed on the flow. Previous turbine tests with
coal-derived fuels by Wenglarz and Fox [4] show a dramatic
increase in deposition rate as the gas temperature is raised
above the particulate melting point. In their study, coated
turbine superalloy specimens were subjected to 2-5 hours of
deposition from three coal-water fuel (CWF) formulations.
The coal had been cleaned to simulate ash levels ( 1%) that
would be considered acceptable for use in a gas turbine. The
fuel was burned in a low-emission subscale turbine combustor
at realistic flow rates (e.g. impact velocities 180 m/s) and
gas temperatures (1100°C). With the turbine specimens
located at two different streamwise locations downstream of
the combustor exit, the influence of gas temperature on
deposition rate could be studied. It was noted that the
upstream specimens (operating at gas temperatures 1100°C)
experienced 1 to 2 orders of magnitude higher deposition rates
compared to the downstream specimens (operating at gas
DRAFT
2
temperatures 980°C). Compared to a previous series of tests
with lower ash content (0.025%) residual fuel oil, the deposit
levels with coal-water fuels were 2 to 3 orders of magnitude
larger for the same operating temperature. An aero-engine
deposition study performed by Kim et al. with volcanic ash
showed that the rate at which deposition occurs increases with
time for a given turbine inlet temperature (TIT) and dust
concentration, i.e., the vanes become better captors of material
as the deposits on the vanes increase [5]. It was also found
that once deposition begins, the mass of material deposited is
proportional to dust concentration for a given TIT and dust
exposure time.
Wenglarz and Fox [4] also explored the possibility of sub-
cooling the upstream turbine specimens and found a factor of
2.5 reduction in deposits for a 200°C drop in metal surface
temperature. Lower deposit formation in areas of reduced
surface temperature was also noted by Bons et al. [12] in their
study of serviced turbine hardware. Cooled turbine vanes
which exhibited large (1-2 mm thick) marine deposits over
their entire surface were noticeably free of deposits in the film
cooling flow path where surface temperatures are significantly
lower. This effect created substantial troughs or “furrows”
which extended for more than 10 hole diameters downstream
of the cooling hole exit. These results confirm the important
role of gas and surface temperature in determining deposition
rates from ash-bearing fuels.
Due to current economic and political pressures, alternate
fuels such as coal, petcoke, and biomass are being considered
to produce substitute syngas fuels to replace natural gas in
power turbines. Given the present volatility in natural gas
markets and the uncertainty regarding projected fuel
availability over the 20-30 year design lifetime of newly
commissioned power plants, coal and petroleum derivative
fuels are already being used at a handful of gas turbine power
plants worldwide. In addition, intermediate goals of the DOE
Future Gen and DOE Turbine Program focus on coal syngas
as a turbine fuel in an effort to reduce dependency on foreign
supplies of natural gas. Thus, the stage is set for broader
integration of alternate fuels in gas turbine power plants.
Studies of potential sources of deposition from these syngas
fuels are necessary so that their adverse effects can be
minimized. Deposition has numerous adverse results that can
range from decreased engine performance to catastrophic
failure of the blades. For monetary as well as safety reasons,
it is highly desirable to reduce or eliminate these effects. In all
but the most severe conditions, deposition is a relatively slow
process and its study on an actual turbine is neither time nor
cost efficient. To remedy this, an accelerated turbine facility
has been developed which simulates 8,000 hours of exposure
time in a four hour test. This is done by matching the net
particle throughput mass at realistic combustor gas exit
temperatures and velocities. The validation of this hypothesis
was the subject of a previous paper by Jensen et al. [6].
Subsequently, this facility has been used to study alternate fuel
deposition at constant operating conditions and the evolution
of deposits with repeated exposure. The present study uses this
facility to characterize the effects of deposition from coal and
petcoke derived fuels on turbine blade materials as the particle
size, gas temperature, and backside cooling level are varied
independently.
Experimental Facility Modifications
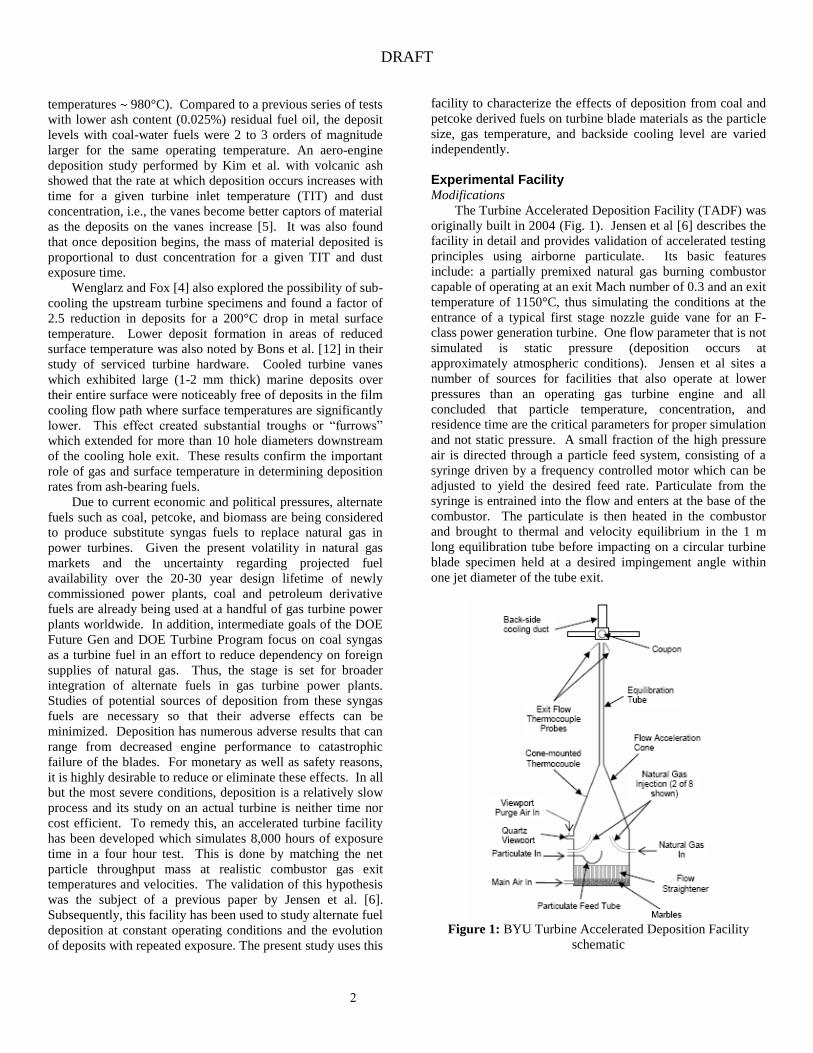
The Turbine Accelerated Deposition Facility (TADF) was
originally built in 2004 (Fig. 1). Jensen et al [6] describes the
facility in detail and provides validation of accelerated testing
principles using airborne particulate. Its basic features
include: a partially premixed natural gas burning combustor
capable of operating at an exit Mach number of 0.3 and an exit
temperature of 1150°C, thus simulating the conditions at the
entrance of a typical first stage nozzle guide vane for an F-
class power generation turbine. One flow parameter that is not
simulated is static pressure (deposition occurs at
approximately atmospheric conditions). Jensen et al sites a
number of sources for facilities that also operate at lower
pressures than an operating gas turbine engine and all
concluded that particle temperature, concentration, and
residence time are the critical parameters for proper simulation
and not static pressure. A small fraction of the high pressure
air is directed through a particle feed system, consisting of a
syringe driven by a frequency controlled motor which can be
adjusted to yield the desired feed rate. Particulate from the
syringe is entrained into the flow and enters at the base of the
combustor. The particulate is then heated in the combustor
and brought to thermal and velocity equilibrium in the 1 m
long equilibration tube before impacting on a circular turbine
blade specimen held at a desired impingement angle within
one jet diameter of the tube exit.
Figure 1: BYU Turbine Accelerated Deposition Facility
schematic
DRAFT
3
800
850
900
950
1000
1050
1100
1150
1200
1250
-1 -0.5 0 0.5 1
Equilibration Tube Radius (r/R)
Ga
s T
em
pe
ratu
re (
de
g C
)
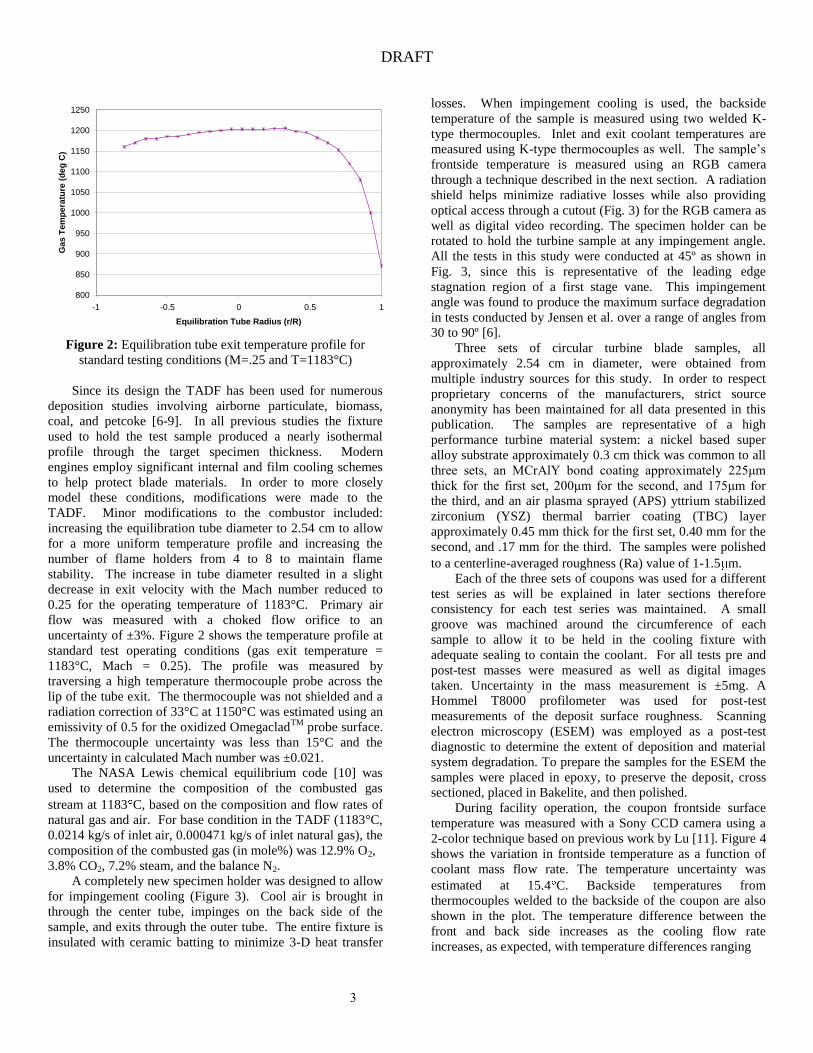
Figure 2: Equilibration tube exit temperature profile for
standard testing conditions (M=.25 and T=1183°C)
Since its design the TADF has been used for numerous
deposition studies involving airborne particulate, biomass,
coal, and petcoke [6-9]. In all previous studies the fixture
used to hold the test sample produced a nearly isothermal
profile through the target specimen thickness. Modern
engines employ significant internal and film cooling schemes
to help protect blade materials. In order to more closely
model these conditions, modifications were made to the
TADF. Minor modifications to the combustor included:
increasing the equilibration tube diameter to 2.54 cm to allow
for a more uniform temperature profile and increasing the
number of flame holders from 4 to 8 to maintain flame
stability. The increase in tube diameter resulted in a slight
decrease in exit velocity with the Mach number reduced to
0.25 for the operating temperature of 1183°C. Primary air
flow was measured with a choked flow orifice to an
uncertainty of ±3%. Figure 2 shows the temperature profile at
standard test operating conditions (gas exit temperature =
1183°C, Mach = 0.25). The profile was measured by
traversing a high temperature thermocouple probe across the
lip of the tube exit. The thermocouple was not shielded and a
radiation correction of 33°C at 1150°C was estimated using an
emissivity of 0.5 for the oxidized OmegacladTM
probe surface.
The thermocouple uncertainty was less than 15°C and the
uncertainty in calculated Mach number was ±0.021.
The NASA Lewis chemical equilibrium code [10] was
used to determine the composition of the combusted gas
stream at 1183 C, based on the composition and flow rates of
natural gas and air. For base condition in the TADF (1183°C,
0.0214 kg/s of inlet air, 0.000471 kg/s of inlet natural gas), the
composition of the combusted gas (in mole%) was 12.9% O2,
3.8% CO2, 7.2% steam, and the balance N2.
A completely new specimen holder was designed to allow
for impingement cooling (Figure 3). Cool air is brought in
through the center tube, impinges on the back side of the
sample, and exits through the outer tube. The entire fixture is
insulated with ceramic batting to minimize 3-D heat transfer
losses. When impingement cooling is used, the backside
temperature of the sample is measured using two welded K-
type thermocouples. Inlet and exit coolant temperatures are
measured using K-type thermocouples as well. The sample’s
frontside temperature is measured using an RGB camera
through a technique described in the next section. A radiation
shield helps minimize radiative losses while also providing
optical access through a cutout (Fig. 3) for the RGB camera as
well as digital video recording. The specimen holder can be
rotated to hold the turbine sample at any impingement angle.
All the tests in this study were conducted at 45º as shown in
Fig. 3, since this is representative of the leading edge
stagnation region of a first stage vane. This impingement
angle was found to produce the maximum surface degradation
in tests conducted by Jensen et al. over a range of angles from
30 to 90º [6].
Three sets of circular turbine blade samples, all
approximately 2.54 cm in diameter, were obtained from
multiple industry sources for this study. In order to respect
proprietary concerns of the manufacturers, strict source
anonymity has been maintained for all data presented in this
publication. The samples are representative of a high
performance turbine material system: a nickel based super
alloy substrate approximately 0.3 cm thick was common to all
three sets, an MCrAlY bond coating approximately 225μm
thick for the first set, 200μm for the second, and 175μm for
the third, and an air plasma sprayed (APS) yttrium stabilized
zirconium (YSZ) thermal barrier coating (TBC) layer
approximately 0.45 mm thick for the first set, 0.40 mm for the
second, and .17 mm for the third. The samples were polished
to a centerline-averaged roughness (Ra) value of 1-1.5 m.
Each of the three sets of coupons was used for a different
test series as will be explained in later sections therefore
consistency for each test series was maintained. A small
groove was machined around the circumference of each
sample to allow it to be held in the cooling fixture with
adequate sealing to contain the coolant. For all tests pre and
post-test masses were measured as well as digital images
taken. Uncertainty in the mass measurement is ±5mg. A
Hommel T8000 profilometer was used for post-test
measurements of the deposit surface roughness. Scanning
electron microscopy (ESEM) was employed as a post-test
diagnostic to determine the extent of deposition and material
system degradation. To prepare the samples for the ESEM the
samples were placed in epoxy, to preserve the deposit, cross
sectioned, placed in Bakelite, and then polished.
During facility operation, the coupon frontside surface
temperature was measured with a Sony CCD camera using a
2-color technique based on previous work by Lu [11]. Figure 4
shows the variation in frontside temperature as a function of
coolant mass flow rate. The temperature uncertainty was
estimated at 15.4 C. Backside temperatures from
thermocouples welded to the backside of the coupon are also
shown in the plot. The temperature difference between the
front and back side increases as the cooling flow rate
increases, as expected, with temperature differences ranging

DRAFT
4
Figure 3: Fixture designed to allow impingement cooling of turbine blade sample.
200
300
400
500
600
700
800
900
1000
1100
1200
0 2 4 6 8 10
Mass Flow of Coolant (g/s)
Te
mp
era
ture
(d
eg
C)
Morning Front - BG
Afternoon Front - BG
Morning Front - IR
Afternoon Front - IR
Morning Back
Afternoon Back
Figure 4: Measured frontside and backside temperatures as a
function of cooling
from 200 to 400 C. An additional frontside temperature
measurement was made with an IR thermometer. A surface
emissivity of 0.2 was used to match the 2-color temperature
measurement for the lowest cooling rate. The IR temperature
measurements seem to follow the average of the two 2-color
measurements with this constant emissivity value. At the
highest coolant flowrate indicated in the plot, the surface heat
flux was estimated to be nearly 1,000 kW/m2 using a simple
one-dimensional heat flow approximation – a value consistent
with heat flux levels in modern 1st stage gas turbines.
Particulate Preparation
The coal and petcoke samples used in this study are the
same as those described in Bons et al [7], with the exception
that the particle sizes have been substantially reduced. This
was accomplished using a mechanical grinder with a collector
to trap the particles exhausted out of the air filter.
Subbituminous coal fly ash was obtained from an operating
power plant, while the petcoke ash is boiler slag obtained from
a combined cycle gas turbine power plant operating with a
blend of 55% petcoke and 45% coal. The ash was
characterized using an environmental scanning electron
microscope (ESEM) to perform x-ray spectroscopy which can
identify the elemental composition down to the atomic number
of carbon. An independent elemental analysis was also
conducted on the ash samples by ALS Chemex using
inductively coupled plasma atomic emission spectroscopy
(ICP-AES). The results were similar with only slight variation
in the weight percentages of silicon which were attributed to
the ESEM measurements being spot measurements while the
ICP-AES were bulk measurements.
To simulate ash that could be entrained by the flow
leading to the turbine, the particles must be small enough to
pass through the various gas cleanup systems. Filtration
systems in modern gas turbine power plants are designed to
remove all particles with diameters greater than 10μm and a
majority of particles larger than 1μm. With inadequate or
degraded filtration, these levels can be exceeded. This study
focuses only on contamination from the fuel gas system. In
addition to particles from the fuel stream, sand and dirt from
the inlet air and rust from the gas turbine flow path can also
form deposits resulting in spallation and TBC loss. This study
is intended to supplement other studies performed by the
authors in which sand, biomass, and other synfuels have been
used [6-9].
After grinding, the size of the ash samples was
determined using the laser-based Coulter Counter. The
Coulter Counter operates using a laser beam to illuminate the
particles contained in a water slurry which scatter light
according to their size. Photodetectors convert the scattered
light to particle size distributions. A more detailed
explanation of the Coulter Counter is given in Bons et al [7].
Table 1 shows the particle size and elemental composition of
the particulate used in the majority of the tests conducted in
this study. The bulk density of each ash sample was measured
Cool air in Cool air out
Equilibration
Tube Exit
Turbine
Blade
Sample
45°
Radiation
Shield

DRAFT
5
in a graduated cylinder, and the apparent density (mass per
particle exterior volume) was calculated using an estimated
packing factor of 0.5.
Table 1: Ash particle summary statistics: size, density, and
average elemental composition.
Coal Petcoke
Mass mean diameter ( m) 3.1-16 6.3
Bulk density (g/cc) 0.99 1.45
Apparent density (g/cc) 1.98 2.90
Element Weight % Weight %
Na 6.9 4.3
Mg 3.6 2.2
Al 17.8 14.5
Si 47.4 38.3
P 1.6 0.0
S 1.8 1.0
K 2.6 2.5
Ca 8.7 7.5
Ti 1.6 0.8
V 0.0 3.4
Fe 6.4 22.9
Ni 0.0 0.9
Particulate Diameter - Coal Fly Ash (Coulter Counter)
0
0.01
0.02
0.03
0.04
0.05
0.06
0.07
0.08
0.09
0.1
0 10 20 30 40 50 60 70 80
Particle Diameter (microns)
% o
f T
ota
l
Small Coal (3 micron)
Medium Coal (8 micron)
Large Coal (13 micron)
Unground Coal (16 micron)
Petcoke (6 micron)
Figure 5: Coal particle size distribution for four sizes tested.
Results and Discussion Particle Size Series Three series of tests were conducted to study the effects of
particle size, gas exit temperature, and metal temperature on
deposition. The first test series looked at the effects of particle
size on deposition. For the case of erosion, Hamed et al. [13]
calculated the trajectories of various sizes of particles (10-
50 m) in a modern LPT stage using a semi-empirical particle
rebound model. They found that larger particles actually have
multiple rebounds between neighboring blades while smaller
particles primarily impact the pressure surface only. To
explore the effect of particle size on deposition, the present
study used standard combustor operating conditions (gas exit
temperature = 1183°C, Mach = 0.25) with the first set of 1”
diameter turbine samples. The tests were run with no cooling
air and the interior passage of the cooling fixture was insulated
with blanket insulation material. The backside temperature
was measured with two welded K-type thermocouples and
found to be approximately 990°C, which is roughly 200°C
below the combustor exit temperature.
Recently, Wammack et al [8] conducted a deposition
study using polished TBC turbine samples where the
specimens were subjected to four consecutive testing cycles,
returning the sample to room temperature between each test.
They measured a significant increase in TBC surface
roughness following the first thermal cycling. As a result, this
roughened surface was much more susceptible to deposit
accumulation compared to the highly polished surface prior to
the first test cycle. To account for this effect in the current test
series, an initial one hour “burn-in” test was conducted with
particulate injection, following which the combustor was shut
down. The sample was allowed to cool without removing it
from the fixture. Following this, the combustor was again
brought to steady state and a standard four hour test was
conducted. Coal ash particulate was used in this test series,
with four different sizes, each obtained from different
locations in the mechanical grinder. The four particle size
distributions (shown in Fig. 5) were obtained using the Coulter
Counter. The data shown in the figure are weight percent, so
in all samples there are a majority of particles (by number) in
the range below the mass mean diameter. ESEM images of
the largest and smallest samples show a representative
distribution of particle sizes (Fig. 6).
Table 2: Deposition results from particle size test series.
Particle
Size [ m]
Preburn Button
Mass [g]
Button Mass
Change [mg]
Separated Deposit
Mass [mg]
Separated Deposit %
Net Deposit
Mass [mg]
Deposition Rate
[mg/cm2hr]
Net Particulate
Mass added to flow [mg]
Net Capture
Efficiency [%]
3 14.73 70 300 81 370 14.6 10050 3.68
8 14.88 60 450 88 510 20.13 10350 4.93
13 14.12 -10 880 101 870 34.34 12720 6.84
16 14.99 -140 1220 113 1080 42.63 13390 8.07

DRAFT
6
Figure 6: ESEM images of smallest (top) and largest (bottom)
size coal particles
Using the pre-test and post-test mass measurements, the
net specimen mass gain during exposure was assessed (Table
2). In some cases the deposit was very fragile and much of it
flaked off following the test as it cooled. The separated
deposit percentage, defined as the amount of deposit that
separated after the test ended divided by the net specimen
mass gain, is also shown in the table. Percentages greater than
100% are indicative of significant spallation of the TBC layer
where the mass of the separated deposit (plus TBC) weighed
more than the net specimen mass gain. The increasing
percentage of separated deposit with increasing particle size
indicates that TBC is more prone to spall with larger deposit
formations.
Figure 7 shows two post-test images of the 13 m particle
test coupon. The first image was taken immediately after
combustor shut-down while the second image was taken after
the sample had cooled to room temperature. Streamwise
aligned deposit structures are evident in the hot deposit image
(Fig. 7a). These structures are similar to fuel deposit structures
previously measured on a serviced turbine blade pressure
surface by Bons et al. [12] (Fig. 8). The deposits in Fig. 8
were considerably more tenacious than the accelerated coal
deposits in this case, since they were still intact on the blade
surface after cool down. With rapid cooling, the mismatch in
thermal expansion coefficients between the metal, the TBC,
and the deposit results in the removal of most of the deposit
with some of the TBC as well. TBC spallation is evident
primarily along the leading edge of the circular specimen (Fig.
7b), even though the deposit thickness is approximately
Figure 7: Post test images of coupon subjected to 13 m
particle size
uniform over the entire coupon (Fig. 7a). Wammack et al.
observed similar behavior in their deposition tests and
attributed this to the impingement of deposit-laden gas at the
exposed metal/TBC interface [7]. Thus, material system
degradation (e.g. TBC spallation) was always most significant
at the leading edge of the turbine specimen. In a gas turbine,
similarly exposed TBC/metal interfaces are evident at each of
the film cooling holes in the stagnation region of the blade.
This explains the common occurrence of TBC spallation
adjacent to stagnation film holes as described by Bons et al.
[12]. The extent of spallation and material system degradation
will be discussed further using ESEM images.
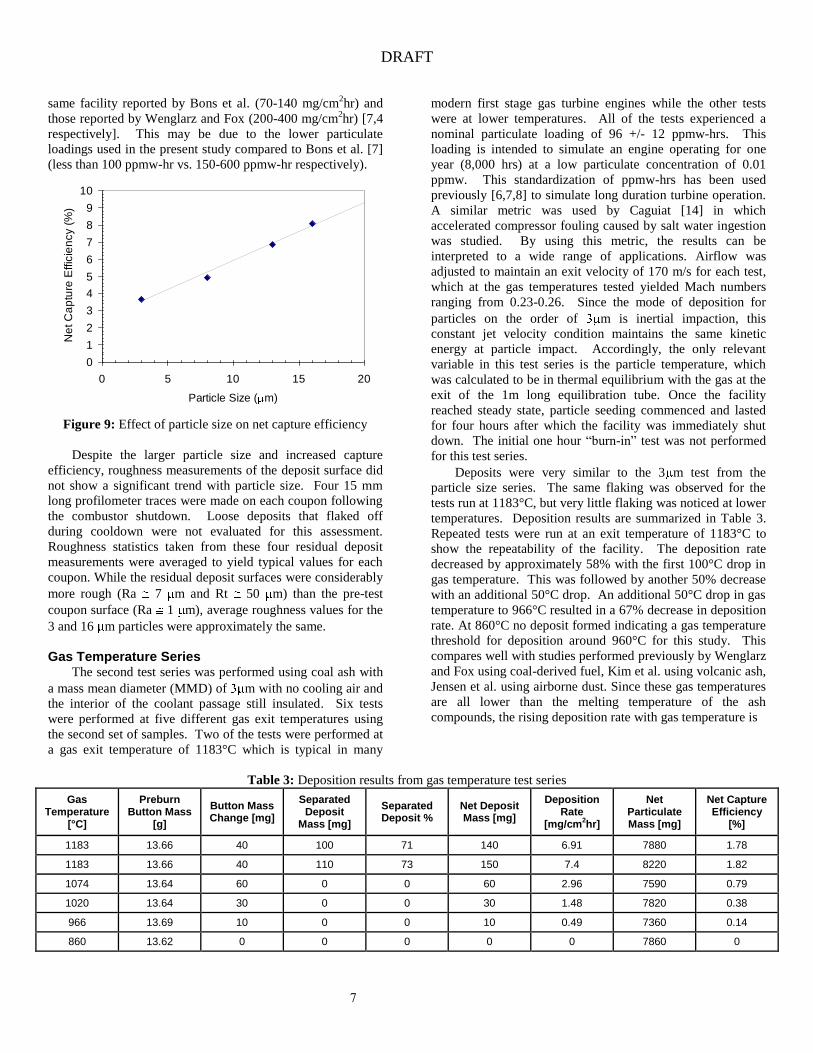
Dividing the net deposit mass by the exposed coupon
surface area and the test duration yielded deposition rate
measurements from 14 mg/cm2hr to 43 mg/cm
2hr for the
smallest and largest size particles (Table 2). Figure 9 shows
the effect of particle size on net capture efficiency (mg/hr of
deposit divided by mg/hr of particulate added to the flow).
Capture efficiency increases asymptotically with particle size
with a more than 50% increase from m to 16 m. These
results suggest that with filter degradation, deposition
Figure 8: Micrograph image taken of turbine blade pressure
surface deposits (flow direction is bottom to top).
problems as well as turbine hardware damage are likely to
increase considerably. Additionally, it is important to note
that even the smallest size particles tested showed significant
deposition. This would indicate that even with properly
functioning filtration systems the problems associated with
deposition and spallation cannot be entirely eliminated. These
deposition rates are lower than previous measurements in the
Flow
Direction
DRAFT
7
same facility reported by Bons et al. (70-140 mg/cm2hr) and
those reported by Wenglarz and Fox (200-400 mg/cm2hr) [7,4
respectively]. This may be due to the lower particulate
loadings used in the present study compared to Bons et al. [7]
(less than 100 ppmw-hr vs. 150-600 ppmw-hr respectively).
0
1
2
3
4
5
6
7
8
9
10
0 5 10 15 20
Particle Size ( m)
Ne
t C
ap
ture
Effic
ien
cy (
%)
Figure 9: Effect of particle size on net capture efficiency
Despite the larger particle size and increased capture
efficiency, roughness measurements of the deposit surface did
not show a significant trend with particle size. Four 15 mm
long profilometer traces were made on each coupon following
the combustor shutdown. Loose deposits that flaked off
during cooldown were not evaluated for this assessment.
Roughness statistics taken from these four residual deposit
measurements were averaged to yield typical values for each
coupon. While the residual deposit surfaces were considerably
more rough (Ra 7 m and Rt 50 m) than the pre-test
coupon surface (Ra 1 m), average roughness values for the
3 and 16 m particles were approximately the same.
Gas Temperature Series The second test series was performed using coal ash with
a mass mean diameter (MMD) of m with no cooling air and
the interior of the coolant passage still insulated. Six tests
were performed at five different gas exit temperatures using
the second set of samples. Two of the tests were performed at
a gas exit temperature of 1183°C which is typical in many
modern first stage gas turbine engines while the other tests
were at lower temperatures. All of the tests experienced a
nominal particulate loading of 96 +/- 12 ppmw-hrs. This
loading is intended to simulate an engine operating for one
year (8,000 hrs) at a low particulate concentration of 0.01
ppmw. This standardization of ppmw-hrs has been used
previously [6,7,8] to simulate long duration turbine operation.
A similar metric was used by Caguiat [14] in which
accelerated compressor fouling caused by salt water ingestion
was studied. By using this metric, the results can be
interpreted to a wide range of applications. Airflow was
adjusted to maintain an exit velocity of 170 m/s for each test,
which at the gas temperatures tested yielded Mach numbers
ranging from 0.23-0.26. Since the mode of deposition for
particles on the order of m is inertial impaction, this
constant jet velocity condition maintains the same kinetic
energy at particle impact. Accordingly, the only relevant
variable in this test series is the particle temperature, which
was calculated to be in thermal equilibrium with the gas at the
exit of the 1m long equilibration tube. Once the facility
reached steady state, particle seeding commenced and lasted
for four hours after which the facility was immediately shut
down. The initial one hour “burn-in” test was not performed
for this test series.
Deposits were very similar to the 3 m test from the
particle size series. The same flaking was observed for the
tests run at 1183°C, but very little flaking was noticed at lower
temperatures. Deposition results are summarized in Table 3.
Repeated tests were run at an exit temperature of 1183°C to
show the repeatability of the facility. The deposition rate
decreased by approximately 58% with the first 100°C drop in
gas temperature. This was followed by another 50% decrease
with an additional 50°C drop. An additional 50°C drop in gas
temperature to 966°C resulted in a 67% decrease in deposition
rate. At 860°C no deposit formed indicating a gas temperature
threshold for deposition around 960°C for this study. This
compares well with studies performed previously by Wenglarz
and Fox using coal-derived fuel, Kim et al. using volcanic ash,
Jensen et al. using airborne dust. Since these gas temperatures
are all lower than the melting temperature of the ash
compounds, the rising deposition rate with gas temperature is
Table 3: Deposition results from gas temperature test series
Gas Temperature
[°C]
Preburn Button Mass
[g]
Button Mass Change [mg]
Separated Deposit
Mass [mg]
Separated Deposit %
Net Deposit Mass [mg]
Deposition Rate
[mg/cm2hr]
Net Particulate Mass [mg]
Net Capture Efficiency
[%]
1183 13.66 40 100 71 140 6.91 7880 1.78
1183 13.66 40 110 73 150 7.4 8220 1.82
1074 13.64 60 0 0 60 2.96 7590 0.79
1020 13.64 30 0 0 30 1.48 7820 0.38
966 13.69 10 0 0 10 0.49 7360 0.14
860 13.62 0 0 0 0 0 7860 0

DRAFT
8
0
0.2
0.4
0.6
0.8
1
1.2
1.4
1.6
1.8
2
800 850 900 950 1000 1050 1100 1150 1200
Gas Temperature (C)
Ne
t C
ap
ture
Effic
ien
cy (
%)
Figure 10: Effect of gas temperature on net capture efficiency
Figure 11: Digital images of post burn coupons at (from left
to right) 1183, 1074, and 966°C
likely due to the increased tendency for deposit sintering at
elevated temperatures. Sintering creates large deposit masses
that are less susceptible to removal by erosion from
subsequent particle impacts. Figure 10 shows the
corresponding decrease in net capture efficiency with gas
temperature. It is noted that the capture efficiency at 1183°C
in Fig. 10 is approximately 50% of that shown in Fig. 9 for the
same 3 m particle size. This is due to the effect of the
“burn-in”, which was not performed for this test series. Figure
11 (a)-(c) show digital images of specimens at 1183°C,
1074°C, and 966°C. Note the large amount of separated
deposit for the high temperature case and the lack of
substantial deposits at low temperature (though the coupon is
still discolored at the lower edge near jet impact). Based on
the trend in Figure 10 we would expect deposition rates to
increase for G and H-class engines which operate above
1500°C. However, some of the constituents may be in a vapor
phase at these temperatures so the degree to which deposition
would increase might not be exponential as indicated in Figure
10. The authors are unaware of any deposition tests in the
open literature that operate at higher temperatures than those
in this study.
A similar trend with gas temperature is noted in the
deposit roughness measurements shown in Fig. 12. All three
statistical roughness metrics (centerline average [Ra], average
peak height [Rz], and peak height [Rt]) increase as gas
temperature is increased above the deposition threshold
0
50
100
150
200
250
300
350
0
5
10
15
20
25
30
35
800 850 900 950 1000 1050 1100 1150 1200
Rt,
Rz
(m
)
Ra
(m
)
Gas Temperature (C)
Ra
Rt
Rz
Figure 12: Effect of gas temperature on deposit roughness.
temperature of 960°C. It should be noted that due to extensive
deposit flaking at 1183°C, the roughness measurement shown
in Fig. 12 is actually taken from a separated flake of deposit
rather than from the residual deposit on the coupon surface.
The strong dependency of deposition rate on gas (and
particle) temperature has important implications for modern
turbine blade rows where the gas temperature can drop by
150-250ºC per stage. If the turbine inlet temperature is high
enough so that particles are molten or sinter readily, they may
collect primarily near the leading edge – since with falling
temperatures through the vane passage, sintering may no
longer be possible. If however, the gas temperature at the vane
inlet is so high that corrosive elements are in the vapor phase,
then they may not deposit on the vane. Rather, they may wait
until the temperature drops and then begin to condense on the
surface – perhaps in the subsequent blade row. Another factor
affecting deposit buildup is of course the flow angle relative to
the local surface. The flow is directly impinging at the leading
edge, whereas it is mostly parallel to the wall at mid-span.
Impingement Cooling Series The third test series was performed to study the effects of
impingement cooling on deposition. The insulation was
removed from the interior of the cooling fixture and two K-
type thermocouples were welded to the backside of each
sample to measure the backside temperature. This test series
used the same set of samples as in the particle size series. The
RGB camera was used to measure the sample frontside
temperature and two K-type thermocouples were used to
measure the incoming and outgoing coolant temperature. Four
tests were run at varying massflows of coolant. The same coal
ash was used as in the gas temperature series (3 m diameter)
and the standard combustor operating conditions, as used in
the particle size series, were used including the initial one hour
“burn-in” test. All of the tests experienced a nominal
particulate loading of 110 +/- 7 ppmw-hrs, only slightly higher

DRAFT
9
Table 4: Deposition results from impingement cooling test series using coal
Massflow of Coolant
[g/s]
Heat Flux [kW/m
2]
Preburn Button
Mass [gr]
Button Mass
Change [mg]
Separated Deposit
Mass [mg]
Separated Deposit %
Net Deposit
Mass [mg]
Deposition Rate
[mg/cm2hr]
Net Particulate Mass [mg]
Net Capture
Efficiency [%]
0 0 14.73 70 300 81 370 14.6 10050 3.68
1.26 500.68 30.56 130 90 41 220 8.68 8480 2.59
3.38 1049.21 30.69 120 20 14 140 5.53 9270 1.51
5.81 1404.35 30.53 100 0 0 100 3.95 8120 1.23
8.33 1614.26 30.93 0 0 0 0 0 9540 0
than the gas temperature series due to the additional one hour
“burn-in” test.
The deposits formed in this test series were much more
tenacious than the previous ones. Appreciable deposit flaking
was only observed for the 1.26 g/s cooling case and it was
minimal. This result is consistent with the behavior of the gas
temperature series in which the lower gas temperatures
showed a more tenacious deposit. The applied coolant lowers
the temperature of the TBC surface producing a thinner
deposit layer. Thin deposit layers are not as susceptible to
flaking induced by thermal contraction during cool down.
Table 4 provides a summary of the deposition results. The
deposition rate was reduced by approximately 40% with the
initial level of cooling. This was followed by further
reductions as the amount of cooling was increased.
Corresponding trends in net capture efficiency are shown in
Fig. 13. For this series, spallation occurred, but was limited to
very small portions of the edge at the base of the sample. The
amount of visible spallation decreased slightly with increased
coolant mass flow. The drop in capture efficiency noted in
Fig. 13 is similar to the result of Wenglarz and Fox [4] who
observed a factor of 2.5 reduction in deposits for a 200°C drop
in metal surface temperature produced by sub-cooling. The
present results show a factor of 4 reduction in deposits for a
360°C drop in backside temperature (100°C drop in frontside
temperature – see Fig. 4) with cooling. These results clearly
show the benefits of cooling in reducing deposition. However,
in G and H class engines the amount of cooling needed to
obtain the necessary drop in frontside temperature could be
prohibitive. These results also suggest that film cooling could
provide an additional reduction in deposition and spallation.
However, Bons et al. [12] noted that film cooling holes
introduce exposed TBC/metal interfaces that are actually more
prone to spallation.
To further assess the level of TBC degradation, the test
articles from this test series were analyzed using the ESEM.
The cross sectioned samples were first used to measure the
thickness of deposit remaining on the surface (Fig. 14). Three
images were taken of the cross sectioned sample: one at the
bottom of the sample (closest to the combustor exit), one near
the middle, and one at the top. Figure 15 shows a typical
series of images taken from the 5.81 g/s cooling level sample.
0
1
2
3
4
5
6
0 1 2 3 4 5 6 7 8 9 10
Mass Flow of Coolant (g/s)
Ne
t C
ap
ture
Effic
ien
cy (
%)
500
550
600
650
700
750
800
850
900
950
1000
Ba
cksid
e T
em
pe
ratu
re (
de
g C
)
Coal
Petcoke
Backside Temperature
Figure 13: Effect of cooling on net capture efficiency
As seen in Fig. 14, residual deposit thickness is fairly
uniform for the no cooling and lowest level of cooling cases.
This is indicative of the large percentage of separated deposit
for these two cases as noted in Table 4. As the amount of
cooling was increased to 3.3 g/s, the top deposit thickness
dropped off considerably while the middle and bottom
continued to increase because of the more tenacious deposit
formation near the leading edge. Since the top of the coupon
was furthest from the jet it experienced the lower temperatures
and thus less deposition. Further increases in the amount of
coolant result in decreasing deposit thicknesses at all
locations. This spatial variation in deposit thickness is similar
to what occurs in an actual turbine with deposition buildup at
the hottest spots near the leading edge [12]. Figure 15 shows
the level of spallation which occurred at the leading edge as a
result of deposit penetration. Similar spallation was seen in
the particle size test series. Wammack et al [8] observed a
similar deposit penetration effect although with a different
TBC material system. With the exception of the highest
cooling case all other tests in this series had varying amounts
of spallation damage caused by penetration of the deposit
along the cross section.

DRAFT
10
Table 5: Deposition results from impingement cooling test series using petcoke
Massflow of Coolant
[g/s]
Heat Flux [kW/m
2]
Preburn Button
Mass [gr]
Button Mass
Change [mg]
Separated Deposit
Mass [mg]
Separated Deposit %
Net Deposit Mass [mg]
Deposition Rate
[mg/cm2hr]
Net Particulate Mass [mg]
Net Capture
Efficiency [%]
0 0 13.8 10 360 97 370 14.60 7720 4.79
3.38 1049.20 29.4 40 60 60 100 3.95 7680 1.22
8.33 1614.26 29.42 20 30 60 50 1.97 8200 0.65
0
0.05
0.1
0.15
0.2
0.25
0.3
0.35
0 2 4 6 8 10
Mass Flow of Coolant (g/s)
De
po
sit T
hic
kn
ess (
mm
)
Deposit Thickness Bottom [mm]
Deposit Thickness Middle [mm]
Deposit Thickness Top [mm]
Figure 14: Remaining deposit thickness vs. cooling level
Figure 15: Typical image series of bottom (left), middle,
and top (right) portions of 5.81 g/s coolant test sample
Figure 16 contains the surface roughness data for the
impingement cooling test series. As expected, the roughness
falls off as the deposit is reduced due to increased backside
cooling. The roughness measurement for the no cooling case
was taken from a separated deposit flake to insure consistency
with the more tenacious deposits at the higher cooling levels.
X-ray spectroscopy was conducted to determine the
elemental constituents in the surface deposit, as well as the
penetrating deposits. Figure 17 shows the elemental
composition in weight percent compared with the ash. The
surface deposits showed a similar makeup as the ash, however
there was a significant increase in Ca while Na and Si showed
large decreases. The figure also clearly shows that the TBC
studied is penetrated by Si, Ca, and Al from the ash. The
spallation appears to be the result of the difference in
coefficients of thermal expansion between the TBC and the
penetrating ash elements. Upon shutdown of the facility, this
mismatch in contraction rates causes significant thermal
stresses in the TBC, resulting in separation of the TBC layer
particularly near the edges of the coupon.
0
50
100
150
200
250
300
350
400
450
0
5
10
15
20
25
30
35
40
45
0 2 4 6 8 10
Rt,
Rz
(m
)
Ra
(m
)
Mass Flow of Coolant (g/s)
Ra
Rt
Rz
Figure 16: Effect of cooling on deposit surface roughness
0
10
20
30
40
50
60
70
Na Mg Al Si P S K Ca Ti Fe
Element
Wt%
Ash
Deposit
Penetration
Figure 17: Elemental comparison of ash, deposit, and
penetration for coal impingement cooling series
Petcoke Series A final series of tests were performed using the
petcoke/coal blend particulate. Three tests were conducted
using particles with a MMD of 6 m. The third set of samples
described earlier were used in this test series. First, a no
cooling test was performed with the interior of the coolant
fixture insulated as in the gas temperature and particle size test
series. Following this, two impingement cooling levels were
tested in the same configuration as the coal series. The same
standard operating conditions were used, namely T = 1183°C,
Mach = 0.25. The deposits looked similar to those of the coal
impingement cooling series. The same large amount of
flaking occurred on the no cooling case, however there was
more flaking on the cooling cases compared to the coal series
Flow
Direction
Bottom
Top
Middle

DRAFT
11
perhaps due to the larger particle size. There was slightly
more spallation of the TBC in the no cooling case compared to
the coal, however the different MMD makes a direct
comparison difficult. A summary of the deposition results is
shown in Table 5. Trends in net capture efficiency are
included in Figure 13 with the coal.
Conclusions
Four series of tests were performed in an accelerated
deposition test facility to study the independent effects of
particle size, gas temperature, and metal temperature on ash
deposits from two candidate power turbine synfuels. Testing
was conducted in the TADF by matching gas temperature,
velocity, and net throughput of particulate out of the
combustor with that experienced by a modern power turbine.
Nominal combustor exit flow conditions are: Mach number of
0.25 and gas temperature of 1183°C. Testing with four
different sizes of coal ash particles showed greater than double
the deposition rate as particle mass mean diameter was
increased from 3 to 16 m. In the second series of tests,
different gas temperatures were studied while the facility
maintained a constant exit velocity of 170m/s (Mach=0.23-
0.26). Particle deposition rate was found to decrease with
decreasing gas temperature. The threshold gas temperature for
deposition was approximately 960°C. Ground coal and
petcoke ash particulates were used in the third and fourth test
series with impingement cooling on the backside of the target
coupon. Deposition rates decreased with increasing massflow
of coolant air, as expected. Deposit surface roughness levels
decreased with decreasing gas temperature and increasing
coolant flow, consistent with the trend in particulate capture
efficiencies for both cases. Post exposure analyses of the third
test series (scanning electron microscopy and x-ray
spectroscopy) show decreasing TBC damage with increased
cooling levels. Work is currently under way to study the
effects of different TBC application techniques on deposition.
Acknowledgements
Various individuals provided invaluable support to this
research effort. The authors would particularly like to thank
the assistance provided by Arun Mehta from Pacificorp for the
coal flyash samples and Tampa Electric Company for
assistance in locating petcoke samples. Dr. Ron Bunker of
GE, Mr. Gerry McQuiggan of Siemens-Westinghouse, and Dr.
Tom Taylor of Praxair Surface Technologies all generously
donated coupon specimens without which the study would not
have been possible. Thanks also to Robert Laycock for
performing particle size analysis and many other helpful tasks.
Aaron Mason and Spencer Grange helped design the coolant
fixture and conduct testing. A special thanks to Ken Forster,
projects lab manager for the M.E. Department at Brigham
Young University; without his help this project would not
have been possible. This work was partially sponsored by the
US Department of Energy – National Energy Technology
Laboratory through a cooperative agreement with the South
Carolina Institute for Energy Studies at Clemson University.
The views expressed in this article are those of the authors and
do not reflect the official policy or position of the Department
of Energy or U.S. Government.
References [1] Wenglarz, R.A., and Wright, I.G., “Alternate Fuels
for Land-Based Turbines,” published in proceedings of the
“Workshop on Materials and Practices to Improve Resistance
to Fuel Derived Environmental Damage in Land-and Sea-
Based Turbines,” October 22-24, 2002, Colorado School of
Mines, Golden, Colorado
[2] Smialek, J.L., Archer, F.A., and Garlick, R.G. in F.H.
Froes et al. (eds.), The Chemistry of Saudi Arabian Sand: A
Deposition Problem on Helicopter Turbine Airfoils, Advances
in Synthesis and Processes, SAMPE, 3, 1992, M92-M101
[3] Toriz, F.C., Thakker, A.B., and Gupta, S.K., J.
ASME, “Thermal Barrier Coatings for Jet Engines” 88-GT-
279, (1988), (presented at the Gas Turbine and Aeroengine
Congress Amsterdam, The Netherlands, June 6-9, 1988).
[4] Wenglarz, R.A., and Fox, R.G. Jr., 1990, “Physical
Aspects of Deposition From Coal-Water Fuels Under Gas
Turbine Conditions”, Journal of Engineering for Gas Turbines
and Power, Jan 1990, pp9-14.
[5] Kim, J., Dunn, M.G., and Baran, A.J. et al, 1993,
“Deposition of Volacanic Materials in the Hot Sections of
Two Gas Turbine Engines,” J. Engr. Gas Turbines & Power
vol. 115, Jul 1993, pp641-651.
[6] Jensen, J.W., Squire, S.W., Bons, J.P., and Fletcher,
T.H., 2004, “Simulated_Land-Based Turbine Deposits
Generated in an Accelerated Deposition Facility,” presented at
IGTI 2004 in Vienna, June 2004. Paper # GT2004-53324.
[7] Bons, J.P., Crosby, J., Wammack, J.E., Bentley, B.I.,
and Fletcher, T.H., “High Pressure Turbine Deposition in
Land-Based Gas Turbines with Various Synfuels,” presented
at IGTI 2005 in Reno, NV, June 2005. Paper # GT2005-
68479. Accepted for publication in ASME Journal of
Engineering for Gas Turbines and Power.
[8] Wammack, J.E., Crosby, J., Fletcher, D., Bons, J.P.,
and Fletcher, T.H., 2006, “Evolution of Surface Deposits on a
High Pressure Turbine Blade, Part I: Physical Characteristics,”
presented at IGTI 2006 in Barcelona, Spain, May 2006,
#GT2006-91246.
[9] Bons, J.P., Wammack, J.E., Crosby, J., Fletcher, D.,
and Fletcher, T.H., 2006, “Evolution of Surface Deposits on a
High Pressure Turbine Blade, Part II: Convective Heat
Transfer,” presented at IGTI 2006 in Barcelona, Spain, May
2006, #GT2006-91257.
[10] McBride, B. J. and Gordon, S., “Computer Program
for Calculation of Complex Chemical Equilibrium
Compositions and Applications II. User's Manual and Program
Description,” http://www.grc.nasa.gov/WWW/CEAWeb/RP-
1311P2.htm (2006)
[11] Lu, H., “Experimental and Modeling Investigations
of Biomass Particle Combustion,” PhD Dissertation, Chemical
Engineering Department, Brigham Young University, Provo,
UT (2006).

DRAFT
12
[12] Bons, J.P., Taylor, R., McClain, S., and Rivir, R.B..
“The Many Faces of Turbine Surface Roughness,” ASME
Journal of Turbomachinery, Vol. 123, Oct. 2001, pp. 739-748.
[13] Hamed, A., Tabakoff, W., Rivir, R.B., Das, K., and
Arora, P., “Turbine Blade Surface Deterioration by Erosion,”
Paper No. ASME-IGTI 2004-54328, June 2004.
[14] Caguiat, D., 2002, “Rolls Royce/Allison 501-K Gas
Turbine Anti-Fouling Compressor Coatings Evaluation,”
presented at IGTI 2002 in Amsterdam, The Netherlands, June
2002, #GT2002-30261.