effective open innovation; a key component of the r&i … · effective open innovation; a key...
TRANSCRIPT

1914 - 2014 A Century of Innovationin the Oil and Gas Industry
© 2015 UOP LLC. All rights reserved. UOP 6696-1
Effective Open Innovation;A Key Component of the R&I Portfolio
Dr. Medhat TannousSenior Director, Regional R&DUOP LLC
GPCA Innovation ConferenceDubaiMarch 17, 2015

Outline
Portfolio Management Open Innovation Model Collaboration Process and Framework @ UOP
– Process Steps– Framework Document– Enabling tools– Lessons learned
Management of collaboration project Partner of Choice Summary Q & A
2

Portfolio Management Corporate Goals Business Strategies Product Innovation & Technology
Strategy Strategic Groupings Operational Portfolio Management Manage Entire Portfolio Dynamic Portfolio Reviews
STR
AP
AO
PEx
ecut
ion
• Where should we invest?
• Which projectsshould we resource?
• Managing to our plans?• Dynamic Needs?
• Right Number of Projects– Prioritization – “Critical Few”– Balanced by type, strategy, platform– Cross functional resource allocation
• Financial– Revenue projections– Act. cost and revenue tracking
• Execution – Project spending – Speed and compliance
Process & Metric Driven Portfolio
2008 2009 2010 2011 2012 2013 2014 2015
NPI ValueR&D Spend
Idea Generation
PortfolioManagement
E&F UOP Core BusinessesExisting Businesses
New Ventures
AlliancesM&A
New Technology or Growth Platforms
NewVentures
CustomerInput
CustomerNeeds
Technology Discovery
Strategic Alignment
Roadmaps
IP
Exploratory
Clear entry point all projects must pass
Idea Generation
PortfolioManagement
E&F UOP Core BusinessesExisting Businesses
New Ventures
AlliancesM&A
New Technology or Growth Platforms
NewVentures
CustomerInput
CustomerNeeds
Technology Discovery
Strategic Alignment
Roadmaps
IP
Exploratory
Clear entry point all projects must pass
Robust Process to Identify & Prioritize Core and Growth Platforms 3
UOPVision &
Goals
Business New Product & Technology Strategy
NPD Discovery Capability
Discovery
Capability
NPD

Main factors affecting decision making Current levels of resources Timeframe to deliver Skills required Availability and cost of capabilities
Portfolio Execution
Having capabilities In-House does not mean they Can be deployed in a timely
manner to meet customer needs
Make / Buy / Partner Decision Matrix - Information extracted from Corporate Executive Board, 2005
Criteria Importance Make Buy Partner1 Complement existing skills3 Leverage core competencies5 Add Intellectual Property / knowledge6 Seed the pipeline with basic discoveries/technologies7 Accelerate product / process development
10 Create a unique value proposition for existing customers11 Enhance marketing position12 Establish new customer relationships16 Minimize signaling a new strategy to competitors22 Improve productivity23 Minimize financial risk25 Minimize risk of IP loss27 Minimize delays to other projects / strategies31 Provide flexibility in a changing business environment
If Organic Growth is Slow and Barely Keeps Up With GDP, and Acquisitions
are Complicated with High Failure Rate, OPEN INNOVATION is an Attractive
Option to Meet Market Demands.
Options Internal Development (Make) Acquisition (Buy) Open Innovation (Parter)
4

Implement & manage formed agreements and relationships
Identify capabilities and resources we need to meet our
strategic objectives?
Locate and evaluate needed
resources?
Establish processes to
access selected resources?
Business Strategy
Project
New product meeting Market & customer needs
Create Value
Based on Roche Pharmaceutical Model
Corp Goals VoC Mkt Trends Regulations Competition Emerging Tech
The “Open Innovation” Model @ UOP
Road MappingGap Analysis
• Collaboration Formation
• Other agreements
• Scouting• Networking
• Collaboration Imp & Management
• Portfolio management
A Structured Approach to Leverage External Capabilities To Speed up CommercializationOf New Profitable Ideas That Will Satisfy Customer Needs and Market Requirements 5
Find Get ManageWant
Objective:
Tools:

Collaboration Formation Framework
Process Document
6 Main Steps- Tasks
• Strategic Assessment Elements (SAE’s) - 8
• Other Elements - 7
Team Manual
INPUTS• Business Strategy• Project • “FIND” Outcome• “WANT” Outcome
• FrameworkDocument
• Signed Contract • Do not proceed
UOP Collaboration/Alliance Formation Framework
Using 6-Sigma Methodology, A Robust Collaboration Formation Process Was Developed based on Best Practices, Stakeholders Requirements, and Our Collaboration Experience 6
Tools / Enablers
Metrics
OUTPUTS

Collaboration Formation Process
Conduct ResourceFit Assessments
Charter FormationTeam
Achieve InternalConsensus
Approach PotentialPartners
1
2
3
4
Select Partner
NegotiateAgreement
5
6Outputs
• Framework Document• Agreement• Implementation Plan
Inputs• Strategic Plan• GAP Analysis• Potential Partners
Collaborations are doomed toFailure without internal consensus
Quickly walk away as friends if there is no strategic fit
Resource complimentary?Available? Outsourcing?
Self-selection enhances successful formation
• Identify needs / business case• Confirm collaboration is the best alternative• Charter planning/negotiating team
• Draft collaboration framework document• Get input from stakeholders• Resolve internal disagreements
• Identify potential partners• Discuss UOP framework document• Assess strategic fit – Go / No Go decision• Develop joint collaboration framework
• Execute NDA• Evaluate capabilities of potential partners• Assess resource fit
• Confirm strategic fit of partner• Confirm resource fit of partner• Review framework doc with stakeholders
• Resolve IP RTU and commercial terms• Negotiate legal Agreement• Conduct collaboration Kickoff Meeting
A Rigorous and Adaptable Process for Planning and Negotiating a Collaboration with Emphasis onSpeed, Internal Alliance and Alignment of Objectives that are Linked to Partners’ Strategic Objectives. 7
Doc

Each element is unique, but interdependent. Changing position in one will require adjusting position in the remaining.
All Elements must be CONSISTENT with Element #2 describing the Strategic Objectives of the collaboration for both partners
Source: Gene Slowinski & Mathew Sagal; The Strongest Link, American Management
Elements of the Collaboration Document
An Iterated Document that Describes the Collaboration in Terms of Specific Elements that Clearly Presents the Business Intents of the Partners. SAEs Provide Early Identification of Deal Killers, Speeds Formation and Avoids Deal Fevers 8
1 Business Plan Summary2 Objectives
OursTheirs
3 Roles : During alliance implementationOursTheirs
4 Overall ResourcesOursTheirs
5 Boundaries6 Market Model7 Strategic Exclusivity8 Intersections9 Detailed Objectives10 Detailed Resources11 Financial Pie-Split12 Intellectual Property13 Working Process and Governance14 Terms & Termination15 Additional Elements to reflect Industry or Market characteristics.
Stra
tegi
c As
sess
men
t Ele
men
ts(S
AEs)
Allia
nce
Fram
ewor
k El
emen
ts
P

Author:Project Name:
Original Project Goal StatementA Need statement should not assume a cause or identify a solutionS - Is it Specific?How can we be clear and concise in describing the need of a customer / stakeholder or the situation?M - Is it Measurable?What could we observe or measure to demonstrate progress / improvement?A - Is it Achievable?What can we target to meet the defined needR - Is it Relevant/Results?Is it alligned with business and customers needs?T - Is it Timely?For our business and our customer ? How long would it take to meet the defined need?
Revised Project StatementIncorporating SMART elements
Criteria Importance Make Buy Partner1 Complement existing skills2 Minimize loss of critical skills3 Leverage core competencies4 Support the activities of multiple SBUs/Groups5 Add Intellectual Property / knowledge6 Seed the pipeline with basic discoveries/technologies7 Accelerate product / process development8 Differentiate offering from competitors9 Expand distribution channels
10 Create a unique value proposition for existing customers11 Enhance marketing position12 Establish new customer relationships13 Expand market share14 Create position of sustainable competitive advantage15 Easily overcome competitor reaction16 Minimize signaling a new strategy to competitors17 Overcome regulatory barriers
Make/Buy/Partner Decision Making
Project/Team Name Project Need Statement (a)What is the Project(s) Need(s)External "WANTS" (b)What are the external capabilities, resources, skills, assets that the project team has identified in order to meet their objectives.
Project Goal / Results $What is the expected outcome?MembersPermanent, full-time team members.ConsultantsIndividuals who's expertise will be needed from time to time, should be kept informed of the team's activities.ScopeWhat are the boundaries of our efforts: process, organization and resources? Who else needs to be involved or informed?ObjectivesWhat is the team required to do. This should be a list of specific tasks.MethodologyA description of the road map and tools to be used in the project.
CommunicationShould describe the paths/vehicles/frequency of communication to sponsors, authorizing bodies, others interested in activity.
ConstraintsLimits of authority, time frame, money spent, margins, revenue, etc.Sponsored byProcess Accountable Manager or Delegate.
Formation Charter
STEP Start Date Jan Feb Mar Apr1 Identify the “Needs” of the SBU along the value chain in order to create a more
valuable customer offering; Strategic Level and Project Level Needs
2 Assessing if alliance is the best way to achieve the strategic goals, when compared to other options; make or buy.
3 Executive Management charters Formation team and provides them time and support.
4 Alliance framework training for team members and top management5 Develop Project timeline / Plan6 Formation team drafts the "Alliance Framework Document" for each "SAE"
7 Solicit input from stakeholders, including Safety and Taxes departments, modify the document and generate next version.
8 Continue with document modifications until Leadership of key stakeholders approves the document and agree to commit resources during implementation.
9 Disagreements are exposed and resolved10 Preliminary assessment of the size of opportunity for UOP11 Decision Go/NoGo to be made
1.
Chartering the Alliance Formation
Team
2.
Achieving Internal
Consensus
Task
Project Plan and Accountabilities
1. Business Plan Summary:
2. Objectives
a. Ours
b. Theirs
3. Roles:
a. Ours
b. Theirs
4. Overall Resources
a. Ours
b. Theirs
5. Boundaries
6. Market Model
7. Strategic Exclusivity
8. Intersections with other Alliance.
ASSET MAP (our firm) ASSET MAP (Partner firm)
a ab bc c
What should we avoid learning (avoid contamination) ?a ab bc c
a ab bc c
a ab bc c
What are they not willing to show us ?
What must the Partner learn about our CapabilitiesWhat must we learn about the Partner's Capabilities
What are we willing to reveal to the Partner ?
What are we not willing to reveal to the Partner ?
What should they avoid learning ?
What are they willing to show us ?
Asset Maps and Tirekick Matrix
Strategic Assessment Element (SAE) UOP's Position Partner 1 Partner 2
1a Our Objectives1b Their Objectives2a Our Roles2b Their Roles3a Our Overall Resources3b Their Overall Resources4 Boundaries5 Market Model6 Strategic Exclusivity7 Intersections
Strategic Reconciliation Map
Key Resource Partner 1 Partner 21 Research Capability2 Ability to develop Products3 Manufacturing Capability4 IP5 Sales offices6 Ability to provide Tech Support7 HS&E8 Marketing Capability9
Resource Fit Reconciliation Map
Patents Technical Know-How Marketing Information
Background
Foreground
Inside Boundaries
Outside Boundaries
During Alliance
After Alliance
1 Step Cycle Time (Wk) 1 Estimated size of Alliance 2 Unique skill contribution (%)
1 Expected Value for UOP ($) 1 Total Time to form the Alliance (wk) 2 Cost to form the Alliance ($) 2 SPAN of Response (days) 3 Actual Annual revenues ($) 3 Probability of Success (%) 4 Actual Annual implementation cost ($)
Process
Non- Financial Finan-
cial
Results
BSC
It is Preferable to Have a Template Which is Standard and Can be Shared, Than for the Knowledge to Reside in the Heads of Few Team Members
Integrated Set of Enablers / Templates
9

Partner Selection; Reconciliation MapsStrategic Fit Reconciliation Map
Key Resource Partner 1 Partner 21 Research Capability2 Ability to develop Products3 Manufacturing Capability4 IP5 Sales offices6 Ability to provide Tech Support7 HS&E8 Marketing Capability
Symbols to be used:OK+: The partner's resources are outstanding and complementary to ours. OK : The partner's resources are satisfactory and complementary to ours. ? : The partner has a weekness that can be overcome by adding additional resources▲: The partner has a weekness that can be overcome by our combined resources● : The partner has a weekness that can be overcome by using third party resources.◄: A probable "deal-killer". The partner has a weakness that cannot be overcome.
Source: Gene Slowinski & Mathew Sagal; The Strongest Link, American Management Association, 2003.
Resource Fit Reconciliation Map
Provide a Visual Summary of the Strategic Fit and Resource Fit Between yourFirm and Potential Partners, and a Communication Tool for Top Management. 10
Strategic Assessment Element (SAE) UOP's Position Partner 1 Partner 2
1a Our Objectives
1b Their Objectives
2a Our Roles
2b Their Roles
3a Our Overall Resources
3b Their Overall Resources
4 Boundaries
5 Market Model
6 Strategic Exclusivity
7 Intersections
Symbols to be used:OK : The partner accepts our position on the SAE? : We have a disagreement and are unsure of the resolution▲: We have a disagreement, but the partner is likely to accept our position.● : We have a disagreement, but the partner's position is acceptable to us.►: A compromise can probably be negotiated◄: A probable "deal-killer".
Source: Gene Slowinski & Mathew Sagal; The Strongest Link, American Management Association, 2003.

Sharing Asset Maps Before Beginning the Tire-Kicks is Vital So That BothPartners Agree on Information to Exchange and Limitations to Exposure.
Conducting Resource Fit Assessment
11
ASSET MAP (our firm) ASSET MAP (Partner firm)
What must we learn about the Partner's Capabilities What must the Partner learn about our Capabilitiesa ab bc c
What should we avoid learning (avoid contamination) ? What should they avoid learning ?a ab bc c
What are we willing to reveal to the Partner ? What are they willing to show us ?a ab bc c
What are we not willing to reveal to the Partner ? What are they not willing to show us ?a ab bc c
Source: Gene Slowinski & Mathew Sagal; The Strongest Link, American Management Association, 2003.
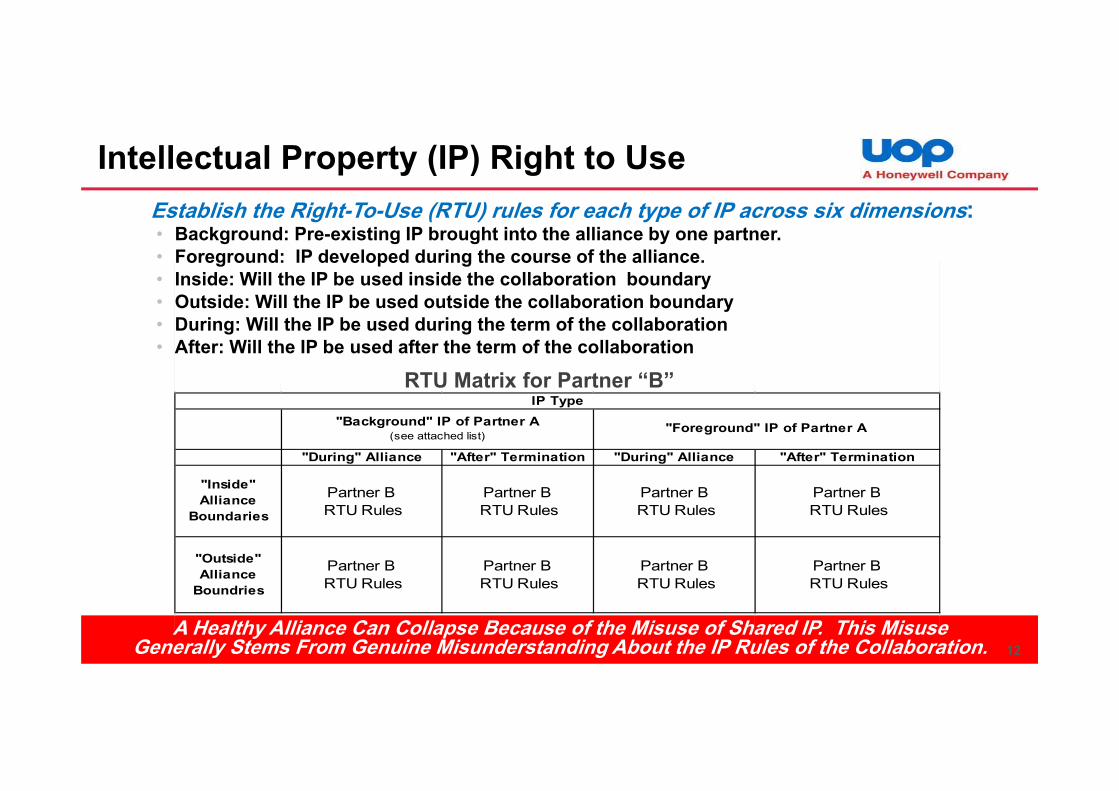
Establish the Right-To-Use (RTU) rules for each type of IP across six dimensions:• Background: Pre-existing IP brought into the alliance by one partner.• Foreground: IP developed during the course of the alliance.• Inside: Will the IP be used inside the collaboration boundary• Outside: Will the IP be used outside the collaboration boundary• During: Will the IP be used during the term of the collaboration • After: Will the IP be used after the term of the collaboration
A Healthy Alliance Can Collapse Because of the Misuse of Shared IP. This Misuse Generally Stems From Genuine Misunderstanding About the IP Rules of the Collaboration.
RTU Matrix for Partner “B”
Intellectual Property (IP) Right to Use
12
"During" Alliance "After" Termination "During" Alliance "After" Termination
"Inside" Alliance
Boundaries
Partner B RTU Rules
Partner B RTU Rules
Partner B RTU Rules
Partner B RTU Rules
"Outside" Alliance
Boundries
Partner B RTU Rules
Partner B RTU Rules
Partner B RTU Rules
Partner B RTU Rules
T b l t d f h t f IP th t i l t t th lli d f h t
"Background" IP of Partner A(see attached list)
"Foreground" IP of Partner A
IP Type

Collaboration Formation; Some Lessons Learned @ UOP Achieve consensus among stakeholders and keep them continuously involved. Collaboration objectives are key tie to business intents and must be stated as
specifically as possible, and not to be mixed with collaboration benefits. Keep legal informed through out the process, but not necessarily participate in
meetings until steps 5/6 are reached. The element "Intersection" for both partners should be reviewed and approved by legal
early in the process before starting the “Tire Kick” activities in Step 4 Incorporate the following IP related activities into the process:
– IP Landscape mapping and analysis– Intersection review and analysis– Freedom to Practice (FTP) and validity
At the first formal meeting with potential partner, know the participants, the key stakeholders, who will be signing the agreement, and which process will be followed Know the Impact of the collaboration on customers, suppliers and competitors. The elements are interdependent, and a change in one can cause changes in
others, and all elements must be aligned with collaboration objectives. Lessons Learned are Based on Input from Stakeholders and
Partners and from Continuously Monitoring the Process 13

UOP’s Gated Technology Delivery Process™
• Used for managing Technology Delivery projects including catalyst, process, equipment, manufacturing technology, etc
• Proprietary management process developed by UOP• Based on Dr. Robert Cooper’s Stage-Gate® methodology
It is Important that Collaboration Partners Understand the Process; Type of Activities Performed in Each Stage, and Deliverables Required for Each Decision Gate
Managing the Collaboration Project
14
ScopingProductConceptSelection
Development CommercialDemonstration
ProductLaunch
Stage 1 Stage 2 Stage 3 Stage 4 Stage 5
Gate 1 Gate 3
Scale-upApproval
Gate 4Post Launch
ReviewProductLaunch
Approval
Gate 5Idea
Screening DevelopmentApproval
Gate 2Project
Selection
ExPAC
PAC 3PAC 1 PAC 2
Project Teams
Team Leaders
ExPAC
PAC 3PAC 1 PAC 2 PAC 3PAC 1 PAC 2 PAC 3PAC 1 PAC 2
Project Teams
Team Leaders
RTRT
RTERT
Idea Generation

UOP’s Technology Delivery Process
15
ScopingProductConceptSelection
Development CommercialDemonstration
ProductLaunch
Stage 1 Stage 2 Stage 3 Stage 4 Stage 5
Gate 1 Gate 3
Scale-upApproval
Gate 4Post Launch
ReviewProductLaunch
Approval
Gate 5Idea
Screening DevelopmentApproval
Gate 2Project
Selection
Idea Generation
Stages• Structured project phases representing increasing levels of effort and investment• Pre-defined technical and business activities in each phase• Established tools provide consistent thought process and documentation • Pre-defined set of deliverables prepared for each decision pointGates• Formal reviews by a multi-disciplinary team of senior management• Success criteria for passing each gate are established in advance• Each gate represents a Go/Stop decision on whether to proceed to the next stage
Rigorous Oversight Process Involving all Functions and Stakeholders

Long History of Open Innovation at UOP
Extensive history of collaboration and partnership– UOP’s collaboration database lists over 400
collaborations– Approximately 180 are currently active– We developed a formal and robust process
for forming collaborations We maintain active collaborations all
over the world with…– Other technology-driven companies– Major research universities– Government laboratories and research
institutes Some examples of collaborations
Technology Field Partners
Uniflex Slurry hydrocracking of heavy residual oils Canmet
Ecofining Green diesel from vegetable oils and animal fats Eni
Hydrotreating Removal of S & N from HC feed Albemarle
MTO Methanol to olefins Norsk Hydro, Statoil
Olefin Cracking
Cracking of heavier olefins to ethylene & propylene TOTAL
Gas Processing Removal of acid gas from NG QP
Aromatics Technology for p-Xyleneproduction KFUPM
HC Hydrogenatio
nDesign of Bimetallic nano
structure catalyst KAUST
FCC Feed treatment KNPC
16

Becoming the “Partner of Choice”
“Working with a “Partner to Avoid” is like dating an octopus :
• Two arms are hugging you • Two arms are strangling you• No one knows what the other four arms are up to!”
The “Partner of Choice” institutionalizes the ability to create and manage the collaboration internally and externally, and seamlessly integrates its internal activities with the partier.
And NOT the “Partner to Avoid”…
UOP Wants to be the Company to WhichInnovative Technologies Are Offered First 17

Summary
UOP is committed to innovation to meet market demands Aligned with business strategies and corp objectives a balanced portfolio
is established:– Renewal of core technologies– Pushing the limits of existing technology– Investing in breakthroughs
Using robust R&D work processes– Voice of the Customer - VoC– Portfolio management– Technology road-mapping– Open innovation; and collaboration formation – Technology Delivery Process– Six Sigma plus
Investing in Regional R&D to work closer with our customers– Middle East, India and SEA
UOP 5625R-1818

UOP: A Century of Innovation
19
UOP creates technology for the oil and gas industry
Better Economics Continuous Innovation Reliability Expertise
UOP technology makes more than 60% of the world’s gasoline, 70% of its polyester and 90% of biodegradable detergents, and processes more than 40% of its LNG
Petrochemicals Natural GasRefining Renewables
UOP technologies offer a high return on investment
Continuous technology improvement allows customer operations to remain cutting edge
UOP technologies are among the most widely proven in the world
UOP has a century-long record leading technology development for the oil and gas industry
800+R&D employees
3,000+ Active patents
2,500
200 with PhDs
Engineers and scientists
31out of 36refining technologies
in use today were developed by
UOP
• Process Technology• Catalysts • Adsorbents• Equipment• Services
Largestprocess licensing organization in the world
Thank You20

UOP 6501J-21
&
21

Backup Slides
22

The Open Innovation ParadigmThe funnel is porous… External ideas can flow into the firm at any point along the innovation process, and internal ideas that do not fit can flow out to be developed and commercialized by others.
Principles of Innovation Systems
Closed InnovationAll the smart people in our field work for us.To profit from R&D, we must discover & commercializeIf we create the most and the best ideas in the industry, we will win.We should control our IP, so that our competitors don’t profit from our ideas.
Open InnovationWe need to work with smart people inside and outside External R&D can create significant value. We don’t have to originate the research to make profit We should profit from others’ use of our IP, and we should buy others’ IP when it fits our own business
Why?• Tap into skills you do not have (Capability).• Leverage other resources (Capacity).• Access outside inventions (Technology).• Free up resources for other critical projects.• Reduce time to market (speed & productivity).
The Marketplace Does Not Care About the Source of Innovation As Long as it
Satisfies Customers Needs at a Fair Price. G. Slowinski
Research DevelopmentInternal
TechnologyBase
ExternalTechnology
Base
Licensing
Spin-offs New Market
Other Firm’sMarket
Technology Insourcing
Source: Open Innovation; H Chesbrough
23

A mutually beneficial agreement between two or more partners, in whichresources, knowledge, and capabilities are shared with the objective
of enhancing each partner’s competitive position.
Collaborations …• Create Value by combining capabilities• Of separate firms • Which share control• In a defined term agreement
Mike Ransom; Eli Lilly & Co.
Collaborations
At UOP, collaborations (Alliances) are formed at any link of its value chain from Research to Service covering a variety of relationships where UOP / partners intend to use or generate IP. UOP alliances may have several purposes; seek scientific /Eng skills, seek new technology, develop new one, add new features to existing technology, access markets, use manufacturing technology, etc..
Ben Gomes-Casseres; Alliance Strategy Consulting
Research, Development, Manufacturing, Marketing,
Definition of Collaboration
24
Merger orAcquisition
ArmsLength
contract

Step Cycle Time (wks)Unique Skill Contribution from
each (%)
Estimated value of the Alliance ($) Estimated Cost to implement ($)
1. Balanced Score Card for each Formed Collaboration
Process
Results
FinancialNon-Financial
• Total Formation Time (wks)• SPAN of response (days)• Probability of Success (%)
• Total Cost to Form the Alliance ($)• Actual Annual Revenues ($)• Actual Annual Imp Cost ($)
Formation Metrics Will Need to be Communicated to Members of the Implementation Team to Answer the Often Heard Question “What got us into this mess?”
Collaboration Formation METRICS
25

Gate Deliverables
26
ScopingProductConceptSelection
Development CommercialDemonstration
ProductLaunch
Stage 1 Stage 2 Stage 3 Stage 4 Stage 5
Gate 1 Gate 3
Scale-upApproval
Gate 4Post Launch
ReviewProductLaunch
Approval
Gate 5Idea
Screening DevelopmentApproval
Gate 2Project
Selection
Idea Generation
Gate Deliverables
Gate 1Idea Screening
• Strategic fit• Project ideas
• Rough market assessment• Resource estimate for Stage 1- Scoping
Gate 2Project Selection
• Preliminary market assessment • Preliminary technical assessment• Preliminary HSE & regulatory assessments
• Preliminary product requirements • Plan for Stage 2 – Concept Selection• Resource estimate for Stage 2
Gate 3Development Approval
• Detailed technical assessment• Validated market assessment• Intellectual property strategy • Manufacturing strategy
• Capital requirements• Detailed HSE & regulatory assessments• Plan for Stage 3 – Development• Resource estimate for Stage 3
Gate 4Scale-Up Approval
• Completed Technical Assessment• Updated market assessment & launch plan• Robust Product/Process defined/validated • Detailed Product & Process specifications • Manufacturing trial run plan
• Updated HSE & regulatory assessments • Capital investment plan • Plan for Stage 4 – Scale-Up• Resource estimate for Stage 4
Gate 5Launch Approval
• Detailed, validated market launch plan• Proven mfg, engineering capabilities• Completed HSE & regulatory approvals
• Technology transfer plan to Manufacturing, Engineering, Customer Service