guidance on organizational life cycle assessment · pdf fileguidance on organizational life...
TRANSCRIPT
Guidance on orGanizational life cycle assessment
Un
it
ed
n
at
io
ns
e
nv
ir
on
me
nt
P
ro
gr
am
me

Copyright © United Nations Environment Programme. 2015
This publication may be reproduced in whole or in part and in any form for educational or non-profit purposes without special permission from the copyright holders, provided acknowledgement of the source is made. UNEP would appreciate receiving a copy of any publication that uses this publication as a source. No use of this publication may be made for resale or for any other commercial purpose whatsoever without prior, individual permission in writing.
DisclaimerThe designations employed and the presentation of the material in this publication do not imply the expression of any opinion whatsoever on the part of the United Nations Environment Programme concerning the legal status of any country, territory, city or area or of its authorities, or concerning delimitation of its frontiers or boundaries. Moreover, the views expressed do not necessarily represent the decision or the stated policy of the United Nations Environment Programme, the European Commission, any national government or any other organization participating in the International Life Cycle Initiative Board. The Life Cycle Initiative complements ongoing national and regional activities. Citing of trade names or commercial processes does not constitute endorsement. Information contained herein does not necessarily reflect the policy or views of the Society of Environmental Toxicology and Chemistry (SETAC). Mention of commercial or noncommercial products and services does not imply endorsement or affiliation by SETAC.
Follow the Life Cycle Initiative’s activities via:• Twitter (@LC_Initiative)• Facebook• LinkedIn Groups• LC Net (subscribe at www.lifecycleinitiative.org)
UNEP promotes environ-
mentally sound practices globally and in its own activities.
This publication has been printed with vegetable-based inks on recycled-content paper in a minimal print run. Our distribu-
tion policy aims to reduce UNEP’s carbon footprint.
ISBN: 978-92-807-3453-9

Guidance on orGanizational
life cycle assessment

Guidance on Organizational Life Cycle Assessment2
AcknowledgementsProducersThis Guidance has been produced by the UNEP/SETAC Life Cycle Initiative at UNEP, Technische Universität Berlin (TU Berlin) and Kogakuin University.
Supervision, technical editing and supportLlorenç Milà i Canals (UNEP DTIE, France) • Sonia Valdivia (UNEP DTIE, France)
Lead authorsJulia Martínez Blanco (TU Berlin, Germany) • Matthias Finkbeiner (TU Berlin, Germany) • Atsushi Inaba (Kogakuin University, Japan)
Co-chairs of the Project GroupMatthias Finkbeiner (TU Berlin, Germany) • Atsushi Inaba (Kogakuin University, Japan)
Co-drafters in the working group (Alphabetic order)Bengtsson, Jonas (Edge Environment Pty Ltd, Australia) • Braunschweig, Arthur (E2 Management Consulting AG, Switzerland) • Cívit, Bárbara María (CONICET, Argentina) • Cobas Flores, Elisa (Environmental Management Engineering SA de CV, Mexico) • Draucker, Laura (World Resource Institute, USA) • Kulatunga, Asela Kumudu (University of Peradeniya, Sri Lanka) • Laurin, Lise (EarthShift, USA) • Lundie, Sven (PE INTERNATIONAL AG, Germany) • Manzardo, Alessandro (University of Padova, Italy) • Margni, Manuele (CIRAIG, Canada) • Milà i Canals, Llorenç (UNEP DTIE, France) • Quiros, Ana (ECO GLOBAL, Costa Rica) • Ramjeawon, Toolseeram (University of Mauritius, Mauritius) • Rodrigues Sousa, Sabrina (COEAM, Brazil) • Valdivia, Sonia (UNEP DTIE, France) • Warsen, Jens (Volkswagen AG, Germany) • Wiche Latorre, Pia Alexandra (Wiche Sustainability, Chile)
Feedback stakeholders who participated in the consultation process (Alphabetic order)Alonso, Juan Carlos (SIMPPLE, Spain) • Arena, Alejandro Pablo (Universidad Tecnológica Nacional, Argentina) • Askham, Cecilia (Ostfold Research, Norway) • Cánovas Creus, Alba (Universidade Federal do Rio de Janeiro, Brazil) • Castelan, Guy (PlasticsEurope, France) • Ciroth, Andreas (GreenDelta, Germany) • Cummis, Cynthia (World Resources Institute, USA) • Emhart, Cristian (Fundación Chile, Chile) • Graff, Veronique (GreenWin, Belgium) • Guenther, Edeltraud (Technical University of Dresden, Germany) • Güereca Hernández, Leonor Patricia (Universidad Nacional Autónoma de México, Mexico) • Hadzhiyska, Dariya (denkstatt, Bulgaria) • Motta, Wladmir Henriques (IBICT/UFRJ, Brazil) • Hill, Mauro (Universidade Federal do Rio de Janeiro, Brazil) • Hou, Ping (IKE Environmental Technology, China) • Kabe, Yuki Hamilton Onda (Braskem SA, Brazil) • Koffler, Christoph (PE INTERNATIONAL AG, USA) • Kulczycka, Joanna (Polish Academy of Sciences, Poland) • Kurppa, Sirpa (MTT Agrifood Research Finland, Finland) • Lu, Di (Medical Technology, USA) • Maiorino, Lorenzo (Institute for Environmental Protection and Research, Italy) • Matt, Dolf (University of British Columbia, Canada) • Meier, Toni (University Halle-Wittenberg, Germany) • Moura, Elton Siqueira (Instituto Federal do Espírito Santo, Brazil) • Napoleon Forpah, Chi (Watershed Task Group, Cameroon) • Nunes, Katia (Technische Universität Darmstadt, Germany) • Oliver Solà, Jordi (Inèdit Innovació SL, Spain) • Onwurah, Ikechukwu Noel E (University of Nigeria, Nigeria) • Osset, Philippe Claude Francois (Solinnen, France) • Pairoj-Boriboon, Sirithan (Thailand Environment Institute, Thailand) • Pajula, Tiina Karin Johanna (VTT, Finland) • Panigrahi, Pradeep (Mahindra Sanyo Special Steel Pvt. Ltd, India) • Patisson, Fabrice (Université de Lorraine, France) • Pierce, Jason (Eastman Chemical, USA) • Pretato, Ugo (Studio Fieschi & soci Srl, Italy) • Sorto, José (Unión Panamericana de Ingenieros, El Salvador) • Souza, Julio Cesar (Fiat Automóveis SA, Brazil) • Stamenkovic, Marija (Technische Universität Berlin, Germany) • Susca, Tiziana (Federal Institute for Materials Research and Testing, Germany) • Tambyrajah,

3Guidance on Organizational Life Cycle Assessment
Dilip (International Natural Fiber Organization, Netherlands) • Tannous, Naji (Lebanon Green Building Council, Lebanon) • Theis, Thomas (University of Illinois, USA) • Traverso, Marzia (BMW, Germany) • Van Acker, Karel (KU Leuven, Belgium) • Visintin, Francesca (Center for Theoretical and Applied Ecology, Italy) • Walakira, Paul (Uganda National Bureau of Standards, Uganda) • Xará, Susana (Portuguese Catholic University, Portugal)
Support in the collection of ‘First Mover’ stories (Alphabetic order)Alvarado Díaz, Elsa Gabriela (CADIS, Mexico) • Bajaj, Sanjeevan (FICCI, India) • Bengtsson, Jonas (Edge Environment, Australia) • Brassel, Andrea (KPMG in Mexico, Mexico) • Brones, Fabien (Natura Cosméticos, Brazil) • Chargoy Amador, Juan Pablo (CADIS, Mexico) • Cívit, Bárbara María (CONICET, Argentina) • Cummis, Cynthia (WRI, USA) • De Bermingham, Noëlla (Accor, France) • Floc’h, Emilie (PwC, France) • Graziano, Emiliano (BASF, Brazil) • Herrmann, Arnaud (Accor, France) • Horrell, Jonathan (Mondelēz International, UK) • Humbert, Sebastien (Quantis, Switzerland) • King, Henry (Unilever, United Kingdom) • Koffler, Christoph (PE INTERNATIONAL AG, USA) • Margni, Manuele (CIRAIG, Canada) • Milà i Canals, Llorenç (UNEP DTIE, France) • Notten, Philippa (The Greenhouse, South Africa) • Ohashi, Kenji (Shiseido, Japan) • Ometto, Aldo Roberto (Universidade de São Paulo, Brazil) • Prieur Vernat, Anne (Storengy, GDF SUEZ, France) • Quiros, Ana (ECO GLOBAL, Costa Rica) • Saling, Peter (BASF SE, Germany) • Seddon, Julia (Inghams, Australia) • Suppen, Nydia (CADIS, Mexico) • Valdivia, Sonia (UNEP DTIE, France) • Van Hemelryck, Steven (Colruyt Group, Belgium) • Warsen, Jens (Volkswagen Group, Germany) • Wilson da Silva, Max (BASF, Brazil)
Technical Review Committee ChairsMary Ann Curran (BAMAC) • Michael Hauschild (Technical University of Denmark)
Editing, proofreading, design & layoutThad Mermer
PrintingPrinter in Kistmacher GmbH (Berlin)
Summary translationAnne-Claire Asselin • Ya-Ju Chang • Annekatrin Lehmann • Julia Martínez Blanco • Masaharu Motoshita • Today Translation and Business Services Ltd
Photo creditsSee full photo citations listed on p.144.
ContributionsThe authors would like to thank all the contributors who provided valuable background, ideas, and comments to this Guidance. Our gratitude also goes to all the organizations and experts that supported us in the collection of ‘First Mover’ stories, also when their specific cases could not be included in the final version of the Guidance. Special thanks to the members of the International Life Cycle Board of the UNEP/SETAC Life Cycle Initiative for providing support, guidance and resources to complete the work. The development of this Guidance was sponsored by the UNEP/SETAC Life Cycle Initiative, the Japanese Ministry of Economy, Trade and Industry (METI), the Japanese Ministry of the Environment (MOE), the Kogakuin University and the Technische Universität Berlin.
AC
KN
OW
LE
DG
EM
EN
TS

Guidance on Organizational Life Cycle Assessment4
Contents
Acknowledgements 2
Executive Summary 6
UNEP Foreword 14
SETAC Foreword 15
How to use the Guidance 16
1. Introduction 18
1.1 Context 19
1.2 Scope of the Guidance 22
1.3 ‘First Mover’ stories and reports 26
2. Overview of O-LCA 29
2.1 What is O-LCA? 30
2.2 Organization goals of an O-LCA 30
2.3 Specific situations for the implementation of O-LCA: experience-based pathways 35
2.3.1 Pathway 1: limited initial environmental experience and information 36
2.3.2 Pathway 2: existing environmental assessment gate-to-gate 36
2.3.3 Pathway 3: existing environmental life-cycle assessment at the product level 37
2.3.4 Pathway 4: existing single-indicator environmental assessment at the organizational level and including value chain 37
2.3.5 Other pathways 38
3. Technical Framework for O-LCA 39
3.1 General 40
3.2 Definition of goal and scope 40
3.2.1 Reporting organization 42
3.2.2 Reporting flow 47
3.2.3 System boundary 49
3.3 Life cycle inventory analysis 53
3.3.1 Activities involved 54
3.3.2 Prioritize data collection efforts 60
3.3.4 Handling multi-functionality situations 70
3.3.5 Data quality 73
3.4 Life cycle impact assessment 77
3.5 Life cycle interpretation and uncertainty 82

5Guidance on Organizational Life Cycle Assessment
CO
NTE
NTS4. Operationalizing O-LCA 84
4.1 Specific features of O-LCA for experience-based pathways 85
4.2 Simplification strategies for small and medium organizations 89
4.3 O-LCA integration into management and decision systems 89
4.3.1 Decision making 89
4.3.2 Setting targets within the organization’s environmental strategy 94
4.3.3 Environmental performance tracking 97
4.3.4 O-LCA results for deriving a product level assessment 101
5. Reporting, assurance and communication to third parties 103
5.1 General 104
5.2 Reporting and assurance 104
5.3 Communication 107
6. Conclusions and future steps 110
List of Tables 112
List of Figures 112
List of Boxes 113
List of Reports 113
References 115
Annex A. Glossary 124
Annex B. Acronyms 129
Annex C. Main existing methodologies referenced throughout the Guidance 130
Annex D. Linkages and comparison of O-LCA and product LCA 133
Annex E. The flagship project 1c “LCA of organizations” 137
Annex F. Case studies (‘First Mover’ stories) 140
Photo credits 144

Guidance on Organizational Life Cycle Assessment6
Executive Summary
Decisions made in organizations can have both positive and negative consequences for the environment. With this in mind, several methodologies, tools and techniques have been developed for organizations to assess the
environmental performance of their goods and services, as a step toward improvement. However, for assessment at the organizational level, the most widespread approaches have only recently considered the full value chain, and these mostly concentrate on a single aspect, like GHG emissions or water use.
Life cycle assessment (LCA) has been promoted as a robust quantitative tool, and a keystone in environmental decision making. While LCA was originally developed for products, the benefits of the life cycle approach may be extended to the more complex prospect of organizational assessment. Within this context, the UNEP/SETAC Life Cycle Initiative launched the flagship project “LCA of organizations” to further explore the capabilities and applicability of organizational life cycle assessment (O-LCA). This Guidance document is the main milestone of the project. It builds on key existing works and initiatives, like the Greenhouse Gas Protocol initiative, and especially strives to align with ISO/TS 14072, and with ISO 14040 and ISO 14044. They are referenced throughout the Guidance as a basis for the explanations and discussions.
O-LCA uses a life cycle perspective to compile and evaluate the inputs, outputs and potential environmental impacts of the activities associated with an organization, and the provision of its product portfolio. This methodology is capable of serving multiple goals at the same time (e.g., identifying environmental hotspots throughout the value chain, tracking environmental performance over time, supporting strategic decisions, and informing corporate sustainability reporting). One goal that O-LCA cannot currently fulfill is externally communicating comparisons between different organizations. Comparative assertions are neither robust nor meaningful, mainly due to the lack of a consistent basis for comparison.
O-LCA is envisioned for organizations of all sizes, both public and private, in all sectors, and all over the world. The first tentative steps toward full O-LCA application are currently taking place, and the outcomes of these are already being used to improve organizations’ environmental performance. Broadening the base of implementation is the logical next step, requiring accessible, practical guidelines and guidance.
Three different pathways describe how organizations with previous experience with environmental tools can use this as a basis to ‘think bigger’ and integrate an O-LCA approach. Additionally, specific recommendations for small, medium and large organizations provide practical ways forward. The specific directions given for several situations underscore that there is no ‘one-size-fits-all’ application of O-LCA. Eleven case studies, through on-the-ground experiences of ‘First Movers’, further illustrate the process and benefits of applying an environmental multi-impact assessment of organizations and their value chain.

7Guidance on Organizational Life Cycle Assessment
Résumé Executif
Les décisions prises dans les organisations ont des conséquences à la fois positives et négatives sur les impacts environnementaux. Dans ce contexte, plusieurs méthodologies, outils et techniques ont été développées pour permettre aux
organisations d’évaluer et améliorer les performances environnementales de leurs biens et services. Toutefois, pour évaluer les impacts au niveau organisationnel, les approches les plus répandues n’ont que récemment examiné la totalité de la chaîne de valeur, et elles se concentrent dans la plupart des cas sur un seul aspect, les émissions de gaz à effets de serre ou l’eau.
L’analyse du cycle de vie (ACV) a été promue comme un outil quantitatif robuste, et une pierre angulaire pour la prise de décision dans le domaine de l’environnement. Alors que l’ACV a été initialement développée pour les produits, les avantages des approches cycle de vie peuvent être étendus à la perspective plus complexe des organisations. Dans ce contexte, UNEP/SETAC Life Cycle Initiative a lancé le projet phare “ACV des organisations” afin d’explorer en détail le potentiel et l’applicabilité de l’analyse du cycle de vie aux organisations (ACV-O). Ce document d’orientation est le jalon principal du projet. Il s’appuie sur les travaux clés d’initiatives existantes, tels que l’initiative du Greenhouse Gas Protocol et s’efforce également de s’aligner sur les normes ISO/TS 14072, ISO 14040 et ISO 14044. Ces normes sont mentionnées tout au long du document comme point de départ des explications et discussions.
L’ACV-O utilise une perspective de cycle de vie pour compiler et évaluer les entrées, les sorties et les impacts environnementaux potentiels des activités associées à une organisation et à la fourniture de son portefeuille de produits. Cette méthodologie répond à plusieurs objectifs à la fois (par exemple, identifier les ‘hotspots’ environnementaux tout au long de la chaîne de valeur, suivre la performance environnementale au fil du temps, appuyer les décisions stratégiques, et alimenter les rapports de développement durable). Toutefois, l’ACV-O ne peut actuellement pas être utilisée pour une communication comparative entre différentes organisations. Les déclarations comparatives ne sont ni robustes ni significatives, principalement en raison de l’absence d’une base de comparaison cohérente.
L’ACV-O peut s’appliquer à des organisations de toutes tailles, publiques et privées, dans tous les secteurs économiques ou institutionnels, et partout dans le monde. Les premiers pas vers une application complète de l’ACV-O sont actuellement en cours, et les résultats de ces expériences ont déjà permis d’améliorer la performance environnementale des organisations. L’étape suivante est d’élargir le champ de mise en œuvre; elle nécessite l’accès à des directives et orientations pratiques.
Trois méthodes sont présentées pour guider les organisations ayant déjà une expérience des outils environnementaux vers une approche intégrative de type ACV-O pour ‘penser plus grand’. De plus, des recommandations spécifiques pour les grandes, ainsi que pour les petites et moyennes organisations, fournissent des moyens pratiques de progresser. Des recommandations pour des situations particulières soulignent qu’il n’y a pas de manière unique de mettre en œuvre une ACV-O. Onze études de cas présentent des expériences concrètes menées par des organisations pionnières, et illustrent davantage la méthode et les avantages de la mise en œuvre d’une évaluation multicritères des impacts environnementaux des organisations et de leur chaîne de valeur.
EX
EC
UTIV
E S
UM
MA
RY

Guidance on Organizational Life Cycle Assessment8
Resumen ejecutivo
Las decisiones adoptadas en las organizaciones pueden tener consecuencias tanto positivas como negativas para el medio ambiente. Teniendo esto en cuenta, diversas metodologías, herramientas y técnicas han sido desarrolladas
para evaluar y mejorar el desempeño ambiental de los productos y servicios ofrecidos por las organizaciones. Sin embargo, las iniciativas con mayor repercusión para la evaluación a nivel de organización sólo recientemente han comenzado a considerar toda la cadena de valor y la mayoría se concentran en un único aspecto, como son las emisiones de gases de efecto invernadero o el uso del agua.
La evaluación o análisis de ciclo de vida (ACV) se ha promovido como una herramienta sólida y cuantitativa, y una pieza clave en la toma de decisiones que afectan al medio ambiente. Mientras el ACV fue desarrollado originalmente para productos, los beneficios del enfoque de ciclo de vida pueden extenderse al nivel de organización, el cual puede implicar una mayor complejidad. Dentro de este contexto, la UNEP/SETAC Life Cycle Initiative lanzó el proyecto insignia “ACV de organizaciones” para explorar las capacidades y aplicabilidad del ACV de organizaciones (ACV-O). Este documento Guía es el hito principal del proyecto. Está basado en trabajos e iniciativas clave existentes, como el Greenhouse Gas Protocol, e intenta ajustarse especialmente a la ISO/TS 14072, ISO 14040 e ISO 14044; se hace referencia a ellos a lo largo de la Guía como base de las explicaciones y discusiones.
El ACV-O utiliza la perspectiva de ciclo de vida para compilar y evaluar las entradas, salidas y posibles impactos ambientales de las actividades asociadas a la organización y a la provisión de su cartera de productos. Esta metodología es capaz de responder a varios objetivos al mismo tiempo (por ejemplo, identificar puntos críticos en la cadena de valor, seguir el desempeño ambiental a lo largo del tiempo, apoyar decisiones estratégicas y facilitar información para completar los informes de sostenibilidad corporativa). Un objetivo para el cual actualmente el ACV-O no debería ser utilizado es la comparación entre diferentes organizaciones. Las afirmaciones comparativas resultantes de la aplicación del ACV-O no son rigurosas ni significativas, debido principalmente a la falta de una base consistente de comparación y por tanto no deben de ser usadas para comunicación a terceros.
El ACV-O es aplicable a organizaciones de todos los tamaños, tanto públicas como privadas, en cualquier sector, y en todo el mundo. Actualmente se están dando los primeros pasos hacia la completa aplicación del ACV-O, y sus resultados iniciales ya son utilizados para mejorar el desempeño ambiental de organizaciones. El siguiente paso debe consistir en expandir su aplicación, lo cual requiere directrices y orientaciones accesibles y prácticas.
En la Guía se describen tres modalidades que las organizaciones con experiencia previa en el uso de herramientas ambientales pueden considerar a la hora de implementar el ACV-O, ampliando así su horizonte de análisis. Además, las recomendaciones específicas para organizaciones pequeñas, medianas y grandes proporcionan una guía práctica para la aplicación de la metodología. Las instrucciones dadas para diferentes situaciones subrayan que no hay un modelo de ACV-O universal. Once casos de estudio, basados en experiencias pioneras reales, ilustran en detalle el proceso y los beneficios de aplicar un análisis ambiental multicriterio a las organizaciones y a su cadena de valor.

9Guidance on Organizational Life Cycle Assessment
执行概要
组织机构的决策可对环境造成积极或消极的影响。因此,许多的方法和评价工具被开发以供组织机构用来评价其产品与服务的环境表现,以便其做进一步的改进。然而,目前在组织机构层面的评价直到最近才开始考虑整个供应链的影响,而且大多数仍仅局限于单一的环境影响,如温室气体的排放或水资源的使用。
生命周期评价 (life cycle assessment, LCA) 作为一种科学的环境量化工具和支持环境决策的楔石正在受到推广。LCA最初仅针对产品进行评价,然而其生命周期方法的优势可延伸应用于更为复杂的组织机构层面的评价。基于此背景,UNEP/SETAC Life Cycle Initiative启动了新的研究项目“组织机构的生命周期评价”,为进一步探索研究组织机构生命周期评价方法 (organizational LCA, O-LCA) 的作用和应用。本指南是该研究项目的重要里程碑。本指南以国际现有的重要工作与标准为依据,例如温室气体议定书 (Greenhouse Gas Protocol),尤其力图与ISO/TS 14072、ISO 14040及ISO 14044保持一致。本指南引用了上述国际工作与标准,并将其作为诠释和讨论的基础。
O-LCA以全生命周期的视角对与组织机构及其所提供产品相关的活动的投入、产出及环境影响进行评价。此方法可同时适用于多种目标,如确定价值链中环境热点问题、追踪不同时期间的环境表现、支持组织机构的决策及为组织机构的可持续发展报告提供信息。目前O-LCA的目标不在于用于外部交流的不同组织间的环境表现的比较,主要由于缺乏一致的比较基础,对比论断将不科学且无意义。
O-LCA可应用于全球不同规模、公立和私立及不同产业部门的组织机构。朝向全O-LCA应用的初步试验正在进行,其结果已被应用于改善组织机构的环境表现。下一个发展目标将是扩大应用基础,为此就需要易操作、可实行的准则与指导文件。
本指南给出了三种不同的方法,描述组织机构如何在已有环境评价工具使用经验的基础上想的更为全面,并结合O-LCA。另外,针对不同规模的组织机构提供了详细并切实可行的建议。在一些情况下给出不同的具体建议强调了不存在“放之四海而皆准”的O-LCA的应用。通过十一个“先驱者”案例的实地经验,进一步阐述了在组织机构与其价值链上应用多项环境影响评价的过程与价值。
EX
EC
UTIV
E S
UM
MA
RY

Guidance on Organizational Life Cycle Assessment10
Основные положения
Принимаемые в организациях решения могут иметь как позитивные, так и негативные последствия для окружающей среды. С учетом этого, как шаг к совершенствованию, для компаний были разработаны несколько методик,
инструментов и способов оценки экологических параметров товаров и услуг. Однако, для оценки на уровне организации, большинство распространенных подходов только недавно стали рассматривать полную цепочку приращения стоимости, и в основном концентрируются на одном аспекте, например, эмиссии парниковых газов или воде.
Оценка жизненного цикла (ОЖЦ) была предложена как надежный количественный инструмент и ключевой фактор принятия экологических решений. Хотя ОЖЦ изначально разрабатывалась для изделий, преимущества подхода оценкижизненного цикла могут быть расширены на более сложные аспекты оценки организации. В этом контексте UNEP/SETAC Life Cycle Initiative запущен флагманский проект “LCA of organizations” (Оценка жизненного цикла организаций) для дальнейшего исследования возможностей и применимости оценки жизненного цикла организаций (О-ОЖЦ). Данный Руководящий документ является основным этапом проекта. Он строится на основных существующих работах и инициативах, таких как Инициатива протокола парниковых газов (Greenhouse Gas Protocol Initiative), и стремится обеспечить соответствие ISO/TS 14072, ISO 14040 и ISO 14044. Они используются в Руководстве как основа для объяснений и обсуждений.
О-ОЖЦ использует перспективу жизненного цикла для сбора и оценки исходных параметров, результатов и возможного воздействия на окружающую среду действий, связанных с организацией, и обеспечения ее линейки изделий. Эта методика позволяет обслуживать несколько задач одновременно (например, выявление экологических «горячих точек» в цепочке приращения стоимости, отслеживание экологических параметров во времени, поддержка стратегических решений и предоставление информации для корпоративной отчетности в области устойчивого развития). Одной из задач, которую О-ОЖЦ не в состоянии в настоящее время выполнить, является сопоставление различных организаций с внешним взаимодействием. Сравнительные утверждения ненадежны и несодержательны, в основном в силу отсутствия непротиворечивых оснований для сравнения.
О-ОЖЦ представляется пригодной для организаций любого размера, как государственных, так и частных, во всех секторах и по всему миру. Первые предварительные шаги к полноценному использованию О-ОЖЦ уже совершаются, и их результаты уже используются для улучшения экологических характеристик организаций. Расширение базы внедрения является следующим логическим шагом, требующим доступных практических рекомендаций и руководств.
Три различных способа описывают, как организации, имеющие предшествующий опыт использования экологических инструментов, могут использовать это, чтобы «думать шире» и интегрировать подход О-ОЖЦ. Кроме того, конкретные рекомендации для малых, средних и больших организаций обеспечивают практическое продвижение вперед. Конкретные указания даются для нескольких ситуаций, подчеркивая, что нет «универсального размера» применения О-ОЖЦ. Одиннадцать примеров, из опыта «первопроходцев», иллюстрируют процесс и преимущества применения экологической многофакторной оценки организаций и их цепочек приращения стоимости.

11Guidance on Organizational Life Cycle Assessment
EX
EC
UTIV
E S
UM
MA
RY
ملّخص تنفيذيُيمكن للقرارات التي تتخذها المؤسسات أن تترك آثاراً إيجابّية على البيئة أو أن تخلّف عواقَب سلبّية على حدٍّ سواء. وبوضع ذلك في االعتبار فقد تّم تطوير عّدة منهجّيات وأدوات وأساليب للمؤسسات
الستخدامها في تقييم األداء البيئي لسلعها وخدماتها، كخطوٍة من الخطوات التي تستهدف تحسين األداء. ومع ذلك، فبالنسبة إلى التقييم على مستوى المؤسسات نجد أّن أكثر الُمقاَربات األوسع
انتشاراً لم تَضع في االعتبار سلسلة القيمة الكاملة سوى في اآلونة األخيرة، وترّكز هذه الُطرق في األغلب على جانٍب واحد، مثل انبعاثات غازات الدفيئة أو الماء.
لقد تّم طرح »تقييم دورة الحياة« (life cycle assessment, LCA) كأداة كّمية قوية، وكحجر أساس في اتخاذ القرارات البيئية. ومع أّن أداة »تقييم دورة الحياة« قد ُوضعت أساساً لتقييم
الُمنتجات إالّ أّن فوائد الطريقة الُمّتبعة في تقييم دورة الحياة يمكن توسيعها بما يغّطي األفق األكثر تعقيداً في تقييم المؤسسات. وضمن هذا السياق، أَطَلقت »مبادرة دورة الحياة« المشتَركة بين
برنامج األمم المتحدة للبيئة (UNEP) وجمعية علم السّميات والكيمياء البيئية (SETAC) المشروَع الرئيسيَّ تحت عنوان »تقييم دورة الحياة للمؤسسات« الستكشاف إمكانيات استخدام أداة تقييم دورة
الحياة للمؤسسات (organizational LCA, O-LCA) ومدى قابلية تطبيقها على نحٍو أكبر. وتشّكل هذه الوثيقة اإلرشادّية المرحلَة البارزة الرئيسّية للمشروع. وتستند الوثيقة إلى أعماٍل
ومبادرات أساسية قائمة مثل مبادرة بروتوكول غازات الدفيئة، وتجتهد على وجه الخصوص ISO/TS لتتوافق مع معيار المواصفات الفنية الصادر عن المنظمة الدولية للمعايير رقم
14072، ومع المعيارين ISO 14040 وISO 14044. وتشير الوثيقة إلى هذه المعايير في سائر الدليل اإلرشادي كأساٍس مرجعّي للتفسيرات والنقاشات التي يستعرضها.
تستخِدم O-LCA منظوَر دورة الحياة في َجمع وتقدير الُمدَخالت والُمخَرجات واآلثار البيئية المحتَملة لألنشطة المرتبطة بمؤسسٍة ما، وأحكام محفظة ُمنَتجاتها. وُتعّد هذه المنهجية قادرة على
تلبية أغراض مستهَدفة متعّددة في آٍن واحد )ومثالً تعريف أهّم المواقع البيئية عبر سائر سلسلة القيمة، وتتّبع األداء البيئي على المدى الزمني، ودعم القرارات االستراتيجية، ومّد الشركات
بالمعلومات الوافية إلصدار تقاريرها حول االستدامة(. وهناك هدٌف ال يمكن O-LCA تحقيقه حالياً، ويتمّثل في التبادل الخارجي للمقاَرنات بين المؤسسات المختلفة. فالبيانات الجازمة الُمقاَرنة
غير قوّيٍة وبال مغزى، ويعود السبب في ذلك أساساً الفتقارها إلى أساٍس ثابت للمقارنة.
لقد تّم وضع O-LCA ضمن تصّوٍر يشمل المؤسسات من كّل األحجام، العاّمة منها والخاّصة على حدٍّ سواء في جميع القطاعات وحوَل العاَلم. ويتم حالياً اتخاذ الخطوات التجريبية األولى نحو
التطبيق الكامل O-LCA، وجاٍر فعالً استخدام نتائج هذه الخطوات لتحسين أداء المؤسسات البيئي. وتتمّثل الخطوة المنطقّية التالية في توسيع قاعدة التنفيذ، والتي تتطلّب بَدورها إرشادات وتوجيهات
متاحة وعملّية.
تصُف مساراٌت ثالث مختلفة كيف يمكن للمؤسسات التي تتحلّى بخبرٍة سابقة في استخدام األدوات .O-LCA البيئية أن تستعملها أساساً في »التفكير األكبر نطاقاً«، وأن تدمج معها مقاربًة خاصة
وباإلضافة إلى ذلك توّفر التوصيات الخاصة بالمؤسسات الصغيرة والمتوسطة والكبيرة ُطرقاً دة الَمعنّية بأوضاٍع شتى أّنه ال يوجد »حلٌّ واحٌد عملّية للمضّي قُدماً. وتبّين التوجيهات المحدَّ
مناسب لجميع الحاالت« O-LCA. وتعرُض دراسات إلحدى عشرة حالة، تستنُد إلى تجارب »المبادرين األوائل« على أرض الواقع، طريقَة وفوائَد تطبيق تقييٍم بيئّي متعّدد األثر للمؤسسات
وسلسلة القيمة الخاصة بها على نحو أوسع.

Guidance on Organizational Life Cycle Assessment12
Zusammenfassung
Entscheidungen in Organisationen können sowohl positive als auch negative Auswirkungen auf die Umwelt haben. Deshalb wurden für Organisationen verschiedene Methoden, Instrumente und Techniken entwickelt, um die
Umweltleistung ihrer Güter und Dienstleistungen zu analysieren bzw. zu verbessern. Auf Organisationsebene wird erst seit kurzem die gesamte Wertschöpfungskette betrachtet und dabei meist auch nur einzelne Umweltaspekte wie die Treibhausgasemissionen oder der Wasserverbrauch.
Die Ökobilanz (life cycle assessment, LCA) hat sich als robuste, quantitative Methode und als Schlüssel zur Unterstützung umweltbezogener Entscheidungsprozesse bewährt. Ursprünglich für Produkte entwickelt, kann ihr Lebenszyklusansatz auch auf Organisationen ausgeweitet und vorteilhaft genutzt werden. In diesem Zusammenhang hat die UNEP/SETAC Life Cycle Initiative das sog. Flaggschiff-Projekt „LCA für Organisationen“ ins Leben gerufen, um die Einsatzmöglichkeiten und Anwendbarkeit von organisationsbezogener Ökobilanz (organizational LCA, O-LCA) zu untersuchen. Der vorliegende Leitfaden ist ein Kernergebnis dieses Projekts. Er baut auf bestehenden wichtigen Arbeiten und Initiativen, wie der Greenhouse Gas Protocol Initiative auf und befindet sich im Einklang mit ISO/TS 14072, ISO 14040 und ISO 14044. Als eine Grundlage für Erklärungen und Diskussionen wird an den entsprechenden Stellen im Leitfaden auf diese verwiesen.
O-LCA nutzt die Lebenszyklusperspektive, um Inputs, Outputs und potentielle Umweltwirkungen von Aktivitäten in Zusammenhang mit einer Organisation und ihrem Produkt-Portfolio zusammenzutragen und auszuwerten. Dabei ist diese Methode in der Lage, eine Vielzahl an Zielen zu bedienen (z.B. Identifizierung von Umwelthotspots entlang des Lebenswegs, zeitliche Verfolgung der Umweltleistungsentwicklung, Unterstützung von strategischen Entscheidungen und Bereitstellung von Informationen für die Nachhaltigkeitsberichtserstattung). Ein Ziel, das O-LCA derzeit nicht erfüllen kann, sind vergleichende Aussagen zu Organisationen und deren externe Kommunikation. Es fehlt eine konsistente Grundlage, um Organisationen vergleichbar zu machen, weshalb vergleichende Aussagen weder robust noch aussagekräftig sind.
O-LCA adressiert Organisationen weltweit, jeglicher Größe, öffentliche und private sowie alle Sektoren der Wirtschaft. Erste Anwender setzen O-LCA bereits heute um und nutzen die Ergebnisse, um die Umweltleistung ihrer Organisation zu verbessern. Der nächste Schritt ist die Ausweitung der Verbreitung von O-LCA. Dafür sind einfach zugängliche und praxisorientierte Anleitungen erforderlich.
Im Leitfaden werden drei verschiedene Wege beschrieben, wie Organisationen aufbauend auf den bereits vorhandenen Erfahrungen mit einzelnen Umweltbewertungsmethoden ihren Analysehorizont erweitern und den O-LCA-Ansatz umsetzen können. Empfehlungen für kleine, mittlere und große Organisationen geben außerdem Hilfestellung für die praktische Umsetzung. Gezielte Empfehlungen für verschiedene Anwendungsfälle unterstreichen, dass es kein “Universalkonzept” für die Anwendung von O-LCA gibt. Darüber hinaus veranschaulichen elf Fallstudien von Vorreitern der O-LCA-Methode den Nutzen der Anwendung einer multi-kriteriellen Umweltbewertungsmethode für Organisationen und ihrer Wertschöpfungskette.

13Guidance on Organizational Life Cycle Assessment
エグゼクティブサマリー
組織における決定は環境に対して正と負の両面の影響を及ぼし得る。このことを踏まえ、改善に向けた一歩として組織が自身の財やサービスの環境パフォーマンスを評価するために、様々な手法、ツールや技術が開発されてきた。しかしながら、組織レベルでの評価に対して最も広く用いられているアプローチでは、最近になってようやくバリューチェーン全体が考慮されるようになり、その多くは温室効果ガスの排出や水利用など、単一の側面に特化している。
ライフサイクルアセスメント(life cycle assessment, LCA)は強力な定量的評価ツール、かつ環境側面での意思決定における要となるものして奨励されてきた。LCAは元来製品評価のために開発されたものであるが、ライフサイクルアプローチの利点は組織評価におけるさらに複雑な可能性へと広がるかもしれない。このような状況から、UNEP/SETAC Life Cycle Initiative では組織のライフサイクルアセスメント
(organizational LCA, O-LCA)の特性と適用可能性を探るために”組織のLCA”プロジェクトが立ち上げられた。このガイダンス文書は当該プロジェクトの成果の主要な到達点の1つである。本ガイダンスは既存の重要な成果や活動(温室効果ガスプロトコルイニシアチブなど)に基づいて構築されており、特に国際規格ISO/TS14072、ISO14040およびISO14044と整合するように努めている。これらはガイダンス文書全体を通して、説明や議論の基になるものとして参照されている。
O-LCAはライフサイクルの観点から、ある組織の活動に係わる潜在的な環境影響を含む総合的な視点を提供する。この手法では同時に複数の目標を取り扱うことができる(例えば、バリューチェーンにおける環境ホットスポットの特定、環境パフォーマンスの時系列での把握、戦略的な意思決定支援、および企業の持続可能性レポートの開示)。O-LCAで現在実現することのできない1つの目標は、異なる組織間の比較に関するコミュニケーションである。このような比較主張は、主に比較のための一致した基準がないため頑健性を欠き、有意義でもない。
O-LCAは世界中のあらゆる部門における、公的および私的に関わらずすべての規模の組織を想定したものになっている。完全なO-LCAの実践に向けた第一歩が現在進められており、それらの成果は既に組織の環境パフォーマンスの改善に利用されている。実践を支える土台となる事例を広げることは次のステップとして当然のことであり、それには理解しやすく実践的なガイドラインやガイダンスが必要となる。
本書では、これまでに環境管理ツールの経験を有する組織が‘大きな視点’で考えてO-LCAのアプローチを取り入れるための土台としてこのガイダンスをどのように活用するかが、3つの道筋で示されている。それに加えて、あらゆる規模の組織に向けた具体的な推奨事項は実務において進むべき道を示してくれる。また、いくつかの状況に対してそれぞれ特定の方向性が示されていることは、O-LCAの実践には“あらゆる事例に対応する唯一のアプローチ”は存在しないことを強調している。11の実践事例では、‘先発者’の実際の経験を通じた組織とバリューチェーンにおける複数の環境影響領域の評価に適用する手順と利点が描かれている。
EX
EC
UTIV
E S
UM
MA
RY

Guidance on Organizational Life Cycle Assessment14
UNEP ForewordOrganizations are increasingly recognizing that they need to understand their environmental impacts at all levels, including those throughout their value chains. Companies are engaging with partners along the entire value chain to assess opportunities for efficiency, increased competitiveness and access to new markets, as well as to strengthen their capacity to respond to risks such as those emerging from dwindling resources and climate change. Governments, too, are feeling a growing pressure to become more sustainable, either through sustainable purchasing decisions in their public procurement, or more broadly throughout their activities.
This report, Guidance on Organizational Life Cycle Assessment, is a milestone in measuring and improving environmental impacts and efficient use of resources at the organization level. It goes beyond assessing individual products, as has been done for many years, to encompassing an
organization—public or private, big or small—as a whole. The report provides guidance to organizations on understanding, quantifying and communicating the environmental footprint of their activities and those of their value chain, thus providing them with a robust basis for sustainability decision-making. Organizational life cycle assessment (O-LCA) empowers organizations to envision their sustainability strategy, steer the design of their products, and improve their processes. It enables them to play a role in supporting the shift to sustainable consumption and production patterns, and the transition to a low-carbon, resource-efficient and inclusive Green Economy.
This guidance document features 11 case studies of leading organizations that work beyond improving specific processes and products by progressively considering their whole value chains. In doing so, they have shown that life cycle assessment is an effective instrument for organizations, providing them with a sound scientific basis to underpin decisions towards sustainable consumption and production. The pioneers showcased are already reaping economic and other benefits of the life-cycle approach applied at the organizational level, for example through increased productivity and profitability by focusing their sustainability strategy where they can maximize positive change, identifying the most important potential partners within their value chains, and by communicating material and meaningful sustainability information to their stakeholders.
O-LCA is the most robust approach available to inform an organization’s sustainability strategy, and has the potential to become a reference point to strengthen the quality of information disclosed in sustainability reporting. It is a useful tool to advance the outcomes of the Rio+20 conference, such as the dissemination of corporate sustainability reporting and the promotion of sustainable consumption and production patterns.
With this publication the UNEP/SETAC Life Cycle Initiative adds to its relevant reference documents, which have contributed to raising global awareness and capacity in life cycle approaches.
Achim SteinerExecutive Director United Nations Environment Programme

15Guidance on Organizational Life Cycle Assessment
SETAC ForewordOne of Life Cycle Assessment’s strengths is its ability to be used in different applications. This guidance document expands the range of applications to include organizations and does so in a top down way – that is, not requiring an assessment of every product in the organization’s portfolio in order to create the organizational level perspective. Further, the methodology is true to the basic principles of LCA – having a clearly defined goal and scope, resulting from systematic evaluation of what questions are to be addressed. Various other core elements of LCA are also retained, such as the organizational equivalent of the product functional unit, the quantitative nature of the analysis, and the full life cycle perspective, including both the supply chain and the downstream users of the organization’s output. Such extensions from firmly rooted and validated principles add to the credibility of the methodology, despite the early stage development and the lack of a library of real world instances of use.
The authors are also careful to provide guidance on where the methodology should and should not be used – “not for publicly-available comparisons of different organizations, but rather for performance tracking and promotion of continuous improvement in efficiency and pollution reduction”. A key aspect of the statement that the methodology is not for use in publically-available comparisons is the qualifier “at this time”. This qualification suggests that, with further refinements and usage, perhaps a limited type of comparison might be possible in the future.
As a co-founding member of the UNEP/SETAC Life Cycle Initiative, the Society is committed to the development and promulgation of life cycle methods that are science-based and developed from principles consistent with the technical fundamentals of LCA. We believe that this new methodology will result in robust and useful evaluations of where incremental value-chain improvements, process pollution preventions and reductions, and customer and end-of-life contributions can be made to reduce an organization’s environmental footprint. The guidance is not hypothetical, theoretical, or conceptual but rather practicable. The approach is built upon the standard practices for conducting LCAs, which have been built up over more than 20 years, and thus should be familiar to many practitioners and prospective users.
Charles Menzie, Ph.D.Executive Director Society of Environmental Toxicology and Chemistry
FO
RE
WO
RD
S

Guidance on Organizational Life Cycle Assessment16
How to use the Guidance
Recommended itineraries. This is a comprehensive document that provides insight for more than one target audience. Table 1 provides an overview of the relevant sections for specific readers. According to their profile and goals, it is recommended
that readers consult the parts of the Guidance indicated in Table 1 as a minimum.
Type of reader
Decision maker: organization or sustainability manager aiming to use O-LCA results.Practitioner: in house or external experts applying O-LCA to an organization.Methodology developer: researcher interested in O-LCA methodology.Consumer or another stakeholder: person or institution looking for an overview of O-LCA.
1. Introduction
1.1 Context √ √ √ √
1.2 Scope of the Guidance √ √ √ √
1.3.’First Mover’ stories and reports √ √ √ √
2. Overview of organizational life cycle assessment
2.1. What is O-LCA? √ √ √ √
2.2. Organization goals of an O-LCA √
2.3 Specific situations for the implementation of O-LCA √
3. Technical framework for organizational life cycle assessment
3.1. General √ √ √ √
3.2. Definition of goal and scope √ √
3.3. Life cycle inventory analysis √ √
3.4. Life cycle impact assessment √ √
3.5. Life cycle interpretation and uncertainty √ √
4. Operationalizing organizational life cycle assessment
4.1. Specific features of O-LCA for experience-based pathways √
4.2. Simplification strategies for small and medium organizations √
4.3. O-LCA integration in management and decision systems √
5. Reporting, assurance and communication to third parties
5.1. General √ √ √
5.2. Reporting and assurance √ √
5.3. Communication √
6. Conclusions and future steps
6. Conclusions and future steps √ √ √ √
Annexes
Annex C √ √
Annex D √
DPMC
D P M C
Table 1. Reading itineraries by type of audience.

17Guidance on Organizational Life Cycle Assessment
Content of sections. A series of key guiding questions is included at the beginning of each section to support the reading, while also providing reference to the parts of the section where the issues are mainly addressed.
Boxes and reports. Throughout the Guidance, illustrative content is highlighted and separated from the main text in boxes and reports. Boxes are dedicated to additional explanations, clarifications or recommendations. Reports are summaries about specific features of the ‘First Mover’ stories included throughout the Guidance and support understanding of the main text by portraying real cases (see Section 1.3). The references used for preparing the reports are cited in Annex F.
Acronyms and Glossary. A comprehensive glossary and description of the acronyms used are listed in Annex A and Annex B, respectively.
Shall, should and may. This Guidance uses precise terminology and distinguishes between requirements and recommendations, (i.e., between the words ‘shall’, ‘should’ and ‘may’). Terminology is based on ISO/TS 14072 and ISO 14044/ISO 14040, in that order. ‘Shall’ is only used when this strength of obligation is also required in the aforementioned standard documents, while ‘should’ is used to identify recommended elements that can be disregarded with proper justification. Finally, ‘may’ is used for other allowed elements or alternatives.
Relevant documents. Documents that are repeatedly cited and used throughout the Guidance are: ISO/TS 14072 (ISO, 2014c), ISO 14040 and ISO 14044 (ISO, 2006b, 2006c, 2014c), as well as the Greenhouse Gas Protocol standards1 (WRI and WBCSD, 2004, 2011a) and the Organisation Environmental Footprint Guide2 (European Commission, 2013a). See Section 1.2.
1 For the sake of simplicity, the “Greenhouse Gas Protocol Corporate Accounting and Reporting Standard” (WRI and WBCSD, 2004) is hereafter called “GHG Protocol Corporate Standard”. Similarly, the “Greenhouse Gas Protocol Corporate Value Chain (Scope 3) Accounting and Reporting Standard” (WRI and WBCSD, 2011a) is hereafter called “GHG Protocol Scope 3 Standard”.
2 For the sake of simplicity, throughout this document it is referred to as the “OEF Guide”.
HO
W T
O U
SE
TH
E G
UID
AN
CE

18 Guidance on Organizational Life Cycle Assessment
1. IntroductionWhich approaches provide the basis
for O-LCA? Section 1.1
Why is it important to consider a life cycle perspective?
Section 1.1
What is the added value of environmental multi-impact
approaches?Section 1.1
Why is this Guidance necessary? What is the scope?
Section 1.2
Which reference documents support this Guidance?
Section 1.2
How relevant is the Guidance for organizations in developing countries
and for SMEs?Section 1.2
Are there any documented experiences of O-LCA application?
Section 1.3
CHAPTER

19Guidance on Organizational Life Cycle Assessment
1.1 Context
Human consumption of resources and the generation of pollutants have arguably surpassed rates that are physically and ecologically sustainable. All organizations have a vital role to play in efforts to reduce environmental impacts
– large corporations due to their relative share of resource depletion and polluting and toxic emissions, and small to medium-sized enterprises (SMEs) due to their collective impact. Therefore, strategic decisions with long-term implications should no longer be based merely on technical and economic considerations.
State of the art for organizational methodologies, tools and techniques
In order for organizations to take credible steps towards protection of the environment, they need stable schemes to frame their approaches. Accordingly, the 2002 World Summit for Sustainable Development in Johannesburg called for a comprehensive set of programs focusing on sustainable consumption and production (UN, 2002). Several methodologies, tools and techniques are available for organizations to assess, compare and show the environmental performance of their products, including goods and services.
At the organizational level, a referent approach for many organizations is the Environmental Management System (EMS), which could be certified by ISO 14001 (ISO, 2004a) or its European counterpart, Eco Management and Audit Scheme (EMAS), (European Commission, 2009). They are mainly procedural tools, and when including an organization ecobalance, they commonly analyze only gate-to-gate processes3. See Annex C for more detail.
Furthermore, over the past ten years, organizational environmental analysis approaches have begun to emerge. For example, carbon footprinting of corporations was proposed within the Greenhouse Gas Protocol initiative (WRI and WBCSD, 2004, 2011a) and in ISO/TR 14069 (ISO, 2013). Other examples include the Carbon Disclosure Project (CDP, 2014c), Bilan Carbone (ADEME, 2010) and DEFRA (2013). See Annex C for more detail on the most widespread approaches.
Nevertheless, the most applied and accepted frameworks and initiatives for the assessment of organizations have only recently considered the full value chain. In addition, they mostly concentrate on a single environmental aspect or indicator and, hence, have not followed an environmental multi-impact approach. It should be acknowledged, though, that these methodologies have promoted and tested, to a certain extent, the application in an organizational context.
Life cycle thinking at the organization level
Life cycle assessment (LCA) is a scientific methodology to support sustainable production and consumption patterns. LCA takes into account a comprehensive set of environmental aspects and potential impacts of a product4 over its entire life cycle (i.e., from raw material extraction through materials processing, manufacture, distribution, use, repair and maintenance, and disposal or recycling). It has been supported and promoted by the UNEP/SETAC Life Cycle Initiative, among others,
3 The revision process for ISO 14001 considers the inclusion of the life cycle approach as a future challenge. Particularly, the recommendation is to “address life cycle thinking and the value chain perspectives more clearly in the identification and evaluation of environmental aspects related to products and services”. News “ISO 14001 revision is underway”. Available at: http://www.iso.org/iso/home/news_index/news_archive/news.htm?refid=Ref1547.
4 In this Guidance, the term ‘product’ includes goods and services, according to ISO 14044 (ISO, 2006c).
CO
NTE
XT
D P M CRecommended
itineraries

20 Guidance on Organizational Life Cycle Assessment
in developed and developing countries as a robust quantitative tool for decision making by producers and stakeholders. Many private and public sector organizations – multinationals, SMEs, cities, regional governments, among others – have already committed to improve the social and environmental performance of their products by adopting life cycle approaches. Many consumers are already using life cycle information to make purchase decisions (UNEP/SETAC, 2012).
The benefits and the potential lessons from the life cycle perspective are not limited to products (Hellweg and Milà i Canals, 2014a). While the LCA methodology was originally developed for products, its application at the organizational level is becoming ever more relevant. The first efforts in the life cycle community on organizational footprinting took place in the 1990s (Taylor and Postlethwaite, 1996; Finkbeiner et al., 1998; Clift and Wright, 2000) and by input-output analysis combined along with LCA (Lave et al., 1995; Huang et al., 2009a, 2009b).
Nonetheless, the assessment for an organization is often more complex than that of products. There is more than one product life cycle to follow since most organizations are engaged in many product life cycles to different degrees (see Figure 1), many departments and business divisions may be involved, and a large part of the environmental impacts can reside outside the organization’s gate, up and down the value chain. Thus, a myriad of raw materials and intermediate products, each with different characteristics and origins, purchased by the organization for the provision of its product portfolio, may need to be evaluated. Similarly, because many different products and sectors can converge into one sole organization, the range of emissions, waste and by-products can be huge.
Recently, the European Commission launched the draft of its OEF Guide, and a pilot phase is underway (European Commission, 2013a). ISO/TS 14072 (ISO, 2014c) has been developed by the International Organization for Standardization. According to Finkbeiner and König (2013), the vast majority (27 out of 31) of the ISO 14044 requirements are basically transferable from products to organizations. Furthermore, in parallel to the development of the standard document, the UNEP/SETAC Life Cycle Initiative started the flagship project “LCA of Organizations” (see Annex E), which further explores the capabilities and applicability of LCA to organizations. This document is the main milestone of that project.
Importance of life cycle consideration
Previous discussions on the environmental performance of organizations (including activities up and down the value chain, and mostly focused on GHG emissions), revealed that ’life cycle’ resource use and emissions5 could significantly contribute to the environmental performance of organizations (Downie and Stubbs, 2011; WRI and WBCSD, 2011a). For instance, Huang et al. (2009b) estimated that indirect GHG emissions – without considering electricity – accounted for up to 75% of total direct and indirect emissions for a vast majority of businesses. Similarly, Makower et al. (2014) showed that, in many industries, only 20% of environmental impacts6 occurred in internal operations. As such, for only 4 of the 19 sectors represented, among their clients, direct impacts contributed over 40% of the total impacts. These four
5 When multiple environmental aspects are assessed, the inventory includes all the emissions to air, soil and water. Apart from emissions, impacts also stem from the consumption of resources. ’Resource use and emissions‘ is the concept proposed to include all these aspects. The term is also used by European Commission (2013a).
6 In Makower et al. (2014), the general concept ‘environmental impacts’ is used, which implies that indicators beyond GHG emissions are considered. However, the authors do not mention which specific categories are included.

21Guidance on Organizational Life Cycle Assessment
sectors are utilities, forestry and mining, oil and gas, and chemicals, which are found at the top of the supply chains of other industries (Makower, 2014). Several of the ‘First Mover’ Reports included throughout this Guidance also show the importance of indirect activities in the total impacts of an organization for different environmental indicators (see Report 8 on p.78).
Therefore, an important part of the impacts of an organization could be neglected if only a gate-to-gate perspective is considered. Focusing on internal operations is helpful and a good starting point, but it has little effect if most of an organization’s impacts occur outside the gates of the organization’s sites. Moreover, accounting only for direct impacts could hide burden shifting between different steps of the value chain. For instance, a certain technological change could reduce the consumption of water on-site, while the production of the appliances, derived from the new technology, could use a volume of water three times that of the savings at the factories of the organization. Furthermore, a holistic view may help identify the actors best positioned to implement improvement opportunities along the value chain.
CO
NTE
XT
‘First Mover’ Reports show the importance of indirect activities in the total impacts of an organization for different environ-mental indicators (see Report 8 on p.78)
Figure 1. Organizations are engaged in many product life cycles. Source: Fundación Chile.
In order to explain the reasoning behind life cycle responsibility, consider the very simplified supply chain of a restaurant that buys processed meat, which was obtained from beef cattle, poultry and pig farms. The logic of upstream responsibility is that by choosing to buy from a meat processor that buys in turn from the farms, the restaurant indirectly enables them to sell beef cattle, poultry and pig, and hence to produce, and subsequently to emit (Huang, 2009a). Hence, emissions from farming and processing, for example, by land clearing or enteric fermentation in animals slaughtered, become ‘embodied’ in the restaurant meal. A similar reasoning may be used for downstream responsibility.

22 Guidance on Organizational Life Cycle Assessment
Importance of environmental multi-impact approaches
Land, water and air are intricately involved in ecosystems and human life cycles, as well as in the life cycle of products. Decisions made in the name of protecting one of these environmental ‘media’ can result in the detriment of another, and even lead to consequences for human health (UNEP/SETAC, 2012). Therefore, while it is clearly useful to cover specific, important environmental areas such as greenhouse gases emissions or water consumption, a holistic approach is needed in order to prevent trade-offs or shifting burdens (Finkbeiner, 2013), that is, resolving one environmental problem while creating another. For example, an organization that switches from fossil to renewable materials for 25% of its raw material inputs may achieve an important reduction for GHG. However, use of land or water consumption may increase. If the latter two are not measured, the organization is unaware of the unintended consequences of its decision. Another example is the switch from coal to nuclear power, which will also reduce GHG emissions, among others, but will increase the impacts related to nuclear waste.
The ultimate aim is to reduce the impacts of the organization’s activities on all aspects of the environment, or to find an appropriate balance of impacts between those aspects. As previously mentioned, many types of resources, waste and emissions are involved in the production of an organization’s product portfolio. Therefore, to properly quantify, and ultimately reduce, the environmental impacts of the organization, it is necessary to evaluate a wide range of environmental aspects. By considering multiple impacts, companies have more angles from which to assess how their operations, performance and decisions affect different natural systems, which in turn may offer more innovative and actionable reduction solutions (Draucker, 2013).
1.2 Scope of the GuidanceThis section presents the goals of the document, the intended audience, and relevant related approaches. It also provides additional detail on the use of O-LCA by small and medium organizations and/or in developing countries.
Goals and features of the Guidance
The Guidance demonstrates that the benefits and the potential of the life cycle approach are not restricted to product assessment, and that its application to organizations is relevant, meaningful and feasible within the framework of product LCA standards. It proves that the methodology proposed here – organizational life cycle assessment (O-LCA)7 defined in Section 2.1 – has overarching benefits and possibilities for organizations to assess their performance regarding the environment, and may also be very useful for other dimensions of sustainability (see Box 1). This Guidance aims to create consistency, credibility, and facilitate an easier and more widespread application of O-LCA. It supports practitioners facing the main methodological challenges when using O-LCA to assess a multi-set of environmental impacts in organizations and in their value chain (Chapter 3).
The document is intended for organizations of all sizes, both public and private, in all economic or institutional sectors (e.g., services, manufacturing, agriculture, administration, etc.), and with diverse amounts of experience on environmental
7 Within the context of the flagship project of the UNEP/SETAC Life Cycle Initiative, O-LCA was selected as the acronym to stand for organizational life cycle assessment, consistent with other Life Cycle Initiative guidelines, although the ISO/TS 14072 does not use the hyphen (i.e., OLCA).
D P M CRecommended
itineraries
23Guidance on Organizational Life Cycle Assessment
management and assessment. The application of O-LCA can benefit from a previous application of other environmental assessment methodologies, such as product LCA, environmental management systems (EMS), or carbon accounting and reporting.
Because O-LCA can be applied in a very wide range of situations, Section 2.3 focuses on most common experience-based pathways and Section 4.2 covers applications in small and medium organizations. These sections show the possibilities of the methodology for different situations and offer a more customized approach. Wherever possible, specific notes or methodological recommendations for certain types of organization are highlighted.
To further facilitate the understanding of the content, actual case studies of organizations that have applied one of the existing organizational approaches or have developed their own schemes are presented in Section 1.3 and incorporated throughout the Guidance.
Reference documents and approaches
It has to be re-emphasized that the Guidance strives to align with ISO/TS 14072 (ISO, 2014c) and builds on the foundations of the ISO 14040 and ISO 14044 product standards. Annex D outlines the similarities and differences between product and organizational LCA.
Indeed, this Guidance is intended to be a detailed accompanying document to ISO/TS 14072, which sets the framework for O-LCA application in a concise manner – its main body is only 8 pages. Therefore, this Guidance provides more detail on the capabilities and applicability of product LCA to the new approach.
SC
OP
E O
F T
HE
GU
IDA
NC
E
Box 1. Impacts beyond environment
The scope of this publication is focused on environmental performance. Its mission, at this stage, is not to provide detailed guidance on social and economic assessment of organizations. Whereas the environmental dimension can be covered quite well today with LCA, the economic and social methodologies still require fundamental scientific progress (Klöpffer, 2008; UNEP/SETAC, 2009a). There has been much theoretical discussion and several practical attempts about how to perform social life cycle assessment (S-LCA) and life cycle cost (LCC), both focusing on product assessment. Yet few case studies applying them in a comprehensive manner are available and many methodological challenges remain unresolved. Therefore, because the maturity for the social and economic assessments is not at the same level as that of environmental LCA, economic and social dimensions were not included in the Guidance.
Nevertheless, the authors acknowledge that the use of organizational approach for LCC, and particularly for S-LCA, is a promising field to explore and develop. As stated by Jørgensen et al. (2008), social impacts are hardly determined by physical flows, but mainly by the way an organization acts toward its stakeholders. It is therefore the organization, rather than the process, which is the fundamental unit (Hauschild et al., 2008). For that reason, the use of an organizational perspective could be more appropriate and fit better with social assessments. An organization could overcome the difficulties of relating social aspects to the functional unit, if the unit of analysis is the entire organization.

24 Guidance on Organizational Life Cycle Assessment
This document, like ISO/TS 14072, does not attempt to describe in detail the aspects of O-LCA that are common with product LCA (e.g., the life cycle impact assessment step) and less so, to resolve common gaps and unanswered questions that continue to challenge the product LCA community8 Thus, O-LCA principles, requirements or guidelines that are neither specified in this Guidance nor in ISO/TS 14072 can then be considered as equivalent to those for product LCA, and therefore ISO 14040 and ISO 14044 are the documents to follow.
In addition to the ISO standard documents, this document builds on other existing internationally agreed (or at least agreed at the supranational scale) approaches, publications and standards on the assessment of the environmental performance of organizations – particularly the Greenhouse Gas Protocol standards (WRI and WBCSD, 2004, 2011a) and the OEF Guide (European Commission, 2013a). They are referred to throughout this publication, along with the ISO standard documents, as a basis for the explanations and discussions.
O-LCA mainly differs from previous LCA approaches by its object of study, the organization; from some other organization-oriented schemes by its perspective, the life cycle; and from existing value chain approaches, because it is an environmental multi-impact assessment. The OEF Guide also has the above-stated features, and in some respects can be seen as a type of organizational LCA. It has been identified, however, to be in conflict with some ‘constitutional’ requirements of product LCA standards (see Annex C), which were agreed at the international level.
This Guidance aims to be a more readable document, while strengthening the visual representation and overall understanding through the provision of examples and targeted guidance for specific situations.
O-LCA for small and medium organizations
Small and medium organizations, and particularly SMEs9, are a relevant and sometimes underestimated contributor to environmental impacts. They are individually small in size, but the collective effect of their impacts is not insignificant. For example, SMEs represent more than 90% of businesses and on average account for 50% and 60% of the gross domestic product (GDP) and employment, respectively, of all countries (UNIDO, 2006). SMEs are very often embodied in the value chain of larger organizations.
As suppliers, SMEs often produce most of the components and services needed for producing the final products sold by larger organizations. It is common that the latter set a list of specifications to which SMEs should comply while operating as a link in their product value chain. In such cases, the benefits of product LCA could be limited in the SME, which cannot decide over many aspects of the products’ specifications. Therefore, O-LCA may be a more valuable tool to apply and improve the SME’s environmental performance. In addition, in many small and medium organizations, the product and organizational level are often similar because of the limited number of goods or services in the portfolio. Thus O-LCA can easily provide insight at more than one level.
8 UNEP/SETAC (2012) and Finkbeiner et al. (2014) list some of these common limitations.
9 A SME is a category of business that falls below a certain threshold (in employees or turnover terms). Different institutions determine different thresholds, with a maximum of 250-1,000 employees and a turnover of up to €50 million. Some countries also recognize the category microenterprise as a smaller type of business category (up to 10 employees).

25Guidance on Organizational Life Cycle Assessment
One of the key problems, in general, of LCA for small and medium organizations is its complexity and costs. Also, SMEs very often do not have access to qualified personnel, technical resources or specialized consultants and are often not experienced in building relationships with different stakeholders (GRI, 2008). The authors of this Guidance expect that the collaboration across the value chain between organizations and an increased number of case studies will help overcome these barriers in the future. In order to contribute to the application of O-LCA in small and medium organizations, tailored recommendations are provided in Section 4.2.2.
O-LCA in developing countries
Nowadays, large companies very often contract suppliers in developing countries to perform intermediate operations in their value chain and to provide service to their local operations, while their products are often sold in developed countries that likely have higher environmental standards. Prompted in part by this fact, many environmental tools are being increasingly used in developing countries. In particular, many stakeholders from developing countries have expressed their interest for an organizational approach for LCA.
Currently, two of the major barriers to the use of product LCA in developing countries are the high cost of application, particularly due to data collection efforts, and the threat of being compared with other regions that use more efficient technologies (Arena, 2008; UNEP/SETAC, 2009a). O-LCA aims to overcome these barriers. On one hand, in spite of O-LCA’s complexity (Section 1.1), it provides the organization with a general picture of its environmental performance without having to perform individual LCAs for the entire product portfolio, which would clearly be a more costly approach. On the other hand, O-LCA is not envisaged for comparative assertions (see Section 2.2) but for performance tracking and for promoting continuous improvement in efficiency and pollution reduction.
SC
OP
E O
F T
HE
GU
IDA
NC
E

26 Guidance on Organizational Life Cycle Assessment
1.3 ‘First Mover’ stories and reportsAlthough complete and rigorous applications of O-LCA are not yet common practice, first practical experiences of the use of organizational approaches for the environmental multi-impact assessment of organizations and their value chain have been identified. Most of these organizations have developed their own methodology, sometimes inspired by one or more of the existing approaches described in Annex C. Some of the most recent experiences mention the ISO/TS 14072 development in their methodological background.
Box 2. Testimonials of the ‘First Mover’ stories
Strengths and opportunities of an environmental multi-impact assessment of organizations and their value chain.
Strengths
• “When it comes to the environment, we work across the whole value chain –from the sourcing of raw materials to our factories and the way consumers use our products”. Unilever
• “LCA is capable of quantifying not all, but most of the relevant environmental drivers, even on a corporate level”. Volkswagen
• “A multi-criteria approach of the group environmental impacts confirms the importance of the eco-issues (energy, water, waste and biodiversity) but also enables to identify emerging topics”. Accor
• “We understand that managing our environmental impacts does not end with carbon emissions measurement”. KPMG
• “We know we can’t do everything. So our focus is in those areas where we can have the greatest impact: sustainable agriculture and reducing the environmental footprint of our own operations”. Mondelēz International
Opportunities
• “By understanding the relative impacts of the various operations over which we ultimately have control, it enables the company to take targeted initiatives and investments into procurement, energy and process efficiency measures, product design, packaging and logistics”. Inghams
• “Corporate value chain environmental analysis is useful to ascertain the efficacy of our practices and for decision making”. Shiseido
• “Analyzing a productive site comparing the system over the years could provide a completely different and broader view of the responsibility of our own actions, and identify opportunities primarily along the value chain in search of better costs and benefits”. BASF
• “In an increasingly complex and international society, we fully realize that Colruyt Group is a link in a chain, thus our direct impact is sometimes limited. This is why we work together with other players to increase the awareness with regard to corporate sustainability. In this manner, we acquire more insight and we inspire each other”. Colruyt Group
• “Storengy early considered the results of the assessment for internal use (employees awareness, efficiency of investments decisions on the long run, strategy support based on environmental arguments, etc.) and external communication (to be defined by Storengy on a case-by-case basis)”. Storengy, a company of GDF SUEZ
• “Turning targets into public commitments helps promote changes in internal processes and encourage other organizations to follow the same path”. Natura
D P M CRecommended
itineraries

27Guidance on Organizational Life Cycle Assessment
The approaches followed by the organizations referred to throughout the Guidance in the ‘First Mover’ Reports may lead to, or be encompassed by the more comprehensive O-LCA, despite existing challenges, and illustrate how an O-LCA might look. Though they may not use the specific framework and terminology of O-LCA, the description of decisions taken in order to deal with some common O-LCA challenges may provide useful insights. Furthermore, the case studies describe how the results benefitted organizations and complemented existing environmental schemes (Box 2).
The experience of eleven organizations is summarized in one or more of the First Mover Reports. According to their relevance to the Guidance, the examples focus on specific facets to show, for instance, how to overcome a specific challenge. When available, publicly accessible information has been cited. In addition, the regions and sectors included are presented in Figure 2, while descriptions and sources of information for each organization are provided in Annex F.
As shown in Figure 2, eight different sectors are represented by the First Mover stories: hotels, food, chemicals, vehicles, energy, retail, consultancy, and cosmetics and personal care products. The selected list includes organizations from 9 countries across North and South America, Europe, Asia and Oceania. Most of them include production and/or distribution in more than one country. In fact, most of the organizations are multinational with sites all over the world. The sizes of the organizations range from 880 to 573,000 employees (see Annex F).
At this point of development, it was neither possible to identify additional examples in Asia and Africa nor for any SMEs. The list of examples is not exhaustive and the authors acknowledge the potential existence of other emerging O-LCA initiatives10. Similarly, the authors were unable to find examples referring to other types of organizations besides companies. Big companies in developed countries are pioneering more advanced and comprehensive sustainability strategies, including the application of approaches in line with O-LCA.
10 The case studies were identified through a general request made to the participants of the flagship project. Other local experts were additionally contacted in those regions that were underrepresented.
FIR
ST M
OV
ER
STO
RIE
S A
ND
RE
PO
RTS
Hotels
Food
Chemicals
Vehicles
Energy
Retail
Consultancy
Cosmetics and personal care
Figure 2. ‘First Mover’ stories: location and main sector.

28 Guidance on Organizational Life Cycle Assessment
Several names have been used to refer to the methodologies used11. Some correspond to existing approaches, like the OEF (European Commission, 2013a) or corporate value chain accounting (WRI and WBCSD, 2011a), while others terms were proposed by the case studies, such as ‘LCA conducted on enterprise level’, ‘corporate environmental assessment’, or corporate ‘value-chain environmental analysis’.
In some cases, the approximate duration of the assessment is indicated in the case studies as a measure of the efforts needed for such an approach. This information is available in some of the reports, and range between 1 and 18 months. However, this is greatly variable and cannot be directly applied to other cases. The effort required depends, among others, on the relative size of the organization, the desired detail and boundaries of the study, and particularly on the existence of previous environmental initiatives. The prior existence of research projects examining environmental indicators, the experience of the organization with environmental tools, and the availability of environmental and activity data may serve to shorten the O-LCA process. Over time, a certain learning curve may exist, so that the needed resources may decrease in subsequent iterations of the O-LCA application, though this gain in efficiency may be counterbalanced if the organization decides to extend the scope of the study.
11 The context of the terminology used by the case studies can be obtained through the information provided in the 18 reports and from the sources listed in Annex F.

INTR
OD
UC
TIO
N
2. Overview of O-LCA
What is O-LCA? Section 2.1
Why should an organization apply O-LCA? What are the potential benefits?
Section 2.2
Can O-LCA be used for comparison between organizations?
Section 2.2
Is there only a ‘one-size-fits-all’ pathway to the application of O-LCA?
Section 2.3
Can the organization benefit from previous use of environmental tools?
Section 2.3
CHAPTER

30 Guidance on Organizational Life Cycle Assessment
2.1 What is O-LCA?
According to ISO/TS 14072 (ISO, 2014c), organizational LCA or O-LCA12 is a compilation and evaluation of the inputs, outputs and potential environmental impacts of the activities associated with the organization adopting a life cycle
perspective13. The object studied in O-LCA, the organization, is described in Box 3. The organization portfolio usually includes more than one product, thus the entire set of goods and services provided by the organization are assessed at the same time.
O-LCA is a life cycle approach that aims to support the identification and quantification of environmental aspects within and beyond the gates of the organization. It takes into account all the suppliers and other partners in the value chain (from now on ‘suppliers’) associated with the provision of the organization’s product portfolio. At the same time, for all the inputs and outputs of each of these suppliers, it is necessary to consider their life cycle (e.g., O-LCA should account for all the life cycle impacts in the production of the diesel consumed by the organization’s distribution service suppliers). Furthermore, O-LCA is an environmental multi-impact approach, meaning that a comprehensive set of environmental issues relevant for the specific system are considered, and together they represent the potential environmental impact profile for the organization’s activities.
This methodology is capable of simultaneously serving multiple goals (see Section 2.2) derived from the aim of the organization. Its application is influenced and guided by the specific conditions and characteristics of the organization and relevant implementation pathway (see some example pathways in Section 2.3).
2.2 Organization goals of an O-LCA A collection of most common opportunities that O-LCA would provide an organization is presented in the following paragraphs and illustrated in Figure 3. The opportunities can be arranged in three groups, namely, analytical goals, managerial goals and societal goals. For example, consider an organization that obtains environmental performance data to support analytical goals. This provides the foundation for future strategic decisions and can support managerial goals (e.g., cost reductions, environmental communication and marketing) for which the ultimate goal is environmental performance improvement. Momentum gained on these goals can in turn encourage others, which together, foster the sustainable development of society
12 ISO/TS 14072 uses the acronym OLCA. See footnote 7.
13 Organizational LCA is essentially a methodology that includes different methods and techniques, and can be used as a tool.
Box 3. What is an organization?
According to ISO/TS 14072 (ISO, 2014c):
“An organization is a person or group of people that has its own functions with responsibilities, authorities and relationships to achieve its objectives”. The concept of organization includes, but is not limited to sole-trader, company, corporation, firm, enterprise, authority, partnership, charity or institution, or part or combination thereof, whether incorporated or not, public or private.
D P M CRecommended
itineraries
DRecommended
itineraries

31Guidance on Organizational Life Cycle Assessment
(societal goals). The described goals exhibit intra- and inter-layer connections. Other additional objectives may be identified, particularly for specific types of organizations and contexts. The opportunities highlighted in the testimonials of the First Mover stories (see Box 2, p.26) provide a sampling of the wide range of goals organizations may have for performing O-LCA. The goals of Shiseido’s corporate value chain environmental analysis are detailed in Report 1 (p.41).
Figure 3. Layers of potential goals of an organization.
Motivations for O-LCA application may differ between large and small/medium organizations, as well as between organizations from developing and developed countries. In general, they would all aim to get analytical results, though, the ultimate use of those results would expose the different drivers. For instance, large organizations may seek to document their good practices, particularly when countries with poor environmental regulation are involved as suppliers. Alternatively, suppliers applying O-LCA may be motivated by the need to fulfill the requirements and standards of a large organization buying a big share of its products.
Gain insight into internal operations and value chain
Having sufficient understanding of a system is a prerequisite to enable the design of efficient strategies that can effectively improve long term performance. O-LCA helps the organization to understand the relationship between the activities and processes involved in the entire value chain and the environmental impacts of its product portfolio. This is particularly important for large organizations that may see O-LCA as a useful tool to better understand the complexity of their operations and interactions with their supplier network.
Identify environmental hotspots
For each of the environmental categories considered and throughout the value chain, O-LCA identifies hotspots having a relevant contribution to the impacts. The hotspots may be identified at different unit levels (e.g., between inputs or outputs, processes,
OR
GA
NIZ
ATIO
N G
OA
LS O
F O
-LC
A
Show environmental
awareness with marketing purposes
Reduce operational costs
Get the basis for environmental
communication with stakeholders and
reporting
Improve organizational
procedures
Get support for strategic decisions
Analytical goals
Managerial goals
Enhance environmental tools within stakeholders
Reduce pressure on the environment
Track environmental performance
Understand risks and impact reduction
opportunities
Identify environmental
hotspots
Gain insight in internal operations and value
chain
Societal goals
The goals of a First Mover’s corporate value chain environmental analysis are detailed in Report 1 (p.41)

32 Guidance on Organizational Life Cycle Assessment
business divisions, brands, regions or facilities). Prioritizing targets is a key outcome and could, as a next step, guide the selection of the most effective interventions and the collection of more specific or better quality data for the hotspots identified (e.g., through performing subsequent product LCAs).
Understand risks and impact reduction opportunities
The organization identifies which areas are at risk and where opportunities exist for resource efficiency and emissions mitigation, regardless of whether they occur within the organization’s boundary, upstream or downstream in the value chain. The identification of trade-offs between impact categories prevents the omission of major risks and opportunities, and thus supports more informed, effective decision making. Accordingly, the holistic approach of O-LCA assists in pinpointing burden shifting throughout the value chain (e.g., through outsourcing) or from one environmental problem to another (e.g., from climate change to water consumption).
Track environmental performance
O-LCA is a very appropriate framework for tracking the environmental performance over time, both at the inventory and impact level, in a similar fashion to how organizations use financial and activity data. Performance tracking responds to multiple organizations’ necessities. For example, it helps in tracing improvements in the environmental performance of the organization in reference to a certain internal or external target.
Support strategic decision making
Understanding risks and identifying impact reduction opportunities provides a solid basis for strategic decision making at different levels, for instance on technologies, investments, and new product lines. Decisions are supported by the provision of information that reveals priority actions and targets. The ultimate actions taken over production processes may be influenced by clients’ specifications on the final products’ characteristics. Likewise, O-LCA helps the adoption of more environmentally friendly management and eco-innovation14 approaches in the organization and along the value chain. O-LCA is also a powerful scenario-building tool that can estimate possible outcomes due to different actions.
Improve organizational procedures
Increasing the knowledge and understanding of internal processes contributes to better management of operations along the value chain. For example, the development, improvement or expansion of systems for gathering and managing environmental and activity data may be encouraged by the demand for O-LCA data, which in turn benefits overall organization management control systems. Performance protocols, staff training and interdepartmental relations can similarly benefit from the application of O-LCA.
Reduce operational costs
Impact savings are sometimes associated with a reduction of operational costs, particularly when actions are focused on decreasing resource consumption.
14 According to UNEP’s definition, “eco-innovation is the development and application of a business model, shaped by a new business strategy that incorporates sustainability throughout all business operations based on life cycle thinking and in cooperation with partners across the value chain. It entails a coordinated set of modifications or novel solutions to products (goods/services), processes, market approach and organizational structure which leads to a company’s enhanced performance and competitiveness.” See more about the UNEP’s eco-innovation project at http://www.unep.org/resourceefficiency/Business/CleanerSaferProduction/Eco-Innovation/Eco-InnovationProject/tabid/106016/Default.aspx.

33Guidance on Organizational Life Cycle Assessment
Furthermore, a better insight of operations may result in improved, more efficient management, not only from an environmental point of view, but also in terms of costs. Additionally, O-LCA application and environmental actions may anticipate future costs due to upcoming regulations.
Establish a basis for environmental communication with stakeholders and reporting
O-LCA is a comprehensive source of information, which could establish the basis for the communication of the organization’s environmental performance to stakeholders, consumers, investors, authorities the general public and others, for instance, through corporate sustainability reporting (e.g., via GRI or CDP schemes (see Box 12,108)).
Large and medium organizations currently have more motivation and resources to report, particularly when they have business engagements in countries with less stringent environmental regulation. Nevertheless, some of the existing reporting initiatives are also targeting smaller organizations. In addition, O-LCA can support reporting required by regulatory authorities via the analytical data it provides. Last, O-LCA results may be used when addressing specific inquiries from outside organizations, such as clients or customers.
Show environmental awareness with marketing purposes
A specific target of environmental communication is to demonstrate the organization’s environmental awareness level and in so doing, boost their reputation with the hope of generating a competitive advantage. Clients, institutions and investors increasingly consider environmental and other sustainability aspects when selecting products or organizations. Most large corporations already use environmental assessment tools and report their impacts, thus O-LCA may be a valuable approach to stimulate quality information. Since such tools are still less common in SMEs, the application of O-LCA combined with effective communication can particularly help to differentiate from competitors.
Reduce pressure on the environment
The ultimate aim of the assessment and derived actions is to contribute to sustainable development by reducing the environmental impacts of the entire organization. The actions of the organization are geared to reduce the overall resource consumption and the emission of impacting substances, which benefits society as a whole. Indeed, such actions are in the self-interest of organizations since some of their own environmental impacts may lead to a situation that negatively affects their operations in the future, for instance, through a disruption in resource availability.
Enhance the use of environmental tools by stakeholders
While it may not be the prime objective of the organization, O-LCA may motivate stakeholders (e.g., suppliers) to apply O-LCA or other environmental tools. Because applying O-LCA requires the quantification and reporting of resource use and emissions from partners in the value chain, this process may encourage suppliers to perform their own measurements and improvements. Large organizations have more resources than small and medium ones to interact with suppliers and influence other local stakeholders.
After proper reporting and communication of the organization’s environmental awareness, it may also motivate consumers to adopt more environmental friendly
OR
GA
NIZ
ATIO
N G
OA
LS O
F O
-LC
A

34 Guidance on Organizational Life Cycle Assessment
practices. Even other competing organizations may recognize the strengths and opportunities of O-LCA or other environmental tools, so that they decide to apply them too.
In particular, assessing value chains within a globalized market may motivate SMEs in developing countries to apply O-LCA and other environmental assessment approaches and overcome existing barriers for the application of a life cycle perspective. On one hand, developing countries are involved in some way in the value chain of almost all international companies. Therefore, those international companies may support business divisions and specific sites on the measurement and assessment of environmental indicators. On the other hand, as products from companies in developing countries penetrate the market, they may be required to fulfill certain criteria that could be addressed by the application of O-LCA. It may help, for instance, with environmental requirements or certifications by organization headquarters or clients from more stringent regulation systems.
O-LCA is not intended for comparison between organizations
Despite the broad applicability of O-LCA, the comparability step is neither meaningful nor robust at this point in time, due to the lack of a consistent basis for comparison between organizations. Accordingly, ISO/TS 14072 states that O-LCA shall not be used for studies envisaged to be used for comparative assertions between organizations intended to be disclosed to the public (e.g., ranking among organizations), but rather use it to drive improvement in the given organization.
Product LCA is meant to be used to compare products providing the same function. This is useful to recall if trying to compare results for organizations. Different organizations have vastly variable product portfolios, which are the base for the definition of the unit of comparison (see Section 3.2.2). Consider, for instance, Unilever providing an enormous range of “foods, household and personal care products” or BASF including “chemicals, plastics, performance products, functional solutions, agricultural solutions, and oil & gas” in its portfolio (see Annex F). Thus, in a strict sense every organization has its specific unit of comparison.
Where two organizations operate and belong to the same sector, it would be more likely that they could have a comparable portfolio, or at least certain brands or business divisions. Thus, some evaluations, like emissions per employee for a given sector, could be claimed to be useful for some forms of decision making, but an organization has many functions and thus, if we are to compare ‘like with like’, all such functions must be taken into consideration. Even within the same sector, the size, location, product segment, vertical integration, financial transactions and overall business model can be significantly different (Finkbeiner, 2013).
Even though comparative statements are excluded in this Guidance, publicly available results could still be used by third-parties to compare between organizations. Therefore, Section 5.2 provides additional advice for publishing results externally.

35Guidance on Organizational Life Cycle Assessment
2.3 Specific situations for the implementation of O-LCA: experience-based pathwaysOne of the strengths of the methodology is that it can be applied in a broad range of situations. The sector, size and structure of an organization may determine the pathway to tackle organizational evaluation, which means there is no ‘one-size-fits-all’ application of O-LCA.
Implementation of O-LCA in small and medium organizations
This Guidance considers the complexity arising from the assessment of large organizations and a myriad of possibilities, not only due to the size, but due to sector, region and experience differences. This complexity may not apply to small and medium organizations and thus, specific notes are included throughout the Guidance to provide them with further clarity and direction. Section 4.2 also provides recommendations to facilitate the application of the Guidance by small and medium organizations.
Experience-based pathways to the implementation of O-LCA
It is quite likely that an organization applying O-LCA has previously used other environmental analysis tools. In this case, the acquired experience may ease and guide O-LCA implementation.
In the following paragraphs most common pathways that could steer an organization to conduct O-LCA are described. They consider the three main dimensions of O-LCA (see Figure 4): the organization has data for its sites (Section 2.3.2); the organization has information on the life cycle of its products (Section 2.3.3); or the organization has assessed the whole organization and value chain but only for one environmental indicator (Section 2.3.4). Needless to say, the particular pathway of an organization may be also a combination of the pathways. Because there is no unique pathway that fits every scenario, some recommendations or tips, in addition to Chapter 3, are provided for each pathway in Section 4.1.
Figure 4. Sketch of the three dimensions of O-LCA. Source: own elaboration inspired by Finkbeiner et al. (1998).
EX
PE
RIE
NC
E-B
ASE
D P
ATH
WA
YS
PRecommended
itineraries

36 Guidance on Organizational Life Cycle Assessment
2.3.1 Pathway 1: limited initial environmental experience and information
This first pathway refers to organizations that have little or no experience with environmental analysis tools, and hence have not performed comprehensive environmental assessments before. O-LCA could help establish a general conception of their environmental performance that will assist with the setting of targets, prioritization of environmental actions and continuous improvement. The analysis would identify the high-impact activities and products of their own operations and their value chain. O-LCA helps to prioritize where additional implementation of other environmental assessment tools at the organization level (e.g., EMS) or product level (e.g., design-for-environment processes) can be more valuable.
2.3.2 Pathway 2: existing environmental assessment gate-to-gate
In this pathway, organizations have already applied organizational gate-to-gate environmental approaches. Previous analyses cover all the processes that take place gate-to-gate in the organization or its production sites. O-LCA application can support the organization to identify further improvement opportunities throughout the value chain, either among suppliers, or in the use and end-of-life stages of its products.
The most common framework for on-site assessments is gate-to-gate corporate ecobalances and environmental audits, as key elements of EMS (see Annex C). Corporate ecobalances, with a gate-to-gate system boundary, are typically used to determine the environmental aspects of an organization and as baseline for improvement measures. Although the life cycle perspective is encouraged in EMS15, in most of the cases only on-site activities are assessed.
This pathway has a large potential as currently more than 300,000 organizations in some 167 countries16 have a certified EMS according to ISO 14001 (ISO, 2004a). Some of these organizations have spent several years developing their EMS, and their continuous environmental improvements on-site have already reached a high degree of maturity. Hence, additional improvements at that level may come with an unfavorable cost-benefit ratio, while there are often significant and cost-effective improvement options upstream and downstream the gates of the organization’s sites. Therefore, O-LCA can serve as a tool to complement and refresh the organizations’ EMS by providing an interface to product assessment and by broadening the horizon from on-site to value chain improvements.
In developing countries, almost 200,000 EMS were certified in 2013, thus this pathway shows significant potential for O-LCA application. China is at the top of the list with a half of those EMS certifications. Although the adoption of ISO 14001 in the remaining developing countries has not achieved the levels of more wealthy regions, the number of certified organizations is already quite significant, for instance, in Brazil, Mexico, South Africa, Egypt, Republic of Korea, Malaysia and India. Moreover, some developing countries are distinguished for their implementation progress, like Argentina, Chile, Thailand and particularly China17.
15 See footnote 3.
16 “ISO Survey 2013”. http://www.iso.org/iso/home/standards/certification/iso-survey.htm?certificate=ISO%209001&countrycode=AF.
17 Ibid.

37Guidance on Organizational Life Cycle Assessment
2.3.3 Pathway 3: existing environmental life-cycle assessment at the product level
Another pathway involves organizations that have assessed the environmental performance of a significant share of products in the portfolio and now want to assess the entire organization. O-LCA will bring a more general and comprehensive understanding of the organization’s environmental performance beyond the individual results for the products previously assessed. It will help, for instance, to identify which business divisions, brands, regions or facilities studied have major impacts, and whether internal activities – usually disregarded in product LCA (e.g., employee commuting and travel, capital equipment) – have a notable share in the performance of the organization. In addition, O-LCA can support the implementation of consistent and specific environmental strategies over different brands or business (see Annex D).
The most widely applied environmental scheme for product assessment is LCA (ISO, 2006b, 2006c). One specific application of LCA, the Environmental Product Declaration (EPD), is a standardized way of quantifying the environmental impacts of a product or system based on LCA and other relevant information, in accordance with the international standard ISO 14025 (ISO, 2006a). The overall goal of an EPD is to provide relevant, verified and comparable information about the environmental impacts of products. It is created and registered in the framework of type III environmental declaration programs, such as the International EPD® System (2014).
Similarly, simplified product LCA methodologies like carbon footprinting or water footprinting can serve as a starting point for O-LCA. They partly fall in the product LCA pathway described here and also in pathway 4, described in the following section, with regard to single environmental indicator assessments on the organizational level. For organizations starting with experience using these two tools, a hybrid approach between pathways 3 and 4 may be defined.
2.3.4 Pathway 4: existing single-indicator environmental assessment at the organizational level and including value chain
This pathway refers to organizations that have assessed the environmental performance of the organization and its value chain for a single impact category
EX
PE
RIE
NC
E-B
ASE
D P
ATH
WA
YS

38 Guidance on Organizational Life Cycle Assessment
indicator. The most well-known methodology for this type of assessment is the GHG Protocol Scope 3 Standard. There are other approaches based on this standard that assess GHG emissions and water (see Annex C). The O-LCA framework considers an environmental multi-impact assessment, which enables the identification of impacts beyond climate change or water use and can thus illuminate trade-offs between impact categories (Section 1.1). The environmental scope of the assessment in this pathway is broader, but depending on the individual organization and the overall analytical framework, the data collection procedures and tools developed for the single-indicator assessment may also be used for O-LCA. Thus, a modular expansion of the impact categories assessed is a promising solution in this pathway.
Thanks to awareness-raising and capacity building efforts in developing countries and to the pressures induced from participation in the global market, more and more organizations in developing countries are assessing their GHG emissions throughout the value chain. This has been particularly encouraged by the Greenhouse Gas Protocol initiative, which established partnership programs in countries like Brazil, China, India, Mexico and Philippines18. Advancing from GHG-based assessments including the value chain, developing countries could follow recommendations in pathway 4 as the basis for O-LCA application.
2.3.5 Other pathways
Apart from the four pathways described above, organizations may also build on the knowledge and data acquired from other environmental analysis tools. They are presented separately because, despite their potential, it is difficult to picture a unique pathway and set appropriate recommendations.
Resource Efficient and Cleaner Production
If organizations have performed comprehensive assessments within the framework of Resource Efficient and Cleaner Production (UNEP, 2014), it may also facilitate the application of O-LCA. UNEP (2014) describes it as a preventive approach to environmental management that refers to a mentality of how goods and services are produced with the minimum environmental impact under present technological and economic limits, without denying growth. Comprehensive assessments mean that significant environmental data (e.g., resource consumption, emissions to air, water, or land) has been collected on-site as a first step toward selecting best management options, and can support O-LCA in a similar way to pathway 2.
Corporate reporting
Another common source of environmental insight is the application of voluntary sustainability reporting schemes, like CSR, GRI, CDP, etc. (see Box 12, p.108). Sustainability reporting may support, for instance, a first description of organization’s units, main emissions and resources. The organization may already have preliminary data for one or more indicators mainly at the inventory and gate-to-gate level, and/or a picture of the stakeholders inside and outside the organization’s gates. Sustainability reporting may have even integrated results from assessments obtained with some of the environmental tools described in the pathways. It should be noted that these reporting schemes are usually implemented by different departments or business divisions than those devoted to operational management, which are more likely to be responsible for O-LCA application.
18 “Programs and Registries of the GHG Protocol”. http://www.ghgprotocol.org/programs-and-registries.

3. Technical Framework for O-LCA
Which elements are to be considered within the goal and scope definition?
Section 3.2
Can the organization start by setting a pilot division, facility or region?
Section 3.2.1
Are all the jointly owned operations of the organization included?
Section 3.2.1
Which is the reference to compare between years? How to define it?
Section 3.2.2
How should the organization decide which steps of the value chain to consider?
Section 3.2.3
Is offsetting considered within the O-LCA framework?
Section 3.2.3
Which types of activities or processes are to be taken into account?
Section 3.3.1
Should the organization model include absolutely all the activities?
Section 3.3.2
What is the procedure to collect the environmental data?
Section 3.3.3 Section 3.3.5
How should the organization deal with data from suppliers supplying to multiple clients?
Section 3.3.4
Which types of environmental indicators are recommended?
Section 3.4
Are there recommendations for interpreting the study results and how do the decisions taken in the previous phases affect them?
Section 3.5
CHAPTER

40 Guidance on Organizational Life Cycle Assessment
3.1 General
In this chapter, the four methodology phases (goal and scope of the study, inventory analysis, impact assessment, and interpretation) are presented and detailed. The methodological challenges encountered when LCA is applied to organizations are
explained in detail.
As previously mentioned, for the steps or requirements that are not specified or modified either in this Guidance or in ISO/TS 14072 (ISO, 2014c), product standards apply (i.e., ISO 14040 and ISO 14044). Other international reference guides and reports providing more detail in the application of LCA19 and organizational value chain approaches20 can also assist on steps not broadly explained in this chapter.
3.2 Definition of goal and scopeGoal and scope definition is the first phase of an O-LCA. These shall be clearly stated and consistent with the intended application. The goal and scope greatly determine the subsequent phases of O-LCA, and due to the iterative nature of the methodology, they may have to be refined during the study.
Goal of the study
The first step of an O-LCA is to describe the goal of the study. Why is an O-LCA being conducted? What question(s) are we trying to answer? Who will use the results? What do we want to assess? The goal definition must be clearly specified because it is decisive for all the phases of O-LCA that follow. Furthermore, in defining the goal of the study, ISO/TS 14072 requires to unambiguously state that the results are not intended to be used in comparative assertions intended to be disclosed to the public.
An O-LCA could be undertaken to, for instance, identify impact reduction opportunities along the value chain, performance tracking over time, or improving knowledge, control, management and transparency of operations involved in the portfolio provision. The most common goals that may lead an organization to perform an O-LCA are detailed in Section 2.2. Box 2 (p.26) lists some of the O-LCA strengths and opportunities highlighted by the First Mover stories. Report 1 (p.41) provides additional detail for one of these stories.
Scope of the study
The next step is to define what is going to be analyzed and how (i.e., the scope). In an O-LCA study, the scope should be unique and sufficiently well-defined to ensure that the breadth, depth and detail of the study are compatible and sufficient to address the stated goals (ISO, 2006b). Practitioners should be sure to adequately describe the organization under study, the limits placed on the organization’s life cycle (which ideally are equivalent to the border between economy and nature), from where the data will be coming and the quality required, how information will be handled, and other scoping decisions. The definition of goal and scope of a First Mover story is presented in Report 3 (p.52).
19 See the several reports available from the website of the UNEP/SETAC Life Cycle Initiative (UNEP/SETAC, 2014) and the “ILCD Handbook” collection (European Commission, 2010b).
20 See the “Organisation Environmental Footprint (OEF) Guide” (European Commission, 2013a), ISO/TR 14069 (ISO, 2013) or the “Corporate Value Chain (Scope 3) Accounting and Reporting Standard” (WRI and WBCSD, 2011a).
The definition of goal and scope of
a First Mover story is presented in
Report 3 (p.52).
Report 1 (p.41) provides an example
of the goals that lead a First Mover to
perform an O-LCA.
D P M CRecommended
itineraries
P MRecommended
itineraries

41Guidance on Organizational Life Cycle Assessment
Shiseido group, a cosmetics and personal care products company, lives on its mission “We cultivate relationships with people. We appreciate genuine, meaningful values. We create beauty, we create wellness”. Accordingly, Shiseido aims to provide goods and services that support the beauty and wellness of people within sustainable thinking. Some early examples of its commitment to sustainability are the re-fill products or the gradual switch to green-polyethylene in packaging. Moreover, Shiseido recently carried out an assessment for Japanese business to evaluate its GHG emissions and water consumption through the value chain.
Corporate value chain environmental analysis was applied to discover hotspots, cost reduction opportunities and business risks of current Shiseido activities. It was useful to ascertain the efficacy of Shiseido practices and for decision making by a combination of product LCA and organizational perspective. Furthermore, Shiseido meant to fulfill international commendation, particularly for big companies, to collect, measure, manage and disclose information about environmental burdens throughout their value chain. Shiseido decided not to use the approach to compare the results with other organizations
because of its high uncertainty.
Shiseido focused on the two categories GHG emissions, due to the global concern about climate change, and water consumption because of their materiality for the sector. Identifying which were the most effective actions to optimize water use within value chain activities was essential for Shiseido. Personal care products and cosmetics rely on many kinds of raw materials made from plants, which are dependent on sustainable water use.
Another important goal for Shiseido was to have an efficient and time-saving solution for environmental data management. Therefore, as a result of the analysis, Shiseido is now developing an original environmental data management system, named CLIC (Calculator of Life cycle Inventory for Corporate). CLIC powerfully supports Shiseido to easily calculate and update GHG emissions and water consumption of the organization. CLIC tallies up LCI data – from products, suppliers, manufacturing and sales, along with secondary data – in one click. In parallel, a derived calculator has been also created for products, named CLIP.
Report 1. Shiseido: Goals for corporate value chain environmental analysis
DE
FIN
ITIO
N O
F G
OA
L A
ND
SC
OP
E

42 Guidance on Organizational Life Cycle Assessment
The following elements (adapted from ISO/TS 14072) shall be considered and clearly described in the scope definition:
• Organization to be studied (Section 3.2.1);
• Products, operations, facilities and sites of the organization included in the reporting organization21 (Section 3.2.1);
• The reference period considered (Section 3.2.1);
• Reporting flow (Section 3.2.2);
• System boundary22 (Section 3.2.3);
• Allocation procedures (Section 3.3.4);
• Impact assessment methodology and types of impacts (Section 3.4);
• Interpretation to be used (Section 3.5);
• Data and data quality requirements (Section 3.3.5);
• Assumptions;
• Value choices and optional elements;
• Limitations;
• Type of critical review, if any (Section 5.2); and
• Type and format of the report required for the study (Section 5.2).
3.2.1 Reporting organization
The primary purpose of the reporting organization in O-LCA, an element comparable to the ‘functional unit’ in product LCA, is to define the unit of analysis. The reporting organization shall be consistent with the other elements of the goal and scope of the study and be clearly defined and measurable (ISO, 2014c). Therefore, the following items should be defined:
• Name and description of the organization or subject of study (e.g., business divisions, brands, regions or facilities involved) (Sub-section A);
• Definition of the consolidation method (Sub-section B); and
• Reference period. See Sub-section C.
The first two items answer the question: who is the organization under study? The consolidation method selected affects the definition of the subject of study. At the same time, the consolidation is only applied over the subset of the organization considered in the study. Therefore, Sub-sections A and B are interconnected and should be considered at the same time. The last item reports when the assessment of the organization was conducted.
21 As described in Annex D, for this Guidance, the concepts ‘reporting organization’ and ‘reporting flow’ are together equivalent to ‘reporting unit’ in ISO/TS 14072 (ISO, 2014c). ‘Reporting organization’ is the definition of ‘reporting unit’ and ‘reporting flow’ is its quantification.
22 ‘System boundary’ sets the limits of the study and includes all the direct and indirect activities. The authors initially preferred the term ‘organization system boundary’ as the O-LCA equivalent to ‘product system boundary’, but was changed so as to avoid confusion with the term ‘organizational boundaries’ (e.g., used in the GHG Protocol Corporate Standard), which only makes reference to operations owned or controlled by the ‘reporting organization’.

43Guidance on Organizational Life Cycle Assessment
A. Subject of study
Although this Guidance recommends and encourages full organizational assessment, the definition of organization by ISO/TS 14072 (Box 3, p.30) does consider different levels of assessment. O-LCA may focus on either the organization as a whole or portion thereof, for instance business divisions, brands, regions or facilities. The organization considered may not necessarily be a legal entity. In Figure 5, an imaginary example for a producer of snacks and drinks is illustrated. Each dot represents one facility, with different shapes for each brand. Four subsets of the organization that would potentially come under consideration are proposed: the whole organization, a brand, a business division and a region.
One common scenario is an organization that plans to do a complete O-LCA in the future but wants to start with a pilot assessment. Transparent criteria should be used to select the pilot case, for instance, according to previous product LCA studies or based on hotspots analysis results, the availability of data, legal compliance issues, etc. Another scenario is an organization producing at essentially independent sites for diverse sectors. For instance, a company that produces chemical and food products would more than likely have separate production lines and sites involved; indeed most of the suppliers may be different. The different sectors may have very distinct operations and thus offer very different impact reduction potential. An assessment carried out on a subset of an organization is described in Report 2 (p.44).
The subset or segment selected should represent a clear unit of operation (e.g., business divisions, brands, regions or facilities). Deliberate exclusion of subsets because of their expected performance (e.g., particularly polluting or controversial facilities) is discouraged. Justification for the subset selection should be reported transparently, particularly if results are intended to be disclosed to the public. In the case that different subsets of an organization are assessed separately, aggregation of the respective results should be done with care in order to avoid double counting or gaps.
Business division FOOD: Brand ChocoSnacks Brand ChipsSnacks Brand PastriesSnacks
Business division DRINKS: Brand CoffeeTime Brand SoftDrinks
The whole company Delicious Snacks LLC
Brand ChocoSnacks in South America
Business division DRINKS Asia region
Segments of the company Delicious Snacks LLC:
Figure 5. Simplified organization structure and example of potential subsets to be assessed.
DE
FIN
ITIO
N O
F G
OA
L A
ND
SC
OP
E
An assessment carried out on a subset of a First Mover is described in Report 2 (p.44).

44 Guidance on Organizational Life Cycle Assessment
A few years ago, the chemical company BASF decided to promote sustainable management and education for sustainability in its production units at the Brazilian locality of São Bernardo do Campo through a project named “Demarchi+Ecoeficiente”. The project identified critical issues and improvement opportunities. The first edition compared the industrial complex performance for 2010 and 2011 and was carried out over 8 months. A second edition, which added results for 2012, built on the initial experience and was completed in only 7 months. The milestones of the project are explained in Report 16 (p.99).
Pioneering project
This initiative focused on a subset of the BASF corporation – the industrial complex in the Demarchi neighborhood (São Bernardo do Campo) – that includes seven production plants mainly dedicated to paints and varnishes production. The complex is internationally recognized for its operational excellence and is aligned to the global strategy of BASF. It was targeted to be a pilot project to provide momentum for replication in other sites of the organization.
Scope for the environmental assessment
LCA was applied as the primary assessment methodology. The reference unit was 1 ton of finished product taking into account the portfolio mix and proportions of the Demarchi industrial complex. The study considered the volume of finished products classified as shipped.
The analysis included the elementary processes that work together in the production of intermediate products, which in turn, serve as inputs for the subsequent processes producing the finished goods. In so doing, the study evaluated the impact
of the whole Demarchi production and the contribution from each production unit. The cradle-to-gate boundary is consistent with the goal to only evaluate the production system, and includes neither capital equipment nor subsidiary activities (e.g., canteens).
The principal source of primary data was the Annual Production Report, which is extracted from BASF’s own data processing system and contains the amount, volume and cost of all raw materials consumed on-site. From the complete list of raw materials, those with lower mass representativeness for the whole complex (<0.3%) and for each production unit (<1%) were disregarded. After this cut-off stage, the list was amended according to price and dangerousness. Secondary data (e.g., technical literature, research reports and LCA databases) was also used.
Environment and other indicators
Two flows – raw materials and energy consumption – and five impact categories – depletion of natural resources, cumulative energy consumption, human toxicity potential, land use, and an aggregated impact category called emissions – were considered. The emissions indicator includes gaseous emissions (divided into the categories global warming potential, photochemical ozone creation potential, ozone depletion potential, and acidification potential), liquid emissions (i.e., volume of wastewater), and solid emissions (i.e., the inventory flow waste generated). The potential of accidents and occupational health issues was also analyzed. In an upcoming evaluation for the year 2013, the indicator water footprint has also been added. The results were normalized with respect to current situation in Brazil – and the observed importance (relevance factor) was used in the grouping of the impact categories.
Report 2. BASF: Demarchi, a pioneering site at the company strategy

45Guidance on Organizational Life Cycle Assessment
B. Consolidation method23
In the case of local organizations, they are often the reporting organization per se. Yet, in the case of bigger and more complex organizations, the subject responsible for the environmental impacts is usually ambiguous, and thus needs to be determined. This shall be done through the definition of the consolidation methods, which will assist in representing the structure of the organization and its relationships with other organizations.
Operations vary in their legal and organizational structure. As listed by WRI and WBSCD (2004), they include wholly-owned operations, incorporated and non-incorporated joint ventures, subsidiaries, and others. If the organization has jointly-owned operations, the operations considered within the reporting organization differ depending on the consolidation method used. The organization shall consolidate all its units or parts (e.g., business divisions, brands, facilities) by one of the following approaches (WRI and WBCSD, 2004; ISO, 2013, 2014c):
• Control: the organization includes units over which it has control. Control can be defined in either financial or operational terms:
• The organization has financial control over a unit if the former has the ability to direct the financial and operating policies of the latter with a view to gaining economic benefits from its activities.
• The organization has operational control over a unit if the former or one of its subsidiaries has the full authority to introduce and implement its operating policies at the operation.
• Equity share: the organization includes units according to its share of equity interest (i.e., according to the organization’s percentage ownership of each of the units).
When equity share is selected, only a part of a certain business division, brand, or facility may be included in the reporting organization of the study. Under the financial or operational control approach, an organization accounts for 100% of the impacts from units over which it, or one of its subsidiaries, has operational or financial control (WRI and WBCSD, 2004). The percentage of ownership or control by the organization over the units involved shall be used to distribute the impacts corresponding to each of those units.
If the organization wholly owns and controls all its units, the reporting organization will be the same, regardless of the approach used. If this is not the case, many permutations are possible. Considering the diagram in Figure 6, Division II is financially and operationally controlled by the reporting organization, and the latter has 25% of the shares of the former. Hence under the control consolidation methods, the entire (100%) Division II is included in the reporting organization, while with the equity share approach, only 25% of Division II is considered. To take another example, Division V is 50% owned by the reporting organization but the latter has neither financial nor operational control. In this case, either 50% or 0%, respectively, of Division V is included in the reporting organization when an equity share or control approach is applied, Finally, when a unit is operationally controlled
23 It should be acknowledged that in other reference documents, consolidation methods are described during the definition of the boundaries (e.g., GHG Protocol Corporate Standard and ISO/TS 14072). However, consolidation methods have an effect on both the system boundary and the definition of the reporting organization. Therefore, in this Guidance, the authors have defined consolidation methods when describing the reporting organization, in order to ensure consistency. This is not in real conflict with ISO/TS 14072 (ISO, 2014c), but a matter of order on the introduction of the concepts.
DE
FIN
ITIO
N O
F G
OA
L A
ND
SC
OP
E
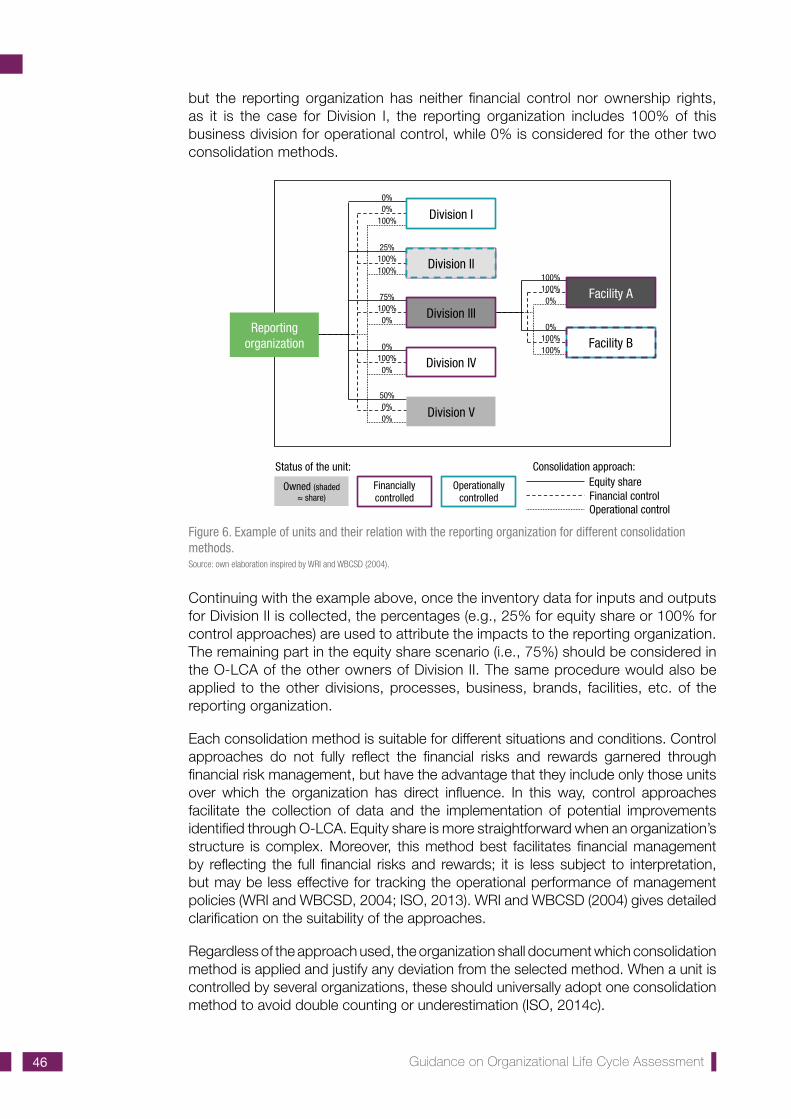
46 Guidance on Organizational Life Cycle Assessment
but the reporting organization has neither financial control nor ownership rights, as it is the case for Division I, the reporting organization includes 100% of this business division for operational control, while 0% is considered for the other two consolidation methods.
Continuing with the example above, once the inventory data for inputs and outputs for Division II is collected, the percentages (e.g., 25% for equity share or 100% for control approaches) are used to attribute the impacts to the reporting organization. The remaining part in the equity share scenario (i.e., 75%) should be considered in the O-LCA of the other owners of Division II. The same procedure would also be applied to the other divisions, processes, business, brands, facilities, etc. of the reporting organization.
Each consolidation method is suitable for different situations and conditions. Control approaches do not fully reflect the financial risks and rewards garnered through financial risk management, but have the advantage that they include only those units over which the organization has direct influence. In this way, control approaches facilitate the collection of data and the implementation of potential improvements identified through O-LCA. Equity share is more straightforward when an organization’s structure is complex. Moreover, this method best facilitates financial management by reflecting the full financial risks and rewards; it is less subject to interpretation, but may be less effective for tracking the operational performance of management policies (WRI and WBCSD, 2004; ISO, 2013). WRI and WBCSD (2004) gives detailed clarification on the suitability of the approaches.
Regardless of the approach used, the organization shall document which consolidation method is applied and justify any deviation from the selected method. When a unit is controlled by several organizations, these should universally adopt one consolidation method to avoid double counting or underestimation (ISO, 2014c).
Division I
Division II
Division V
Division IV
Facility A
Facility B
Division III
Owned (shaded ≈ share)
Operationally controlled
Financially controlled
Status of the unit: Consolidation approach: Equity share Financial control Operational control
25% 100% 100%
0% 0%
100%
75% 100%
0%
0% 100%
0%
50% 0% 0%
100% 100%
0%
0% 100% 100%
Reporting organization
Figure 6. Example of units and their relation with the reporting organization for different consolidation methods. Source: own elaboration inspired by WRI and WBCSD (2004).

47Guidance on Organizational Life Cycle Assessment
C. Reference period
It is necessary to set the reference period (i.e., the specific time period for which the organization is being studied), as the results are valid for that period. Reference period is recommended to be one operation cycle of the organization, and in accordance to financial and other reporting schemes, one year is the preferred option. Other periods may be considered if properly justified (e.g., in the case of seasonal services).
3.2.2 Reporting flow
The reporting flow is a measure of the outputs of the reporting organization. It is a quantitative amount and constitutes the basis for completing the inventory of O-LCA. The reporting flow links the different units in the value chain with the portfolio of the reporting organization. According to the OEF Guide (European Commission, 2013a) reporting flow should answer the questions What? How much? How well? How long? See Box 4 for more discussion regarding the two latter questions.
The most common way to define the reporting flow is to refer to the nature and amount (i.e., What? How much?) of the organization’s product portfolio provided over the reference period. The amount of products can be quantified per unit (e.g., number of jeans or skirts produced by a clothing manufacturer, or number of patients attended to in a hospital), per weight (e.g., kilograms of steel, iron and aluminum provided by a metal producer), or per volume (e.g., liters of milk produced by a farmer). Matching the reporting flow definition with existing records in the reporting organization’s management control system can ease the adoption of O-LCA. If a very detailed portfolio is available, the organization may use it, otherwise, representative products of the clusters in the portfolio are to be contemplated (see for instance Report 5 on p.67, Report 7 on p.75, and Report 17 on p.100).
An organization may also define its portfolio in non-physical terms, such as economic revenue and number of employees. It could be very useful, for example, in organizations providing a very wide portfolio of products, to aggregate them in a unique figure. However, monetary value might not always adequately mirror the physical realities because prices depend on non-physical parameters and vary over time. The number of employees indicator does not allow measuring efficiency improvements over time.
One special case is organizations with product portfolios that change dramatically over time (e.g., agricultural producers using crop rotation or organizations providing customized products on demand). In such cases, one option would be to compare time periods with similar product portfolio characteristics. However, if continuous performance tracking is intended, the use of parameterized data sets or even system models can provide quantitatively usable information over time.
Finally, for many organizations that provide services or social functions, the identification and quantification of the reporting may be particularly challenging. An example is a consultancy providing expert or professional advice services, for which it is difficult to define and quantify the products sold. Here, the reporting flow could be quantified, for instance, in economic terms, in the number of hours of advice provided, or per number of employees. Another related challenging situation is for organizations selling very client-specific products, as the aggregation into categories of products may not be meaningful.
An organization may use an existing detailed portfolio or representative products of the clusters in the portfolio (see, for instance, Report 5 on p.67, Report 7 on p.75, and Report 17 on p.100).
DE
FIN
ITIO
N O
F G
OA
L A
ND
SC
OP
E

48 Guidance on Organizational Life Cycle Assessment
Box 4. Quality and durability of the products in the portfolio
Answering the questions How long? and How well? during the characterization of the reporting flow of an organization that provides more than a few products can be particularly challenging.
During performance tracking, a quality and/or durability indication may be critical to the interpretation of the results. One example of their relevance is when a product in the portfolio is re-designed for improved durability or performance. A possible consequence of this may be more intensive energy or resource consumption during manufacturing stage, on per unit basis. If only the type and number of products produced are considered (What? and How much?) in the study, performance tracking might show an increase in the environmental impacts, but would not reflect any long-term benefits of the measure.
Ideally, the level of performance (How well?) for each of the products in the portfolio should be stated (e.g., in the case of paint, the thickness of the layer when applied to a wall of certain characteristics), as should its life span or durability under standard conditions (How long?). These parameters are even more difficult to quantify for services and for a broad product portfolio. Quality and durability, both for goods and services, can be reflected by economic revenue, since product price is often an indicator of its quality/durability. However, the use of economic data introduces more uncertainty into the results.

49Guidance on Organizational Life Cycle Assessment
3.2.3 System boundary
Organizations are ultimately embedded in networks of social, financial and physical relationships (Figure 7). It is therefore necessary to establish boundaries that formally define which of these relationships will be considered in the study, and which will be disregarded. As previously mentioned, the resource use and emissions linked to processes upstream (e.g., goods and services purchased by the reporting organization) or downstream (e.g., linked to the distribution and end-of-life of the products) can be as, or more, determinant of the overall environmental profile of the reporting organization than ones occurring within the reporting organization (Pelletier et al., 2013).
As defined by ISO 14044 (ISO, 2006c), the system boundary in product LCA is “a set of criteria specifying which unit processes are part of a product system and thus determine which processes shall be included within the LCA”. As in product LCA, the use of LCA databases in O-LCA expands the processes and tiers considered beyond the system boundary, though in a rough form and using generic data. The main requirements of system boundary definition in LCA apply for O-LCA, although some specific requirements and recommendations are presented below.
Figure 7. Simplified example of supplier tiers in the value chain of an organization.Source: own elaboration based on GRI (2005).
A. Requirements and guidelines for system boundary definition
According to ISO 14044, system boundary shall be documented and justified in accordance with the goal and scope of the study. An organizational chart or diagram can show the reporting organization’s operations, value chain, and their inter-relationships. The complete life cycle covering all inputs and outputs related to the reporting organization’s activities shall be considered and disclosed, with justification
Logistics
Supplier
Supplier
Supplier Supplier
Material producer
Supplier
Material producer
Distributor
Retailer Retailer Consumer
Consumer
Consumer
Consumer
Upstream
Downstream
REPORTING ORGANIZATION
DE
FIN
ITIO
N O
F G
OA
L A
ND
SC
OP
E
Weak
Strong
Strong
Influence
Weak

50 Guidance on Organizational Life Cycle Assessment
for any exclusion. Therefore, system boundary shall be defined to include direct as well as indirect resource use and emissions (see Section 3.3.1). The former occur within the reporting organization, while the latter take place throughout the value chain linked to organization’s activities (Box 5). Moreover, supporting activities should be included (e.g., marketing, stock storage, research and development, heating at the offices, etc.), see Section 3.3.1.D.
Organizations usually face choices on how many levels upstream and downstream from which they should obtain data. Ideally, the entire value chain should be analysed, but resources and data availability can pose a challenge. Considering the complex interdependence of processes in modern economies and the high degree of complexity of international value chains, it would be fair to assume that in general all sectors are directly or indirectly connected. Therefore, including the ‘entire’ value chain would often mean spanning the global economy (Suh et al., 2004). Section 3.3.2 is devoted to help prioritize the activities to be included in the study and those activities deserving better data quality.
B. Boundary for the entire or for a subset of the organization
As explained above, an organization may be interested in assessing the entire organization or a subset (see Sub-section 3.2.1.A). The system boundary should be defined according to the reporting organization. Figure 8 presents three potential subsets for a simplified organization: differences are shown in the delimitation of the system boundary and for the two approaches cradle-to-grave and cradle-to-gate.
When the reporting organization is the organization per se, the two entire Facilities I and II are considered (Figure 8a), and all the related upstream and downstream processes are involved. However, the entire value chain of the organization is not included if only a subset is assessed. In the example of Figure 8b, only two of the production lines in Facilities I and II produce the selected brand (Product B and B’), thus the product line A and associated value chain are out of the scope. Similarly,
Box 5. Direct and indirect resource use and emissions
Resource use and emissions (to air, water and soil) are divided into direct and indirect (WRI and WBCSD, 2004):
Direct resource use and emissions are those from sources that are owned or controlled by the reporting organization.
Indirect resource use and emissions are consequence of the activities of the reporting organization, but occur at sources owned or controlled by another organization or the consumer (upstream or downstream).
Direct resource use and emissions are those considered in scope 1 for the GHG Protocol Corporate Standard (see Annex C), while scope 2 and 3 are together equivalent to the indirect resource use and emissions in this Guidance. Several initiatives are working on the definition of the three scopes, particularly scope 2, for other environmental aspects apart from GHG emissions (see for instance Draucker (2013)). Braunschweig (2014) defines power production, waste and waste water treatment as potential activities to be considered in scope 2 for all impact categories, because these are standard infrastructures used by society to support economic activities.

51Guidance on Organizational Life Cycle Assessment
when Facility II is the subject assessed (Figure 8C), product line A and associated value chain are also excluded, and Facility I is merely a supplier of the reporting organization for Product B and B’.
C. Cradle-to-gate or cradle-to-grave assessment
A complete cradle-to-grave assessment of an organization should include the resource consumption and emissions of the use phase and the end-of-life phase (i.e., waste disposal and treatment) of products sold by the reporting organization in the reference period (see Figure 8) (ISO, 2014c).
Nevertheless, modeling the downstream activities is not always feasible. Calculating input and outputs for the use phase typically requires product design specifications and
DE
FIN
ITIO
N O
F G
OA
L A
ND
SC
OP
E
Raw materials Production Use End of life
Product life cycle
Organization boundaries
Operational boundaries
PRODUCT A
Raw materials Production Use End of life
PRODUCT B
Other activities
FACILITY II
Cradle-to-gate ORGANIZATION
Cradle-to-grave
The boundaries of the organization are including the
entire organization
FACILITY I
Other activities
Raw materials Production Use End of life
PRODUCT B‘
Production
Production
Raw materials Production Use End of life
PRODUCT A
Raw materials Production Use End of life
PRODUCT B
Other activities
Cradle-to-gate BRAND
Cradle-to-grave
The boundaries of the organization are restricted to a
brand
FACILITY I
Other activities
Raw materials Production Use End of life
PRODUCT B‘
Production
Production
Product life cycle
Operational boundaries
Organization boundaries
FACILITY II
Raw materials Production Use End of life
PRODUCT A
Raw materials Production Use End of life
PRODUCT B
Other activities
Cradle-to-gate FACILITY Cradle-to-grave
The boundaries of the organization are restricted
to one facility
FACILITY I
Other activities
Raw materials Production Use End of life
PRODUCT B‘
Production
Production
Product life cycle
Operational boundaries
Organization boundaries
FACILITY II
Product life cycle
Reporting organization
System boundary
(8a) The reporting organization is the entire organization
(8b) The reporting organization is one brand
(8c) The reporting organization is one facility
Figure 8. Reporting organization and corresponding system boundary.
52 Guidance on Organizational Life Cycle Assessment
assumptions about how consumers use products. Similarly, end-of-life assessment involves being informed about the final fate that users or waste managers give the product.
In accordance to ISO/TS 14072 (ISO, 2014c), downstream activities should be included if products directly consume energy or generate emissions during use phase (e.g., automobiles, aircraft, power plants and buildings) or indirectly consume energy or cause emissions during use (e.g., apparel that requires washing and drying, food that requires cooking and refrigeration or soaps and detergents that require heated water).
If the organization has no influence on the use and end-of life stage of its products (e.g., via product design or recycling campaigns), it may select the cradle-to-gate perspective, (i.e., up to the gate of the reporting organization), thus downstream stages are excluded. The latter situation is quite common for raw materials and intermediate products. In Figure 8, both a cradle-to-gate and cradle-to-grave24 boundary are defined for the three simplified subjects of study (Sub-section 3.2.1.A).
D. Offsetting
According to the GHG Protocol Corporate Standard (WRI and WBCSD, 2004), offsets are discrete GHG emission reductions used to compensate for resource use
24 Another additional but theoretical alternative is the cradle-to-cradle approach, which considers a circular system where resources are tightly linked to EoL of products (i.e., a system that is not only efficient but also essentially waste free). Although a complete cradle-to-cradle is not achievable, mainly due to the Laws of Thermodynamics, circular economy and reverse logistics (Ellen MacArthur Foundation, 2014) are using the concept for promoting a change of behavior in industrial and human systems.
Report 3. Accor: Goal and scope definition for Accor’s environmental footprint
The hotel group Accor performed its environmental footprint in 2011 within the context of a CSR strategic assessment, given Accor’s desire to have a global view of its relevant environmental impacts. The study involved nearly a year of groundwork. Accor’s goal to quantify metrics on its global environmental impacts led to the creation of a specific methodology to provide accurate information about the real environmental issues of Accor’s activity beyond CO
2 and
on-site activities, and thereby to build the best possible strategy to curb its impacts and generate value for the group1.
To fit Accor’s environmental footprint within an O-LCA framework as defined in this Guidance, the reporting organization may be defined as the worldwide international group, over one year, including operational control2.
The reporting flow is defined as the yearly number of overnight stays, breakfasts served and meals served as representative of Accor’s basic services offering.
The boundary of the study was defined to be the three main life cycle steps of a hotel, namely, construction, use phase and end-of-life. The use phase is the most significant, and includes the accommodation service, hotel restoration services and hotel management (recreational services are excluded). The activities included in the system boundary were split into 11 activities (on-site water use, on-site energy use, on-site air conditioning & cooling system, on-site waste management, external laundry cleaning, food and beverage, construction & renovation, room equipment, hotel management, offices management, and employee travel). For each activity the life cycle perspective was considered.
1 Read more about Accor’s First Mover story in Report 7 (p.75) and Report 10 (p.82).
2 Owned, operated and franchised hotels are included in the study. In the case of Accor, operational control includes franchised hotels because they are required to follow the brand’s business model.
53Guidance on Organizational Life Cycle Assessment
or emissions elsewhere. They are calculated relative to a baseline that represents a hypothetical scenario in the absence of the project. Accordingly, for an environmental multi-impact assessment, hypothetical offsetting scenarios shall be considered for every impact category.
Environmental offsetting25 is not supported by this Guidance. According to ISO/TR 14069 (ISO, 2013), offsetting shall not be aggregated with the organization’s results. Nevertheless, practitioners can show offsetting separate of the results. Any offsets used should be based on credible methods, which should be clearly described in the study.
3.3 Life cycle inventory analysisThe inventory is the O-LCA phase when data is collected, systems are modeled, and life cycle inventory (LCI) results are obtained, based on the study’s goal and scope definition (see Report 7, p. 75). This should be done iteratively with the other phases of O-LCA. The inventory should consist of all inputs (e.g., energy, water and materials) and outputs (e.g., products, co-products, waste and emissions to air, to water and to soil) connected with the activities involved in the provision of the reporting flow (see Section 3.2.2) and considering the system boundary definition (see Section 3.2.3). For direct activities, the inventory shall include all inputs and outputs. Regarding the value chain, it is recommended to consider all the inputs and outputs from indirect activities that are included in the system boundary.
The inventory should be ultimately expressed as elementary flows, defined as “material or energy entering the system being studied that has been drawn from the environment without previous human transformation, or material or energy leaving the system being studied that is released into the environment without subsequent human transformation” (ISO, 2014a). Non-elementary (or complex) flows, which comprise the remaining inputs (e.g., electricity, materials and transport processes) and outputs (e.g., waste and by-products), should be transformed into elementary flows.
For conducting the inventory phase, operational steps in the central column of Figure 9 should be performed. The most time-consuming step in the inventory is data collection. The type of data used, the quality, and the sources used in the study shall be transparently reported. Additionally, data quality requirements and the method selected for handling multi-functionality influence the LCI (sections 3.3.4 and 3.3.5).
Different approaches may be adopted for completing the inventory for direct and indirect activities. In general, better quality and more specific data is expected for activities inside the reporting organization, while more generic data may be used for the remaining activities (Section 3.3.3). Nevertheless, organizations should strive to get precise information on their operations and value chain, rather than estimates. Prior to getting to the optimum stage, intermediate steps may be necessary, where data would be estimated, extrapolated, etc. Data collection and data quality improvement should be an iterative process during the assessment and over time. In years following the first assessment, organizations should improve the data quality of the inventory by replacing lower quality data with higher quality data as it becomes available.
25 All the other related methodologies are also discouraging the accounting of offsets in the environmental reporting of an organization (WRI and WBCSD, 2004; ISO, 2006d, 2013, 2014c; European Commission, 2013a).
INV
EN
TO
RY
AN
ALY
SIS
P MRecommended
itineraries
The inventory analysis for a First Mover story is presented in Report 7 (p.75)

54 Guidance on Organizational Life Cycle Assessment
Figure 9. Iterative steps of O-LCA inventory analysis. Source: modified from ISO 14040 (ISO 2006a).
3.3.1 Activities involved
The inventory should include all the resource use and emissions associated with the activities within the system boundary (see Figure 10). The list below presents potential activities to consider – additional ones may be defined – based on activity lists proposed by WRI and WBCSD (2004, 2011a) and by European Commission (2013a), and is classified into direct activities and in upstream/downstream indirect activities. The activities considered by a First Mover story are presented in Report 4 (p.56).
A. Direct activities
• Generation of energy resulting from combustion of fuels in stationary sources (e.g., boilers, furnaces and turbines).
• Physical or chemical processing (e.g., from manufacturing, processing and cleaning).
• Transportation of materials, intermediate products, products and waste in vehicles owned or controlled by the reporting organization.
• Employee commuting, organization personnel travel, and client and visitor transportation using vehicles owned or controlled by the reporting organization.
• Disposal and treatment of solid and liquid waste when processed in facilities owned or controlled by the reporting organization.
• Consumption of natural resources extracted with equipment owned or controlled by the reporting organization (e.g., consumption of river water, extraction of minerals and trees).
• Emissions to air and discharges to water and soil from intentional or unintentional releases (e.g., cooling water released to a river, emissions after application of fertilizers to soil, and gaseous or liquid emissions leaked through cracks in collection pipes).
Goal and scope definition (in section 3.2)
Mutli-functionality (in section 3.3.4)
Data quality
requirements (in section 3.3.5)
Identify involved activities/processes
(Prioritize data collection efforts)
Select data collection approach
Data collection
Validation of data
Relating data to reporting flow
Data aggregation
The activities considered by a
First Mover story are presented in Report 4 (p.56).

55Guidance on Organizational Life Cycle Assessment
B. Indirect upstream activities
• Extraction and/or production of purchased:
» Raw materials (e.g., sand, wood and water),
» Fuels (e.g., crude oil and natural gas),
» Goods (e.g., packaging and intermediate products),
» Outsourced services (e.g., marketing, legal, information technology (IT) and logistic services),
» Capital equipment (e.g., machinery used in production processes, buildings, office equipment, transport vehicles and transportation infrastructure).
• Extraction, production and distribution of purchased electricity, steam and heating/cooling energy.
• Disposal and treatment of solid/liquid waste generated by operations of the reporting organization when processed in facilities it neither owns nor controls.
• Transportation of raw materials, fuels, goods and capital equipment (between suppliers and from suppliers), and waste, in vehicles not owned or controlled by the reporting organization.
• Employee commuting and organization personnel travel using vehicles not owned or controlled by the reporting organization.
• Operations of assets leased by the reporting organization.
Furthermore, indirect upstream activities should also include inputs and outputs generated by other upstream activities. For instance, extraction, production and transportation of electricity consumed during raw materials extraction and fuels, goods and services consumed for the disposal and treatment of solid/liquid waste generated.
Purchased raw materials, goods
and services
Capital
Waste generated in operations
Purchased electricity, fuel
and energy
Transportationand distribution
Employee commuting
Business travel Leased assets
Indirect upstream activities Organization
facilities
Organization vehicles and equipment
Direct activities
End-of-life treatment of sold
products
Leased assets
Use of sold products
Processing ofsold products
Transportationand distribution
Franchises
Indirect downstream
activities
Reporting organization
Value chain
Value chain
equipment
Outputs (emissions, waste, etc.)
Inputs (energy, water, material resources, goods, services, etc.)
INV
EN
TO
RY
AN
ALY
SIS
Figure 10. Direct and indirect activities and resource use and emissions. Source: own elaboration based on WRI and WBCSD (2011a).
56 Guidance on Organizational Life Cycle Assessment
C. Indirect downstream activities
• Transportation and distribution of products to the client or travel of the client to the place of consumption, where the means of transport are not owned or controlled by the reporting organization.
• Processing and storage of products provided to the client (e.g., when the good is an intermediate product that needs small additional transformation before being offered to the final consumer) in facilities not owned or controlled by the reporting organization.
• Use or consumption of the provided goods (e.g., electricity and water consumed while using and cleaning a certain house appliance) and services (e.g., electricity and water consumed during the accommodation of a guest in a hotel).
• End-of-life (EoL) treatment of products sold.
• Operation of franchises, investments and assets, owned by the reporting organization (lessor) and leased to other entities.
As with indirect upstream activities, indirect downstream activities should also include inputs and outputs generated by other downstream activities, for instance during EoL.
Other direct or indirect activities could also be defined, if necessary. Particularly, more specific definition of the activities considered within the system boundary is recommended for the specific study. The organization may use a list of documented expenses to cross-check whether the inventory includes all the reporting organization’s activities. Here, attention should be given to avoiding double counting of resource use and emissions between different activities (e.g., transport between stages of the value chain and intermediate products’ life cycle).
This is one of the few cases where the OEF Guide has been applied, and was completed during the OEF pilot phase in 2011 (European Commission, 2013). The study duration was about one month. The assessment considered, in principal, the whole Colruyt Group including retail, wholesale and food service and other activities, with the exception of France where only the food service activities were taken into account.
Regarding the boundary, a cradle-to-grave analysis was limited to in-house products (own brands Boni, Everyday, etc. that have been processed in some way by Colruyt Group employees), while a gate-to-gate analysis was made for the other products (i.e., international brands provided in the shops of the organization, such as Coca-Cola, Nestlé, etc., without any transformation).
The five in-house products deemed representative for the cradle-to-grave analysis were rice, coffee, meat, wine and cheese. Figure 11 summarizes the activities and resource use and emissions considered gate-to-gate (direct activities) and up and down the value chain (for the 5 in-house products assessed).
Primary data collection was performed across all Colruyt Group sites. Significant efforts were made to consolidate and cross-check the information generated from the numerous sites that was provided partially in a different format or units, or not always using a consistent system boundary. Generic life cycle inventory data was additionally used to calculate cradle-to-gate inventory of the five in-house products.
Report 4. Colruyt Group: Activities included in the Organization Environmental Footprint1
1 Own elaboration from a summary of the “OEF report pilot testing phase” prepared by Manuele Margni (CIRAIG).

57Guidance on Organizational Life Cycle Assessment
The results of the OEF showed that three parts of Colruyt Group made significant contributions to the overall environmental impact: principally the activities upstream and downstream related to the in-house food products, but also the transport activities and the site level activities of the shops and the processing sites (e.g., cooling at shops has a significant contribution to ozone depletion). Results beyond climate change provided insightful information for other impact categories.
Currently, Colruyt Group is still involved in the OEF retail sector rules elaboration, together with other retailers such as Carrefour, Kering and Office Depot. In upcoming versions of the study, system boundary is planned to be broadened, particularly in France, and data quality improved. In the short term, the results of Colruyt Group’s organizational LCA are intended to support two internal action/reduction plans in operation; one on energy use and one on climate change. Within the next few years, Colruyt Group is committed to start using the results as a basis for its environmental action plan.
Site-level activities:
Employees business travels: Airplane business travel to IT offices in India
• land occupation (non-built areas, e.g., parking)
• cooling fluids leakage (for shops, administration sites, processing sites and DC depots)
• energy use (electricity, natural gas and heavy fuel)
• capital equipment (buildings) • water use
Company car transport and employee commuting without company cars
Other site-specific activities (e.g., own renewable energy production)
Transportation to shops (distribution): • company trucks and vans used to distribute the products from DC depots to shops • cooling fluids leakage from refrigerated trailers • use of CO2 for refrigerated trolleys
UP
ST
RE
AM
A
CT
IVIT
IES
Production and transport of the 5 in-house food products
Packaging and editing material bought to pack or re-pack the products to be sold in shops
Customer transportation: customers shopping trip to one of the Colruyt Group shops
Use phase of the 5 in-house food products and corresponding packaging materials and editing materials: energy and water uses for any relevant process, e.g., storage in fridge, cooking, coffee making, dishwashing
End of life of 5 in-house food products and corresponding packaging materials and editing materials: • transport from use site to collection center • transport from collection center to treatment site • waste treatment (recycling, incineration with energy recovery and landfilling)
DIR
EC
T A
CT
IVIT
IES
DO
WN
ST
RE
AM
A
CT
IVIT
IES
Figure 11. Colruyt Group – List of direct (for all products) and indirect activities (for the five in-house products) included in the OEF. Source: adapted from Colruyt Group.
Report 4. (Continued)
INV
EN
TO
RY
AN
ALY
SIS

58 Guidance on Organizational Life Cycle Assessment
D. Recommendations for supporting activities and use phase and end-of-life
Recommendations are provided below for some particular activities. More details on how to consider the remaining activities could be accessed from the GHG Protocol Corporate Standard and GHG Protocol Scope 3 Standard (WRI and WBCSD, 2004, 2011a, 2013), and the OEF Guide (European Commission, 2013a).
Supporting activities
Activities and operations of the organization that are not directly involved with the production of the products, but represent, for instance, managerial, marketing, design or R&D departments, which are key for an efficient and profitable operation of the organization. These activities are often disregarded in product LCA, however, they should be considered in O-LCA. Supporting activities include a very broad spectrum of activities, like provision of capital equipment, working-environment related activities, and capital expenditures, for which further detail is given in the following lines, and many others (e.g., travelling and commuting of employees and research activities). These activities may be particularly relevant for the inventory of organizations providing services. In general, involving all the reporting organization’s activities in the study contributes to achieving a broad view of the impact reduction opportunities. This will promote lateral thinking in the search for mitigation alternatives.
If these supporting activities provide service(s) to other organizations outside the reporting organization (by outsourced or joint services), only the corresponding portion is allocated to the reporting organization and may be defined on a per worker basis, for example.
Provision of capital equipment
Capital equipment (i.e., buildings, machinery, infrastructures and vehicles) used to manufacture, store, deliver, etc. In general, assets such as buildings, factories, vehicles and equipment are used over a different time period than the reference period considered for O-LCA (see Sub-section 3.2.1.C). According to ISO/TS 14072 (ISO, 2014c), burdens considered in the inventory should take into account the lifespan of those assets and the time period over which they are used. In that case the calculation methods shall be clearly justified and documented26.
Working-environment related activities
In certain sectors, some of these activities may be required by law (e.g., canteen service, heating and air conditioning of workplace, and cleaning services) or are undertaken as a choice (e.g., gardening, leisure areas and child-care services). These activities are related with the working conditions and utilities, but they are only indirectly related with the production. However, the organization should avoid the ‘knee-jerk’ reaction to cut them or disregard them from the study solely to reduce their environmental impact, but should rather work to render them more environmentally friendly.
Leased assets, franchises and investments
The methodological challenge of dealing with immaterial products, like loans, funds, investments or leased assets, still needs to be addressed, as this is relatively new ground for LCA. Hence a general approach to cover and allocate financial products
26 When financial accounting approaches are used (e.g., GHG Protocol Corporate Standard (WRI and WBCSD, 2004)), organizations account for the total cradle-to-gate emissions of purchased capital equipment in the year of acquisition, and provide appropriate context in the report.

59Guidance on Organizational Life Cycle Assessment
needs to be developed. As an example, the investment category recommendations by the Greenhouse Gas Protocol initiative are not yet satisfactory, because the investor shall only account for scope 1 and scope 2 emissions of the investees. Scope 3 emissions are disregarded for simplification, though they can often form a substantial part of the total impacts (Finkbeiner, 2013). Further advice will be available in the upcoming document “Financial Sector Guidance for Corporate Value Chain (Scope 3) Accounting, Reporting and Risk” (WRI and WBCSD, 2014a).
Use phase and end-of-life
When the system boundary includes cradle-to-grave activities, forecasting use phase and end-of-life, particularly in broad and diverse portfolios, may pose a challenge. Modeling the use and fate of a product is particularly product-dependent (and sometimes user-, cultural- or regional-dependent) and the parameters to consider include electricity or water consumed, intensity of use, lifetime, maintenance practices, waste management practices in the region, etc. The modeling may consider either average or extreme practices. One solution to reduce the need for data is to define representative products and types of users to model the whole portfolio.
Product design specifications are one source of data to define the use phase and end-of-life. Another option is to assume that the user is following product use instructions provided by the organization, which sometimes also recommends a specific treatment for disposal. If this information is not available at the level of the organization, recommendations set by sector associations, consumer associations or by other institutions can be used; otherwise, consumer survey results can be conducted. Regarding the final fate of the product, statistical data from regional waste managers may be of use.
If the contribution of the use phase to the total impacts is relevant and the data used to model this phase can be improved, it is recommended to find better and more specific data in the following applications of O-LCA. Additionally, it is highly recommended that the organization performs sensitivity analysis for best and worst practices, and states if significant differences are perceived in the results.
INV
EN
TO
RY
AN
ALY
SIS

60 Guidance on Organizational Life Cycle Assessment
3.3.2 Prioritize data collection efforts
Accounting for resource use and emissions need not involve absolutely every input, output or activity in the life cycle. ISO 14044 allows input and output selection in product LCA by including a clause with the option for leaving out insignificant inputs or outputs from a system, generally known as ‘cut-off’. Several criteria are used in LCA practice to decide which inputs and outputs are to be excluded (e.g., mass, energy and environmental relevance). The cut-off criteria used by BASF are presented in Report 2 (p.44).
In principle, it is desirable that all the activities within the defined system boundary are considered in O-LCA studies, with a focus on the inclusion of direct activities. However, not all of activities are environmentally significant, nor it is possible to acquire the data necessary to include them (Pelletier, 2013). If it is not feasible to consider the whole set of activities in the value chain of the reporting organization (i.e., if cut-off is applied), it should focus on the most relevant activities. For the selected activities, the organization may either use better data than for other activities, or simply exclude the other activities. Focusing resources based on significance can enable organizations to collect higher quality data for the priority activities in the value chain.
Criteria Description of activities
Quantitative aspects
Environmental impacts
Contribute significantly to the total anticipated resource use and emissions of the reporting organization.
Mass or energy
Contribute significantly to the total mass or energy flow of the reporting organization (across the value chain).
Spending or revenue
Require a high level of spending or generate a high level of revenue.
Organizational aspects
Suppliers’ closeness
(Indirect activities) performed by the suppliers at the closest tiers to the reporting organization (e.g., first, second and third).
Influence Present potential emissions reductions that could be undertaken or influenced by the reporting organization.
Risk
Contribute to the risk exposure of the reporting organization (e.g., climate change related risks such as financial, regulatory, value chain, product and technology, compliance/litigation, and reputational risks).
Stakeholders Deemed critical by key stakeholders (e.g., customers, suppliers, investors or civil society).
Outsourcing
(Outsourced activities) previously performed in-house or activities outsourced by the reporting organization that are typically performed in-house by other organizations in the reporting organization’s sector.
Sector guidance
Identified as significant by sector-specific guidance.
Table 2. Criteria for identifying relevant activities. Source: modified from WRI and WBCSD (2011a).
The cut-off criteria used by one First Mover
are presented in Report 2 (p.44).

61Guidance on Organizational Life Cycle Assessment
Organizations can use several methods and criteria to identify priority activities (see Table 2). Following the GHG Protocol Scope 3 Standard (WRI and WBCSD, 2011a), organizations should prioritize data collection efforts on the activities that are expected to have the most significant environmental impacts, offer the most significant impact reduction opportunities, and are the most relevant to the organization’s business goals. Where the contribution to environmental impacts cannot be used for prioritizing, it is recommended to use a combination of other criteria. The criterion or criteria selected for inclusion of inputs and outputs and the assumptions on which they are established should be clearly described, and could be iteratively improved. Different rankings of activities, according to the criteria selected, may be performed for direct and indirect activities. The effect on the outcome of the study of the criteria selected should also be assessed and described.
Environmental impacts
The most rigorous approach to identify priority activities and ensure that no environmentally relevant flows are cut-off is on the basis of environmental impacts. A quantitative method based on an initial estimation (screening) of the environmental impacts gives the most accurate measure of the relative magnitudes of the various activities.
Screening according to the size of impacts may be relatively easy for a single-indicator assessment (e.g., GHG emissions). With multiple impact categories, flows will contribute differently to each category, meaning that different flows will need to be cut-off. The organization should be aware that this would then require determining cut-offs for each impact category relative to the threshold (Pelletier, 2013), which becomes more complex when assessing an increasing number of environmental indicators.
An estimation of the environmental impacts of the activities selected may use generic data, for instance industry-average data, environmentally extended input-output data (see Box 6), proxy data, or rough estimates. However, if a certain quality is not achieved for the screening data, misleading conclusions could be drawn as to whether an input or output will or will not significantly change the overall results.
For environmental and other quantitative criteria, the significance of a certain input or output on the overall inventory should be defined in accordance with the goal and scope of the study. All the inputs and outputs that contribute more than a defined threshold (e.g., percentage) should be included in the study.
Mass and energy
The two other criteria suggested both by ISO 14044 and WRI and WBCSD (2011a) are mass and energy, though there is no theoretical or empirical basis that guarantees that a small mass or energy contribution will always result in negligible environmental impacts. Furthermore, there are suppliers that do not contribute mass or energy, for example service sectors (Suh, 2004; Huang, 2009a). As suggested by Pelletier et al. (2013), if a mass/energy cut-off must be applied in the environmental accounting, the organization should provide recommended methods for energy or mass flow analysis throughout the value chain.
Spending or revenue
Spending or revenue can be used for identifying the most relevant suppliers and other partners in the value chain of an organization. A financial spending analysis can rank purchased products from upstream according to their contribution to the total
INV
EN
TO
RY
AN
ALY
SIS

62 Guidance on Organizational Life Cycle Assessment
Box 6. Input-output analysis data
Input-output analysis or IOA (Leontief, 1986) may be a useful tool for LCA to quantify the connectivity among industry-service sectors, wherein monetary data can be translated into environmental inputs and outputs. Environmentally-extended input-output analysis (EE-IOA) uses economic input-output analysis to map general interdependencies between sectors in the economy of a given region and quantify those relationships (in monetary terms), and then assign environmental factors to the sectors as defined by the input-output tables. Therefore, EE-IOA models estimate direct and indirect environmental effects, i.e., effects caused by the business sector itself and its suppliers, as well as wider effects in the economy caused by the suppliers’ suppliers (Reimann et al., 2014).
EE-IOA can be used as a screening methodology to inform estimation of the anticipated life cycle emissions (Huang, 2009a). Moreover, a combination of EE-IOA data with detailed process-based data in a ‘hybrid’ data collection approach, the so-called economic input-output life cycle analysis (EIO-LCA), could be useful to complete the data collection of an entire value chain. In such a hybrid EIO-LCA, the impact of a specific product is analyzed with LCA, and the impacts of process chains not included or ‘cut off’ in the LCA are estimated with the help of EE-IOA (Lave, 1995; Suh, 2004).
Still, apart from GHG emission accountancy, which is available in many national statistics, only a limited number of other environmental indicators can be found today (Lenzen et al., 2012). The user should also be aware of other methodological and data challenges, like country discrepancies in the classification of sectors and products and the lack of specific models for imports and exports, and for use and end-of-life phases (Suh, 2004; Huang, 2009b; Reimann, 2014).
expenditure of the reporting organization. However, as with energy and mass basis, spending and revenue do not correlate well with environmental impacts, and so this criterion should not be used alone.
Suppliers’ closeness
Another option is to place the system boundary at least one tier (or the agreed number of tiers) outside the reporting organization, with one tier understood to be one step up or down the value chain (see Figure 7, p.49). Take, for example, a library as the organization in question. They buy books. Their system boundary must include, at least, the impacts of the book production facilities and distribution chain. Ideally, it should consider also the value chain of paper, all the way back to the seeds of the trees.
Because contact with suppliers at the first, second or third tier may be more direct, data collection would be easier. However, accounting for the resource use and emissions that are ‘close’ to the reporting organization in the value chain might ignore important impacts, if a very high percentage of the inputs and outputs lie beyond these first tiers.
Influence
Organizations often have the ability to influence decisions from other organizations, though they have no real control over them. Typical examples of relationships that may confer significant influence are contractual relationships that require certain operating standards and practices, and situations where the reporting organization accounts for a substantial portion of sales of the other. This is related to suppliers’ closeness, as

63Guidance on Organizational Life Cycle Assessment
it is quite common that organizations have more influence over first tiers of the value chain (Figure 7, p.49). The reporting organization may prioritize activities in the value chain where it has the potential to influence resource use and emissions (GRI, 2005; WRI and WBCSD, 2011a).
Other criteria
The organization may prioritize any other activities expected to be the most relevant for the reporting organization or its stakeholders. It may include activities that are significant for the organization’s risk exposure, those deemed as critical by the stakeholders or that have been identified as significant by sector-specific guidance. Activities meeting any additional criteria developed by the organization or sector could also be used (WRI and WBCSD, 2011a).
3.3.3 Inventory quantification
A. Types of data
Two general types of data can be used in the inventory quantification, specific and generic, for which examples are provided in Box 7. The following are definitions based on European Commission (2013a):
Box 7. Examples of specific and generic data1
Specific data sources:
• Process- or plant-level consumption data.
• Bills and stock/inventory of consumables.
• Emissions declared/reported to authorities for legal purposes such as permits or fulfilling reporting requirements.
• Emission measurements.
• Mass balance or stoichiometry.
• Composition of waste and products.
• Procurement and sale department(s) (see Box 8).
Generic data sources:
• Industry-average data:
» data from literature or scientific papers,
» life cycle inventory databases,
» other databases from governments, international governmental organizations, associations, etc.,
» industry association reports,
» government statistics.
• Average financial data.
• Proxy data.
1 Mainly based on WRI and WBSCD (2011a).
INV
EN
TO
RY
AN
ALY
SIS

64 Guidance on Organizational Life Cycle Assessment
• Specific data (also called primary data) refers to directly measured or collected data representative of process or activities at a specific facility or set of facilities.
• Generic data (also called as secondary data) is not based on direct measurements or calculation for the respective specific process(es) or activity(ies), but rather sourced from a third-party life cycle inventory database or other source.
Generic data can be either sector-specific (i.e., particular of the sector being considered) or multi-sector. When using generic data, organizations should prioritize databases and publications that are internationally recognized, provided by national governments, or peer-reviewed.
Ideally, the whole set of direct and indirect activities within the system boundary of the study should be described using specific data (i.e., modeling the exact life cycle). In practice, obtaining specific data, particularly for the activities upstream and downstream might be expensive and time consuming. All data may include a mixture of measured and estimated data. Indeed, for very complex organizations (e.g., large number of facilities in many different countries or very long and intricate value chains), obtaining specific data for all the direct activities can be particularly challenging.
According to ISO (2006c), the type of data used is conditioned by the definition of the goal and scope to be met. The inventory is the most time consuming, and thus, most expensive step of an LCA because an inventory has to be completed for all the activities selected. Organizations should focus on collecting data of sufficient quality to ensure that the inventory appropriately reflects the situation of the organization, supports its goals, and serves the decision-making needs (WRI and WBCSD, 2013). In general, the use of specific data is recommended, particularly for direct activities.
Greater use of assumptions, extrapolations and generic data is expected for indirect activities and also for very large organizations. However, the collection of
Box 8. Converting financial information to physical flows1
Organizations may manage their purchase information in a way that enables making a link with LCA data gathering through IT tools. Then the issue of the conversion of financial information to physical flow arises. ISO/TS 14072 (ISO, 2014c) identified the main issues that should be taken into account in order to reduce the introduced uncertainty:
When the price of products is used to calculate the amount of products purchased corresponding to a given amount of money spent during a specified time period, it is necessary to take into account: (1) the variation of the cost over time and (2) the exchange rate variation between currencies over time if inputs from different countries are considered;
When background LCA data is available for a given time period, and it is used for another period, it is necessary to adjust the variation of money value between the two periods of time (e.g., to compensate for inflation); and
When different levels of detail are combined within the LCA calculation, adjustments may be needed to better reflect the reality.
1 Primarily based on ISO/TS 14072 (ISO, 2014c).

65Guidance on Organizational Life Cycle Assessment
primary input and output data from suppliers in order to obtain site-specific data is recommended when possible, in particular for activities identified as top priority (see Section 3.3.2). When organizations do have a contractual influence on the value chain, the expectation is for them to push to have access to data which is material to decision making.
B. Data collection approaches
This sub-section seeks to bring some order to the many alternatives that an organization has for quantifying its inventory at the organizational and value chain level. The following three inventory calculation procedures are proposed in the annexes of ISO/TS 14072 (ISO, 2014c):
• Bottom-up approach (or product-oriented approach) entails adding the different LCAs of the products of the reporting organization, weighted by the amount of products that are produced during the reference period, together with the supporting activities27. Additional detail is provided on p.66. Report 5 (p.67) describes the tailored bottom-up approach used by Unilever.
• Top-down approach (or inventory-oriented approach) considers the reporting organization as a whole, and adds upstream (cradle-to-gate) models for all inputs of the organization and downstream (gate-to-grave) models for all outputs. Additional detail is provided on p.67. The First Mover stories of Storengy and Accor, in Report 6 (p.74) and Report 7 (p.75) respectively, illustrate the use of a top-down approach.
• Additionally, a hybrid approach or intermediate approach that uses both bottom-up and top-down data could be imagined. Available LCA results for products in the portfolio (or for small subsets of the reporting organization) may be representative of similar products (or, e.g., facilities). This bottom-up data can then be extrapolated for those similar products or facilities and subtracted from the top-down data.
Bottom-up versus Top-down
Conceptually, the bottom-up and top-down approaches (see Figure 12) should arrive at the same results. However, the addition of different product LCAs (bottom-up), although adding the supporting activities, may overlook some of the processes that would be considered with a top-down approach. For instance, an individual product LCA would consider the electricity consumption for a manufacturing process, but most probably would neither include the factory lighting nor the offices’ electricity consumption. The top-down approach would gather data for all the electricity inputs of the organization including, for instance, lighting. On the other hand, a bottom-up approach uses data at the product level and likely includes almost all the inputs and outputs involved, unlike the top-down approach, for which those substances or processes not relevant for the whole organization tend to be disregarded. A further common difference between the two approaches is the granularity of the results: more disaggregated and specific data is expected for the bottom-up approach. In any case, the results may be not the same, but consistent results should be obtained from both approaches.
27 This approach has similarities with the Pathway 3, defined in Section 2.3.3. However, in a ‘bottom-up’ approach, the LCAs of the products in the portfolio are supposed to be calculated during the assessment, while in Pathway 3, these products’ LCAs are already available from previous studies.
The First Mover stories in Report 6 (p.74) and Report 7 (p.75), illustrate the use of a top-down approach.
INV
EN
TO
RY
AN
ALY
SIS
Report 5 (p.67) describes how a First Mover tailored and used a bottom-up approach.

66 Guidance on Organizational Life Cycle Assessment
Bottom-up data collection
According to the bottom-up procedure definition, the O-LCA of an organization is calculated by applying LCA to the products in the portfolio. Ideally, the organization should conduct an LCA of each of its products, though depending on the scale and variability of the portfolio, this may be unrealistic. If the organization chooses not to assess every single product, this should be in accordance with the goals of the study and relevant criteria should be used to select the products. The final number of products assessed should be sufficient to guarantee representativeness of the entire portfolio.
One approach, illustrated by Report 5 (p.67), is the definition of clusters or families of products, according to a number of criteria (e.g., region of production or consumption, type of raw materials used during production, consumer habits, dominant production technology, size and packaging). Once a product cluster is defined, a proxy product can be identified to be assessed with LCA. For instance, a meta-product, (or, abstraction of a product) that represents that group of products may be defined (see Milà i Canals et al. (2010)), or the product(s) which best represent the cluster may be selected. Another option to prioritize products is to use a ranking of products based on sales, weight, profit or, preferably, a combination thereof, thus selecting those which surpass a certain threshold28.
It is also possible to define other means to focus data collection efforts. For example, when the product portfolio is relatively homogenous, the organization may conduct a customized LCA to its products as a group by defining a priority list of inputs and outputs, and even impact categories, that were previously defined as being most relevant (e.g., according to the conclusions of several pilot product LCAs).
Once the impact per product is calculated, it should be weighted and aggregated with the rest of the products in the portfolio. The weighting factors are calculated according to the number of units produced in the reference period. When proxy products are used, the production ratio should include all the products in the cluster. The supporting activities (e.g., employee commuting and travel, capital expenditures, fleet energy use and emissions) and any other organizational activities not included in the product LCAs should then be added to arrive at the final result.
28 As in product LCA when using cut-off, the criteria selected should guarantee that environmental relevance is not neglected (see Section 3.3.2).
Report 5 (p.67), illustrates the
definition of clusters or families
of products according to a
number of criteria.
Reporting organization
Division III Division II Division I
Facility E
Supporting activities
Facility C Facility B Facility A
BOTT
OM-U
P
TOP-DOWN
+ + + +
P
+
Facility D
Figure 12. Sketch of the bottom-up and the top-down approaches for data collection.

67Guidance on Organizational Life Cycle Assessment
INV
EN
TO
RY
AN
ALY
SIS
In 2008 Unilever, a producer of foods, house-hold and personal care products, started an ambitious initiative to assess its global footprint (e.g., for carbon and water) in order to obtain a picture of its global business and to support business strategy and decision-making at its various organizational levels. The assessment informs the Unilever Sustainable Living Plan1 and is now updated and reported annually. The first footprint took approximately 18 months to complete, while time was reduced to 12 and 8 months in the subsequent yearly repetitions.
Representative products and countries
Unilever sells a wide portfolio of products in over 190 countries. The wide diversity of products and their use, as well as the size of the company, made a bottom-up conventional product-based footprint approach, including every single product globally, impractical. Therefore, the footprinting process was streamlined by defining a representative set of countries and products. 14 countries were selected according to several factors both related to business (e.g., annual sales, coverage of all product categories and consumer habits) and environment (e.g., country infrastructure and environmental profile, like carbon intensity of the electricity grid and degree of water scarcity). Unilever’s product portfolio was grouped into clusters of similar products in each country (e.g., concentrated liquid laundry detergent in plastic bottles). From each cluster a representative product was selected for subsequent measurement. A key challenge in this clustering exercise was to strike a balance between guaranteeing representativeness and managing the effort for data collection. Currently over 2,000 representative products are footprinted in the 14 countries and this represents about 70% of Unilever’s global sales.
Global environmental footprint methodology
The Unilever footprinting methodology comprises three main phases: business data extraction phase; footprint measurement phase (that combines the business data with environmental information); and interpretation
and reporting phase. The scope is cradle-to-grave although this varies by environmental indicator depending upon the availability of data and the relevance for the management plan. Unilever’s footprint is measured at an individual representative product level across the life cycle, and aggregated at a product cluster, category, country and company level. It is expressed in two formats, namely: per consumer use and as absolute totals. For each representative product, Unilever analyzes sourcing and ingredient information, packaging, manufacturing impacts and data on consumer habits (which often vary by country). Apart from business data, secondary data is used due to the wide variety of ingredients and processes involved.
Environmental indicators
The footprint includes the assessment of GHG emissions for all life cycle stages from cradle-to-grave. Water use, consumer waste and sustainable sourcing are also assessed. Unilever’s current water metric considers the water added to the product and the water used by consumers in 7 of the 14 countries that have been classified as water-scarce. Although the metric excludes water used to produce Unilever’s agricultural inputs, this was estimated to be only about 15% of the total water life cycle footprint. For waste, the focus is on packaging waste (i.e., amount of packaging that ends up in landfill or as litter) and product leftovers (i.e., the amount that remains in the packaging). Furthermore, the local recycling context is considered. Water use and the waste generated by Unilever’s manufacturing operations are measured as part of its eco-efficiency program and have been reported regularly since the 1990s; therefore these are not included in the footprint exercise. Finally, Unilever has developed a metric for the sustainable sourcing of agricultural raw materials. The criteria for sustainable sourcing cover the three pillars of sustainability and focus on the agricultural production stage only (where some of the biggest opportunities for reducing environmental impacts and enhancing social and economic benefits exist).
Report 5. Unilever: A streamlined approach for global environmental footprint assessment
1 See more about Unilever’s Sustainable Living Plan in Report 15 (p.96).

68 Guidance on Organizational Life Cycle Assessment
Top-down data collection
The top-down approach, also used in the hybrid approach, may follow several collection alternatives, which are described in the following paragraphs (see also Figure 13). As previously mentioned, specific data should be used for direct activities. There are two main methods to quantify the inventory for direct resource use and emissions at the reporting organization: direct measurement or calculation. Both methods can be adopted depending on the data available, provided they are well documented and reported. It is recommended to use statistical analysis tools when a large amount of data is collected during isolated or systematic measurements.
Measurement (option A in Figure 13) means quantification of resource use and emissions using direct monitoring, mass balance or stoichiometry. Using measurement often results in a more accurate inventory, however this type of data is more expensive and the organization might not have the necessary equipment.
Calculation (option B in Figure 13) requires the use of two types of data: activity data and consumption/emission factors. Activity data is a quantitative measure of the level of activity that results in environmental impacts (e.g., liters of fuel consumed, kilometers of distance, hours operated and money spent). Primary activity data should be obtained either from specific measurement or from data that already exists or has been systematically collected by the organization (e.g., meter readings, purchase records, utility bills and engineering models).
Emission or consumption factors are sets of factors that convert activity data into resource use and emissions (e.g., amounts of gases emitted per liter of fuel consumed or per kilometer traveled, and liters of water consumed per hour operated or per currency spent). Emission or consumption factors are often generic data (e.g., grey literature and sector reports) assumed to be representative for a particular process/activity. If calculation is used, the organization should ensure that the entire set of resources consumed and emissions released to air, water and soil that are contributing to the multiple impact categories considered in Section 3.4 is taken into account.

69Guidance on Organizational Life Cycle Assessment
For quantifying resource use and emissions over its value chain (upstream and downstream), the organization may either assess the suppliers individually (options C and D in Figure 13) or seek to quantify the entire value chain at one time (options E and F). For the former, direct resource use and emissions at the supplier level29 should be measured (option C) or estimated (option D) following the explanations in the previous paragraphs for direct activities at the reporting organization (option A and B, respectively). The use of measurement and calculation at the supplier-level results in more accurate inventory data, although it reduces the number of suppliers and tiers that can be considered (because it is more time and effort intensive) and may lead to multi-functional situations that must be resolved (see Section 3.3.4).
29 The direct resource use and emissions of the suppliers are the indirect resource use and emissions included in the system boundary of the reporting organization.
INV
EN
TO
RY
AN
ALY
SIS
Direct activities
Direct activities should use specific data.
measured data estimated data
Direct resource use and emissions
(at the reporting organization level)
Activity data (at the reporting
organization level)
Generic/specific consumption and emissions factors
(A) (B)
Indirect activities
Indirect activities can use specific and/or generic data.
Specific data (measured/collected) at the supplier level
(for the products of the suppliers
assessed)
(allocation)
Generic data (process or sector data)
Indirect resources and emissions
(of the reporting organization)
(F) (C) (D)
Specific data (product LCA particular of suppliers)
(E)
(for the entire value chain)
measured data estimated data
Direct resource use and emissions
(at the supplier level) Activity data
(of the supplier)
Generic/specific consumption and emissions factors
Figure 13. Top-down alternatives that an organization can use for quantifying the inventory for direct and indirect activities.

70 Guidance on Organizational Life Cycle Assessment
Collecting specific data at the supplier level is likely to require wider engagement of the organization, as well as with outside suppliers and partners.
Two other alternatives are to use specific or generic data to model the entire value chain (option E and F, respectively). Activity data from the organization should be collected in order to either quantify the inputs and outputs involved in the reporting organization’s activities or to identify the sectors involved for the provision of necessary products. The activity data is then used to weigh the specific or generic data. Specific data refers to product LCAs particular for the supplier considered, if available. Generic data should be process (e.g., product LCA data from databases like ecoinvent) or may be sector data (e.g., EEIO, see Box 6, p.62).
Finally, the direct resource use and emissions consumed or released within the reporting organization are aggregated with the resource use and emissions consumed or released up and down the value chain. Organizations are required to report a description of the types and sources of data to calculate the inventory. Moreover, time periods represented by the data collected shall be clearly stated in the study.
3.3.4 Handling multi-functionality situations
When a process, activity or unit delivers several outputs (i.e., products) and only one or some of them are included in the study, a ‘multi-functionality’ situation may be faced. Sometimes the inventory for that multi-functional process or facility uses specific data which is quantified at the process or facility level as a whole, while the reporting organization is the recipient of only part of the products provided. This requires the use of either another type of data or the definition of certain criteria that would determine which part of the inventory is attributable to the reporting organization (see Sub-section A).
The most common multi-functionality situation in O-LCA arises when quantifying (using specific data) resource use and emissions in the value chain. Organizations rarely purchase the whole product spectrum and the total production volume of a particular supplier or other partners in the value chain. Therefore, the basket of products purchased from suppliers is responsible for only the attributable part of the environmental interventions of those suppliers (see the Sub-section B for further detail).
Similarly, when the definition of the reporting organization takes into account only a subset of the organization (e.g., a business division), some of the processes or facilities may not be included as a whole in the reporting organization, (e.g., a facility that is producing for other business divisions within the same organization). In this case, only an attributable share of resource use and emissions of this process or facility should be included in the study.
When using specific data, the multi-functionality problem would not arise if the process or facility produces only one output. Moreover, if the study considers the whole process or facility there is no need to solve the multi-functionality problem because the whole spectrum of outputs (i.e., products provided) is included. Typically, no problem arises when using generic data to calculate resource use and emissions because this type of data is usually available per product or input, but not for a whole organization.
Some outputs of a certain process or facility may be partly co-products and partly waste. In such cases, the inputs and outputs of the process or facility shall be
71Guidance on Organizational Life Cycle Assessment
INV
EN
TO
RY
AN
ALY
SIS
allocated to the co-products part only (ISO, 2014c). If waste becomes useful and marketable for use in another system, it is no longer considered waste and should be treated like other outputs.
A. How to solve multi-functionality situations
The study shall identify the processes shared with other systems, and deal with them according to the following hierarchy of solutions30, which is based on ISO (2006c) and WRI and WBCSD (2011a).31 Wherever possible, organizations should avoid or minimize allocation and use it only when more accurate data is not available, as allocation adds uncertainty to the estimation of inputs and outputs. Allocation should be avoided by:
1. Looking for product-level data when the individual resource use and emissions of the purchased product could be quantified. For instance, a product LCA of the product, previously performed by the supplier (option E in Figure 13, p.69) or, if consistent with the goals and scope and considered better than allocation, a generic product LCA (option F in Figure 13).
2. Subdividing the inventory of inputs and outputs by either directly sub-metering activity data for the outputs involved in the study or using engineering models to separately estimate emissions related to each output.
Where the first two options do not apply in the study, allocation may be applied, i.e., the inputs and outputs of the system should be partitioned between its different products or functions according to a certain relationship:
3. Relevant underlying physical relationships. The relationship should be relevant either in the sense that it reflects how input flows determine the proportions of output flows, or in terms of how specific characteristics of the input flows relate to the functions provided by the co-products (Pelletier, 2013). Examples: mass, volume, energy, number of units, chemical content, etc.
4. When physical relationships are not an option, allocation may be applied using economic or other relationships.
Some requirements from ISO 14044 (ISO, 2006c) to be fulfilled when using allocation are: (1) the sum of the allocated inputs and outputs of a unit process shall be equal to the inputs and outputs of the unit process before allocation; (2) allocation procedures shall be uniformly applied to similar inputs and outputs of the system under consideration; and (3) whenever several alternative allocation procedures seem applicable, a sensitivity analysis shall be conducted to illustrate the consequences of the departure from the selected approach.
Furthermore, when data from other organizations is used, it is necessary to agree which one decides and applies the allocation criteria. Allocation by the reporting organization is likely to ensure more consistency in the study, while allocation by the supplier may be more practical by avoiding the need for suppliers to report confidential business information (WRI and WBCSD, 2011a).
30 In general, system expansion should not be used at the organizational level because of the concern regarding inconsistent or poorly representative substitution scenarios. Accordingly, system expansion is not considered as an option neither in ISO/TS 14072 (ISO, 2014c) nor in the GHG Protocol Corporate Standard (WRI and WBCSD, 2004). It is discouraged.
31 See these two publications for further guidance on multi-functionality situations.

72 Guidance on Organizational Life Cycle Assessment
B. Multi-functionality of a supplier32
For an O-LCA, it is generally not consistent to simply aggregate the entire set of direct inputs and outputs of the suppliers, because organizations normally neither purchase the whole product spectrum nor the total production volume of a particular supplier.
Figure 14 shows a possible upstream in the value chain of an organization composed of tier 1, tier 2 and tier 3 suppliers. Each tier produces several products for the following tier. This is a simplification – in reality multiple suppliers are usually supplying to the reporting organization and to each tier, which creates a network of organizations (see Figure 7, p.49). As long as all products from tier 1, 2 or 3 were all completely involved in the product portfolio of the reporting organization, no multi-functionality problems would arise (e.g., in tier 3 for Figure 14).
However, if some products produced by the ‘Tier x supplier’ are not part of the reporting organization value chain but are involved in delivering the product portfolio of another organization (e.g., in tier 1 and 2), they should not be accounted for. Hence it is necessary to define which is the attributable part of the direct resource use and emission spectrum of the ‘Tier x supplier’, according to the purchased share of the reporting organization.
This shall be done following the hierarchy in Sub-section A and consistent with the goal of the study, by using data representative for the products purchased, or by applying allocation to the supplier’s inventory. Organizations might have a vast number of products involved in the value chain. Therefore, allocation (options 3 and 4 in Sub-section A) of the environmental impacts of the supplier to each single product may not bring any value to the study and would represent a major effort. It may be more relevant to identify families of products to which the environmental impacts are allocated.
32 This part is based on clause 5.3 of ISO/TS 14072 and on Finkbeiner and König (2013).
Tier 1 supplier
product
product
product
product
product
product
product
product
product
product
product
Tier 2 supplier
product
product
product
product
product
product
product
product
Tier 3 supplier
product
product
product
product
product
product
product
product
product
product
Reporting organization
White products are involved in the product portfolio of the reporting organization. Black products are involved in the value chain of other organizations.
Figure 14. Simplified upstream composed of tier 1, tier 2 and tier 3 suppliers. Source: modified from Finkbeiner and König (2013).

73Guidance on Organizational Life Cycle Assessment
According to Sub-section A, the first proposed alternative is to obtain an overview of the environmental burdens of the different products that the reporting organization purchased by collecting generic (option F in Figure 13, p.69) or, preferably, specific (options E in Figure 13) product LCA data. For those products and impacts that contribute significantly to the overall burden, the relevant suppliers should be approached in order to gain access to their specific data and to identify options to reduce impacts by product or process optimization. If impact reductions cannot be achieved with the existing supplier, choosing an alternative supplier with better performance may be an option to consider by the reporting organization. In any case product-level data should be used and this represents an interface to the domain of product LCA. As a consequence, the ‘theoretical’ advantage of O-LCA of not having to cope with numerous product life cycles may no longer apply, when the first option of the hierarchy is selected.
The following fictitious example (see Figure 15) describes a retailer who is measuring the impacts associated to a supplier – a food processing plant that supplies cans of tomato paste and tomato sauce. The retailer does not purchase all the products produced by the supplier – half of the tomato sauce cans are purchased by other organizations. Four different solutions, according to the hierarchy in Sub-section A, are proposed and explained. Unlike the product-level data alternative, the other three alternatives require further assessment of the impacts of the subsequent suppliers in tier 2, 3, etc. (i.e., in the value chain).
3.3.5 Data quality
Data quality assessment shall be undertaken with care, as this is fundamental to ensure the reliability and validity of the findings, in order to reach useful conclusions. Data quality can be verified quantitatively or qualitatively. The data quality requirements should address the criteria given in Table 3.
INV
EN
TO
RY
AN
ALY
SIS
Food processing
1.5 M tomato paste
1 M tomato sauce
1 M tomato sauce
(others)
Retailer
Tier 1
Simplified inventory for Tier
1 (per year)
(a) 25 GJ electricity (b) 1800 t tomato (c) 25 t aluminium
1. Product-level data Generic or specific product LCAs exist for one can of
tomato paste and sauce. The impacts of the individual LCAs
should be multiplied by 1.5 and 1 million times,
respectively. Impacts for all the following tiers are also
included.
3. Physical allocation Inventory is allocated
according to the total number of cans purchased (2.5 million out of 3.5). Therefore, a factor
0.71 is applied to the inventory values. The retailer should account for: 18 GJ of electricity, 1280 t of tomato,
and 18 t of aluminium.
2. Subdividing In the food processing plant consumption of resources is monitored, e.g., it is possible to
state that 18 GJ of electricity are used for paste and 7 for sauce. The former is fully
considered and half of the latter, according to the retailer purchase.
4. Economic allocation Inventory is allocated according to the price ($0.70 per paste can and $0.40 for sauce).
Multiplied by the number of products produced means a revenue of $1.85 million,
78% of which is paid by the retailer. This percentage is also applied to the inventory,
thus the retailer accounts for: 20 GJ of electricity, 1410 t of tomato, and 20 t of
aluminium.
Input Paste Sauce Retailer (1) GJ 18 7 21.5 (2) t 1200 600 1500 (3) t 11 14 18
Figure 15. Example of multi-functionality of a supplier and four options to distribute impacts according to the hierarchy in Sub-section A.

74 Guidance on Organizational Life Cycle Assessment
Storengy, a company of GDF SUEZ and an operator present along the entire value chain of underground storage of natural gas, commissioned a study to assess the life cycle impacts of its activities. By choosing a top-down multi-criteria approach, Storengy went beyond the regulatory requirements in France for scope 1 and 2 GHG emissions declarations. The study also identified the most effective environmentally friendly reduction actions and guided internal environmental policies1.
Scope of the study
The study reported the 2011 results for all the activities of Storengy France. It considered Storengy’s 12 French underground storage sites, which are divided into four regional clusters. For any site, boundaries were set at the level of gas meter (i.e., before the gas meter when injecting gas into the underground storage, and after the gas meter when withdrawing natural gas from the storage facility to the transport network). The system boundary included all the activities and elements necessary for the operation of Storengy, organized in three categories: travel, industrial activities, and tertiary activities (including marketing activities).
Four environmental indicators were assessed: the impact categories climate change, acidification and photochemical ozone creation; and the aggregated flow consumption of non-renewable energy. Last, although not complete, a water indicator was considered for some of the activities.
Inventory analysis
Each of the activity categories was further subdivided in order to better identify the main contributors to environmental impacts, and areas for improvement. For example, travel was subdivided into professional travel and employee commuting, with each of these divided again by type of transport used. Data was collected in a top-down approach for
each of the activity subcategories. To meet Storengy’s expectations, the results were presented for the whole organization and by regional storage cluster.
Five main sources of data were used. The first two correspond to Storengy’s internal data. First, data was sourced from the several sites that is monitored monthly and collected in an internal database. This includes data on resource consumption and intermediate products (e.g., energy and chemicals), emissions (e.g., air pollution and water pollution), and activity data (e.g., operating hours). Second, internal information was accessed on the construction projects of the sites. Moreover, own data from the whole GDF SUEZ group complemented the inventory with detail on, for instance, the infrastructure modeling of gas processing. Finally, when primary data was not available, the inventory was based on environmental secondary data from the ecoinvent database and public statistical data. For travel and tertiary activities, internal data and public statistical data were mostly used, while all the aforementioned sources of data were used in the industrial activities category.
Data quality assessment
In order to ensure a minimum quality of the data and state the robustness of the results, the study included a qualitative assessment of the data used, according to five requirements: reliability; completeness; temporary correlation (considering data from 2011 when primary data was used and a five-year limit for secondary data); spatial correlation (considering Storengy France information for primary data and French data, or international data as a less-preferred option, for secondary data); and technology representativeness. A score was given to each of the five requirements for all the groups of activities, considering good, satisfactory or low level. Furthermore, a general evaluation of the data quality was conducted for each group of activities.
Report 6. Storengy: Global approach to environmental performance
1 See some improvement scenarios proposed in Report 14 (p.95).

75Guidance on Organizational Life Cycle Assessment
INV
EN
TO
RY
AN
ALY
SIS
Two data quality schemes applied by two First Movers are presented in Report 6 (p.74) and Report 7 (p.75).
Criteria Description
Temporal representativeness
The degree to which the data set reflects actual time and the minimum length of time over which data should be collected.
Geographical representativeness
The degree to which the data set reflects actual location.
Technological representativeness
The degree to which the data set reflects actual level of technology.
Precision Measure of the variability of the data values for each data expressed.
CompletenessWhether or not all the data necessary to conduct the assessment is available.
Reproducibility
Qualitative assessment of the extent to which information about the methodology and data values would allow an independent practitioner to reproduce the results reported in the study. It is related with transparency.
Reliability The degree to which the approach, sources, data collection methods and verification procedures used to obtain the data are dependable.
Table 3. Data quality criteria. Source: based on ISO 14044 (ISO, 2006c) and WRI and WBCSD (2011a).
The organization should collect data of sufficient quality to ensure that the inventory appropriately reflects the emissions and resources associated to the activities of the reporting organization, supports the organization’s goals, and serves the decision making needs of users, both internal and external to the organization. Higher uncertainty for indirect activities is acceptable as long as the data quality of the inventory is sufficient to support the organization’s goals and ensures that the inventory for indirect activities is still relevant. Two data quality schemes applied by First Mover stories are presented in Report 6 (p.74) and Report 7 (p.75).
1 See more about Accor’s goal and scope in Report 3 (p.52) and interpretation in Report 10 (p.82).
Report 7. Accor: Inventory and impact quantification for Accor’s environmental footprint
Type of data collected
The quantification of the inventory with a top-down approach and the estimation of environmental impacts were performed for each of the 11 activity categories separately. Within every category, Accor took into account key activity data referring to all the flows involved in Accor’s operation1. Activity data should be understood as the quantified translations of the operation (such as amount of kWh of energy used). Two types of data were collected: global and environmental. The former includes, for instance, the number of hotels, rooms, total area, number of meals and breakfasts. They were useful for extrapolations
and allocations and mostly obtained through corporate departments and Accor’s reporting system. The specific environmental activity data sources were the procurement department, Accor’s environmental reporting system, hotel census, and specific suppliers’ data collection.
The ‘hotel unit’ concept
Because, the group Accor includes around 3,500 hotels of different budget segments and situated in more than 90 countries, it was neither possible nor necessary for the goals of the study to provide specific data for each hotel. The inventory and impact assessment

76 Guidance on Organizational Life Cycle Assessment
Report 7. (Continued)
2 See more about Accor’s interpretation and uncertainty analysis in Report 10 (p.82).
Figure 16. Accor – Methodology used to estimate impacts at the group level. Source: PricewaterhouseCoopers Advisory (2011a).
Category #1
Impactsat the hotel unit level
Impacts consolidated at the Group level
Possible distinctions while consolidating the results: • impacts per source of impact• impact per regional zone & type of management• impacts per brand
Impactsat the hotel unit level
Activity dataScope: Variable (Brand, class of hotel, hotel, etc.)
Activity dataScope: Variable (Brand, class of hotel, hotel, etc.)
Environmental factor
Environmental factor
Category #11
were calculated at the hotel unit level. The hotel unit is an artificial concept that represents the aggregation of all the hotels which have a common brand, management type and country. A total of 359 hotel units were defined. To estimate the impacts of every activity at the hotel unit level, during data collection, some extrapolations and allocations were made on the basis of the number of rooms, the number of hotels, the area covered, the hotel brand, and the regional zones (Figure 16).
Environmental management indicators
Environmental factors were obtained from several databases, studies and literature not specific to Accor. They provide the link that converted the quantities (activity data) into the resulting environmental impacts (for instance, the kg of CO
2 eq. emitted per
kWh of energy used), depending on the indicators selected.
Environmental indicators were selected according to their relevance to the accom-modation services sector, to Accor’s environ-mental program priorities, and to their under-standability to stakeholders. Indicator selection was further limited by the availability of reliable assessment methods.
Three key inventory-level indicators for Accor were assessed: energy consumption (as primary resource), water use, and ultimate waste production, and two impact categories, climate change and water eutrophication. Some indicators were not assessed for some activities either because it was not feasible to assess the impacts of the activity to the indicator or because the activity did not represent a major contribution to the indicator.
Outputs of the assessment
Obtaining hotel units’ impacts offered Accor the possibility of different levels of assessment, for instance, the impacts of a brand, of Accor’s activities in a specific country, etc. According to the number of hotels represented in each hotel unit, the impacts at the whole company level were consolidated.
An overview of the overall reliability and accuracy of the “data sources used”, the “extrapolations, allocations and main hypotheses” and the “environmental factors” was also provided. The level of reliability of each item was rated low, medium or high, according to certain criteria. Accordingly, an evaluation of the reliability of the calculated environmental impacts for each activity was provided using the same scale2.
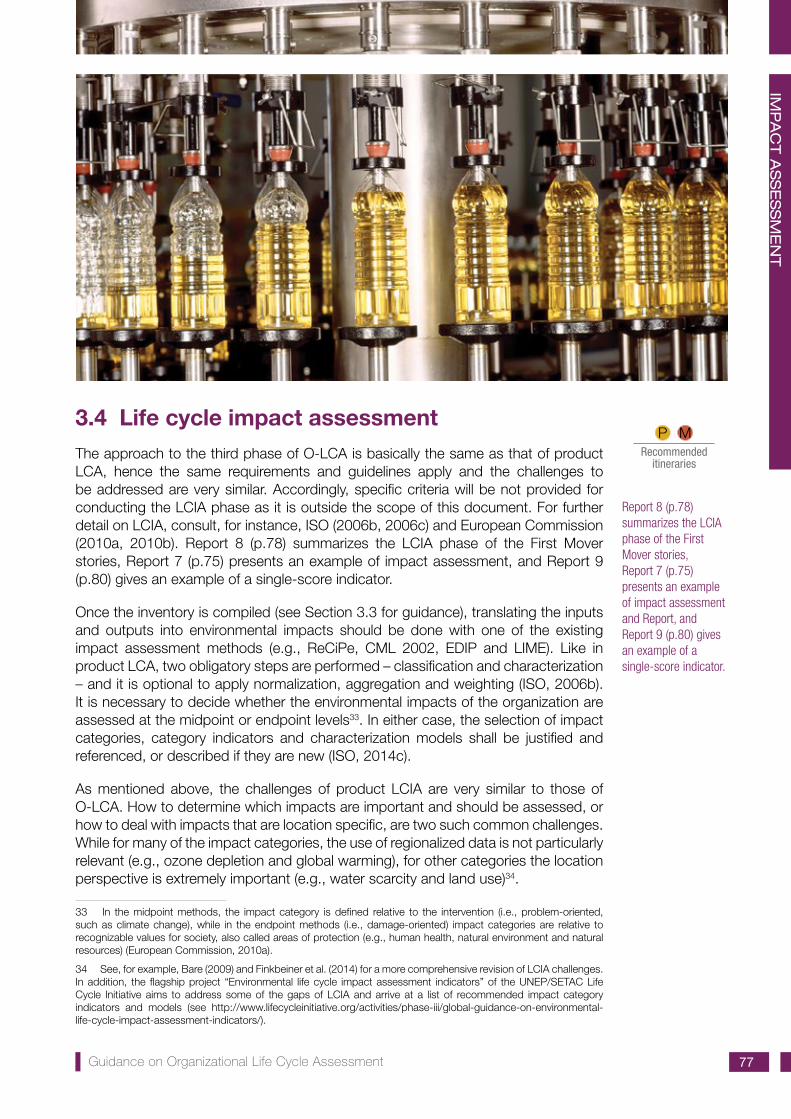
77Guidance on Organizational Life Cycle Assessment
IMP
AC
T A
SSE
SSM
EN
T
3.4 Life cycle impact assessmentThe approach to the third phase of O-LCA is basically the same as that of product LCA, hence the same requirements and guidelines apply and the challenges to be addressed are very similar. Accordingly, specific criteria will be not provided for conducting the LCIA phase as it is outside the scope of this document. For further detail on LCIA, consult, for instance, ISO (2006b, 2006c) and European Commission (2010a, 2010b). Report 8 (p.78) summarizes the LCIA phase of the First Mover stories, Report 7 (p.75) presents an example of impact assessment, and Report 9 (p.80) gives an example of a single-score indicator.
Once the inventory is compiled (see Section 3.3 for guidance), translating the inputs and outputs into environmental impacts should be done with one of the existing impact assessment methods (e.g., ReCiPe, CML 2002, EDIP and LIME). Like in product LCA, two obligatory steps are performed – classification and characterization – and it is optional to apply normalization, aggregation and weighting (ISO, 2006b). It is necessary to decide whether the environmental impacts of the organization are assessed at the midpoint or endpoint levels33. In either case, the selection of impact categories, category indicators and characterization models shall be justified and referenced, or described if they are new (ISO, 2014c).
As mentioned above, the challenges of product LCIA are very similar to those of O-LCA. How to determine which impacts are important and should be assessed, or how to deal with impacts that are location specific, are two such common challenges. While for many of the impact categories, the use of regionalized data is not particularly relevant (e.g., ozone depletion and global warming), for other categories the location perspective is extremely important (e.g., water scarcity and land use)34.
33 In the midpoint methods, the impact category is defined relative to the intervention (i.e., problem-oriented, such as climate change), while in the endpoint methods (i.e., damage-oriented) impact categories are relative to recognizable values for society, also called areas of protection (e.g., human health, natural environment and natural resources) (European Commission, 2010a).
34 See, for example, Bare (2009) and Finkbeiner et al. (2014) for a more comprehensive revision of LCIA challenges. In addition, the flagship project “Environmental life cycle impact assessment indicators” of the UNEP/SETAC Life Cycle Initiative aims to address some of the gaps of LCIA and arrive at a list of recommended impact category indicators and models (see http://www.lifecycleinitiative.org/activities/phase-iii/global-guidance-on-environmental-life-cycle-impact-assessment-indicators/).
P MRecommended
itineraries
Report 8 (p.78) summarizes the LCIA phase of the First Mover stories, Report 7 (p.75) presents an example of impact assessment and Report, and Report 9 (p.80) gives an example of a single-score indicator.

78 Guidance on Organizational Life Cycle Assessment
Report 8. Overview of impact assessment in the ‘First Mover’ stories
Environmental indicators beyond greenhouse gas emissions
The following is a general overview of the impact assessment approaches considered in the eleven First Mover stories incorporated in the Guidance. As previously mentioned, the most common impact category at the organizational level is climate change (usually presented as GHG emissions); accordingly, all the First Mover stories have considered this category1.
As an environmental multi-impact methodology, impact category indicators beyond climate change that are relevant to the sector should be included in O-LCA. Apart from impact category indicators, organizations often use additional indicators at the inventory level (see Box 9). Table 4 summarizes the environmental impact categories and the inventory-level indicators measured in the First Mover stories. As previously mentioned, in O-LCA, the differences in approach of the two types of indicators should be transparently stated.
1 Several reasons should be noted for such a broad use. First, climate change is one of the most well-known and addressed environmental threats worldwide. Second, several standards and methodologies to account for GHG emissions facilitate their quantification (see Annex C). Last, background data and examples for this indicator are widely available.
2 Generic impact categories and inventory-level indicators are used in the table. Impact methods and specific name of the indicators may be different in the First Mover Reports.
‘First Mover’ story
Environmental impacts category Inventory-level indicator
Clim
ate
chan
ge
Eutro
phic
atio
n
Wat
er fo
otpr
int
Land
use
Acid
ifica
tion
Phot
oche
mic
al
ozon
e cr
eatio
n
Ozo
ne la
yer
depl
etio
n
Hum
an to
xici
ty
pote
ntia
l
Oth
ers
Sing
le-s
core
Wat
er u
se o
r co
nsum
ptio
n
Was
te g
ener
ated
Ener
gy
cons
umpt
ion
Raw
mat
eria
ls
cons
umpt
ion
Accor u u u u u
BASF u o u u u u u u u u u
Colruyt Group u u u u u u u u u
Inghams1 u u u u u u u u u u
KPMG u u u u u u u u u
Mondelēz International u u u
Natura u o o
Shiseido u u
Storengy (GDF SUEZ) u u u o u
Unilever2 u u u
Volkswagen u
u Indicators assessed by the organization.
o Indicators with no complete data and/or not detailed in the reference documents of the organization.
Table 4. Environmental indicators assessed by the ‘First Mover’ stories2.

79Guidance on Organizational Life Cycle Assessment
IMP
AC
T A
SSE
SSM
EN
T
Only seven of the First Mover stories addressed environmental impact categories beyond climate change. The LCIA for Inghams included 12 impact categories, characterized at midpoint level, normalized per capita for the specific country and weighted using national average factors (see Report 9 on p.80). The retailer Colruyt Group performed the assessment for the fourteen categories recommended by the OEF Guide. Six additional impact categories, apart from climate change, were considered by BASF and KPMG, while normalization and aggregation were used. The hotel group Accor and the snacks producer Mondelēz International each included one additional impact category, namely, eutrophication and land use, respectively. Finally, Storengy assessed acidification and photochemical ozone creation, apart from climate change.
At the inventory level, the most used indicators among the First Mover stories were waste generated and water use or consumption throughout the value chain. For these indicators, each organization developed its own accounting approach, not always fulfilling all the LCA principles. Additionally, Accor and Storengy accounted
for the total energy consumption in primary MWh; while BASF calculated the cumulative energy demand (in MJ) and raw materials consumption.
Importance of upstream and downstream activities
Regarding the results, for most of the First Mover stories and indicators, value chain contribution to the total impacts was much higher than the impacts gate-to-gate of the organization. Two main steps of the life cycle were responsible for the relevance of these impacts in the assessed First Mover stories – provision of raw materials and use phase –, while transport, distribution, offices, processing sites, etc. had in general quite minor contributions. For instance, around 55% and 95% of total GHG emissions and water footprint of Mondelēz International, respectively, occurred during raw materials production, while manufacturing accounted for only 10% of the GHG emissions and was negligible for water footprint (see Figure 17). Similarly, production of food and beverages served by Accor contributed around 90% to its total impacts for water consumption and eutrophication. For the cosmetics producer Shiseido, the use phase was responsible of nearly 75% of its total GHG emissions and water consumption. A similar trend resulted for Unilever, a producer of food, household and personal care products. About 70% of the total GHG emissions took place during the use of Unilever’s products, mainly due to washing and showering products, while 25% of emissions were related to raw materials production and only 5% to manufacture of the final products. For the water indicator, the contribution of use phase was even higher with 85% of the total figure. For Natura, also devoted to the production and distribution of personal care products, extraction and transport of raw materials were the larger contributors to climate change, at slightly over 40%. However, use phase was not considered in this case. Finally, use phase represented about 75% of the total GHG emissions of
Volkswagen in the vehicles sector.
Figure 17. Mondelēz International – Corporate environmental footprint results for 20133.Source: adapted from Mondelēz International.
3 See more about Mondelēz International’s assessment in Report 18 (p.109).
Report 8. (Continued)
Raw M
ateria
ls
Packa
ging M
ateria
ls
Delivery
to M
fg.
Manufa
cture
Distrib
ution
Usage
Waste
Manag
emen
t
Busine
ss Tr
avel Climate
change
0%
2%
4%
60%
12%
100%
10%
90%
8%
80%
6%
70%
Blue water
Land occupation

80 Guidance on Organizational Life Cycle Assessment
The goals of Inghams, a chicken and turkey products company, were to identify environmental hotspots with the view to reduce impacts and costs, and improve products, processes and supply chains in Australia, as well as underpin Inghams’ marketing and communication initiatives. The study took approximately 6 months and covered cradle-to-retailer or quick service restaurant gate (i.e., the life cycle of chicken line from feed procurement and material acquisition to processing, production, distribution, and retail). Data was collected per Australian state when possible and the results were presented for the whole organization in Australia and per product1.
Report 9. Inghams: Single-score ecopoints for the chicken line division
1 See more about Inghams’ impact calculation per product in Report 17 (p.100).
A single-score overall environmental impact was measured in ecopoints with a weighted metric across 12 midpoint impact categories: abiotic resource depletion (minerals and nonrenewable fuels), acidification, eco-toxicity, eutrophication, global warming, human toxicity, ionizing radiation, land transformation and use, ozone depletion, photochemical smog, respiratory effects, and water consumption. The results for the overall impact, as well as for GHG emissions, water consumption, and consumption of non-renewable fuels are presented in Figure 18.
Figure 18. Inghams – Impact categories contribution by alternative life cycle input/stage. The results are presented per ton of generic chicken output.Source: adapted from Bengtsson and Seddon (2013).
In order to calculate the overall impact, the 12 environmental impact categories were normalized and weighted. A commonly used factor for normalization is the annual average per capita impacts of a citizen, hence impact categories were normalized using the total Australian impacts (around year 2008) divided by the population. This gave a common basis for comparison across impact categories by eliminating the different units of each impact category. Finally, each
of the environmental impacts was weighted according to their relative importance in Australia. Australian weighting factors from Howard et al. (2011) were used, which were derived from stakeholders’ opinions about the relative importance of the different impact categories. The opinions were sourced at eleven workshops conducted around Australia in major population centers, spanning all major climate zones, states and territories, and incorporating some regional centers.
0%
10%
20%
30%
40%
50%
60%
70%
80%
90%
100%
Overall (Ecopoints/t) Global warming (kg CO
2 eq/t)
Water consumption (L/t)
Non-renewable energy depl. (kg Sb eq/t)
Corporate & Overheads
Distribution & Cold Storage
Product Packaging
Meat Processing
Poultry Grow-out
Feed Production Plants
Feed Ingredients

81Guidance on Organizational Life Cycle Assessment
IMP
AC
T A
SSE
SSM
EN
T
One or a combination of reasons may drive the selection of the set of indicators, for instance, they were identified as hotspots in previous pilot or product assessments, are the most relevant for the sector, are required by regulations, are recommended by voluntary reporting, are already assessed at the on-site level (e.g., within EMS), etc. The selection of impact categories shall be consistent with the goal and scope of the study and take the stakeholders affected by the outcome into consideration. It shall reflect a comprehensive set of environmental issues related to the system being studied, in order to avoid unintended shifting of burdens (see more about the importance of environmental multi-impact approaches in Section 1.1). Other types of indicators are discussed in Box 9. Issues such as the choice of modeling and evaluation of impact categories may introduce subjectivity into the LCIA phase. Therefore, transparency is critical for the impact assessment to ensure that assumptions are clearly described and reported (ISO, 2006b).
Box 9. Particular indicators
It is important to note that environmental impact categories complying with the product LCA standards (ISO, 2006b, 2006c) are analyzing potential impacts, rather than predictions of actual environmental effects. Organizations may want to also quantify and show real impacts, particularly on-site. For example, they may add specific effects on the biodiversity of the region where the several facilities of the organization are located.
Additionally, it is currently typical for organizations to include inventory-level indicators, like waste produced, or water and energy consumed along the life cycle, as these are important metrics for organizations. However, this type of indicator does not integrate the impacts; for instance in the indicator ‘waste produced’, the total amounts of waste produced in different steps of the value chain are usually summed up without considering specific treatment processes for different types of materials, which could lead to a different intensity of impact. Water and energy consumption are two additional widespread inventory-level indicators, which may be substituted in the future by their equivalent impact category indicator, once regionalized impact assessment methods for water and improved abiotic depletion impact methods, respectively, are agreed in the scientific community.
The results for inventory-level indicators may be presented along with impact category indicators. However, it should be clearly acknowledged that the former do not reveal impacts and that the two types of indicators are not mutually exclusive, but provide different types of information. Moreover, the organization should check that no double counting occurs between the two types of indicators, as inventory data is also the source of data to calculate impact category indicators.
Single-score impact category indicators (i.e., expressing the results of the environmental multi-impact assessment with only one aggregated indicator) have potential for O-LCA (see Report 9 on p.80). Based on value choices, they ease the interpretation of the results for non LCA experts, like managers. However, single-score indicators hide information trade-offs and have higher uncertainties as long as normalization and weighting factors are used. If the organization is aware of the limitations of inventory-level indicators and single-score impact category indicators, they may be used in the study.

82 Guidance on Organizational Life Cycle Assessment
The results of the environmental footprint were a valuable input for Accor to define the main Corporate Social Responsibility (CSR) issues and the action plan for the following years1. Accor’s CSR evolved with the ambition to be a value differentiator for the whole hotel group. Results are also being used by Accor in order to raise awareness among its employees on the relevant environmental impacts.
Accor underlined that the main results and lessons of the study were in line with the set objectives. One of the key results was that carbon and energy were identified to be the first areas for progress for Accor as hotels’ on-site energy consumption accounted for 75% of Accor’s energy footprint and affected its carbon balance. Furthermore, food purchases accounted for most of the water consumed and polluted. Another key lesson was that building sites were a critical link in the waste production chain as 70% of the total waste was generated during the demolition (i.e., disposal of the inert waste) of hotels at their end-of-life.
The environmental results were comple-mented with an indicator of reliability (low,
medium or high), in order to reflect the robustness of the data used, methods, hypothesis, etc. For instance, data sources for the calculation of on-site energy use were considered highly reliable while the construction and renovation analysis was noted to the least reliable.
Sensitivity analyses were conducted in order to assess the influence of certain hypotheses on the results. The sensitivity analysis examined, for instance, the life expectancy value of hotel buildings, or the occupancy rates and attendance indexes values that were used. When possible, better hypotheses were defined and results recalculated.
The complete findings of this environmental footprint shaped Accor’s new sustainable development strategy, ”PLANET 21”, and its related action plan. The strategy defines 21 commitments and ambitious goals for achievement in 2015 and includes a program to inform guests and employees, and encourage them to contribute to reinventing hotel sustainability. An update of Accor’s footprint for 2013 is currently under development.
1 See more about Accor’s goals, scope and assessment approach in Report 3 (p.52) and Report 7 (p.75).
Report 10. Accor: Interpretation and uncertainty for Accor’s environmental footprint
3.5 Life cycle interpretation and uncertainty The fourth step of an O-LCA dealing with interpretation and uncertainty is analogous to that of product LCA, meaning that recommendations and requirements for the latter are applicable to the former. Therefore, as with the previous step, LCIA, only summarized guidance will be presented here. For further detail, see ISO (2006b, 2006c, 2014c). Interpretation phase and uncertainty are presented in a First Mover story in Report 10.
Interpretation is the phase of an O-LCA in which the findings from the inventory analysis and the impact assessment are considered together. The interpretation phase should indicate the consistency of the results according to all the aspects defined during the goal and scope phase. It is necessary to outline conclusions, explain limitations that have occurred, and provide recommendations.
Furthermore, interpretation should involve an iterative process. First, the significant issues are identified according to the inventory and impact results. Second, the
P MRecommended
itineraries
Interpretation phase and uncertainty
are presented in a First Mover story in
Report 10 (p.82).

83Guidance on Organizational Life Cycle Assessment
methodology and results are evaluated for completeness, sensitivity and consistency. The next step is to draw first conclusions and check that they are consistent with goal and scope. Finally, if the conclusions are consistent they can be reported; otherwise, it is necessary to revise the scope of O-LCA, improve the quality of data collected and impacts calculated and return to the first step of the interpretation (ISO, 2006c).
If an organization makes assumptions (e.g., about the importance of a particular raw material), these can be tested during the sensitivity analysis, with a view as to whether more work is needed on a given issue. If a certain raw material has been entered using general data, but then turns out to be very important for the O-LCA results, then more specific data could be added. In some cases, specific supplier data can be extremely important for the analysis results (Modahl et al., 2012).
Data sources and data quality assessment together with uncertainty assessment shall be carefully performed when dealing with an O-LCA (ISO, 2014c). The influence of data quality on the interpretation shall be mentioned. For instance, is the level of granularity of the data adequate for the goals of the study? Is there an appropriate balance between generic and specific data? When representative products by clusters were defined, how representative are these products of the total portfolio? Moreover, apart from the data, an evaluation of other issues that affect the uncertainty of the analysis (e.g., the model, the methods) shall be included, and an identification of the significant issues. The calculation of uncertainty of an O-LCA would not be much different than for a product LCA. In addition, the limitations associated to the uncertainty assessment itself shall be mentioned.
Apart from that, interpretation shall include the identification of the hotspots of the system with a significant dominance or contribution to the impacts of the organization or to its inventory. Hotspots can be identified at different levels depending on the level of aggregation of the data: business divisions, brands, inputs/outputs, stages/processes, facilities, suppliers, regions, products, etc. Finally, based on the results, it is necessary to answer the questions raised during goal and scope of the study, and advance recommendations whilst explicitly taking into account aforementioned limitations to the robustness and applicability of the results.
Conclusions and recommendations from the interpretation phase will support internal decision making and set the framework for environmental performance tracking and targets monitoring (see Section 4.3). Recommendations shall be based on the final conclusions of the study, once enough analysis-improvement iterations have been performed to fulfill the goals of the study.
INTE
RP
RE
TA
TIO
N A
ND
UN
CE
RTA
INTY

4. Operationalizing O-LCA
How can the organization use previous experience and information from other environmental tools, like EMS, product
LCA or GHG reporting?
Section 4.1
Are there any specific recommendations for the application of O-LCA in small and
medium organizations?Section 4.2
How can O-LCA support the organization’s decision-making?
Section 4.3.1
What can O-LCA contribute to the organization’s environmental strategy?
Section 4.3.2
Is it possible to track environmental performance over time?
Section 4.3.3
Can the organization use O-LCA information for product LCA?
Section 4.3.4
CHAPTER

85Guidance on Organizational Life Cycle Assessment
4.1 Specific features of O-LCA for experience-based pathways
In order to make O-LCA more operational, this section presents specific recommendations and tips on implementation for four pathways (as outlined in Section 2.3). The pathways are defined according to the organization’s previous
experience with environmental tools and the existence of environmental data. Organizations do not need to start from scratch if relevant data on their environmental performance at different levels are already available. A summary of guidance for the different elements of O-LCA application as it may apply to each pathway is given in Table 5 (pp. 86-7).
Tips for pathway 1: limited initial environmental experience and information
Organizations that have little or no initial environmental experience or data are classified within pathway 1 (see Section 2.3.1). Here, the assessment should start from scratch following the guidance provided in Chapter 3. Before starting O-LCA analysis, background research on relevant concepts like environmental analysis, sustainability, resource efficiency, etc. is recommended35.
Tips for pathway 2: existing environmental assessment gate-to-gate
Organizations with existing internal experience with environmental management and available results on-site may apply O-LCA using previous gate-to-gate assessment as a starting point (see Section 2.3.2). Available assessments could be used in two different ways. First, data on the environmental burdens of direct activities could be transferred to O-LCA, but its applicability would depend on which and how many environmental indicators were assessed and how comprehensive the assessment was. Second, a preliminary inventory of inputs and outputs (e.g., raw materials, intermediate products, energy, waste produced and products) of the reporting organization could guide the definition of the targeted suppliers. Report 11 (p.88) shows an intermediate example between pathways 2 and 3.
Tips for pathway 3: existing environmental life-cycle assessment at product level
Pathway 3 considers that the reporting organization has already undertaken LCAs for most of the products in the portfolio, or at least enough representative product LCAs to enable a sound estimation of the environmental impacts. In this case, the existing LCAs weighted by the amount of products that are produced during the reference period can be summed with the supporting activities, and other activities disregarded in the product LCAs, to complete the O-LCA (see the bottom-up approach in Sub-Section 3.3.3.B). See Report 11 (p.88).
If product LCAs are available for a small fraction of the product portfolio, the data can still contribute to the inventory of O-LCA (e.g., adopting a kind of hybrid approach, see Sub-Section 3.3.3.B). Furthermore, previous product assessments may assist in pinpointing hotspots (e.g., specific resources or emissions or specific impact categories) previously identified as relevant at the product level (see Section 3.3.2).
In both cases, it is critical to be consistent in the allocation and cut-offs for each of the product LCAs considered so as to avoid double-counting or gaps. Inconsistencies could lead to incorrect conclusions and decisions.
35 See for example: (Ellen MacArthur Foundation, 2014; UNEP, 2014; UNEP/SETAC, 2014).
Report 11 (p.88) shows an intermediate example between pathways 2 and 3.
EX
PE
RIE
NC
E-B
ASE
D P
ATH
WA
YS
PRecommended
itineraries

86 Guidance on Organizational Life Cycle Assessment
Steps in O-LCADimension addresseda
Organization on-site (Pathway 2) Product-LCAs (Pathway 3) Environmental aspect (Pathway 4)
Schematic diagramb
Goal and scope
GoalsInclude all the activities and environmental impacts of the activities beyond reporting organization’s sites, it means in the value chain.
Broaden the goals of the assessment beyond individual products to the organizational level, aiming to include all the activities of the organization.
Consider an environmental multi-impact approach, avoiding trade-offs between several environmental issues.
Reporting organization
The previous definition of the organization may provide the basis for defining the reporting organization. Usually, operational control is selected as the consolidation method, as EMS is recommended to be applied to activities controlled by the reporting organization.
Define the reporting organization from scratch.The organization has been already identified and defined. The same consolidation method may be used to define the reporting organization.
Reporting flow No specific recommendation.Previous product LCAs should involve representative products within the product portfolio.
Some previous data on the portfolio of the reporting organization exists.
System boundaryBoundaries of the system should be expanded to include indirect activities. Existing records on inputs and outputs may assist on the definition of the boundaries.
Overlapping the system boundary of the individual product LCAs plus the supporting activities may result in an approximate depiction of the system boundary. Pay attention to consistency in the cut-off rules.
Boundaries defined for a single-indicator assessment may provide the basis for defining the extended boundaries.
Life cycle inventory analysis
Identify involved activitiesMain direct activities and associated resource use and emissions in the value chain may have been identified according to mass, spending, etc.
Overlapping the activities assessed in the individual product LCAs plus the supporting activities.
All the activities with inputs or outputs contributing to other impact categories should be added.
Data collectionConsider data collection beyond site, i.e., supplier data and generic data for background processes.
If enough individual representative product LCAs are available and the data quality is suitable for the goals of O-LCA, the data collection should focus on supporting activities. The inventory will consist of the summation of the individual LCAs weighted by the amount of products manufactured during the reference period (in a similar way as presented for the bottom-up approach data collection, Section 3.3.3.B).
Collection of data for all resource use and emissions, aside from existing data for the previously assessed environmental aspect. Prior connections made with different levels of management in the organization and with suppliers will ease the compiling of the complete inventory.
Multi-functionality No specific recommendation.Criteria for multi-functional situations should be standardized for all the products and supporting activities.
Criteria for multi-functional situations should be standardized for all resource use and emissions.
Data quality requirementsNo specific recommendation.
Data quality at the product level will determine the quality of the organizational assessment. Existing data quality evaluations for product LCAs can be used.
Existing data quality evaluations for the environmental aspect assessed can be used.
Impact assessmentRegardless if it was done before, assess the environmental issues at the impact assessment level.
All impact categories and assessment methods should be agreed upon for all products.
Other impact categories apart from the aspect assessed should be included.
InterpretationHow the pathway has influenced the scope of the study should be analyzed.
How the pathway has influenced the scope of the study should be analyzed.
How the pathway has influenced the scope of the study should be analyzed.
a Because no additional tips are provided, pathway 1 was not included in the table.b Complete sketch is presented in Figure 4 (p.35). Parts highlighted in red represent the elements previously assessed in the specific pathway.
Table 5. Particular guidance for O-LCA implementation in pathways 2, 3 and 4.
On-site assessment
Impact category n
Prod
uct a
sses
smen
t
On-site assessment
Ozone layer depletion
Prod
uct a
sses
smen
t
On-site assessment
Climate change
Prod
uct a
sses
smen
t

87Guidance on Organizational Life Cycle Assessment
Steps in O-LCADimension addresseda
Organization on-site (Pathway 2) Product-LCAs (Pathway 3) Environmental aspect (Pathway 4)
Schematic diagramb
Goal and scope
GoalsInclude all the activities and environmental impacts of the activities beyond reporting organization’s sites, it means in the value chain.
Broaden the goals of the assessment beyond individual products to the organizational level, aiming to include all the activities of the organization.
Consider an environmental multi-impact approach, avoiding trade-offs between several environmental issues.
Reporting organization
The previous definition of the organization may provide the basis for defining the reporting organization. Usually, operational control is selected as the consolidation method, as EMS is recommended to be applied to activities controlled by the reporting organization.
Define the reporting organization from scratch.The organization has been already identified and defined. The same consolidation method may be used to define the reporting organization.
Reporting flow No specific recommendation.Previous product LCAs should involve representative products within the product portfolio.
Some previous data on the portfolio of the reporting organization exists.
System boundaryBoundaries of the system should be expanded to include indirect activities. Existing records on inputs and outputs may assist on the definition of the boundaries.
Overlapping the system boundary of the individual product LCAs plus the supporting activities may result in an approximate depiction of the system boundary. Pay attention to consistency in the cut-off rules.
Boundaries defined for a single-indicator assessment may provide the basis for defining the extended boundaries.
Life cycle inventory analysis
Identify involved activitiesMain direct activities and associated resource use and emissions in the value chain may have been identified according to mass, spending, etc.
Overlapping the activities assessed in the individual product LCAs plus the supporting activities.
All the activities with inputs or outputs contributing to other impact categories should be added.
Data collectionConsider data collection beyond site, i.e., supplier data and generic data for background processes.
If enough individual representative product LCAs are available and the data quality is suitable for the goals of O-LCA, the data collection should focus on supporting activities. The inventory will consist of the summation of the individual LCAs weighted by the amount of products manufactured during the reference period (in a similar way as presented for the bottom-up approach data collection, Section 3.3.3.B).
Collection of data for all resource use and emissions, aside from existing data for the previously assessed environmental aspect. Prior connections made with different levels of management in the organization and with suppliers will ease the compiling of the complete inventory.
Multi-functionality No specific recommendation.Criteria for multi-functional situations should be standardized for all the products and supporting activities.
Criteria for multi-functional situations should be standardized for all resource use and emissions.
Data quality requirementsNo specific recommendation.
Data quality at the product level will determine the quality of the organizational assessment. Existing data quality evaluations for product LCAs can be used.
Existing data quality evaluations for the environmental aspect assessed can be used.
Impact assessmentRegardless if it was done before, assess the environmental issues at the impact assessment level.
All impact categories and assessment methods should be agreed upon for all products.
Other impact categories apart from the aspect assessed should be included.
InterpretationHow the pathway has influenced the scope of the study should be analyzed.
How the pathway has influenced the scope of the study should be analyzed.
How the pathway has influenced the scope of the study should be analyzed.
a Because no additional tips are provided, pathway 1 was not included in the table.b Complete sketch is presented in Figure 4 (p.35). Parts highlighted in red represent the elements previously assessed in the specific pathway.
EX
PE
RIE
NC
E-B
ASE
D P
ATH
WA
YS
On-site assessment
Impact category n
Prod
uct a
sses
smen
t
On-site assessment
Ozone layer depletion
Prod
uct a
sses
smen
t
On-site assessment
Climate change
Prod
uct a
sses
smen
t
On-site assessment
Impact category n
Prod
uct a
sses
smen
t
On-site assessment
Ozone layer depletion
Prod
uct a
sses
smen
t
On-site assessment
Climate change
Prod
uct a
sses
smen
t

88 Guidance on Organizational Life Cycle Assessment
Report 11. Volkswagen: Use of existing EMS and product LCA for Corporate GHG Assessment
The Volkswagen Group, a vehicle and engines manufacturer, comprises twelve brands operating facilities across 27 countries and delivering almost 10 million vehicles per year. Volkswagen has set its sights on becoming the world’s most sustainable automobile manufacturer by 2018. In order to achieve this, the group environmental strategy sets ambitious goals in terms of production, product design and intelligent mobility concepts. Volkswagen defines the serious risks associated with climate change as a central challenge, and therefore, its environmental focus is on carbon. But it is
also committed to reductions in energy and water consumption, solvent emissions and waste for disposal.
Volkswagen reports regularly on its climate protection strategy to CDP (2014c). Within that context, in 2012, Volkswagen published its first scope 3 inventory using the data and experience it had acquired from previous applications of environmental analysis tools (Figure 19). To fulfill scope 1 and 2 inventories, Volkswagen used existing EMS data from most of its sites worldwide, which are often certified according to ISO 14001 (ISO, 2004a) and/or EMAS (European Commission, 2009).
Figure 19. Volkswagen – Data collection approach for Corporate Environmental Assessment.Source: adapted from Warsen (2013).
Regarding scope 3 emissions, Volkswagen reported 12 of the 15 categories defined by the GHG Protocol Scope 3 Standard (WRI and WBCSD, 2011a) with high automotive sector relevance, using data from existing vehicle LCAs. Since LCA is an integral part of Volkswagen’s environmental policy it has applied cradle-to-grave product LCA to a multitude of models over the past 20 years.
Scope 3 data for vehicles for which no specific LCA has been conducted yet, were derived from existing LCA figures from comparable models in the same segment. Sales-weighted LCA figures were added up in order to end up with an estimate of Volkswagen’s inventory. Quantification of remaining scope 3 categories was accomplished with other data sources.
Scope 1&2 Upstream Downstream
Resources Production Distribution &
storage Usephase End-of-life
[…] […] […] […] […]
LCA of vehicle 1
[…]
Resources Production Distribution &
storage Usephase End-of-life LCA of vehicle 2
[…]
EMS organization sites
89Guidance on Organizational Life Cycle Assessment
EX
PE
RIE
NC
E-B
ASE
D P
ATH
WA
YS
A pathway variant falling between pathway 3 and 4 involves the use of simplified product LCA methodologies for one single indicator (e.g., carbon or water footprints). Here, additional data for assessing the remaining impact categories should be collected. Refer to the last two columns of Table 5 for comments and recommendations.
Tips for pathway 4: existing single-indicator environmental assessment at the organizational level and including value chain
In this pathway, a previous assessment has been completed for the entire organization and its value chain for a single environmental indicator (e.g., GHG). Here, the review of the goal and scope of the single-indicator assessment can be applied to the definition of the goal and scope of O-LCA since a preliminary definition of the consolidation method and system boundary exists. However, evaluating additional impact categories implies collecting new data for the emissions not yet assessed, as well as data on resource consumption. Connections established between different internal management levels and with suppliers during the single-indicator assessment process will facilitate the collection of the complete inventory.
4.2 Simplification strategies for small and medium organizations
This section gives specific recommendations for the use of O-LCA by small and medium organizations36. Considering the case of an SME, the reporting organization is perhaps easier to define and likely has a closer relationship and influence over its own site(s) of operation. However, an SME may have less influence over its suppliers if it purchases only a small share of their production. Table 6 (p.90) presents recommendations and guidelines for SMEs, arranged according to the steps of O-LCA.
4.3 O-LCA integration into management and decision systems
This section explores how organizations can apply the outcomes from O-LCA within its management control and decision system. Three interconnected uses – decision making, target setting and performance tracking – are described below. Parts of these internal uses provide the basis for the organization’s communication to third parties (see Chapter 5). Complementarily, 4.3.4 presents how O-LCA results could be used for a generic assessment of product level. How similar approaches to O-LCA were used and their benefits are illustrated in Report 12 to Report 17 (pp.91-100).
4.3.1 Decision making
An increasing number of organizations are incorporating environmental criteria into their decision-making systems, alongside economic, technical and other aspects. O-LCA is an excellent support framework that provides environmental information at the organization level and, depending on the scope, at more disaggregated levels (e.g., activity, business division, brand, region or facility).
36 Small and medium organizations are represented here by SMEs, following the reasoning given in Sections 1.2 (p.16) and 2.3 (p.29).
PRecommended
itineraries
DRecommended
itineraries
How similar approaches to O-LCA were used and their integration into management and decision systems are illustrated in Report 12 to Report 17 (pp.91-100).

90 Guidance on Organizational Life Cycle Assessment
Steps in O-LCARecommendations for small and medium organizations
Goal and scope
Goals
Very often, application of O-LCA by SMEs is motivated by requests from larger organizations purchasing their products, although it could benefit the organization in many other aspects. See Section 2.2.
Reporting organization
The definition of the reporting organization is straightforward. In most cases, the subject of study is the entire organization. Without jointly owned operations, the selection of the consolidation method has no effect on the results. One-year reporting period is particularly recommended for SMEs, as it is the most common and can facilitate reporting to third parties.
Reporting flowThe product portfolio is usually recorded by the SMEs in its site(s) and can easily be aggregated.
System boundary
The smaller size and fewer interconnections of SMEs should make it easier to describe the value chain and identify suppliers.
Very often, SMEs are suppliers of larger companies, which in turn, sell the final products to consumers. This makes modeling of the use phase and EoL a difficult task. Therefore, SMEs would likely select cradle-to-gate assessments.
Life cycle inventory analysis
Identify involved activitiesSMEs should identify direct and indirect activities in its site(s) and bring them together in the inventory.
Data collection
The same recommendations apply during the prioritization of data collection and the preference for specific data. In order to reduce costs, specific data may be estimated with activity data.
Impact assessment
When O-LCA outcomes are used to answer stakeholder’s requests, it is recommended to directly apply assessment methods suggested by the stakeholder. Otherwise, use broadly used indicators (see Table 4, p.78).
Interpretation No specific recommendation
Table 6. Complementary recommendations for a simplified implementation of O-LCA in small and medium organizations.

91Guidance on Organizational Life Cycle Assessment
Report 12. Natura: Carbon Neutral Program
SCOPE 3 (E3)
SCOPE 3 (E3)
SCOPE 3 (E3)
SCOPE 3 (E3)
CARBON CYCLE AT NATURANATURA’S EMISSIONS CHAIN 2010
42% 10%
10% 15% 23%
Extraction and transport of raw materials and packaging
Natura’s own industrial process and other internal processes
Direct inputs Transportation of products to consultants and consumers
Final disposal of products and packaging
SOME EXAMPLES OF WHERE THE EMISSIONS OCCUR
Emissions generated in the final disposal of our products (raw materials and packaging materials) after their use.
Emissions generated by transporting our products to the 1.2 million sales consultants in the countries where we operate.
Estimated emissions from the transport of our products from sales consultants to end consumers.
Consumption of fuel by the vehicles of executives and the sales force.Emissions from out effluent treatment station.SCOPE 2 (E2)
Electrical energy used at our facilities.SCOPE 3 (E3)
Air travel, transporting people, exports.
Emissions generated in the processes of our suppliers for the production of our raw materials and packaging materials, such as the consumption of electrical energy or fossil fuels.
Emissions from transporting these materials to Natura.
SCOPE 1 (E1)Emissions generated in the processes of our suppliers for the production of our raw materials and packaging materials, such as the consumption of electrical energy or fossil fuels.
Emissions from transporting these materials to Natura.
The manufacturer and marketer of cosmetics, fragrances and personal care products Natura has launched several initiatives to minimize its environmental impacts. For instance, it has applied LCA since 2000 with a simplified LCA calculation for packaging implemented for all products and consolidated at company level. In 2007, Natura created its Carbon Neutral Program to promote an ongoing and significant reduction of its GHG emissions and limit the impact Natura causes.
Natura created its own GHG emission inventory, based on the standards of the Greenhouse Gas Protocol initiative and on ISO 14064-1 (ISO, 2006d). The company chose a broad scope in this respect, including the emissions generated by activities ranging from the extraction of raw materials to the final disposal of products and packaging, and including all the steps related to processing and transportation.
The Carbon Neutral Program is divided into three stages that guide Natura’s actions to continually improve and streamline its processes. The first stage is the annual corporate inventory, which comprises a quarterly follow-up and a multi-year plan based on a projection of future emissions. The second stage focuses on actions and processes aimed at reducing GHG emissions (see Figure 20). The calculated indicators and
the emission reduction targets are incorporated into each macro-process conducted by Natura, complementing other performance indicators (e.g., company financials). The third stage of activities is to offset all emissions that cannot be avoided. To this end, Natura organizes volunteer projects selected on the basis of a tender. The first main target of the program was to reduce Natura’s carbon footprint by 33% in a five year period, which was achieved on-time in 2013.
Looking ahead, new ambitions and targets have been set for 2020, translating Natura’s strong commitment to progress on the implementation of an advanced management system. This includes a new GHG emissions reduction target of 33% compared to 2012 levels, together with a much broader range of targets and indicators based on life cycle thinking. Natura is working on other indicators to address the demand for material indicators and business-based measurements. For example, it has developed a waste inventory guided by a life cycle perspective that considers the volumes of waste generated. In addition, a water footprint model is currently under development that considers the supply chain as well as products’ use phase, while cross-referencing regional water availability and water treatment data.
Figure 20. Natura – GHG emission chain 2010 and examples of reduction measures. Source: Natura.
O-L
CA
IN M
AN
AG
EM
EN
T

92 Guidance on Organizational Life Cycle Assessment
KPMG offers Audit, Tax and Advisory services, and it is strongly committed to reduce its environmental impacts by establishing strategic and operational mechanisms for sustainability management, such as the Global Green Initiative (GGI). GGI was launched in 2008 by KPMG International with the aim to measure, report and reduce net GHG emissions. Currently more than 40 member firms are participating in the program, including KPMG in Mexico.
Goals of KMPG in Mexico
As a part of the global sustainability strategy of KPMG International and in parallel to the implementation of the GGI in Mexico, the Sustainability Committee of KPMG in Mexico has implemented a life cycle approach for a service organization. It has helped to encourage KPMG in Mexico and key stakeholders (e.g., suppliers, clients and communities) to raise their environmental awareness, modify consumption patterns, use natural resources responsibly, choose the right waste management options, and engage stakeholders in commitments and responsibilities.
Corporate environmental footprint
KPMG in Mexico has quantified its overall environmental footprint following the ISO 14040 and 14044 standards for product LCA for seven years, allowing effective and efficient decisions on sustainability issues along its supply chain. This positions KPMG in Mexico as one of the first companies to apply LCA at the organizational level in Latin America.
KPMG in Mexico’s environmental footprint is the sum of all potential environmental impacts that occur during the life cycle of the services provided by the firm. The scope of the assessment considers the operations of KPMG in Mexico’s three main offices –
Mexico City, Monterrey and Guadalajara – representing 92% of full-time equivalent employees. The environmental footprint is calculated referenced to the functional unit of “the activities of KPMG in Mexico during one year”. The impact assessment methodology used is ReCiPe, adjusted for local human health, ecosystem quality and resource depletion characteristics.
Environmental footprint strengthens sustainability management
Consistent with previous years, the 2013 environmental footprint results indicate that air and road transportation, and electricity consumption represent more than 90% of the organization’s total environmental footprint. KPMG in Mexico has, therefore, focused along the years on reducing transportation and electricity consumption through a series of internal policies.
The travel policy has been revised and updated to promote the use of virtual offices with video conferencing solutions as an alternative to air travel. Electricity consumption savings strategies include the installation of energy saving bulbs, the configuration of laptops with energy saving modes, and the upgrading of physical servers to virtual environments.
Though waste generation contributes little to the overall environmental footprint, several awareness raising actions have been implemented, for example, to encourage the reduction of unnecessary printouts by requiring personal passwords and monitoring the number of prints made per employee.
The environmental footprint has enabled KPMG in Mexico to identify the best opportunities for integrated sustainability management and implement actions to continuously reduce its environmental impacts.
Report 13. KPMG: The corporate environmental footprint supports sustainability management of KPMG in Mexico1
1 Summary prepared by the Center for Life Cycle Assessment and Sustainable Design (CADIS) as environmental footprint advisor of KPMG in Mexico.

93Guidance on Organizational Life Cycle Assessment
Enhancing insight
Decision making requires comprehensive knowledge about the entire system in question. O-LCA enables a better mapping of the organization, its value chain, the stakeholders involved, etc. It helps the organization understand the interlinkages between the activities and processes involved along the value chain and the environmental impacts of its product portfolio. Decision making based on the outcomes of O-LCA should take data quality and uncertainty of the results into account.
Through O-LCA results, the organization gains insights into the current environmental risks and impact reduction opportunities, and can formulate strong arguments for effective actions to reduce its environmental impacts. Such actions can be divided into production, managerial and supplier level, as outlined in Box 10. Several actions undertaken by Natura and KPMG are described in Report 12 (p.91) and Report 13 (p.92), respectively.
Forecasting scenarios
A completed O-LCA model enables the organization to test the effect of proposed actions or measures using scenarios (see Report 14 on p.95), and forecast the environmental savings or trade-offs between impact categories. Scenarios should be accompanied by transparent and clear explanations of the assumptions considered. They should not be made publicly available since they represent fictitious outcomes and can be easily misunderstood or even misused.
Stimulating data collection efforts
O-LCA results identify where additional effort may be required or where further analysis may be necessary to take decisions. Sometimes, the granularity of the study is found to be too coarse for certain decisions. These situations can be addressed by, for example, collecting more disaggregated data, performing specific measurements, using background data for the specific sector, or performing product LCA to pinpoint impact reduction opportunities in selected products’ life cycles.
O-L
CA
IN M
AN
AG
EM
EN
T
Several actions undertaken by two First Movers are described in Report 12 (p.91) and Report 13 (p.92)
The use of scenarios to test the effect of proposed actions and measures is illustrated by Report 14 (p.95)

94 Guidance on Organizational Life Cycle Assessment
Box 10. Examples of actions to reduce environmental impacts
Actions at the production level1:
• Explore:
» the use of new materials,
» new designs to reduce the amount of consumed resources per unit of product,
» new techniques to reduce or neutralize emissions.
Actions at the managerial level:
• Train workers on environmental issues and more eco-friendly practices (see Report 16 on p.99).
• Conduct a campaign to modify consumer behavior.
• Explore ways to communicate with less support materials and travel.
Actions at the suppliers’ level:
• Set minimum requirements and recommendations for suppliers.
• Promote and support improvements in the production techniques of suppliers.
• Promote the use of environmental assessment methodologies, and particularly O-LCA, among suppliers.
Actions at the value chain level:
• Seek out alliances and new business models with different actors in the value chain, which demonstrate superior environmental performance.
1 More actions are proposed in the theme Resource Efficient and Cleaner Production of UNEP (2014).
The application of O-LCA may also spur the organization to develop or improve data collection, gathering and management systems. Stimulated by the need for data when applying environmental assessment tools, Shiseido developed new data management systems at the corporate and product level, called CLIP and CLIC in Report 1 (p.41). Here, the implementation of a homogeneous system to gather data from different departments, business divisions and sites of the organization is highly recommended.37 Beyond the obvious use for environmental analysis, the data may also be valuable for use in other departments.
4.3.2 Setting targets within the organization’s environmental strategy
Any robust organizational strategy requires setting targets (e.g., for revenues, sales, other core indicators), and tracking performance against those targets. Environmental
37 Within the context of the UNEP/SETAC Life Cycle Initiative, some general requirements and proposals in the global guidance UNEP/SETAC (2011) may be helpful for organizations to develop their own data systems.
New data management
systems developed at the corporate and product level (called CLIP and CLIC) are
presented in Report 1 (p.41).

95Guidance on Organizational Life Cycle Assessment
O-L
CA
IN M
AN
AG
EM
EN
T
100% 100% 100% 100%
87%
68%
94% 101%
0%
20%
40%
60%
80%
100%
120%
Global warming (CO2 eq)
Stratospheric ozone creation
(kg NMVOC eq)
Acidification (kg SO2 eq)
Non-renewable primary energy
consumption (MJ)
2011 Initial scenario Massive electro-compressors scenario
The study results of Storengy1 showed that industrial activities contributed more than 91% to all the indicators assessed, and that natural gas compressors comprised a high proportion of Storengy’s overall impacts. Several scenarios for potential improvement were tested through the analysis of the results2, three of which are summarized here.
First, to reduce its CO2 emissions, Storengy
engaged in its industrial policy to replace old compressors (turbochargers) with more efficient new compressors (electro-compressors). The replacement reduces the natural gas combustion emissions, as well as certain direct discharges of CH4 and NMVOC. This scenario indicates improvements on the order of up to 32%
Report 14. Storengy: Improvement scenarios and savings quantification
for stratospheric ozone creation, 13% for global warming and 6% for acidification (see Figure 21). The second scenario prioritized high-speed train (TGV) to aircraft when travel time was similar, and the third proposed the recovery of direct discharges of CH4 during chromatography operations. Savings for the latter two measures were almost negligible though they still represented environmental improvements at a low environmental cost.
In general, the methodology enabled Storengy to measure the potential improvements by the proposed actions. Additional potential gains identified in other scenarios were not quantifiable at that stage of the study due to a lack of required data, and require specific studies in the future.
1 See more about Storengy’s study in Report 6 (p.74).
2 This information was obtained from the confidential report of the organization (CRIGEN, 2012).
Figure 21. Storengy – Scenario replacement of some turbochargers with electro-compressors.Source: adapted from CRIGEN (2012).

96 Guidance on Organizational Life Cycle Assessment
Figure 22. Unilever – The main pillars and themes of the Unilever Sustainable Living Plan. Source: Unilever (2014).
1 See more about Unilever’s global environmental footprint in Report 5 (p.67).
2 “Product Analyser”. http://www.unilever.com/flash/ProductAnalyser/ProductAnalyser.aspx.
3 “Inspiring sustainable living: expert insights into consumer behaviour & Unilever’s five levers of change”. http://www.unilever.com/images/slp_5-Levers-for-Change_tcm13-276807.pdf.
The first results of Unilever’s global environmental footprint1 were communicated at the launch of the Unilever Sustainable Living Plan (USLP) in 2010. The corporate footprint not only provides footprint data for reporting but also supports innovation tools, provides guidance for the innovation process, and enables systematic anticipation of innovations’ impacts.
Key features of the USLP include its relevance to all of Unilever’s brands, products and markets, its life cycle based approach and its focus on all three dimensions of sustainable development. The USLP defines three pillars – health and well-being, environment, and livelihoods – which contain over 50 public, time bound goals specified across 9 themes (see Figure 22). This articulates Unilever’s ambitious target of doubling the size of the business by 2020 while reducing its overall environmental impacts.
The themes were mainly chosen because of their scientific relevance and scale of impact for Unilever’s portfolio. Unilever has conducted a number of assessments over the past 15 years that have helped identify the major emissions and hotspots across the value chain. Furthermore, other factors affected the selection, such as the relevance of themes to external stakeholder expectations and Unilever’s ability to quantify the metrics.
The Unilever Footprint has been updated three times and is planned for annual updating. This is only possible because of a significant improvement in the footprinting processes and the development of bespoke data validation and reporting tools that hold and manage data from the different business IT systems. In addition, there have been significant improvements in data quality, increased granularity and number of representative products enabling greater specificity and brand-level assessments and reporting. Actions in other areas, including biodiversity, are also reported.
It is possible to see the data behind the USLP through an app on the Unilever webpage called “Product Analyser” that shows the environmental impacts of a selection of Unilever’s products across their life cycle2. The app provides the GHG, water or waste impacts of few representative food, or home or personal care products on a ‘per consumer use’ basis. For Unilever, influencing the behavior of individual consumers is a keystone to achieve the reduction targets since the use phase and end-of-life significantly contribute to the total impacts. To this end, Unilever published the behavior change model “Five levers for change”3 which comprises a set of key principles for reducing impacts.
Report 15. Unilever: Sustainable Living Plan

97Guidance on Organizational Life Cycle Assessment
O-L
CA
IN M
AN
AG
EM
EN
T
A real example of how a First Mover implemented performance tracking is presented in Report 16 (p.99).
Report 15 (p.96) presents the example of an environmental strategy.
management is no different. Common reasons for setting and tracking environmental targets include minimizing future risks and stimulating innovation, preparing for future regulations, and due diligence reporting, for instance, via voluntary reporting programs (WRI and WBCSD, 2004). Report 15 (p.96) presents the example of Unilever’s environmental strategy.
An environmental multi-impact life cycle approach, such as O-LCA, is the most effective and efficient way to inform an environmental strategy. Because O-LCA provides the current measure of an organization’s environmental performance, it can be used as the basis for target setting, and provide a framework for tracking the achievements of the goals, as described in Section 4.3.3. Furthermore, hotspots identified throughout the value chain through O-LCA (e.g., certain sites, processes, types of products) may lead the organization to set specific targets to address these, while also taking the organization’s commitments, stakeholders concerns, legal requirements, etc. into account.
Types of targets
A target should be defined as a ‘quantified reduction’ to be achieved in a ‘target year’ on the basis of a ‘reference year’. The target is measured either in absolute (e.g., cubic meters) or relative (e.g., percentage) terms, and can be presented for the entire organization or as an intensity or efficiency measure (e.g., reduce water consumption per unit of revenue). Global or specific targets can be defined for both direct and indirect impacts.
Recommendations for target setting
Setting targets for different impact categories ensures the avoidance of trade-offs between environmental aspects. Setting global targets for the entire organization and value chain is recommended in order to avoid trade-offs between different activities along the value chain, Setting specific targets for certain activities, products, business divisions, brands, regions or facilities due to specific circumstances provides additional metrics. It is recommended to define the targets at the impact level, not at the inventory level, as indicators like mass or volume do not always reflect the most significant resource use and emissions impacts. Organizations should define both long-term targets to facilitate long-term planning and large capital investments, and intermediate targets to encourage more frequent progress measurement. See WRI and WBCSD (2004, 2011a) for more detailed Guidance on target definition.
4.3.3 Environmental performance tracking
There are multiple reasons for an organization to expand existing performance tracking schemes to integrate the environment. The most common performance tracking goals are: to track the results of the decisions taken (see Section 4.3.1); to set environmental performance targets and monitor them (see Section 4.3.3); to report and communicate with third parties (see Chapter 5). A real example of performance tracking is presented in Report 16 (p.99).
Maintaining consistency
Performance tracking of an organization is defined as the comparison of the performance of the same organization’s products and operations over time, based on a consistent reference period, system boundary and reporting organization (ISO,

98 Guidance on Organizational Life Cycle Assessment
2014c). However, organizations are not static entities but evolve over time, thus the results of the assessment in the compared periods may use slightly different reporting organizations. A given tolerance is allowed by ISO/TS 14072 (ISO, 2014c) to state that two reporting organizations are the same. The degree of divergence that can be overlooked is primarily conditioned by the goal and scope, and should be quantified and transparently reported. Similarly, for performance tracking, a given tolerance is allowed for the time period, the system boundary, and the products and operations over time.
Comparison time period
The typical time period for comparisons is one year. Furthermore, a baseline period may be defined if, for example, reduction targets are to be monitored. When the targets and the baseline period are established in the first year that O-LCA is applied, they might be considered to be preliminary due to the likely improvements in the approach and data collection in the following iterations. The organization may, therefore, consider the adaptation or replacement of the original baseline in subsequent editions.
Managing organizational and data change
Organizations often undergo structural changes such as acquisitions, mergers, outsourcing, and divestments, which can affect the definition of the reporting organization. This, in turn, alters the historic impact performance of the organization, making meaningful comparisons over time more difficult. When significant changes occur, the organization should recalculate the historical impact performance.
Variations in system boundary, calculation methods, improvements in data accuracy, or discovery of significant errors may also pose challenges for performance tracking. Not only major changes can be deemed significant, but many small changes can also be cumulatively significant. It is the responsibility of the organization to determine the ‘significance threshold’ that triggers baseline period and historic impact performance recalculation. As an alternative to recalculating impacts, organizations may reestablish the baseline period to a more recent year.
The chapters devoted to reporting and tracking in WRI and WBCSD (2004, 2011a) show how to recalculate the baseline period and the historic impact performance specifically for the case of reporting of GHG emissions. The requirements are similar for O-LCA, however, reporting and performance tracking are less straightforward, when the number of indicators increases.
Accounting for reporting flow changes
A further challenge for performance tracking is when the reporting flow evolves over time (e.g., due to an increase in sales or a new product in the portfolio). A portion of the changes in the environmental impact profile may not be a consequence of changes in resource use efficiency and/or emissions per unit of product, but due to variations in the reporting flow. An increase in environmental impacts due to an increase in production should be reflected in performance tracking. If the comparison is not in absolute values but per revenue, increases or decreases in the production are indirectly incorporated (although fluctuations in the prices would add uncertainty to the results). Quantifying variations in the reporting flow over time

99Guidance on Organizational Life Cycle Assessment
O-L
CA
IN M
AN
AG
EM
EN
T
1 See more about the project in Report 2 (p.44).
2 Eco-efficiency analysis, first coined by the World Business Council for Sustainable Development (WBCSD), is a tool for quantifying the relationship between economic value creation and environmental impacts, throughout the entire life cycle of a product. In other words, to be eco-efficient is to add more value to a product while simultaneously decreasing adverse environmental impacts. See for example: http://www.epa.gov/sustainability/analytics/eco-efficiency.htm. A standard also exists for product systems that describes the principles, requirements and guidelines for eco-efficiency assessment (ISO, 2012).
3 See “Eco-Efficiency Analysis” for additional detail on the concepts behind the eco-efficiency matrix, in https://www.basf.com/group/corporate/site-ludwigshafen/en/sustainability/eco-efficiency-analysis/eco-efficiency-analysis.
One of the main outcomes of the Demarchi industrial complex project1 was the comparison of its environmental performance over time, which enabled the evaluation of impact trends and identification of relevant effects on impact distribution due to changes in the production units. The same methodology was used for the assessment in 2010, 2011 and 2012, and the portfolio mix and proportions of production at Demarchi sites were fixed for consistency.
Figure 23a shows the implemented performance tracking scheme. A web chart was used with 2010 as the base year for comparing impact changes. Depletion of natural resources increased over time, while the impacts were reduced for the other categories. For each impact category, disaggregated results were provided per production unit, and divided into direct and indirect impacts (see Figure 23b for cumulative energy consumption).
Report 16. BASF: Environmental performance tracking and other sustainability schemes
An assessment of economic performance was undertaken to take the costs required to fulfill customer needs (e.g., cost of production, investments, application, disposal, etc.) into account. The data from the environmental and economic assessments was then fed into an eco-efficiency analysis (EEA)2, and compared over time. In fact, BASF was one of the first companies to establish an EEA methodology in the early 1990s and to use the eco-efficiency matrix3.
The other pillar of the Demarchi project was education for sustainability, which promoted sustainable development by stimulating behavior change, achieved through the internalization of concepts and practices by managers and workers. Four steps were defined for the process – sensitization, awareness, training, and reality transformation – and included several tools (e.g., workshops, games, and training sessions).
Figure 23. BASF – Performance tracking schemes: (a) overall impacts considered (left) and (b) specific results for cumulative energy consumption (right). Source: Fundação Espaço (2014).
Cumulative energy consumption
Land use Emissions
Demarchi + value chain
Production unit 1
2010
25000
MJ/
func
tiona
l uni
t 20000
15000
10000
5000
020102011 20112012 2012
Production unit 2
Production unit 3
Production unit 4
Production unit 5+6
Production unit 7
DemarchiHuman toxicity
potential
Depletion of natural resources
Potential accidents and occupational diseases
2010 2011 2012

100 Guidance on Organizational Life Cycle Assessment
Report 17. Inghams: Economic allocation of environmental impacts among main chicken product categories
The study focused on Inghams’ chicken line division1, which represents its largest division in Australia. Chicken accounts for more than 90% of Inghams’ output. This line includes a wide range of plain, ready to cook and ready to eat chicken products. Because the inventory data was mostly collected at the organizational or state level and the company wished to present the environmental impacts per product, an approach was needed to determine how the environmental impacts should be assigned to each of the co-products.
Allocation method
To accomplish the goal, economic allocation was used, following the requirements and guidelines in leading Australian LCA and LCI methodologies (Howard, 2011). The project team conducting the study considered that, in addition to allowing for consistent allocation up and down supply chains, economic allocation reflected the objective of the industry which was to generate profit, not mass or energy. Hence, the principle products – several chicken meat products
for human consumption – were attributed all the process burdens. A very small portion was allocated to the by-products (e.g., feathers, blood, lungs, skins and trims) with low economic value. In comparison, a mass allocation would have allocated about half of the burden to the principal meat products and half to the less valued by-products.
Generic LCAs for product categories
The LCA was conducted at the facility or enterprise level, establishing impacts in average per ton chicken production terms. Three main products were considered representative of the whole Inghams production, and thus all the different products were grouped in the categories ‘whole bird’, ‘breast fillet’ and ‘chicken schnitzel’ (see Figure 24).
Allocation to primary processing meat products (i.e., whole bird, breast fillet and other produce) was based on the relative wholesale price at the factory gate of individual product categories compared with the average total fresh produce wholesale value (see Figure 24). Consequently, using
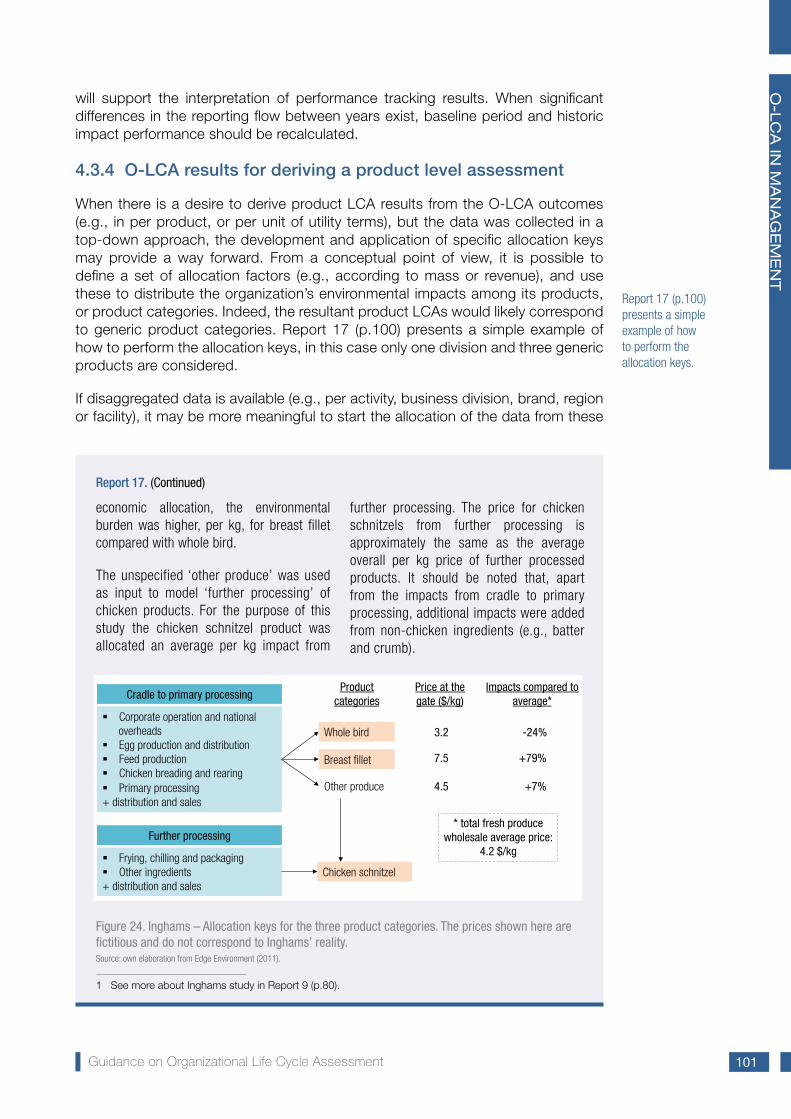
101Guidance on Organizational Life Cycle Assessment
Report 17 (p.100) presents a simple example of how to perform the allocation keys.
Corporate operation and national overheads Egg production and distribution Feed production Chicken breading and rearing Primary processing
+ distribution and sales
Cradle to primary processing
3.2 -24%
7.5 +79%
4.5 +7%
Product categories
Price at the gate ($/kg)
Impacts compared to average*
Frying, chilling and packaging Other ingredients
+ distribution and sales
Further processing
Whole bird
Breast fillet
Other produce
Chicken schnitzel
* total fresh produce wholesale average price:
4.2 $/kg
1 See more about Inghams study in Report 9 (p.80).
Figure 24. Inghams – Allocation keys for the three product categories. The prices shown here are fictitious and do not correspond to Inghams’ reality.Source: own elaboration from Edge Environment (2011).
economic allocation, the environmental burden was higher, per kg, for breast fillet compared with whole bird.
The unspecified ‘other produce’ was used as input to model ‘further processing’ of chicken products. For the purpose of this study the chicken schnitzel product was allocated an average per kg impact from
further processing. The price for chicken schnitzels from further processing is approximately the same as the average overall per kg price of further processed products. It should be noted that, apart from the impacts from cradle to primary processing, additional impacts were added from non-chicken ingredients (e.g., batter and crumb).
Report 17. (Continued)
will support the interpretation of performance tracking results. When significant differences in the reporting flow between years exist, baseline period and historic impact performance should be recalculated.
4.3.4 O-LCA results for deriving a product level assessment
When there is a desire to derive product LCA results from the O-LCA outcomes (e.g., in per product, or per unit of utility terms), but the data was collected in a top-down approach, the development and application of specific allocation keys may provide a way forward. From a conceptual point of view, it is possible to define a set of allocation factors (e.g., according to mass or revenue), and use these to distribute the organization’s environmental impacts among its products, or product categories. Indeed, the resultant product LCAs would likely correspond to generic product categories. Report 17 (p.100) presents a simple example of how to perform the allocation keys, in this case only one division and three generic products are considered.
If disaggregated data is available (e.g., per activity, business division, brand, region or facility), it may be more meaningful to start the allocation of the data from these
O-L
CA
IN M
AN
AG
EM
EN
T

102 Guidance on Organizational Life Cycle Assessment
sub-levels. Disaggregated data is highly recommended, particularly for international and multi-sectorial organizations with very broad product portfolios. Inghams used data from the chicken division to create the chicken product categories in Report 17 (p.100); a similar allocation approach could be applied to other divisions and corresponding product categories like turkey and pet foods. This would have provided more meaningful results than using Inghams’ global results to calculate the impacts of categories including chicken, turkey and pet food products.
The generic LCAs would be highly dependent on the allocation rule selected, and may not be fully relevant to the products that would eventually be allocated. In the interest of transparency, the assumptions behind the distribution of impact(s) among products should be clearly stated alongside the results. Any related public communications should indicate that the impacts correspond to generic categories of products, not to the specific product purchased by the consumer.
It should be noted that even though allocation keys can be applied to O-LCA results to derive generic product LCAs, the most appropriate methodology for product LCA is ISO 14040 and ISO 14044. Indeed, O-LCA application can ease the application of product LCA given the existence of superior knowledge of the value chain, aggregated data that can be used as preliminary information, etc.
Report 17 (p.100) demonstrates how
data from one division can be used
to create product categories.

5. Reporting, assurance and communication to third parties
What are the specific requirements for an O-LCA report?
Section 5.2
Why is it recommended to perform a critical review?
Section 5.2
Which schemes exist for the public communication of O-LCA results?
Section 5.3
CHAPTER

104 Guidance on Organizational Life Cycle Assessment
5.1 General
Reporting and communication on sustainability have become an essential organizational management practice around the world. Governments at the United Nations Conference on Sustainable Development in Rio de Janeiro
in 2012 (Rio+20) underscored the importance of corporate sustainability reporting, and the role government, industry and other stakeholders should play to spur more and improve sustainability reporting, while paying particular attention to the needs of developing countries – paragraph 47 of the UN (2012)38.
“Increasingly, companies are using LCA results to report on key environmental aspects on a corporate level, presenting the areas across the value chain where product portfolios generate impacts, and outlining how the companies are tackling these” (Hellweg and Milà i Canals, 2014a). The relevance of the issues included in sustainability reporting, and the derived business strategy, can be significantly strengthened through O-LCA.
This Chapter outlines the principles and requirements to report and communicate to decision makers and third parties, but for more in-depth guidance, it is recommended to consult specialized sources. Reporting requirements from ISO standards (ISO, 2006c, 2014b) have been adapted here for the application of O-LCA (ISO, 2014c). Other suggested documents are:
• Schemes that focus on reporting GHG emissions (WRI and WBCSD, 2011a; ISO, 2013).
• A FAQ regarding corporate sustainability reporting (UNEP, 2013).
• Other communication and reporting initiatives reviewed in KPMG/UNEP/GRI/UCGA (2013).
Report 18 (p.109) shares an example of communication and reporting strategy of an organization based on the outcomes of a methodology similar to O-LCA.
5.2 Reporting and assuranceReporting
Reporting presents study results and other critical information to the study commissioner and to third parties. The results and conclusions of the O-LCA shall be completely and accurately reported to the intended audience without bias and in accordance with the goals of the study. The results, data, methods, assumptions and limitations shall be transparently presented and comprehensive enough to show the complexities of the study (ISO, 2006c). Results may be presented at different levels of detail according to the goal and scope (e.g., for whole organization, business divisions, brands, regions, facilities, or activities).
Further reporting requirements for O-LCA studies include:
• Clear definition of the reporting organization being assessed, according to the subject of study, the consolidation rules, and the reference period;
38 UNEP, with the GRI, provides secretariat support to the Group of Friends of Paragraph 47, a government-led initiative that contributes to scaling up the quantity of organizations reporting globally, and improve the quality and usefulness of the information being disclosed. See http://www.unep.org/resourceefficiency/Business/SustainableandResponsibleBusiness/Reporting/FriendsofParagraph47/tabid/105011/Default.aspx.
Report 18 (p.109) shares an example of communication
and reporting strategy.
D PRecommended
itineraries
D P CRecommended
itineraries
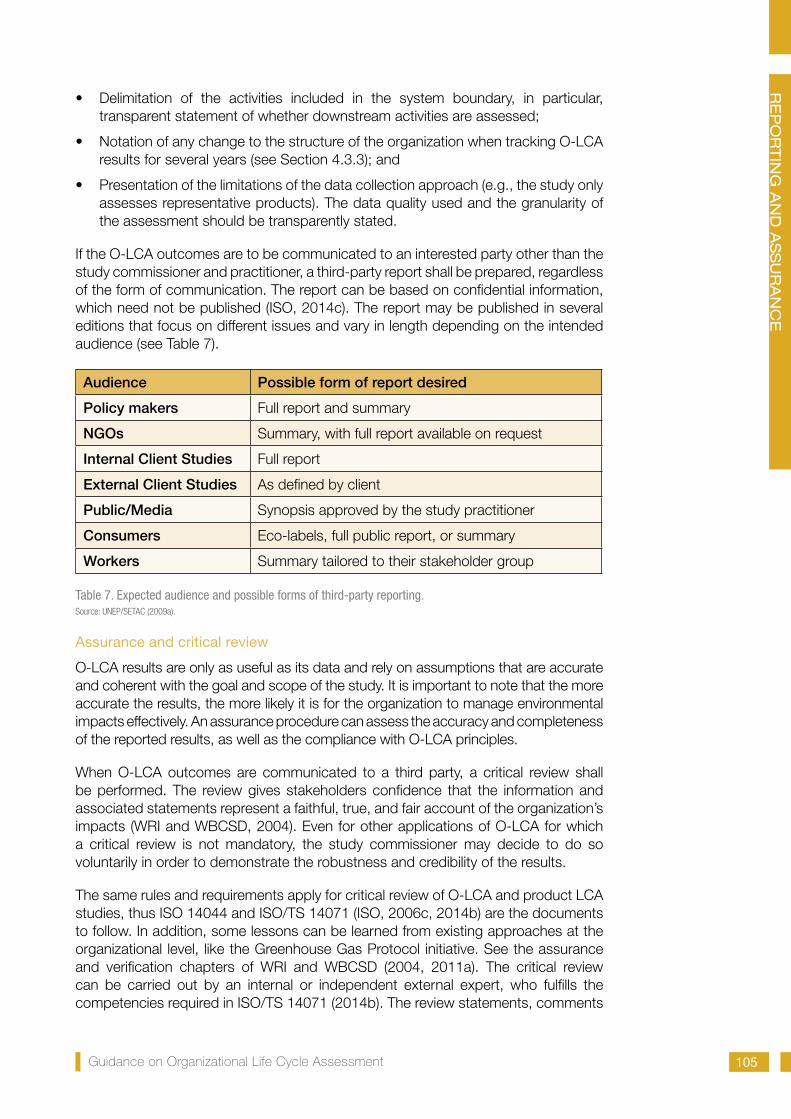
105Guidance on Organizational Life Cycle Assessment
• Delimitation of the activities included in the system boundary, in particular, transparent statement of whether downstream activities are assessed;
• Notation of any change to the structure of the organization when tracking O-LCA results for several years (see Section 4.3.3); and
• Presentation of the limitations of the data collection approach (e.g., the study only assesses representative products). The data quality used and the granularity of the assessment should be transparently stated.
If the O-LCA outcomes are to be communicated to an interested party other than the study commissioner and practitioner, a third-party report shall be prepared, regardless of the form of communication. The report can be based on confidential information, which need not be published (ISO, 2014c). The report may be published in several editions that focus on different issues and vary in length depending on the intended audience (see Table 7).
Audience Possible form of report desired
Policy makers Full report and summary
NGOs Summary, with full report available on request
Internal Client Studies Full report
External Client Studies As defined by client
Public/Media Synopsis approved by the study practitioner
Consumers Eco-labels, full public report, or summary
Workers Summary tailored to their stakeholder group
Table 7. Expected audience and possible forms of third-party reporting. Source: UNEP/SETAC (2009a).
Assurance and critical review
O-LCA results are only as useful as its data and rely on assumptions that are accurate and coherent with the goal and scope of the study. It is important to note that the more accurate the results, the more likely it is for the organization to manage environmental impacts effectively. An assurance procedure can assess the accuracy and completeness of the reported results, as well as the compliance with O-LCA principles.
When O-LCA outcomes are communicated to a third party, a critical review shall be performed. The review gives stakeholders confidence that the information and associated statements represent a faithful, true, and fair account of the organization’s impacts (WRI and WBCSD, 2004). Even for other applications of O-LCA for which a critical review is not mandatory, the study commissioner may decide to do so voluntarily in order to demonstrate the robustness and credibility of the results.
The same rules and requirements apply for critical review of O-LCA and product LCA studies, thus ISO 14044 and ISO/TS 14071 (ISO, 2006c, 2014b) are the documents to follow. In addition, some lessons can be learned from existing approaches at the organizational level, like the Greenhouse Gas Protocol initiative. See the assurance and verification chapters of WRI and WBCSD (2004, 2011a). The critical review can be carried out by an internal or independent external expert, who fulfills the competencies required in ISO/TS 14071 (2014b). The review statements, comments
RE
PO
RTIN
G A
ND
ASSU
RA
NC
E

106 Guidance on Organizational Life Cycle Assessment
of the practitioner, and any response to recommendations made by the reviewer, shall be included in the O-LCA report (ISO, 2006c).
Reporting by third-parties
Third parties should also follow the requirements described above when reporting O-LCA results of other organizations. If these third parties insist on using the results of the latter to publish comparisons, disregarding all guidance to the contrary, some issues should be addressed to make such comparisons somewhat meaningful (see Box 11).
Box 11. Requirements when O-LCA results are used for comparison by third parties
It bears repeating that O-LCA results are not appropriate for communicating comparisons with other organizations (Section 2.2). In general, it is quite likely that the O-LCA results have inconsistent goals and assess the organizations using different granularity levels, data specificity, supplier levels involved, indicator sets, etc. However, third parties might still use O-LCA results to perform comparisons. One example would be ranking organizations in the same sector or product section in terms of intensity (i.e., impacts per turnover or per equivalent product output).
The third party should gage the comparability prior to the comparison. There are several elements that should be equivalent in order to make the comparison minimally meaningful:
• Goal and scope definition:
» Reporting organization and the reporting flow. It is particularly important to define the reference unit used for comparison. How are the differences of sector, size, and location, if any, being considered in the reference unit selected for comparison? Is the overall business model of each organization taken into account?
» System boundary. The criteria for the inclusion of inputs and outputs are identical (e.g., cut-off criteria);
» When the O-LCA results do not cover the full life cycle, the stages which are (or are not) considered; and
» Reporting period.
• Inventory analysis:
» Methods and calculations for data collection;
» Data quality requirements; and
» Allocation of resource use and emissions.
• Impact assessment:
» Impact category selection, calculation rules and the units used.
Furthermore, single-score impact assessment indicators (see Box 9, p.81) are not to be used in comparative assertions intended for public disclosure, but rather disaggregated results should be used.

107Guidance on Organizational Life Cycle Assessment
5.3 CommunicationOrganization environmental strategy and performance tracking (see Section 4.3.2 and 4.3.3) are two elements typically reported by organizations. This section provides some detail and recommendations for the communication step of O-LCA, but more detailed guidance can be found in more specialized literature (see Section 5.1).
Organizations communicate its environmental performance to third parties in order to improve consumers’ perception (e.g., of the organization and its products), to differentiate from competitors (e.g., their policies, products), or more ambitiously, to be regarded as a benchmark on environmental protection and management within its sector and beyond. The organization may also simply need to respond to investors’ or other stakeholders’ requests and concerns.
Many organizations have a specific environment or sustainability section in their website with a wide range of information included. Other channels of communication, which should be chosen depending on the target audience, are advertising, product labeling, e-bulletins, conferences, workshops, leaflets, press releases, etc. Communicating the results and scope of O-LCA can be done in a multitude of ways. The figures and First Mover Reports throughout this Guidance provide some examples. Figure 1 (p.21) and Figure 11 (p.57) illustrate the activities considered in the corresponding studies. Results of O-LCA can be communicated through infographics (e.g., Figure 20, p.91) and Unilever’s global environmental footprint schemes39), 3D graphs (e.g., Figure 17, p.79), or web charts for performance tracking illustration (e.g., Figure 23, p.99). Maps and web pages with links to further information (e.g., the public thirty-page summary of Accor’s study40) offer still other possibilities.
Large organizations commonly report annual performance on sustainability and environmental performance, alongside other issues. Organizations produce sustainability reports “to publicly communicate their sustainability practices, comply with mandatory reporting requirements, respond to stakeholder demands, increase transparency and track progress against their commitments to sustainability” (UNEP, 2013). Organizations may follow an existing voluntary sustainable reporting scheme to facilitate the process. Some of the more well-known and used reporting schemes are presented in Box 12. O-LCA can be a great information source for all the communication options mentioned.
Within the communication strategy, O-LCA outcomes are more likely presented in a summarized form; this summary should provide enough detail, also about the goal and scope, for the reader to understand the granularity and uncertainty embedded in the study (see Section 5.2). The summary should, in essence, be a transparent and stand-alone document.
The environmental impacts are typically presented in absolute values – i.e., the total value for the whole organization or a part thereof (e.g., per business division, brands, region or facility). For communication purposes, the results may also be presented in per unit of revenue terms. Another possibility would be to use per unit of product, but the unit and assumptions made should be transparently defined, and should only
39 See Unilver’s GHG footprint. http://www.unilever.com/sustainable-living-2014/reducing-environmental-impact/greenhouse-gases/our-greenhouse-gas-footprint/index.aspx.
40 The Accor group’s Environmental Footprint (Accor, 2011b).
CO
MM
UN
ICA
TIO
N
DRecommended
itineraries

108 Guidance on Organizational Life Cycle Assessment
Box 12. Voluntary sustainability reporting
An O-LCA provides an organization with key environmental performance information that could be used for joining sustainability reporting schemes. Corporate sustainability reporting or CSR “communicates information that is relevant for understanding a company’s long-term economic value and contribution towards a sustainable global economy by taking account of the company’s economic, environmental, social and governance performance and impacts” (UNEP, 2013).
A variety of initiatives assist organizations with their sustainability strategy and reporting. Some have a comprehensive sustainability scope, while others can be sector- or issue- specific (KPMG/UNEP/GRI/UCGA, 2013). Even though these are not necessarily based on a life cycle perspective, they can assist the organization with sustainability reporting.
Some of the most broadly used international voluntary accounting, auditing and reporting initiatives include the Global Reporting Initiative (GRI) and its GRI G4 Sustainability reporting Guidelines; the Carbon Disclosure Project (CDP), which focuses on climate change and water reporting; and the United Nations Global Compact principles. Two additional relevant international initiatives are the Sustainability Accounting Standards Board (SASB), which provides reporting guidelines by sector (SASB, 2014), and the International Integrated Reporting (IIR), which targets investments (IIR, 2014).
According to GRI (GRI, 2014a), a sustainability report is a report published by an organization “about the economic, environmental and social impacts caused by its everyday activities”. A GRI-based report mainly includes on-site environmental impact data, although detail outside the organization is also considered in some of the indicators proposed in the latest version of GRI’s Sustainability Reporting Guidelines, “G4” (GRI, 2013) (e.g., energy consumption outside the organization, GHG emissions based on the Greenhouse Gas Protocol initiative with optional scope 3, and a specific section for the evaluation of suppliers).
The Carbon Disclosure Project (CDP, 2014b) is an international, not-for-profit organization providing a global system for companies and cities to measure, disclose, manage and share vital environmental information. It has two reporting programs for climate change (CDP, 2014c) and water (CDP, 2014a).
The UN Global Compact (UN, 2014) is a strategic policy initiative for companies that are committed to align their strategies and operations with ten universally accepted principles covering human rights, labor, environment and anti-corruption. Organizations commit to report annually on progress made on implementing the ten principles by issuing a “Communication on Progress (COP)”.
Some initiatives provide specific frameworks, guidance and incentives for SMEs to undertake sustainability reporting. To this end, the booklet from GRI (2014b) includes a more simple introduction to sustainability reporting, which is complemented with other documents in GRI’s section ”Support for first time reporters”1.
1 GRI’s support for first time reporters. https://www.globalreporting.org/reporting/reporting-support/support/Pages/default.aspx.

109Guidance on Organizational Life Cycle Assessment
be used when a representative or main product can be defined. For instance, a car producer can report the environmental impacts per car produced, but the impacts are likely different for each brand, size, motor, fuel, etc. (see Section 4.3.4).
Single-score impact assessment methods can be easier to communicate (see Report 9 on p.80), and may be used as long as the results are not used in comparative assertions intended for public disclosure (see Section 2.2). However, they may hide trade-offs and have higher uncertainties (see Box 9, p.81). Therefore, if aggregation is performed, the methods should be transparently reported and detailed findings prior to aggregation should be available in a suitable form.
Corporate environmental footprint
Mondelēz International, a producer of snack foods, began conducting a complete cradle-to-grave corporate environmental footprint in 2011 (when it was still part of Kraft Foods Group). Activities in its value chain are categorized into representative stages of the supply chain (e.g., raw materials, transport, manufacture, distribution, use, etc.). The categories align with the categorization of the GHG Protocol Scope 3 Standard. In each category, activities are modeled based on the best available information to identify the flows of materials, energy and resources. These flows are then matched to pre-existing LCI data. In some cases, new LCI data has been developed (e.g., for important supply chain commodities). A set of impact assessment methods has been applied to provide a comprehensive view of overall environmental impacts, but the priority for interpretation and internal communication has been carbon footprint, water footprint and land use, which represent the most significant issues for Mondelēz International and its value chain impacts. The footprint is updated annually.
Sustainability strategy
The sustainability leadership at Mondelēz International has applied footprint results to guide the development of their sustainability strategy and activities (e.g., to identify and prioritize hotspots, and ensure appropriate resource allocation to address these). In
particular, the footprint (Figure 17, p.79) showed that sustainable agriculture and responsible sourcing – with a strong focus on cocoa and coffee as key commodities – should form pillars of the sustainability strategy. For each of these commodity groups, detailed commodity LCA data has been cross-referenced with risk information (sourced from groups, such as WWF) to identify a detailed plan of action.
Reporting and communication
The corporate environmental footprint has been used extensively in Mondelēz International’s corporate sustainability reporting. The project provides a complete set of the relevant scope 3 carbon footprint categories for inclusion on the company’s CDP reporting, and has helped Mondelēz International achieve high scores in this part of the CDP assessment. The carbon footprint information also helps the company to quantify the areas of improvement that can be reported to CDP, as well as providing evidence to support its statements in its carbon reduction strategy. In 2013, Mondelēz International reported to the CDP Water questionnaire and in the near future, a global water footprint (under development) will be an important supporting resource. It also reports to the Dow Jones Sustainability index (DJSI) using both the carbon and water footprint results, earning the organization high ratings within its sector over the past several years.
Report 18. Mondelēz International – Support of the corporate environmental footprint for sustainable strategy, reporting and communication1
1 Summary adapted from an essay provided by Mondelēz International.
CO
MM
UN
ICA
TIO
N
Report 9 on p.80 presents an example of single-score impact assessment methods.

6. Conclusions and future steps
CHAPTER

111Guidance on Organizational Life Cycle Assessment
The flagship project “LCA of organizations”, under the umbrella of the UNEP/SETAC Life Cycle Initiative, aims to show that life cycle thinking at the organizational level is relevant, meaningful and feasible using a similar framework to product
LCA standards. The first outcome of the project is this document “Organizational life cycle assessment – Guidance for organizations to conduct LCA considering their value chain”, which eases the application of O-LCA and demonstrates its potential. This Guidance also aims to be a more detailed and complementary document to ISO/TS 14072; the latter, in turn, forms the basis for the methodological framework of the former, alongside with ISO 14040 and ISO 14044 standards.
Organizational life cycle assessment (O-LCA) has significant potential to help corporations, authorities, institutions and other organizations improve their environmental performance by providing the necessary, credible information for decision making. A life cycle perspective takes environmental strategy and action beyond on-site resource efficiency and pollution avoidance by identifying efficient improvement opportunities for different actors along the entire value chain. Given the multitude of inputs and outputs involved in the provision of goods and services, and the equally large variety of resultant environmental impacts, only an environmental multi-impact life cycle approach can lead to decisions that find the right balance among those impacts.
Some organizations are already contributing staff time and financial resources to obtain a full picture of their activities and impacts, up and down the value chain. The ‘First Mover’ stories included in this Guidance illustrate both the potential and the challenges of O-LCA, and provide evidence that O-LCA can be applied by a variety of organizations, sectors, sizes and regions. Different levels of experience with environmental tools and the existence of relevant data can facilitate O-LCA application.
O-LCA can represent a key element in an organization’s internal decision-making system as it offers insight to the organization and its value chain, and identifies hotspots where action should be taken. Furthermore, it provides a structure for environmental performance tracking and target achievement as defined by the organization’s environmental strategy. Finally, O-LCA results support reporting and communication to third parties. Indeed, the authors strongly recommend that voluntary sustainability reporting standards request the holistic and life cycle perspective brought about by O-LCA in their practice.
As a next step, the application of O-LCA in SMEs needs to be encouraged and supported, as collectively they have an important role on global environmental impacts and, to date, no ‘First Mover’ stories could be identified. The same holds true for organizations in the Asian and African continents, which were found to be underrepresented within the case studies. A simplified version of this Guidance could be considered to improve this situation. In addition, the potential of an organizational approach for a life cycle assessment of the social dimension of sustainability should be also explored and developed. Last, the use of organizational approach in life cycle sustainability assessment should be kept in mind as the next major milestone.
For now, the international community is encouraged to apply the O-LCA methodology as outlined in this Guidance. The authors look forward to interacting with colleagues and stakeholders to discuss success stories, results obtained from case studies,41 and remaining challenges over the coming years.
41 In order to test the document, several case studies from different regions, sectors, with different levels of experience on the use of environmental tools and data available will be conducted in 2015 using this Guidance (see Annex E).
CO
NC
LU
SIO
NS A
ND
FU
TU
RE
STE
PS
D P M CRecommended
itineraries

Guidance on Organizational Life Cycle Assessment112
List of Tables
Table 1. Reading itineraries by type of audience 16Table 2. Criteria for identifying relevant activities 60Table 3. Data quality criteria 75Table 4. Environmental indicators assessed by the ‘First Mover’ stories
78
Table 5. Particular guidance for O-LCA implementation in pathways 2, 3 and 4
86
Table 6. Complementary recommendations for a simplified implementation of O-LCA in small and medium organizations
90
Table 7. Expected audience and possible forms of third-party reporting
105
List of Figures
Figure 1. Organizations are engaged in many product life cycles 21Figure 2. ‘First Mover’ stories: location and main sector 27Figure 3. Layers of potential goals of an organization 31Figure 4. Sketch of the three dimensions of O-LCA 35Figure 5. Simplified organization structure and example of potential subsets to be assessed
43
Figure 6. Example of units and their relation with the reporting organization for different consolidation methods
46
Figure 7. Simplified example of supplier tiers in the value chain of an organization
49
Figure 8. Reporting organization and corresponding system boundary
51
Figure 9. Iterative steps of O-LCA inventory analysis 54Figure 10. Direct and indirect activities and resource use and emissions
55
Figure 11. Colruyt Group – List of direct (for all products) and indirect activities (for the five in-house products) included in the OEF
57
Figure 12. Sketch of the bottom-up and the top-down approaches for data collection
66
Figure 13. Top-down alternatives that an organization can use for quantifying the inventory for direct and indirect activities
69
Figure 14. Simplified upstream composed of tier 1, tier 2 and tier 3 suppliers
72
Figure 15. Example of multi-functionality of a supplier and four options to distribute impacts according to the hierarchy in Sub-section A
73
Figure 16. Accor – Methodology used to estimate impacts at the group level
76
Figure 17. Mondelēz International – Corporate environmental footprint results for 2013
79

113Guidance on Organizational Life Cycle Assessment
Figure 18. Inghams – Impact categories contribution by alternative life cycle input/stage. The results are presented per ton of generic chicken output
80
Figure 19. Volkswagen – Data collection approach for Corporate Environmental Assessment
88
Figure 20. Natura – GHG emission chain 2010 and examples of reduction measures
91
Figure 21. Storengy – Scenario replacement of some turbochargers with electro-compressors
95
Figure 22. Unilever – The main pillars and themes of the Unilever Sustainable Living Plan
96
Figure 23. BASF – Performance tracking schemes: (a) overall impacts considered (left) and (b) specific results for cumulative energy consumption (right)
99
Figure 24. Inghams – Allocation keys for the three product categories. The prices shown here are fictitious and do not correspond to Inghams’ reality
101
List of Boxes
Box 1. Impacts beyond environment 23Box 2. Testimonials of the ‘First Mover’ stories 26Box 3. What is an organization? 30Box 4. Quality and durability of the products in the portfolio 48Box 5. Direct and indirect resource use and emissions 50Box 6. Input-output analysis data 62Box 7. Examples of specific and generic data 63Box 8. Converting financial information to physical flows 64Box 9. Particular indicators 81Box 10. Examples of actions to reduce environmental impacts 94Box 11. Requirements when O-LCA results are used for comparison by third parties
106
Box 12. Voluntary sustainability reporting 108
List of Reports
Report 1. Shiseido: Goals for corporate value chain environmental analysis
41
Report 2. BASF: Demarchi, a pioneering site at the company strategy
44
Report 3. Accor: Goal and scope definition for Accor’s environmental footprint
52
Report 4. Colruyt Group: Activities included in the Organization Environmental Footprint
56
Report 5. Unilever: A streamlined approach for global environmental footprint assessment
67
TA
BLE
S, F
IGU
RE
S, B
OX
ES, R
EP
OR
TS

Guidance on Organizational Life Cycle Assessment114
Report 6. Storengy: Global approach to environmental performance 72Report 7. Accor: Inventory and impact quantification for Accor’s environmental footprint
75
Report 8. Overview of impact assessment in the ‘First Mover’ stories 78Report 9. Inghams: Single-score ecopoints for the chicken line division
80
Report 10. Accor: Interpretation and uncertainty for Accor’s environmental footprint
82
Report 11. Volkswagen: Use of existing EMS and product LCA for Corporate GHG Assessment
88
Report 12. Natura: Carbon Neutral Program 91Report 13. KPMG: The corporate environmental footprint supports sustainability management of KPMG in Mexico
92
Report 14. Storengy: Improvement scenarios and savings quantification
95
Report 15. Unilever: Sustainable Living Plan 96Report 16. BASF: Environmental performance tracking and other sustainability schemes
99
Report 17. Inghams: Economic allocation of environmental impacts among main chicken product categories
100
Report 18. Mondelēz International: Support of the corporate environmental footprint for sustainable strategy, reporting and communication
109
115Guidance on Organizational Life Cycle Assessment
References42
Accor (2011a) Accor Group’s Environmental Footprint (confidential). Paris: PricewaterhouseCoopers Advisory.
Accor (2011b) The Accor group’s Environmental Footprint. Paris, France: Accor Sustainable Development Department. Online http://www.accor.com/fileadmin/user_upload/Contenus_Accor/Developpement_Durable/pdf/earth_guest_research/2011_12_08_accor_empreinte_environnementale_dp_bd_en.pdf
Accor (2014) Accor Group website. Online http://www.accor.com.
ADEME (2010) Bilan Carbone Companies and Local Authorities Version. Methodological Guide Version 6.1: Objectives and Principles for the Counting of Greenhouse Gas Emissions. French Agency for the Environment and Energy Management. Online http://www.associationbilancarbone.fr/sites/default/files/guide_methodologique_v6_euk-v.pdf.
Alvarado Díaz E.G., Chargoy Amador J.P., Suppen Reynaga N. (2014) KPMG en México. Huella ambiental organizacional 2013. CADIS.
Arena A.P. (2008) Spreading Life-Cycle Assessment to Developing Countries - Lessons from Argentina. Journal of Industrial Ecology, 4(3), 3–6.
Bare J.C. (2009) Life cycle impact assessment research developments and needs. Clean Technologies and Environmental Policy, 12(4), 341–351.
BASF (2014) BASF website. Online http://www.basf.com/group/corporate/en.
Bengtsson J., Seddon J. (2013) Cradle to retailer or quick service restaurant gate life cycle assessment of chicken products in Australia. Journal of Cleaner Production, 41, 291–300.
Braunschweig A. (2014) GHG-balances and LCA: Applying the concept of scopes in organisational LCAs. E2 Management Consulting. Online http://www.e2mc.com.
Bronès F. (2011) Natura Brazil, a Life Cycle Management experience in the cosmetic industry. In M. Finkbeiner (Ed.), Towards Life Cycle Sustainability Management. Berlin/Heidelberg: Springer.
Business Dictionary (2014) Business Dictionary. Online http://www.businessdictionary.com.
CDP (2014a) Carbon Disclosure Project - Water program guidance website. Online https://www.cdp.net/en-US/Pages/guidance-water.aspx.
CDP (2014b) Carbon Disclosure Project website. Online https://www.cdp.net/en-US/Pages/HomePage.aspx.
42 All the URLs in the References were revised in November 2014.
RE
FE
RE
NC
ES

Guidance on Organizational Life Cycle Assessment116
CDP (2014c) Carbon Disclosure Project - Climate change program guidance website. Online https://www.cdp.net/en-US/Pages/guidance-climate-change.aspx.
Clift R., Wright L. (2000) Relationships between environmental impacts and added value along the supply chain. Technological Forecasting and Social Change, 65(3), 281–295.
Colruyt Group (2014) Colruyt Group website. Online http://www.colruytgroup.com/en.
CRIGEN (2012) Analyse du Cycle de Vie des activités de Storengy en 2011 (confidential). Sain-Denis, Paris: Storengy, GDF SUEZ.
DEFRA (2013) Environmental Reporting Guidelines: Including mandatory greenhouse gas emissions reporting guidance. Department for Environment, Food and Rural Affairs. Online https://www.gov.uk/government/publications/environmental-reporting-guidelines-including-mandatory-greenhouse-gas-emissions-reporting-guidance.
Downie J., Stubbs W. (2011) Evaluation of Australian companies’ scope 3 greenhouse gas emissions assessments. Journal of Cleaner Production, 56, 156–163.
Draucker L. (2013) GHG Protocol: moving Corporate Accounting Beyond GHGs. In Abstract book: SETAC North American 34th Annual Meeting, Nashville, USA. SETAC.
Edge Environment (2011) Life Cycle Assessment of Inghams’ Chicken Products (confidential). Manly, Sydney: Inghams.
Ellen MacArthur Foundation (2014) Towards the Circular Economy vol.3: accelerating the scale-up across global supply chains. World Economic Forum, the Ellen MacArthur Foundation and McKinsey & Company. Online http://www.ellenmacarthurfoundation.org/business/reports/ce2014.
European Commission (2009) Regulation (EC) No 1221/2009 of the European Parliament and of the Council of 25 November 2009 on the voluntary participation by organisations in a Community eco-management and audit scheme (EMAS), repealing Regulation (EC) No 761/2001 and Commission Deci. Official Journal of the European Union.
European Commission (2010a) International Reference Life Cycle Data System (ILCD) Handbook - Analysing of existing Environmental Impact Assessment methodologies for use in Life Cycle Assessment. European Commission - Joint Research Centre - Institute for Environment and Sustainability. Online http://eplca.jrc.ec.europa.eu/uploads/ILCD-Handbook-LCIA-Background-analysis-online-12March2010.pdf.
European Commission (2010b) International Reference Life Cycle Data System (ILCD) Handbook - General guide for Life Cycle Assessment - Detailed guidance. European Commission - Joint Research Centre - Institute for Environment and Sustainability. Online http://bookshop.europa.eu/en/international-reference-life-cycle-data-system-ilcd-handbook-general-guide-for-life-cycle-assessment-detailed-guidance-pbLBNA24708/.

117Guidance on Organizational Life Cycle Assessment
European Commission (2013a) Organisation Environmental Footprint Guide. European Commission - Joint Research Centre - Institute for Environment and Sustainability. Online http://eur-lex.europa.eu/JOHtml.do?uri=OJ:L:2013:124:SOM:EN:HTML.
European Commission (2013b) Product Environmental Footprint Guide. European Commission - Joint Research Centre - Institute for Environment and Sustainability. Online http://eur-lex.europa.eu/JOHtml.do?uri=OJ:L:2013:124:SOM:EN:HTML.
Finkbeiner M. (2013) Product environmental footprint—breakthrough or breakdown for policy implementation of life cycle assessment? The International Journal of Life Cycle Assessment, 19(2), 266–271.
Finkbeiner M., Ackermann R., Bach V., Berger M., Brankatschk G., Chang Y.-J., Grinberg M., Lehmann A., Martínez-Blanco J., Minkov N., Neugebauer S., Scheumann R., Schneider L., Wolf K. (2014) Challenges in Life Cycle Assessment: An Overview of Current Gaps and Research Needs. In W. Klöpffer (Ed.), Background and Future Prospects in Life Cycle Assessment. (pp. 207–258). Springer Netherlands.
Finkbeiner M., König P. (2013) Carbon Footprint and Life Cycle Assessment of Organizations. Journal of Environmental Accounting and Management, 1(1), 55–63.
Finkbeiner M., Wiedemann M., Saur K. (1998) A comprehensive approach towards product and organisation related environmental management tools. The International Journal of Life Cycle Assessment, 3(3), 169–178.
Fundação Espaço ECO (2014) Demarchi + ecoeficiente: Relatório 2012/2013 (confidential). São Bernardo do Campo, São Paulo: BASF.
GRI (2005) GRI Boundary Protocol. Global Reporting Initiative. Online https://www.globalreporting.org/resourcelibrary/GRI-Boundary-Protocol.pdf.
GRI (2008) Small, Smart and Sustainable: Experiences of SME Reporting in Global Supply Chains. Global Reporting Initiative. Online https://www.globalreporting.org/resourcelibrary/Small-Smart-Sustainable.pdf.
GRI (2013) Sustainability Reporting Guidelines, G4. Global Reporting Initiative. Online https://www.globalreporting.org/reporting/g4/Pages/default.aspx.
GRI (2014a) Global Reporting Initiative website. Online http://www.globalreporting.org.
GRI (2014b) Ready to Report? Introducing Sustainability Reporting for SMEs. Global Reporting Initiative. Online https://www.globalreporting.org/resourcelibrary/Ready-to-Report-SME-booklet-online.pdf.
Hauschild M.Z., Dreyer L.C., Jrgensen A. (2008) Assessing social impacts in a life cycle perspective — lessons learned. CIRP Annals-Manufacturing Technology, 57(1), 21–24.
RE
FE
RE
NC
ES

Guidance on Organizational Life Cycle Assessment118
Hellweg S., Milà i Canals L. (2014a) Emerging approaches, challenges and opportunities in life cycle assessment. Science, 344(6188), 1109–1113.
Howard N., Bengtsson J., Kneppers B. (2011) Weighting of environmental impacts in Australia. Building Products Life Cycle Inventory. Building Products Life Cycle Inventory. Online http://www.bpic.asn.au/LCIMethodology.htm.
Huang Y.A., Lenzen M., Weber C.L., Murray J., Matthews H.S. (2009a) The role of input-output analysis for the screening of corporate carbon footprints. Economic Systems Research, 21(3), 217–242.
Huang Y.A., Weber C.L., Matthews H.S. (2009b) Categorization of scope 3 emissions for streamlined enterprise carbon footprinting. Environmental Science & Technology, 43(22), 8509–8515.
IIR (2014) International Integrated Reporting website. Online http://www.theiirc.org.
Inghams (2014) Inghams Enterprise website. Online http://www.inghams.com.au.
International EPD® System (2014) EPD® website. Online http://www.environdec.com.
ISO (2004a) ISO 14001: Environmental management systems — Requirements with guidance for use. Geneva, Switzerland: International Organization for Standardization.
ISO (2004b) ISO 14004: Environmental management systems — General guidelines on principles, systems and support techniques. Geneva, Switzerland: International Organization for Standardization.
ISO (2006a) ISO 14025: Environmental labels and declarations — Type III environmental declarations — Principles and procedures. Geneva, Switzerland: International Organization for Standardization.
ISO (2006b) ISO 14040: Environmental Management — Life Cycle Assessment — Principles and framework. Geneva, Switzerland: International Organization for Standardization.
ISO (2006c) ISO 14044: Environmental Management — Life Cycle Assessment — Requirements and Guidelines. Geneva, Switzerland: International Organization for Standardization.
ISO (2006d) ISO 14064-1: Greenhouse gases — Part 1: Specification with guidance at the organization level for quantification and reporting of greenhouse gas emissions and removals. Geneva, Switzerland: International Organization for Standardization.
ISO (2006e) ISO 14064-3: Greenhouse gases — Part 3: Specification with guidance at the validation and verification of greenhouse gas assertions. Geneva, Switzerland: International Organization for Standardization.
ISO (2012) ISO 14045: Environmental management — Eco-efficiency assessment of product systems — Principles, requirements and guidelines. Geneva, Switzerland: International Organization for Standardization.

119Guidance on Organizational Life Cycle Assessment
ISO (2013) ISO/TR 14069: Greenhouse gases — Quantification and reporting of greenhouse gas emissions for organizations — Guidance for the application of ISO 14064-1. Geneva, Switzerland: International Organization for Standardization.
ISO (2014a) ISO 14046: Water footprint — principles, requirements and guidance. Geneva, Switzerland: International Organization for Standardization.
ISO (2014b) ISO/TS 14071: Environmental management — Life cycle assessment — Critical review processes and reviewer competencies: Additional requirements and guidelines to ISO 14044:2006. Geneva, Switzerland: International Organization for Standardization.
ISO (2014c) ISO/TS 14072: Environmental management — Life cycle assessment — Requirements and guidelines for Organizational Life Cycle Assessment. Geneva, Switzerland: International Organization for Standardization.
Iwai T., Ohashi K. (2013) GHG & Water assessment of Shiseido. In International Workshop for Scope 3 and LCA for Organization, November, Tokyo, Japan. MIZUHO. Online http://www.mizuho-ir.co.jp/english/release/scope3ws131121.html.
Jørgensen A., Le Bocq A., Nazarkina L., Hauschild M. (2008) Methodologies for social life cycle assessment. The International Journal of Life Cycle Assessment, 13(2), 96–103.
Klöpffer W. (2008) Life cycle sustainability assessment of products. The International Journal of Life Cycle Assessment, 13(2), 89–95.
KPMG (2014) KPMG website. Online http://www.kpmg.com/global/en/pages/default.aspx.
KPMG/UNEP/GRI/UCGA (2013) Carrots and sticks: Sustainability reporting policies worldwide – today’s best practice, tomorrow’s trends. Amsterdam: Global Reporting Initiative, United Nations Environment Programme, KPMG Climate Change & Sustainability Services and Centre for Corporate Governance in Africa. Online https://www.globalreporting.org/resourcelibrary/carrots-and-sticks.pdf.
Lave L.B., Cobas-Flores E., Hendrickson C., McMichael F.C. (1995) Life Cycle Assessment: Using Input-Output Analysis to Estimate Economy-wide Discharge. Environmental Science and Technology, 29(9), 420–426.
Lenzen M., Kanemoto K., Moran D., Geschke A. (2012) Mapping the structure of the world economy. Environmental Science & Technology, 46(15), 8374–81.
Leontief W.W. (1986) Input-output economics. New York: Oxford University Press.
Makower J., Mattison R., Salo J., Kelley D. (2014) State of Green Business 2014. GreenBiz Group and Trucost. Online http://www.trucost.com/_uploads/publishedResearch/SOGB 2014.pdf.
Milà i Canals L., Sim S., García-Suárez T., Neuer G., Herstein K., Kerr C., Rigarlsford G., King H. (2010) Estimating the greenhouse gas footprint of Knorr. The International Journal of Life Cycle Assessment, 16(1), 50–58.
RE
FE
RE
NC
ES

Guidance on Organizational Life Cycle Assessment120
Mizuho (2014) International Workshop of Scope 3 and LCA for Organization website. Online http://www.mizuho-ir.co.jp/english/release/scope3ws131121.html.
Modahl I.S., Askham C., Lyng K.-A., Skjerve-Nielssen C., Nereng G. (2012) Comparison of two versions of an EPD, using generic and specific data for the foreground system, and some methodological implications. The International Journal of Life Cycle Assessment, 18(1), 241–251.
Mondelēz International (2014) Mondelēz International website. Online http://www.mondelezinternational.com.
Natura (2011) Carbon neutral 2010 case study (internal powerpoint). Natura.
Natura (2014a) Natura Report 2013. Natura. Online http://natu.infoinvest.com.br/ptb/4888/Relatrioanualemingls.pdf.
Natura (2014b) Natura website. Online http://www.natura.net.
Oxford University Press (2014) Oxford Dictionaries. Online http://www.oxforddictionaries.com.
Pelletier N., Allacker K., Pant R., Manfredi S. (2013) The European Commission Organisation Environmental Footprint method: comparison with other methods, and rationales for key requirements. The International Journal of Life Cycle Assessment, 19(2), 387–404.
Reimann K., Finkbeiner M., Horvath A., Matsuno Y. (2014) Evaluation of environmental life cycle approaches for policy and decision making support in micro and macro level applications. European Commission - Joint Research Centre - Institute for Environment and Sustainability. Online http://publications.jrc.ec.europa.eu/repository/bitstream/111111111/15195/1/lbna24562enc.pdf.
SASB (2014) Sustainability Accounting Standards Board website. Online http://www.sasb.org/.
Shiseido (2014) Shiseido website. Online http://www.shiseidogroup.com.
Storengy (2014) Storengy website. Online http://www.storengy.com.
Suh S. (2004) Materials and energy flows in industry and ecosystem networks: life cycle assessment, input-output analysis, material flow analysis, ecological network flow analysis, and their combinations for industrial ecology. Leiden University. Online https://openaccess.leidenuniv.nl/handle/1887/8399.
Suh S., Lenzen M., Treloar G.J., Hondo H., Horvath A., Huppes G., Jolliet O., Klann U., Krewitt W., Moriguchi Y. (2004) System boundary selection in life-cycle inventories using hybrid approaches. Environmental Science & Technology, 38(3), 657–664.
Taylor A.P., Postlethwaite D. (1996) Overall Business Impact Assessment (OBIA). In Proceedings of the 4th SETAC Case Study Symposium, Brussels, Belgium. (Vol. Brussels). Brussels: SETAC.

121Guidance on Organizational Life Cycle Assessment
UN (2002) Report of the World Summit on Sustainable Development, Johannesburg, South Africa, 26 August- 4 September 2002. New York: United Nations. Online http://www.un.org/jsummit/html/documents/summit_docs/131302_wssd_report_reissued.pdf.
UN (2012) The Future we want: final document of the Rio+20 Conference. United Nations Conference on Sustainable Development Rio+20, Rio de Janeiro, Brazil, 20-22 June 2012. New York: United Nations. Online http://www.un.org/en/sustainablefuture/.
UN (2014) United Nations Global Compact website. Online http://www.unglobalcompact.org.
UNEP (2000) Malmö ministerial declaration United Nations Environmental Programme. United Nations Environmental Programme. Online http://www.unep.org/malmo/malmo_ministerial.htm.
UNEP (2013) Frequently Asked Questions on Corporate Sustainability Reporting. Paris, France: United Nations Environment Programme. Online https://www.globalreporting.org/resourcelibrary/GoF47Para47-FAQs.pdf.
UNEP (2014) Resource Efficient and Cleaner Production website. Online http://www.unep.fr/scp/cp/.
UNEP/SETAC (2007) Life Cycle Management A Business Guide to Sustainability. Paris, France: Life-Cycle Initiative, United Nations Environment Programme and Society for Environmental Toxicology and Chemistry. Online http://www.lifecycleinitiative.org/wp-content/uploads/2012/12/2007 - LCM.pdf.
UNEP/SETAC (2009a) Guidelines for social life cycle assessment of products. Paris, France: Life-Cycle Initiative, United Nations Environment Programme and Society for Environmental Toxicology and Chemistry. Online http://www.lifecycleinitiative.org/wp-content/uploads/2012/12/2009 - Guidelines for sLCA - EN.pdf.
UNEP/SETAC (2009b) Life Cycle Management: How business uses it to decrease footprint, create opportunities and make value chains more sustainable. Paris, France: Life-Cycle Initiative, United Nations Environment Programme and Society for Environmental Toxicology and Chemistry. Online http://www.lifecycleinitiative.org/wp-content/uploads/2012/12/2009 - LCA - How business uses it.pdf.
UNEP/SETAC (2011) Global Guidance Principles for Life Cycle Assessment Databases A basis for greener processes and products. Paris, France: Life Cycle Inititative, United Nations Environment Programme and Society for Environmental Toxicology and Chemistry. Online http://www.lifecycleinitiative.org/wp-content/uploads/2012/12/2011 - Global Guidance Principles.pdf.
RE
FE
RE
NC
ES

Guidance on Organizational Life Cycle Assessment122
UNEP/SETAC (2012) Greening the Economy Through Life Cycle Thinking: Ten Years of the UNEP/SETAC Life Cycle Initiative. Paris, France: Life Cycle Inititative, United Nations Environment Programme and Society for Environmental Toxicology and Chemistry. Online http://www.lifecycleinitiative.org/wp-content/uploads/2013/03/2012_LCI_10_years_28.3.13.pdf.
UNEP/SETAC (2014) Life Cycle Initiative website. Online http://www.lifecycleinitiative.org/.
Unger N., King H. (2013) Use of the Life Cycle approach on company, category and product level to support the greenhouse gas strategy in a multinational company. In 6th International Conference on Life Cycle Management - LCM 2013. Gothenburg, Sweden. (pp. 63–66). Gothenburg: ISBN NO: 978-91-980973-5-1.
Unger N., King H., Calvert S. (2011) How to measure and manage the life cycle greenhouse gas impact of a global multinational company. In M. Finkbeiner (Ed.), Towards Life Cycle Sustainability Management. Berlin/Heidelberg: Springer.
UNIDO (2006) Responsible trade and market access: Opportunities or obstacles for SMEs in developing countries? United Nations Industrial Development Organization, Private Sector Development Branch. Online http://www.unido.org/fileadmin/user_media/Publications/Pub_free/Responsible_trade_and_market_access.pdf.
Unilever (2014) Unilever website. Online http://www.unilever.com.
Volkswagen (2014) Volkswagen website. Online http://www.volkswagenag.com.
Warsen J. (2013) Usability of LCA for Corporate Environmental Assessment and Reporting - Experiences from the Automotive Sector. In Intenrational Workshop for Scope 3 and LCA for Organization, Tokyo, Japan. MIZUHO. Online http://www.mizuho-ir.co.jp/english/release/scope3ws131121.html.
Warsen J., Krinke S., Damme G. (2013) Implementing the life cycle approach at Volkswagen. In Proceedings of the 6th International Conference on Life Cycle Management, Gothenburg, Sweden.
WRI and WBCSD (2004) GHG Protocol Corporate Accounting and Reporting Standard. World Resources Institute and World Business Council for Sustainable Development. Online http://www.ghgprotocol.org/files/ghgp/public/ghg-protocol-revised.pdf.
WRI and WBCSD (2011a) Corporate Value Chain (Scope 3) Accounting and Reporting Standard – Supplement to the GHG Protocol Corporate Accounting and Reporting Standard. World Resources Institute and World Business Council for Sustainable Development. Online http://www.ghgprotocol.org/files/ghgp/public/Corporate-Value-Chain-Accounting-Reporing-Standard_041613.pdf.
WRI and WBCSD (2011b) Product Life Cycle Accounting Reporting Standard. World Business Council for Sustainable Development. Online http://www.ghgprotocol.org/files/ghgp/public/Product-Life-Cycle-Accounting-Reporting-Standard_041613.pdf.

123Guidance on Organizational Life Cycle Assessment
WRI and WBCSD (2013) Technical Guidance for Calculating Scope 3 Emissions - Supplement to the Corporate Value Chain (Scope 3) Accounting & Reporting Standard. World Resources Institute and World Business Council for Sustainable Development. Online http://www.ghgprotocol.org/feature/scope-3-calculation-guidance.
WRI and WBCSD (2014a) Financed Emissions Initiative - Financial Sector Guidance on GHG Accounting and GHG Risk Management website. Online http://www.ghgprotocol.org/files/ghgp/Concept Note GHG Protocol Financial Sector Guidance final.pdf.
WRI and WBCSD (2014b) Greenhouse Gas Protocol website. Online http://www.ghgprotocol.org/.
RE
FE
RE
NC
ES

Guidance on Organizational Life Cycle Assessment124
Annex A. Glossary
Allocation An approach to solve multi-functional situations. Partitioning the input or output flows of a system (e.g., product, process or facility) between the system under study and other systems (adapted from ISO (2006c)).
Baseline period A historical datum (e.g., year) against which an organization’s impacts are tracked over time (definition of ‘base year’ in WRI and WBCSD (2011a)), particularly for monitoring targets.
Brand A line of products provided by an organization under a particular name.
Business division
A relatively autonomous part of a large company that operates as an independent enterprise with responsibility for a particular range of products or activities (adapted from Oxford (2014)).
Also called branch and business sector.
Comparative assertion
Environmental claim regarding the superiority or equivalence of one system versus a competing system that performs the same function (adapted from ISO (2006c)).
Consolidation method
Approach to be selected by the organization in setting the reporting organization, for assessing the inputs, outputs and potential environmental impacts of the activities associated with the organization. It represents the structure of the organization and its relationships with other organizations. Note: three distinct approaches are used, the operational control, financial control, or the equity share (adapted from ISO (2014c)).
Also called consolidation approach and consolidation methodology.
Cradle-to-gate Assessment that includes the stages of the life cycle until the products leave the organization (commonly comprises raw material extraction, processing, transport, and manufacturing).
Cradle-to-grave
Assessment that includes all the stages of the life cycle (commonly comprises raw material extraction, processing, transport, manufacturing, distribution, use, and EoL).
Critical review Process intended to ensure consistency between an O-LCA and the principles and requirements of the International Standards on life cycle assessment (ISO (2006c)).
Data quality Characteristics of data that relate to their ability to satisfy stated requirements (ISO, 2006c).
Direct activities (or impacts)
Activities from sites that are owned or controlled by the reporting organization (adapted from ‘direct GHG emission’ in WRI and WBCSD (2004)).
Disclosed to the public
The audience is not specifically limited and hence includes non-technical and external audience, e.g., consumers (European Commission, 2010b).
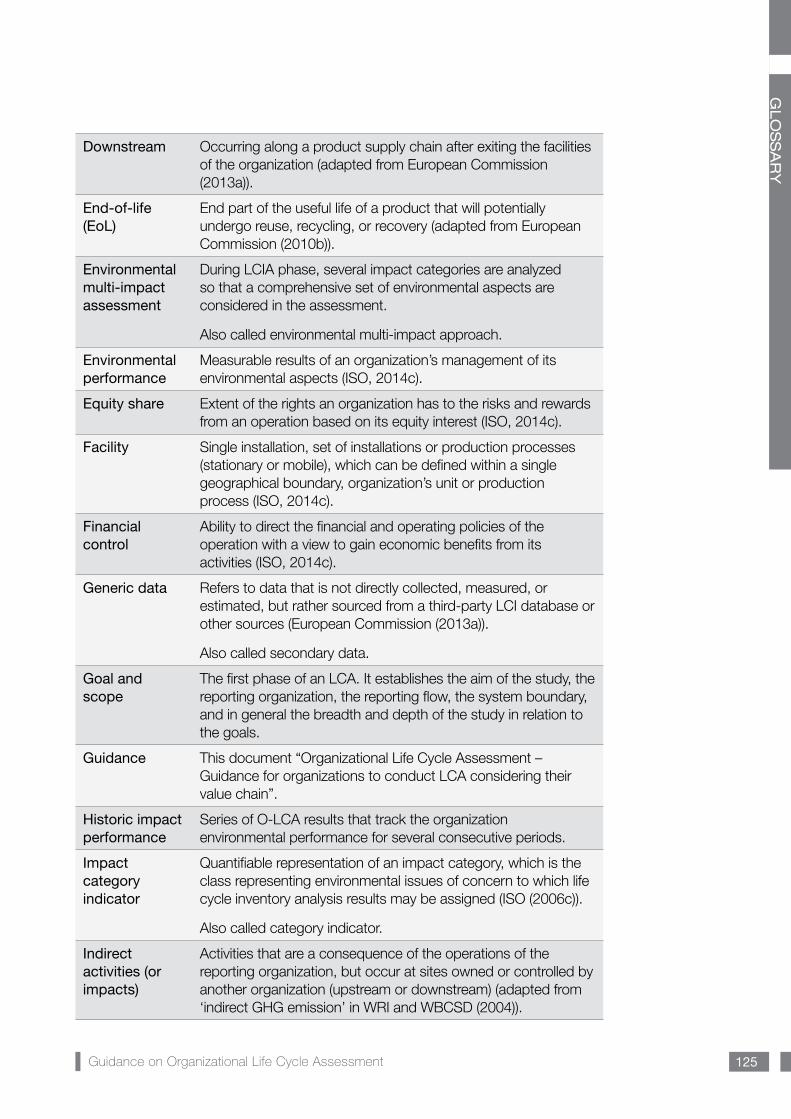
125Guidance on Organizational Life Cycle Assessment
Downstream Occurring along a product supply chain after exiting the facilities of the organization (adapted from European Commission (2013a)).
End-of-life (EoL)
End part of the useful life of a product that will potentially undergo reuse, recycling, or recovery (adapted from European Commission (2010b)).
Environmental multi-impact assessment
During LCIA phase, several impact categories are analyzed so that a comprehensive set of environmental aspects are considered in the assessment.
Also called environmental multi-impact approach.
Environmental performance
Measurable results of an organization’s management of its environmental aspects (ISO, 2014c).
Equity share Extent of the rights an organization has to the risks and rewards from an operation based on its equity interest (ISO, 2014c).
Facility Single installation, set of installations or production processes (stationary or mobile), which can be defined within a single geographical boundary, organization’s unit or production process (ISO, 2014c).
Financial control
Ability to direct the financial and operating policies of the operation with a view to gain economic benefits from its activities (ISO, 2014c).
Generic data Refers to data that is not directly collected, measured, or estimated, but rather sourced from a third-party LCI database or other sources (European Commission (2013a)).
Also called secondary data.
Goal and scope
The first phase of an LCA. It establishes the aim of the study, the reporting organization, the reporting flow, the system boundary, and in general the breadth and depth of the study in relation to the goals.
Guidance This document “Organizational Life Cycle Assessment – Guidance for organizations to conduct LCA considering their value chain”.
Historic impact performance
Series of O-LCA results that track the organization environmental performance for several consecutive periods.
Impact category indicator
Quantifiable representation of an impact category, which is the class representing environmental issues of concern to which life cycle inventory analysis results may be assigned (ISO (2006c)).
Also called category indicator.
Indirect activities (or impacts)
Activities that are a consequence of the operations of the reporting organization, but occur at sites owned or controlled by another organization (upstream or downstream) (adapted from ‘indirect GHG emission’ in WRI and WBCSD (2004)).
GLO
SSA
RY

Guidance on Organizational Life Cycle Assessment126
Input Product, material or energy flow that enters a unit process. Note: products and materials include raw materials, intermediate products and co-products (ISO, 2006b).
Life cycle assessment
Compilation and evaluation of the inputs, outputs and the potential environmental impacts of a product system throughout its life cycle (ISO, 2006c).
Also called product LCA.
Life cycle impact assessment, LCIA
Phase of LCA (product LCA or O-LCA) aimed at understanding and evaluating the magnitude and significance of the potential environmental impacts for a product or organization throughout the entire life cycle (ISO (2006c)).
Also called impact assessment.
Life cycle interpretation
Phase of LCA (product LCA or O-LCA) in which the findings of either the inventory analysis or the impact assessment, or both, are evaluated in relation to the defined goal and scope in order to reach conclusions and recommendations (ISO (2006c)).
Also called interpretation.
Life cycle inventory, LCI
Phase of LCA (product LCA or O-LCA) involving the compilation and quantification of inputs and outputs for a product or organiza-tion throughout the entire life cycle (adapted from ISO (2006c)).
Also called inventory.
Life cycle thinking
Going beyond the traditional focus on production site and manufacturing processes to include the environmental, social, and economic impacts of a product or organization over its entire life cycle. The main goals of life cycle thinking are to reduce a system’s resource use and emissions to the environment as well as improve its socio-economic performance throughout its life cycle (adapted from UNEP/SETAC (2007)).
Operational control
Full authority to introduce and implement operating policies at the operation level (ISO, 2014c).
Organization (1) An organization is a person or group of people that has its own functions with responsibilities, authorities and relationships to achieve its objectives. The concept of organization includes, but is not limited to sole-trader, company, corporation, firm, enterprise, authority, partnership, charity or institution, or part or combination thereof, whether incorporated or not, public or private (ISO, 2014c).
(2) Another definition is “a social unit of people that is structured and managed to meet a need or to pursue collective goals. All organizations have a management structure that determines relationships between the different activities and the members, and subdivides and assigns roles, responsibilities, and authority to carry out different tasks. Organizations are open systems—they affect and are affected by their environment” (Business Dictionary, 2014).
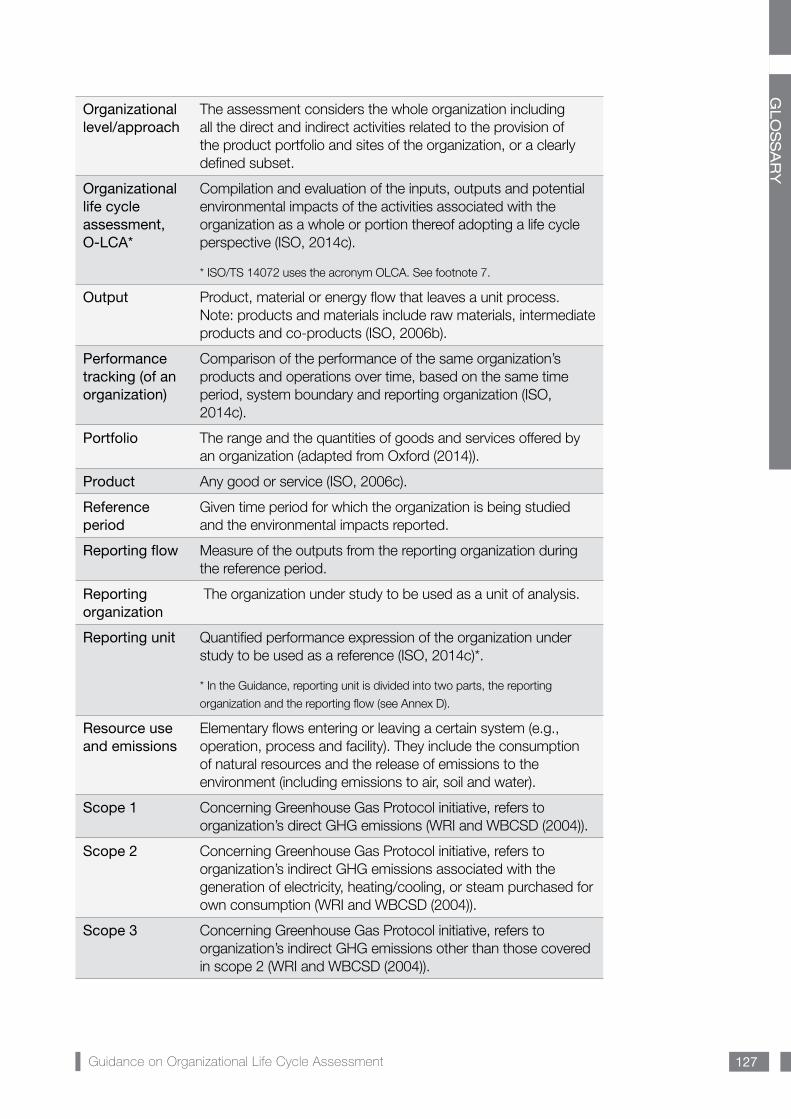
127Guidance on Organizational Life Cycle Assessment
Organizational level/approach
The assessment considers the whole organization including all the direct and indirect activities related to the provision of the product portfolio and sites of the organization, or a clearly defined subset.
Organizational life cycle assessment, O-LCA*
Compilation and evaluation of the inputs, outputs and potential environmental impacts of the activities associated with the organization as a whole or portion thereof adopting a life cycle perspective (ISO, 2014c).
* ISO/TS 14072 uses the acronym OLCA. See footnote 7.
Output Product, material or energy flow that leaves a unit process. Note: products and materials include raw materials, intermediate products and co-products (ISO, 2006b).
Performance tracking (of an organization)
Comparison of the performance of the same organization’s products and operations over time, based on the same time period, system boundary and reporting organization (ISO, 2014c).
Portfolio The range and the quantities of goods and services offered by an organization (adapted from Oxford (2014)).
Product Any good or service (ISO, 2006c).
Reference period
Given time period for which the organization is being studied and the environmental impacts reported.
Reporting flow Measure of the outputs from the reporting organization during the reference period.
Reporting organization
The organization under study to be used as a unit of analysis.
Reporting unit Quantified performance expression of the organization under study to be used as a reference (ISO, 2014c)*.
* In the Guidance, reporting unit is divided into two parts, the reporting
organization and the reporting flow (see Annex D).
Resource use and emissions
Elementary flows entering or leaving a certain system (e.g., operation, process and facility). They include the consumption of natural resources and the release of emissions to the environment (including emissions to air, soil and water).
Scope 1 Concerning Greenhouse Gas Protocol initiative, refers to organization’s direct GHG emissions (WRI and WBCSD (2004)).
Scope 2 Concerning Greenhouse Gas Protocol initiative, refers to organization’s indirect GHG emissions associated with the generation of electricity, heating/cooling, or steam purchased for own consumption (WRI and WBCSD (2004)).
Scope 3 Concerning Greenhouse Gas Protocol initiative, refers to organization’s indirect GHG emissions other than those covered in scope 2 (WRI and WBCSD (2004)).
GLO
SSA
RY

Guidance on Organizational Life Cycle Assessment128
Specific data Refers to directly measured or collected data representative of activities at a specific facility or set of facilities (European Commission (2013a)).
Also called primary data and site-specific data.
Subset of an organization
A managerial or regional part of an organization (e.g., business division, brand, region or facility).
Also called segment of an organization.
Supplier An entity that provides or sells products to another entity (i.e., a customer) (WRI and WBCSD, 2011a). In this Guidance, when referring to suppliers, both suppliers and other partners in the value chain are considered.
Supply chain A network of organizations (e.g., manufacturers, wholesalers, distributors and retailers) involved in the production, delivery, and sale of a product to the consumer (WRI and WBCSD, 2013).
Supporting activities
Activities of an organization that do not directly contribute to product production, but are necessary for running the organization.
System boundary
Set of criteria specifying which activities are part of the studied system. It determines the direct and indirect resource use and emissions associated with the operations of the reporting organization (adapted from WRI and WBCSD (2004) and ISO (2006c)).
Uncertainty analysis
Systematic procedure to quantify the uncertainty introduced in the results of a LCI analysis due to the cumulative effects of model imprecision, input uncertainty and data variability (ISO, 2006c).
Upstream Occurring along the value chain of purchased goods/services prior to entering into the organization facilities (adapted from European Commission (2013a)).
Value chain Refers to all of the upstream and downstream activities associated with the operations of the organization, including the use of sold products by consumers and the end-of-life treatment of sold products after consumer use. (WRI and WBCSD (2011a)).
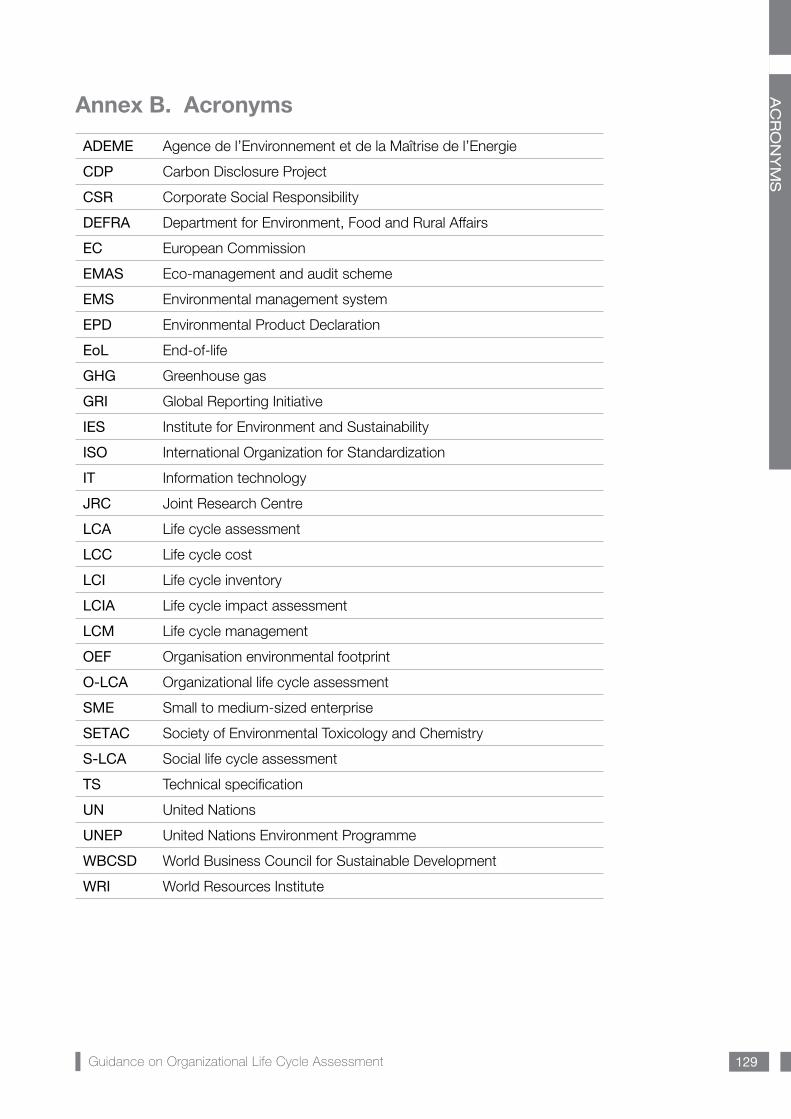
129Guidance on Organizational Life Cycle Assessment
Annex B. Acronyms
ADEME Agence de l’Environnement et de la Maîtrise de l’Energie
CDP Carbon Disclosure Project
CSR Corporate Social Responsibility
DEFRA Department for Environment, Food and Rural Affairs
EC European Commission
EMAS Eco-management and audit scheme
EMS Environmental management system
EPD Environmental Product Declaration
EoL End-of-life
GHG Greenhouse gas
GRI Global Reporting Initiative
IES Institute for Environment and Sustainability
ISO International Organization for Standardization
IT Information technology
JRC Joint Research Centre
LCA Life cycle assessment
LCC Life cycle cost
LCI Life cycle inventory
LCIA Life cycle impact assessment
LCM Life cycle management
OEF Organisation environmental footprint
O-LCA Organizational life cycle assessment
SME Small to medium-sized enterprise
SETAC Society of Environmental Toxicology and Chemistry
S-LCA Social life cycle assessment
TS Technical specification
UN United Nations
UNEP United Nations Environment Programme
WBCSD World Business Council for Sustainable Development
WRI World Resources Institute
AC
RO
NY
MS

Guidance on Organizational Life Cycle Assessment130
DTI/1702/PA
Annex C. Main existing methodologies referenced throughout the GuidanceIn the following sub-sections, the main existing approaches that laid the ground for O-LCA are briefly described.
A. Environmental management system
An environmental management system (EMS) is part of an organization’s management system used to develop and implement its environmental policy and manage its environmental aspects (ISO, 2004a). An EMS follows a Plan-Do-Check-Act; hence it is based in a process of continual improvement. The assumption is that this increased control will improve the environmental performance of the organization and its operating efficiency. However, the EMS itself does not dictate the level of environmental performance that must be achieved; each organization’s EMS is tailored to the organization’s specific characteristics and goals.
ISO 14001 and 14004 (ISO, 2004a, 2004b) set out the criteria for an environmental management system and support voluntary certification. The Eco-Management and Audit Scheme (EMAS) is another voluntary environmental management instrument (European Commission, 2009) for which certification can be obtained. The basic elements of an EMS are:
• reviewing the environmental goals of the organization,
• analyzing its environmental impacts and legal requirements,
• setting environmental objectives and targets to reduce environmental impacts and comply with legal requirements,
• establishing programs to meet these objectives and targets,
• monitoring and measuring progress in achieving the objectives,
• ensuring environmental awareness and competence of employees, and
• reviewing the progress of the EMS and making improvements.
B. Greenhouse Gas Protocol and other single-indicator accounting and reporting approaches
The Greenhouse Gas Protocol is a joint initiative of the World Resources Institute (WRI) and the World Business Council on Sustainable Development (WBCSD). It is widely used internationally as an accounting tool for governments and organizations to understand, quantify, and manage greenhouse gas emissions. It provides the accounting framework for most GHG standards and programs in the world (WRI and WBCSD, 2014b), such as the Carbon Disclosure Project (CDP, 2014c), Bilan Carbone (ADEME, 2010) and DEFRA (2013) and also for water reporting with CDP (2014a).
The “Greenhouse Gas Protocol Corporate Accounting and Reporting Standard” (WRI and WBCSD, 2004) provides standards and guidance for organizations preparing a GHG emissions inventory. It defines the scopes concept. Scope 1 refers to direct emissions from sources that are owned or controlled by the reporting company. Scopes 2 and 3 account for indirect emissions that are related to the activities of the reporting company but occur at sources owned or controlled by another company. Scope 2 focuses on the emissions from the generation of purchased electricity,
P MRecommended
itineraries
131Guidance on Organizational Life Cycle Assessment
heating, cooling or steam consumed by the company, while Scope 3 accounts for the remaining activities. The standard promotes the alignment of organization’s goals with the scope of the study and includes a detailed section on the procedure for defining emission reduction goals.
The “Greenhouse Gas Protocol Corporate Value Chain (Scope 3) Accounting and Reporting Standard” (WRI and WBCSD, 2011a) complements the former standard and provides companies with additional requirements and guidelines to assess their entire value chain emissions (included in Scope 3) and identify the most effective ways to reduce emissions. Accounting for Scope 3 emissions is optional when using the GHG Protocol Corporate Standard, but mandatory when the GHG Protocol Scope 3 Standard is used.
C. ISO 14064 and ISO/TR 14069
Parts 1 and 3 of ISO 14064 (ISO, 2006d, 2006e) specify principles and requirements for quantification, validation and reporting of GHG emissions and removals at the organizational level. They include requirements for the design, development, management, reporting and verification of an organization’s GHG inventory. ISO/TR 14069 (ISO, 2013) provides guidance for the application of ISO 14064-1 to greenhouse gas inventories at the organizational level, regarding the quantification and reporting of direct emissions, energy indirect emissions and remaining indirect emissions. ISO 14064-1, ISO 14064-3 and ISO/TR 14069 incorporate many key concepts and requirements defined by WRI and WBCSD (2004, 2011a).
D. ISO/TS 14072
“ISO/TS 14072: Environmental management — Life cycle assessment — Requirements and guidelines for Organizational Life Cycle Assessment” (ISO, 2014c) provides recommendations and requirements specifically for O-LCA to facilitate a more effective application of ISO 14040 and ISO 14044 (ISO, 2006b, 2006c) to organizations. The document describes how to adapt the requirements of product LCA to organizations and the potential benefits that this can bring. The main recommendations are regarding system boundary, and the limitations on reporting, environmental declarations and comparative assertions. An explicit adaptation of the requirements of ISO 14040 and ISO 14044 to an organizational context and an example of the application of O-LCA are provided in the annexes of ISO/TS 14072 document.
E. Life cycle management
Life cycle management (LCM) is a business management approach that puts the tools and methodologies within the life cycle thinking framework into practice. Therefore, it is an umbrella for both product LCA and O-LCA. The purpose of LCM is to ensure more sustainable value chain management by all types of organizations. It is a management system that helps organizations minimize the environmental and social burdens associated with their product or product portfolio, and thus with the organization itself and associated value chains, while maximizing economic and social values (UNEP/SETAC, 2009b, 2012). Under the LCM framework, sustainability is achieved through the use of life cycle approaches, programs and activities, and it is supported by relevant and reliable datasets, as well as an appropriate policy framework (UNEP/SETAC, 2012).
MA
IN E
XIS
TIN
G M
ETH
OD
OLO
GIE
S

Guidance on Organizational Life Cycle Assessment132
F. Organisation Environmental Footprint (OEF) Guide
The “Organisation Environmental Footprint (OEF) Guide”, developed by the Joint Research Centre of the European Commission, is a multi-criteria measure of the environmental performance of a product-providing organization from a life cycle perspective (European Commission, 2013a). It was the first published document of this importance describing a methodology that considers a life cycle perspective, multi-criteria assessment, while addressing the organizational perspective. It is been developed in parallel to the so called Product Environmental Footprint (European Commission, 2013b).
The document provides guidance on how to calculate an OEF and aims to increase reproducibility and comparability by emphasizing prescriptiveness over flexibility to ensure that the methodology is applied consistently (Pelletier, 2013). The OEF Guide has some requirements that do not align with life cycle standard principles (ISO, 2006b, 2006c, 2014c), that have not been extensively tested or used (e.g., screening step, lack of cut-off criteria, recycling formula for end-of-life, and the default set of impact categories and indicators) (Finkbeiner, 2013). The OEF Guide considers the possibility of comparative assertions intended for disclosure to the public, for organizations within the same sector and according to the OEF Sector Rules (under development).

133Guidance on Organizational Life Cycle Assessment
Annex D. Linkages and comparison of O-LCA and product LCAO-LCA follows the four-phase methodology underlying the product LCA standards (ISO, 2006b, 2006c), including goal and scope definition, inventory, impact assessment and interpretation. Similarly, most of the principles, requirements and guidelines from ISO 14040 and ISO 14044 apply also to O-LCA, with some minor adaptations. Finkbeiner and König (2013) state that the vast majority (27 out of 31) of the ISO 14044 requirements are basically transferable to organizations.
Product LCA and O-LCA have the following characteristics in common:
• Clear definition of the goal and scope consistent with the intended application;
• Iterative nature;
• Need of a reference unit;
• Definition of the system boundary;
• Life cycle or value chain approach;
• High need for data;
• Data quality requirements;
• Allocation procedures for reuse and recycling;
• Comprehensive set of environmental issues;
• Use of the same LCIA methodology;
• Interpretation of the inventory and impact assessment;
• Critical review when communicated to the public;
• Support decision-making; and
• Identify hotspots and priority for action.
Differences and complementarities between product LCA and O-LCA are summarized and discussed in the following sub-sections.
A. Complementarity
Product LCA and O-LCA are complementary tools at different levels, primarily because they answer different questions43. A product LCA, in itself, does not provide all the information to make decisions at the organizational level, as O-LCA does. Product LCA does, however, provide information on how to improve the environmental performance of an individual product, while the granularity of O-LCA does not allow for this.
The complementary nature of the two tools is made evident when O-LCA results are used to identify hotspots, for which product LCA is then used to pinpoint impact reduction opportunities in the selected products’ life cycles. As an alternative example, if a large number of product LCAs (or at least enough to be representative of the product portfolio) were undertaken with a consistent approach, then the
43 A similar complementarity is found between the standards “GHG Protocol Scope 3 Standard” and “GHG Protocol Product” (WRI and WBCSD, 2011a, 2011b) and between the guides “Product Environmental Footprint” and “Organisation Environmental Footprint” (European Commission, 2013a, 2013b).
O-L
CA
- PR
OD
UC
T L
CA
CO
MP
AR
ISO
N
MRecommended
itineraries

Guidance on Organizational Life Cycle Assessment134
summation of the product LCAs could serve as a proxy for an organization’s O-LCA result for the same reporting interval, if supporting activities were also added (see Section 2.3.3). Taking the opposite case, it may be also possible to generate individual generic product LCAs from O-LCA results, based on specific allocation keys (see Section 4.3.4).
From an O-LCA process perspective a certain amount of product-level data is indispensable, particularly when dealing with upstream or downstream burden allocation. Because organizations normally buy a share of a given supplier’s product portfolio, only the burdens corresponding to the purchased share shall be accounted for in O-LCA. Hence an allocation of the supplier-aggregated burdens using product-level data would need to be undertaken (see Sub-section 3.3.4.B).
B. Comparison
Even though O-LCA mostly follows the ISO 14040 and 14044 product standards with similar elements to be defined within the study, key differences can be identified at certain steps of the study (e.g., unit of analysis, system boundary and data collection). A comparison of the two methodologies is summarized in Table D.1.
The most obvious difference between product LCA and O-LCA is the scope. The former is an environmental evaluation of individual products, while the latter assesses an entire organization, or part thereof (i.e., specific business divisions, brands, regions or facilities). This affects the definition of both the unit of reference, used to build the inventory, and the delimitation of the system boundary.
In ISO/TS 14072, the unit of analysis is the ‘reporting unit’, which is defined as a “quantified performance expression of the organization under study to be used as a reference”. For the sake of clarity, in this Guidance, ‘reporting unit’ is broken down into two elements: ‘reporting organization’ and ‘reporting flow’. The authors considered it necessary to differentiate between the two aspects of the unit of analysis (‘reporting unit’), the definition of the unit (‘reporting organization’) and the quantification of that unit (‘reporting flow’). The latter are not explicitly used in ISO/TS 14072 (ISO, 2014c).
Although the main requirements of system boundary definition in product LCA apply to O-LCA, the approach is different. For the latter, the value chain considers upstream and downstream organizations’ operations/processes/activities involved in the production of the entire product portfolio of the reporting organization, in addition to the raw materials, energy, intermediate products, etc. considered for an individual product LCA.
The scope definition (including unit of analysis and system boundary) was introduced in product LCA to achieve comparability. However, inherent differences between organizations, their portfolios/operations, and thus, their O-LCA approach decisions introduce serious comparability issues (see Section 2.2). “Rather than comparing different organizations, the continuous improvement of organizations with a regular assessment of the environmental performance of an individual organization over time – performance tracking – seems a more promising application for O-LCA” (Finkbeiner, 2013).

135Guidance on Organizational Life Cycle Assessment
Product LCA O-LCA
Goal and scope
General A sole product LCA, in itself, does not provide all the information to make decisions on an organizational level, as O-LCA does.
The granularity of O-LCA does not give information on how to improve the environmental performance of an individual product.
Unit of analysis and consistent boundaries are mostly required for comparative assertions. Product LCA can also be used for performance tracking if it is embedded in the right technical and organizational manner.
Apart from transparency reasons (due to the large complexity of the system), the need of a unit of analysis and consistent boundaries is for environmental performance tracking of the organization.
Unit of analysis
Functional unit and the reference flow are defined according to the main function/s of the product.
The reporting organization defines the organization per se (i.e., the unit of analysis) and the reporting flow ideally represents the quantification of its product portfolio (amounts, unit, revenue, etc.).
Functional unit specifies which the function of the product used for comparison is.
In the reporting organization, it is specified which part(s) of the organization are included, determining whether the whole organization is considered and using the consolidation methods.
The reference flow refers to a certain number of units of the product assessed – as many as needed to fulfill the functional unit.
The reporting flow very often includes more than one product – as many as the organization is offering in its portfolio.
Time issues
Generally, results of the study are largely time-independent during a reasonable period.
The results reported by an organization may be different from one year to the following one, due to changes in the amounts or types of products in the portfolio, among others.
Very often, the environmental impacts are calculated according to the life span of the product.
The environmental results of the organization are referred to a given reference period that should be defined in the reporting organization.
System boundary
The units/steps of the life cycle are processes, materials, energy, intermediate products, etc.
The units are those organizations in the value chain of the organization.
The system boundary is derived from the type of product.
The definition of the reporting organization is the determining issue for stating system boundary.
No distinction is done between direct and indirect impacts.
The direct and indirect activities and associated impacts are differentiated within the system boundary.
O-L
CA
- PR
OD
UC
T L
CA
CO
MP
AR
ISO
N

Guidance on Organizational Life Cycle Assessment136
Product LCA O-LCA
Life cycle inventory analysis
General The involvement of stakeholders is encouraged (beyond the study commissioners) in the peer review of the study.
It is recommended, as far as possible, the involvement of the suppliers, especially for providing specific data of their operations and own suppliers.
The outcomes may be of course updated but it is not common to do so periodically.
An ulterior improvement of data collection efforts and data quality is particularly recommended. Due to the performance tracking objective, O-LCA is expected to be applied to the organization in consecutive years.
Supporting activities
Those activities that are not directly linked to the production are usually not considered.
O-LCA does consider activities generally disregarded in product LCA (e.g., business travel, leased assets, heating, cleaning services, managerial offices).
Data collection
The use of specific data for the product assessed is expected.
The use of more generic or extrapolated data is expected, particularly in big organizations providing complex products.
Multi-functional situations
System expansion is one option to avoid allocation.
In general, system expansion is not used, due to the risk of inconsistent or poorly representative substitution scenarios.
Life cycle impact assessment
General Basically, the same methods are used for product and organizational LCA once the inventory has been compiled. In O-LCA, the use of inventory-level indicators, apart from impact categories, is common.
Life cycle interpretation and uncertainty
General Comparison between products is possible and can be communicated, given the comparability of the assessment approach.
External communication of comparative assertions is discouraged, but performance monitoring and reporting is sought.
Reporting and communication
General Communication of results (e.g., through EPDs) is mainly targeted to consumers.
Organizational reporting (e.g., sustainability reporting) mainly aims to communicate the results to, consumers, institutions and society.
Table D.1. Differences between product LCA and O-LCA.

137Guidance on Organizational Life Cycle Assessment
Annex E. The flagship project 1c “LCA of organizations” A. The UNEP/SETAC Life Cycle Initiative
The United Nations Environment Programme (UNEP) and the Society for Environmental Toxicology and Chemistry (SETAC) launched, in 2002, an international life cycle partnership, known as the UNEP/SETAC Life Cycle Initiative, aiming to enable users around the world to put life cycle thinking into effective practice. The initiative responds the call by governments around the world for a life cycle economy in the Malmö Declaration (UNEP, 2000). It has contributed to the “10-Year Framework of Programmes (YFP) on Sustainable Consumption and Production Patterns”, as requested at the World Summit on Sustainable Development in Johannesburg (UN, 2002). This 10YFP has recently been adopted in the Rio+20 Summit with a mandate to affirm its vision based on life cycle approaches (UN, 2012). Coinciding with the Rio+20 Summit, a special publication was launched for the tenth anniversary of the UNEP/SETAC Life Cycle Initiative, entitled “Greening the Economy Through Life Cycle Thinking” (UNEP/SETAC, 2012).
Since its establishment, “the UNEP/SETAC Life Cycle Initiative has been active […] to help bring the life cycle approach and the related tools to maturity. It has been at the center of efforts to generate life cycle tools that have the potential to provide a full triple-bottom-line breakdown of a product’s impacts. It has helped to bring together the required human resources for developing and using the tools existing via the international network of life cycle practitioners, which continues to expand” (UNEP/SETAC, 2012). The activities of the Life Cycle Initiative have been carried out in several phases.
Although progress has been achieved on global consensus about key life cycle topics, a number of issues still need attention and are being addressed in Phase III (2012-2016)44. The overarching objective of the current phase is to facilitate the generation and uptake of science-based life cycle approaches and information for products by business, government and civil society practice worldwide as a basis for sustainable consumption and production. The work program for Phase III was derived through an intensive strategy development process, and includes three program areas and a number of flagship projects and non-flagship activities.
B. The flagship project “LCA of organizations”
The flagship project “LCA of organizations” within Phase III started early 2013. The primary goal of the project is to demonstrate that the benefits of the life cycle approach are not limited to the application to products and that the use in organizations is relevant, meaningful and feasible within the framework of product LCA standards. The co-leaders of the flagship project are Prof. Dr. Matthias Finkbeiner from TU Berlin (Germany) and Prof. Atsushi Inaba from Kogakuin University (Japan). Dr. Julia Martínez Blanco from TU Berlin (Germany) is the coordinator of the project.
The flagship project and this Guidance will:
• Complement product perspective with the assessment of organizations.
• Enhance the value that O-LCA brings to organizations and their value chains.
44 More information on Phase III of the Life Cycle Initiative is available in UNEP/SETAC (2014).
LC
A O
F O
RG
AN
IZA
TIO
NS F
LA
GSH
IP P
RO
JEC
T

Guidance on Organizational Life Cycle Assessment138
• Highlight situations for which O-LCA could be useful.
• Ease the application of O-LCA, focusing on methodological challenges.
• Proof and exemplify the use of the methodology through a road-testing phase.
• Guide practitioners through the many standards and approaches that may hinder application at the organizational level.
• Contribute to the spread of O-LCA among stakeholders.
The flagship project has three main tasks. The first two tasks were devoted to the drafting and consolidation of this Guidance (see Sub-section E). Sub-section F lists the external events where the Guidance was discussed or presented. Finally, Sub-section G indicates the calendar and activities for the last task of road-testing the Guidance.
Date Milestone Type
April 2013 Project is approved by the ILCB UNEP/SETAC
June 2013 Invitation to participate is sent (e-mail) UNEP/SETAC
July 2013 Establishment of the groups Internal
Task 1: Drafting the Guidance Document
September 2013
WD1 – Bullet-point draft sent to co-drafters Document
October 2013 WD2 – Preliminary draft sent to co-drafters Document
November 2013 First face-to-face meeting in Japan Meeting
January 2014 Online meeting of the working group Meeting
February 2014 Start collecting case studies for the Guidance
Case studies
June 2014 WD3 – Preliminary draft sent to co-drafters Document
July 2014 Online meeting of the working group Meeting
Task 2: Consolidated Guidance Document
August 2014 WD4 – Agreed draft sent to feedback stakeholders
Document
October 2014 End of the collection of case studies for the Guidance
Case studies
October 2014 WD5 – Consolidated draft sent to feedback stakeholders
Document
November 2014 WD6 – Final draft Document
December 2014 Editing and proofreading Document
December 2014 Review process by ILCB – TRC UNEP/SETAC
February 2015 Design and lay-out Document
Table E.1. Milestones of Tasks 1 and 2 of the flagship project “LCA of organizations”.

139Guidance on Organizational Life Cycle Assessment
C. Summary of the process for the publication of the Guidance
Task 1: Drafting of the Guidance Document
A working group of 17 people was established in mid-2013 to support the lead authors draft the Guidance and are listed as co-drafters in the Acknowledgements (p. 3). The first meeting of the working group was held in Tokyo in November 2013, back-to-back with the “International Workshop of Scope 3 and LCA for Organization” (Mizuho, 2014). Two additional online meetings were held during 2014. Methodological issues and case studies were discussed at each physical and virtual meeting. Three versions of the Guidance were circulated among the working group members between September 2013 and June 2014 (i.e., working documents, WD1, 2 and 3).
Case studies describing organizational approaches for the environmental multi-impact assessment of organizations and their value chains were collected for inclusion in the Guidance (See Section 1.3). In total, 20 external experts from around the world, alongside participants of the flagship project, searched for suitable case studies and more than 40 organizations were contacted. Particular efforts were devoted to have a representative set of case studies from regional and sectorial point of view.
Task 2: Consolidated Guidance Document
Once the authors and working group had prepared the Guidance, it was consolidated by the feedback of about 50 stakeholders and the contact person for each case study (see Acknowledgements, p.4). The specific dates are shown in Table E.1. Feedback was also collected at several conferences and international meetings during 2014 (see Sub-section F). The final draft was submitted to the International Life Cycle Board of the UNEP/SETAC Life Cycle Initiative for review in December 2014.
D. External events where the Guidance was presented
During its preparation, the Guidance and other flagship project outputs were presented in several relevant international conferences and meetings in order to promote the methodology and collect comments and feedback. These include:
• International Workshop for Scope 3 Standard and LCA for Organization (Japan, October 2013). Platform presentation by Julia Martínez Blanco.
• SETAC Europe 24th Annual Meeting (Switzerland, May 2014). Poster.
• UNEP/SETAC Life Cycle Initiative: Update on phase 3 activities (Parallel to SETAC Europe 24th Annual Meeting). Platform presentation by Julia Martínez Blanco.
• ISO/TC 207 Environmental management plenary (Panamá, May 2014). Platform presentation by Matthias Finkbeiner.
• Indian Conference of Life Cycle Management - ILCM 2014 (India, September 2014). Platform presentation by Ana Quiros.
• LCA XIV Conference (USA, October 2014). Platform presentation by Ana Quiros.
• 11th International Conference on EcoBalance (Japan, October 2014). Platform presentation by Atsushi Inaba.
Task 3: Guidance road-testing (2015)
The flagship project, in 2015, will begin road-testing this Guidance document in about 10 organizations from different regions, sectors, and with different levels of experience on the use of environmental tools and with varying amounts of available data. This should provide a good foundation upon which a larger group of stakeholders can engage to use O-LCA. There are already several organizations willing to contribute to the road-testing of O-LCA.
LC
A O
F O
RG
AN
IZA
TIO
NS F
LA
GSH
IP P
RO
JEC
T

Guidance on Organizational Life Cycle Assessment140
Annex F. Case studies (‘First Mover’ stories)Every ‘First Mover’ story referred to in this Guidance is described below, with a brief explanation of the organization, part of the organization assessed and presented in the Guidance, and Reports related to the case study. Table F.1 provides additional detail of the case studies.
Accor SA
Description: Accor is a French international hotel group present in 92 countries with more than 3,500 hotels and a large brand portfolio. Accor’s activities cover accommodation, restoration and sale of food and beverages. It is a pure-player in hotels and boasts a unique and universal business model as an owner, operator and franchisor of budget through to luxury hotels on all five continents. Subject assessed: the whole company.
Reports in the Guidance: Report 3 (p.52), Report 7 (p.75) and Report 10 (p.82).
BASF
Description: BASF, founded in Germany in 1865, is currently the largest chemical company in the world. It comprises production sites in more than 80 countries in Europe, Asia, Australia, America and Africa and supplies products to a wide variety of industries in over 200 countries. Its business is organized in the segments chemicals, plastics, performance products, functional solutions, agricultural solutions, and oil & gas. Subject assessed: Demarchi, an industrial complex of BASF in São Bernardo do Campo, Brazil (1,200 employees (Fundação Espaço ECO, 2014)).
Reports in the Guidance: Report 2 (p.44) and Report 16 (p.99).
Colruyt Group
Description: Colruyt Group is a family-owned retailer, active in Belgium, France and Luxembourg. It is primarily engaged in retail and wholesale of food products (including, e.g., Colruyt, OKay, Bio-Planet, DreamLand and ColliShop). Colruyt Group also supplies fuels through DATS 24 filling stations, provides printing and document management solutions (Symeta) and produces renewable energy (WE Power). Finally, it also has a corporate activities division. Subject assessed: in principal, the whole company
Reports in the Guidance: Report 4 (p.56).
Inghams Enterprises Pty Limited
Description: Inghams is one of the largest producers of chicken and turkey products in Australia. Today, it encompasses a fully integrated farming, primary and further processing poultry business, ingredients for pet food and a piggery operation. It includes over 70 owned and operated facilities and over 160 contracted broiler farms. Inghams operates in all Australian states and New Zealand. Subject assessed: the chicken product line in Australia (6,000 employees).
Reports in the Guidance: Report 9 (p.80) and Report 17 (p.100).

141Guidance on Organizational Life Cycle Assessment
KPMG
Description: KPMG is a global network of professional firms providing Audit, Tax and Advisory services, with more than 155,000 professionals working together to deliver value in 155 countries worldwide. In Mexico, the firm has been operating for more than 65 years. KPMG in Mexico has over 175 partners and more than 2,800 professionals in 18 offices, strategically located in the most important cities of the country, to offer its services to local, national and multinational clients. Subject assessed: KPMG in Mexico (2,690 employees).
Reports in the Guidance: Report 13 (p.92).
Mondelēz International, Inc.
Description: Mondelēz International is a global snacking powerhouse. It is a world leader in biscuits, chocolate, gum, candy, coffee and powdered beverages, with brands such as Oreo, LU and Nabisco biscuits; Cadbury, Cadbury Dairy Milk and Milka chocolate; Trident gum; Jacobs coffee and Tang powdered beverages. Subject assessed: the whole company.
Reports in the Guidance: Report 18 (p.109).
Natura Cosméticos SA
Description: Natura is the biggest Brazilian manufacturer and marketer of cosmetics, fragrances and personal care products with a strong presence in Latin America. It sells products through 1.6 million sales consultants who distribute nearly 400 million product units per year to Natura’s customers in many countries. Subject assessed: the whole company.
Reports in the Guidance: Report 12 (p.91).
Shiseido Company, Limited
Description: Shiseido is a cosmetic and personal care product manufacturer and seller company in Japan. It is one of the oldest cosmetics companies in the world, founded in 1872 as Japan’s first western-style pharmacy. Shiseido is the largest cosmetic firm in Japan and the fourth largest cosmetics company in the world. Subject assessed: Shiseido in Japan (24,600 employees (Shiseido, 2014)).
Reports in the Guidance: Report 1 (p.41).
Storengy (GDF SUEZ)
Description: Storengy is a limited company of GDF SUEZ, operating along the entire value chain of the underground storage of natural gas, mainly in France and also abroad. It is one of the few global operators with skills as diverse as market analysis, subsoil science, drilling techniques, engineering underground storage tanks, the operation of industrial facilities and surface industrial safety. With its expertise, Storengy has become one of the world leaders in the sector. Subject assessed: Storengy in France (880 employees (Storengy, 2014)).
Reports in the Guidance: Report 6 (p.74) and Report 14 (p.95).
FIR
ST M
OV
ER
STO
RIE
S

Guidance on Organizational Life Cycle Assessment142
Unilever
Description: Unilever is an Anglo-Dutch multinational fast moving consumer goods company with a wide ranging portfolio in foods, household and personal care products. Unilever owns around 400 brands, including Knorr, Ben & Jerry’s and Dove. Subject assessed: the whole company.
Reports in the Guidance: Report 5 (p.67) and Report 15 (p.96).
Case study Region headquarters Sector EmployeesContact person in the organization
Sources for preparing the summaries
Accor S.A. Europe (France) Hotels and resorts 160,000 (Accor, 2014) Arnaud Herrmann, VP Sustainable Development
(Accor, 2011a, 2011b, 2014)
BASF Europe (Germany) Chemicals 112,000 (BASF, 2014) Emiliano Graziano, Socio-ecoefficiency Manager Area Brazil
(Fundação Espaço ECO, 2014)
Colruyt Group Europe (Belgium) Retail 27,000 (Colruyt Group, 2014)
Steven Van Hemelryck, Project Engineer - Environment & Energy
Summary of OEF report pilot testing phase prepared by Manuele Margni (CIRAIG)
Inghams Enterprises Pty Limited
Oceania (Australia) Poultry 8,000 (Inghams, 2014) Julia Seddon, Group Environment Manager
(Edge Environment, 2011; Bengtsson, 2013; Inghams, 2014)
KPMG Europe (Netherlands) Professional services 155,000 (KPMG, 2014) Andrea Brassel, Manager of Corporate Responsability & Sustainability Manager in Mexico
Summary of Alvarado Díaz et al. (2014) prepared by Elsa Gabriela Alvarado Díaz (CADIS)
Mondelēz International, Inc.
North America (US) Food processing 100,000 (Mondelēz International, 2014)
Jonathan Horrell, Director Sustainability
Mondelēz International (2014) and essay provided by the organization
Natura Cosméticos S.A. Latin America (Brazil) Consumer goods - Cosmetics
7,000 + 1.6 million sales consultants (Natura, 2014a)
Fabien Brones, Environmental Impact Manager
(Bronès, 2011; Natura, 2011, 2014a, 2014b)
Shiseido Company, Limited
Asia (Japan) Consumer goods - Cosmetics
47,000 (Shiseido, 2014) Kenji Ohashi, Environmental Planning Group
Iwai and Ohashi (2013) and essays provided by the organization
Storengy (GDF SUEZ) Europe (France) Natural gas 1,000 (CRIGEN, 2012) Anne Prieur Vernat, LCA and Environmental Assessment Expert in GDF SUEZ
(CRIGEN, 2012)
Unilever Europe (UK) Consumer goods – food, beverage, cleaning agents and personal care
174,000 (Unilever, 2014) Dr. Henry King, Science & Technology Leader - Sustainability
(Milà i Canals, 2010; Unger et al., 2011; Unger and King, 2013; Unilever, 2014)
Volkswagen Group Europe (Germany) Automotive 573,000 (Volkswagen, 2014) Dr. Jens Warsen, Group Research Environmental Affairs Product
(Warsen, 2013; Warsen et al., 2013; Volkswagen, 2014)
Table F.1. Detail information of the case studies

143Guidance on Organizational Life Cycle Assessment
Volkswagen
Description: The Volkswagen Group is one of the world’s leading vehicle and engine manufacturers and the largest carmaker in Europe. Volkswagen comprises twelve brands that operate facilities across 27 countries delivering more than 10 million vehicles per year. Subject assessed: the whole company.
Reports in the Guidance: Report 11 (p.88).
Case study Region headquarters Sector EmployeesContact person in the organization
Sources for preparing the summaries
Accor S.A. Europe (France) Hotels and resorts 160,000 (Accor, 2014) Arnaud Herrmann, VP Sustainable Development
(Accor, 2011a, 2011b, 2014)
BASF Europe (Germany) Chemicals 112,000 (BASF, 2014) Emiliano Graziano, Socio-ecoefficiency Manager Area Brazil
(Fundação Espaço ECO, 2014)
Colruyt Group Europe (Belgium) Retail 27,000 (Colruyt Group, 2014)
Steven Van Hemelryck, Project Engineer - Environment & Energy
Summary of OEF report pilot testing phase prepared by Manuele Margni (CIRAIG)
Inghams Enterprises Pty Limited
Oceania (Australia) Poultry 8,000 (Inghams, 2014) Julia Seddon, Group Environment Manager
(Edge Environment, 2011; Bengtsson, 2013; Inghams, 2014)
KPMG Europe (Netherlands) Professional services 155,000 (KPMG, 2014) Andrea Brassel, Manager of Corporate Responsability & Sustainability Manager in Mexico
Summary of Alvarado Díaz et al. (2014) prepared by Elsa Gabriela Alvarado Díaz (CADIS)
Mondelēz International, Inc.
North America (US) Food processing 100,000 (Mondelēz International, 2014)
Jonathan Horrell, Director Sustainability
Mondelēz International (2014) and essay provided by the organization
Natura Cosméticos S.A. Latin America (Brazil) Consumer goods - Cosmetics
7,000 + 1.6 million sales consultants (Natura, 2014a)
Fabien Brones, Environmental Impact Manager
(Bronès, 2011; Natura, 2011, 2014a, 2014b)
Shiseido Company, Limited
Asia (Japan) Consumer goods - Cosmetics
47,000 (Shiseido, 2014) Kenji Ohashi, Environmental Planning Group
Iwai and Ohashi (2013) and essays provided by the organization
Storengy (GDF SUEZ) Europe (France) Natural gas 1,000 (CRIGEN, 2012) Anne Prieur Vernat, LCA and Environmental Assessment Expert in GDF SUEZ
(CRIGEN, 2012)
Unilever Europe (UK) Consumer goods – food, beverage, cleaning agents and personal care
174,000 (Unilever, 2014) Dr. Henry King, Science & Technology Leader - Sustainability
(Milà i Canals, 2010; Unger et al., 2011; Unger and King, 2013; Unilever, 2014)
Volkswagen Group Europe (Germany) Automotive 573,000 (Volkswagen, 2014) Dr. Jens Warsen, Group Research Environmental Affairs Product
(Warsen, 2013; Warsen et al., 2013; Volkswagen, 2014)
FIR
ST M
OV
ER
STO
RIE
S

Guidance on Organizational Life Cycle Assessment144
Photo credits
Page SourceCover – palm trees Annekatrin LehmannCover – sunset Clara Martínez GarcíaCover – production chain Flickr - No name1
Cover – rice production Flickr - United Nations Photo2
P1 – vegetables Julia Martínez BlancoP1 – people Flickr - Charles Roffey3
P1 – money ShutterstockP18 – sailors Kirana WolfP25 – rice production Flickr - Mariusz Kluzniak4
P29 – ferris wheel Julia Martínez BlancoP37 – cranes Pawel KazmierczykP39 – stone pile iStockphotoP41 – air transport Pawel KazmierczykP48 – women iStockphotoP59 – women Flickr - CIFOR5
P68 – mountain Ester SanllehiP77 – bottle filling iStockphotoP84 – strawberry production Flickr - World Bank Photo Collection6
P93 – street Julia Martínez BlancoP100 – offices Flickr - Heather Buckley7
P103 – fields Annekatrin LehmannP110 – posy Clara Martínez García
Flickr images reproduced under the Creative Commons license 1 https://www.flickr.com/photos/psit/5605605412/in/photolist-bvcbis-vGpC2-88u6P9-qb8ms-Fk7SA-5VCT3r-
o9Jiv8-7p3AnQ-5VCSSt-em2tj-naim3R-7zjGac-4BeUe8-beHUTg-85CsKc-6iSSpX-8CFY8h-4EZoU6-8CG373-9xmccb-4DcPQH-2gemF-29Ree-5Dw5v-5nBDrG-4Geeys-vGpBe-aAYvA4-5nxnz6-5nBCLN-8D45r6-5nBBLE-bDieoP-5nBCgs-5nxosX-5nBD6C-9GymqJ-5nBBqw-4F3Lrg-5nBARw-7AucwN-5nxoZF-bqomgC-bDifqX-bqoMNU-8CCQvZ-5yBDSs-aA4Xdh-aA2hG8-aA4XhJ
2 https://www.flickr.com/photos/un_photo/6812601569/
3 https://www.flickr.com/photos/charlesfred/109258281/in/photolist-aDYFt-dZ4iW2-6q5aJ-cyXB2-J1V6F-uomYV-eKBJQP-jdysiW-jdx2AR-nZo1A--a7uGZv-fCgCj-6q4MX-5FSesQ-abr4zF-9mZAQF-8XU6K-j3ncUC-53ZEhh-6hEvps-edx98k-aFbGJv-jdyXbL-c1tPtG-6kGom-pszygT-7EaZRW-jduvRr-8Q4h8-jdzdMC-jdwQiF-jdw2mM-ff8qRS-8TiQZ-65otBM-t8eDK-jdwMYb-dbjaww-8hXxzB-9adz2s-9msrLW-dpXxBY-66cMR8-9QeUoe-fEuyum-fEuDJ9-4qTN1b-5sgUY2-iatWi
4 https://www.flickr.com/photos/39997856@N03/11850367566/in/photolist-j4beqb-ehCXYr-7419E6-ayUVSP-bRXwWR-5rdKRJ-bPQdw-6YmLLR-aNY5Gz-aJXuck-aG9bAa-aSCH92-gcnYx-aTiHCF-aHvMBa-aTiHMp-fcP686--bks74W-nVifwy-ehJHhw-6HhLpa-jarkeY-4Eh6zL-jJhbj5-88qSMM-bDcWSL-m4EPdC-aKFt76-aQ8mca-aKji-q9mBQ3-4jZunY-aHvN9P-88qSJK-crz2f9-63V8Rf-on3Uxf-aJDtZF-j3Gk6T-73uFVX-dJ2g43-o-p5Uh8-ooSyMQ-3jP9wP-7455UG-88u7nw-4gAEQJ-35Cc6Y-nq28vw
5 https://www.flickr.com/photos/cifor/6429431757/in/set-72157628216240379/
6 https://www.flickr.com/photos/worldbank/8102900770/in/photolist-dm2qqx-dm2qj4-dm2ucA-dm2ugj-dm2qot-dm2u6G-9ugn98-9ugmUe-9Fgc1r-9FgbQP-9Fj8QA-9Fgt6X-9ugngx-9ujWSS-9ugnvH-9FjpX3-9Fj8Uo-6JpkmD-ov8YdE-CZyNv-9Fgt1k-9Fj95S-9Fgc3p
7 https://www.flickr.com/photos/heatherbuckley/8364484956/in/photolist-dK9aXS-e7urRf-bzbX-4Q1Njo-8J9oR9-ETVWM-pujCQ-5iFCam-MhQi-k9Dj4-6UTxUf-4p9yZH-6LFb8z-6P7YdG-ecsCNB-5uN6DY-bBAFj-ejpaFA-6npvqA-kvWUVF-4e9cMx-e1x3Fr-d2ASd-4BoUFF-yyHBV-qv8hpt-7vUUxM-685wTN-pyjSwZ-7fVdiQ-5idr27-pWdRpt-bbdXEv-dyKu1P-4pxFGZ-5p1jK7-8vEXpw-BiMaZ-5kDyTm-mgBbgq-dYEHR2-k6VTYz-4U-Rjg1-pu7e2F-dARPPr-nUcsPu-fFwC28-REYo4-8s1e4L-dxFHsw

145Guidance on Organizational Life Cycle Assessment
PH
OTO
CR
ED
ITS

About the UNEP/SETAC Life Cycle Initiative
The United Nations Environment Programme (UNEP) and the Society for Environmental Toxicology
and Chemistry (SETAC) launched in 2002 an International Life Cycle Partnership, known as the
Life Cycle Initiative (LCI), to enable users around the world to put life cycle thinking into effective
practice. The Initiative responds the call by Governments around the world for a Life Cycle
economy in the Malmö Declaration (2000). It contributes to the 10-Year Framework of Programmes
to promote sustainable consumption and production patterns, as requested at the World Summit
on Sustainable Developement (WSSD) in Joannesburg (2002). It aims to promote life cycle thinking
globally and facilitate the exchange of knowledge of over 2,000 experts worldwide and four
regional networks from different continents.
Building on the successes of the first two phases of activities from 2002 to 2012 and following from
the expert consultation outcomes, the Life Cycle Initiative has started phase III in 2012.
Vision
A world where life cycle approaches are mainstreamed.
Mission
Enable the global use of credible life cycle knowledge for more sustainable societies.
Objectives
The overarching objective of the Life Cycle Initiative is to: Facilitate the generation and uptake
of science-based life cycle approaches and information for products by business, government
and civil society practice worldwide as a basis for sustainable consumption and production. The
specific objectives of the Life Cycle Initiative are to:
• Enhance the global consensus and relevance of existing and emerging life cycle methodologies
and data management;
• Expand capability worldwide to apply and to improve life cycle approaches; making them
operational for organisations;
• Communicate current life cycle knowledge and be the global voice of the Life Cycle community
to influence and partner with stakeholders.
For more information,see
www.lifecycleinitiative.org

Sponsors and Strategic Partners of the UNEP/SETAC Life Cycle Initiative
Platinum Sponsors
Gold Sponsors
Silver Sponsors
Bronze Sponsors
Strategic Supporting Partners
African LCA Network (ALCANET); Association for Life Cycle Assessment in Latin America (ALCALA); Federation of Indian Chamber of Commerce and Industries (FICCI); Ibero-American Network of LCA; Indian LCA Society; ISO; Sichuan University
About SETAC
The Society of Environmental Toxicology and Chemistry (SETAC) is a professional society in the form
of a non-forprofit association, established to promote the use of a multidisciplinary approach to solving
problems of the impact of chemicals and technology on the environment. Environmental problems
often require a combination of expertise from chemistry, toxicology, and a range of other disciplines
to develop effective solutions. SETAC provides a neutral meeting ground for scientists working in
universities, governments, and industry who meet, as private persons not bound to defend positions,
but simply to use the best science available.
Among other things, SETAC has taken a leading role in the development of Life Cycle Management
(LCM) and Life Cycle Assessment (LCA).
The organization is often quoted as a reference on LCA matters.
For more information,see
www.setac.org

About the UNEP Division of Technology, Industry and Economics
Set up in 1975, three years after UNEP was created, the Division of Technology, Economics
(DTIE) provides solutions to policy-makers and helps change the business environment by offering
platforms for dialogue and co-operation, innovative policy options, pilot projects and creative market
mechanisms.
DTIE plays a leading role in three of the six UNEP strategic priorities: climate change, harmful
substances and hazardous waste, resource efficiency.
DTIE is also actively contributing to the Green Economy Initiative launched by UNEP in 2008. This
aims to shift national and world economies on to a new path, in which jobs and output growth are
driven by increased investment in green sectors, and by a switch of consumers’ preferences towards
environmentally friendly goods and services.
Moreover, DTIE is responsible for fulfilling UNEP’s mandate as an implementing agency for the
Montreal Protocol Multilateral Fund and plays an executing role for a number of UNEP projects
financed by the Global Environment Facility.
The Office of the Director, located in Paris, coordinates activities through:
> The International Environmental Technology Centre - IETC (Osaka), which implements
integrated waste, water and disaster management programmes, focusing in particular on Asia.
> Sustainable Lifestyles, Cities and Industry (Paris), which promotes sustainable consumption
and production patterns as contribution to human development through global markets.
> Chemicals (Geneva), which catalyzes global actions to bring about the sound management of
chemicals and the improvement of chemical safety worldwide.
> Energy (Paris and Nairobi), which fosters energy and transport policies for sustainable development
and encourages investment in renewable energy and energy efficiency.
> OzonAction (Paris), which supports the phase-out of ozone depleting substances in developing
countries and countries with economies in transition to ensure implementation of the Montreal
Protocol.
> Economics and Trade (Geneva), which helps countries to integrate environmental considerations
into economic and trade policies, and works with the finance sector to incorporate sustainable
development policies. This branch is also charged with producing green economy reports.
UNEP DTIE activities focus on raising awareness, improving the transfer of knowledge
and information, fostering technological cooperation and partnerships, and
implementing international conventions and agreements.
For more information,see
www.unep.org/dtie

For more information, contact:UNEP DTIESustainable Lifestyles, Cities and Industry Branch15 Rue de Milan75441 Paris CEDEX 09FranceTel: +33 1 4437 1450Fax: +33 1 4437 1474E-mail: [email protected]/dtie
O-LCA uses a life cycle perspective to compile and evaluate the inputs, outputs and potential environmental impacts of the activities associated with an organization, and the provision of its product portfolio. This methodology is capable of serving multiple goals at the same time (e.g., identifying environmental hotspots throughout the value chain, tracking environmental performance over time, supporting strategic decisions, and informing corporate sustainability reporting).
O-LCA is envisioned for organizations of all sizes, both public and private, in all sectors, and all over the world. The first tentative steps toward full O-LCA application are currently taking place, and the outcomes of these are already being used to improve organizations’ environmental performance. Broadening the base of implementation is the logical next step, requiring accessible, practical guidelines and guidance.
This publication provides an overview and the needed guidance to support the application of O-LCA, with special focus on its main methodological challenges. It is targeted to practitioners, decision makers, methodology developers, consumers and other stakehold-ers. Specific directions are given for several scenarios regarding the size and experience of the organization with environmental tools. Eleven case studies further illustrate the process and benefits of applying an environmental multi-impact assessment to organiza-tions and their value chain.
www.unep.orgUnited Nations Environment ProgrammeP.O. Box 30552 - 00100 Nairobi, Kenya
Tel.: +254 20 762 1234Fax: +254 20 762 3927
e-mail: [email protected]
DTI/1896/PA
ISBN: 978-92-807-3453-9