effect of h o and h o on the mechanical properties and
TRANSCRIPT

Effect of H2O and H2O2 on the Mechanical Properties and Microstructure of Selected Natural and Synthetic Polymer Structures
by
Shih-Feng Chou
A dissertation submitted to the Graduate Faculty of Auburn University
in partial fulfillment of the requirements for the Degree of
Doctor of Philosophy
Auburn, Alabama December 12, 2011
Keywords: vapor phase hydrogen peroxide decontamination, mechanical properties, microstructure, keratin materials, hydration, polymers
Copyright 2011 by Shih-Feng Chou
Approved by
Ruel A. Overfelt, Chair, Professor of Materials Engineering Gisela Buschle-diller, Professor of Polymer and Fiber Engineering
Jeffrey W. Fergus, Professor of Materials Engineering Dong-Joo Kim, Associate Professor of Materials Engineering
Barton C. Prorok, Associate Professor of Materials Engineering

ii
Abstract
Modern transportation systems may be subjected to unintentional contamination from
infected passengers as well as deliberate contamination from terrorism. Hydrogen peroxide has
been used for years as a disinfectant in the medical community and is under consideration in the
dilute vapor form as a decontaminant/disinfectant/sterilant for transportation vehicles like
aircraft, buses, subway trains, ambulances, etc. Although the biological efficacy of STERIS
Corporation’s Vaporized Hydrogen Peroxide (VHP®) technology has been demonstrated
elsewhere, the compatibility of the process with typical aircraft materials has not been rigorously
established. The present thesis documents a two-part investigation involving (i) a materials
compatibility evaluation involving the effects of moisture and hydrogen peroxide exposures on
the physical, mechanical and chemical properties of synthetic and natural airliner cabin
polymeric fabric materials and (ii) a detailed investigation of the effects of moisture on the
relatively unstudied north American porcupine quill – a natural keratin material. Physical
changes induced by the sorption of moisture had an effect on the mechanical properties of all of
the fabric materials (synthetic and natural) examined. However, only hydrogen peroxide
chemically attacked the natural, keratin-based wool fabric and this had (along with moisture
sorption) a significant deleterious effect on the mechanical properties of wool. To more fully
understand the relationship between mechanical behavior and moisture sorption of keratin
materials, a less-studied but larger keratin-based material was used for additional detailed
investigation. Porcupine quills belong to one of the alpha-keratin families and their

iii
macrostructure is composed of a cylindrical outer shell with a reinforcing inner foam core. As
expected, increasing the water content decreased the tensile stiffness and strength and increased
the ductility of the porcupine quills. The shell of the porcupine quill, in contrast to the inner
foam structure, carried the majority of the axial tensile loads. In addition, the quill shells’ axial
tensile properties and resistance to nanoindentation were generally higher than similar
mechanical properties measured in the circumferential direction of the shells due to the axial
orientation of the keratin fibers. Infrared spectroscopy of quill shells showed that the content of
α-type keratin decreased while β-type keratin increased as the strain increased to 15% -
consistent with literature results for wool fibers. Scanning electron microscopy of the fracture
surfaces of porcupine quill shells reveal 2 - 3 distinct layers with different fracture characteristics
in the shells. The outer layer of the porcupine shell appears to resist the plasticizing effects of
moisture, due to the presence of hydrophobic lipids in the outer layer.

iv
Acknowledgments
I sincerely thank my advisor Dr. Ruel A. Overfelt for his guidance, instruction, and support
in every aspect of this study. It would have been impossible to complete the research work
during the years without his continuous effort of supervision and encouragement. I would also
like to express my gratitude to my former advisor, Dr. William F. Gale, for his invaluable help,
support, and instructions at the early stage of the Ph.D. work. Sincere thanks are also owed to
my committee members: Dr. Gisela Buschle-diller, Dr. Jeffrey W. Fergus, Dr. Dong-Joo Kim
and Dr. Barton C. Prorok for their help and suggestions on this dissertation. Special thanks are
due to Dr. Curtis G. Shannnon, Dr. Charles J. Weschler, Dr. Ramsis Farag and Dr. Sin Ming Loo
for their advice on various subjects related to this research. I would like to express my gratitude
to Mr. Roy Howard, Mr. Steve Moore and Mr. L.C. Mathison for their technical help and
assistance in the research. Sincere thanks to my former colleagues: Dr. Nofrijon Sofyan, Raghu
Viswanathan, Jamie McAllister and Chad Callender as well as my current colleagues:
Mobbassarhassan Sk, Chan Kang, John Andress and Amanda Neer. Sincere thanks are
extended to Ms. Yvonne Williams from Auburn University Miller Writing Center for help in
proofreading this dissertation. Finally, I would like to express my special appreciation to my
family, my wife and my friends for the spiritual support through the years.
v
The style and format of this dissertation are in accordance with Journal of Materials Science.
The following refereed journal papers, technical reports, conference presentations were a product
of this research investigation:
Refereed journal papers:
• Gale WF, Sofyan NI, Gale HS, Sk MH, Chou SF, Fergus JW and Shannon CG (2009)
Effect of vapour phase hydrogen peroxide, as a decontaminant for civil aviation
applications, on microstructure, tensile properties and corrosion resistance of 2024 and
7075 age hardenable aluminium alloys and 304 austenitic stainless steel. Mater Sci
Technol 25:76-84.
• Chou SF, Gale WF, Gale HS, Shannon CG, Buschle-Diller G, and Sofyan NI (2010) An
evaluation of airliner cabin textile materials after hydrogen peroxide decontamination –
physical and structural changes and their influence on mechanical properties. Mater Sci
Technol 26:66-80.
• Chou SF and Overfelt RA (2011) Tensile deformation and failure of North American
porcupine quills. Mater Sci Eng C, 31:1729-1736.
• Chou SF, Overfelt RA, and Miller ME (2011) Anisotropic mechanical behavior of
keratin tissue from North American porcupine quill shell. Acta Biomater, Submitted.
Reviewed technical reports:
• Chou SF, Overfelt RA, Gale WF, Gale HS, Shannon CG, Buschle-diller G, and Watson J
(2009) Effect of hydrogen peroxide on common aviation textiles. FAA Technical Report
DOT/FAA/AM-09/16.
vi
• Chou SF, Sk MH, Sofyan NI, Overfelt RA, Gale WF, Gale HS, Shannon CG, Fergus JW,
and Watson J (2009) Evaluation of the effect of hydrogen peroxide on common aviation
structural materials. FAA Technical Report DOT/FAA/AM-09/23.
• Loo SM, Kiepert J, Klein D, Pook M, Chou SF, Overfelt RA, and Watson J (2010)
Evaluation of the effects of hydrogen peroxide on common aircraft electrical materials.
FAA Technical Report DOT/FAA/AM-10/5.
Conference Presentations:
• Chou SF and Overfelt RA (2011) “Mechanobiology of alpha-keratin using North
American porcupine quills,” 35th Annual Meeting of the American Society of
Biomechanics, August 10-13, 2011, Long Beach, CA.
• Chou SF and Overfelt RA (2011) “The study of mechanical properties on cellular solids
using North American porcupine quills,” Professor K. K. Chawla Honorary Symposium
on Fibers, Foams and Composites: Science and Engineering, Materials Science &
Technology 2011, October 16-20, 2011, Columbus, OH.
• Chou SF and Overfelt RA (2011) “Experimental characterization of natural keratin
material by tensile and nanoindentation using North American porcupine quills,” 4th
International Conference on the Mechanics of Biomaterials and Tissues, December
11-15, 2011, Hawaii.

vii
Table of Contents
Abstract ....................................................................................................................................... ii
Acknowledgement ..................................................................................................................... iv
List of Figures ............................................................................................................................. x
List of Tables ............................................................................................................................ xx
List of Abbreviations ............................................................................................................... xxi
1. Introduction .......................................................................................................................... 1
2. Literature Review ................................................................................................................. 8
2.1 Vapor Phase Hydrogen Peroxide Decontamination ................................................... 8
2.1.1 Technical Application ..................................................................................... 13
2.1.2 Efficacy ........................................................................................................... 16
2.1.3 Affordability .................................................................................................... 18
2.1.4 Materials Compatibility ................................................................................... 19
2.1.5 Advantages and Disadvantages ....................................................................... 21
2.2 Synthetic Polymeric Materials Tested ...................................................................... 22
2.2.1 Nylon ............................................................................................................... 22
2.2.2 Polyester .......................................................................................................... 26
2.2.3 Nomex® ........................................................................................................... 29
2.2.4 Fabric Structures .............................................................................................. 31
2.3 Natural Keratin Materials Tested .............................................................................. 33

viii
2.3.1 Wool ................................................................................................................ 40
2.3.2 Porcupine Quill ................................................................................................ 44
2.3.3 Other Keratin Materials ................................................................................... 49
2.3.4 Structure – Properties Relationship of Keratin Materials ............................... 53
2.3.5 Chemical Properties of Keratin Materials ....................................................... 62
3. Objectives of the Research ................................................................................................. 68
4. Experimental Procedures ................................................................................................... 70
4.1 Exposure of Selected Textile Fabrics to VHP® Process ........................................... 70
4.1.1 Materials Preparation ...................................................................................... 70
4.1.2 Hydrogen Peroxide Exposure .......................................................................... 72
4.1.3 Physio-chemical Measurements ...................................................................... 78
4.1.4 Mechanical Testing ......................................................................................... 79
4.2 Characterization of Porcupine Quill Keratin Materials ............................................ 80
4.2.1 Materials Preparation ...................................................................................... 81
4.2.2 Physio-chemical and Microstructural Characterization .................................. 82
4.2.3 Mechanical Testing ......................................................................................... 84
4.2.4 Electron Microscopy and Nano-Mechanical Testing ...................................... 86
5. Results and Discussion ...................................................................................................... 88
5.1 Effects of Hydrogen Peroxide Treatments on Selected Textile Fabrics ................... 88
5.1.1 Physical Observation of Selected Textiles after VHP® Process ...................... 88
5.1.2 Degradation of Fibers ...................................................................................... 93
5.1.3 Mechanical Properties ................................................................................... 105
5.1.4 Relationship between Physical/Structural and Mechanical Properties ......... 124

ix
5.1.5 Significance for Decontamination Practice ................................................... 125
5.2 Evaluation of Mechanical Properties of North American Porcupine Quill ............ 127
5.2.1 Physical Characterization .............................................................................. 127
5.2.2 Chemical Characterization ............................................................................ 132
5.2.3 Tensile Properties: Axial and Circumferential .............................................. 136
5.2.4 Fractography and Microstructure .................................................................. 148
5.2.5 Micromechanical Properties .......................................................................... 155
5.2.6 Chemical Analysis of Deformation ............................................................... 158
6. Conclusions ...................................................................................................................... 163
6.1 Effects of Hydrogen Peroxide on Selected Textile Fabrics ................................... 163
6.2 Evaluation of Tensile and Micromechanical Properties of Keratin Material ......... 164
7. Suggestions for Future Work ........................................................................................... 166
7.1 Vaporized Hydrogen Peroxide Decontamination .................................................... 166
7.2 Structure-Properties of Keratin Materials ............................................................... 167
References ............................................................................................................................... 169
Appendices .............................................................................................................................. 180
Appendix A: Mechanical Properties of Leather after Hydrogen Peroxide Exposure .................................................................. 181
Appendix B: Flammability of Airliner Cabin Textiles after Hydrogen Peroxide Exposure .................................................................. 183
Appendix C: FR4 & Acrylic Coating after Hydrogen Peroxide Exposure ................... 193
Appendix D: Materials Compatibility of Avionics after Hydrogen Peroxide Exposure .................................................................. 201
x
List of Figures
Figure 1 Demonstration of decontamination of entire wide body airliner cabin using vapor phase hydrogen peroxide at Oklahoma City, OK., USA, March 2007 ............ 3
Figure 2 Dry heat inactivation time of Bacillus Anthracis as a function of temperature ....... 11
Figure 3 Schematics of changes in relative humidity and hydrogen peroxide vapor concentration in a typical VHP® cycle. (i) initial dehumidification phase, (ii) conditioning phase, (iii) decontamination phase, and (iv) final aeration phase ............................................................................................ 15
Figure 4 VHP® kill matrix for Geobacillus stearothermophilus spores showing D-values as a function of hydrogen peroxide vapor concentration at 30 °C ........................... 18
Figure 5 Scanning electron microscopy image of nylon 6.6 fibers and the related chemical formula...................................................................................................... 23
Figure 6 Schematics of load versus extension curve for nylon fibers showing an initial elastic region followed by a neck-down region after yield. ..................................... 25
Figure 7 Yield stress versus strain rate for nylon 6.6 at different temperatures ..................... 25
Figure 8 Scanning electron microscopy image of polyester fibers and the related chemical formula...................................................................................................... 27
Figure 9 Stress-strain curve of polyester fibers ...................................................................... 28
Figure 10 Relationship between flexural strength of polyester/glass fiber composite with various glass fiber contents. ............................................................................. 29
Figure 11 Scanning electron microscopy image of Nomex® fibers and the related chemical formula...................................................................................................... 30
Figure 12 Effects of applied load and temperature on the friction coefficient of Nomex® fabric ......................................................................................................... 31
Figure 13 Distinction between the warp and weft yarns of a common textile fabric ............... 32
xi
Figure 14 Correlations of Young’s modulus and density for various materials categorized as (1) engineering polymers, (2) natural polymers and polymer composites, (3) natural ceramics and ceramic composites, (4) engineering alloys, (5) engineering ceramics, (6) porous ceramics, and (7) engineering composites ............................................................................... 34
Figure 15 (a) X-ray diffraction patterns using a 2-D detector of α-typed keratin showing 0.52-nm arcs at the meridian and broad 0.96-nm spots at the equator, (b) A schematic molecular structure of α-typed keratin related to the x-ray diffraction patterns .......................................................................................... 37
Figure 16 (a) X-ray diffraction patterns using a 2-D detector of β-typed keratin showing 0.33-nm arcs at the meridian, 0.465-nm arcs at the equator, and broad 0.96-nm spots at the equator, (b) A schematic molecular structure of β -typed keratin related to the x-ray diffraction patterns. ........................................ 38
Figure 17 X-ray diffraction patterns of merino wool at (a) 0% strain: showing the corresponding α-typed keratin features, and the integration of intensity using Lorentzian function along ± 35° of meridian is shown in the Intensity versus Bragg’s angle plot. (b) 33% strain: showing the corresponding β-typed keratin features, and the integration of intensity using Lorentzian function along equator ± 35° is shown in the Intensity versus Bragg’s angle plot. ................................................................................................... 39
Figure 18 Schematic of a wool fiber ........................................................................................ 41
Figure 19 Atomic configuration of wool showing disulfide crosslinks, hydrogen bonds, protein salt bridges, and amide bonds. ......................................... 44
Figure 20 Four typical porcupine quills as used in the present investigation as a comparison with two large African porcupine quills in dimension. ........................ 45
Figure 21 (a) Scanning electron microscopic image of the backward facing barbs at the tip of quills; (b) Scanning electron microscopic image of a cross-sectional view of a North American porcupine quill showing the interior foam core surrounded by an outer shell; (c) Scanning electron microscopic image of a cross-sectional view of a African porcupine quill showing the similar feature to the North American porcupine quills with additional radial reinforcing walls running from the shell toward the center ........................................................ 46
Figure 22 Schematic of a quill shell consisting of three layers with different molecular structures ................................................................................................. 47
Figure 23 Schematic of a horn (α-typed keratin) from macroscopic to microscopic level and further down to molecular level ............................................................... 51
xii
Figure 24 Schematic of a bovine hoof ...................................................................................... 51
Figure 25 Schematic of a feather (β-typed keratin). The basic structure of a feather consists of the main shaft (rachis), the side branches (barbs), and the small needle-like structure extended from the barb (barbules) ......................................... 52
Figure 26 (a) Stress strain curve for a wool fiber showing the Hookean region, linear region, and post-yield region. (b) Stress relaxation curve for a wool fiber showing in yield region and post-yield region. ................................... 56
Figure 27 Feughelman’s Two-Phase model of a wool fiber: C phase indicates the intermediate filaments and M indicates the keratin-associated protein matrix ........................................................................................................... 58
Figure 28 Feughelman’s Zone-Series Model showing X- and Y-zones where X-zones contribute to the deformation of yield region and Y-zones contribute to the deformation of post-yield region. (a) Matrix consists of water-containing globules (b) As load applied, the intermediate filaments started to move toward each other jamming the protein residuals (c) With protein residuals jammed by two intermediate filaments, the Y-zones became more difficult to extend ................................................................................................................... 58
Figure 29 Chapman and Hearle’s Composite Model for a wool fiber showing the highly crosslinked intermolecular network. (a) Fiber is not extended (b) Fiber is extended under a load ............................................................................ 60
Figure 30 A photo-oxidation process involved in the break-down of amine linkage in keratins ................................................................................................................. 64
Figure 31 The titration curve for one of the major amino acids in α-typed keratin, alanine. At low pH, the amines are positively charged where the carboxylates are neutral resulting in a net positively charged protein. The process is then reversed at high pH, and the protein becomes negatively charged ........................................ 65
Figure 32 Physical dimensions of textile specimens for pre-notched tensile warp and tear warp testing. Note location and orientation of the pre-test “tears” in the fabric test samples. The direction of the warp yarns are shown in light gray dashed lines. Tensile weft and tear weft test samples would be rotated 90 degrees .................................................................................................... 72
Figure 33 Experimental setup of (a) Steris 1000ED bio-decontamination unit attached to a small stainless steel enclosure for precise control of vapor concentration and (b) walk-in tent enclosure for large number of specimens processing. .............................................................................................. 74

xiii
Figure 34 Tensile and tear test on textile fabrics using Instron 4400R with compressed air driven grips ..................................................................................... 80
Figure 35 Experimental setup for tensile testing of entire North American porcupine quills and their shells: (a) a custom-made platform for PASCO miniature stress-strain apparatus, (b) a gear box attached to a rotary motor to provide constant strain-rate and load and extension data were recorded by a 50N load cell and rotation sensor, and (c) the specimen was held by two custom-made specimen grips and superglue was applied to the insertion between the grips and the specimen ............................................................................................................. 85
Figure 36 Percentage change in weight for wool, nylon, polyester, and Nomex® after 1 or 10 VHP® cycles and 1 or 14 day post-exposure aging times in laboratory air or vacuum .......................................................................................... 91
Figure 37 Physical changes of wool fabrics after VHP® and hydrogen peroxide liquid concentrate exposure: (a) a ~ 57% dimensional shrinkage on the 168 hours liquid exposure; and (b) color change for samples exposed to 10 VHP® ................ 92
Figure 38 Secondary electron images for wool fibers: (i) and (ii) as-received; (iii) and (iv) 10 VHP® cycles (450ppm); (v) and (vi) 168 hours dip exposure (35%) .................................................................................................. 94
Figure 39 Change in fiber diameter after 10 VHP® cycles (450 ppm) followed by aging for 14 days ...................................................................................................... 95
Figure 40 FTIR spectra of (a) nylon, (b) polyester, and (c) Nomex® after 450 ppm VHP® exposure. (i) as-received; (ii) 1 VHP® cycle + 1 day vacuum desiccator; (iii) 1 VHP® cycle + 1 day laboratory air; (iv) 1 VHP® cycle + 14 days vacuum desiccator; (v) 1 VHP® cycle + 14 days laboratory air; (vi) 10 VHP® cycles + 1 day vacuum desiccator; (vii) 10 VHP® cycles + 1 day laboratory air; (viii) 10 VHP® cycles + 14 days vacuum; (ix) 10 VHP® cycles + 14 days laboratory air .......................................................... 98
Figure 41 FTIR spectra of wool after 450 ppm VHP® exposure showing the appearance of the S=O bond consistent with the formation of sulphinite or sulphinate from disulphides. (i) as-received; (ii) 1 VHP® cycle + 1 day vacuum desiccator; (iii) 1 VHP® cycle + 1 day laboratory air; (iv) 1 VHP® cycle + 14 days vacuum desiccator; (v) 1 VHP® cycle + 14 days laboratory air; (vi) 10 VHP® cycles + 1 day vacuum desiccator; (vii) 10 VHP® cycles + 1 day laboratory air; (viii) 10 VHP® cycles + 14 days vacuum desiccator; (ix) 10 VHP® cycles + 14 days laboratory air .......................................................... 99
Figure 42 FTIR spectra in the range of 600 – 1600 cm-1 of wool after 10 VHP® exposure followed by 14 days aging in laboratory air. The S=O characteristic peak can be seen clearly ......................................................................................... 100

xiv
Figure 43 Raman spectra of wool after 10 VHP® cycles at 450 ppm and 168 hours of dip testing in 35% hydrogen peroxide liquid concentrate showing (a) low wavenumebrs and (b) high wavenumbers .............................................................. 102
Figure 44 Raman spectra of wool in the range of 400 – 4000 cm-1 illustrating the fluorescence hump (indicated by an arrow) for the as-received sample. ............... 103
Figure 45 XPS spectra for wool in the conditions indicated: (a) overview scan and (b) detailed scan in the sulfur atom region ............................................................. 104
Figure 46 Results of batch-to-batch and day-to-day variability study of measured (a) tensile strength and (b) elongation to failure of as received wool .................... 106
Figure 47 Results of batch-to-batch and day-to-day variability study of measured (a) tensile strength and (b) elongation to failure of as received Nomex® .............. 107
Figure 48 Percentage change in tensile strength and elongation to failure of wool after indicated cycles of VHP® treatment at 450 ppm followed by days of aging conditions in either laboratory air or vacuum desiccator ......................... 109
Figure 49 Percentage change in tensile strength and elongation to failure of nylon after indicated cycles of VHP® treatment at 450 ppm followed by days of aging conditions in either laboratory air or vacuum desiccator ......................... 109
Figure 50 Percentage change in tensile strength and elongation to failure of polyester after indicated cycles of VHP® treatment at 450 ppm followed by days of aging conditions in either laboratory air or vacuum desiccator ......................... 110
Figure 51 Percentage change in tensile strength and elongation to failure of Nomex® after indicated cycles of VHP® treatment at 450 ppm followed by days of aging conditions in either laboratory air or vacuum desiccator ......................... 110
Figure 52 Percentage change in tensile strength of wool, nylon, polyester, and Nomex® after 24 – or 168 – hour exposures to 35% hydrogen peroxide liquid concentrate for the indicated post-exposure in laboratory air aging conditions ........................ 112
Figure 53 Percentage change in elongation to failure of wool, nylon, polyester, and Nomex® after 24 – or 168 – hour exposures to 35% hydrogen peroxide liquid concentrate for the indicated post-exposure in laboratory air aging conditions ..................................................................................................... 112
Figure 54 Tensile stress vs. strain curves for wool (a) as-received and VHP® cycles at 450 ppm and (b) as-received and dip exposures to liquid hydrogen peroxide ....................................................................................... 114

xv
Figure 55 Effects on the weight change and tensile properties of pre-soiled wool and Nomex® specimens after 10 VHP® cycles at 450 ppm followed by aging in either laboratory air or vacuum desiccator for 1 day or 14 days. (PS, LA = pre-soiled, laboratory air; US, LA = unsoiled, laboratory air; US, VD = unsoiled, vacuum desiccator) ................................................................ 116
Figure 56 Effect on the weight change and tensile properties of wool after 10 VHP® cycles at different enclosure concentrations (i.e., 150 ppm and 450 ppm) ............ 118
Figure 57 Percentage change in maximum tear stress and average tear stress of wool after indicated cycles of VHP® treatment at 450 ppm followed by days of aging conditions in either laboratory air or vacuum desiccator ......................... 120
Figure 58 Percentage change in maximum tear stress and average tear stress of nylon after indicated cycles of VHP® treatment at 450 ppm followed by days of aging conditions in either laboratory air or vacuum desiccator ............................. 120
Figure 59 Percentage change in maximum tear stress and average tear stress of polyester after indicated cycles of VHP® treatment at 450 ppm followed by days of aging conditions in either laboratory air or vacuum desiccator ............................. 121
Figure 60 Percentage change in maximum tear stress and average tear stress of Nomex® after indicated cycles of VHP® treatment at 450 ppm followed by days of aging conditions in either laboratory air or vacuum desiccator ............................. 121
Figure 61 Effect of 10 VHP® cycles at 450 ppm followed by aging in laboratory air for up to 100 days on tensile strength and elongation to failure for wool, nylon, polyester, and Nomex® ............................................................................... 123
Figure 62 Effect of 10 VHP® cycles at 450 ppm followed by aging in laboratory air for up to 100 days on maximum tear stress and average tear stress for wool, nylon, polyester, and Nomex® ............................................................................... 123
Figure 63 Thickness variation of the porcupine quills in transverse direction showing (a) measurements and averages of each cross-sectional plane at a 5-mm increment from the root and (b) measurements of one cross-sectional plane (15 mm longitudinal distance from the root) with 10 circumferential positions, each separated by ~36°, clockwise ........................................................................ 129
Figure 64 Specimen population distribution of the thickness versus radius ratio (t/a) on the mechanically tested porcupine quills conditioned at 65% RH and 100% RH ................................................................................................................ 130
xvi
Figure 65 Percentage thickness of the three sub-layers found in the shell of North American porcupine quills. Each data point represents 10 samples and the error bars represent ± 1 standard deviation. Three representative optical microscopy images are shown for circumferential location at 2π/5, π, and 9π/5 ................................................................................................. 131
Figure 66 FTIR spectra of the porcupine quill and wool fiber showing the characteristic peaks of C-H bending, C-H stretching, and O-H stretching. ................................. 133
Figure 67 Single crystal x-ray diffraction pattern of α-keratin materials. (a) Image from 2-D detector of a North American porcupine quill; (b) Image from 2-D detector of an African porcupine quill; (c) Image from 2-D detector of a wool sample; (d) Integrated diffraction patterns along ± 45° of horizontal; and (e) Integrated diffraction patterns along ± 45° of vertical ..................................... 135
Figure 68 A schematic diagram of stress-strain plot for a α-keratin material (wool) showing the Hookean region, yield region, and post-yield region ........................ 136
Figure 69 (a) Typical experimental stress-strain curves for North American porcupine quills conditioned at 65% and 100% RH; (b) Experimental stress-strain curve for a North American porcupine quill conditioned at 100% RH showing the definitions of the endpoints of the Hookean region, yield region, and the post-yield region ................................................................... 138
Figure 70 Results from mechanical testing showing Young’s modulus in the Hookean region and post-yield region of the 65% RH and 100% RH quills examined in entire quills (with interior foam) and quill shells (without interior foam) ........................................................................................... 140
Figure 71 Results from mechanical testing showing engineering stresses at the yield point, at the post-yield transition point, and at the moment of fracture for the 65% RH and 100% RH North American porcupine quills with and without the interior foam structure......................................................................... 142
Figure 72 Results from mechanical testing showing engineering strains at the yield point, at post-yield transition point, and at the moment of fracture for the 65% RH and 100% RH North American porcupine quills with and without the interior foam structure......................................................................... 143
Figure 73 Elastic modulus comparison of porcupine quill shells stretched in axial (parallel to the growth direction) and circumferential (perpendicular to the growth direction) at 65% RH and 100% RH ......................................................... 145
Figure 74 Tensile properties comparison of porcupine quills shells in axial and circumferential direction at 65% RH and 100% RH for (a) yield and fracture stresses and (b) yield and fracture strains .............................................................. 146

xvii
Figure 75 Elastic modulus of North American porcupine quills treated with 10 cycles of VHP® followed by conditioning at 65% RH and 100% RH to compare with results shown on wool .................................................................................... 148
Figure 76 SEM pictures of fracture surfaces of a typical 65% RH conditioned porcupine quill. Lower Left: overall view showing deformation of sample after failure. Three close-up pictures show details of the fracture surface of the quill shell from the regions indicated. See text for discussion ......................... 152
Figure 77 SEM pictures of fracture surface of a typical 100% RH conditioned porcupine quill. Lower Left: overall view showing extensive deformation of sample. Three close-up pictures show details of the fracture surface of the quill shell from the regions indicated. See text for discussion............................... 153
Figure 78 TEM images of axially-oriented porcupine quill shell. (a) Transverse view. (b) Longitudinal view. Features of cortical (spindle) cells labeled as I,J,K and L; cell membrane complex (indicated by arrows); interdigitated cortical cells labeled as “icc”; in (a) intermediate filaments (bright dots) and amorphous matrix (dark region) can also be seen ...................................................................................................... 154
Figure 79 Nanoindentaiton in a depth controlled continuous stiffness mode on axial and circumferential directions, showing in (a) average hardness and (b) average elastic modulus .................................................................................... 156
Figure 80 (a) Average hardness and (b) average elastic modulus for porcupine quill shells in inner layer, intermediate layer, and outer layer ....................................... 157
Figure 81 ATR-FTIR spectra of quill shell for the inner layer and outer layer ..................... 160
Figure 82 Representative curve fitting plots on the result of ATR-FTIR scanned through the inner shell at amide I band for (a) 0% strain and (b) 10% strain ........ 161
Figure 83 Change of average alpha phase unfolded into beta phase as strain increases for (a) quill outer shell and (b) quill inner shell ..................................................... 162
Figure A-1 Weight change of commercial leather, purchased from McMaster-Carr, after 1 cycle and 10 cycles of VHP® exposure and 10 min dip in hydrogen peroxide liquid concentrate. Each column represents five specimens .................................. 181
Figure A-2 Tensile stress vs. strain curves for commercial leather subjected to 1 VHP® cycle, 10 VHP® cycles and 10 minute dip in 35% liquid H2O2 ............................. 181
Figure A-3 Effects on the tensile and tear properties of commercial leather specimens after 1 and 10 VHP® cycles at 450 ppm and 10 min dip in liquid hydrogen peroxide.................................................................................................. 182
xviii
Figure B-1 (a) Schematics and test specifications for vertical burning test. (b) Schematics and test specifications for horizontal burning test ......................... 187
Figure B-2 (a) Vertical and (b) horizontal flammability test results for nylon ........................ 187
Figure B-3 (a) Vertical and (b) horizontal flammability test results for polyester ................... 189
Figure B-4 (a) Vertical and (b) horizontal flammability test results for Nomex® .................... 190
Figure B-5 (a) Vertical and (b) horizontal flammability test results for wool ......................... 191
Figure B-6 Appearance of wool after vertical flammability testing ......................................... 192
Figure C-1 Stress vs. strain curve for uncoated FR4 strips utilizing 3-point bending test showing (a) delamination and instant failure behavior in both longitudinal and transverse direction, and (b) elastic recovery curve for longitudinal uncoated FR4 board ............................................................................................... 195
Figure C-2 Various glass fiber/epoxy FR4 printed circuit board composite samples after 168 hrs exposure to 35% liquid hydrogen peroxide. Control sample was not exposed ............................................................................ 196
Figure C-3 Glass fiber/epoxy FR4 printed circuit board samples weight changes due to VHP® and dip exposure. Error bars represent ± 1 standard deviation ................... 196
Figure C-4 Effect of hydrogen peroxide exposure on the flexural properties of the glass fiber/epoxy FR4 printed circuit board composite. (a) Flexural strength, (b) Strain at peak load. Error bars represent ± 1 standard deviation ...................... 197
Figure C-5 Fracture surface of FR4 boards .............................................................................. 198
Figure C-6 (a) FTIR and (b) Raman spectroscopy of the acrylic conformal coating from the glass fiber/epoxy FR4 printed circuit board composite ................................... 199
Figure C-7 Raman spectroscopy of the epoxy matrix from the (a) carbon fiber/epoxy structural composite and (b) glass fiber/epoxy FR4 printed circuit board composite ............................................................................................................... 200
Figure D-1 Dummy boards for tests of materials compatibility checks. From left to right: (a) Wire Board, (b) Pad Board, and (c) Interdigitated Board ................................ 200
Figure D-2 Auger electron spectroscopy of copper on the print circuit boards ....................... 204
Figure D-3 XPS of the copper layer on the print circuit board. Insert shows the 2p3/2 peak ... 204
Figure D-4 Raman spectra of the insulation layer on the aviation wire ................................... 205

xix
Figure D-5 DSC diagram of the insulation layer on the aviation wire ..................................... 205

xx
List of Tables
Table I Amino acid composition in merino wool (µmol/g). LSF: low sulfur fraction; HSF: high sulfur fraction; USF: ultra-high sulfur fraction ...................................... 42
Table II Some physical and mechanical properties of selected porcupine quills .................. 49
Table III Tensile properties of bird rachis and claws .............................................................. 53
Table IV Comparison of the mechanical properties of keratin based biomaterials ................ 54
Table V pKa1 (COO-), pKa2 (NH+) and pI for various amino acids typically found in keratins ...................................................................................................... 66
Table VI Parameters employed in various VHP exposures .................................................... 75
Table VII Test matrix for textile fabrics for effect of hydrogen peroxide exposure and effect of adsorbed/absorbed moisture (water/hydrogen peroxide/mixture of both) ............................................................. 78
Table B-I 12-second vertical flammability testing of aviation grade textiles ........................ 192
Table D-I Percentage weight change of the printed circuit boards and aviation wire after VHP® treatment ........................................................................................... 206
Table D-II Surface elemental composition of the print circuit board by XPS ......................... 206
xxi
List of Abbreviations
ACER Airliner Cabin Environment Research
BI Biological Indicator
CFU Colony-Forming Unit
COTS Commercial Off-The-Shelf
CYS Cystine
EPA Environmental Protection Agency
FAA Federal Aviation Administration
FDA Food and Drug Administration
FIFRA Federal Insecticide, Fungicide, and Rodenticide Act
FTIR Fourier Transform Infrared Spectroscopy
GOTS Government Off-The-Shelf
HPV Hydrogen Peroxide Vapor
IF Intermediate Filaments
KAP Keratin-Associated Proteins
NM Near Market
RITE Research in the Intermodal Transport Environment
SEM Scanning Electron Microscopy
VHP Vaporized Hydrogen Peroxide
XPS X-ray Photoelectron Spectroscopy
1
1. Introduction
There has been a long history of humans struggling with biological agents to maintain
good health for living [1-3]. As technologies improve rapidly, the demand for a better quality
of healthy living conditions increases the need to find suitable decontamination techniques.
Decontamination is a process to eliminate unwanted/harmful biological agents (or chemical
warfare agents) on objects or in a space to a safe level. This process requires the
decontaminants to react physically and/or chemically with the specific biological/chemical
agents without degrading the materials properties of all other objects present in the same space in
the meantime. For example, ultraviolet (UV) light has been employed in the dairy and other
industries to destroy microorganisms in water treatments without degrading the containers or
other additives/supplements in the solution [4-6]. However, it is necessary for scientists and
engineers to find desirable decontamination techniques that are not limited to line-of-sight for
cost effective decontamination processes.
Decontamination might also be needed to mitigate human health and economic impacts
due to the outbreak of epidemics/pandemics. Effective techniques should ideally be passive
clean-up steps toward the recovery of normal living conditions and should carry the capacity of
sterilizing a space from as small as a hospital room to as large as an office building. Moreover,
desirable decontamination techniques should be robust and capable of sterilizing modern
transport vehicles (e.g., buses, trains, ships and aircraft) since these could possess a higher threat
of transporting and/or spreading diseases around the world.
2
The outbreak of severe acute respiratory syndrome (SARS) from Hong Kong to South
East Asia and across the world in 2002 illustrated the severity of how modern transportation can
affect passengers and highlighted the need for decontamination of these transportation systems
during the outbreak [7,8]. Another example of an epidemic/pandemic was the outbreak of
highly pathogenic avian influenza viruses (H5N1) during 2004 from South East Asia [9-11].
The viruses quickly spread to most of the countries in Asia, including Japan and South Korea.
Although H5N1 virus demonstrated its powerful fatality among poultry, it was also found that
animal-to-human and human-to-human infection were possible [12,13]. Several years after the
HPAI outbreak in 2009, the outbreak of H1N1 (known as swine flu) started from Mexico and
quickly spread to the United States, Europe and Asia [14,15]. No one knows when and where
the next outbreak of influenza will initiate. Thus having a qualified decontamination technique
for such outbreaks of epidemics/pandemics is highly desirable.
Apart from the outbreak of epidemics/pandemics worldwide, the concern of deliberate
use of biological/chemical warfare agents by terrorists increased with the attack on the World
Trade Center and the Pentagon in 2001 [16]. A chemical warfare agent may be defined as
poisonous chemicals that generate uncomfortable irritation, or in some cases, cause deterioration
of human tissues whereas biological agents are classified as pathogens or other toxins derived
from other living microorganisms. Examples of the use of chemical warfare agents and
biological agents would be the Sarin gas attack on Tokyo subway in 1995 and the anthrax attack
in Washington D.C. in 2001, respectively [17-20]. In such cases of attacks from deliberate use
of biological/chemical warfare agents from terrorism, a suitable decontamination technique may
be necessary for clean-up and site remediation in order to minimize on-going impacts.
3
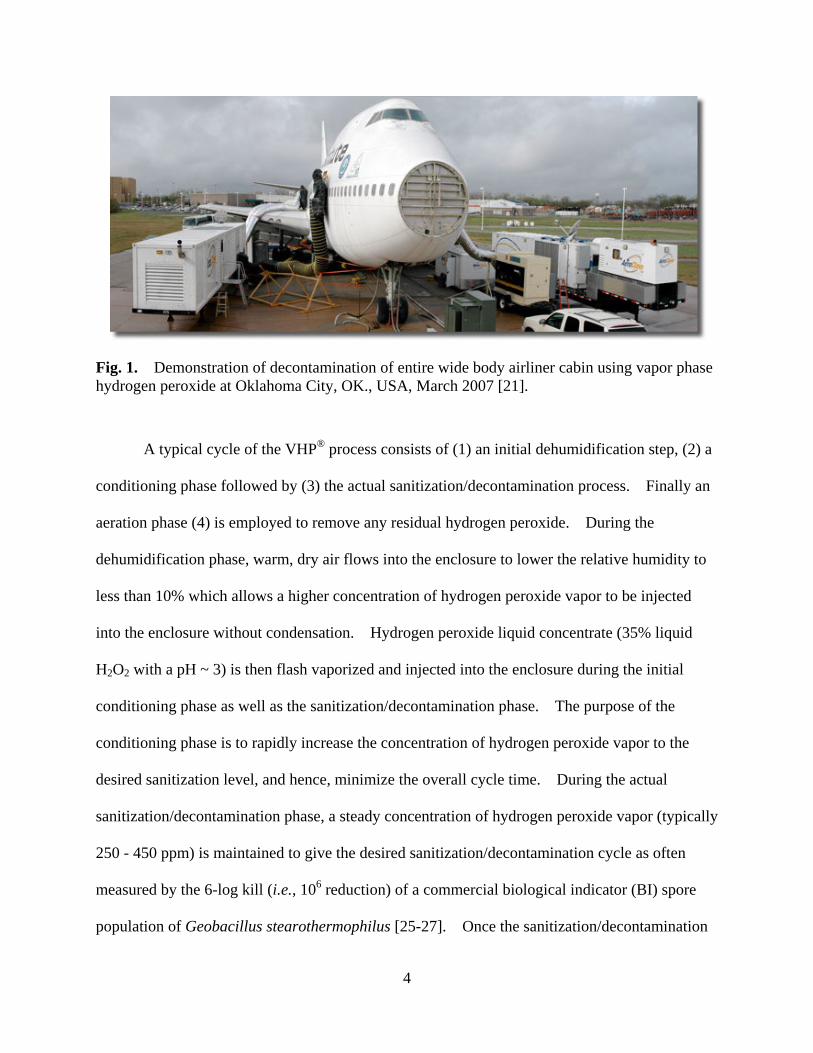
As part of the continuing research in the Center of Excellence for Research in the
Intermodal Transport Environment (RITE, formerly known as the Air Transportation Center of
Excellence for Airliner Cabin Environment Research, ACER), under the funding of the Office of
Aerospace Medicine, Federal Aviation Administration (FAA), U.S. Department of
Transportation (DOT); Auburn University, Harvard University, Kansas State University, and
Purdue University were involved in a series of tests on different disinfection/decontamination
processes for modern transportation, especially civil aviation. One of the most promising
decontamination techniques employed at Auburn University was the Steris Vaporized Hydrogen
Peroxide (VHP®)* decontamination process. Fig. 1 illustrates the application of VHP®
decontamination process for an entire wide body airliner cabin in a field experiment conducted
by the ACER team [21]. In order to apply such a decontamination technique to real life
situations, a series of materials compatibility evaluations are required to check for possible
changes in materials properties. Earlier test results on the effects of hydrogen peroxide vapor to
metal alloys employed in the airliner fuselage showed little to negligible effects [22,23].
Hence, this dissertation focuses on the effect of hydrogen peroxide and its by-product, water, on
selected synthetic polymeric materials and natural materials, and concentrates on the factors (i.e.,
H2O and/or H2O2) that might degrade the long term exposure-structure-property relationships
[24].
* VHP® is a registered trademark of STERIS Corporation, Mentor, OH, USA.
4
Fig. 1. Demonstration of decontamination of entire wide body airliner cabin using vapor phase hydrogen peroxide at Oklahoma City, OK., USA, March 2007 [21].
A typical cycle of the VHP® process consists of (1) an initial dehumidification step, (2) a
conditioning phase followed by (3) the actual sanitization/decontamination process. Finally an
aeration phase (4) is employed to remove any residual hydrogen peroxide. During the
dehumidification phase, warm, dry air flows into the enclosure to lower the relative humidity to
less than 10% which allows a higher concentration of hydrogen peroxide vapor to be injected
into the enclosure without condensation. Hydrogen peroxide liquid concentrate (35% liquid
H2O2 with a pH ~ 3) is then flash vaporized and injected into the enclosure during the initial
conditioning phase as well as the sanitization/decontamination phase. The purpose of the
conditioning phase is to rapidly increase the concentration of hydrogen peroxide vapor to the
desired sanitization level, and hence, minimize the overall cycle time. During the actual
sanitization/decontamination phase, a steady concentration of hydrogen peroxide vapor (typically
250 - 450 ppm) is maintained to give the desired sanitization/decontamination cycle as often
measured by the 6-log kill (i.e., 106 reduction) of a commercial biological indicator (BI) spore
population of Geobacillus stearothermophilus [25-27]. Once the sanitization/decontamination

5
phase is completed, the enclosure is then aerated with fresh air while any residual hydrogen
peroxide vapor breaks down catalytically into environmentally benign water and oxygen.
In considering the application of VHP® decontamination to modern transportation or
other aspects of routine daily life, it is very unlikely that all the interior materials would be
removed for sanitization of the enclosure. The opportunity for hydrogen peroxide vapor
induced damage/oxidization of polymeric materials remains a major concern. Textile fabrics as
found in clothes, seat cushions, carpets, and curtains are of particular interest due to the high
potential of absorbing/adsorbing hydrogen peroxide vapor introduced by VHP® processing.
This might result in various consequences, such as: (1) delayed release of small amounts of
hydrogen peroxide vapor (typically < 10 ppm) that causes human and animal irritation after the
aeration phase and (2) the degradation of the mechanical integrity of the materials.
Furthermore, fabrics consist of numerous fibers that are very sensitive to changes of humidity in
the environment, and absorbing/desorbing atmospheric moisture might affect the efficacy of
decontamination or the rate of oxidation (if it occurs) of the polymer structure during the VHP®
process. Finally, condensation of hydrogen peroxide vapor during the decontamination process
is proven to be of much higher concentrations (~ 70%) than the liquid concentrate actually used
to produce the original vapor (35%) [28]. Effects on humans and animals in contact with
fabrics containing such condensates could result in serious skin damage.
Given the concerns outlined above, the present research evaluated the overall effect of
hydrogen peroxide vapor on a representative sample of synthetic polymeric and natural material
fabrics, namely nylon, polyester, and Nomex®† and natural keratin-based wool. Additional
compatibility investigations were also performed for: (i) FR4 avionics board and acrylic coating
† Nomex® is a registered trademark of E. I. du Pont de Nemours and Company or its affiliates, Wilmington, DE, USA.
6
to investigate the electrical and mechanical properties [23,29] and (ii) leather materials in both
synthetic and natural form to investigate the mechanical and flammability properties [30]. The
preliminary results of these materials are not the main focus of this dissertation and are
documented in the Appendices.
Many synthetic polymer materials are known to be susceptible to moisture sorption and,
if H2O2 vapor is similarly absorbed by these materials, their engineering properties could be
seriously degraded. Among the selected synthetic polymeric materials, nylon is one of the
outstanding materials in terms of mechanical strength. It was invented in the period of 1928 –
1937 by W. Carother at Dupont to replace expensive silks produced by spiders and silkworms
[31]. Nylon consists of planar amide (–CONH–) groups as its basic building block, and its high
tensile strength (e.g., 70 MPa) can be attributed to the covalent bonding between the elements
and the hydrogen bonds forming between the amides [32,33]. These hydrogen bonds allow
nylon to easily absorb water molecules but not as much as typical cellulose materials, such as
cotton. Polyester, on the other hand, can be found in threads or yarns of fabric that is required
to withstand harsh environments and to withstand abrasive loads, such as safety belts, working
clothes, and home furnishings [34,35]. Unlike nylon, polyester does not form hydrogen bonds
within the polymer chains, and hence, it is hydrophobic. Nomex® was invented in 1960 to
accomplish the need for a more fire resistant material [36]. The basic building block of
Nomex® is related to nylon with additional aromatic backbones, and this gives the material a
rigid and strong bonding resulting in excellent behavior in mechanical properties and
flammability.
Of the natural materials investigated in this research, wool is one of the most common
keratin materials and is found in clothes, seat cushions, carpeting, upholstery padding, etc. due to
7
its outstanding physical (retaining heat and moisture sorption), mechanical (high elasticity and
strength) and flammability properties [37,38]. Wool belongs to the keratin family and this
fibrous protein, known for its sulfur-rich content, consists of filamentous scaffolds embedded in
an amorphous matrix to provide a desirable strength to the cells or tissues. Testing of fabrics,
due to the complexities of the various weaves, complicates the understanding of basic properties
of natural keratin materials under the effect of H2O and H2O2. It is necessary to observe the
behavior using a more basic form, e.g., single wool fibers or aligned groups of fibers. Testing a
single wool fiber can pose numerous difficulties due to its small size and inconsistency within
and between fibers. Hence, a related keratin material that has not yet been fully studied, i.e.,
North American porcupine quill, was chosen to (1) more extensively investigate this interesting
biological material and (2) understand the effect of H2O and H2O2 in relation to the change of
mechanical properties and microstructure for keratin.
8
2. Literature Review
The main focus of this research is to study and understand the changes in materials
properties due to the exposure to H2O and H2O2 (e.g., during the VHP® decontamination
process) and to relate the changes to the composition/microstructure of the material. There
were two major types of materials, i.e., synthetic polymeric materials and natural keratin-based
materials, that were exposed to H2O and H2O2 during the VHP® decontamination process and
this chapter provides necessary background and insights for the experimental procedures
implemented in subsequent chapters.
2.1 Vapor Phase Hydrogen Peroxide Decontamination
Decontamination may be defined as a process to eliminate any harmful contaminants
from an object or an area to a demonstrably safe level. Although decontamination has been
developed and used for sterilizing tools from medical waste since Charles Chamberland [39]
invented the steam autoclave in 1879, the technique is still primarily limited to medical and
pharmaceutical facilities as well as research laboratories‡. Significant effort is being expended
to apply and improve the existing decontamination techniques to other areas, such as the
military, the semiconductor industry and the food industry [40-42]. The demand for
decontamination of large spaces (e.g., an office building or a large aircraft) after
‡ In general, decontamination is referred to the clean-up process in all fields, such as nuclear waste, radioactive materials, waste soil in mining industry, contaminated soil in agricultural industry, food products, etc. However, the main focus of decontamination in this dissertation regards sanitizing biological agents that can cause epidemics/pandemics as well as biological and chemical warfare agents from the deliberate use by terrorists in large spaces.

9
epidemics/pandemics or biological/chemical warfare and terrorism is motivating scientists and
engineers to search for effective but low cost decontamination techniques.
There are many decontamination techniques that are available, such as commercial
off-the-shelf (COTS), government off-the-shelf (GOTS), and near market (NM) products at the
present time, and the main idea is to select a suitable decontamination technique rather than
develop a new one for the use of large space sanitization. Within the COTS/GOTS/NM
decontamination techniques, a general classification can be made to divide these techniques into
physical methods, chemical methods, and physiochemical methods. Typical physical§,
physicochemical, and chemical methods are listed below, based on the source of decontaminants
and method of delivery [43,44].
Physical Methods for Decontamination:
(1) Thermal Decontamination
(2) Ultraviolet (UV) Light Exposure
(3) Energy Beam Methods (x-ray, electron beam, and γ-ray)
Chemical Methods for Decontamination:
(1) Liquid Decontaminants (e.g., bleach)
(2) Vapor-phase Decontaminants (e.g., vaporized hydrogen peroxide)
(3) Foams and Gels
(4) Catalytic Methods (including enzymes)
Physicochemical Methods for Decontamination:
(1) Plasma/corona Discharge Based Methods
(2) Combination of Physical and Chemical Methods
§ Many of the physical methods depend on affecting the biochemistry of the target biological or chemical agent.
10
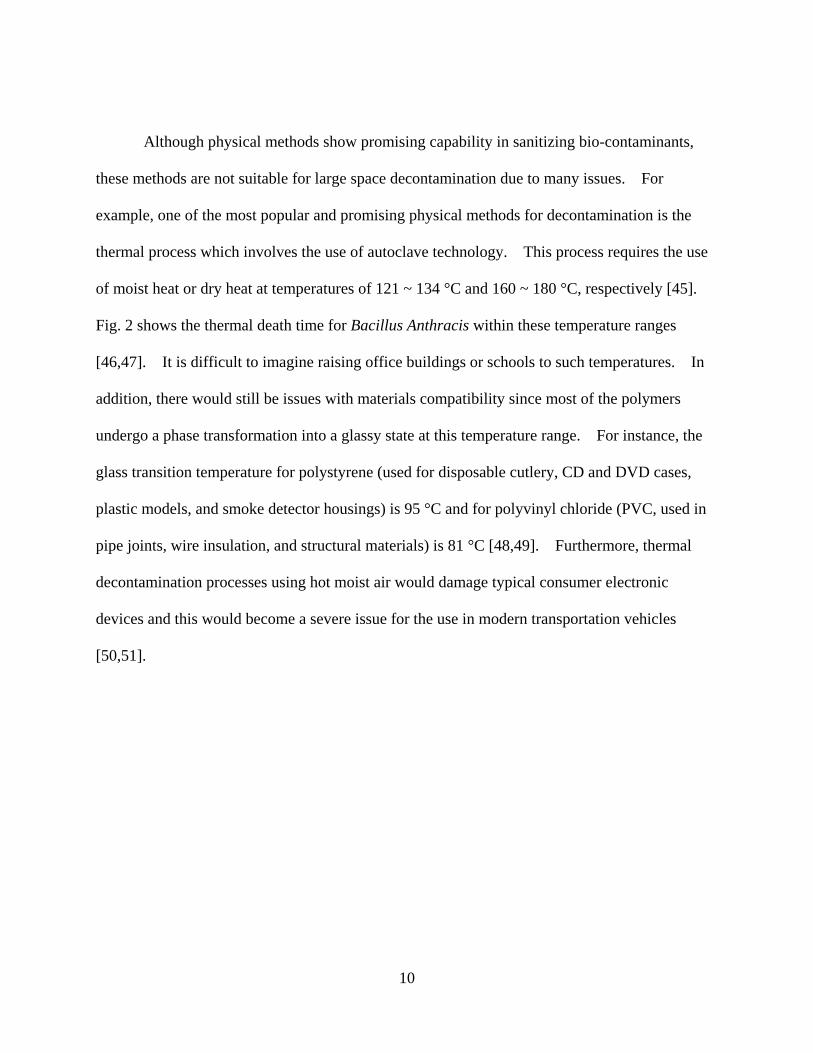
Although physical methods show promising capability in sanitizing bio-contaminants,
these methods are not suitable for large space decontamination due to many issues. For
example, one of the most popular and promising physical methods for decontamination is the
thermal process which involves the use of autoclave technology. This process requires the use
of moist heat or dry heat at temperatures of 121 ~ 134 °C and 160 ~ 180 °C, respectively [45].
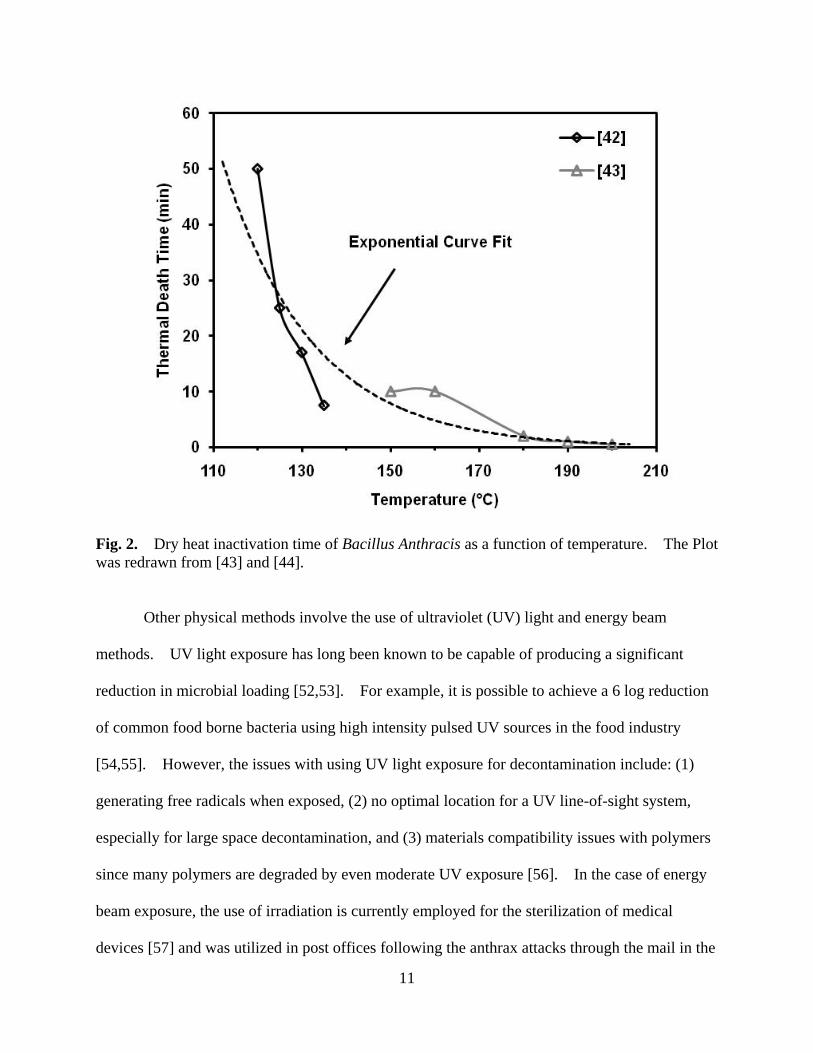
Fig. 2 shows the thermal death time for Bacillus Anthracis within these temperature ranges
[46,47]. It is difficult to imagine raising office buildings or schools to such temperatures. In
addition, there would still be issues with materials compatibility since most of the polymers
undergo a phase transformation into a glassy state at this temperature range. For instance, the
glass transition temperature for polystyrene (used for disposable cutlery, CD and DVD cases,
plastic models, and smoke detector housings) is 95 °C and for polyvinyl chloride (PVC, used in
pipe joints, wire insulation, and structural materials) is 81 °C [48,49]. Furthermore, thermal
decontamination processes using hot moist air would damage typical consumer electronic
devices and this would become a severe issue for the use in modern transportation vehicles
[50,51].
11
Fig. 2. Dry heat inactivation time of Bacillus Anthracis as a function of temperature. The Plot was redrawn from [43] and [44].
Other physical methods involve the use of ultraviolet (UV) light and energy beam
methods. UV light exposure has long been known to be capable of producing a significant
reduction in microbial loading [52,53]. For example, it is possible to achieve a 6 log reduction
of common food borne bacteria using high intensity pulsed UV sources in the food industry
[54,55]. However, the issues with using UV light exposure for decontamination include: (1)
generating free radicals when exposed, (2) no optimal location for a UV line-of-sight system,
especially for large space decontamination, and (3) materials compatibility issues with polymers
since many polymers are degraded by even moderate UV exposure [56]. In the case of energy
beam exposure, the use of irradiation is currently employed for the sterilization of medical
devices [57] and was utilized in post offices following the anthrax attacks through the mail in the

12
Washington DC area [58]. Unlike electron beams and x-ray, γ-irradiation uses radioactive
isotopes, such as cobalt 60 or cesium 137, rather than a machine source [59]. Such systems are
commercially impractical for large space decontamination due to the bulky energy beam systems
and/or shielding necessary for the highly penetrating beams. In general, such physical methods
are primarily suitable for decontamination of pharmaceutical or medical products.
A physicochemical method such as low temperature plasma can be promising since it can
be employed at lower temperatures than the physical method -- even at room temperature for
some applications [60,61]. This sanitization technique was commercialized in 2007 for the
Toyota Camry XLE model where a plasma cluster ionizer was installed within the cabin air
filtration system to minimize airborne particles, odors, and allergens in the air [62]. However,
typical plasma with enough energy to disinfect biological agents requires a vacuum environment
which is not suitable for large space decontamination.
Chemical methods could be another candidate for decontaminating a large space and they
are known to have biocidal effects since the Federal Insecticide, Fungicide, and Rodenticide Act
(FIFRA) was enacted in 1947 [63]. The act provided federal regulations and restrictions for the
use of chemicals as pesticides under the control of Environmental Protection Agency (EPA) in
the United States [64]. Chemical methods for disinfecting biological agents are widely used in
pharmaceutical, medical, and food industries. Typical chemical decontaminants involve the use
of alkylating agents or oxidative compounds in the form of ethylene oxide, peracetic acid,
chlorine dioxide, hydrogen peroxide, and formaldehyde [65,66]. Of this group, hydrogen
peroxide delivered in the vapor phase appears to be the most promising candidate among the
chemical methods for decontamination [22]. It has shown excellent potential for large space
sanitization of biological agents and biological/chemical warfare agents, and it is also very

13
environmentally friendly. Hence, vapor phase hydrogen peroxide will be reviewed in detail in
the following sub-sections.
2.1.1 Technical Application
There are two major technologies that use vaporized hydrogen peroxide to achieve
disinfection, namely the VHP® process developed by STERIS Corp. (Cleveland, OH, USA) and
the HPV** (hydrogen peroxide vapor) process developed by Bioquell Inc (Andover, Hants, UK).
The major difference between these two techniques is that the STERIS VHP® system functions
at low relative humidity (typically less than 30% RH for the cycle), whereas the Bioquell HPV
system intentionally allows higher relative humidity in the enclosure for disinfection. The
increase in relative humidity allows “micro-condensation” or a microscopic film of hydrogen
peroxide liquid on the surface of objects [67]. In contrast, the STERIS VHP® system does not
allow any form of condensation and uses hydrogen peroxide in the vapor phase to penetrate into
an object’s surface to achieve sanitization [40]. In this dissertation, all experimentation related
to hydrogen peroxide vapor (H2O2) was conducted with a STERIS VHP® system.
VHP® was originally developed for decontamination of medical and microbiological
laboratories (BSL-2 to BSL-4), for pharmaceutical manufacturing facilities, and for sterilization
of medical devices and instruments. The STERIS VHP® system was widely used in these areas
and is now also equipped in ambulances for decontamination purposes. Shortly after the
September 11 attack on the U.S., there was an anthrax incident from intentional spreading of a
letter containing the agent to NBC studios††, the New York Post newspaper, and government
buildings [68,69]. In 2001 during the anthrax attack, two U.S. government facilities, the
** Hydrogen peroxide vapor (HPV) process (Clarus®) is a trade mark of Bioquell, Andover, Hants, UK. †† The clean-up of NBC studios was performed by VHP decontamination process where papers and negatives were removed for off-site treatment with ethylene dioxide before the application of VHP treatment.

14
General Service Administration mail handling facility in Washington DC and the U.S.
Department of State mail center in Sterling, VA., were sanitized by the STERIS VHP® system
under an exemption of FIFRA Section 18 [70]. Also, with support from the U.S. Department of
Defense (DoD), the STERIS system was used in the demonstrations of decontamination of a
C-141 cargo aircraft and a F-16 fighter jet [70]. More recently during the time of Hurricane
Katrina in 2005, STERIS VHP® systems were employed under the observation of EPA in many
facilities, equipments, and emergency vehicles that had been contaminated with pathogens [71].
A typical Steris VHP® 1000ED biodecontamination cycle consists of four phases, namely
the initial dehumidification phase, the conditioning phase, the actual
sanitization/decontamination phase, and finally the aeration phase. A schematic diagram of
change in relative humidity (H2O) and hydrogen peroxide vapor (H2O2) concentration for a
typical VHP® cycle is shown in Fig. 3.‡‡ As mentioned previously in Section 1.0, the initial
dehumidification phase lasted from 10 to 30 minutes depending on the initial relative humidity of
an enclosure and the size of the enclosure. The reason for the dehumidification phase to lower
the humidity to less than 10% RH was to avoid condensation of high concentration hydrogen
peroxide liquid during the following phases. The conditioning phase enables quick ramp-up of
the hydrogen peroxide vapor concentration for the following sanitization/decontamination phase,
thus minimizing the cycle time and usage of hydrogen peroxide. Finally, an aeration phase is
employed to remove residual hydrogen peroxide vapor and break down the vapor into
environmentally friendly water and oxygen.
‡‡ Note that the actual time required for each phase depends on decontamination volume, relative humidity, temperature and other environmental parameters.

15
Fig. 3. Schematics of changes in relative humidity and hydrogen peroxide vapor concentration in a typical VHP® cycle. (i) initial dehumidification phase, (ii) conditioning phase, (iii) decontamination phase, and (iv) final aeration phase.
VHP® technology has been investigated for possible usage in aircraft applications and the
process has been shown to be efficacious (complete kill of 106 CFU of the spore forming
Geobacillus stearothermophilus) in a narrow body aircraft fuselage [21] as well as wide-body
aircraft if the air in the cabin section was well mixed so that adequate levels of VHP® vapor were
uniformly distributed [72,73]. These studies used vaporized hydrogen peroxide concentrations
in the range of 150 - 600 ppm and cycle times of 80 - 120 min. Maximum concentrations of
hydrogen peroxide vapor were carefully controlled to avoid condensation in cool locations
within the aircraft cabins. Although these previous studies did not evaluate the compatibility of
the various cabin materials with exposure to vaporized hydrogen peroxide, it was noted that there
were no noticeable changes to any of the cabin materials [72].
16
2.1.2 Efficacy
In this dissertation, efficacy refers to the effectiveness of eliminating
biological/chemical contaminants to a safe level without significant degradation of the
contaminated objects. A safe level is defined as a condition after the decontamination process
where humans can interact with the objects without any harmful results. Although the goal for
a decontamination process is to reach a safe level, it is worthwhile to note that different
decontamination techniques may result in different levels of efficacy. Nevertheless, the
effectiveness of the VHP® decontamination technique includes: (1) highly sporicidal (i.e., lethal
to spores), even when the concentration is as low as 200 ppm, (2) quick inactivation of biological
agents after sterilization for minutes, and (3) widely destructive for most of the microorganisms
[40].
The expression of efficacy for a decontaminant can be quantified in terms of either “log10
kill” or the related “D-value” [74]. A one log10 kill represents the efficiency in reduction or
elimination of 90% of the contaminant population whereas the D-value indicates the time it takes
to produce 90% reduction of the contaminant population. As evaluated by the STERIS, a
typical decontamination process is often validated with a 106 spore reduction on Biological
Indicators (BI) where a smaller D-value (i.e., shorter time) is always desirable. Other
validations of log10 kill include the sanitization efficiency test in the food industry where the
criteria is a 5 log10 reduction (99.999%) in Escherichia coli or Staphylococcus aureus bacteria
within 30 minutes at 20 °C [75]. For validation from ASTM International Standard E2111-05,
a 6 log10 reduction (99.9999%) of bacteria population is required [76].
A plot of average D-value versus hydrogen peroxide vapor concentration is shown in Fig.
4 using Geobacillus stearothermophilus spores inoculated on stainless steel coupons for a 6 log10

17
reduction at 30 °C [40]. Although there has been much effort to develop a standard for a
reasonable efficacy that leads to a safe level, it is still debatable for constructing an acceptable
log10 kill and D-value for VHP® decontamination of large spaces. For example, temperature is
one of the important parameters affecting the concentration of vapor phase hydrogen peroxide.
In such case of decontamination of an office building, a subway train, or an aircraft, regions that
are colder may exceed 9 log10 kill (close to dew point and hence higher percent saturation for
hydrogen peroxide vapor), where regions that are warmer may only reach 5 log10 kill.
Furthermore, a log10 kill and D-value for a same VHP® decontamination process may change due
to weather (e.g., summer and winter) or may differ due to climate, such as in Alaska or Florida.
Hence, it is necessary for users to establish an acceptable standard so that the testing conditions
are reliable for batch-to-batch comparison§§. In this dissertation where materials compatibility
tests of selected polymers were conducted in a relatively small laboratory scale enclosure, the
validation of bacteria reduction is set to 8 log10 kill within a reasonable D-value.
§§ The U.S. Food and Drug Administration (FDA) views the D-value as a quantitative carrier test of the biological indicators.

18
Fig. 4. VHP® kill matrix for Geobacillus stearothermophilus spores showing D-values as a function of hydrogen peroxide vapor concentration at 30 °C [40]. 2.1.3 Affordability
In cases where VHP® decontamination is to be performed in response to an outbreak of
epidemics/pandemics, routine sanitizations in order to prevent the spread of disease may be
required. To implement the uses of VHP® decontamination technique, several affordability
issues related to the operator’s aspects should be considered, such as the skill of the operators,
the necessity for further training of an operator, and the assurance level for VHP®
decontamination to be carried out by the operator. These issues can be easily solved by using
standard operating procedures to reach a desirable assurance level for the operators.
On the other hand, the time and costs for routine VHP® decontamination may be more
difficult to decide. For example, a typical VHP® decontamination process for a large space
19
sterilization (e.g., subway trains and aircraft) may last for 4 ~ 6 hours. Although it may be
desirable for these modern transports to be sanitized during the off-duty time frame (e.g., during
the night), it may well require an offloading-for-decontamination scheme during an epidemic or
pandemic. In such an instance, the assurance level for a clean transport may over ride other
considerations for companies or industries using VHP® decontamination. Thus, it may become
necessary to consider implementing routine decontamination in regard to the level of necessity
for sterilization.
2.1.4 Materials Compatibility
VHP® has generally shown good short-term materials compatibility, with the exception
of porous surfaces and cellulose materials. Minor physical effects or actual damage on
materials subjected to VHP® decontamination may not appear immediately. There is a need to
study and understand the short/long term effect due to single/multiple exposures of materials to
vapor phase hydrogen peroxide. The term materials compatibility is considered in this
dissertation as a measurement of how materials can withstand the exposure of VHP®
decontamination processes without significant changes in materials properties. In this regard,
whether or not a material is compatible with vapor phase hydrogen peroxide can be determined
from either physical/mechanical aspects (e.g., change of shape, color, and structure that can be
observed or examined mechanically) or chemical aspects (e.g., aroma, change of phase and
microstructure that might not be apparent to the naked eye and should be examined using
quantitative analytical techniques).
Earlier materials compatibility test on 2024-T3 and 7075-T6 aluminum alloys and 304
austenitic stainless steel for aircraft structural materials showed that there was little to negligible
difference in tensile properties after either short or long term exposure to hydrogen peroxide in
20
the form of a vapor or a liquid phase [22,23]. Polymeric materials are among the most
vulnerable materials when subjected to VHP® decontamination since polymers consist of long
chain carbon-carbon backbones with side chain functional groups as well as intermolecular
cross-links which might be degraded by oxidation from the hydrogen peroxide. Moreover,
polymers are likely to absorb moisture prior to decontamination which could affect the rate of
oxidation of the polymer structure during the VHP® process [77,78]. Finally, residual hydrogen
peroxide adsorbed on (or absorbed in) the polymers would limit the use of VHP®
decontamination, since this could be a concern with respect to both human health and subsequent
fire retardence (see Appendix B). Ideally, a series of decontamination tests should be
performed on actual polymeric materials present in a contaminated environment. Hence,
several representative synthetic polymers and natural materials were selected for testing in this
work [79].
There are several materials compatibility issues of concern when performing the VHP®
decontamination process. The first is the effect of multiple decontamination cycles, where
decontamination is to be performed for routine sanitization in response to an outbreak of
epidemics/pandemics. Hence, a single material might be subjected to numerous
decontamination cycles and the possibility of cumulative damage from hydrogen peroxide vapor
might increase. Secondly, it is possible that any damage to the polymeric materials due to a
single or multiple VHP® exposures may not appear in an immediate loss of its functionality.
Instead, it is possible that damage would manifest in the form of a reduction in the long term
performance of the polymer. Hence, it could become necessary to perform accelerated life
testing incorporating the effect of moisture (H2O) and hydrogen peroxide (H2O2) for the
polymeric materials. Additionally, the materials compatibility effects of VHP®
21
decontamination process might vary under differing ambient environments. Finally, to simulate
the effects of unintentional condensation of the peroxide (as could occur during a process control
failure or a sudden change in ambient temperature) or operator abuse (such as spilling the liquid
peroxide concentrate on the materials), materials compatibility evaluations should also include
liquid hydrogen peroxide exposure.
2.1.5 Advantages and Disadvantages
Given the considerations above, hydrogen peroxide delivered in the vapor phase is a
promising candidate for large space decontamination. In summary, the advantages and
disadvantages of using VHP® decontamination include:
Advantages:
(1) Proven efficacy as an antimicrobial.
(2) Extensive industry experience as a sterilant.
(3) Operation at modest temperature.
(4) Relatively simple hardware.
(5) A delivery method that appears to be capable of sterilizing large spaces.
(6) Supplies employed are relatively inexpensive.
(7) Although VHP® is toxic at the concentration employed, operator protection
needs appear to be modest (e.g., duct tape is often sufficient to keep the
ambient VHP® concentration below 1 ppm).
Disadvantages:
(1) Porous surfaces and highly absorptive materials present a challenge to VHP®
since the hydrogen peroxide vapor can be trapped on the surface or inside the
materials.
22
(2) Cycle time is proportional to the size of an enclosure, and it is a relatively
long process for large space decontamination.
(3) Humidity and temperature can alter the efficacy.
2.2 Synthetic Polymeric Materials Tested
Most modern polymers are covalently bonded and consist of long chain carbon-carbon
backbones with additional side functional groups or crosslinks between the main backbones to
enhance mechanical strength [80,81]. There are additional intermolecular and/or intramolecular
weak forces between the atoms in the polymer microstructure. These hydrogen bonds or Van
der Waals forces can also alter water sorption kinetics [82]. Hydrogen bonds allow polymers to
become either hydrophobic or hydrophilic. The mechanical properties of synthetic polymers
are strongly dependant on the molecular weight, the degree of crystallinity and the intrinsic
intermolecular forces from hydrogen and Van der Waals bonding plus covalent cross-links when
applicable [83].
In considering the materials compatibility of VHP® decontamination, three common
polymers often used throughout interior spaces were chosen for testing: nylon, polyester and
Nomex®. The following sub-sections provide brief reviews of these three polymers.
2.2.1 Nylon
Nylon belongs to the family of polyamides, that is, polymers that contain amide groups
(–CONH–) as a recurring part of the polymer chain. The synthesis of nylon utilizes the reaction
between amino groups and acid groups (or carboxyl groups) to form polyamide [84]. Fig. 5
shows a scanning electron microscopy image of nylon fibers (as well as the chemical formula for
nylon 6.6 polymers). Nylon was the first synthetic, semicrystalline polymer (about 50%
crystalline) with strength and temperature resistant properties (melting temperature of 269 °C)

23
that allowed its use as a fiber or as an engineering thermoplastic [85,86]. Originally, nylon was
developed by E. I. du Pont de Nemours and Company for the replacement of silk in the textile
industry [87], and nylon is still one of the most popular materials often found in clothing and
carpeting. However, the excellent properties of nylon in resisting heat, oil, wear and abrasion,
combined with great toughness and stiffness, also led to many practical engineering applications,
such as gears, bearings and coil forms [88,89]. More recently, nylon was used by Bortolato et
al. [90] as a surface membrane for detecting polycyclic aromatic hydrocarbons, a toxic pollutant
listed by EPA often found in food and environmental samples (i.e., water and air).
Fig. 5. Scanning electron microscopy image of nylon 6.6 fibers and the related chemical formula.
Nylons have a good combination of mechanical properties, such as strength, stiffness,
toughness, wear and abrasion resistance, and low coefficient of friction, over a relatively wide
temperature and humidity range [91]. A schematic plot of stress versus strain for nylon is
shown in Fig. 6 where a neck-down region can often be observed after yielding, and finally, a
N (CH2)6(
H
N
H
C
O
(CH2)4 C
O
)n
24
strain hardening effect before breakage [92]. Fig. 7 shows the yield stress as a function of
strain rate for nylon 6.6 at different humidity levels and temperatures [93]. These data suggest
that yield stress increases as the strain rate increases; however, increasing strain rate in the range
of 5 to 50 mm/min has little to negligible effect on the yield strength. At temperatures below
the glass transition temperature, yield and tensile strength decrease significantly with the
decreasing amide concentration due to the break-down of hydrogen bonds by water molecules
[94]. Moisture plays an important role in the mechanical properties of nylons due to the
presence of hydrogen bonds in the microstructure, and the yield stress can decrease as much as
50% with an increase in moisture content to 8% for nylon 6.6 [95]. The plasticizing effect and
drop in glass transition temperature of nylons often occur during moisture uptake and can also
explain the drop of tensile strength. The effect of temperature on the tensile properties is
similar to the effect of moisture, and it is suggested that nylon can withstand temperatures as low
as -40 °C without the loss of its mechanical strength; however, the tensile strength decreases and
percent elongation increases for nylon fibers at elevated temperatures [96].

25
Fig. 6. Schematics of load versus extension curve for nylon fibers showing an initial elastic region followed by a neck-down region after yield. A strain hardening process can often be observed at large strain. [92]
Fig. 7. Yield stress versus strain rate for nylon 6.6 at different temperatures. The figure is replotted from reference [93].
Extension
Load
YieldPoint
Neck-downRegion
StrainHardening

26
2.2.2 Polyester
Generally speaking, polyester refers to a group of chemical compounds containing many
ester groups (–COO–) as the major structural component in the main chain of the polymer.
Polyester is a product of polycondensation of dicarboxylic acids and dihydroxy alcohols as
defined by Kienle [97]. A scanning electron microscopy image of polyester fibers is shown in
Fig. 8 with the chemical formula of polyester also shown. The early development of polyester
resins can be dated back to 1910 and 1915, and was carried out by the reactions between glycerol
and phthalic anhydride in a two-stage process in the laboratories of General Electric Company
[98]. The development of polyesters was relatively slow until the use of maleic anhydride and
fumaric acid as the main ingredients for the unsaturated polyesters in 1933 [99]. During World
War II, polyesters containing unsaturated groups grew significantly in contributing the
constituents of shaped composite structures such as glass-reinforced polyesters with the addition
of glass fibers. The improvement of using polyester as condensed fiber was carried by Carother
at E. I. du Pont de Nemours and Company who also created nylon 6.6 fibers. The rapid spread
of polyester fibers in the textile industry started in the 1950 ~ 1960s when polyester became a
popular material in clothing. Polyester fibers are strong and tough materials that resist
wrinkling, stretching or shrinking, and do not absorb as much water as nylon which allows it to
dry quickly.

27
Fig. 8. Scanning electron microscopy image of polyester fibers and the related chemical formula.
Polyester can refer to a variety of synthetic ester-based polymers and co-polymers, such
as poly(ethylene terephthalate) (PET), poly(butylenes terephthalate) (PBT), poly(ethylene
2,6-naphthalane) (PEN), etc. These ester-based polymers can also be blended with others to
improve mechanical properties, chemical properties, and flame retardance. Furthermore, the
mechanical properties of polyester, especially PET fibers, are highly dependent on the conditions
of an injection molding process due to the slow crystallization rate. The mechanical properties
of polyester reviewed in this section will focus on the basic structure of PET in the form of
fibers.
A stress-strain curve for polyester fiber is shown in Fig. 9 [100]. Oudet and Bunsell
[101] conducted a series of mechanical tests on polyester fibers including tensile, creep, and
fatigue testing. It was suggested that the tensile and creep behavior improved with increased
crystallinity of polyester fibers, although decreased fatigue lifetimes were found [101]. It was
also suggested that fatigue failure of polyester fibers required the reorganization of the molecular
CH2CH2C C(
O)
O
nOO
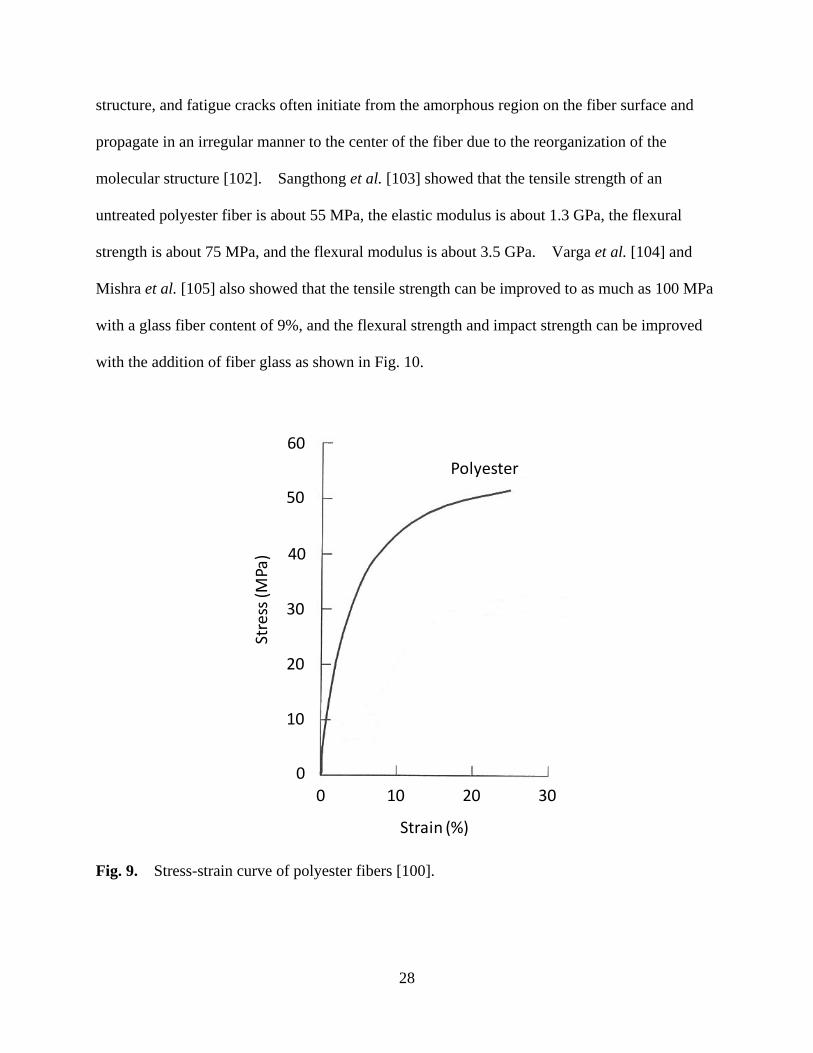
28
structure, and fatigue cracks often initiate from the amorphous region on the fiber surface and
propagate in an irregular manner to the center of the fiber due to the reorganization of the
molecular structure [102]. Sangthong et al. [103] showed that the tensile strength of an
untreated polyester fiber is about 55 MPa, the elastic modulus is about 1.3 GPa, the flexural
strength is about 75 MPa, and the flexural modulus is about 3.5 GPa. Varga et al. [104] and
Mishra et al. [105] also showed that the tensile strength can be improved to as much as 100 MPa
with a glass fiber content of 9%, and the flexural strength and impact strength can be improved
with the addition of fiber glass as shown in Fig. 10.
Fig. 9. Stress-strain curve of polyester fibers [100].
Polyester
10 20 300
10
20
30
40
50
60
0
Strain (%)
Stre
ss (M
Pa)

29
Fig. 10. Relationship between flexural strength of polyester/glass fiber composite with various glass fiber contents [105]. 2.2.3 Nomex®
Nomex® was developed by E. I. du Pont de Nemours and Company in the early 1960s
due to the need for fire resistant materials in aerospace and military applications. Nomex® is
also called aramid and is derived from nylon with the replacement of aromatic rings to the
carbon backbones. The molecular structure of Nomex® is so stable that it will not burn, drip,
melt, or support combustion in the air. A scanning electron microscopy image of Nomex®
fibers and its related chemical formula is shown in Fig. 11. Studies on pyrolysis of Nomex®
fibers carried out by Villar-Rodil et al. [106] showed that the rupture of hydrogen bonds began at
the 300 ~ 400 °C. The decomposition of Nomex® is a two-step process with an intermediate
aryl nitrile formed at 433 °C. This is followed by a decrease in intensity of amide bands at a
temperature of 607 °C in diffuse reflectance Fourier transform infrared spectroscopy. Studies
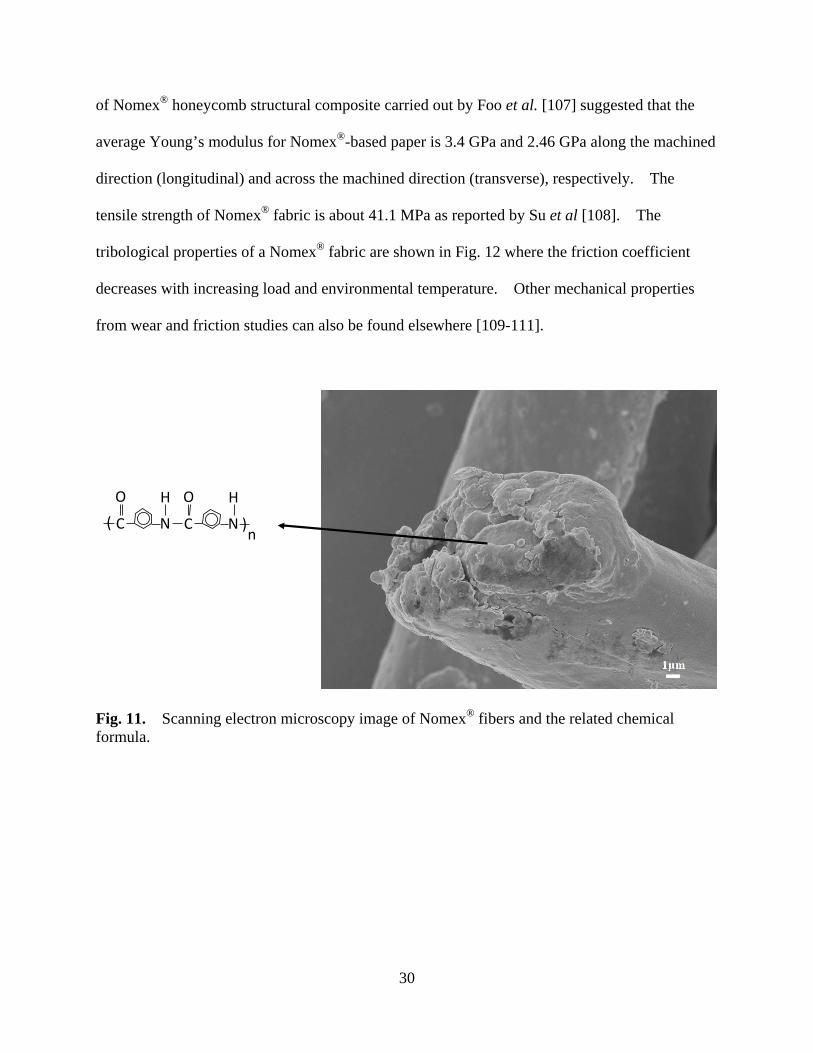
30
of Nomex® honeycomb structural composite carried out by Foo et al. [107] suggested that the
average Young’s modulus for Nomex®-based paper is 3.4 GPa and 2.46 GPa along the machined
direction (longitudinal) and across the machined direction (transverse), respectively. The
tensile strength of Nomex® fabric is about 41.1 MPa as reported by Su et al [108]. The
tribological properties of a Nomex® fabric are shown in Fig. 12 where the friction coefficient
decreases with increasing load and environmental temperature. Other mechanical properties
from wear and friction studies can also be found elsewhere [109-111].
Fig. 11. Scanning electron microscopy image of Nomex® fibers and the related chemical formula.
N
H
C
O
N
H
C
O( )
n
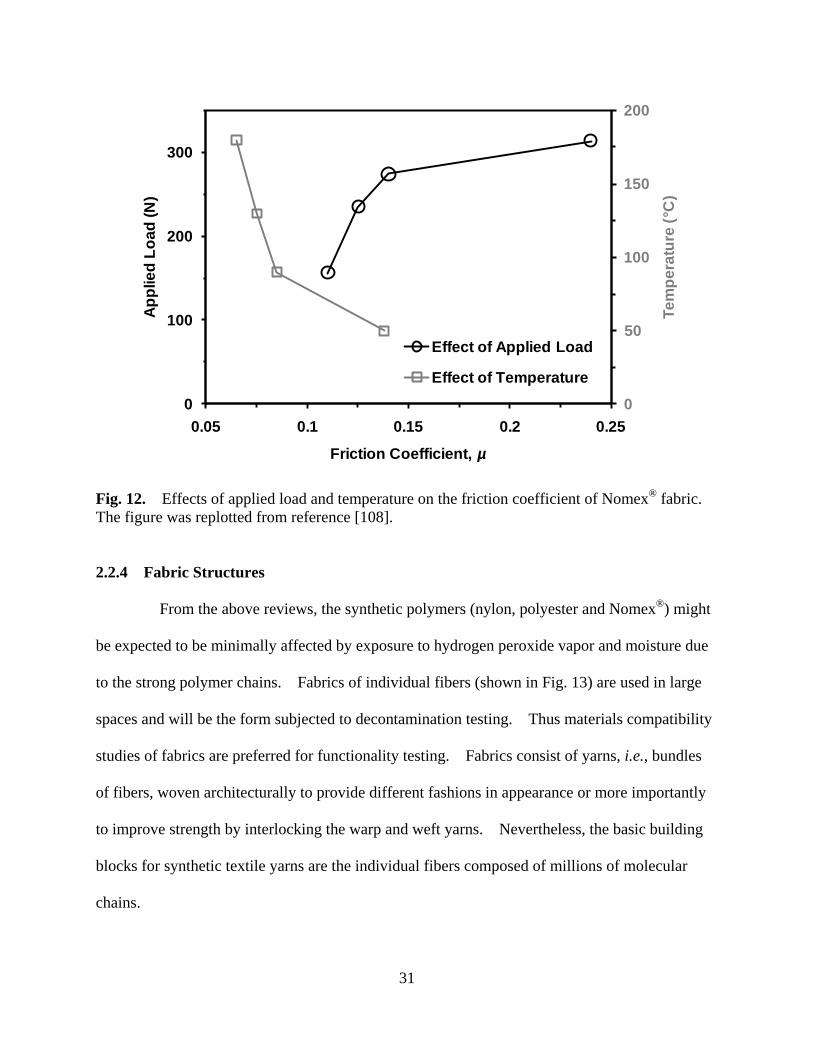
31
Fig. 12. Effects of applied load and temperature on the friction coefficient of Nomex® fabric. The figure was replotted from reference [108]. 2.2.4 Fabric Structures
From the above reviews, the synthetic polymers (nylon, polyester and Nomex®) might
be expected to be minimally affected by exposure to hydrogen peroxide vapor and moisture due
to the strong polymer chains. Fabrics of individual fibers (shown in Fig. 13) are used in large
spaces and will be the form subjected to decontamination testing. Thus materials compatibility
studies of fabrics are preferred for functionality testing. Fabrics consist of yarns, i.e., bundles
of fibers, woven architecturally to provide different fashions in appearance or more importantly
to improve strength by interlocking the warp and weft yarns. Nevertheless, the basic building
blocks for synthetic textile yarns are the individual fibers composed of millions of molecular
chains.
0
50
100
150
200
0
100
200
300
0.05 0.1 0.15 0.2 0.25
Tem
pera
ture
(°C
)
Appl
ied
Load
(N)
Friction Coefficient, µ
Effect of Applied Load
Effect of Temperature

32
Textile fabrics can be made from solutions (nonfibrous), directly from discrete fibers or
from yarns [112]. For the construction of fabrics from yarns, weft yarns are interwoven over and
under stretched warp yarns under tension as shown in Fig. 13. Since warp yarns must
withstand the tension and sometimes abrasion from the weaving process, warp yarns are made
stronger than weft yarns and with more twist. Warp yarns also align straighter with less
crimping and bending by the interlacing mechanics than the corresponding weft yarns.
Tensile testing a sheet of fabric poses a different situation than testing a single fiber since
weaving and twisting effects present major confounding factors for fabrics and yarns. Other
factors which play important roles in mechanical testing of large pieces of fabric consist of the
opening of the pores, the planar density of yarns, and the frictions generated between the yarns.
Along with all these factors, it can be expected that the individual fibers will shrink or expand
due to changes in the amount of water desorption or sorption resulting in loose yarns and more
openings or vice versa.
Fig. 13. Distinction between the warp and weft yarns of a common textile fabric

33
2.3 Natural Keratin Materials Tested
Natural keratin material is exhibited in various forms (e.g.; fibers: hairs and wools;
laminates: nails, hooves, horns; composites: porcupine quills, feathers, and beaks), and can be
found at the outer most layer of the skin of the vertebrate animals to form a protective and/or
structural layer for the organisms. This fibrous material, known by its sulfur-rich content,
consists of numerous semi-crystalline intermediate filaments embedded in an amorphous matrix
to provide a considerable strength to the tissues. The basic elements in keratin materials consist
of carbon, nitrogen, oxygen, hydrogen and sulfur. With complex intra-molecular and
inter-molecular crosslinks within/between the intermediate filaments and the matrix, the
mechanical properties of keratin materials are considerably higher than some of the engineering
synthetic materials. For example, the elastic modulus and the tensile strength for moose antlers
have been reported as 11.6 GPa and 115 MPa, respectively [113,114], whereas the elastic
modulus and tensile strength of nylon 6.6 at 50% RH room temperature were reported as 1.7 GPa
and 72 MPa respectively [91]. Fig. 14 shows the property map of Young’s modulus as a
function of density for natural polymers and polymer composites compared with natural
ceramics and ceramic composites, engineering alloys, engineering ceramics, and engineering
composites [115]. It can be seen from the figure that the keratin materials, with a density at
around 1 ~ 2 g/cm3, are very light-weight and quite elastic (Young’s modulus: 5 ~ 10 GPa).
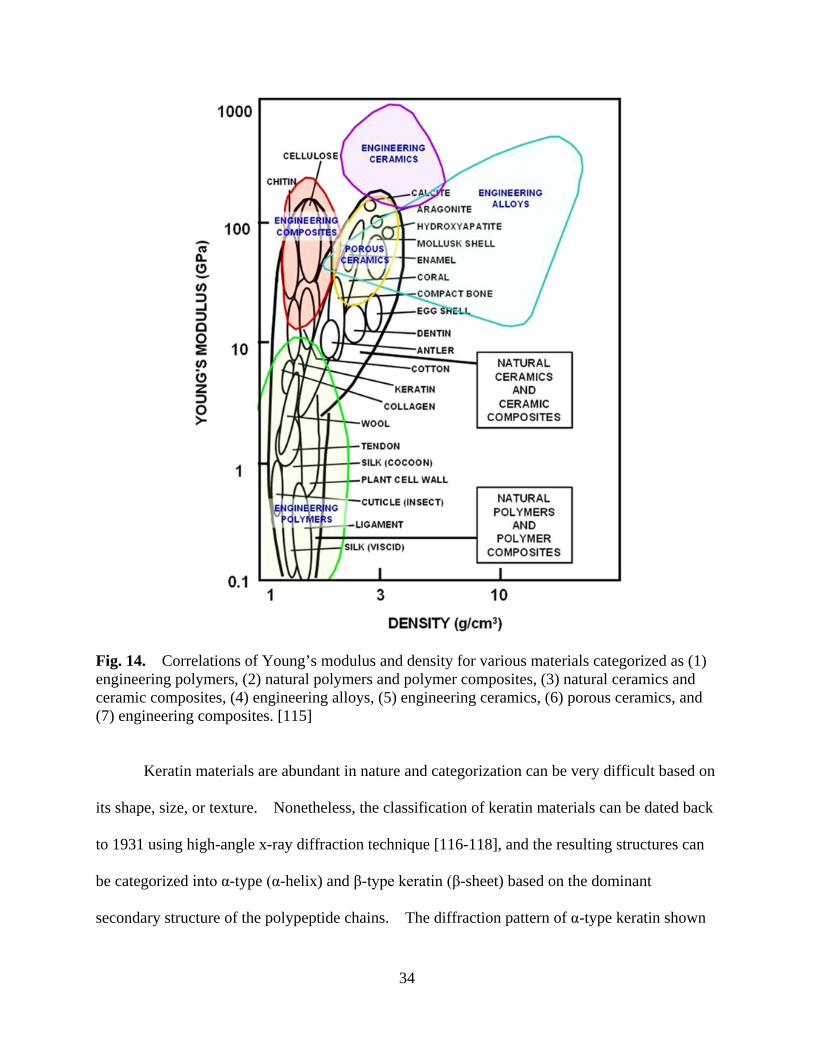
34
Fig. 14. Correlations of Young’s modulus and density for various materials categorized as (1) engineering polymers, (2) natural polymers and polymer composites, (3) natural ceramics and ceramic composites, (4) engineering alloys, (5) engineering ceramics, (6) porous ceramics, and (7) engineering composites. [115]
Keratin materials are abundant in nature and categorization can be very difficult based on
its shape, size, or texture. Nonetheless, the classification of keratin materials can be dated back
to 1931 using high-angle x-ray diffraction technique [116-118], and the resulting structures can
be categorized into α-type (α-helix) and β-type keratin (β-sheet) based on the dominant
secondary structure of the polypeptide chains. The diffraction pattern of α-type keratin shown
35
in Fig. 15(a) is often observed with tissues from mammals (e.g., hairs, skin, nails, hooves, horns,
etc.). α-type keratin diffraction patterns generally consist of:
(1) Sharp arcs at the meridian (indicated by 0.52 nm) associated with the fine
configuration of residuals periodically folded into α-helical coils (~ 47 nm) forming an
intermediate filament with globular C- and N- terminal domains [116]; and
(2) Broad spots at the equator representing the mean distance of the two adjacent
α-helical coil axes (~ 0.98 nm) [116,119].
A schematic of the molecular structure for α-keratins is shown in Fig. 15(b).
The diffraction pattern of β-type keratin shown in Fig. 16(a) is often found on avian and
reptilian animals (e.g., skins, bird beaks, feathers, etc.). β-type keratin diffraction patterns
consist of features different from the α-typed keratin, such as:
(1) Sharp arcs at the meridian (~ 0.33 nm) corresponding to the distance between
residuals along a single polypeptide chain in a regular β-sheet conformation [117,118];
(2) Sharp arcs at the equator (~ 0.465 nm) corresponding to the lateral distances
(in-plane) between chains in a β-sheet structure [117,119]; and
(3) Broad 0.96 nm spots on the equator representing a series of “piled-up” β-sheets
[115,116,118] and associated with a mean intersheet distance (out-of-plane) between two
adjacent β-sheets.
A schematic of the molecular structure for β -keratins is shown in Fig. 16(b).
Another feature observed in the diffraction pattern of β-keratins (avian and reptilian
keratin) involves the broad diffuse halo at around 0.45 nm (not clearly seen in α-keratins). This
broad halo is associated with the disordered amorphous polypeptide chains separation. It is
worthwhile to note that the α-keratin (mammalian keratin) also produces a similar type of
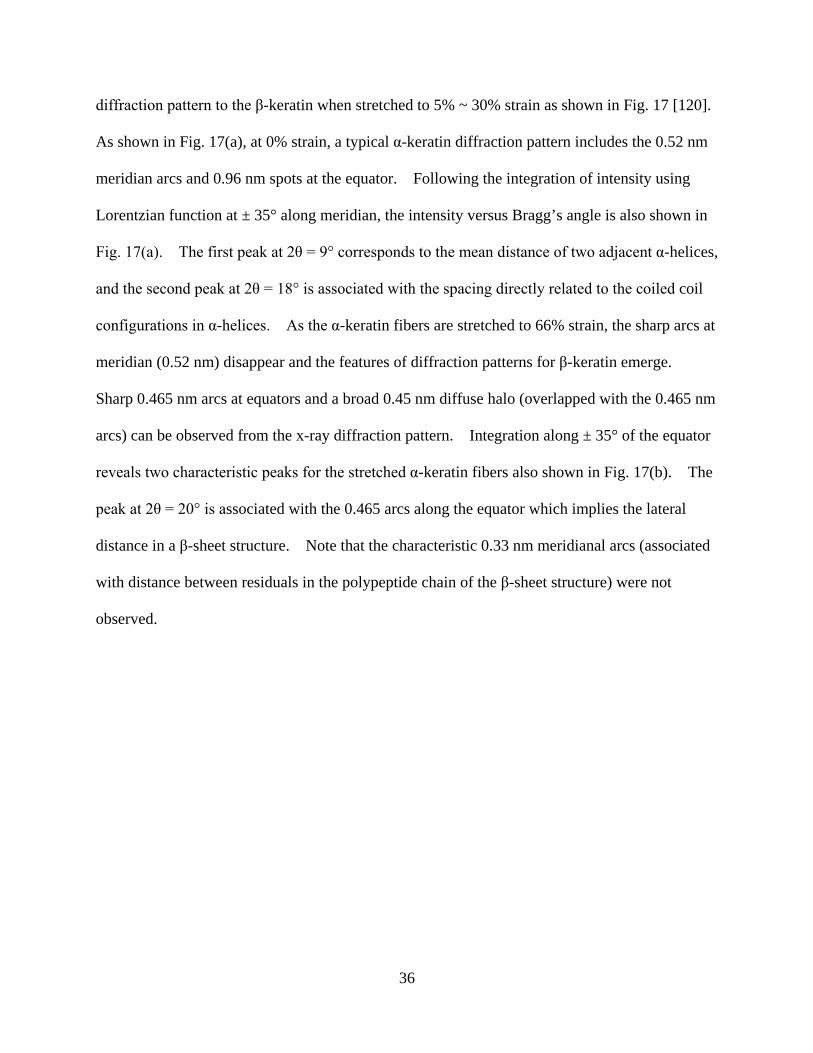
36
diffraction pattern to the β-keratin when stretched to 5% ~ 30% strain as shown in Fig. 17 [120].
As shown in Fig. 17(a), at 0% strain, a typical α-keratin diffraction pattern includes the 0.52 nm
meridian arcs and 0.96 nm spots at the equator. Following the integration of intensity using
Lorentzian function at ± 35° along meridian, the intensity versus Bragg’s angle is also shown in
Fig. 17(a). The first peak at 2θ = 9° corresponds to the mean distance of two adjacent α-helices,
and the second peak at 2θ = 18° is associated with the spacing directly related to the coiled coil
configurations in α-helices. As the α-keratin fibers are stretched to 66% strain, the sharp arcs at
meridian (0.52 nm) disappear and the features of diffraction patterns for β-keratin emerge.
Sharp 0.465 nm arcs at equators and a broad 0.45 nm diffuse halo (overlapped with the 0.465 nm
arcs) can be observed from the x-ray diffraction pattern. Integration along ± 35° of the equator
reveals two characteristic peaks for the stretched α-keratin fibers also shown in Fig. 17(b). The
peak at 2θ = 20° is associated with the 0.465 arcs along the equator which implies the lateral
distance in a β-sheet structure. Note that the characteristic 0.33 nm meridianal arcs (associated
with distance between residuals in the polypeptide chain of the β-sheet structure) were not
observed.

37
(a)
(b)
Fig. 15. (a) X-ray diffraction patterns using a 2-D detector of α-type keratin showing 0.52-nm arcs at the meridian and broad 0.96-nm spots at the equator [116]. (b) A schematic molecular structure of α-type keratin related to the x-ray diffraction patterns.
CO
NHCHR
CO
NH
CHR
CO
NHCHR
CO
NH
CHR
NH
CHR
CO
NH
CO
5.1
Å CO
NHCHR
CO
NH
CHR
CO
NHCHR
CO
NH
CHR
NH
CHR
CO
NH
CO
9.8 Å
38
(a)
(b)
Fig. 16. (a) X-ray diffraction patterns using a 2-D detector of β-type keratin showing 0.33-nm arcs at the meridian, 0.465-nm arcs at the equator, and broad 0.96-nm spots at the equator [117]. (b) A schematic molecular structure of β -type keratin related to the x-ray diffraction patterns.
0.33 nm

39
(a)
(b)
Fig. 17. X-ray diffraction patterns of merino wool at (a) 0% strain: showing the corresponding α-typed keratin features, and the integration of intensity using Lorentzian function along ± 35° of meridian is shown in the Intensity versus Bragg’s angle plot. (b) 33% strain: showing the corresponding β-typed keratin features, and the integration of intensity using Lorentzian function along equator ± 35° is shown in the Intensity versus Bragg’s angle plot. [120] Studies of hard/structural keratins (both α-type and β-type) have drawn increased attention
due to potential applications in tissue engineering and drug delivery in recent years [121-123].
However, most of our knowledge on the mechanical behavior of hard/structural keratin,
especially at the micro-structural level, has been established from studies of wool keratin fibers
over the past 50 years [124-129]. Recently, avian feathers/quills have been studied for their
0.52 nm
0.96 nm
0.465 nm0.96 nm
40
application as light weight composite materials [130-134] whereas hooves and horns have been
investigated for their energy-absorption properties [114,133,135-138]. Unfortunately, there is
still a considerable lack of information on the basic mechanical response of mammalian quills,
such as porcupine quills [139-144]. In the following sections, wool (the most widely studied
keratin material) and porcupine quill (perhaps the least studied keratin material) will be
compared and contrasted with an intent of establishing the scientific framework for the detailed
investigations reported later in this thesis.
2.3.1 Wool
A schematic of a wool fiber, typically about 20 µm in diameter, is shown in Fig. 18
[145]. The fiber consists of an inner cortex region (~ 90%) surrounded by layers of outer
cuticle cells (~ 10%) arranged like overlaying roof tiles. The outer cuticle layers contain mostly
the cysteine amino acid (thus higher in sulfur content than the inner cortex region, see below)
and three other amino acids which form a more amorphous structure than exhibited by the cortex
[145]. The cortex region contains para-cells and ortho-cells segregated bilaterally with the
para-cells having higher sulfur content than the ortho-cells [145]. Each cell is made up of 5 ~
20 macrofibrils with diameters of about 200 nm. Each macrofibril is formed by 100 ~ 200
sulfur-deficient intermediate filaments (IF, originally referred to in the literature as microfibrils)
and sulfur-rich keratin-associated proteins (KAP) [145]. The intermediate filaments are
approximately 7.5 nm in diameter, composed of 16 coiled pairs of α-helical crystalline 40
dimmers and crosslinked by the amorphous keratin-associated protein matrix.[146]

41
Fig. 18. Schematic of a wool fiber [145].
A wool fiber is composed of five basic elements: carbon, oxygen, hydrogen, nitrogen and
sulfur. These elements form 16 different types of amino acids as shown in Table I [147,148].
Polypeptide bonds form from random amino acids by combining a carboxyl group and an amine
group to form a 2-D structure with chains of amino acid residuals. Once the configuration of
the amino acid residuals is in a repeating order, the positive charge of the –NH dipole will attract
the negative charge of the –C=O dipole forming intra-molecular hydrogen bonds and folding the
otherwise planar polypeptide sheet. (Note Fig. 19.) These hydrogen bonds contribute to the
helical structure of the keratin intermediate filaments. Regions that are randomly configured
with amino acid residuals (i.e., the keratin-associated protein matrix) will have inter-molecular
hydrogen bonds which then form a hydrophilic amorphous structure.

42
Table I. Amino acid composition in merino wool (µmol/g). LSF: low sulfur fraction; HSF: high sulfur fraction; USF: ultra-high sulfur fraction. [147]

43
Disulfide bonds crosslinked between two cysteine amino acids are thought to be major
covalent bonds in the structure. These bonds hold several α-helical crystalline “ropes” into a
bundle and provide a rigid link with the amorphous protein matrix to form the intermediate
filament. Unlike the hydrogen bond which is a temporary set, the disulfide crosslink is a
permanent set that can react to alkali, bleach, UV light, etc. Any chemicals that destroy the
cysteine crosslink can greatly alter the properties of the keratin fiber. Another crosslink that
occurs in keratin fibers is the protein salt bridge which is a weak ionic bond between the
carboxylic acids and the amines. It usually takes place between the negatively charged aspartic
acid or glutamic acid and the positively charged argentine or lysine [112]. The protein salt
bridge also provides strength to the fiber and will react with acids and dyes [112]. A schematic
diagram is shown in Fig. 19 to illustrate the polypeptide bonds, hydrogen bonds, disulfide
crosslinks and the protein salt bridges.

44
Fig. 19. Atomic configuration of wool showing disulfide crosslinks, hydrogen bonds, protein salt bridges, and amide bonds. [147] 2.3.2 Porcupine Quill
A porcupine quill can be regarded as a composite keratin-based material consisting
basically of a strong cylindrical outer shell reinforced with a soft and lightweight inner-foam
core. Fig. 20 shows four typical North American porcupine quills as studied in the current
investigation and compared with two larger African porcupine quills. The outward facing tips
of North American porcupine quills have backward facing barbs for about 10% of the length as
shown in Fig. 21(a). These barbs make quill removal particularly difficult and painful for any
animal unlucky enough to get too close to the porcupine. Fig. 21(b) shows a typical
CH
NH
CO
CH
NH
CO
CH
NH
CO
CH
NH
CO
CH
NH
CO
CH
NH
CO
CH
NH
CO
CH
NH
CO
CH2CH2 S S
(CH2)4(CH2)2 NH3COO- +
LysineGlutamicAcid
Cystine Crosslink
Protein Salt Bridge
+
-
Hydrogen Bond
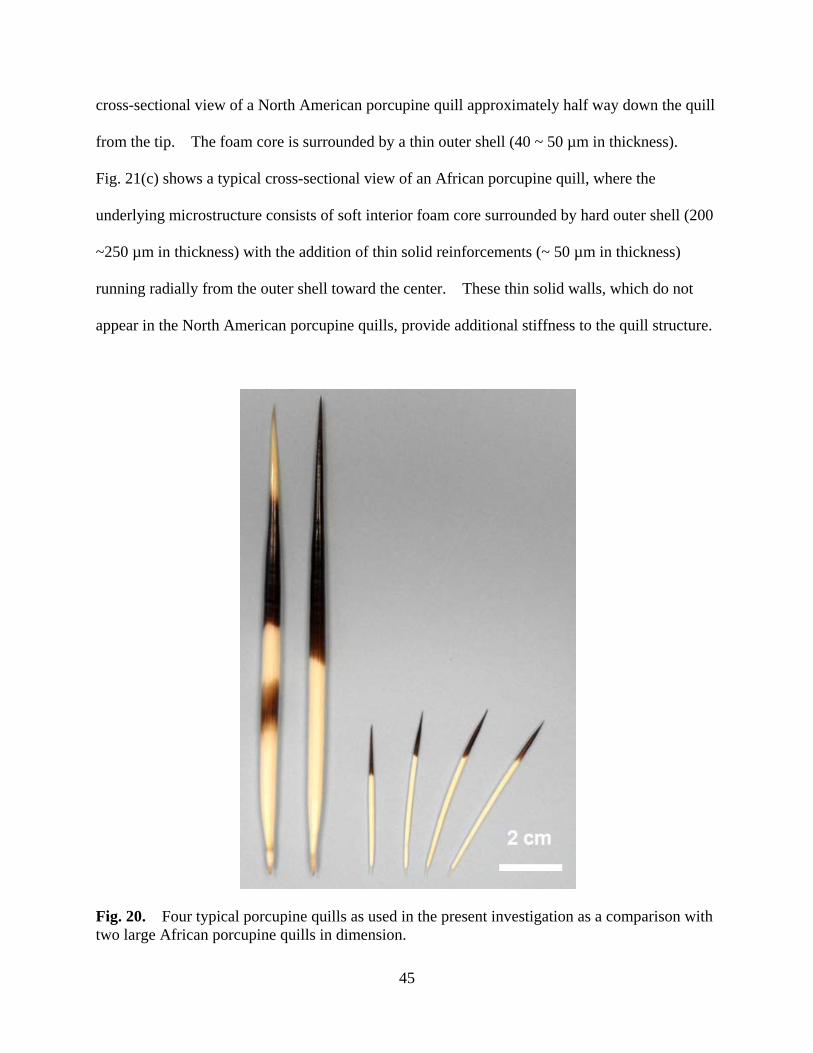
45
cross-sectional view of a North American porcupine quill approximately half way down the quill
from the tip. The foam core is surrounded by a thin outer shell (40 ~ 50 µm in thickness).
Fig. 21(c) shows a typical cross-sectional view of an African porcupine quill, where the
underlying microstructure consists of soft interior foam core surrounded by hard outer shell (200
~250 µm in thickness) with the addition of thin solid reinforcements (~ 50 µm in thickness)
running radially from the outer shell toward the center. These thin solid walls, which do not
appear in the North American porcupine quills, provide additional stiffness to the quill structure.
Fig. 20. Four typical porcupine quills as used in the present investigation as a comparison with two large African porcupine quills in dimension.

46
(a) (b)
(c)
Fig. 21. (a) Scanning electron microscopic image of the backward facing barbs at the tip of quills; (b) Scanning electron microscopic image of a cross-sectional view of a North American porcupine quill showing the interior foam core surrounded by an outer shell; (c) Scanning electron microscopic image of a cross-sectional view of a African porcupine quill showing the similar feature to the North American porcupine quills with additional radial reinforcing walls running from the shell toward the center.

47
The quill shell consists of two to three major circumferential layers as shown in Fig. 22.
The formation of structures in the three layers was proposed by Busson et al. [149] using x-ray
micro-diffraction on African porcupine quills. The diffraction patterns showed a moderately
ordered α-type keratin plus lipid in the outer layer, an amorphous and poorly ordered β-type
keratin at the middle layer, and a highly ordered α-type keratin in the inner layer. Transition
zones were reported between the three layers.
Fig. 22. Schematic of a quill shell consisting of three layers with different molecular structures.
Sparse reports of mechanical property data for porcupine quill have appeared in the
literature. Bendit [139] utilized compression testing and reported longitudinal and transverse
properties of African porcupine quills which are 2-4 times larger than quills from North

48
American porcupines. Feughelman and Druhala [140] examined the longitudinal and
transverse properties of African porcupine quills under tension in both water and HCl (pH ~ 1)
solution, and reported mechanical properties similar to rhinoceros horns. The specific chemical
compositions and the microstructural arrangements of the keratin molecules and the other tissue
constituents can vary considerably from tissue to tissue depending upon the particular application
for which the tissue is being utilized, e.g., strength with low density or energy absorption. Thus
a wide range of mechanical properties would be expected.
Gibson et al. [141-144] conducted a series of physical observations and bending/buckling
tests on several types of porcupine quills. Summaries of their physical and mechanical results
are shown in Table II. The outer shell of the porcupine quills carried the majority of the load
during bending and buckling due to the high stiffness of the shell compared to the foam core.
The molecular structure of the shell was composed of fibrous filaments (double-stranded keratin
α-helices) aligned parallel to the quill axis and embedded in a keratin-associated protein matrix
similar to that of wool fibers.
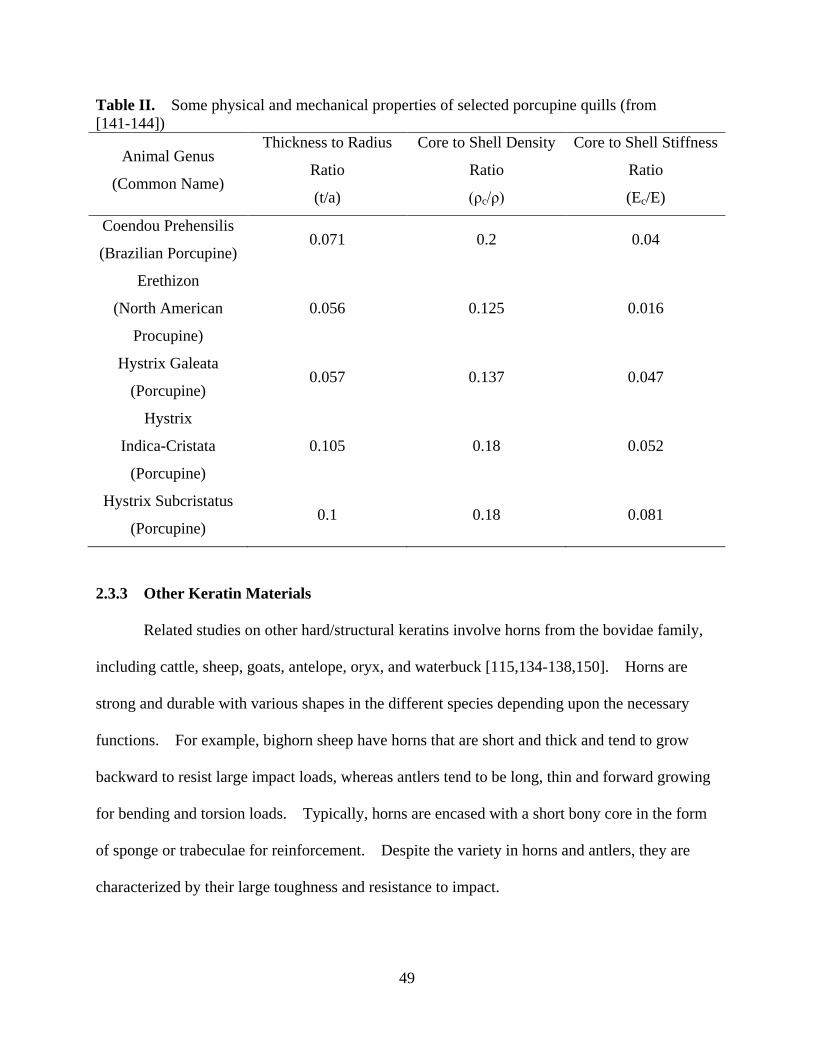
49
Table II. Some physical and mechanical properties of selected porcupine quills (from [141-144])
Animal Genus
(Common Name)
Thickness to Radius
Ratio
(t/a)
Core to Shell Density
Ratio
(ρc/ρ)
Core to Shell Stiffness
Ratio
(Ec/E)
Coendou Prehensilis
(Brazilian Porcupine) 0.071 0.2 0.04
Erethizon
(North American
Procupine)
0.056 0.125 0.016
Hystrix Galeata
(Porcupine) 0.057 0.137 0.047
Hystrix
Indica-Cristata
(Porcupine)
0.105 0.18 0.052
Hystrix Subcristatus
(Porcupine) 0.1 0.18 0.081
2.3.3 Other Keratin Materials
Related studies on other hard/structural keratins involve horns from the bovidae family,
including cattle, sheep, goats, antelope, oryx, and waterbuck [115,134-138,150]. Horns are
strong and durable with various shapes in the different species depending upon the necessary
functions. For example, bighorn sheep have horns that are short and thick and tend to grow
backward to resist large impact loads, whereas antlers tend to be long, thin and forward growing
for bending and torsion loads. Typically, horns are encased with a short bony core in the form
of sponge or trabeculae for reinforcement. Despite the variety in horns and antlers, they are
characterized by their large toughness and resistance to impact.
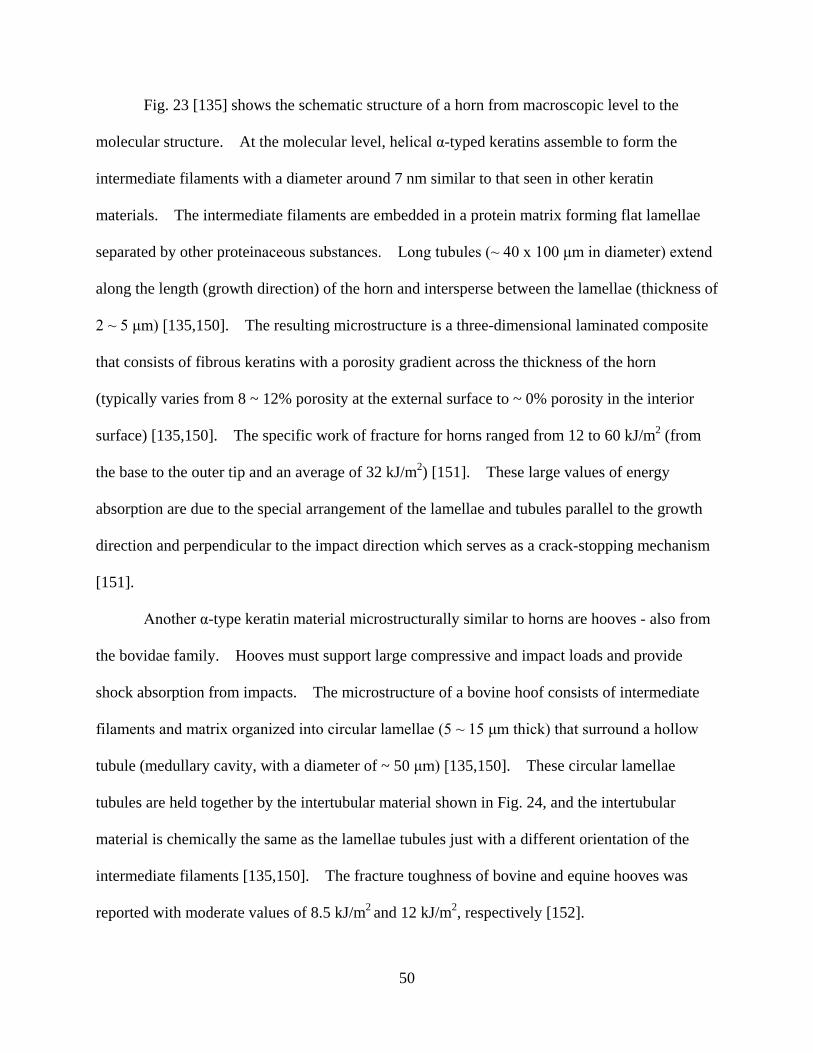
50
Fig. 23 [135] shows the schematic structure of a horn from macroscopic level to the
molecular structure. At the molecular level, helical α-typed keratins assemble to form the
intermediate filaments with a diameter around 7 nm similar to that seen in other keratin
materials. The intermediate filaments are embedded in a protein matrix forming flat lamellae
separated by other proteinaceous substances. Long tubules (~ 40 x 100 μm in diameter) extend
along the length (growth direction) of the horn and intersperse between the lamellae (thickness of
2 ~ 5 μm) [135,150]. The resulting microstructure is a three-dimensional laminated composite
that consists of fibrous keratins with a porosity gradient across the thickness of the horn
(typically varies from 8 ~ 12% porosity at the external surface to ~ 0% porosity in the interior
surface) [135,150]. The specific work of fracture for horns ranged from 12 to 60 kJ/m2 (from
the base to the outer tip and an average of 32 kJ/m2) [151]. These large values of energy
absorption are due to the special arrangement of the lamellae and tubules parallel to the growth
direction and perpendicular to the impact direction which serves as a crack-stopping mechanism
[151].
Another α-type keratin material microstructurally similar to horns are hooves - also from
the bovidae family. Hooves must support large compressive and impact loads and provide
shock absorption from impacts. The microstructure of a bovine hoof consists of intermediate
filaments and matrix organized into circular lamellae (5 ~ 15 μm thick) that surround a hollow
tubule (medullary cavity, with a diameter of ~ 50 μm) [135,150]. These circular lamellae
tubules are held together by the intertubular material shown in Fig. 24, and the intertubular
material is chemically the same as the lamellae tubules just with a different orientation of the
intermediate filaments [135,150]. The fracture toughness of bovine and equine hooves was
reported with moderate values of 8.5 kJ/m2 and 12 kJ/m2, respectively [152].
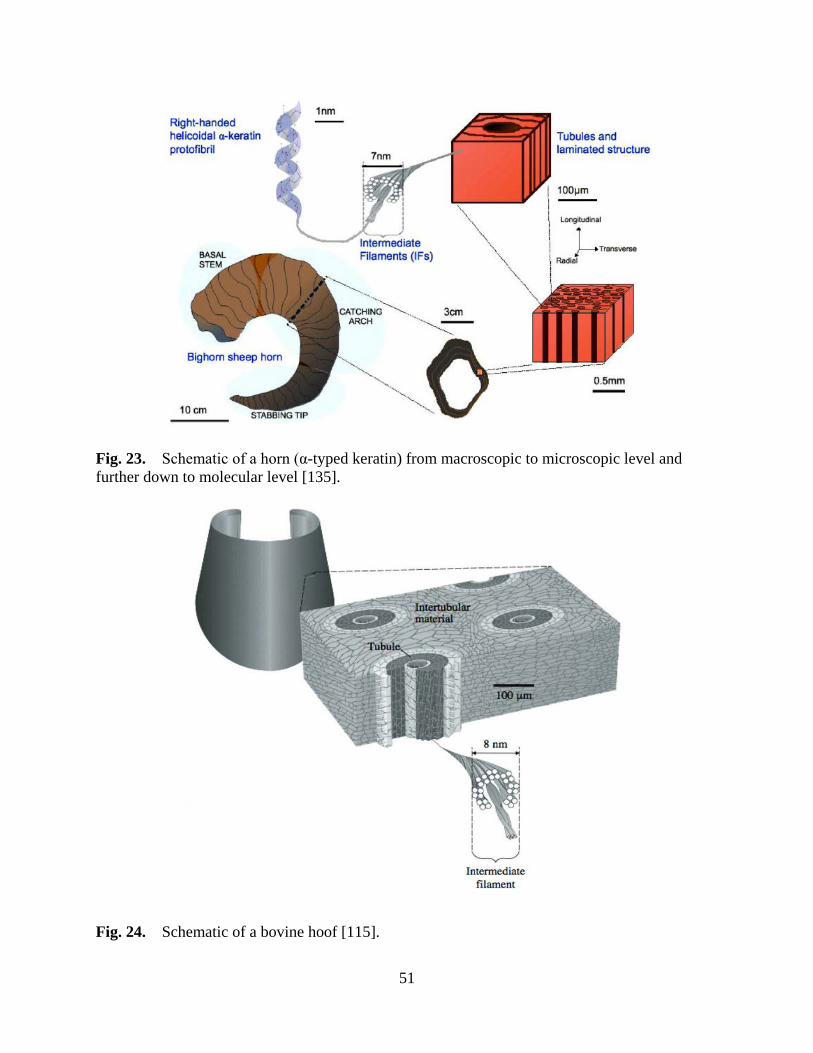
51
Fig. 23. Schematic of a horn (α-typed keratin) from macroscopic to microscopic level and further down to molecular level [135].
Fig. 24. Schematic of a bovine hoof [115].
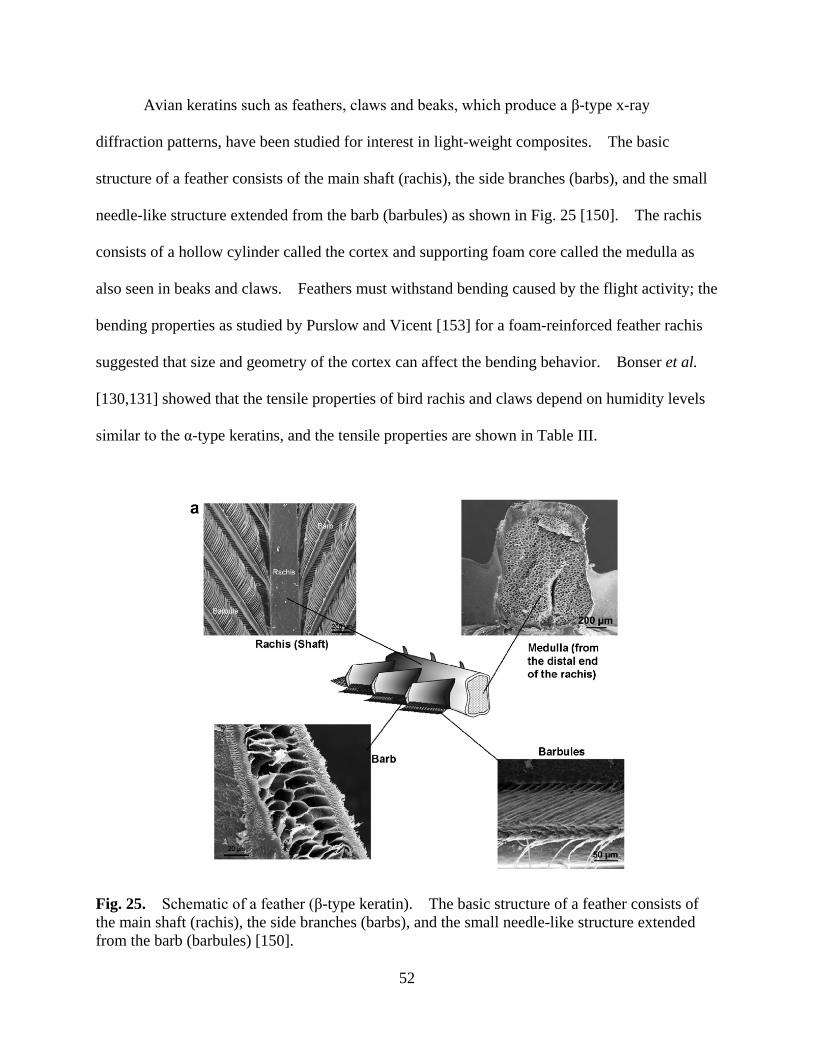
52
Avian keratins such as feathers, claws and beaks, which produce a β-type x-ray
diffraction patterns, have been studied for interest in light-weight composites. The basic
structure of a feather consists of the main shaft (rachis), the side branches (barbs), and the small
needle-like structure extended from the barb (barbules) as shown in Fig. 25 [150]. The rachis
consists of a hollow cylinder called the cortex and supporting foam core called the medulla as
also seen in beaks and claws. Feathers must withstand bending caused by the flight activity; the
bending properties as studied by Purslow and Vicent [153] for a foam-reinforced feather rachis
suggested that size and geometry of the cortex can affect the bending behavior. Bonser et al.
[130,131] showed that the tensile properties of bird rachis and claws depend on humidity levels
similar to the α-type keratins, and the tensile properties are shown in Table III.
Fig. 25. Schematic of a feather (β-type keratin). The basic structure of a feather consists of the main shaft (rachis), the side branches (barbs), and the small needle-like structure extended from the barb (barbules) [150].
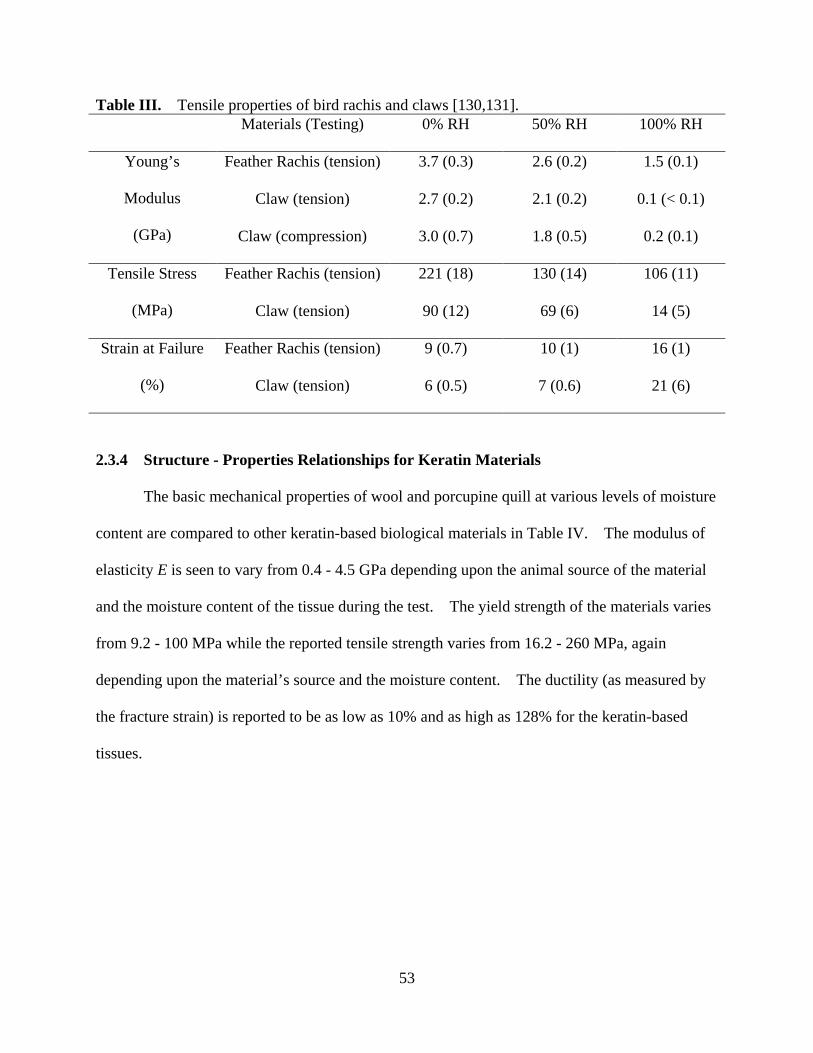
53
Table III. Tensile properties of bird rachis and claws [130,131]. Materials (Testing) 0% RH 50% RH 100% RH
Young’s
Modulus
(GPa)
Feather Rachis (tension) 3.7 (0.3) 2.6 (0.2) 1.5 (0.1)
Claw (tension) 2.7 (0.2) 2.1 (0.2) 0.1 (< 0.1)
Claw (compression) 3.0 (0.7) 1.8 (0.5) 0.2 (0.1)
Tensile Stress
(MPa)
Feather Rachis (tension) 221 (18) 130 (14) 106 (11)
Claw (tension) 90 (12) 69 (6) 14 (5)
Strain at Failure
(%)
Feather Rachis (tension) 9 (0.7) 10 (1) 16 (1)
Claw (tension) 6 (0.5) 7 (0.6) 21 (6)
2.3.4 Structure - Properties Relationships for Keratin Materials
The basic mechanical properties of wool and porcupine quill at various levels of moisture
content are compared to other keratin-based biological materials in Table IV. The modulus of
elasticity E is seen to vary from 0.4 - 4.5 GPa depending upon the animal source of the material
and the moisture content of the tissue during the test. The yield strength of the materials varies
from 9.2 - 100 MPa while the reported tensile strength varies from 16.2 - 260 MPa, again
depending upon the material’s source and the moisture content. The ductility (as measured by
the fracture strain) is reported to be as low as 10% and as high as 128% for the keratin-based
tissues.
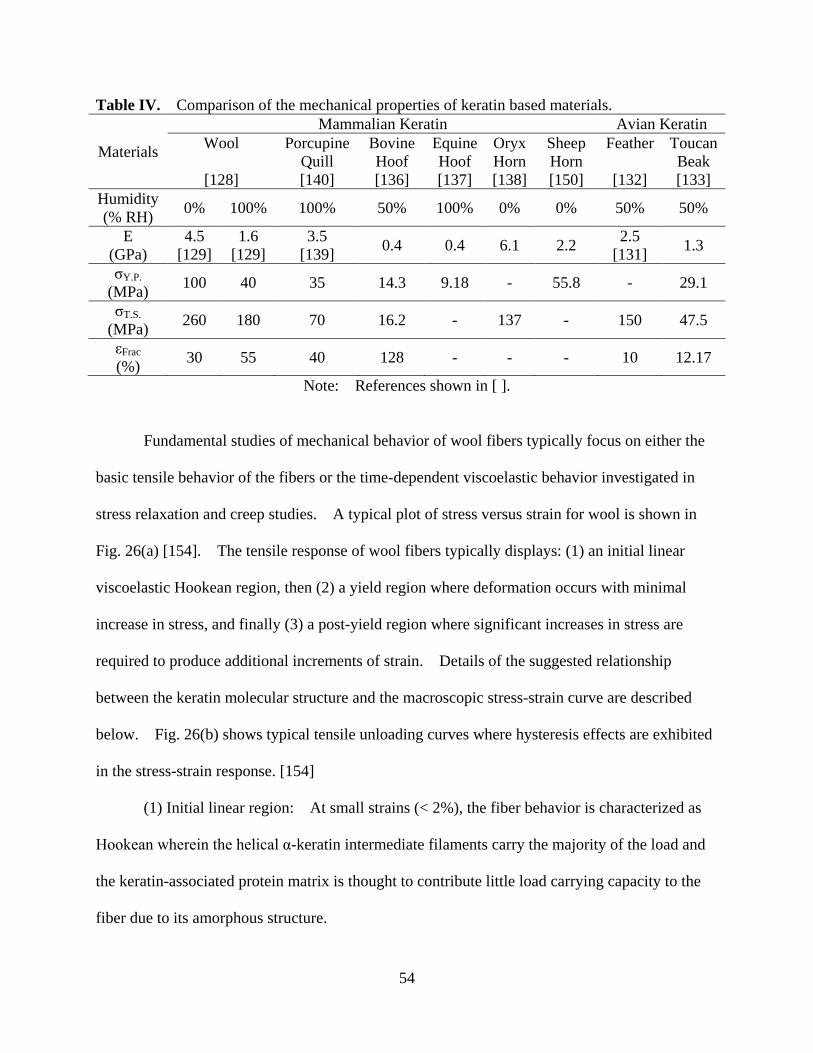
54
Table IV. Comparison of the mechanical properties of keratin based materials.
Materials
Mammalian Keratin Avian Keratin Wool
[128]
Porcupine Quill [140]
Bovine Hoof [136]
Equine Hoof [137]
Oryx Horn [138]
Sheep Horn [150]
Feather
[132]
Toucan Beak [133]
Humidity (% RH) 0% 100% 100% 50% 100% 0% 0% 50% 50%
E (GPa)
4.5 [129]
1.6 [129]
3.5 [139] 0.4 0.4 6.1 2.2 2.5
[131] 1.3
σY.P. (MPa) 100 40 35 14.3 9.18 - 55.8 - 29.1
σT.S. (MPa) 260 180 70 16.2 - 137 - 150 47.5
εFrac (%) 30 55 40 128 - - - 10 12.17
Note: References shown in [ ].
Fundamental studies of mechanical behavior of wool fibers typically focus on either the
basic tensile behavior of the fibers or the time-dependent viscoelastic behavior investigated in
stress relaxation and creep studies. A typical plot of stress versus strain for wool is shown in
Fig. 26(a) [154]. The tensile response of wool fibers typically displays: (1) an initial linear
viscoelastic Hookean region, then (2) a yield region where deformation occurs with minimal
increase in stress, and finally (3) a post-yield region where significant increases in stress are
required to produce additional increments of strain. Details of the suggested relationship
between the keratin molecular structure and the macroscopic stress-strain curve are described
below. Fig. 26(b) shows typical tensile unloading curves where hysteresis effects are exhibited
in the stress-strain response. [154]
(1) Initial linear region: At small strains (< 2%), the fiber behavior is characterized as
Hookean wherein the helical α-keratin intermediate filaments carry the majority of the load and
the keratin-associated protein matrix is thought to contribute little load carrying capacity to the
fiber due to its amorphous structure.

55
(2) In 1950, Pauling and Corey [155] proposed the α-helix conformation for the keratin
polypeptide chains and noted a transformation of the molecular structure from the α-helix
conformation to a β-sheet conformation at strains greater than 2% but less than about 30%. The
transformation between the two thermodynamically stable mechanical states (α-helix ↔ β-sheet)
is generally believed to occur at a more-or-less constant stress and at random sites along the
intermediate filament. The hysteresis effects during stress recovery seen in this region when
samples are unloaded are due to β-sheets transforming back to the α-helix conformation.
During unloading, the refolding of the α-helix chains occurs at reduced stress levels presumably
due to the slow reformation of the stabilizing ionic bonds. All strains are recoverable in this
stage of deformation.
(3) For strains larger than about 30%, the slope of the stress-strain curve increases due to
the intrinsic resistance of the β-sheet structure within the intermediate filaments and/or rapidly
increasing load carrying capacity of the keratin-associated protein matrix. On recovery, the
stress follows approximately the same slope in the post-yield region but carries much lower
stresses in the yield region during elastic recovery back to the original state. At very high
extensions, some loss of complete elastic recovery is found and small permanent strains remain.

56
(a) (b)
Fig. 26. (a) Stress strain curve for a wool fiber showing the Hookean region, linear region, and post-yield region. (b) Stress relaxation curve for a wool fiber showing in yield region and post-yield region. [154]
Several micromodels have been advocated for interpreting the tensile behavior of the
keratins in wool. In 1959 Feughelman proposed the Two-Phase Model consisting of
water-impenetrable rigid rods (phase C in Fig. 27 representing the helical α-keratin intermediate
filaments) embedded in a matrix (phase M in Fig. 27 representing the keratin-associated protein
matrix) [156]. The water-impenetrable intermediate filament consisted of two pairs of apolar
residuals surrounded by residuals having columbic interaction; thus, the structure was
hydrophobic. The 1959 Feughelman model then treated the matrix as many separate globules
containing protein residuals surrounded by water molecules. Phase M was sensitive to moisture
uptake. The mechanical properties of the fiber decreased with increasing amounts of water in the
fiber. Feughelman interpreted the initial Hookean region due to changes in bond angles of the
helical α-keratin intermediate filaments and the mechanical properties were assumed isotropic
and identical in both phases [157]. The transition from α-helix to β-sheet in the intermediate
57
filaments then occurred at a more-or-less constant stress as the fiber reached its yield point and
the initially water impenetrable intermediate filaments became progressively more water
penetrable [158].
However, Feughelman’s original model was unable to explain why the unfolding of
α-helix to β-sheet terminated at a strain ~ 30% whereas a complete unfolding of the α-helix to
β-sheet should have resulted in an increase of length of ~ 120%. Moreover, the model was
unable to explain the increase of slope in the tensile data in the post-yield region. In 1994,
Feughelman modified his original Two-Phase Model into a Zone-Series Model and considered
fibers to contain X- and Y-zones (so-called Burte-Halsey units) in the longitudinal direction with
each zone containing both intermediate filaments and keratin-associated protein matrix [159].
Feughelman determined that the X-zones were subject to deformation upon first stretching the
fiber (i.e., the yield region) and the mechanical behavior of the post yield region was attributed to
the elongation of Y-zones. Feughelman suggested that the unfolding of the α-helix to β-sheet
during the stretching of X-zones in the yield region forced the intermediate filaments to move
toward each other and resulted in “jamming the protein globules in the matrix” [160]. The
jamming mechanism was believed to hinder the unfolding process in the Y-zones and explained
why the α-helices could not be fully extended and why the slope in post-yield region increased.
A schematic of Feughelman’s Zone-Series Model is shown in Fig. 28 [127]. A key idea
embedded in Feughelman’s model is that the keratin-associated protein matrix contains
hydrophilic globules surrounded by water molecules and that the structure could undergo a
transition from a weakly bonded gelatinous (gel) state to an extremely mobile solution (sol) state
[127,160]. The transition from “gel” state to “sol” state reverted once the extension ceased.
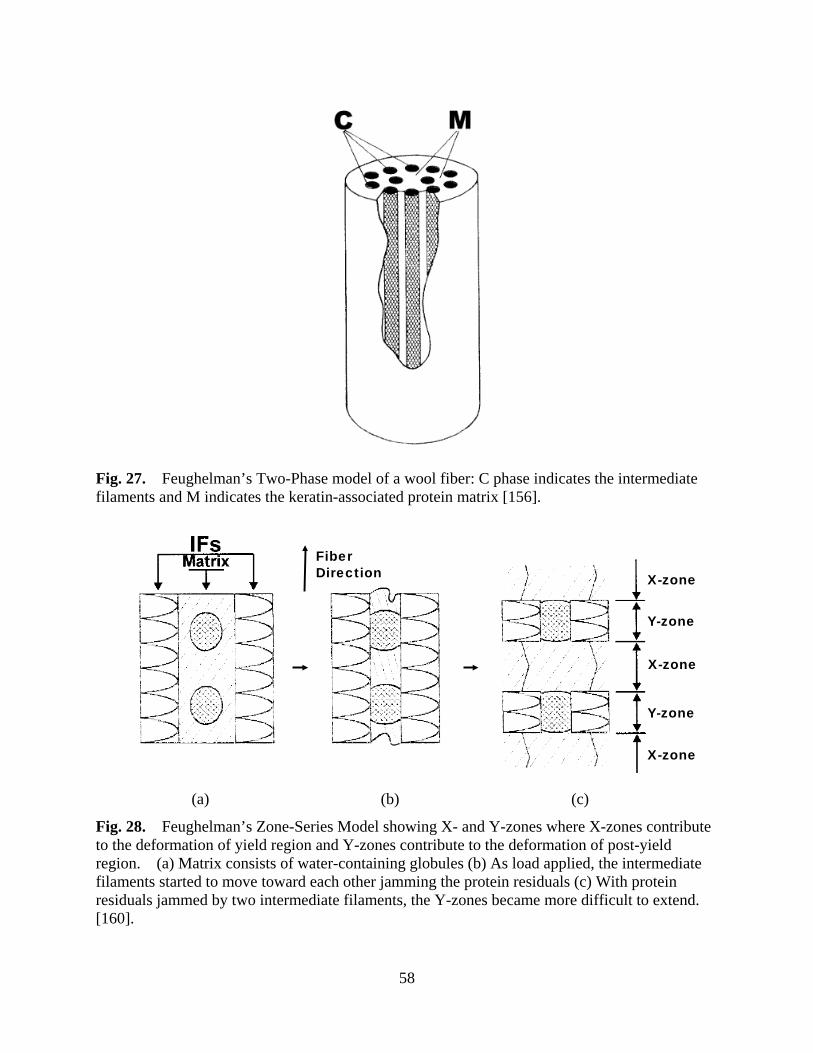
58
Fig. 27. Feughelman’s Two-Phase model of a wool fiber: C phase indicates the intermediate filaments and M indicates the keratin-associated protein matrix [156].
(a) (b) (c)
Fig. 28. Feughelman’s Zone-Series Model showing X- and Y-zones where X-zones contribute to the deformation of yield region and Y-zones contribute to the deformation of post-yield region. (a) Matrix consists of water-containing globules (b) As load applied, the intermediate filaments started to move toward each other jamming the protein residuals (c) With protein residuals jammed by two intermediate filaments, the Y-zones became more difficult to extend. [160].
Y-zone
Y-zone
X-zone
X-zone
X-zone
FiberDirection

59
In 1968, Chapman and Hearle used the fundamental schematic of keratin structure
developed by Feughelman and proposed a more detailed micromechanical model
[125,155,161-163]. This model proposed that a critical stress is required to initiate the
unfolding of α-helix to β-sheet in the intermediate filaments. Once initiated by the critical
stress, a lower equilibrium stress could then maintain the β-sheet conformation. Chapman and
Hearle focused on the stress transferred from intermediate filaments to the matrix and predicted
that the unfolding process of α-helix to β-sheet occurred at separated zones even if the
intermediate filaments were originally uniform. Chapman and Hearle stated that although this
separated zone unfolding process was in agreement with Feughelman’s model, the fundamental
phenomenon lay in the mechanics of the structure of the keratin fiber [154]. This model also
assumed that the keratin-associated protein matrix was not composed of separate globules as
advanced by Feughelman [159] but was a highly crosslinked inter-molecular network (Fig. 29).
The crosslinked network was somehow mechanically coupled with the intermediate filaments to
contribute to the load-carrying stress-strain behavior. A complete coupling between the
filaments and the matrix would result in the same strain in the filament and the matrix and load
sharing between the two constituents [161]. On the other hand, if there was no coupling
between filaments and the matrix, the total stress could be estimated by simply adding the stress
acting on the matrix to the stress acting on filaments at whatever level of strain the two exhibited
in response to the applied load [162]. Chapman and Hearle predicted that partial coupling
between the intermediate filaments and the keratin-associated protein matrix would be the
general and most likely case [154].

60
(a) (b)
Fig. 29. Chapman and Hearle’s Composite Model for a wool fiber showing the highly crosslinked intermolecular network. (a) Fiber is not extended (b) Fiber is extended under a load [126].
Based on their composite model theory, three cases of partial coupling between the
filaments and the matrix were studied by Chapman and Hearle. The first and simplest case
assumed that the strongest connections between filaments and matrix were located at the
terminal ends of the filaments’ α-helical crystalline dimers. Stretching of a fiber could then
create a discontinuity of zones of α-helix opening to β-sheets along discrete intervals. Chapman
and Hearle showed that this discontinuous coupling case could be modeled as [161]:
Initial Hookean Region:
𝜎 = 𝐸𝐹𝜀
Yield Region:
𝜀 =𝜎[(𝜎𝑒 + 𝐸𝑀𝜀𝑏) + 𝑛𝜆𝐸𝐹𝜀𝑏] − 𝑛𝜆𝜎𝑒𝜀𝑏𝐸𝐹 − 𝜎2
(𝜎𝑒 + 𝐸𝑀𝜀𝑏)𝐸𝐹 − 𝜎𝐸𝐹

61
Post-Yield Region:
𝜎 = �2𝐸𝐹𝐸𝑀𝜀𝑏 − 𝐸𝐹(𝜎𝑐 − 𝜎𝑒)2𝜀𝑏(𝐸𝑀 + 1) − (𝜎𝑐 − 𝜎𝑒)� 𝜀
where, EF is modulus for the filaments, EM is modulus for the matrix, σe is the equilibrium stress,
σc is the critical stress, εb is strain associated with transition from α-helix to β-sheet, and nλ is the
total increase in length due to zone opening.
The second case that Chapman and Hearle studied involved no slippage at the interface of
the intermediate filaments and the protein matrix. Stress is considered to be transferred from
the filaments to the matrix and the matrix was deformed in both tension and shear. Opening of
the β-sheets would occur at separate locations (followed by the first case) even when the
filaments and matrix were initially uniform, and the stress intensity near these zones was large
enough to repel other openings [162]. The mathematical expression of this case could be
written as [162]:
Yield Region:
𝜎 = 𝜙(𝜀)
where stress applied to the system is a complex function of fibril strain and matrix strain, and the
stress and strain can be written individually as [162]:
𝜎 = 𝜎𝑒 + 𝑘𝐾1𝜎0 �2
1 − 𝑒−2𝐾1𝑎− 1� +
𝑘𝜎𝑒𝑞
𝜀 =𝑥𝑎 + 𝑥𝑏𝑎 + 𝑏
with,
𝑥𝑎 =𝜎𝑒𝑞𝑎 +
𝐾𝜎0𝑞𝐾1
�2 �𝑎 − �1
𝐾1� � sinh𝐾1𝑎�
1 − 𝑒−2𝐾1𝑎− �𝑎 − �1
𝐾1� � (𝑒𝐾1𝑎 − 1)��

62
𝑥𝑏 = �𝜎𝑒 + ℎ𝑐 � 𝑏 +
𝐾𝜎0𝑐𝐾2
��𝑏 −1𝐾2
(𝑒𝐾2𝑏−1)� −2 �𝑏 − �1
𝐾2� � sinh𝐾2𝑏�
1 − 𝑒−2𝐾2𝑏 �
and, K is the matrix shear modulus, k is the matrix tensile modulus, q is the tensile modulus for
fibril in the helix form, c is the tensile modulus for fibril in the extended form, a and b are the
left and right points where the system suffers no shear, and K1 and K2 are constants related to K,
k, q, and c.
The third case focused on possible slippage at the interface of the intermediate filaments
and the protein matrix. Shear stress was transferred from the filaments to the matrix, and any
elastic strain redistribution in the matrix was ignored. The mathematical expression of this case
can be described as [163]:
Yield Region:
𝜀 = 2𝑛𝜆 �1 −𝜎 + 𝜎𝑒2𝑎𝜀𝑏
� +𝜎𝑎− 𝑦𝑚
𝑛𝑎
(𝜎 − 𝜎𝑒)
Post-Yield Region:
𝜎 = 𝜎𝑒 + 𝐸𝑋∗ + 𝜎0
𝜀 = 𝜀𝑏 �1 −𝐸𝑘1𝑋∗�
𝜆0� + �
𝐸𝑘1𝑋∗�
𝜆0� �
𝜎0 + 𝜎𝑒2𝑎 �
where, ym is the length for slippage, and 𝑋∗ = 𝑘1𝐸�𝑥0−𝑥 𝜀𝑏� �
2.3.5 Chemical Properties of Keratin Materials
The physical forms of α-keratins described here are as diverse as porcupine quills,
various horns and antlers, and extremely soft fine furs of small mammals such as mice.

63
Although there are some variations between the physical forms of keratins, there are also
remarkable similarities in amino acid compositions between comparable types of keratins. The
overall amino acid composition of α-type keratins depends on the relative proportion of the two
major types of protein, namely the high-sulfur and low-sulfur proteins, and the chemical
behavior of α-typed keratins may vary from one another. Among all the amino acids, cystine
(CYS) crosslinks are a special feature of α-type keratins, in which reactions of CYS with
oxidants and reductants are of major importance.
Most of the radiation chemistry of α-type keratins is concerned with the effect of
exposure to sunlight. Photo-oxidation of the peptide bonds in α-type keratins is the most
damaging reaction to weaken the main backbone of the material [164,165]. Subsequent
damage by UV light on other amino acids such as tyrosine, tryptophan, proline, etc. can also
occur after prolonged exposure [166,167]. The reaction of photo-oxidation is shown in Fig. 30
[168]. Additional carbonyl and amide groups are formed following the cleavage of the peptide
N-C bond. This reaction is implicated in the loss of strength and the susceptibility to other
chemical reactions. Photochemical damage also increases the susceptibility of keratins to
discoloration when exposed to dry heat at temperatures over 110 °C for a prolonged period
[168]. Depending on the conditions of exposure to UV irradiation, keratins (especially wool)
can either be bleached or yellowed, known as photobleaching and photoyellowing [169,170].
Inglis and Lennox [171] found that irradiation of wool with different UV wavebands selected
from natural or artificial sources affected the yellowness of wool when UV waveband is below
331 nm, whereas visible light above 398 nm induces photobleaching. Meybeck [172]
suggested that aromatic amino acids absorb UV light, and there is a photochemical conversion to
glyoxylyl and pyruvyl peptides after energy is transferred to glycine and alanine. Dyer et al.
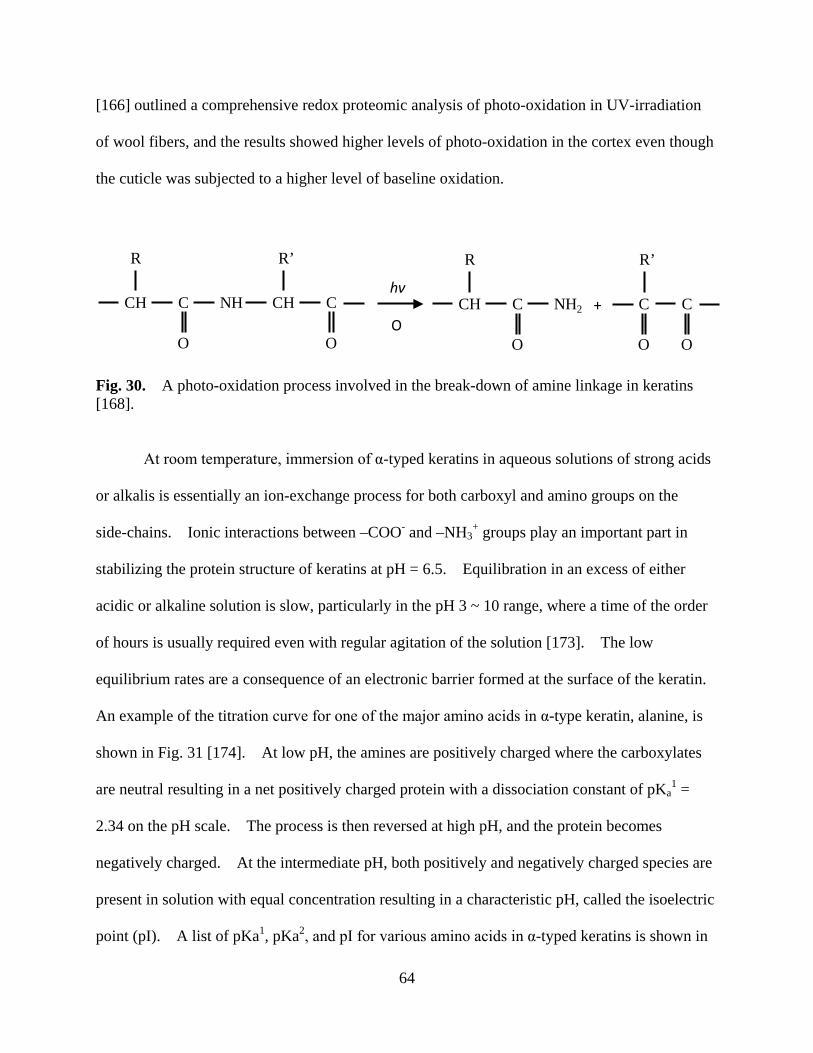
64
[166] outlined a comprehensive redox proteomic analysis of photo-oxidation in UV-irradiation
of wool fibers, and the results showed higher levels of photo-oxidation in the cortex even though
the cuticle was subjected to a higher level of baseline oxidation.
Fig. 30. A photo-oxidation process involved in the break-down of amine linkage in keratins [168].
At room temperature, immersion of α-typed keratins in aqueous solutions of strong acids
or alkalis is essentially an ion-exchange process for both carboxyl and amino groups on the
side-chains. Ionic interactions between –COO- and –NH3+ groups play an important part in
stabilizing the protein structure of keratins at pH = 6.5. Equilibration in an excess of either
acidic or alkaline solution is slow, particularly in the pH 3 ~ 10 range, where a time of the order
of hours is usually required even with regular agitation of the solution [173]. The low
equilibrium rates are a consequence of an electronic barrier formed at the surface of the keratin.
An example of the titration curve for one of the major amino acids in α-type keratin, alanine, is
shown in Fig. 31 [174]. At low pH, the amines are positively charged where the carboxylates
are neutral resulting in a net positively charged protein with a dissociation constant of pKa1 =
2.34 on the pH scale. The process is then reversed at high pH, and the protein becomes
negatively charged. At the intermediate pH, both positively and negatively charged species are
present in solution with equal concentration resulting in a characteristic pH, called the isoelectric
point (pI). A list of pKa1, pKa2, and pI for various amino acids in α-typed keratins is shown in
CH
R
C
O
NH CH
R’
C
O
CH
R
C
O
NH2 C
R’
C
O
hν
OO
+
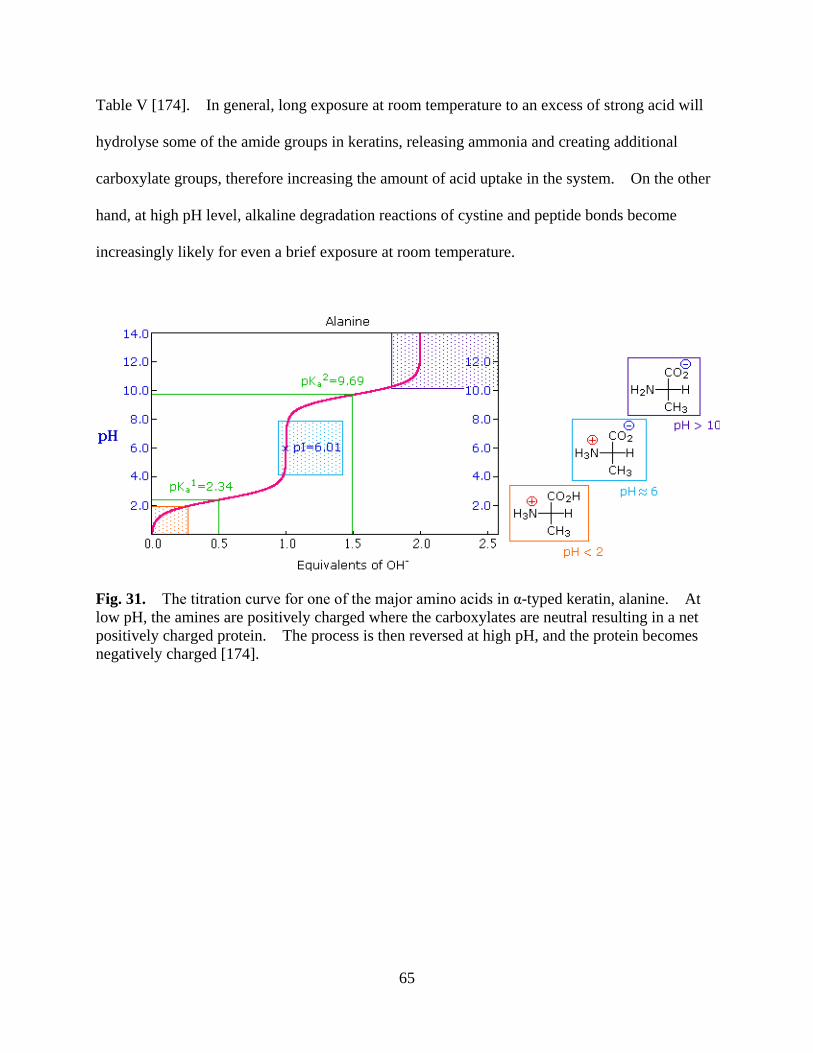
65
Table V [174]. In general, long exposure at room temperature to an excess of strong acid will
hydrolyse some of the amide groups in keratins, releasing ammonia and creating additional
carboxylate groups, therefore increasing the amount of acid uptake in the system. On the other
hand, at high pH level, alkaline degradation reactions of cystine and peptide bonds become
increasingly likely for even a brief exposure at room temperature.
Fig. 31. The titration curve for one of the major amino acids in α-typed keratin, alanine. At low pH, the amines are positively charged where the carboxylates are neutral resulting in a net positively charged protein. The process is then reversed at high pH, and the protein becomes negatively charged [174].

66
Table V. pKa1 (COO-), pKa2 (NH+) and pI for various amino acids typically found in keratins [174].
Amino Acid COO- (pKa1) NH3
+ (pKa2) pI
Arginine 2.1 9.0 10.8
Aspartic Acid 2.1 9.8 3.0
Cysteine 1.7 10.4 5.0
Glutamic Acid 2.2 9.7 3.2
Lysine 2.2 9.0 9.8
Tyrosine 2.2 9.1 5.7
A typical oxidative bleaching process for wool involving hydrogen peroxide liquid can be
accomplished in a 20 ml/l (35%) H2O2 at pH =8.5 with 0.4 g/l sodium pyrophosphate or other
chemically-related products as a stabilizer [175]. Other bleaching methods of wool fibers by
hydrogen peroxide solutions is often accomplished during routine processing using alkaline 3%
hydrogen peroxide solution at a temperature of 80 ~ 90 ºC [176]. In an earlier study by
Arifoglu et al. [177], the level of whiteness of wool after bleaching by hydrogen peroxide was
found to be controlled by the exposure time, the concentration of hydrogen peroxide, the pH
level, and the temperature of the treatment. Gacen and Cayuela [178] showed that when
bleaching wool with an alkaline solution (pH = 9) of hydrogen peroxide (~ 5%) containing
sodium pyrophosphate/sodium oxalate buffering medium at 55 ºC for 2 hours, the whiteness
index was greater than bleaching in an acidic solution (pH = 4.7). Thus chemical attack by
hydrogen peroxide liquid concentrate was more severe in an alkaline solution than in an acidic
solution. In a more recent study by Cardamone et al. [179], the effect of shrinkage on wool
during hydrogen peroxide bleaching was controlled by the unstable perhydroxy (HO2-) radicals.
67
These authors found that the chemical attack of the wool disulfide cross links by hydrogen
peroxide produced sulfonic acid and changed the anionic charge on the surface of wool fibers.
The net effect was to increase the hydrophobicity, decreasing the electrostatic repulsion of the
fibers and causing shrinkage in the wool fabrics.
68
3. Objectives of the Research
Among all the sanitization methods, VHP® decontamination appears to be one of the best
candidates for the use of routine as well as emergency clean-up in large spaces and modern
transport vehicles, especially in the aviation industry. As discussed previously (see section
2.1.4), a typical VHP® process introduces moisture and hydrogen peroxide vapor during the
conditioning and decontamination phase which is of particular concern with porous and/or highly
absorptive polymeric materials. Hence, it was necessary to perform a series of materials
compatibility investigations on polymers. Textile fabrics, namely wool, nylon, polyester, and
Nomex®, are used during Part I of this research to examine the effects on mechanical properties
from the exposure to H2O and H2O2 during VHP® decontamination processes.
It is expected that moisture and hydrogen peroxide vapor may alter the mechanical
properties of the above polymeric materials. Wool belongs to the alpha-keratin family, has
been extensively studied for 50 years and would be expected to be particularly susceptible to
degradation from moisture and hydrogen peroxide vapor. However, a less-studied
alpha-keratin material that is similar to wool in molecular structure (i.e., North American
porcupine quill) but with samples sizes much larger than individual wool fibers was chosen for
Part II of this research. The second portion of the research examines the effects of hydration
and degradation on keratin materials due to exposure of H2O and H2O2.
Thus, there are two specific objectives for the present research:
The first objective is to evaluate mechanically and chemically changes in properties of
selected textile fabrics before and after VHP® exposure. Under the framework of this research,
69
these studies are divided into effects of (i) moisture and (ii) hydrogen peroxide vapor on four
different fabric materials. These data will enable technologists to assess the ability of VHP®
decontamination processes to be applied within commercially relevant environments.
The second objective derives from the first objective and mainly consists of more
fundamental studies and characterization of changes in mechanical properties of alpha-keratin
materials due to environmental exposures. Alpha-keratin materials are very sensitive to
moisture and hydrogen peroxide (a strong oxidant) and their mechanical properties can be altered
by exposure to these two factors. The investigations focus on a sparsely studied alpha-keratin
material, North American porcupine quills. The goals in Part II of the research include: (1)
providing information on the underlying microstructure of North American porcupine quills; (2)
examining the role of moisture absorption in the tensile and nanomechanical behavior of North
American porcupine quill tissue; and (3) quantitatively investigating the unfolding processes of
alpha-keratin to beta-keratin in porcupine quill tissue due to applied tensile loads.

70
4. Experimental Procedures
This section documents the experimental procedures used to investigate the materials
compatibility of common airliner cabin fabrics (wool, nylon, polyester and Nomex®) with
hydrogen peroxide vapor decontaminant. Furthermore, the experimental procedures to
characterize natural keratin polymer material of North American porcupine quill are also
described here.
4.1 Exposure of Selected Textile Fabrics to VHP® Process
4.1.1 Materials Preparation
The specific motivation of this part of the research was to evaluate the materials
compatibility of textiles representative of those used in the modern aircraft. Although the focus
of the work is on airliner cabin textiles, in the interests of test consistency and repeatability, the
decision was made to perform the work on representative laboratory-grade test materials, rather
than actual cabin fabrics from in-service aircraft. Thus laboratory-grade textile samples of
wool, nylon, polyester, and Nomex® were acquired from Testfabrics (Testfabrics Inc., West
Pittston, PA, USA).
High quality wool, nylon, polyester, and Nomex® specimens were pre-cut from the
as-received raw fabrics and labeled consistent with test conditions according to the test
specifications shown in Fig. 32. Pre-notched tensile specimens (8” x 2”) and tongue tear
specimens (8” x 3”) were prepared in accordance with ASTM standards D 5034 – 95 [180] and
D 2261 – 96 [181] respectively.

71
Textiles are highly anisotropic due to the characteristics of yarns and the directions of
weaving and the inherent anisotropy could represent a significant confounding factor on the
behavior of each specimen during mechanical testing. Hence, samples were cut from the
as-received raw fabrics and prepared into two groups, namely warp and weft, based on the
majority of the load-carrying yarns during the mechanical testing. For example, a tensile warp
specimen corresponded to the tensile configuration shown in Fig. 32 where the uniaxial tensile
load was applied parallel to the warp yarns with weft yarns perpendicular to the loading axis to
minimize their influence on the test results. On the other hand, a tear warp specimen
corresponds to the tear configuration shown in Fig. 32 where the warp yarns were aligned
perpendicular to the 3” pre-notched line. With two specimen clamps holding the left and right
sides of the bottom of the specimen, the warp yarns were subjected to a tearing load to propagate
tearing failure. Both warp and weft specimens were inspected visually and specimens
containing any macroscopic weaving defects were eliminated prior to VHP® exposure.

72
Fig. 32. Physical dimensions of textile specimens for pre-notched tensile warp and tear warp testing. Note location and orientation of the pre-test “tears” in the fabric test samples. The direction of the warp yarns are shown in light gray dashed lines. Tensile weft and tear weft test samples would be rotated 90 degrees.
4.1.2 Hydrogen Peroxide Exposure
Sample exposures to vaporized hydrogen peroxide were performed with a 1000ED
Bio-decontamination Unit (STERIS Corporation, Mentor OH, USA) using Vaprox®*** as the
sterilant in an enclosed chamber, either a small austenitic stainless steel chamber or a large vinyl
enclosure, with volumes of 0.38 and 9.51 m3 respectively. Fig. 33(a) shows the Steris 1000ED
bio-decontamination unit attached to a rigid stainless steel chamber for precision control on
VHP® exposure, and Fig. 33(b) shows the tent enclosure used in this research for processing
*** Vaprox, a trademark of STERIS Corporation, Mentor, OH. USA, is a 35% hydrogen peroxide liquid concentrate with pH ~ 3.5.
2” 3”
8”
Tensile Tear
1”
3”

73
large number of specimens. Vaprox® sterilant, i.e., hydrogen peroxide stock solution at a
concentration of 35 % and pH of 3~4, was flash vaporized into the chamber using the VHP®
1000ED unit. Fabric samples were placed on austenitic stainless steel wire racks during
decontamination to allow gas circulation.
Effective use of hydrogen peroxide vapor decontamination requires an adequate
combination of concentration and exposure time. The hydrogen peroxide vapor concentration
depends on temperature and humidity of the sealed enclosure, and the exposure time depends on
the size of an enclosure. During the decontamination process, hydrogen peroxide liquid
concentrate is continuously injected into a vaporizer at temperatures above 110 °C. The
vaporized hydrogen peroxide was mixed and blown into the enclosure with dry hot air for the
required exposure time to assure decontamination. Once the hydrogen peroxide vapor leaves
the enclosure, it is catalytically converted into water vapor and oxygen. The parameters of the
various VHP® cycles performed in this research are listed in Table VI.
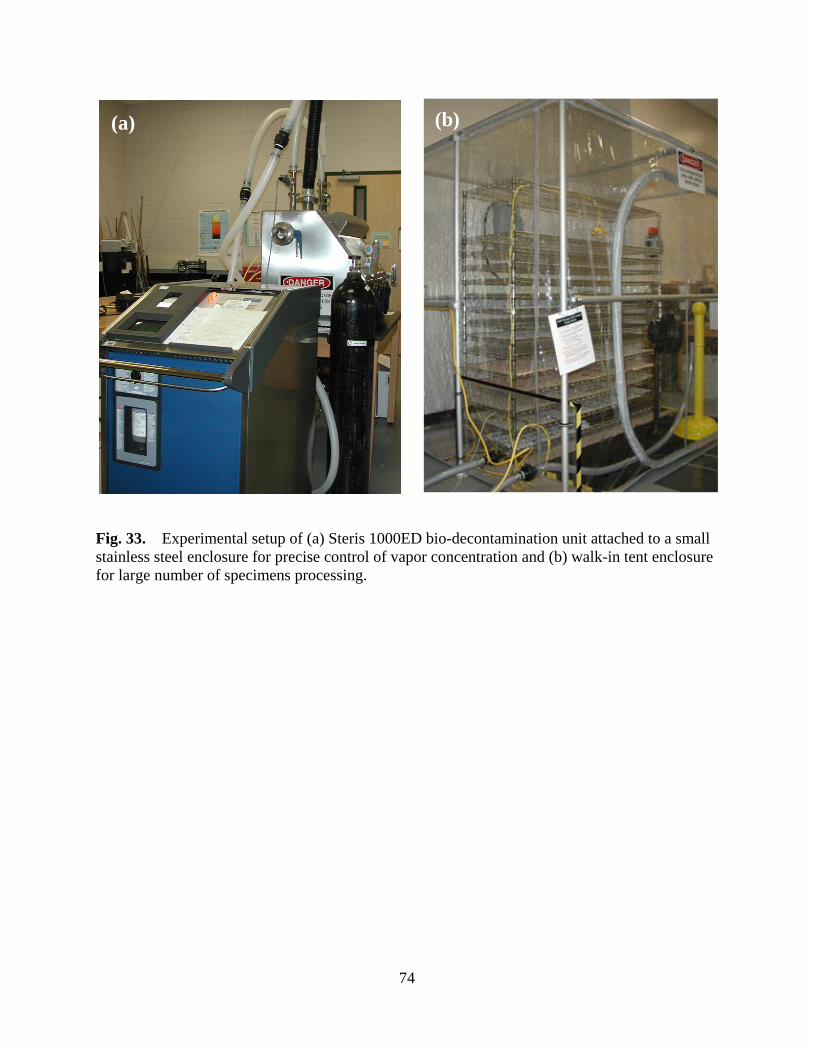
74
Fig. 33. Experimental setup of (a) Steris 1000ED bio-decontamination unit attached to a small stainless steel enclosure for precise control of vapor concentration and (b) walk-in tent enclosure for large number of specimens processing.
(a) (b)

75
Table VI. Parameters employed in various VHP exposures. Enclosure Concentration 450 ppm 150 ppm
Enclosure Type Rigid Stainless Steel Flexible Tent Rigid Stainless Steel
Enclosure Volume
(ft3) 13.4 336 13.4
Air Flow Rate
(SCFM) 13 20 13
Dehumidification Time
(min) 10 35 10
Condition Injection Rate
(g/min) 3.6 5.5 1.3
Condition Time
(min) 10 20 10
Decontamination Injection Rate
(g/min) 1.3 2.9 0.66
Decontamination Time
(min) 288 288 288
Aeration Time
(min) 75 210 45
76
Several test runs were required prior to the actual sample exposure testing to ensure that
the exposure cycles represented actual decontamination practice. The temperatures inside the
enclosure were closely monitored using 8 thermocouples to ensure that temperature inside the
enclosure was homogeneous and higher than the dew point of the hydrogen peroxide vapor
during the VHP® processes in order to avoid condensation. Time, pressure, injection rate,
humidity, and temperature were recorded for each VHP® cycle in a reasonable time (e.g., 1 hr) to
ensure the samples were properly exposed to the specific conditions required.
There were slight differences in the ramp-rate to the working concentration and the
aeration time for the small and large enclosure due to the performance limit of the VHP®
1000ED apparatus. Typically, it required 30 minutes for the conditioning phase and 6 hours for
the aeration phase of the large tent enclosure and only 10 minutes for the conditioning phase and
1.5 hours for the aeration phase in the small stainless steel chamber. However, the
decontamination process temperatures, concentrations, and exposure times were all controlled
closely and it is believed that the effect of using two different enclosures was negligible.
A total VHP® cycle (dehumidification, ramp up to the working peroxide concentration,
decontamination and aeration) typically required 6 ~ 8 hours, depending on the enclosure type
and the necessity for any further aeration. Cycle development for the small chamber and large
enclosure were targeted at a 2,000 ppm inlet concentration and a 450 ppm enclosure
concentration as measured by ATI sensors††† (ATI Inc., Collegeville, PA, USA) during the
operation. Post cycle measurements of the concentration of hydrogen peroxide vapor were
††† The ATI sensors are capable of sensing hydrogen peroxide vapor above around 50 ppm with a nominal accuracy of ± 5%. The signal to noise ratio decreases significantly when the concentration of hydrogen peroxide vapor is below 10 ppm.

77
conducted using a Dräger CMS sensor and Dräger tubes‡‡‡ (Dräger Safety Inc., Pittsburgh, PA,
USA). The exposure environment was designed to be more aggressive than that used for field
trials, which employed an inlet concentration ~ 450 ppm and a 150~200 ppm enclosure
concentration [21,79].
The present research dealt with after exposure effects to fabric structure and properties
rather than any immediate effect on the change of appearance or mechanical properties of
materials during the VHP® process. Thus, post VHP® exposure aging processes were divided
into three time frames: (1) short-term aging (1 ~ 3 days), (2) intermediate-term aging (14 ~ 17
days), and long-term aging (~100 days). For sample aging in vacuum desiccators, there were
little to negligible effects on desorption processes after 3 days, and hence, there were no
long-term aging (~100 days) tests conducted using vacuum. Effects on exposure to hydrogen
peroxide were divided into: (1) various repetitive VHP® cycles (e.g., 1, 10, 25 VHP® cycles) to
simulate either a single cycle or multiple cycles of routine decontamination and (2) exposure to
35% hydrogen peroxide liquid feedstock for 24 or 168 hours to simulate possible incidents
involving operator abuse or unintentional spillage. Dip exposure of fabric samples to 35%
liquid phase hydrogen peroxide was carried out in opaque PVC bottles (Fisher Scientific, Fair
Lawn NJ, USA). After dip exposure, all dip specimens were immediately rinsed in DI-water
and then air dried in an electrostatic film drying cabinet (Delta 1, CPM, Inc. Dallas TX) for 1
day. In general, a test matrix, shown in Table VII, was developed to allow a comparison of the
influence on common airliner cabin fabric materials of either the oxidizing effect of hydrogen
peroxide exposure, or the addition of moisture in the form of water, reacted hydrogen peroxide,
or a mixture of both [24].
‡‡‡ Dräger tubes are capable of measuring hydrogen peroxide vapor in the range of 0.1 to 3 ppm, whereas the Dräger CMS sensor can measure hydrogen peroxide vapor in the range of 0.02 to 2 ppm.

78
Table VII. Test matrix for textile fabrics for effect of hydrogen peroxide exposure and effect of adsorbed/absorbed moisture (water/hydrogen peroxide/mixture of both) [24].
1~3
Days
Laboratory
Air
14~17
Days
Laboratory
Air
100~103
Days
Laboratory
Air
1~3
Days
Vacuum
Desiccator
14~17
Days
Vacuum
Desiccator
Unexposed
1 VHP®
Cycle
10 VHP®
Cycles
25 VHP®
Cycles
24 Hours
Dip
168 Hours
Dip
4.1.3 Physio-chemical Measurements
The weight changes of specimens due to exposure to hydrogen peroxide were measured
using an accuSeries® accu-124 balance (Fisher Scientific, Arvada, CO, USA). Fiber diameter
change due to moisture content variation was measured using secondary electron images
obtained using a JEOL JSM 7000F (JEOL, Peabody, MA, USA) field emission scanning electron
Effe
ct o
f Hyd
roge
n Pe
roxi
de E
xpos
ure
Effect of Adsorbed/Absorbed Moisture (Water/Hydrogen Peroxide/Mixture of Both)
79
microscope (FE-SEM) operated at 10 kV. The specimens were gold coated using a Pelco SC-6
sputter coater (Ted Pella Inc., Redding, CA, USA) prior to FE-SEM analysis. Changes in the
various fabrics after exposures to either 35% liquid hydrogen peroxide or vaporized hydrogen
peroxide were initially examined via straightforward physical observation (i.e., appearance to the
unaided eyes and residual post-exposure aroma), weight change, and observation via optical and
scanning electron microscopy.
Chemical analyses were performed using Fourier transform infrared spectroscopy (FTIR)
using an IR Prestige – 21 (Shimadzu Scientific Instruments, Columbia, MD, USA) spectrometer
on pellets made of a mixture of the ground textile fibers and potassium bromide, over a scan
range from 400 cm-1 to 4000 cm-1. Raman spectroscopy was employed to complement the
infrared spectroscopy. Raman spectra were acquired using an Invia Confocal Raman
Microscope (Renishaw, Wotton-under-Edge, Gloucestershire, UK) using a 514.5 nm wavelength
and 1 mW laser excitation source. Spectra were recorded using a 50x objective lens which
generated a 1 μm laser spot. The physical and mechanical characterization results were
interpreted using ANOVA statistical analysis using Microsoft EXCEL software.
4.1.4 Mechanical Testing
After fabric specimens were exposed and then aged in either laboratory air or a vacuum
dessicator, mechanical testing was performed in an environmentally conditioned laboratory (21 ±
1 ºC, 65 ± 2 % relative humidity) using a screw-driven Instron 4400R (Instron Inc., Canton MA,
USA) universal materials testing machine in accordance with ASTM standards D 5034 – 95
[180] and D 2261 – 96 [181]. Fig. 34 shows tensile and tear testing using the Instron 4400R
with compressed air driven grips to prevent slippage of the specimens. Control specimens were
performed regularly in order to confirm the stability of the materials, machine, testing procedures
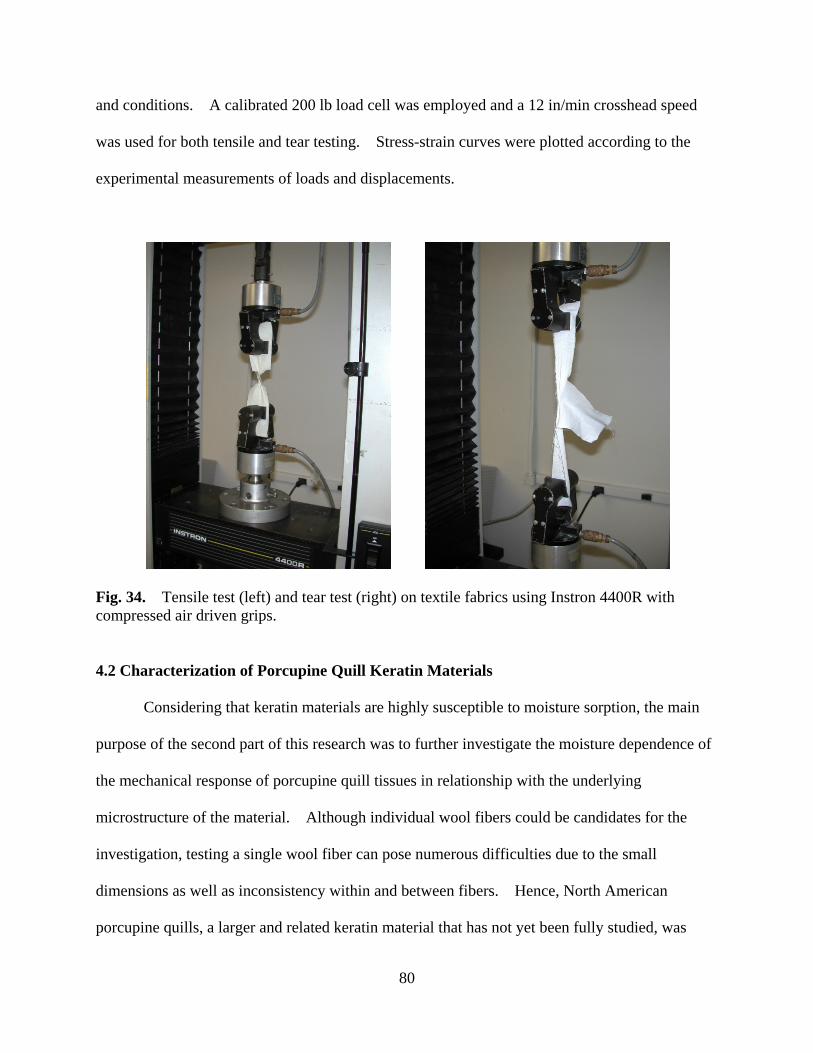
80
and conditions. A calibrated 200 lb load cell was employed and a 12 in/min crosshead speed
was used for both tensile and tear testing. Stress-strain curves were plotted according to the
experimental measurements of loads and displacements.
Fig. 34. Tensile test (left) and tear test (right) on textile fabrics using Instron 4400R with compressed air driven grips. 4.2 Characterization of Porcupine Quill Keratin Materials
Considering that keratin materials are highly susceptible to moisture sorption, the main
purpose of the second part of this research was to further investigate the moisture dependence of
the mechanical response of porcupine quill tissues in relationship with the underlying
microstructure of the material. Although individual wool fibers could be candidates for the
investigation, testing a single wool fiber can pose numerous difficulties due to the small
dimensions as well as inconsistency within and between fibers. Hence, North American
porcupine quills, a larger and related keratin material that has not yet been fully studied, was

81
chosen in this part of the research to investigate the mechanical response of keratin under various
conditions.
4.2.1 Materials Preparation
North American porcupine quills (40 ~ 50 mm in length and 1.5~2.0 mm in diameter)
were purchased from Spirit Connection Store (Titusville, PA., USA) for uniaxial tensile testing.
Prior to any actual testing, the as-received porcupine quills were carefully inspected for any
visible defects (i.e., cracks, holes, notches, etc.) or non-uniformity in diameter throughout the test
region. Defective quills were not tested. The as-received porcupine quills were then
conditioned in a textile conditioning unit (Parameter Generation & Control, Black Mountain,
NC., USA) for precise temperature and humidity control at 21 ± 1 ºC and 65 ± 5 % relative
humidity for 24 hours in accordance with ASTM D3822 – 07 [182]. The 100% relative
humidity condition was achieved by immersing the as-received porcupine quills in de-ionized
water for 24 hours.
For tests performed solely on the quill shell, the selected quills were sliced into a
desirable shape by a sharp razor blade and, after soaking in de-ionized water for 1 hour, the inner
foam core was carefully removed by custom-made tweezers that minimized damage to the inner
shell wall. The quill shells were immersed in de-ionized water at room temperature for 24
hours to relax any residual stresses created after removing the inner foam core. The quill shells
were then flattened into a thin strip (~ 30 µm in thickness) and dried at an elevated temperature
(~150 °C) for subsequent tensile testing and/or nanoindentation. After mounting the quill shell
on custom-made specimen grips (see Section 4.2.3 below), the quill shells to be subjected to
tensile test were conditioned at two different humidity levels (i.e., 65% RH and 100% RH).
82
4.2.2 Physio-chemical and Microstructural Characterization
Basic physical characterization of North American porcupine quills was performed by
first sectioning of quills for microscopic examination using sharp razor blades. Thickness
variations of the porcupine quills were measured using secondary electron images obtained by a
JEOL JSM 7000F (JEOL, Peabody, MA, USA) field emission scanning electron microscope
(FE-SEM) operating at 20 kV. The specimens were gold coated by a Pelco SC-6 sputter coater
(Ted Pella Inc., Redding, CA, USA) prior to FE-SEM analysis.
Fundamental chemical structural analyses of porcupine quills were performed by Fourier
transform infrared spectroscopy (FTIR) using a PerkinElmer Spectrum GX (PerkinElmer,
Covina, CA., USA) spectrometer on pellets made of a mixture of the ground quill shell and
potassium bromide, over a scan range from 400 cm-1 to 4000 cm-1. Nitrogen gas was used to
purge the FTIR system in order to reduce the effect of moisture present in air which could
interfere with the amide peaks. The resulting spectrum was used to compare with similar
spectral analyses of wool fibers performed in this research.
X-ray diffraction of quill tissues was performed on a Bruker D-8 Discover (Bruker AXS
Inc., Madison, WI., USA) single crystal diffractometer with an area detector using Cu Kα
irradiation (wavelength = 1.54 Å) at 40 kV generator voltage and 30 mA generator current. A
0.5 pinhole collimator was used for the x-ray incident beam, and specimens were placed and
aligned on a sample stage using an optical laser source with a distance of 15 cm from the
detector face. The incident beam and the detector were both set at 5° from horizontal, and the
exposure time was 200 sec with a frame size of 1024 x 1024 pixels.
Further chemical analyses were performed by attenuated total reflectance Fourier
transform infrared spectroscopy (ATR-FTIR) using a Nicolet 6700 (Thermo Fisher Scientific

83
Inc., USA) spectrometer with a diamond crystal, over a scan range from 400 cm-1 to 4000 cm-1.
A moderate pressure was applied from the anvil onto the specimen to ensure a good physical
contact between the sample and the diamond crystal for quality signals. The estimated
penetration depth was ~ 2 µm at 1600 cm-1, and the critical angle of incidence was 35.4° based
on the refractive index of 1.4 according to Schulz et al. [183] on the measurement of refractive
index of human nail (α-type keratin). Each integrated spectrum was collected by a total number
of 32 scans at the resolution of 4 cm-1.
Constant levels of strain were imposed on samples in-situ on the ATR-FTIR instrument
using a modified digital caliper to quantify the change of α-phase to β-phase. Specimens were
sandwiched between two 0.04 mm thick aluminum washers that enabled the bolts on the
modified caliper to elongate the specimen. The desired displacements for the selected strains
were calculated using the measured nominal length and the caliper was reset to zero as the bolts
started to stretch the specimen.
The resulting spectra obtained from the stretched samples, especially at the amide I band
(1580 cm-1 to 1700 cm-1), were smoothed and baseline corrected using OMNIC software
(Thermo Fisher Scientific Inc., USA) provided by the ATR-FTIR system before the
deconvolution processes were performed using Origin software (Origin 7.5, OriginLab Corp.,
Northampton, MA, USA). The deconvolution curve fitting processes were achieved by using
the Gaussian fit module (15 cm-1 ~ 17 cm-1 full width at half maximum) in the Origin software
centered at 1651 cm-1 for α-keratin, 1621 cm-1 for β-keratin, 1675 cm-1 for β-keratin/carbon
backbones, and 1692 cm-1 for carbon backbones [184]. Relative peak heights were measured
and normalized and the relative amount of the α-keratin and β-keratin as functions of strain were
then compared with the zero strain value.

84
4.2.3 Mechanical Testing
Tensile testing of porcupine quills was performed with a miniaturized stress-strain
apparatus (PASCO, Roseville, CA., USA) automated by attaching a rotary motor and a gear box
to provide a constant strain rate of 4.8 x 10⁻⁵ s-1 as shown in Figs. 35(a) and 35(b). Load versus
extension data were obtained using a Passport Interface data acquisition unit and Data Studio
software (PASCO, Roseville, CA., USA). Specimen grips (~ 57.15 mm X 14.05 mm) for
tensile testing of the as-conditioned quills were custom-manufactured from tempered aluminum
tubing (9.525 mm OD and 7.938 mm ID) by fabricating the tube to form a suitable cylindrical
hole for insertion of quills as shown in Fig. 35(c). The entire quill was inserted into the grips
and adhesive (Loctite® Brand, Henkel Co., Westlake, OH., USA) applied to both the
as-conditioned quills and the specimen grips. The nominal separation between the two
specimen grips was maintained at 10 mm to ensure a consistent and repeatable sample gauge
length. After curing the adhesive, the test specimens were replaced in the original conditioning
environment (either 65% RH or 100% RH) for at least 24 hours prior to tensile testing.
Pre-machined holes in the specimen grips allowed for repeatable alignment of the quill test
specimens with the loading axis to eliminate bending effects on the quill samples.

85
Fig. 35. Experimental setup for tensile testing of entire North American porcupine quills and their shells: (a) a custom-made platform for PASCO miniature stress-strain apparatus, (b) a gear box attached to a rotary motor to provide constant strain-rate and load and extension data were recorded by a 50N load cell and rotation sensor, and (c) the specimen was held by two custom-made specimen grips and superglue was applied to the insertion between the grips and the specimen.
Stresses were calculated (1) by measuring the thickness and load carrying area of each
test quill after tensile testing and (2) by assuming that the outer shell of the quill carried 100% of
the load. Strains were calculated using measured displacements and the initial separation of the
specimen grips as the initial sample gauge length. The mechanical characterization results were
interpreted by single factor analysis of variance using EXCEL software with a 99% confidence
interval (p<0.01). Normality of the data was confirmed at the 95% confidence level by the
Lilliefors test [185] using MatLab software. All graphical error bars represent 95% confidence
limits unless defined separately.
(a) (b)
(c)
86
4.2.4 Electron Microscopy and Nano-mechanical Testing
Sectioning of quill shells for microscopic examination of the fracture surface was
performed after the specimens were tensile tested. Secondary electron images were acquired by
using a JEOL JSM 7000F (JEOL, Peabody, MA, USA) field emission scanning electron
microscope (FE-SEM) operating at 20 kV. The specimens were gold coated by a Pelco SC-6
sputter coater (Ted Pella Inc., Redding, CA, USA) prior to FE-SEM analysis.
One centimeter pieces of quill tip were prepared for transmission electron microscopy by
first sectioning and removing the tip of the quill with a razor blade. Both ends of the specimen
were opened to allow better infiltration of solutions and resin into the samples. Following tip
removal, samples were immersed in 0.5M thioglycolic acid (97%) for 24 hours at room
temperature prior to the staining process in order to enhance contrast between the filaments and
matrix. After removing from thioglycolic acid solution, samples were washed in distilled water
for at least 1 hour. Samples were then placed in a 2% aqueous solution of osmium tetroxide for
72 hours at room temperature. Samples were washed in distilled water for 3 hours and then
dehydrated to 100% ethanol through a graded alcohol series, followed by a final change to 100%
propylene oxide (PO). Samples remained in each solution change for approximately 1 hour at
room temperature. Over the course of 8 hours, the samples were infiltrated with increasing
amounts of Araldite resin (AR) diluted in PO as follows: 25% AR + 75% PO, 50% AR + 50%
PO, 75% AR + 25% PO, 2 changes of 100% AR. For all steps, a low amount of vacuum was
applied periodically to the sample vials to facilitate gas removal and to enhance solution
exchange. Quill samples were then removed from their vials, placed in molds containing fresh
resin and then polymerized for 24 hours at 70 degree C.

87
Subsequent to polymerization, embedded samples were trimmed and sectioned using a
Leica Ultracut T ultramicrotome (Leica Microsystems, Inc, Buffalo Grove, IL, USA). Silver
sections were picked up on 200 mesh copper grids and examined in a Zeiss EM 10 TEM at 60kV
(Carl Zeiss, LLC North America).
Nanoindentations on both the axial and circumferential planes were performed with an
MTS NanoIndenter XP system with a Berkovich diamond tip in depth-controlled continuous
stiffness mode. Prior to the testing, the quill shells were mounted in a mixture of epoxy resin
(EpoThin® 20-8140-032, Buehler, Lake Bluff, IL, USA) and epoxy resin hardener (EpoThin®
20-8142-016, Buehler, Lake Bluff, IL, USA). The quill shells were reinforced by stainless-steel
specimen support clips (Sample-Klip® Buehler, Lake Bluff, IL, USA) during the mounting
process (1) to ensure a perpendicular cross-sectional plane for indentations and (2) to ensure
mechanical support from both sides of the specimen during indentation testing. The specimen
mount was polished using standard metallographic polishing methods using a 0.03 µm Al2O3
solution on an automatic polishing wheel (TegraPol-15 and Tegra Force-1, Struers Inc.,
Cleveland, OH, USA). During indentation testing, Poisson's ratio was set to 0.50 [135,186], the
allowable drift rate 0.05 nm/sec, and a harmonic displacement target of 2 nm. Each
sample/layer was examined for at least 20 individual indents using MTS TestWorks 4 and the
results were averaged with MTS Analyst.

88
5. Results and Discussion
5.1 Effects of Hydrogen Peroxide on Selected Textile Fabrics
Changes in the mechanical properties and chemical structure of cabin textiles due to
hydrogen peroxide exposure are discussed in this section. Hydrogen peroxide is a relatively
strong oxidizer and Vaprox® is also strongly acidic with a pH ~ 3. Furthermore, VHP®
processes introduce moisture, usually resulting in an increase of 20% in the relative humidity.
5.1.1 Physical Observation of Selected Textiles after VHP® Process
One of the limitations for VHP® decontamination technique is the issue with
adsorption/absorption of hydrogen peroxide vapor in porous and/or sorbent materials. The
fabric materials used in this research are considered strong absorbers of moisture and hence there
existed the possibility that hydrogen peroxide might become trapped in the porous textiles.
Unfortunately, the peroxide concentration in the chamber during the later stages of aeration
cycles was below the reliable lower limit of detection of the ATI sensors (50 ppm). As
expected, however, it did appear that the hydrogen peroxide concentration dropped more slowly
when aerating large numbers of textile samples compared with an empty chamber.
The aeration phase at the end of the VHP® exposure cycle was designed to be sufficient
to remove most of the hydrogen peroxide vapor to a safe level (below 1 ppm). Indeed, the
peroxide concentration measured using the Dräger tubes at the end of each run, by means of
inserting the tubes into a small opening in the chamber was found to be well below the 1 ppm
level, typically 100 ppb, which is the lower detection limit of the Dräger tubes. Once the

89
aeration cycle was completed and the enclosure opened, the Dräger CMS sensor was inserted
and peroxide concentrations were measured during harvesting of the specimens.
Notwithstanding the low macroscopic concentration of hydrogen peroxide after aeration,
mechanical disturbance of the specimens during their harvesting (at the end of the final aeration
phase of the decontamination cycle) resulted in a detectable release of sorbed hydrogen
peroxide/organic peroxide vapor into the air. This was up to a macroscopic concentration of
greater than 2 ppm (i.e., exceeding the upper detection limit of the Dräger CMS, but still within
the noise region of the ATI sensors).
Representative percentage weight change data before and after hydrogen peroxide
exposure are shown in Fig. 36 for warp specimens of wool, nylon, polyester and Nomex®
intended for tear testing. A similar trend of increase in weight was also observed for the tensile
specimens measured immediately after VHP® exposure. As seen in Fig. 36, the percentage
weight changes observed for the polyester samples exhibited no statistically significant
differences, < ±1%, for the conditions investigated. This is consistent with the hydrophobic
behavior of polyester discussed in section 2.2.2. The wool, nylon and Nomex® samples all
gained weight after the VHP® treatments followed by aging in laboratory air. The wool
samples exhibited the largest weight gains with approximately 1.5% gain in weight after 1 VHP®
treatment and 1 day of laboratory air aging and over 8% weight gain after 10 VHP® cycles and
14 days aging in laboratory air. The weight gains of nylon and Nomex® were approximately
half those of wool.
However, quite different results were seen for samples aged in a vacuum desiccator after
exposure to hydrogen peroxide vapor. All samples exhibited weight losses after a single VHP®
treatment followed by aging in a vacuum desiccator for either 1 or 14 days. Aging samples in a
90
vacuum desiccator after 10 VHP® treatments showed no statistically significant change in weight
for polyester and Nomex®, whereas nylon and wool exhibited reduced increases in weight of
only about 1% and 2%, respectively. A significant part of the weight gains found after
laboratory air aging were probably due to the presence of residual moisture in the fibers due to
(1) absorption of water vapor directly from the environment and/or (2) decomposition of
absorbed hydrogen peroxide to water and oxygen.
Decreases in weight after a single VHP® treatment followed by vacuum aging are
consistent with the weight gain being primarily absorbed moisture that is subsequently removed
by the vacuum treatment. Net increases in the weight of wool and nylon after 10 VHP®
treatments followed by vacuum aging are consistent with chemical oxidation of the polymers.
In addition, the appearance of the wool samples after 10 VHP® cycles exhibited a slight
discoloration from the hydrogen peroxide treatment.
In general, further laboratory air aging increased the weight gain, particularly in the case
of wool. Similar behavior was noted after 10 VHP® cycles; however as might be expected the
weight gains were larger but remained below 6% for one day and 10% for fourteen days of post
exposure aging. A one cycle of VHP® exposure, followed by post-exposure aging under
vacuum resulted in a weight loss. In contrast, 10 VHP® cycles, followed by vacuum aging
generally tended to produce small weight gains with the possible exception of Nomex® which
showed some tendency to lose weight, although a great deal of scatter is noted in the latter case.
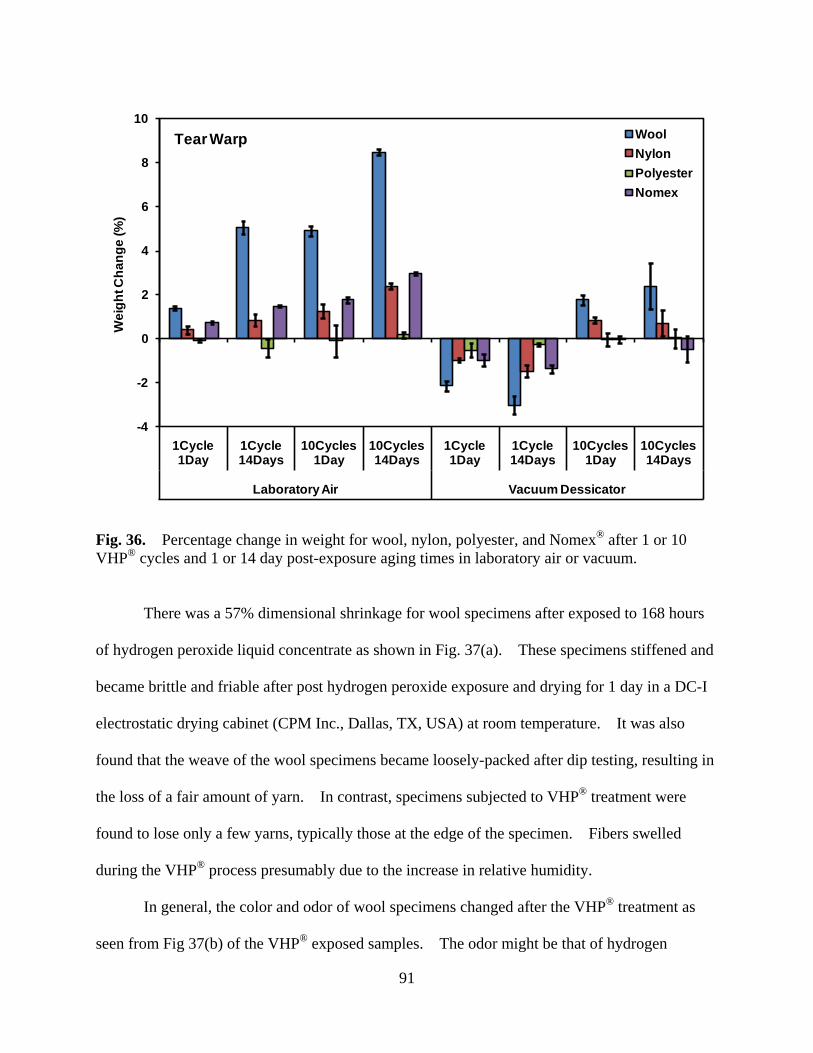
91
Fig. 36. Percentage change in weight for wool, nylon, polyester, and Nomex® after 1 or 10 VHP® cycles and 1 or 14 day post-exposure aging times in laboratory air or vacuum.
There was a 57% dimensional shrinkage for wool specimens after exposed to 168 hours
of hydrogen peroxide liquid concentrate as shown in Fig. 37(a). These specimens stiffened and
became brittle and friable after post hydrogen peroxide exposure and drying for 1 day in a DC-I
electrostatic drying cabinet (CPM Inc., Dallas, TX, USA) at room temperature. It was also
found that the weave of the wool specimens became loosely-packed after dip testing, resulting in
the loss of a fair amount of yarn. In contrast, specimens subjected to VHP® treatment were
found to lose only a few yarns, typically those at the edge of the specimen. Fibers swelled
during the VHP® process presumably due to the increase in relative humidity.
In general, the color and odor of wool specimens changed after the VHP® treatment as
seen from Fig 37(b) of the VHP® exposed samples. The odor might be that of hydrogen
-4
-2
0
2
4
6
8
10
1Cycle 1Day
1Cycle 14Days
10Cycles 1Day
10Cycles 14Days
1Cycle 1Day
1Cycle 14Days
10Cycles 1Day
10Cycles 14Days
Laboratory Air Vacuum Dessicator
Wei
ght C
hang
e (%
)WoolNylonPolyesterNomex
Tear Warp

92
peroxide and/or other organic peroxides since these have quite similar aromas [187-189].
Furthermore, after removal of the exposed specimens from the chamber, the specimens were
found to have the ability to bleach contacting surfaces, which suggests the presence of significant
residual hydrogen peroxide and/or organic peroxide. The aroma change might simply be the
result of the sorption of moisture (peroxide/water). Indeed, it was observed that the aroma was
removed after aging in a vacuum desiccator. However, the color change would seem to imply
some structural change(s), at least near the fiber surface. A similar odor was also noticed for
the VHP® exposed man-made fibers examined, but the odor was much less marked than for the
wool. Furthermore, unlike the wool, this odor was not accompanied by a color change.
(a) (b)
Fig. 37. Physical changes of wool fabrics after VHP® and hydrogen peroxide liquid concentrate exposure: (a) a ~ 57% dimensional shrinkage on the 168 hours liquid exposure; and (b) color change for samples exposed to 10 VHP®.
168HoursDip
24HoursDip
As-Received As-Received24
HoursDip
10VHP
Cycles
Tensile Specimens Tear Specimens
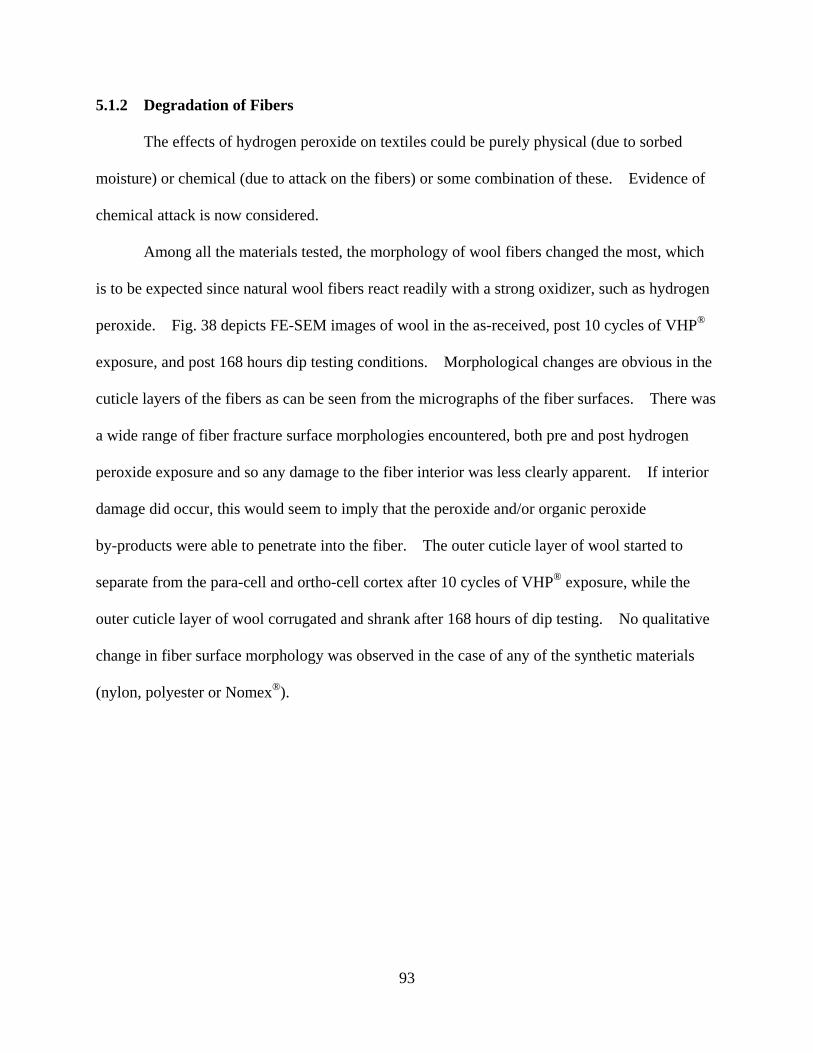
93
5.1.2 Degradation of Fibers
The effects of hydrogen peroxide on textiles could be purely physical (due to sorbed
moisture) or chemical (due to attack on the fibers) or some combination of these. Evidence of
chemical attack is now considered.
Among all the materials tested, the morphology of wool fibers changed the most, which
is to be expected since natural wool fibers react readily with a strong oxidizer, such as hydrogen
peroxide. Fig. 38 depicts FE-SEM images of wool in the as-received, post 10 cycles of VHP®
exposure, and post 168 hours dip testing conditions. Morphological changes are obvious in the
cuticle layers of the fibers as can be seen from the micrographs of the fiber surfaces. There was
a wide range of fiber fracture surface morphologies encountered, both pre and post hydrogen
peroxide exposure and so any damage to the fiber interior was less clearly apparent. If interior
damage did occur, this would seem to imply that the peroxide and/or organic peroxide
by-products were able to penetrate into the fiber. The outer cuticle layer of wool started to
separate from the para-cell and ortho-cell cortex after 10 cycles of VHP® exposure, while the
outer cuticle layer of wool corrugated and shrank after 168 hours of dip testing. No qualitative
change in fiber surface morphology was observed in the case of any of the synthetic materials
(nylon, polyester or Nomex®).

94
Fig. 38. Secondary electron images for wool fibers: (i) and (ii) as-received; (iii) and (iv) 10 VHP® cycles (450ppm); (v) and (vi) 168 hours dip exposure (35%).
In order to perform FE-SEM studies, it was necessary to eliminate residual moisture
through storage for 1 day in a vacuum desiccator. Hence, whereas the weight change
measurements are truly for laboratory air exposure, fiber diameter measurements invariably and
unavoidably include at least one day of vacuum exposure which makes interpretation of these
data highly ambiguous. The fiber diameter data reported here are for specimens subjected to 10
VHP® cycles at 450 ppm, followed by 14 days of aging in either laboratory air or a vacuum
desiccator. A shrinkage of 1 ~ 7% in fiber diameter is observed as shown in Fig. 39.
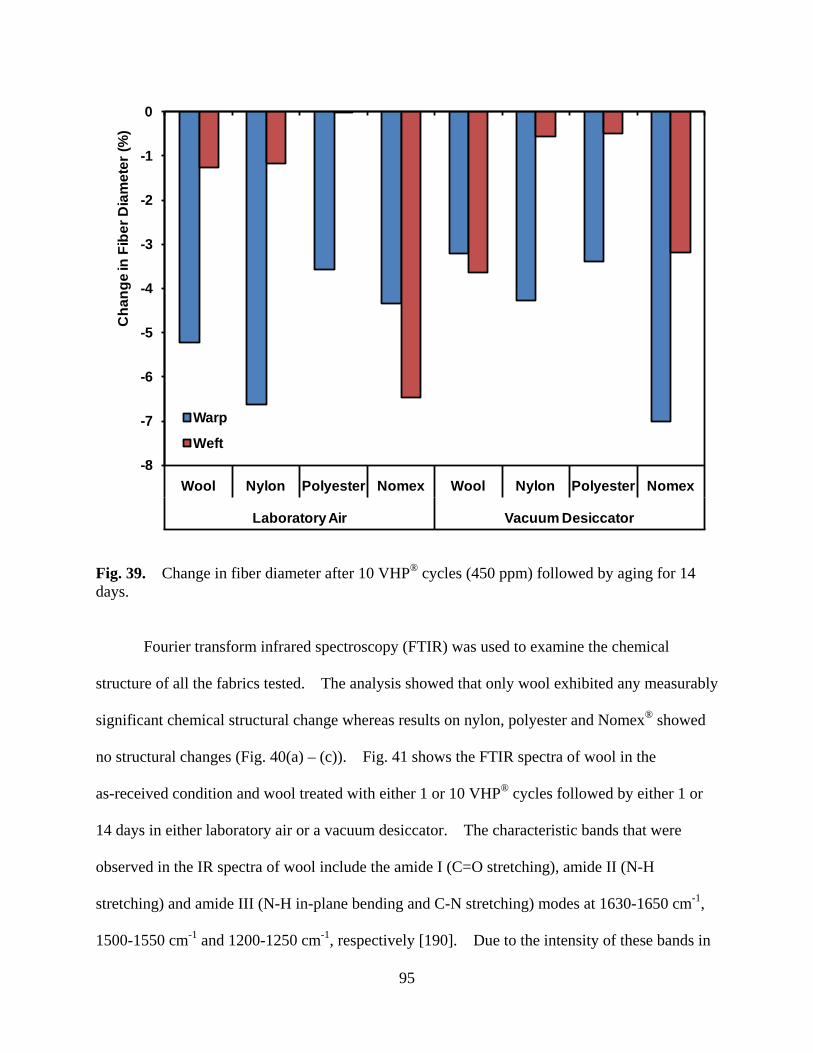
95
Fig. 39. Change in fiber diameter after 10 VHP® cycles (450 ppm) followed by aging for 14 days.
Fourier transform infrared spectroscopy (FTIR) was used to examine the chemical
structure of all the fabrics tested. The analysis showed that only wool exhibited any measurably
significant chemical structural change whereas results on nylon, polyester and Nomex® showed
no structural changes (Fig. 40(a) – (c)). Fig. 41 shows the FTIR spectra of wool in the
as-received condition and wool treated with either 1 or 10 VHP® cycles followed by either 1 or
14 days in either laboratory air or a vacuum desiccator. The characteristic bands that were
observed in the IR spectra of wool include the amide I (C=O stretching), amide II (N-H
stretching) and amide III (N-H in-plane bending and C-N stretching) modes at 1630-1650 cm-1,
1500-1550 cm-1 and 1200-1250 cm-1, respectively [190]. Due to the intensity of these bands in
-8
-7
-6
-5
-4
-3
-2
-1
0
Wool Nylon Polyester Nomex Wool Nylon Polyester Nomex
Laboratory Air Vacuum Desiccator
Cha
nge
in F
iber
Dia
met
er (%
)
Warp
Weft
96
the as-received sample and the strong overlap of the amide I band with the water absorption
band, it is not possible using FTIR spectroscopy to discern small changes in protein
conformation as a result of VHP® treatment.
A distinctive new peak at around 1035 cm-1 is seen for the VHP® treated wool specimen
shown in Fig. 42 on the as-received wool and VHP® exposed wool. Although the existence of
the 1035 cm-1 peak was tenuous after 1 VHP® cycle, this peak was readily apparent with
repeated exposure (10 cycles). This new band is associated with the symmetric stretching of
S=O bonds of sulphinate or sulphinite and would appear to indicate the presence of oxidized
disulphides in wool [191-193]. Furthermore, the intensity of this band increases as the
exposure to VHP® increases, suggesting that disulphide groups in the wool keratin are
chemically oxidized by the hydrogen peroxide vapor. This type of damage to the crosslinks of
the protein backbone is consistent with the observed increased elongation to failure of the wool
fibers after VHP® exposure and possibly also the loss of tensile strength (see section 5.1.3)
[194,195]. Similar results were seen for the wool samples exposed to concentrated liquid
hydrogen peroxide by dip testing.

97
(a)
(b)
400900140019002400290034003900
Rel
ativ
e Tr
ansm
ittan
ce (%
)
Wavenumber (cm-1)
i
ii
iii
iv
v
vi
vii
viii
ix
400900140019002400290034003900
Rel
ativ
e Tr
ansm
ittan
ce (%
)
Wavenumber (cm-1)
i
ii
iii
iv
v
vi
vii
viii
ix

98
(c)
Fig. 40. FTIR spectra of (a) nylon, (b) polyester, and (c) Nomex® after 450 ppm VHP® exposure. (i) as-received; (ii) 1 VHP® cycle + 1 day vacuum desiccator; (iii) 1 VHP® cycle + 1 day laboratory air; (iv) 1 VHP® cycle + 14 days vacuum desiccator; (v) 1 VHP® cycle + 14 days laboratory air; (vi) 10 VHP® cycles + 1 day vacuum desiccator; (vii) 10 VHP® cycles + 1 day laboratory air; (viii) 10 VHP® cycles + 14 days vacuum; (ix) 10 VHP® cycles + 14 days laboratory air.
400900140019002400290034003900
Rel
ativ
e Tr
ansm
ittan
ce (%
)
Wavenumber (cm-1)
i
ii
iii
iv
v
vi
vii
viii
ix
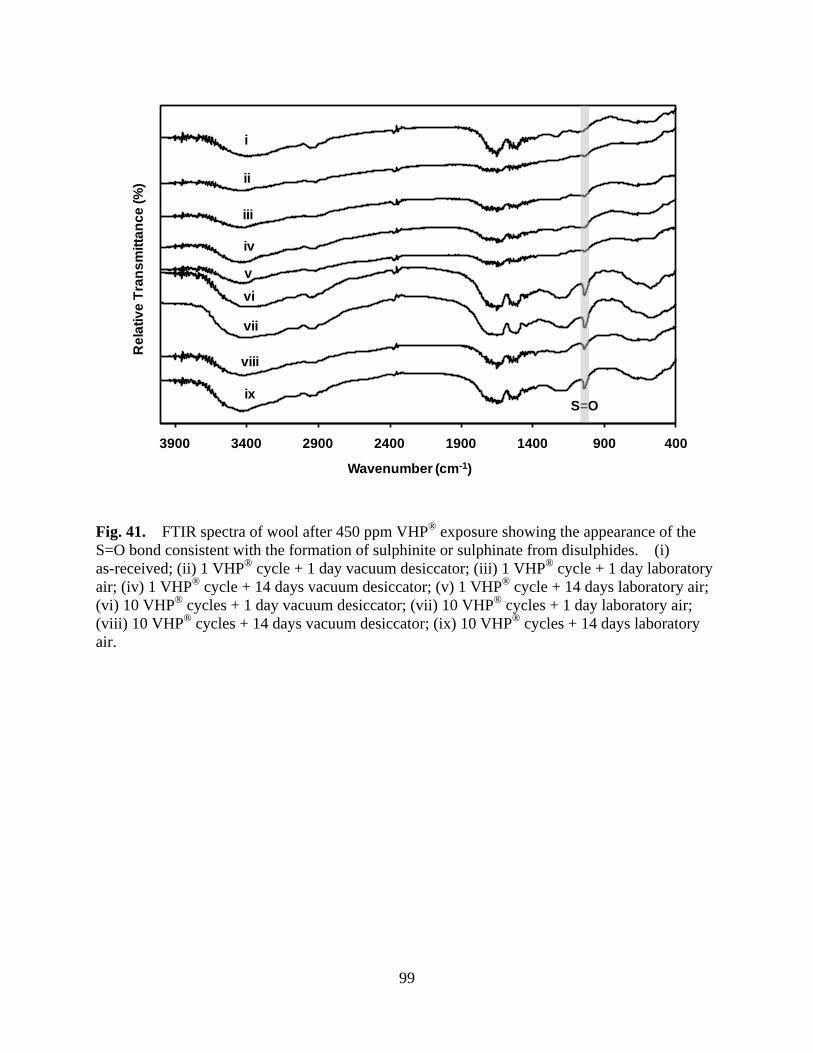
99
Fig. 41. FTIR spectra of wool after 450 ppm VHP® exposure showing the appearance of the S=O bond consistent with the formation of sulphinite or sulphinate from disulphides. (i) as-received; (ii) 1 VHP® cycle + 1 day vacuum desiccator; (iii) 1 VHP® cycle + 1 day laboratory air; (iv) 1 VHP® cycle + 14 days vacuum desiccator; (v) 1 VHP® cycle + 14 days laboratory air; (vi) 10 VHP® cycles + 1 day vacuum desiccator; (vii) 10 VHP® cycles + 1 day laboratory air; (viii) 10 VHP® cycles + 14 days vacuum desiccator; (ix) 10 VHP® cycles + 14 days laboratory air.
400900140019002400290034003900
Rel
ativ
e Tr
ansm
ittan
ce (%
)
Wavenumber (cm-1)
i
ii
iii
iv
vvi
vii
viii
ixS=O
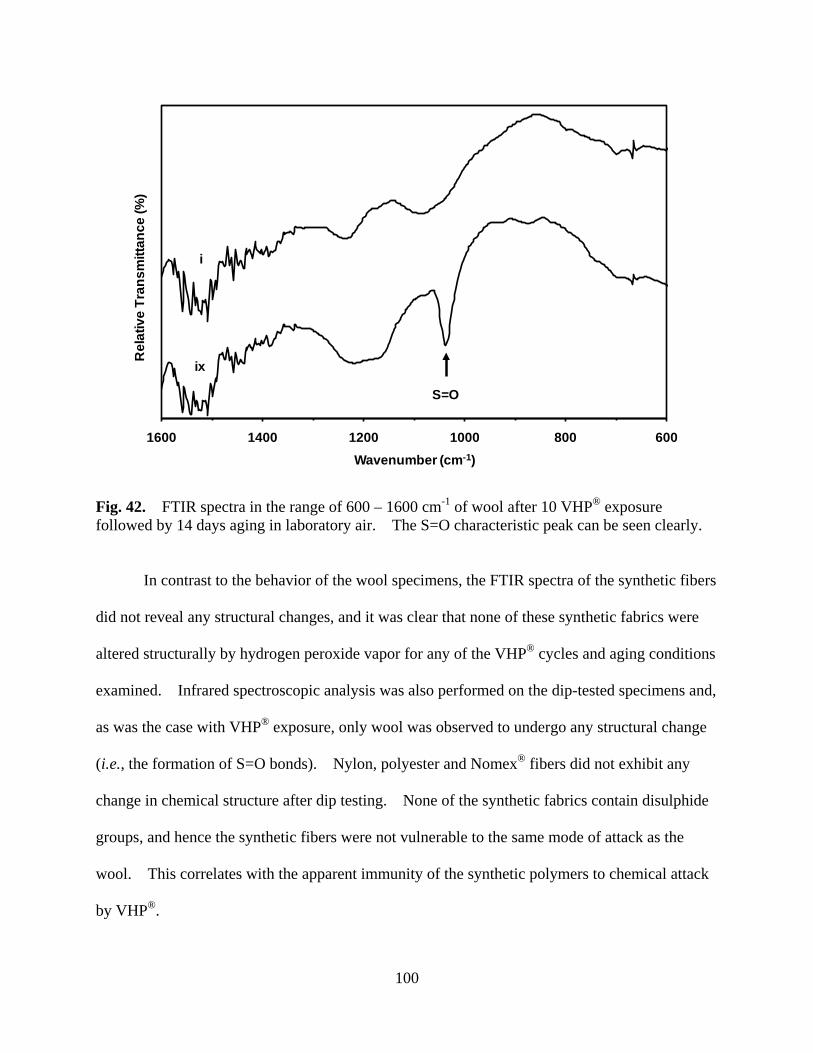
100
Fig. 42. FTIR spectra in the range of 600 – 1600 cm-1 of wool after 10 VHP® exposure followed by 14 days aging in laboratory air. The S=O characteristic peak can be seen clearly.
In contrast to the behavior of the wool specimens, the FTIR spectra of the synthetic fibers
did not reveal any structural changes, and it was clear that none of these synthetic fabrics were
altered structurally by hydrogen peroxide vapor for any of the VHP® cycles and aging conditions
examined. Infrared spectroscopic analysis was also performed on the dip-tested specimens and,
as was the case with VHP® exposure, only wool was observed to undergo any structural change
(i.e., the formation of S=O bonds). Nylon, polyester and Nomex® fibers did not exhibit any
change in chemical structure after dip testing. None of the synthetic fabrics contain disulphide
groups, and hence the synthetic fibers were not vulnerable to the same mode of attack as the
wool. This correlates with the apparent immunity of the synthetic polymers to chemical attack
by VHP®.
6008001000120014001600
Rel
ativ
e Tr
ansm
ittan
ce (%
)
Wavenumber (cm-1)
i
ix
S=O

101
Raman spectroscopy was performed on the exposed wool specimens in order to more
clearly observe any changes in the amide bands upon exposure to VHP®. It can be seen from
Fig. 43(a) that the amide I and III bands corresponding to wavenumbers at 1630~1650 cm-1 and
1200~1250 cm-1 do not display any change after 10 cycles of VHP® exposure or 168 hours of dip
testing. As noted in the FTIR experiments, a distinct peak at 1035cm-1 which corresponds with
the formation of S=O bonds after hydrogen peroxide treatment was also observed in the Raman
spectra. In addition, peaks at 1450cm-1 were assigned to C-H bending, and peaks at 890~960
cm-1 corresponded with a C-C backbone vibration [196-198]. A high wavenumber Raman
spectrum of wool, shown in Fig. 43(b), clearly shows C-H stretching. Fig. 44 depicts Raman
spectra over the wavenumber range 400 and 3500 cm-1. In the case of the as-received material,
a broad fluorescence feature, probably associated with an organic finish on the as-received wool
surface dominates the spectrum. The intensity of this fluorescence decreases after 10 cycles of
VHP® exposure, consistent with the observed yellowing of the wool specimens.
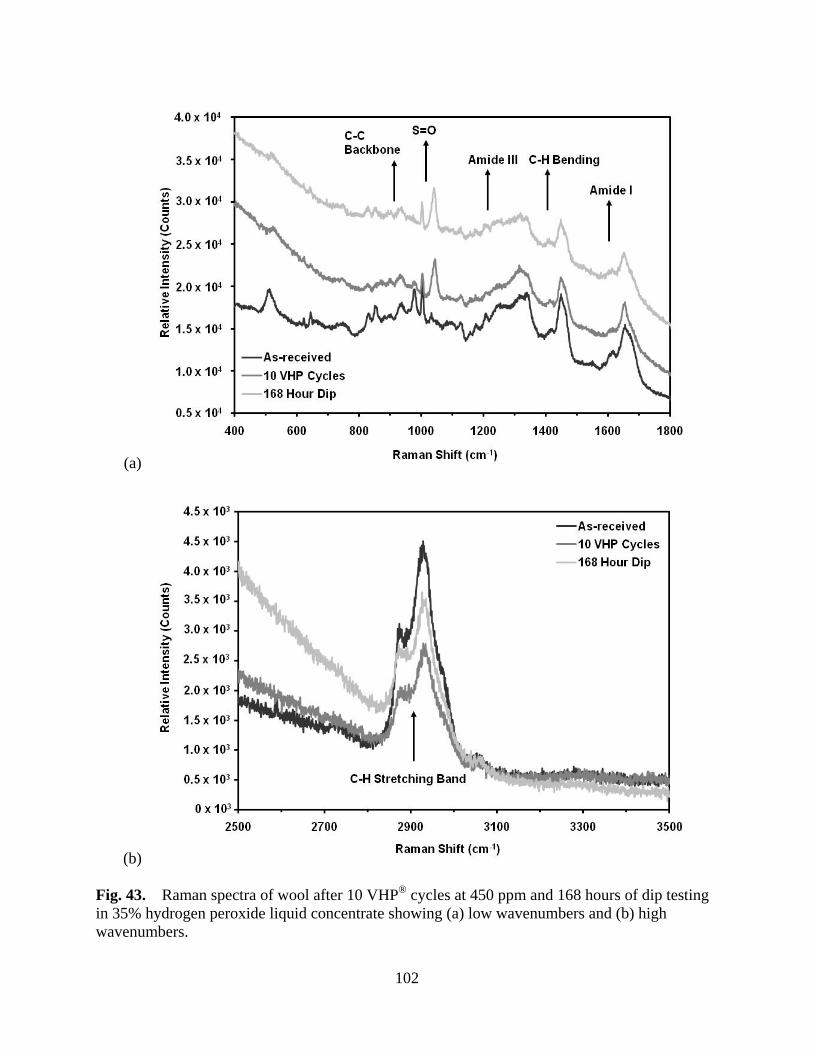
102
(a)
(b)
Fig. 43. Raman spectra of wool after 10 VHP® cycles at 450 ppm and 168 hours of dip testing in 35% hydrogen peroxide liquid concentrate showing (a) low wavenumbers and (b) high wavenumbers.
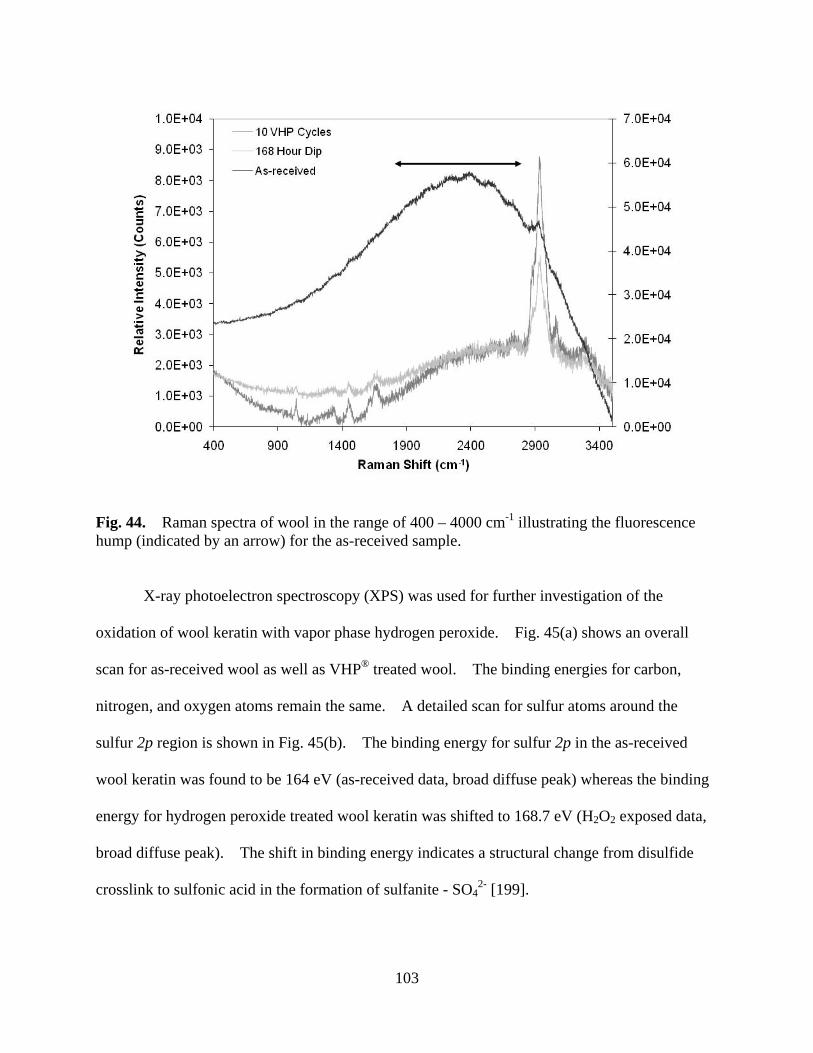
103
Fig. 44. Raman spectra of wool in the range of 400 – 4000 cm-1 illustrating the fluorescence hump (indicated by an arrow) for the as-received sample.
X-ray photoelectron spectroscopy (XPS) was used for further investigation of the
oxidation of wool keratin with vapor phase hydrogen peroxide. Fig. 45(a) shows an overall
scan for as-received wool as well as VHP® treated wool. The binding energies for carbon,
nitrogen, and oxygen atoms remain the same. A detailed scan for sulfur atoms around the
sulfur 2p region is shown in Fig. 45(b). The binding energy for sulfur 2p in the as-received
wool keratin was found to be 164 eV (as-received data, broad diffuse peak) whereas the binding
energy for hydrogen peroxide treated wool keratin was shifted to 168.7 eV (H2O2 exposed data,
broad diffuse peak). The shift in binding energy indicates a structural change from disulfide
crosslink to sulfonic acid in the formation of sulfanite - SO42- [199].

104
(a)
(b)
Fig. 45. XPS spectra for wool in the conditions indicated: (a) overview scan and (b) detailed scan in the sulfur atom region.

105
5.1.3 Mechanical Properties
Tensile and tear testing were performed to study the effect on the mechanical properties
of moisture and possible chemical attack by hydrogen peroxide. Four mechanical properties,
tensile strength, elongation to failure, maximum tear strength, and average tear strength were
evaluated for all fabrics. Furthermore, mechanical properties are categorized and reported for
the warp and weft directions due to the anisotropic materials properties for textile fabrics.
Statistical observations of the mechanical properties have been correlated with the physical and
structural changes discussed in previous sections.
Although high quality textile materials were procured as noted previously, the
as-received fabrics were anisotropic, inevitably of somewhat variable weave, and sensitive to
ambient humidity. All of these factors can complicate the interpretation of the results due to: a)
variation both within each batch and from batch to batch, b) ambient humidity changes from day
to day and c) the variability of the tensile testing results due to small differences in sample
alignment relative to the warp and weft directions. A mechanical property variability study
using a nine-batch sample variability experiment on as-received wool (the most variable
material) and Nomex® (the least variable material) as the reference material was conducted, to
ascertain the effect of these factors, focusing on tensile properties. The batch to batch variation
of the tensile properties of as-received wool and Nomex® is shown in Fig. 46 and Fig. 47,
respectively, and it is clear that any such variation (which ipso facto also incorporates day to
day) is fairly small.
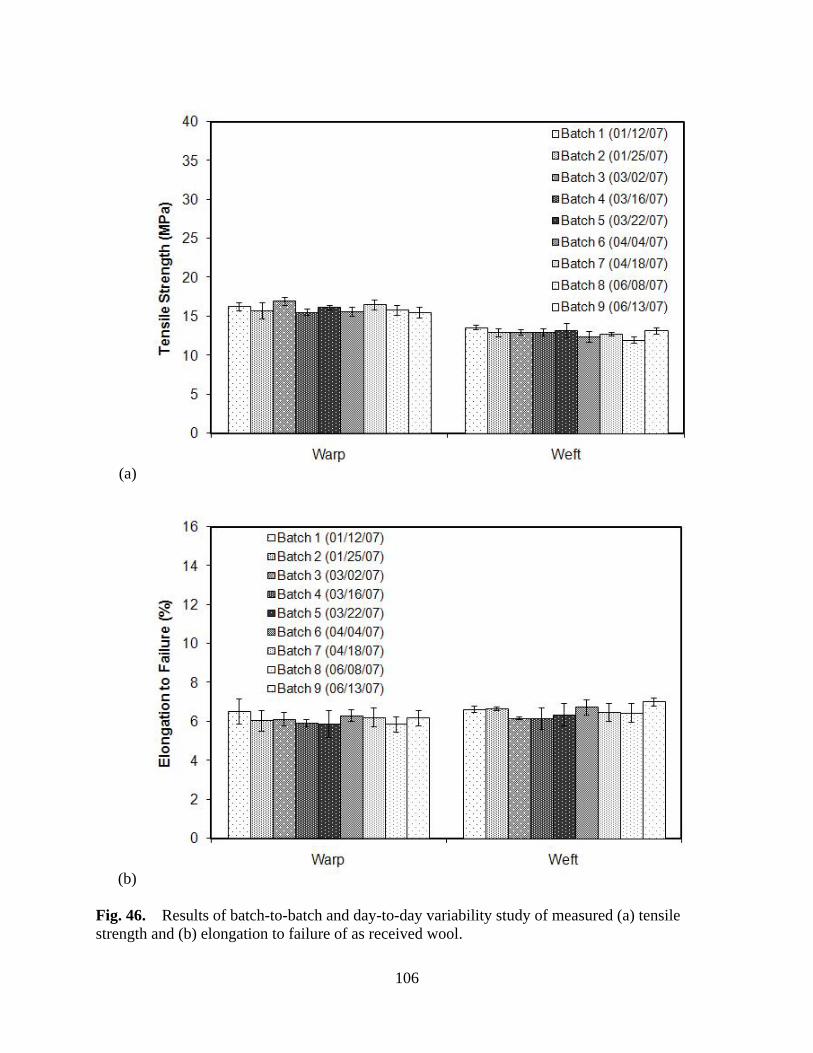
106
(a)
(b)
Fig. 46. Results of batch-to-batch and day-to-day variability study of measured (a) tensile strength and (b) elongation to failure of as received wool.

107
(a)
(b)
Fig. 47. Results of batch-to-batch and day-to-day variability study of measured (a) tensile strength and (b) elongation to failure of as received Nomex®.

108
The effects of VHP® exposure on the tensile strength and elongation to failure for
samples oriented to tensile test either the warp or the weft fibers are shown in Figs. 48 – 51 for
wool, nylon, polyester and Nomex®, respectively [24,30].
A general tendency for a decrease in tensile strength and an increase in elongation to
failure was observed for wool after VHP® exposure and laboratory air aging. After 10 VHP®
cycles plus one or fourteen days of aging, the decrease in tensile strength and the increase in
elongation to failure was about 30% in both cases. In the case of dip exposed wool samples, the
decrease in tensile strength was even more dramatic (in some cases exceeding a 60% decrease).
In the case of VHP® exposed and then vacuum aged wool, the extent of damage was somewhat
lower and did not follow any very obvious trend. In most cases however, the damage was not
fully reversed by post-exposure aging in vacuum. In general, with only laboratory aging in air,
increasing VHP® exposures led to decreases in the tensile strength and increases in the
elongation to failure for both orientations of wool samples. However, aging treatments in the
vacuum desiccator after VHP® exposure made the wool results less conclusive.
VHP® exposure was also found to have some effect on the tensile properties of the
synthetic polymers examined. This was generally less dramatic than in the case of wool.
Mechanical test data for the nylon samples (Fig. 49) yielded slight decreases in tensile strength
(~ 5 - 10%) for almost all test conditions and inconclusive results for changes in the elongation
to failure with no statistically significant trends. The polyester samples (Fig. 50) generally
exhibited decreases in tensile strength (~ 10 - 20%) as well as decreases in elongation to failure
(~ 10 - 20%) for most test conditions. Finally, the Nomex® samples (Fig. 51) exhibited no
consistent changes in tensile strength for all test conditions.

109
Fig. 48. Percentage change in tensile strength and elongation to failure of wool after indicated cycles of VHP® treatment at 450 ppm followed by days of aging conditions in either laboratory air or vacuum desiccator.
Fig. 49. Percentage change in tensile strength and elongation to failure of nylon after indicated cycles of VHP® treatment at 450 ppm followed by days of aging conditions in either laboratory air or vacuum desiccator.
-40
-30
-20
-10
0
10
20
30
40
1Cyc
le 1
Day
1Cyc
le 1
4Day
s
10C
ycle
s 1D
ay
10C
ycle
s 14
Day
s
1Cyc
le 1
Day
1Cyc
le 1
4Day
s
10C
ycle
s 1D
ay
10C
ycle
s 14
Day
s
1Cyc
le 1
Day
1Cyc
le 1
4Day
s
10C
ycle
s 1D
ay
10C
ycle
s 14
Day
s
1Cyc
le 1
Day
1Cyc
le 1
4Day
s
10C
ycle
s 1D
ay
10C
ycle
s 14
Day
s
Laboratory Air Vacuum Dessicator Laboratory Air Vacuum Dessicator
Tensile Strength Elongation to Failure
Perc
enta
ge C
hang
e (%
) WarpWeft
Wool
-40
-30
-20
-10
0
10
20
30
40
1Cyc
le 1
Day
1Cyc
le 1
4Day
s
10C
ycle
s 1D
ay
10C
ycle
s 14
Day
s
1Cyc
le 1
Day
1Cyc
le 1
4Day
s
10C
ycle
s 1D
ay
10C
ycle
s 14
Day
s
1Cyc
le 1
Day
1Cyc
le 1
4Day
s
10C
ycle
s 1D
ay
10C
ycle
s 14
Day
s
1Cyc
le 1
Day
1Cyc
le 1
4Day
s
10C
ycle
s 1D
ay
10C
ycle
s 14
Day
s
Laboratory Air Vacuum Dessicator Laboratory Air Vacuum Dessicator
Tensile Strength Elongation to Failure
Perc
enta
ge C
hang
e (%
) WarpWeft
Nylon
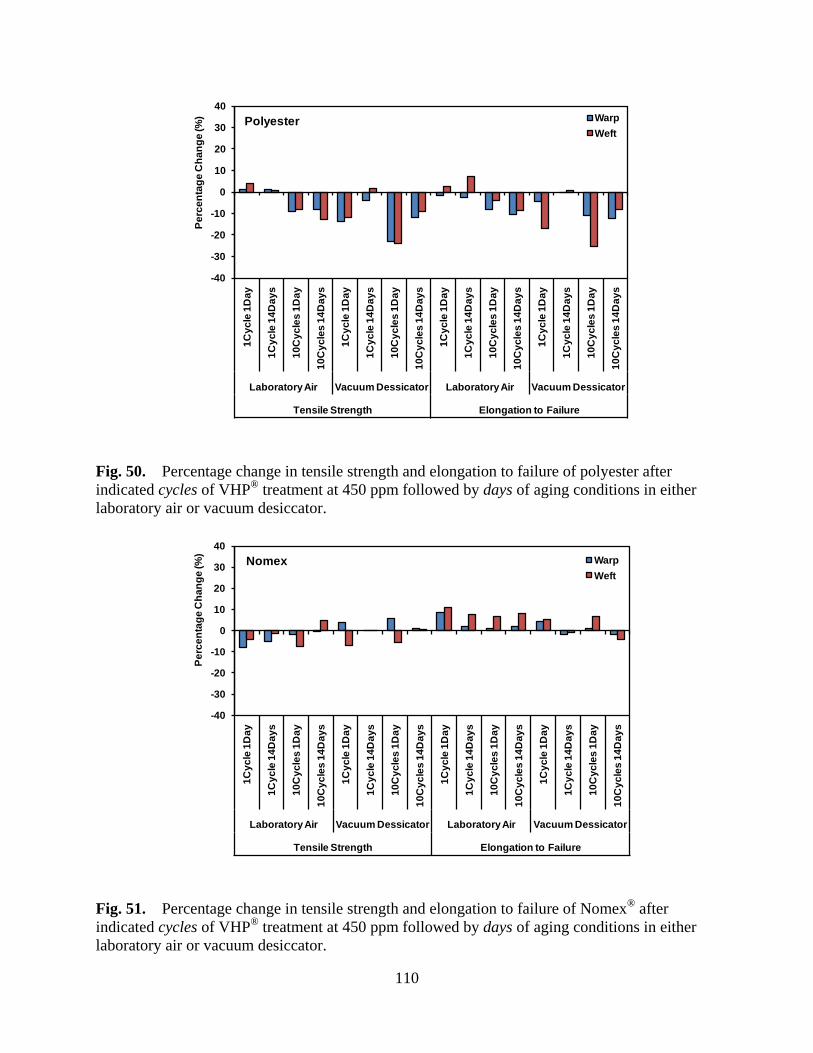
110
Fig. 50. Percentage change in tensile strength and elongation to failure of polyester after indicated cycles of VHP® treatment at 450 ppm followed by days of aging conditions in either laboratory air or vacuum desiccator.
Fig. 51. Percentage change in tensile strength and elongation to failure of Nomex® after indicated cycles of VHP® treatment at 450 ppm followed by days of aging conditions in either laboratory air or vacuum desiccator.
-40
-30
-20
-10
0
10
20
30
40
1Cyc
le 1
Day
1Cyc
le 1
4Day
s
10C
ycle
s 1D
ay
10C
ycle
s 14
Day
s
1Cyc
le 1
Day
1Cyc
le 1
4Day
s
10C
ycle
s 1D
ay
10C
ycle
s 14
Day
s
1Cyc
le 1
Day
1Cyc
le 1
4Day
s
10C
ycle
s 1D
ay
10C
ycle
s 14
Day
s
1Cyc
le 1
Day
1Cyc
le 1
4Day
s
10C
ycle
s 1D
ay
10C
ycle
s 14
Day
s
Laboratory Air Vacuum Dessicator Laboratory Air Vacuum Dessicator
Tensile Strength Elongation to Failure
Perc
enta
ge C
hang
e (%
) WarpWeft
Polyester
-40
-30
-20
-10
0
10
20
30
40
1Cyc
le 1
Day
1Cyc
le 1
4Day
s
10C
ycle
s 1D
ay
10C
ycle
s 14
Day
s
1Cyc
le 1
Day
1Cyc
le 1
4Day
s
10C
ycle
s 1D
ay
10C
ycle
s 14
Day
s
1Cyc
le 1
Day
1Cyc
le 1
4Day
s
10C
ycle
s 1D
ay
10C
ycle
s 14
Day
s
1Cyc
le 1
Day
1Cyc
le 1
4Day
s
10C
ycle
s 1D
ay
10C
ycle
s 14
Day
s
Laboratory Air Vacuum Dessicator Laboratory Air Vacuum Dessicator
Tensile Strength Elongation to Failure
Perc
enta
ge C
hang
e (%
) WarpWeft
Nomex
111
The effect of exposure of the various textiles to 35% liquid hydrogen peroxide was
investigated by leaving samples in the concentrated hydrogen peroxide solutions for periods of 1
day or 7 days (168 hours). The percentage changes in tensile strength and elongation to failure
for the various textile materials (warp and weft orientations) are shown in Figs. 52 and 53,
respectively [24,30]. The polyester samples exhibited minimal changes in tensile strength and
essentially no changes in elongation to failure after exposure to the liquid hydrogen peroxide.
Except for the 24 hour exposure with 1 day air aging treatment, the nylon samples also exhibited
minimal changes in tensile strength but slight increases in elongation to failure for most of the
test conditions after exposure to the liquid hydrogen peroxide. The reason for the large
decreases in tensile strength for the nylon samples subjected to a 24 hour exposure and 1 day air
aging treatment is unclear. Wool samples generally exhibited large decreases in tensile
strength. Although the Nomex® samples exhibited large decreases in tensile strength, the
Nomex® samples exhibited inconsistent elongation to failure results for these test conditions. In
general, in the case of dip exposure, when compared with VHP® exposure, there was less of a
clear distinction between the wool and some of the synthetic polymers examined (e.g., both
nylon and Nomex® suffered significant loss of tensile strength under some conditions).
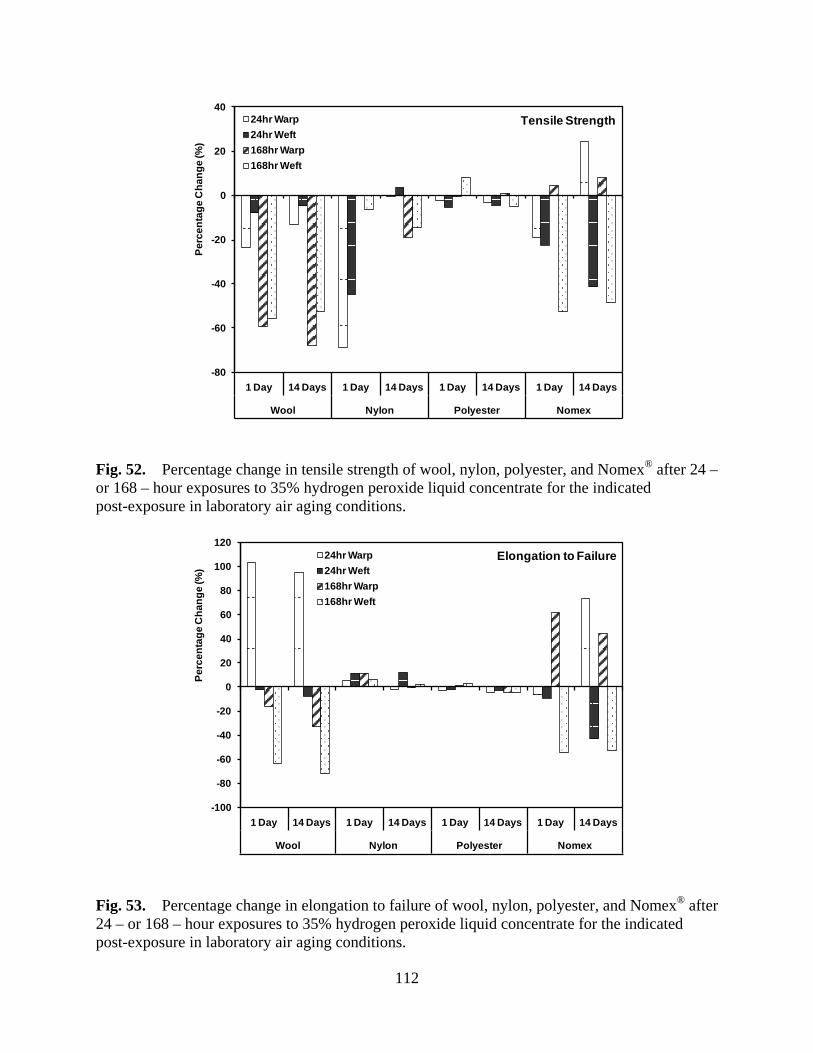
112
Fig. 52. Percentage change in tensile strength of wool, nylon, polyester, and Nomex® after 24 – or 168 – hour exposures to 35% hydrogen peroxide liquid concentrate for the indicated post-exposure in laboratory air aging conditions.
Fig. 53. Percentage change in elongation to failure of wool, nylon, polyester, and Nomex® after 24 – or 168 – hour exposures to 35% hydrogen peroxide liquid concentrate for the indicated post-exposure in laboratory air aging conditions.
-80
-60
-40
-20
0
20
40
1 Day 14 Days 1 Day 14 Days 1 Day 14 Days 1 Day 14 Days
Wool Nylon Polyester Nomex
Perc
enta
ge C
hang
e (%
)
24hr Warp24hr Weft168hr Warp168hr Weft
Tensile Strength
-100
-80
-60
-40
-20
0
20
40
60
80
100
120
1 Day 14 Days 1 Day 14 Days 1 Day 14 Days 1 Day 14 Days
Wool Nylon Polyester Nomex
Perc
enta
ge C
hang
e (%
)
24hr Warp24hr Weft168hr Warp168hr Weft
Elongation to Failure
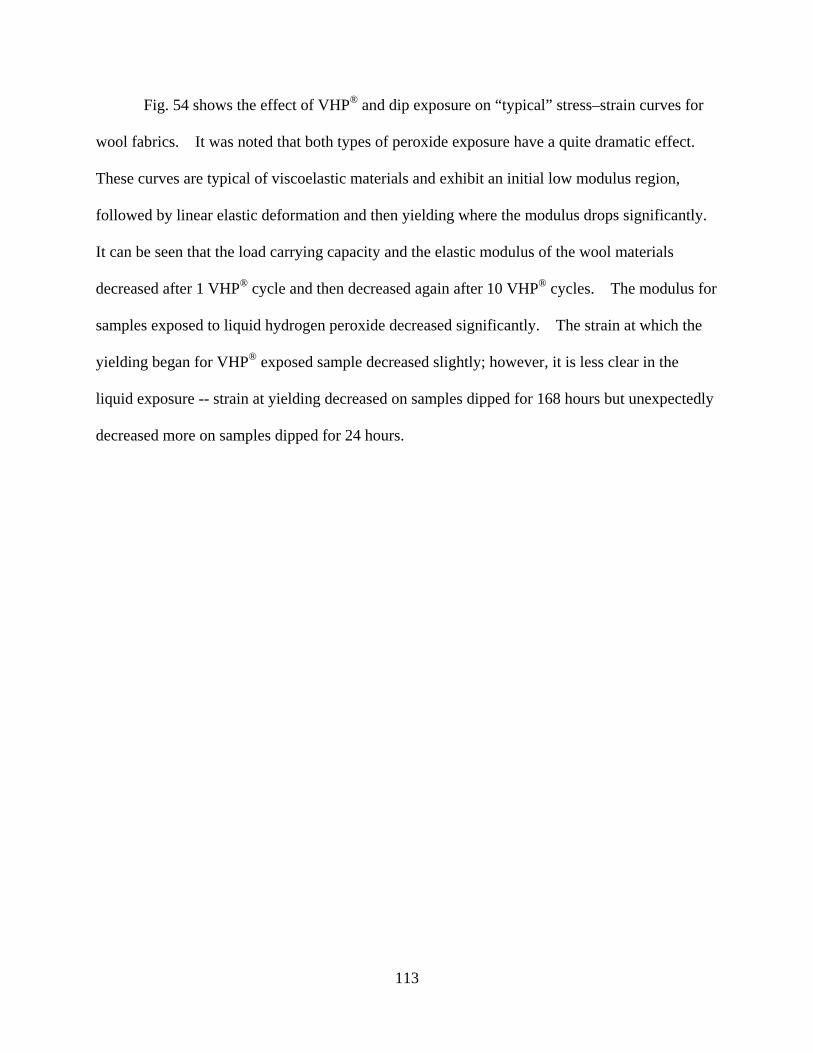
113
Fig. 54 shows the effect of VHP® and dip exposure on “typical” stress–strain curves for
wool fabrics. It was noted that both types of peroxide exposure have a quite dramatic effect.
These curves are typical of viscoelastic materials and exhibit an initial low modulus region,
followed by linear elastic deformation and then yielding where the modulus drops significantly.
It can be seen that the load carrying capacity and the elastic modulus of the wool materials
decreased after 1 VHP® cycle and then decreased again after 10 VHP® cycles. The modulus for
samples exposed to liquid hydrogen peroxide decreased significantly. The strain at which the
yielding began for VHP® exposed sample decreased slightly; however, it is less clear in the
liquid exposure -- strain at yielding decreased on samples dipped for 168 hours but unexpectedly
decreased more on samples dipped for 24 hours.
114
(a)
(b)
Fig. 54. Tensile stress vs. strain curves for wool (a) as-received and VHP® cycles at 450 ppm and (b) as-received and dip exposures to liquid hydrogen peroxide.
0
2
4
6
8
10
12
14
16
0 1 2 3 4 5 6 7 8 9 10
Stre
ss (M
Pa)
Strain (%)
As-received1VHP Cycle 14Days Lab AirAs-reveived10VHP Cycles 14 Days Lab Air
0
2
4
6
8
10
12
14
16
0 1 2 3 4 5 6 7 8 9 10
Stre
ss (M
Pa)
Strain (%)
As-received24 Hours DipAs-received168 Hours Dip
115
Transition metal ions, present in normal home or office type environmental soiling (and
presumably in the cabin environment) can catalyze reactions involving hydrogen peroxide
[200-202]. Given that the aroma of hydrogen peroxide and/or organic peroxide was apparent
from wool specimens after VHP® exposure, the decision was made to experiment with soiling
the tensile specimens prior to the VHP® exposure of wool (affected chemically by hydrogen
peroxide) and Nomex® (not attacked chemically by hydrogen peroxide). This simply involved
attaching the specimens to the air return grille in an office area for a period of fifteen days, prior
to VHP® exposure, for comparison with the as-received materials. FTIR spectra for pre-soiled
wool and VHP® exposed specimens indicated S=O stretching results similar to that observed
after hydrogen peroxide exposure of the as-received material, and no significant change was
found as a result of pre-soiling the samples. As expected, no change was observed for the
Nomex® specimens as a consequence of pre-soiling. Fig. 55 shows the effects of pre-soiling on
VHP® exposed plus laboratory air aged samples. In this instance, the comparison is between
soiled versus unsoiled, in both cases subject to subsequent VHP® exposure and laboratory air
aging. In order to provide a sense of scale, data on unsoiled samples, subjected to VHP®
exposure, followed by vacuum aging have also been included. As can be seen from the figure,
pre-soiling did not have a marked effect on the properties of VHP® exposed and laboratory air
aged samples. Indeed, the effect of pre-soiling was much less marked than that of post-test
vacuum aging versus air aging for unsoiled samples.

116
Fig. 55. Effects on the weight change and tensile properties of pre-soiled wool and Nomex® specimens after 10 VHP® cycles at 450 ppm followed by aging in either laboratory air or vacuum desiccator for 1 day or 14 days. (PS, LA = pre-soiled, laboratory air; US, LA = unsoiled, laboratory air; US, VD = unsoiled, vacuum desiccator)
-40
-30
-20
-10
0
10
20
30
40
PS US US PS US US PS US US PS US US PS US US PS US US
LA LA VD LA LA VD LA LA VD LA LA VD LA LA VD LA LA VD
Weight Change Tensile Strength Elongation to Failure
Weight Change Tensile Strength Elongation to Failure
Wool Nomex
Perc
enta
ge C
hang
e (%
)1 Day Aging14 Days Aging
117
ANOVA analysis of the overall dataset confirmed the statistical significance of the effect
of hydrogen peroxide exposure on wool specimens after 10 VHP® cycles. The tensile
properties of the synthetic fabrics showed no clear or systematic change after vapor hydrogen
peroxide exposure (post exposure properties were usually within ± 10% of the pre-VHP®
exposure data). As was discussed above, it has been found that VHP® exposure at a 450 ppm
enclosure concentration caused a loss of strength and increase in elongation to failure of the wool
specimens. Hence, the decision was made to determine if this behavior was replicated at lower
VHP® concentrations. Thus, a VHP® cycle with a 150 ppm enclosure concentration was
conducted for wool specimens (this concentration is close to that used for field trials of the use of
VHP® on aircraft [21,73].§§§ The S=O stretch is clearly visible after exposure of wool
specimens to 10 cycles of VHP® decontamination at 150 ppm, although this was weaker than the
S=O stretch observed after 450 ppm exposure. These data suggest that some oxidation of the
disulphide bonds occurs even at a reduced VHP® concentration. Fig. 56 shows the change in
the physical and tensile properties of wool after 10 VHP® cycles, comparing the 150 and 450
ppm concentrations. It was found from the weight change data that the 150 ppm exposed
specimens took up less moisture (hydrogen peroxide/water/or mixture of both) which resulted in
no color or odor change for the samples as a result of exposure. In these circumstances, the loss
of strength and increase in elongation to failure, apparent after exposure to a 450 ppm
concentration, was partially alleviated even for wool.
§§§ 150 ppm is around the minimum concentration that can be regarded as being well into the sporicidal range which begins at ~ 80 ppm.

118
Fig. 56. Effect on the weight change and tensile properties of wool after 10 VHP® cycles at different enclosure concentrations (i.e., 150 ppm and 450 ppm).
-40
-30
-20
-10
0
10
20
30
40
150 ppm 450 ppm 150 ppm 450 ppm 150 ppm 450 ppm
Weight Change Tensile Strength Elongation to Failure
Perc
enta
ge C
hang
e (%
)WarpWeft
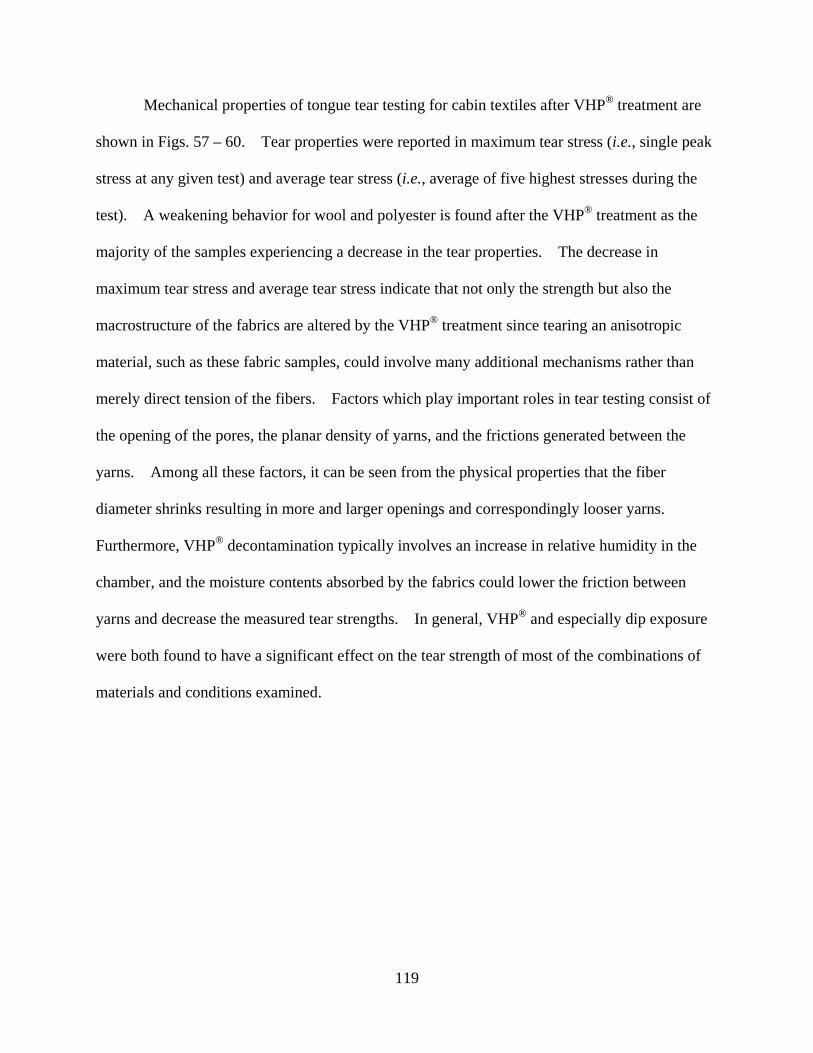
119
Mechanical properties of tongue tear testing for cabin textiles after VHP® treatment are
shown in Figs. 57 – 60. Tear properties were reported in maximum tear stress (i.e., single peak
stress at any given test) and average tear stress (i.e., average of five highest stresses during the
test). A weakening behavior for wool and polyester is found after the VHP® treatment as the
majority of the samples experiencing a decrease in the tear properties. The decrease in
maximum tear stress and average tear stress indicate that not only the strength but also the
macrostructure of the fabrics are altered by the VHP® treatment since tearing an anisotropic
material, such as these fabric samples, could involve many additional mechanisms rather than
merely direct tension of the fibers. Factors which play important roles in tear testing consist of
the opening of the pores, the planar density of yarns, and the frictions generated between the
yarns. Among all these factors, it can be seen from the physical properties that the fiber
diameter shrinks resulting in more and larger openings and correspondingly looser yarns.
Furthermore, VHP® decontamination typically involves an increase in relative humidity in the
chamber, and the moisture contents absorbed by the fabrics could lower the friction between
yarns and decrease the measured tear strengths. In general, VHP® and especially dip exposure
were both found to have a significant effect on the tear strength of most of the combinations of
materials and conditions examined.
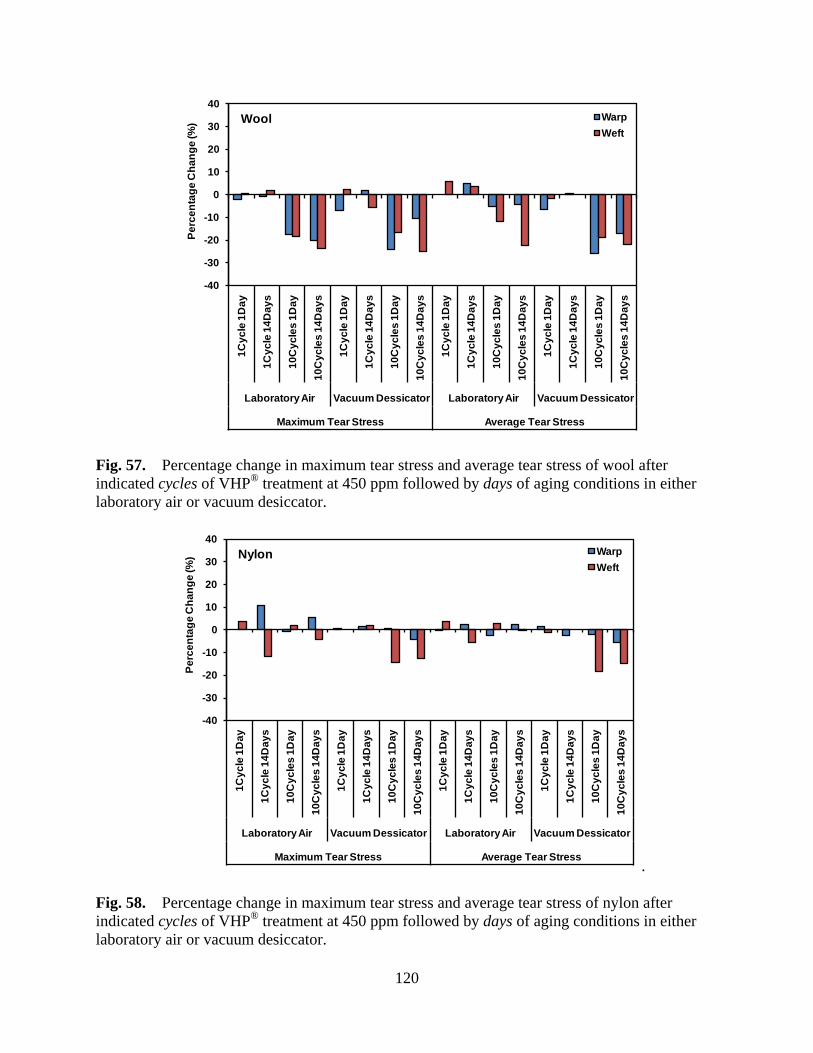
120
Fig. 57. Percentage change in maximum tear stress and average tear stress of wool after indicated cycles of VHP® treatment at 450 ppm followed by days of aging conditions in either laboratory air or vacuum desiccator.
.
Fig. 58. Percentage change in maximum tear stress and average tear stress of nylon after indicated cycles of VHP® treatment at 450 ppm followed by days of aging conditions in either laboratory air or vacuum desiccator.
-40
-30
-20
-10
0
10
20
30
40
1Cyc
le 1
Day
1Cyc
le 1
4Day
s
10C
ycle
s 1D
ay
10C
ycle
s 14
Day
s
1Cyc
le 1
Day
1Cyc
le 1
4Day
s
10C
ycle
s 1D
ay
10C
ycle
s 14
Day
s
1Cyc
le 1
Day
1Cyc
le 1
4Day
s
10C
ycle
s 1D
ay
10C
ycle
s 14
Day
s
1Cyc
le 1
Day
1Cyc
le 1
4Day
s
10C
ycle
s 1D
ay
10C
ycle
s 14
Day
s
Laboratory Air Vacuum Dessicator Laboratory Air Vacuum Dessicator
Maximum Tear Stress Average Tear Stress
Perc
enta
ge C
hang
e (%
) WarpWeft
Wool
-40
-30
-20
-10
0
10
20
30
40
1Cyc
le 1
Day
1Cyc
le 1
4Day
s
10C
ycle
s 1D
ay
10C
ycle
s 14
Day
s
1Cyc
le 1
Day
1Cyc
le 1
4Day
s
10C
ycle
s 1D
ay
10C
ycle
s 14
Day
s
1Cyc
le 1
Day
1Cyc
le 1
4Day
s
10C
ycle
s 1D
ay
10C
ycle
s 14
Day
s
1Cyc
le 1
Day
1Cyc
le 1
4Day
s
10C
ycle
s 1D
ay
10C
ycle
s 14
Day
s
Laboratory Air Vacuum Dessicator Laboratory Air Vacuum Dessicator
Maximum Tear Stress Average Tear Stress
Perc
enta
ge C
hang
e (%
) WarpWeft
Nylon

121
Fig. 59. Percentage change in maximum tear stress and average tear stress of polyester after indicated cycles of VHP® treatment at 450 ppm followed by days of aging conditions in either laboratory air or vacuum desiccator.
Fig. 60. Percentage change in maximum tear stress and average tear stress of Nomex® after indicated cycles of VHP® treatment at 450 ppm followed by days of aging conditions in either laboratory air or vacuum desiccator.
-40
-30
-20
-10
0
10
20
30
40
1Cyc
le 1
Day
1Cyc
le 1
4Day
s
10C
ycle
s 1D
ay
10C
ycle
s 14
Day
s
1Cyc
le 1
Day
1Cyc
le 1
4Day
s
10C
ycle
s 1D
ay
10C
ycle
s 14
Day
s
1Cyc
le 1
Day
1Cyc
le 1
4Day
s
10C
ycle
s 1D
ay
10C
ycle
s 14
Day
s
1Cyc
le 1
Day
1Cyc
le 1
4Day
s
10C
ycle
s 1D
ay
10C
ycle
s 14
Day
s
Laboratory Air Vacuum Dessicator Laboratory Air Vacuum Dessicator
Maximum Tear Stress Average Tear Stress
Perc
enta
ge C
hang
e (%
) WarpWeft
Polyester
-40
-30
-20
-10
0
10
20
30
40
1Cyc
le 1
Day
1Cyc
le 1
4Day
s
10C
ycle
s 1D
ay
10C
ycle
s 14
Day
s
1Cyc
le 1
Day
1Cyc
le 1
4Day
s
10C
ycle
s 1D
ay
10C
ycle
s 14
Day
s
1Cyc
le 1
Day
1Cyc
le 1
4Day
s
10C
ycle
s 1D
ay
10C
ycle
s 14
Day
s
1Cyc
le 1
Day
1Cyc
le 1
4Day
s
10C
ycle
s 1D
ay
10C
ycle
s 14
Day
s
Laboratory Air Vacuum Dessicator Laboratory Air Vacuum Dessicator
Maximum Tear Stress Average Tear Stress
Perc
enta
ge C
hang
e (%
) WarpWeft
Nomex
122
In order to determine whether the oxidation of wool by VHP® is reversible, specimens
exposed to VHP® were subjected to different aging times in laboratory air. Representative
FTIR spectra of wool samples exposed to 10 VHP® decontamination cycles and aged for
different times were acquired. The characteristic S=O symmetric stretch was still observed
clearly in the spectra even after 100 days of aging in laboratory air, indicating that the change
was irreversible (in the short to medium term at least).
Additional laboratory air aging for 10 cycle VHP® exposure specimens of all the cabin
textiles examined was conducted for 100 days in a conventional laboratory environment and Fig.
61 and Fig. 62 depict the tensile and tear properties of these materials. No clear trends towards
a return of tensile or tear mechanical properties to their pre-peroxide exposure (either vapor or
liquid) condition were observed after prolonged post-exposure aging (14 days in a vacuum
desiccator and 100 days in laboratory air). It is possible that samples could absorb/adsorb
ambient moisture during laboratory air aging. However, the extended vacuum aging should
have been quite effective in removing moisture and this is supported by the weight change data.
The lack of a clear beneficial effect due to prolonged evacuation (which should have removed
most of the moisture from the fibers) would tend to suggest that the direct effect of residual
adsorbed/absorbed moisture is not a major contributor to the loss of tear strength measured
immediately after VHP® exposure. Instead, the reversible geometrical change due to fiber
swelling and shrinkage and the irreversible chemical attack by hydrogen peroxide, in the case of
wool, would contribute to the loss of tear properties.
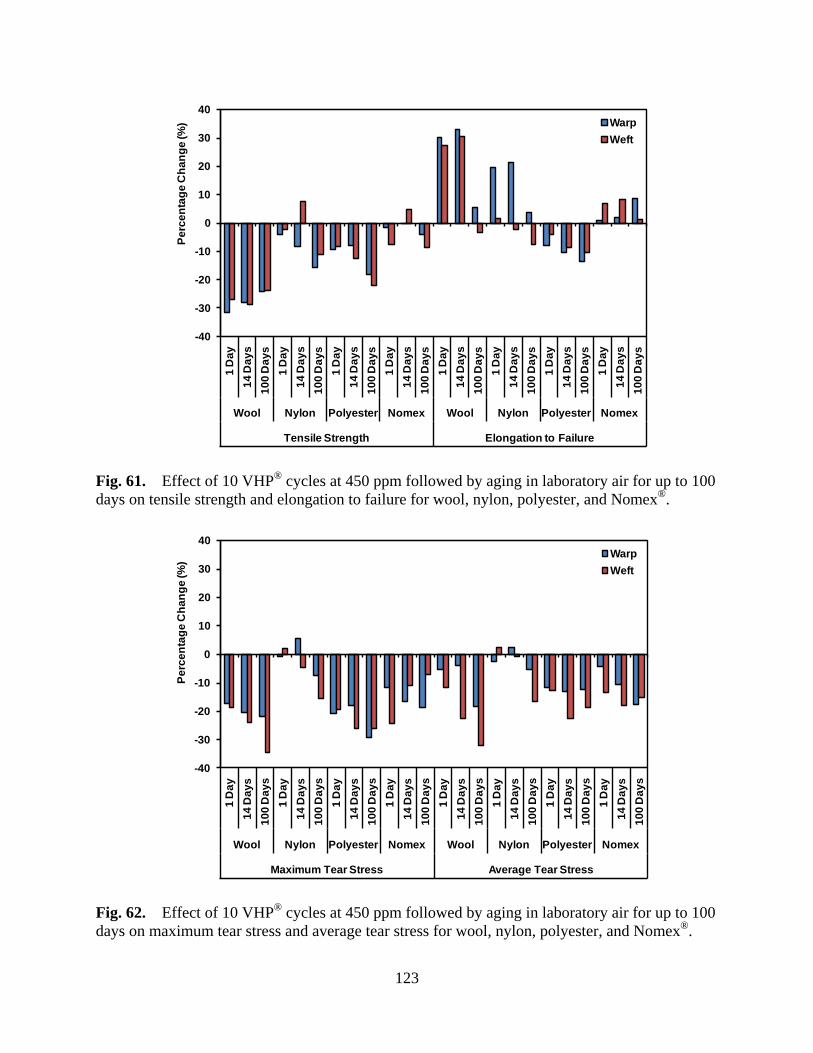
123
Fig. 61. Effect of 10 VHP® cycles at 450 ppm followed by aging in laboratory air for up to 100 days on tensile strength and elongation to failure for wool, nylon, polyester, and Nomex®.
Fig. 62. Effect of 10 VHP® cycles at 450 ppm followed by aging in laboratory air for up to 100 days on maximum tear stress and average tear stress for wool, nylon, polyester, and Nomex®.
-40
-30
-20
-10
0
10
20
30
40
1 D
ay14
Day
s10
0 D
ays
1 D
ay14
Day
s10
0 D
ays
1 D
ay14
Day
s10
0 D
ays
1 D
ay14
Day
s10
0 D
ays
1 D
ay14
Day
s10
0 D
ays
1 D
ay14
Day
s10
0 D
ays
1 D
ay14
Day
s10
0 D
ays
1 D
ay14
Day
s10
0 D
ays
Wool Nylon Polyester Nomex Wool Nylon Polyester Nomex
Tensile Strength Elongation to Failure
Perc
enta
ge C
hang
e (%
) WarpWeft
-40
-30
-20
-10
0
10
20
30
40
1 D
ay14
Day
s10
0 D
ays
1 D
ay14
Day
s10
0 D
ays
1 D
ay14
Day
s10
0 D
ays
1 D
ay14
Day
s10
0 D
ays
1 D
ay14
Day
s10
0 D
ays
1 D
ay14
Day
s10
0 D
ays
1 D
ay14
Day
s10
0 D
ays
1 D
ay14
Day
s10
0 D
ays
Wool Nylon Polyester Nomex Wool Nylon Polyester Nomex
Maximum Tear Stress Average Tear Stress
Perc
enta
ge C
hang
e (%
)
WarpWeft

124
5.1.4 Relationship between Physical/Structural Changes and Mechanical Properties
With the change in color, the loss of tensile strength, increase in elongation to failure, and
the oxidation of sulphur bonds to S=O, it would appear that wool fibers had degraded via an
oxidizing process during the decontamination treatment by hydrogen peroxide (see section 5.1.1,
5.1.2, and 5.1.3). To eliminate the possibility that trapped moisture (water and/or hydrogen
peroxide), rather than chemical/structural changes caused the change in tensile properties, wool
specimens were held in a vacuum desiccator after VHP® exposure for up to 14 days prior to
mechanical testing. The tensile data and ANOVA analysis of these data indicated no obvious
tendency for wool to regain its original properties. Hence, it would appear that the damage to
the wool induced by the decontamination process was irreversible, at least within the aging
conditions examined, and it is unlikely to have been the result of trapped moisture from the
decontamination process.
As was discussed previously, VHP® exposure caused both changes in fiber diameter with
associated changes in the fiber weave (see section 5.1.1 and Fig. 37) and, in the case of wool,
damage to the fiber surfaces (see section 5.1.2 and Fig. 38). Tearing of an anisotropic material,
such as the fabrics examined here, can be influenced by multiple factors [203-205]. These
factors include residual internal stresses on the fibers, opening of the pores between the yarns,
the planar density of yarns and the friction generated between the yarns. Among these factors,
it can be seen from the data in Section 5.1.2 that the fiber diameter shrank, which resulted in
loose yarns and more openings which may have contributed to the change in tear properties
observed as a result of VHP® exposure. Following initial dehumidification, VHP®
decontamination typically involves an increase in relative humidity in the chamber, once
injection of peroxide commences, and the moisture absorbed/adsorbed by the fabrics (see section

125
5.1.1 and Fig. 36) could lower the friction between the yarns, and hence, at least in part, account
for the decrease in apparent tear strength.
5.1.5 Significance for Decontamination Practice
A series of material compatibility checks have been performed on the airliner interior
textile materials to evaluate the feasibility of using VHP® decontamination technology on large
aircraft, as a baseline solution for routine microbial contamination of the airliner cabin during an
epidemic/pandemic, which implies repeated use of VHP® on the same cabin materials. The
effect of VHP® on the textile materials tested indicates that sorption of the hydrogen peroxide
vapor would limit the use of VHP®, using the types of cycles employed in the present work.
However, this limitation can probably be addressed by significantly increasing the aeration time
and the temperature. It should be recognized that the decontamination environment employed
in this research was more aggressive than that employed in typical practice, and yet, this work
indicated that only a microscopic amount of hydrogen peroxide vapor was adsorbed on the
fabrics. Furthermore, decontamination cycles developed for a 150 ppm enclosure concentration
did not result in any measurable release of hydrogen peroxide and/or organic peroxide during
sample harvesting or any apparent aroma within the limits of the present researchers’ olfactory
sensitivities.
By far, the most significant result of VHP® exposure was that this contributed to
chemical attack and surface degradation of wool. As was observed in the results of the
mechanical tests and the FTIR and Raman analyses, wool survived a single VHP®
decontamination cycle (450 ppm enclosure concentration) without significant structural and
physical damage. However, it suffered damage from 10 VHP® decontamination cycles at both
150 and 450 ppm enclosure concentrations. Hence, there appears to be significant issues that

126
need to be addressed before VHP® can be routinely used in the presence of wool. In contrast,
the issues observed with the synthetic materials are minor and perhaps relatively easy to address
through decontamination cycle changes (especially enhanced aeration). Furthermore, it should
be cautioned that with a microscopic amount of absorbed/adsorbed hydrogen peroxide vapor in
the textiles which resulted in the change of fiber diameter, it will be necessary to examine other
possible effects, for example the flammability of the material and the mechanical fatigue
properties, neither of which have been addressed in the present work.
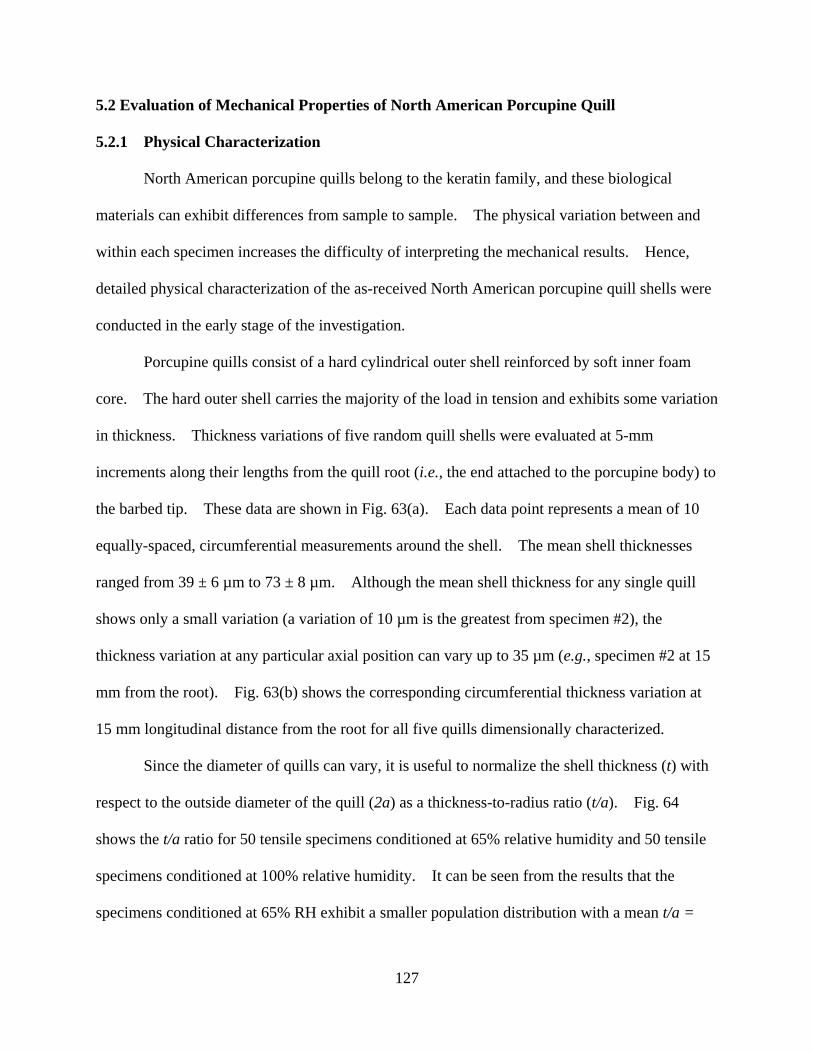
127
5.2 Evaluation of Mechanical Properties of North American Porcupine Quill
5.2.1 Physical Characterization
North American porcupine quills belong to the keratin family, and these biological
materials can exhibit differences from sample to sample. The physical variation between and
within each specimen increases the difficulty of interpreting the mechanical results. Hence,
detailed physical characterization of the as-received North American porcupine quill shells were
conducted in the early stage of the investigation.
Porcupine quills consist of a hard cylindrical outer shell reinforced by soft inner foam
core. The hard outer shell carries the majority of the load in tension and exhibits some variation
in thickness. Thickness variations of five random quill shells were evaluated at 5-mm
increments along their lengths from the quill root (i.e., the end attached to the porcupine body) to
the barbed tip. These data are shown in Fig. 63(a). Each data point represents a mean of 10
equally-spaced, circumferential measurements around the shell. The mean shell thicknesses
ranged from 39 ± 6 µm to 73 ± 8 µm. Although the mean shell thickness for any single quill
shows only a small variation (a variation of 10 µm is the greatest from specimen #2), the
thickness variation at any particular axial position can vary up to 35 µm (e.g., specimen #2 at 15
mm from the root). Fig. 63(b) shows the corresponding circumferential thickness variation at
15 mm longitudinal distance from the root for all five quills dimensionally characterized.
Since the diameter of quills can vary, it is useful to normalize the shell thickness (t) with
respect to the outside diameter of the quill (2a) as a thickness-to-radius ratio (t/a). Fig. 64
shows the t/a ratio for 50 tensile specimens conditioned at 65% relative humidity and 50 tensile
specimens conditioned at 100% relative humidity. It can be seen from the results that the
specimens conditioned at 65% RH exhibit a smaller population distribution with a mean t/a =
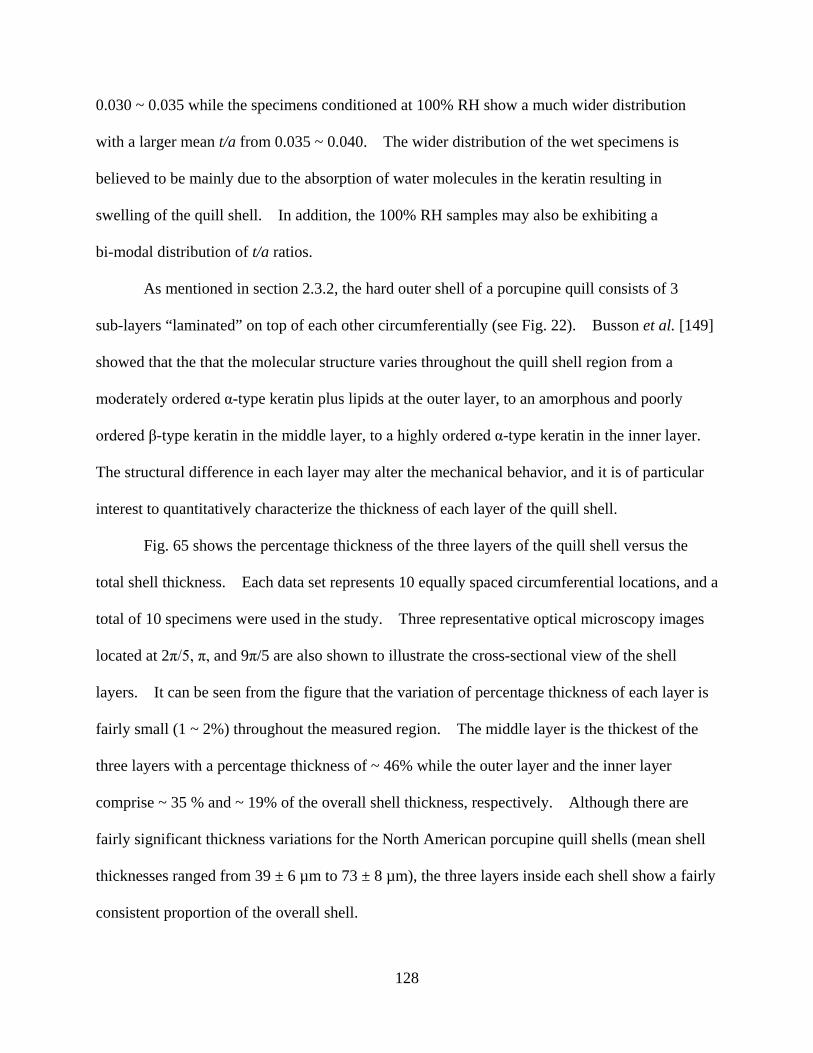
128
0.030 ~ 0.035 while the specimens conditioned at 100% RH show a much wider distribution
with a larger mean t/a from 0.035 ~ 0.040. The wider distribution of the wet specimens is
believed to be mainly due to the absorption of water molecules in the keratin resulting in
swelling of the quill shell. In addition, the 100% RH samples may also be exhibiting a
bi-modal distribution of t/a ratios.
As mentioned in section 2.3.2, the hard outer shell of a porcupine quill consists of 3
sub-layers “laminated” on top of each other circumferentially (see Fig. 22). Busson et al. [149]
showed that the that the molecular structure varies throughout the quill shell region from a
moderately ordered α-type keratin plus lipids at the outer layer, to an amorphous and poorly
ordered β-type keratin in the middle layer, to a highly ordered α-type keratin in the inner layer.
The structural difference in each layer may alter the mechanical behavior, and it is of particular
interest to quantitatively characterize the thickness of each layer of the quill shell.
Fig. 65 shows the percentage thickness of the three layers of the quill shell versus the
total shell thickness. Each data set represents 10 equally spaced circumferential locations, and a
total of 10 specimens were used in the study. Three representative optical microscopy images
located at 2π/5, π, and 9π/5 are also shown to illustrate the cross-sectional view of the shell
layers. It can be seen from the figure that the variation of percentage thickness of each layer is
fairly small (1 ~ 2%) throughout the measured region. The middle layer is the thickest of the
three layers with a percentage thickness of ~ 46% while the outer layer and the inner layer
comprise ~ 35 % and ~ 19% of the overall shell thickness, respectively. Although there are
fairly significant thickness variations for the North American porcupine quill shells (mean shell
thicknesses ranged from 39 ± 6 µm to 73 ± 8 µm), the three layers inside each shell show a fairly
consistent proportion of the overall shell.
129
(a) (b)
Fig. 63. Thickness variation of the porcupine quills in transverse direction showing (a) measurements and averages of each cross-sectional plane at a 5-mm increment from the root and (b) measurements of one cross-sectional plane (15 mm longitudinal distance from the root) with 10 circumferential positions, each separated by ~36°, clockwise.
0
20
40
60
80
Thic
knes
s (µ
m)
0
20
40
60
80
Thic
knes
s (µ
m)
0
20
40
60
80
Thic
knes
s (µ
m)
0
20
40
60
80
Thic
knes
s (µ
m)
0
20
40
60
80
0 5 10 15 20 25 30
Thic
knes
s (µ
m)
Longitudinal Distance from Root (mm)
0
20
40
60
80
Thic
knes
s (µ
m)
Specimen 1
0
20
40
60
80
Thic
knes
s (µ
m)
Specimen 2
0
20
40
60
80
Thic
knes
s (µ
m)
Specimen 3
0
20
40
60
80
Thic
knes
s (µ
m)
Specimen 4
0
20
40
60
80
1 2 3 4 5 6 7 8 9 10
Thic
knes
s (µ
m)
Circumferential Positions at 15mm Logitudianl Distance from Root
Specimen 5

130
Fig. 64. Specimen population distribution of the thickness versus radius ratio (t/a) on the mechanically tested porcupine quills conditioned at 65% RH and 100% RH.
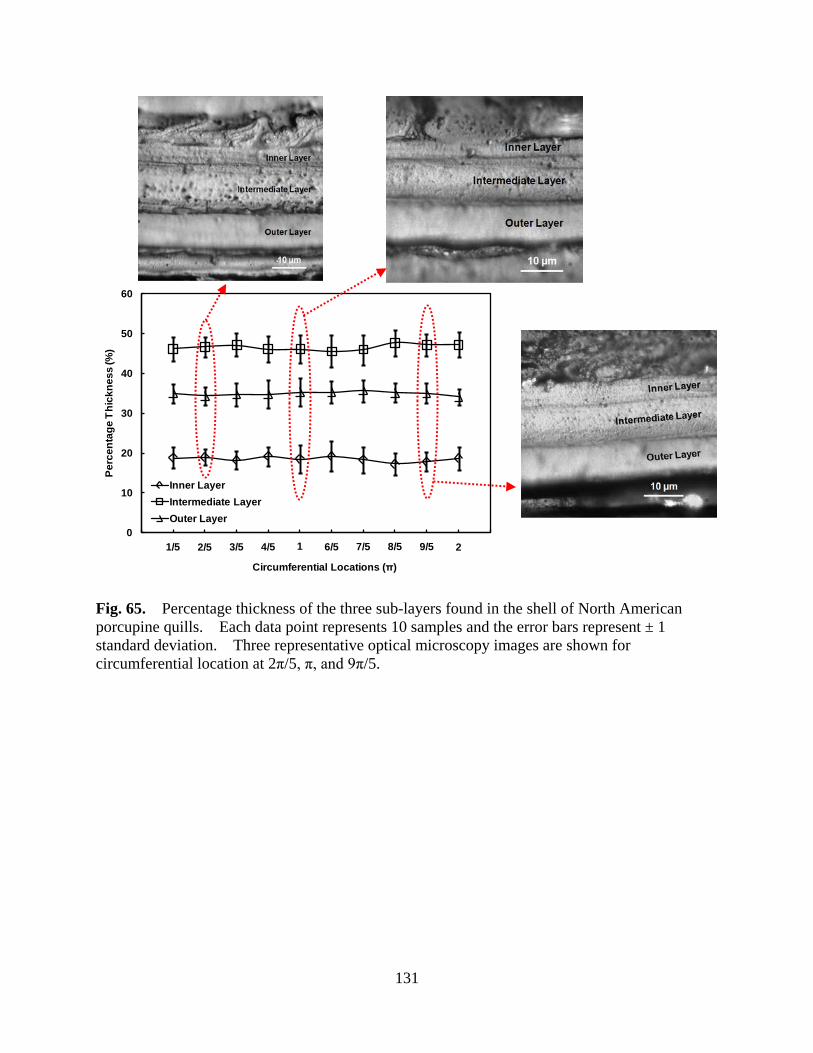
131
Fig. 65. Percentage thickness of the three sub-layers found in the shell of North American porcupine quills. Each data point represents 10 samples and the error bars represent ± 1 standard deviation. Three representative optical microscopy images are shown for circumferential location at 2π/5, π, and 9π/5.
0
10
20
30
40
50
60
Perc
enta
ge T
hick
ness
(%)
Circumferential Locations (π)
Inner LayerIntermediate LayerOuter Layer
1/5 2/5 3/5 4/5 1 6/5 7/5 8/5 9/5 2
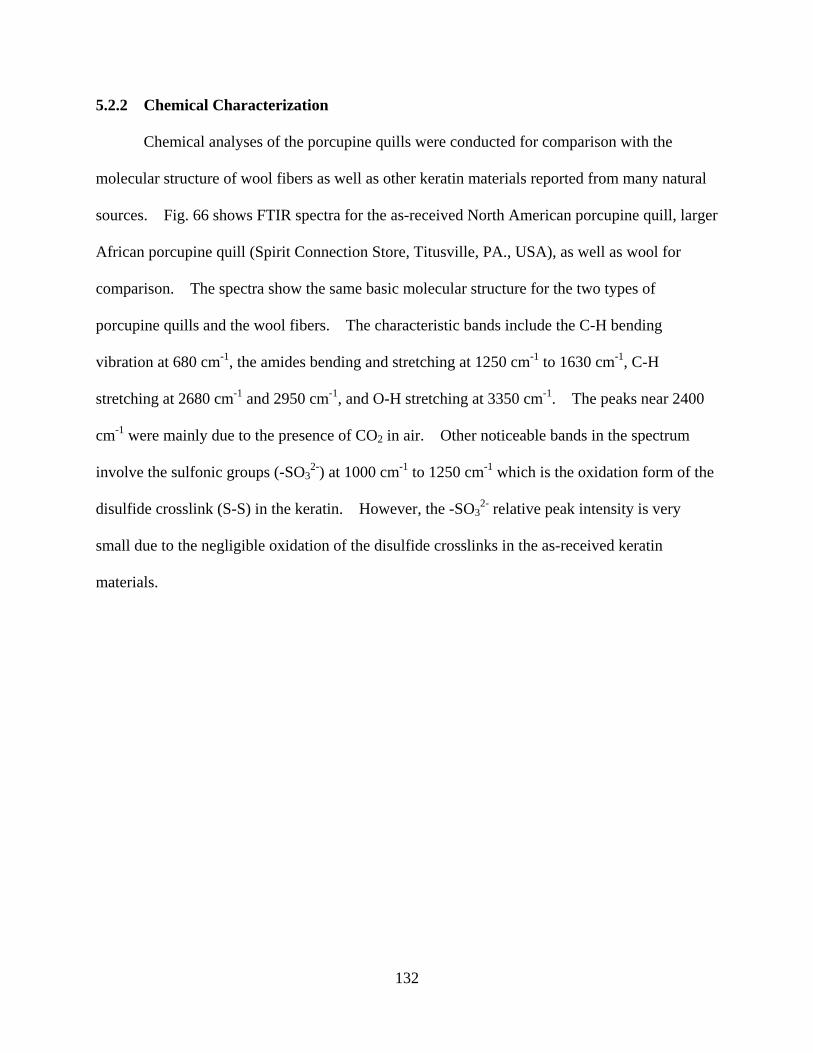
132
5.2.2 Chemical Characterization
Chemical analyses of the porcupine quills were conducted for comparison with the
molecular structure of wool fibers as well as other keratin materials reported from many natural
sources. Fig. 66 shows FTIR spectra for the as-received North American porcupine quill, larger
African porcupine quill (Spirit Connection Store, Titusville, PA., USA), as well as wool for
comparison. The spectra show the same basic molecular structure for the two types of
porcupine quills and the wool fibers. The characteristic bands include the C-H bending
vibration at 680 cm-1, the amides bending and stretching at 1250 cm-1 to 1630 cm-1, C-H
stretching at 2680 cm-1 and 2950 cm-1, and O-H stretching at 3350 cm-1. The peaks near 2400
cm-1 were mainly due to the presence of CO2 in air. Other noticeable bands in the spectrum
involve the sulfonic groups (-SO32-) at 1000 cm-1 to 1250 cm-1 which is the oxidation form of the
disulfide crosslink (S-S) in the keratin. However, the -SO32- relative peak intensity is very
small due to the negligible oxidation of the disulfide crosslinks in the as-received keratin
materials.

133
Fig. 66. FTIR spectra of the porcupine quill and wool fiber showing the characteristic peaks of C-H bending, C-H stretching, and O-H stretching.
North American porcupine quills, based on their x-ray diffraction patterns [149], belong
to alpha-keratin family. The microstructure of hard/structural keratin consists of
semicrystalline intermediate filament coils with diameters of 7.5 nm (a single α-helical coil is
roughly 2 nm in diameter) and lengths of 47 nm embedded in an amorphous matrix. Typical
high angle x-ray diffraction patterns of the as-received North American and African porcupine
quills plus wool are shown in Fig. 67. The images from the 2-D detector shown in Fig. 67(a) –
(c) consist of two broad rings at locations consistent with the reported keratin microstructure.
Wool samples tended to exhibit the highest intensities followed by African porcupine quill and
North American porcupine quill, respectively. The African porcupine quill spectrum shows a
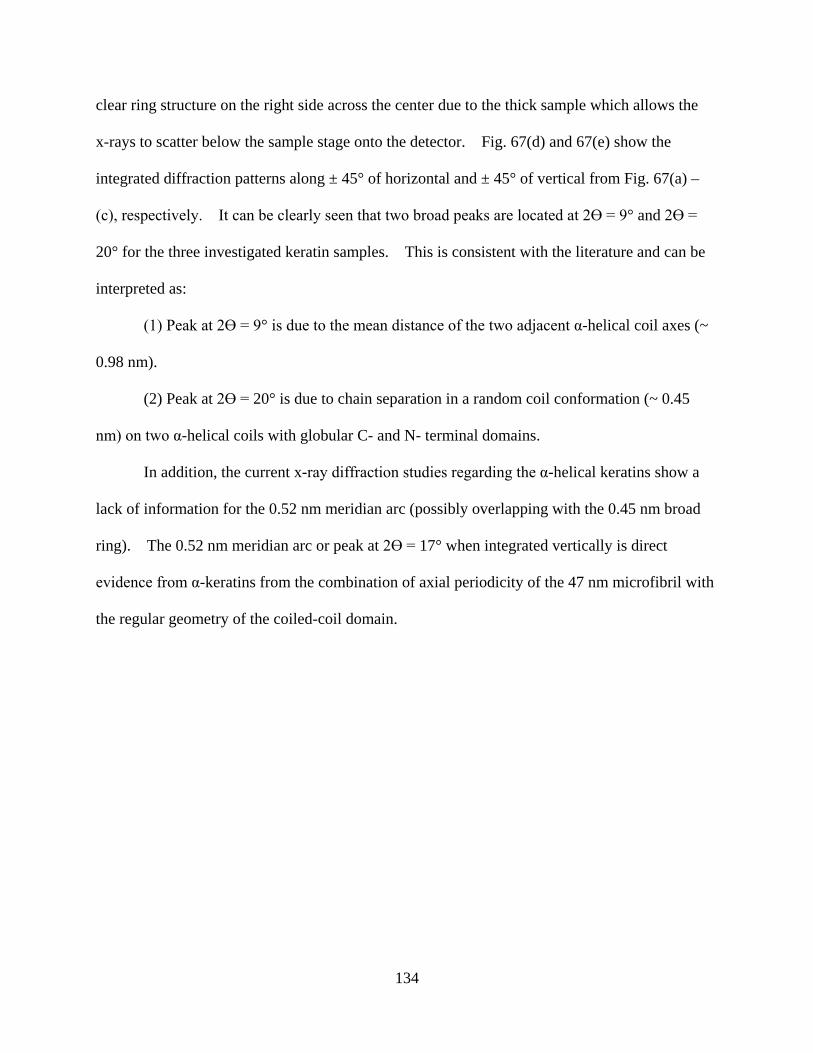
134
clear ring structure on the right side across the center due to the thick sample which allows the
x-rays to scatter below the sample stage onto the detector. Fig. 67(d) and 67(e) show the
integrated diffraction patterns along ± 45° of horizontal and ± 45° of vertical from Fig. 67(a) –
(c), respectively. It can be clearly seen that two broad peaks are located at 2Ө = 9° and 2Ө =
20° for the three investigated keratin samples. This is consistent with the literature and can be
interpreted as:
(1) Peak at 2Ө = 9° is due to the mean distance of the two adjacent α-helical coil axes (~
0.98 nm).
(2) Peak at 2Ө = 20° is due to chain separation in a random coil conformation (~ 0.45
nm) on two α-helical coils with globular C- and N- terminal domains.
In addition, the current x-ray diffraction studies regarding the α-helical keratins show a
lack of information for the 0.52 nm meridian arc (possibly overlapping with the 0.45 nm broad
ring). The 0.52 nm meridian arc or peak at 2Ө = 17° when integrated vertically is direct
evidence from α-keratins from the combination of axial periodicity of the 47 nm microfibril with
the regular geometry of the coiled-coil domain.
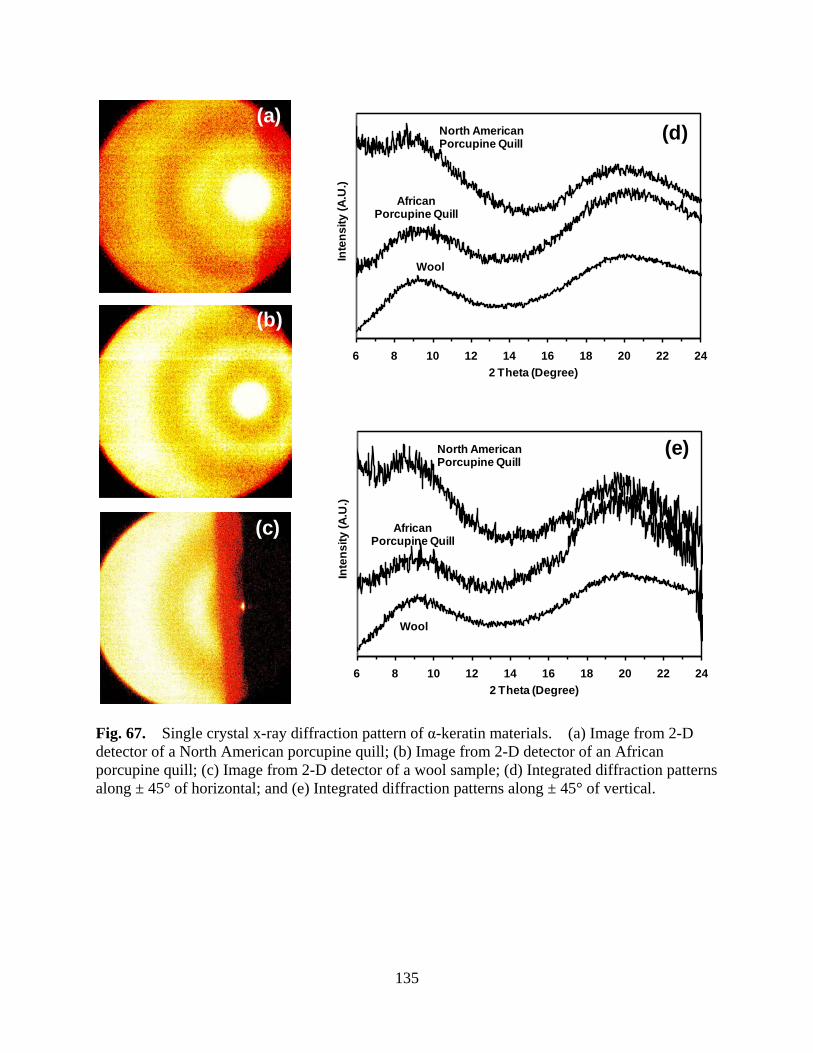
135
Fig. 67. Single crystal x-ray diffraction pattern of α-keratin materials. (a) Image from 2-D detector of a North American porcupine quill; (b) Image from 2-D detector of an African porcupine quill; (c) Image from 2-D detector of a wool sample; (d) Integrated diffraction patterns along ± 45° of horizontal; and (e) Integrated diffraction patterns along ± 45° of vertical.
6 8 10 12 14 16 18 20 22 24In
tens
ity (A
.U.)
2 Theta (Degree)
North AmericanPorcupine Quill
AfricanPorcupine Quill
Wool
6 8 10 12 14 16 18 20 22 24
Inte
nsity
(A.U
.)
2 Theta (Degree)
North AmericanPorcupine Quill
AfricanPorcupine Quill
Wool
(a)
(b)
(c)
(d)
(e)

136
5.2.3 Tensile Properties: Axial and Circumferential
An idealized schematic of stress versus strain for parallel, axially-oriented keratin fibrils
is shown in Fig. 68 [126,154]. The tensile response of keratin materials typically displays an
initial linear viscoelastic region, then a yield region where deformation occurs with minimal
increase in stress, and finally a post-yield, strain-hardening region where significant increases in
stress are required to produce additional increments of strain. A detailed description of the
stress-strain behavior of α-keratin materials and the related molecular structure for each region
was addressed previously in Section 2.3.4.
Fig. 68. A schematic diagram of stress-strain plot for a α-keratin material (wool) showing the Hookean region, yield region, and post-yield region [154].
σPost-yield
Hookean Region
Yield Region
Post-yieldRegion
StrainεYield εPost-yield εFracture
Stress
σYield
σFracture

137
Typical stress-strain curves of North American porcupine quill conditioned at 65% RH or
100% RH are shown in Fig. 69(a). As expected, increasing the amount of water molecules
within the keratin material significantly decreases the load carrying capacity (tensile and fracture
stresses) and increases the elongation to failure of the material during tensile testing. In
addition, the 65% RH samples exhibit a clear critical stress (~ 5% strain) at the end of the
Hookean region consistent with the Chapman and Hearle model for α-keratins (see section
2.3.4). The critical stress found in the 65% RH sample is believed to initiate the unfolding of
α-helices to β-sheets in the intermediate filaments. Once the unfolding mechanism is initiated
by the critical stress, a lower equilibrium stress can then maintain the progression of the
sequential process until strain hardening phenomena begin.
Fig. 69(b) shows an experimental stress-strain curve of a 100% RH conditioned North
American porcupine quill showing the initial viscoelastic Hookean region followed by the yield
region and finally the post-yield region similar to the ideal stress-strain curve for other
α-keratins. Nine important parameters are defined in Fig. 69(b) to enable discussion later
regarding the mechanical properties. Three of the nine parameters are simply the modulus in
each of the three regions. The transition points (i.e., stresses and strains) between the Hookean
and yield regions and between the yield and post-yield regions are obtained at the intersections
of the extrapolated slopes of the various regions as shown in Fig. 69(b). The final two
parameters are the fracture stress and fracture strain from the end point of the stress-strain curve
of each sample.

138
(a)
(b)
Fig. 69. (a) Typical experimental stress-strain curves for North American porcupine quills conditioned at 65% and 100% RH; (b) Experimental stress-strain curve for a North American porcupine quill conditioned at 100% RH showing the definitions of the endpoints of the Hookean region, yield region, and the post-yield region.

139
Fig. 70 shows the mean modulus in the Hookean and post-yield regions for entire quill
samples conditioned at 65% RH and 100% RH (50 specimens at each RH condition). It can be
seen from the figure that the 65% RH entire quill specimens show a statistically significant
higher Hookean modulus (~ 2500 MPa) than the 100% RH specimens (~ 1000 MPa). These
differences are significant at the 99% confidence level (p<0.01). The average modulus in the
yield region exhibited negligible difference between the 65% RH and 100% RH samples with
mean values of 45 ~ 50 MPa. In the post-yield region shown in Fig. 70, the mean Hookean
modulus for 65% RH and 100% RH entire quill samples then increased to values of 190 MPa
and 130 MPa, respectively. The difference in these two post-yield modulus values was also
statistically significant. Comparison of the modulus of porcupine quill in the initial Hookean
region to other similar keratin based fibers (see Table IV) is interesting. The initial modulus of
North American porcupine quill conditioned at 65% RH (2.5 GPa) compares favorably to that
reported for feather quill at 50% RH (2.5 GPa) by Myers et al [134]. The initial modulus of the
North American porcupine quill conditioned at 100% RH (1.0 GPa) compares favorably to that
reported for wool (1.6 GPa) by Speakman [128] but is considerably less than that reported for the
much larger African porcupine quill (3.5 GPa) [139]. Also shown in Fig. 70 are mean Hookean
and post-yield moduli for quill samples composed of sections of only the shell (i.e., internal foam
removed) and conditioned at 65% RH and 100% RH (5 specimens at each RH condition). The
shell-only modulus values were not significantly different from the entire quill values. These
results are consistent with Karam and Gibson’s results [143] that found the quill shell would
carry approximately 98% of the tensile load while the foam core would only carry about 2% of
the load.
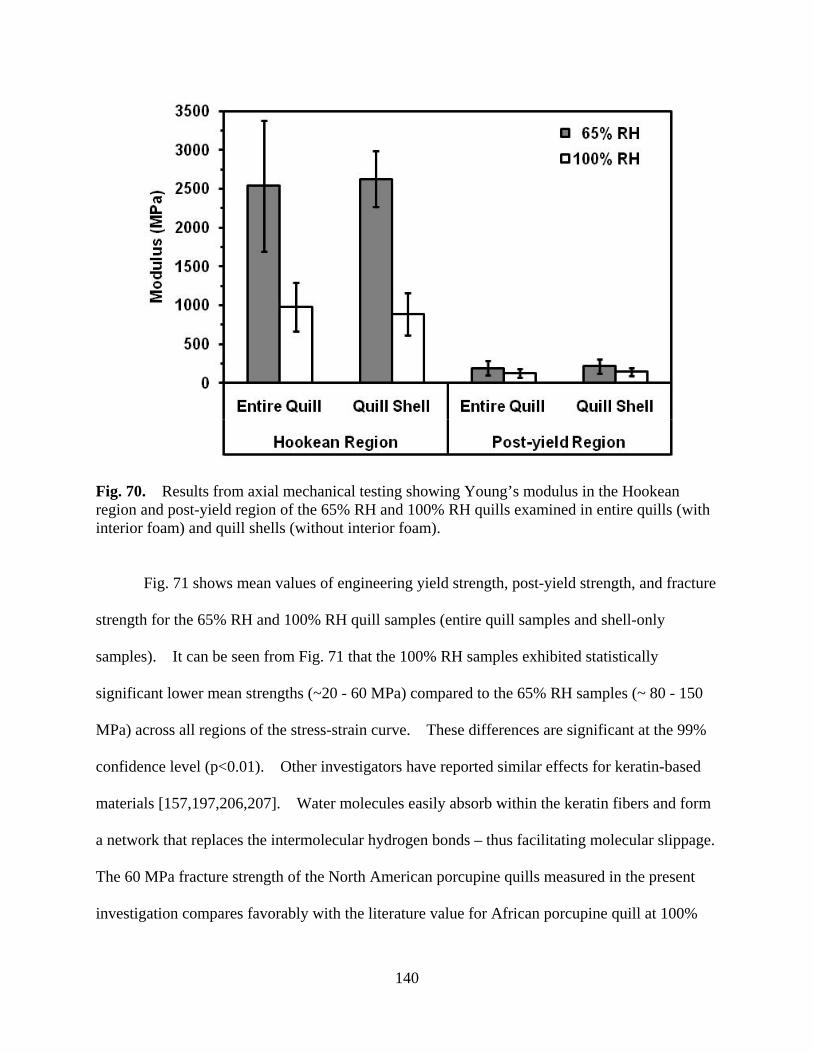
140
Fig. 70. Results from axial mechanical testing showing Young’s modulus in the Hookean region and post-yield region of the 65% RH and 100% RH quills examined in entire quills (with interior foam) and quill shells (without interior foam).
Fig. 71 shows mean values of engineering yield strength, post-yield strength, and fracture
strength for the 65% RH and 100% RH quill samples (entire quill samples and shell-only
samples). It can be seen from Fig. 71 that the 100% RH samples exhibited statistically
significant lower mean strengths (~20 - 60 MPa) compared to the 65% RH samples (~ 80 - 150
MPa) across all regions of the stress-strain curve. These differences are significant at the 99%
confidence level (p<0.01). Other investigators have reported similar effects for keratin-based
materials [157,197,206,207]. Water molecules easily absorb within the keratin fibers and form
a network that replaces the intermolecular hydrogen bonds – thus facilitating molecular slippage.
The 60 MPa fracture strength of the North American porcupine quills measured in the present
investigation compares favorably with the literature value for African porcupine quill at 100%

141
RH (70 MPa) [140]. However, as shown in Table IV, values for the fracture (i.e., tensile)
strength of wool are considerably higher than the corresponding values for North American
porcupine quill shown in Fig. 71.
It is also of interest to note in Fig. 71 that the measured yield strength, post-yield strength
and fracture strength of the 100% RH shell-only samples were not significantly different from
the 100% RH whole quill samples. However, the 65% RH shell-only samples exhibited
statistically significant, lower values of strength across all regions of the stress-strain curve.
These measured strengths were approximately 25% lower than the strengths measured using the
whole quill samples. These lower values might be due to inadvertent defects introduced into
the shell-only samples from the manual foam removal process or the sample sectioning and
flattening process. Sample preparation defects would be expected to be more important at the
higher stresses imposed on the samples conditioned at 65% RH.
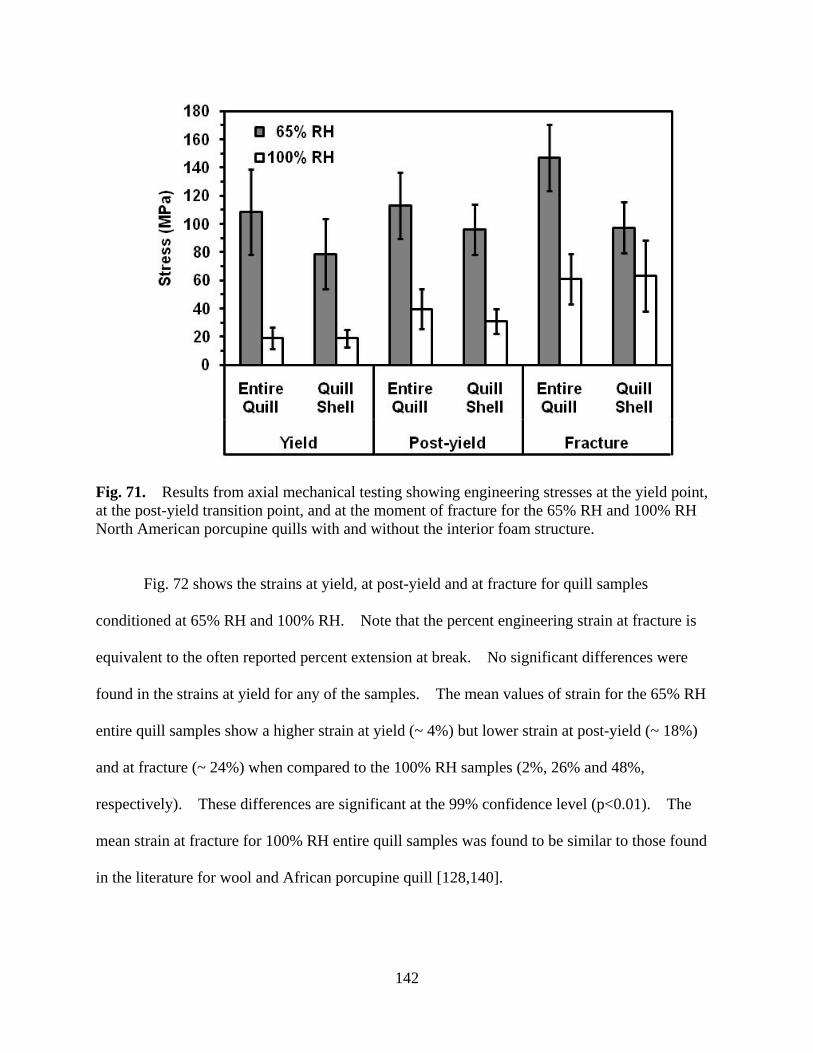
142
Fig. 71. Results from axial mechanical testing showing engineering stresses at the yield point, at the post-yield transition point, and at the moment of fracture for the 65% RH and 100% RH North American porcupine quills with and without the interior foam structure.
Fig. 72 shows the strains at yield, at post-yield and at fracture for quill samples
conditioned at 65% RH and 100% RH. Note that the percent engineering strain at fracture is
equivalent to the often reported percent extension at break. No significant differences were
found in the strains at yield for any of the samples. The mean values of strain for the 65% RH
entire quill samples show a higher strain at yield (~ 4%) but lower strain at post-yield (~ 18%)
and at fracture (~ 24%) when compared to the 100% RH samples (2%, 26% and 48%,
respectively). These differences are significant at the 99% confidence level (p<0.01). The
mean strain at fracture for 100% RH entire quill samples was found to be similar to those found
in the literature for wool and African porcupine quill [128,140].

143
Fig. 72 also shows that the measured strains at post-yield and at fracture for the shell-only
samples were lower than those measured on the entire quill samples for conditions of 65% RH
and 100% RH. Although these differences are significant at the 99% confidence level (p<0.01)
for the 100% RH samples, as discussed above, the lower measured strains may be the result of
sample defects introduced during preparation of the shell-only samples.
Fig. 72. Results from axial mechanical testing showing engineering strains at the yield point, at post-yield transition point, and at the moment of fracture for the 65% RH and 100% RH North American porcupine quills with and without the interior foam structure.
The microstructure of α-keratins consists of numerous micro-fibrils (~ 0.2 µm in
diameter) aligned parallel to the growth direction according to the studies on fracture surfaces
(see section 5.2.4), and the micro-fibrils consisted of intermediate filaments (double-stranded
α-helices) embedded in the amorphous matrix. In the axial direction and at small strain (< 2%
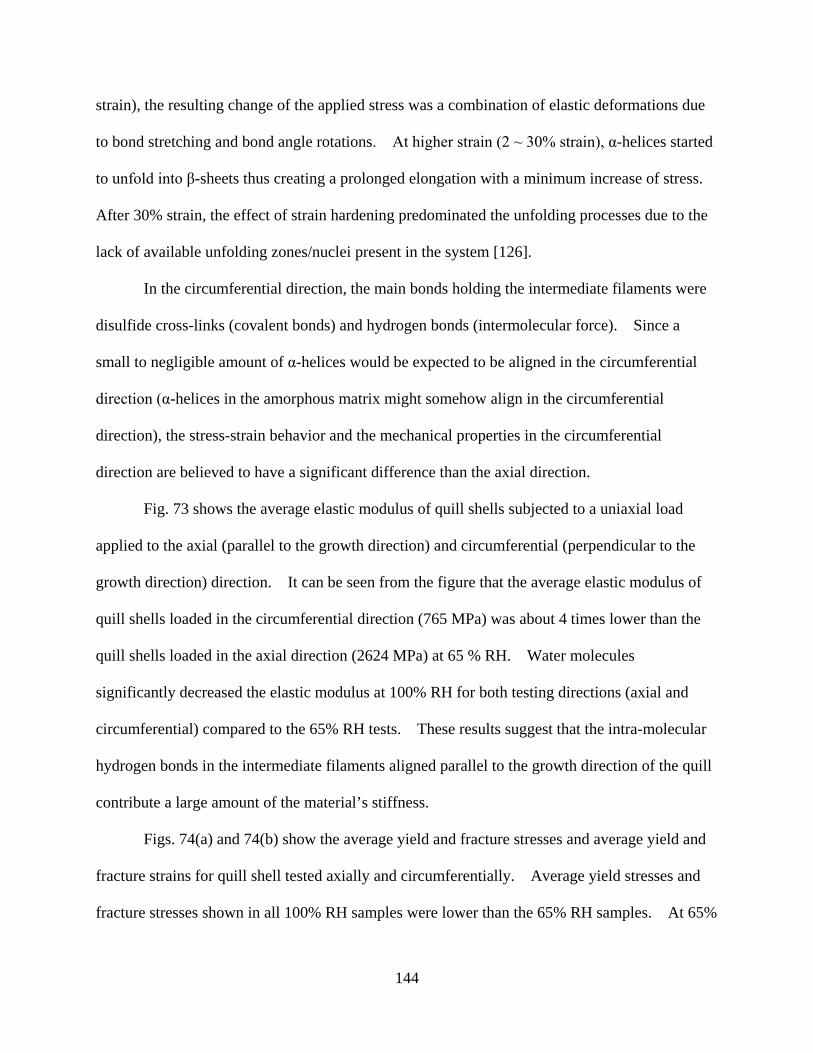
144
strain), the resulting change of the applied stress was a combination of elastic deformations due
to bond stretching and bond angle rotations. At higher strain (2 ~ 30% strain), α-helices started
to unfold into β-sheets thus creating a prolonged elongation with a minimum increase of stress.
After 30% strain, the effect of strain hardening predominated the unfolding processes due to the
lack of available unfolding zones/nuclei present in the system [126].
In the circumferential direction, the main bonds holding the intermediate filaments were
disulfide cross-links (covalent bonds) and hydrogen bonds (intermolecular force). Since a
small to negligible amount of α-helices would be expected to be aligned in the circumferential
direction (α-helices in the amorphous matrix might somehow align in the circumferential
direction), the stress-strain behavior and the mechanical properties in the circumferential
direction are believed to have a significant difference than the axial direction.
Fig. 73 shows the average elastic modulus of quill shells subjected to a uniaxial load
applied to the axial (parallel to the growth direction) and circumferential (perpendicular to the
growth direction) direction. It can be seen from the figure that the average elastic modulus of
quill shells loaded in the circumferential direction (765 MPa) was about 4 times lower than the
quill shells loaded in the axial direction (2624 MPa) at 65 % RH. Water molecules
significantly decreased the elastic modulus at 100% RH for both testing directions (axial and
circumferential) compared to the 65% RH tests. These results suggest that the intra-molecular
hydrogen bonds in the intermediate filaments aligned parallel to the growth direction of the quill
contribute a large amount of the material’s stiffness.
Figs. 74(a) and 74(b) show the average yield and fracture stresses and average yield and
fracture strains for quill shell tested axially and circumferentially. Average yield stresses and
fracture stresses shown in all 100% RH samples were lower than the 65% RH samples. At 65%

145
RH, average yield stress and fracture stress measured in the circumferential direction were lower
than measured in the axial direction. This is also true for the 100 % RH samples
(circumferential and axial directions). Average yield strains of all 65% RH and 100% RH
samples showed small to negligible differences between tests in the axial versus circumferential
direction. Average fracture strains of samples loaded in the axial direction at 65% RH and
100% RH showed higher strains than the circumferential direction.
Fig. 73. Elastic modulus comparison of porcupine quill shells stretched in axial (parallel to the growth direction) and circumferential (perpendicular to the growth direction) at 65% RH and 100% RH.
146
(a)
(b)
Fig. 74. Tensile properties comparison of porcupine quills shells in axial and circumferential direction at 65% RH and 100% RH for (a) yield and fracture stresses and (b) yield and fracture strains.

147
From these data, the mechanical stiffness and strengths of α-keratins can be significantly
reduced by the presence of water molecules in the tissue. Water molecules serve as a
plasticizer by replacing the hydrogen bonds in the α-keratins, and the consequential effect of
hydration is a decrease in strength and a corresponding increase in elongation. This is found in
many of the naturally occurring polymers like cellulose materials. However, unlike most of the
other biological materials, keratins exhibit a sulfur-rich content (cystine residuals) in the matrix
and slightly moderate sulfur in the intermediate filaments. The presence of sulfur allows
keratins to exhibit covalent crosslinks internally, and thus, providing much higher strengths.
As discussed previously in the VHP® compatibility studies of wool, hydrogen peroxide
oxidized the wool disulfide crosslinks and perhaps decreased the mechanical stiffness and
strength of wool to 30% less than its original state (see section 5.1.1, 5.1.2, and 5.1.3) [24,30].
Although VHP® has no known application regarding sanitizing porcupine quills, it is of interest
to compare the mechanical properties of oxidized porcupine quills and the wool fabrics using the
same oxidant. Fig. 75 shows the mean elastic modulus of North American porcupine quills
treated with 10 cycles of VHP® at 450 ppm, the same process conditions used previously on
wool fabrics. Mechanical testing of quills after treatment with 10 cycles of VHP® followed by
conditioning at 65% RH is almost identical to the test conditions in the environmental
conditioned lab for the wool fabrics. The elastic modulus for North American porcupine quills
decreases by 33% at 65% RH and by 66% at 100% RH after 10 VHP® exposures. Although not
shown in Fig. 75, the tensile fracture strength at 65% RH also decreased by ~ 27% after 10
VHP® cycles. The results shown here illustrate that in the previous studies of materials
compatibility for cabin polymeric materials using VHP® decontamination, the decrease in
mechanical properties found on wool can be attributed to the oxidation of the disulfide crosslinks

148
rather than macroscopic fabric defects (loosed yarns) or other related fabric integrity issues
(adsorption of hydrogen peroxide/water).
Fig. 75. Elastic modulus of North American porcupine quills treated with 10 cycles of VHP® followed by conditioning at 65% RH and 100% RH. 5.2.4 Fractography and Microstructure
The fracture surface morphology of porcupine quills after tensile testing was investigated
by scanning electron microscopy. Typical fracture surfaces of samples conditioned with 65%
RH and 100% RH are shown in Figs. 76 and 77, respectively. As discussed above, water
molecules can serve as a plasticizer in keratin materials [157] and significantly increase the
elongation during tensile testing. As expected and as shown in Figs. 76 and 77, the fracture
0
1000
2000
3000
4000
As-received 10 VHP
Mod
ulus
(MPa
)
65% RH100% RH
Hookean Region

149
appearances of the 65% RH samples exhibit significantly less evidence of sample deformation
after testing to failure than the 100% RH samples. The tensile fracture of the shell for the 65%
RH sample generally occurred at 90o to the applied tensile axis. The geometry of the 100%
RH sample shown in Fig. 77 is highly distorted and the shell material displays extensive
delamination.
Higher magnification views of several representative locations around the porcupine shell
for the 65% RH sample and the 100% RH sample are also shown in Figs. 76 and 77. The shell
fracture surfaces reveal a concentrically layered structure consisting of 2 or 3 layers all around
the circumference. Some samples exhibited regions of outer shells that clearly possessed two
layers while others displayed regions with three distinct layers consistent with the x-ray
microdiffraction study of porcupine shell by Busson et al [149]. Three layers are clearly seen
in the shell of the 65% RH sample shown in Fig. 76 (b) – (d). The inside layer attaches the
shell to the foam core of the quill. According to Busson et al, lipids can be found in the
outermost layer of the porcupine shell. These researchers speculated that the lipids in the
outermost layer might provide protection against the environment. In Fig. 76(c) the outside
layer displays a very smooth fracture surface while the middle layer is considerably rougher.
Smooth mirror-like fracture surfaces in polymeric materials are generally associated with slow
stable crack growth. The outer layer is rougher in Figs. 76(b) and 76(d) indicating increasing
crack velocity in that region of the sample. The only mirror-like smooth fracture surface was in
the outside layer in the region shown in Fig. 76(c). The fracture likely began in this area of the
shell, perhaps due to decreased moisture content in the outer layer due to the presence of
hydrophobic lipids [149]. If the presence of lipids in the outside layer reduced the amount of
150
moisture in that layer compared to the inner layers, the outside layer would be less ductile and
more prone to fracture.
Two layers are also evident in the 100% RH sample shown in Fig. 77. Extensive
deformation of an inner layer caused delamination between the inner layer (Fig. 77 (c)) and the
outer layer (Fig. 77(d)) over much of the sample. The delaminated and severely stretched inner
layer is seen to be composed of a fibrous texture that appears to be approximately aligned with
the tensile axis at fracture (Fig. 77(c)). The fibrous texture shown in Fig. 77(c) exhibits
splintering of the layer’s constituents, perhaps revealing the ~ 3 µm diameter spindle shaped
cortical cells of the shell material as noted by Kreplak et al [208]. Fig. 77(b) shows a region of
the 100% RH sample that exhibited significant distortion and a roughened fracture surface
without delamination. Finally, Fig. 77(d) shows a fracture surface with a smooth, mirror-like
region. The fracture of this sample may have initiated in the vicinity of Fig. 77(d) – in the outer
layer – as was also seen for the 65% RH sample.
Further investigation of the underlying fine microstructure of the porcupine quill samples
was pursued using transmission electron microscopy. Fig. 78(a) shows a cross-sectional TEM
image of an axially-oriented sample taken from close to the tip of the porcupine quill. The
electron dense boundaries between the cortical cells are clearly evident (note arrows in Fig.
78(a)). In addition, scattered regions of granular cytoplasmic debris are also seen within several
cortical cells and cell boundaries [213,214]. A number of small cortical cells appear to be
completely enclosed within other cortical cells (labeled as “icc”). This is likely due to the
image plane sectioning a region of the sample where the ends of adjacent cortical cells
interdigitate among each other. Fig. 78(b) shows a longitudinal view TEM image from the
same general region as Fig. 78(a). The cortical cells of the porcupine quill (labeled “I, J, K, and
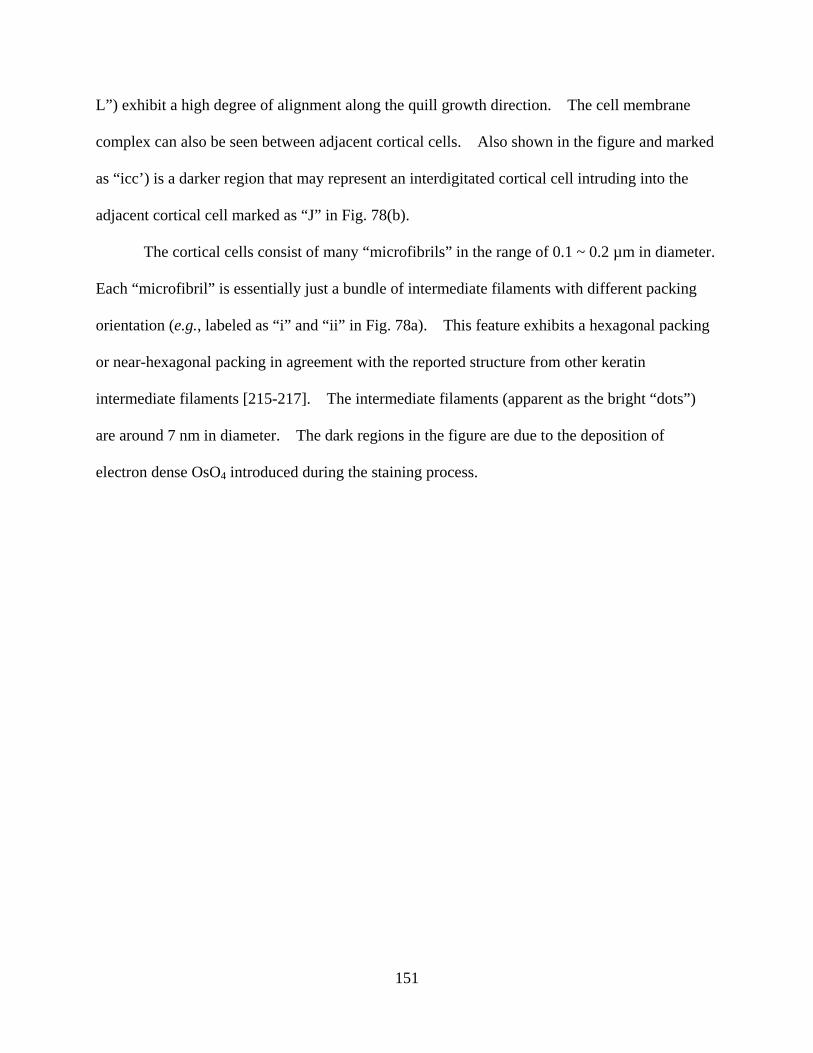
151
L”) exhibit a high degree of alignment along the quill growth direction. The cell membrane
complex can also be seen between adjacent cortical cells. Also shown in the figure and marked
as “icc’) is a darker region that may represent an interdigitated cortical cell intruding into the
adjacent cortical cell marked as “J” in Fig. 78(b).
The cortical cells consist of many “microfibrils” in the range of 0.1 ~ 0.2 µm in diameter.
Each “microfibril” is essentially just a bundle of intermediate filaments with different packing
orientation (e.g., labeled as “i” and “ii” in Fig. 78a). This feature exhibits a hexagonal packing
or near-hexagonal packing in agreement with the reported structure from other keratin
intermediate filaments [215-217]. The intermediate filaments (apparent as the bright “dots”)
are around 7 nm in diameter. The dark regions in the figure are due to the deposition of
electron dense OsO4 introduced during the staining process.
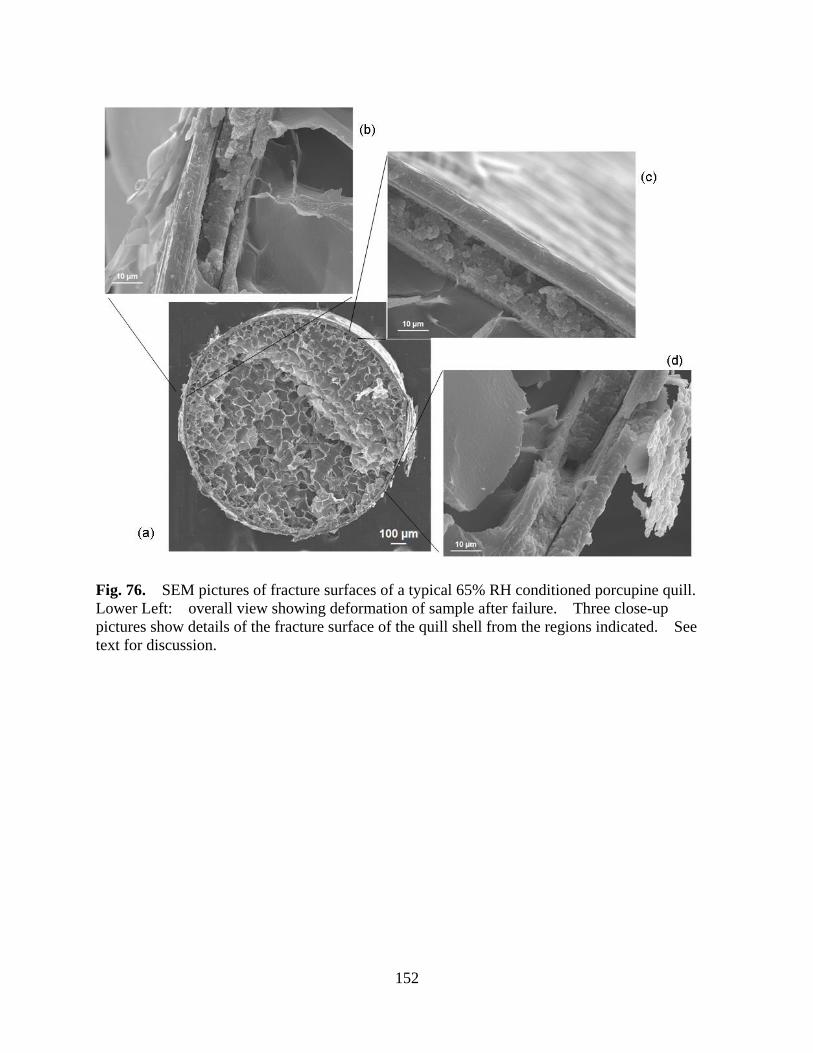
152
Fig. 76. SEM pictures of fracture surfaces of a typical 65% RH conditioned porcupine quill. Lower Left: overall view showing deformation of sample after failure. Three close-up pictures show details of the fracture surface of the quill shell from the regions indicated. See text for discussion.
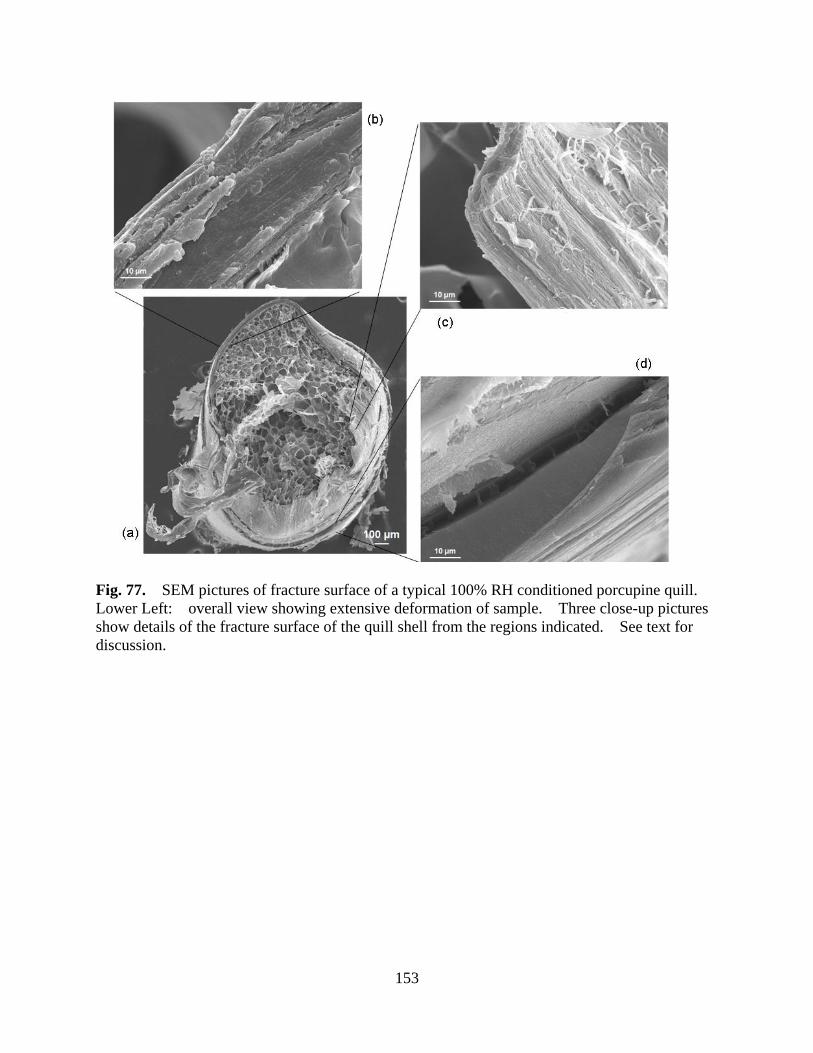
153
Fig. 77. SEM pictures of fracture surface of a typical 100% RH conditioned porcupine quill. Lower Left: overall view showing extensive deformation of sample. Three close-up pictures show details of the fracture surface of the quill shell from the regions indicated. See text for discussion.
154
(a)
(b)
Fig. 78. TEM images of axially-oriented porcupine quill shell. (a) Transverse view. (b) Longitudinal view. Features of cortical (spindle) cells labeled as I,J,K and L; cell membrane complex (indicated by arrows); interdigitated cortical cells labeled as “icc”; in (a) intermediate filaments (bright dots) and amorphous matrix (dark region) can also be seen.
icc
i
ii
I
J
K
L

155
5.2.5 Micromechanical Properties
Porcupine quill shells consist of 2 ~ 3 layers as discussed in the previous section and in
previous studies from the literature. Busson et al. used x-ray micro-diffraction and proposed
that the crystallinity and the micro-structure were different in the various layers from a
moderately ordered α-type keratin plus lipid (outer layer) to an amorphous and poorly ordered
β-type keratin in the middle layer and finally a highly ordered α-type keratin in the inner layer
[149]. Fig. 78(a) and Fig. 78(b) show the average hardness and average elastic modulus of
porcupine quill shells indented axially and circumferentially over the indentation depth of 1 µm
at room temperature. Poisson’s ratio of keratin materials (horn) is reported to range from 0.35
to 0.9 [136,186] and an arbitrary number for Poisson’s ratio of 0.5 was chosen in this research.
The principal effect of Poisson ratio would be to shift the elastic modulus up or down a small
percentage. The average hardness and elastic modulus of epoxy are also shown in Fig 78(a)
and Fig. 78(b), respectively. It can be seen from the figures that the average hardness and
modulus for the axial direction were higher than equivalent measurements in the circumferential
direction. This result is consistent with the microstructural model of α-helices aligning parallel
to the growth direction.
Fig. 79(a) and Fig. 79(b) show the average hardness and average elastic modulus for
nanoindentations on the three layers axially and circumferentially. The data were determined
by observing the indentations under optical microscopy and by selecting the indentations that
were made on the desired layers. It can be seen from the figures that the average hardness (~
0.45 GPa for axial and ~ 0.4 GPa for circumferential direction) and the average elastic modulus
(~ 8 GPa for axial and ~ 7 GPa for circumferential direction) of the inner shell (presumably
consisting highly ordered α-type keratin) were higher than the intermediate layer and the outer

156
layer. Statistically insignificant differences were found for modulus and hardness values when
compared between the axial and circumferential directions in the middle and outer layers.
(a)
(b)
Fig. 79. Nanoindentaiton in a depth controlled continuous stiffness mode on axial and circumferential directions, showing in (a) average hardness and (b) average elastic modulus.
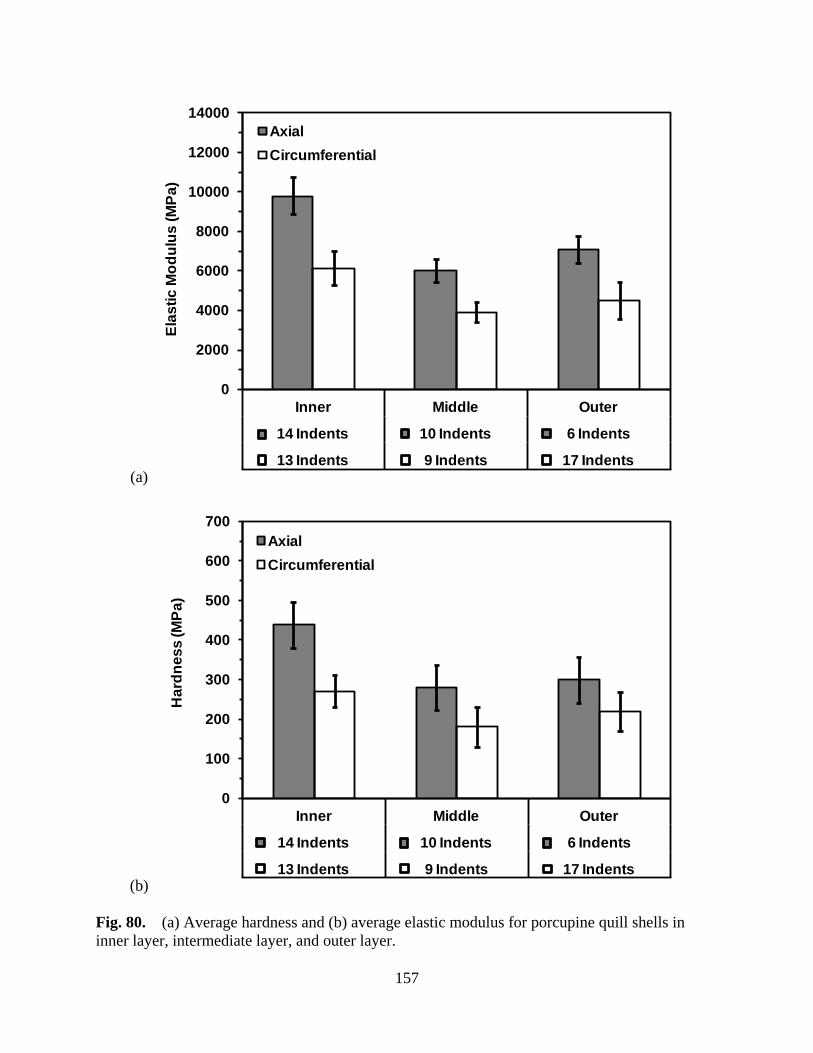
157
(a)
(b)
Fig. 80. (a) Average hardness and (b) average elastic modulus for porcupine quill shells in inner layer, intermediate layer, and outer layer.
0
2000
4000
6000
8000
10000
12000
14000
Inner Middle Outer
14 Indents 10 Indents 6 Indents
13 Indents 9 Indents 17 Indents
Elas
tic M
odul
us (M
Pa)
AxialCircumferential
0
100
200
300
400
500
600
700
Inner Middle Outer
14 Indents 10 Indents 6 Indents
13 Indents 9 Indents 17 Indents
Har
dnes
s (M
Pa)
AxialCircumferential

158
5.2.6 Chemical Analyses of Deformation
Chemical analyses of the porcupine quill shells were conducted to compare with the
molecular structure of keratin fibers reported from other natural sources [184,209-212]. Fig. 80
shows an ATR-FTIR spectrum for the inner and outer shell of as-received porcupine quill shells
in the range of 400 cm-1 to 4000 cm-1. The characteristic bands of amides include the amide I
(C=O stretching) at 1630 cm-1 to 1650 cm-1, the amide II (N-H stretching) at 1500 cm-1 to 1550
cm-1, and amide III (N-H in-plane bending and C-N stretching) at 1200 cm-1 to 1250 cm-1.
Other noticeable bands in the spectra include protein CH3 vibration symmetrically and
asymmetrically at 2900 cm-1 to 2980 cm-1, C-H vibration from the lipids at 3050 cm-1, and
symmetric stretching of S=O at 1035 cm-1. The peaks at 1900 cm-1 to 2400 cm-1 were mainly
due to the presence of CO2 in air, and the broad peak at 3220 cm-1 was due to O-H vibration of
moisture presented in the air. It was worthwhile to note that only the spectrum from the outer
layer of the quill shell exhibited the band of C-H vibration from lipids which was consistent with
other investigators [209-212]. The S=O bands from the oxidation of disulfide cross-links (S-S)
in the spectrum of the outer layer might be due to partial oxidation from the environment. The
S=O band intensity was low when compared to the amides, and the band was not observed when
using the transmission mode of the FTIR.
The deconvolution of the amide I band involved two major peaks centered at 1651 ~
1657 cm-1 for α-keratin and 1621 ~ 1631 cm-1 for β-keratin, using a 15 ~ 17 cm-1 full width at
half maximum [184]. As shown in Fig. 81(a) and 81(b) of a representative experimental result
from the inner quill shell, a small hump at around 1621 cm-1 which corresponded to the
composition of β-keratin can be observed from the amide I band at 0% strain. At 10% strain,
the intensity of the hump increased and the deconvolution of the band showed an increase for the
159
β-keratin and a decrease for the α-keratin. In order to quantitatively measure the change of
α-keratin to β-keratin during the unfolding process, each specimen was stretched and scanned at
0% strain, 5% strain, 7% strain, 10% strain, and 15% strain. Fig. 82(a) shows the changes of
α-keratin and β-keratin for the quill shell outer surface whereas Fig. 82(b) shows the changes of
α-keratin and β-keratin for the quill shell inner surface. It can be seen from the figures that the
relative amount of β-keratin increased from 30% to 45% (outer shell) and from 37% to 52%
(inner shell) when stretched from 0% to 10% strain. On the other hand, the relative amount of
α-keratin decreased from 41% to 35% (outer shell) and from 44% to 31% (inner shell). It can
also be seen from the figures that the inner shell is composed of a higher relative amount of
α-keratin and β-keratin at any strain than the outer shell. This is consistent with Busson et al.
[149] observation that the inner shell region is highly ordered keratin whereas the outer shell is
only moderately ordered keratin.

160
Fig. 81. ATR-FTIR spectra of quill shell for the inside surface (inner layer) and the outside surface (outer layer).
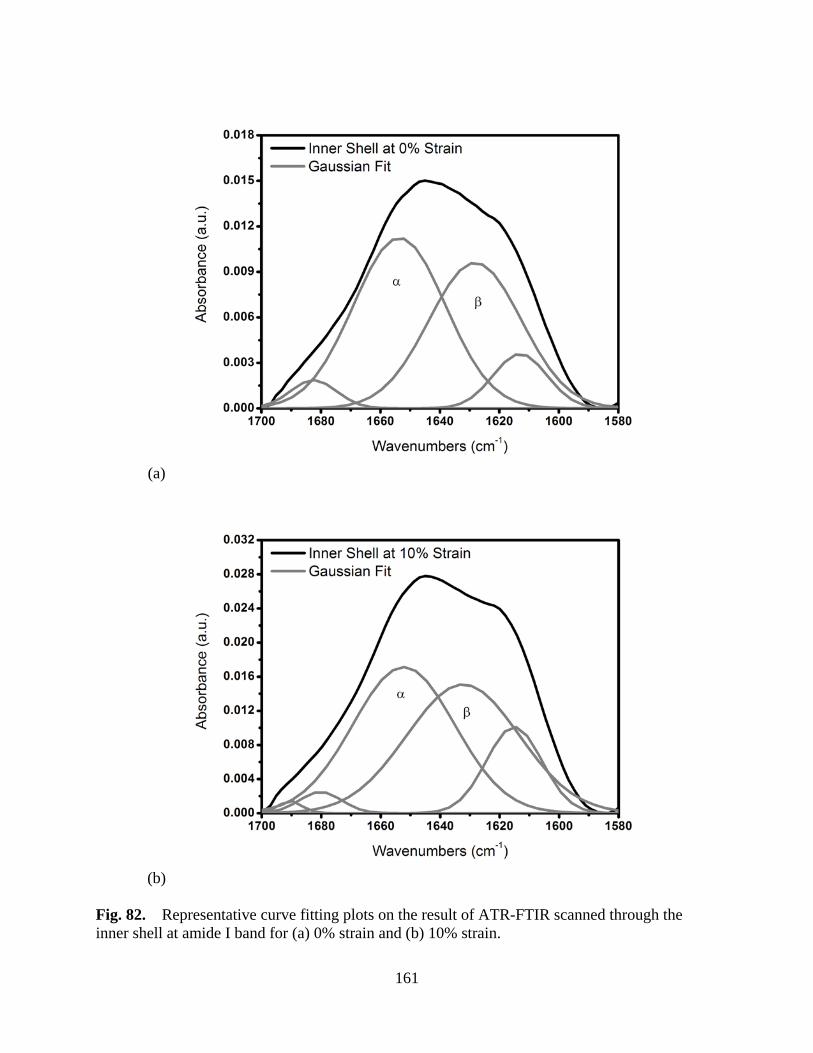
161
(a)
(b)
Fig. 82. Representative curve fitting plots on the result of ATR-FTIR scanned through the inner shell at amide I band for (a) 0% strain and (b) 10% strain.
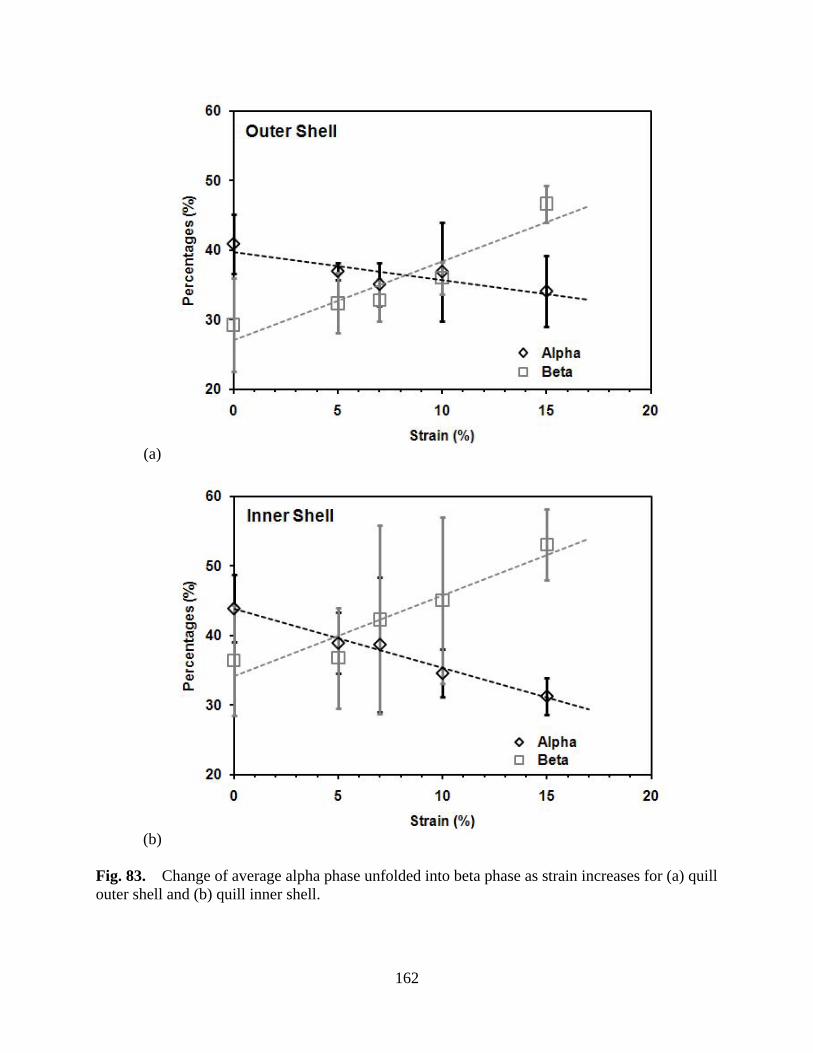
162
(a)
(b)
Fig. 83. Change of average alpha phase unfolded into beta phase as strain increases for (a) quill outer shell and (b) quill inner shell.

163
6. Conclusions
The following conclusions can be drawn from this work.
6.1 Effects of Hydrogen Peroxide on Selected Textile Fabrics
A tendency for significant weight gain was observed for all fabrics (nylon, polyester,
Nomex® and wool) after VHP® exposure. Furthermore, sample harvesting at the end of the
decontamination treatment correlated with a microscopic (but noticeable) release of hydrogen
peroxide/organic peroxide odor/vapor. Fabric fibers swelled as a result of the VHP® treatment;
however the fiber diameter usually shrank after post exposure aging in either air or a vacuum
desiccators. The shrinkage correlated with the appearance of more openings (pores) between
the yarns and looser packing of the fabrics’ weave.
The weight and fiber geometry changes correlated with a reduction in tear strength as a
result of VHP® exposure for most of the samples examined. The tensile properties indicated a
trend of reduction in tensile strength and increase in elongation to failure for wool specimens as a
result of attack by hydrogen peroxide vapor. The effect of hydrogen peroxide on the tensile
properties of wool was, in general, somewhat more marked than in the case of the synthetic
fibers.
FTIR and Raman spectra indicated that the oxidation of wool’s disulphide crosslinks into
sulphinate or sulphinite by hydrogen peroxide vapor would seem to account for the loss of
wool’s tensile properties. The oxidation process was found to be permanent and irreversible.
No effect of hydrogen peroxide vapor on protein conformation in wool keratins was apparent in
the Raman spectra. However, a decrease in intensity of fluorescence of the wool specimens
164
corresponded with a yellowing effect, apparent in visual observations after hydrogen peroxide
treatment.
Thus, it would appear that, based on the data reported here, the VHP® decontamination
technique could relatively easily be made suitable for the synthetic materials examined through
enhancement of the decontamination cycle (especially improved aeration). In contrast, the
degradation of wool in cabin textiles could be a limiting issue if VHP® treatment is to be
employed on such materials.
6.2 Evaluation of Tensile and Micromechanical Properties of Keratin Material
A comprehensive set of tensile data on over one hundred samples of North American
porcupine quill has been presented in this document. Electron microscopic observations of the
samples showed that the outer shell of the porcupine quill is composed of 2-3 concentric layers
and exhibits a non-uniform shell thickness. The fracture strength and the strain at fracture of
the North American porcupine quills at 100% RH measured in the present investigation compare
favorably with literature data for African porcupine quill at 100% RH. Decreasing the water
content of the porcupine quill samples from 100% RH to 65% RH increased their tensile
stiffness and strength by a factor of approximately 2.5 and decreased the measured strains at
fracture by approximately half.
Axial loads of quill shells are carried primarily (~98%) by the quill shell; the reinforcing
foam core contributes little to this load carrying capacity. Tensile fracture of the porcupine
quill shells investigated here occurs initially by slow crack growth, likely initiating in the outer
layer of the quill shell materials. Perhaps the presence of lipids in the outer layer, as reported
by Busson et al. [149] and consistent with ATR-FTIR data presented here, reduced the amount
165
of moisture in the outside layer and decreased the ability of the keratin molecules to sustain
plastic deformation without fracture.
The elastic modulus of shell-only in axial direction (2624 MPa) is around 4 times greater
than shell-only in the circumferential direction (765 MPa) at 65% RH. At 100% RH, there is
only a slight difference in elastic modulus for shell-only loaded axially and circumferentially.
The mean fracture stress and fracture strain for porcupine shell in the axial direction are higher
than the shell in the circumferential direction. Average elastic modulus of quill shell in axial
direction is ~ 7.5 GPa and ~ 6.5 GPa in circumferential direction. The average hardness and
average elastic modulus of the inner shell are found to be slightly higher than the intermediate
shell and the outer shell. These results are consistent with previous findings in the literature
that the α-keratin intermediate filaments exhibit preferred alignment along the axial direction.
Deconvolution of the amide I band revealed an increase of β-keratin and a decrease of
α-keratin for both the outer and inner shells as strain increases. These results are consistent
with the known molecular strain accommodation process of α-helices unfolding into β-sheets
throughout the yield region of keratin materials.

166
7. Suggestions for Future Work
Although the present dissertation accomplished a great amount of work on (1) materials
compatibility issues on common airliner cabin materials using vaporized hydrogen peroxide as a
decontaminant and (2) structure-properties relationship of natural keratin materials, the following
are suggestions for future work in these areas.
7.1 Vaporized Hydrogen Peroxide Decontamination
Although the effects on short-term and long-term exposure of hydrogen peroxide vapor
were found little to be negligible on synthetic polymer fabrics (nylon, polyester, and Nomex®),
more detailed research on the mechanism(s) of physical absorption/adsorption of hydrogen
peroxide vapor is suggested. This suggested topic is related to the diffusion and release of
hydrogen peroxide vapor on porous and sorbent materials which could limit the application of
the decontamination technique.
Although materials flammability tests due to the exposure of VHP® on actual cabin
textiles and actual/laboratory-graded leathers (mechanical and flammability properties) were
performed and are documented in the appendices, these results are limited due to small sample
sizes utilized. More testing of the flammability effects appears to be warranted.
From the present research, only wool underwent degradation/oxidation from VHP®
exposure. It has been demonstrated and reported in this research that the oxidation processes
occurred at the disulfide crosslinks. This is reasonable and expected since hydrogen peroxide is
a strong oxidizer. Hence, it is suggested that more research on materials compatibility should
be conducted for (1) materials exhibiting similar sulfur crosslinks as wool for a comparison and

167
(2) materials exhibiting other crosslinks that are susceptible of oxidation from hydrogen peroxide
vapor, such as fluorine and chlorine crosslinks.
7.2 Structure-Properties of Keratin Materials
Characterizing the molecular deformation of alpha-keratin during tensile testing using
x-ray diffraction still poses difficulties due to the resolution of the x-ray beam. Most of the
explanations on mechanical behavior and changes of microstructure for keratin materials are
either constructed from the molecular level (microstructural point of view) or from the
stress-strain curve (macroscopic properties point of view). For the past 50 years, few have
bridged these two aspects directly. Hence, it is suggested that more research should be
conducted on x-ray diffraction of alpha-keratins, preferably porcupine quill since it produces the
most clear diffraction patterns, during extension.
From the present research, the shell of porcupine quills carries the majority of the load (>
98%), and fractography of the quill shells reveals 2 ~ 3 distinct layers with different
morphologies. Although evidence for the presence of lipids was found in the outer layer of the
porcupine quill shell, consistent with Busson et al. [149], it is recommended that more work in
this area could be productive using techniques such as confocal laser scanning microscopy.
The function and the mechanical behavior of the alpha-keratin amorphous matrix remain
unknown. Future research using 7 M or higher concentration of lithium bromide at an elevated
temperature (~ 70 °C or higher) would induce supercontraction of the alpha-keratin. This
causes the crystalline components in the alpha-keratin to be disrupted to exhibit an amorphous
state. Such experiments would enable the mechanical properties of an amorphous matrix to be
probed experimentally.
168
Alpha keratins exhibit excellent mechanical properties suitable for tissue engineering.
Although the present research focused on the scientific understanding of structure –properties
relationship of alpha keratin tissues, their engineering applications are highly recommended for
future studies. As part of the continuous research from the present work, alpha keratin will be
chemically dissolved and blended with chitin/chitosan-gelatin solution followed by directional
freeze-casting to create well-aligned scaffolds with a highly porous structure suitable for tissue
grafting and bone substitutes in biomedical applications.

169
References
1. Szinicz L (2005) History of chemical and biological warfare agents. Toxicology 214:167-181.
2. Bhalla DK, and Warheit DB (2004) Biological agents with potential for misuse: a historical perspective and defensive measures. Toxicol Appl Pharmacol 199:71-84.
3. Black RM (2010) History and perspectives of bioanalytical methods for chemical warfare agent detection. J Chromatogr B 878:1207-1215.
4. Palgan I, Caminiti IM, Muñoz A, Noci F, Whyte P, Morgan DJ, Cronin DA, and Lyng JG (2010) Effectiveness of high intensity light pulses (HILP) treatments for the control of Escherichia coli and Listeria innocua in apple juice, orange juice and milk. Food Microbiol, In Press.
5. Chun H, Kim J, Chung K, Won M, and Song KB (2009) Inactivation kinetics of Listeria monocytogenes, Salmonella enterica serovar Typhimurium, and Campylobacter jejuni in ready-to-eat sliced ham using UV-C irradiation. Meat Sci 83:599-603.
6. Matak KE, Sumner SS, Duncan SE, Hovingh E, Worobo RW, Hackney CR, and Pierson MD (2007) Effects of ultraviolet irradiation on chemical and sensory properties of goat milk. J Dairy Sci, 90:3178-3186.
7. Varia M, Wilson S, Sarwal S, McGeer A, Gournis E, Galanis E, and Henry B (2003) Investigation of a nosocomial outbreak of severe acute respiratory syndrome (SARS) in Toronto, Canada. Can Med Assoc J 169:285-292.
8. Chowell G, Fenimorea PW, Castillo-Garsow MA, and Castillo-Chavez C (2003) SARS outbreaks in Ontario, Hong Kong and Singapore: the role of diagnosis and isolation as a control mechanism. J Theor Biol 224:1-8.
9. Edler AA (2006) Avian flu (H5N1): its epidemiology, prevention, and implications for anesthesiology. J Clin Anesth 18:1-4.
10. Osterhaus ADME, Jong JCD, Rimmelzwaan GF, and Claas ECJ (2002) H5N1 influenza in Hong Kong: virus characterizations. Vaccine 20:S82-S83.
11. Mase M, Tsukamoto K, Imada T, Imai K, Tanimura N, Nakamura K, Yamamoto Y, Hitomi T, Kira T, Nakai T, Kiso M, Horimoto T, Kawaoka Y, and Yamaguchi S (2005) Characterization of H5N1 influenza A viruses isolated during the 2003–2004 influenza outbreaks in Japan. Virology 332:167-176.
12. Yupiana Y, Vlas SJ, Adnan NM, and Richardus JH (2010) Risk factors of poultry outbreaks and human cases of H5N1 avian influenza virus infection in West Java Province, Indonesia. Int J Infect Dis 14:e800-e805.
13. Jong MD and Hien TT (2006) Avian influenza A (H5N1). J Clin Virol 35:2-13. 14. Cannava P, Cicillini D, Higgins M, McGrath A, and O'Leary J (2010) Response to H1N1
Influenza Outbreak in a Pediatric Children's Hospital: Challenges Faced and Lessons Learned. J Pediatr Nurs 25:375-381.
15. Gatherer D (2009) The 2009 H1N1 influenza outbreak in its historical context. J Clin Virol 45:174-178.

170
16. Abadie A and Gardeazabal J (2008) Terrorism and the world economy. Eur Econ Rev 52:1-27.
17. Okumura T, Hisaoka T, Yamada A, Naito T, Isonuma H, Okumura S, Miura K, Sakurada M, Maekawa H, Ishimatsu S, Takasu N, and Suzuki K (2005) The Tokyo subway sarin attack – lessons learned. Toxicol Appl Pharmacol 207:S471-S476.
18. Okumura T, Hisaoka T, Naito T, Isonuma H, Okumura S, Miura K, Maekawa H, Ishimatsu S, Takasu N, and Suzuki K (2005) Acute and chronic effects of sarin exposure from the Tokyo subway incident. Environ Toxicol Pharmacol 19:447-450.
19. Cole LA (2004) Commentary: The 2001 anthrax attacks: Implications for the medical community and beyond. Clin Dermatol 22:168-170.
20. Franz DR (2009) Preparedness for an anthrax attack. Mol Asp Med 30:503-510. 21. Gale WF, Gale HS and Watson J (2008) Field evaluation of whole airliner decontamination
technologies for narrow-body aircraft. FAA Technical Report DOT/FAA/AM-08/2. 22. Gale WF, Sofyan NI, Gale HS, Sk MH, Chou SF, Fergus JW and Shannon CG (2009) Effect
of vapour phase hydrogen peroxide, as a decontaminant for civil aviation applications, on microstructure, tensile properties and corrosion resistance of 2024 and 7075 age hardenable aluminium alloys and 304 austenitic stainless steel. Mater Sci Technol 25:76-84.
23. Chou SF, Sk MH, Sofyan NI, Overfelt RA, Gale WF, Gale HS, Shannon CG, Fergus JW, and Watson J (2009) Evaluation of the effect of hydrogen peroxide on common aviation structural materials. FAA Technical Report DOT/FAA/AM-09/23.
24. Chou SF, Gale WF, Gale HS, Shannon CG, Buschle-Diller G, and Sofyan NI (2010) Evaluation of airliner cabin textile materials after vapour phase hydrogen peroxide decontamination. Mater Sci Technol 26:66-80.
25. STS Biological Indicators, http://www.stsduotek.com/bio-indicators.html#stripgeo, Accessed on October 29, 2010.
26. Ravens Laboratories, Spore Strips, http://www.mesalabs.com/products-services/raven-labs/spore-strips.html, Accessed on October 29, 2010.
27. SGM Biotech, Spore Strip Biological Indicators, http://sgmbiotech.com/products/sgmstrip.php, Accessed on October 29, 2010.
28. Sk MH, Overfelt, RA, Haney RL, and Fergus JW (2011) Hydrogen enbrittlement of high strength 4340 steel due to condensation during vaporized hydrogen peroxide treatment. Mater Sci Eng, In Press.
29. Loo SM, Kiepert J, Klein D, Pook M, Chou SF, Overfelt RA, and Watson J (2010) Evaluation of the effects of hydrogen peroxide on common aircraft electrical materials. FAA Technical Report DOT/FAA/AM-10/5.
30. Chou SF, Overfelt RA, Gale WF, Gale HS, Shannon CG, Buschle-diller G, and Watson J (2009) Evaluation of the effects of hydrogen peroxide on common aviation textiles. FAA Technical Report DOT/FAA/AM-09/16.
31. Viswanathan A (2010) Wallace Carothers: More than the inventor of Nylon and Neoprene. Would Patent Information 32:300-305.
32. Pant HR, Bajgai MP, Yi C, Nirmala R, Nam KT, Baek W, and Kim HY (2010) Effect of successive electrospinning and the strength of hydrogen bond on the morphology of electrospun nylon-6 nanofibers. Colloids Surf A 370:87-94.
33. Kuo PC, Sahu D, and Yu HH (2006) Properties and biodegradability of chitosan/nylon 11 blending films. Polym Degrad Stab 91:3097-3102.
171
34. Varga C, Miskolczi N, Bartha L, and Lipóczi G (2010) Improving the mechanical properties of glass-fibre-reinforced polyester composites by modification of fibre surface. Mater Des 31:185-193.
35. Yousif BF, Lau STW, and McWilliam S (2010) Polyester composite based on betelnut fibre for tribological applications. Tribol Intl 43:503-511.
36. Inside Story on Nomex® for Firefighters, http://www2.dupont.com/Personal_Protection/en_US/tech_info/literature/literature_nomex.html, Accessed on October 29, 2010.
37. Gnip I, Vèjelis S, Keršulis V, and Vaitkus S (2010) Strength and deformability of mineral wool slabs under short-term compressive, tensile and shear loads. Constr Build Mater 24:2124-2134.
38. Tian CM, Shi ZH, Zhang HY, Xu JZ, and Shi JR (1995) Study on the thermal stability of wool treated with flame-retardant reagents. Thermochim Acta 284:435-439.
39. Chamberland C (1879) J de Medecine, de Chirurgie et de Pharmacologie. 67:61-62. 40. STERIS corp., Steris VHP Generator Training Program. 41. Lambert RJW (2004) in Fraise AP, Lambert PA and Maillard JY (eds), Russell Hugo &
Ayliffe’s Principles and practice of Disinfection, preservation & sterilization, 4th ed, Blackwell Publishing Malden, MA, 345-360.
42. Crittenden JC, Suri RPS, Perram DL, and Hand DW (1997) Decontamination of water using adsorption and photocatalysis. Wat Res 31:411-418.
43. Moreau M, Orange N, and Feuilloley MGJ (2008) Non-thermal plasma technologies: New tools for bio-decontamination. Biotech Adv 26:610-617.
44. Steer J (2002) Decontamination. Surgery 20:197-200. 45. Gould GW (2004) in Fraise AP, Lambert PA and Maillard JY (eds), Russell Hugo &
Ayliffe’s Principles and practice of Disinfection, Preservation & Sterilization, 4th ed, Blackwell Publishing Malden, MA, 361-383.
46. Murray TJ (1931) Thermal death point. J Infect Dis 48:457-467. 47. Francis A (1956) Observations on time and temperature in the killing of spores by dry heat.
Proc Pathol Soc G.B. Irel 71:351-352. 48. Inoue R, Kanaya T, Miyazaki T, Nishida K, Tsukushi I, and Shibata K (2006) Glass
transition and thermal expansivity of polystyrene thin films. Mater Sci Eng A 442:367-370. 49. Grohens Y, Sacristan J, Hamon L, Reinecke H, Mijangos C, and Guenet JM (2001) Glass
transition of ultra-thin films of modified PVC. Polymer 42:6419-6423. 50. Suhir E (1997) Failure criterion for moisture-sensitive plastic packages of integrated circuit
(IC) devices: Application of von Kármán's equations with consideration of thermoelastic strains. Int J Solids Struct 34:2991-2993.
51. Ma X, Jansen KMB, Ernst LJ, van Driel WD, van der Sluis O, and Zhang GQ (2007) Characterization of moisture properties of polymers for IC packaging. Microelectron Reliab 47:1685-1689.
52. Matak KE, Churey JJ, Worobo RW, Sumner SS, Hovingh E, Hackney CR, and Pierson MD (2005) Effect of UV light for the reduction of Listeria monocytogenes in Goat’s milk. J Food Protect 68:2212-2216.
53. Yuan BR, Sumner SS, Eifert JD, and Marcy JE (2003) Response of Salmonella and Escherichia coli O157:H7 to UV energy. J Food Protect 66:1071-1073.

172
54. Sommer R, Haider T, Cabaj A, Heidenreich E, and Kundi M (1996) Increased inactivation of Saccharomyces cerevisiae by protraction of UV irradiation. Appl Environ Microbiol 62:1977-1983.
55. Rowan NJ, MacGregor SJ, Anderson JG, Fouracre RA, Mcllvaney L, and Farish O (1999) Pulsed-light inactivation of food-related microorganisms. Appl Environ Microb 65:1312-1315.
56. Andrady AL (1996) Ultraviolet radiation and polymers in physical properties of polymers handbook, Mark JE (ed) American Institute of Physic, Woodbury, NY, 547-555.
57. Turman BN, Kaye RJ, and Jacobs JA (2002) An overview of electron beam decontamination technology and applications in proceedings of the Twenty-Fifth International Power Modulator Symposium, 39-43.
58. Diffuse security threats: Technologies for mail sanitization exist, but challenges remain, GAO Report to Congressional Requesters, April 2002.
59. Davies K and Glover LC (1996) Effects of electron beam and γ irradiation on polymeric materials in physical properties of polymers handbook, Mark JE (ed) American Institute of Physic, Woodbury, NY, 557-576.
60. Ragni L, Berardinelli A, Vannini L, Montanari C, Sirri F, Guerzoni ME, and Guarnieri A (2010) Non-thermal atmospheric gas plasma device for surface decontamination of shell eggs. J Food Eng 100:125-132.
61. Kim DB, Gweon B, Moon SY, and Choe W (2009) Decontamination of the chemical warfare agent simulant dimethyl methylphosphonate by means of large-area low-temperature atmospheric pressure plasma. Curr Appl Phys 9:1093-1096.
62. Sharp Plasmacluster, The World’s First “Plasmacluster Ion” Air Cleaning Technology, http://sharp-world.com/plasma_c/features/index.html, Accessed on November 4, 2010.
63. Shaffer CH (1977) in Block SS (ed) Disinfection, sterilization, and preservation. 2nd Ed, Lea & Febiger, Philadelphia, 78-99.
64. EPA, Summary of the federal insecticide, fungicide, and rodenticide act, http://www.epa.gov/lawsregs/laws/fifra.html, Accessed on November 4, 2010.
65. Caputo RA and Odlaug TE in Block SS (ed) Disinfection, sterilization, and preservation. 2nd Ed, Lea & Febiger, Philadelphia, 47-64.
66. Portner DM and Hoffman RK (1968) Sporicidal Effect of Peracetic Acid Vapor. Appl. Microbio 16:1782-1785.
67. Bioquell HPV Generator, http://www.bioquell.com/lifescience.asp, Accessed on November 4, 2010.
68. Anthrax Letter, NBC Studio, http://seedmagazine.com/content/article/the_anthrax_agenda/, Accessed on November 4, 2010.
69. Anthrax Letter, NBC Studio, http://www.seattlepi.com/national/42657_anthrax13.shtml, Accessed on November 4, 2010.
70. Steris VHP, Anthrax Decontamination, http://www.steris.com/defense/gaseousdecon.cfm, Accessed on November 4, 2010.
71. Steris VHP, Katrina, http://www.steris.com/about/news/archive_corporate.cfm?releaseId=765975, Accessed on November 4, 2010.
72. Shaftstall RM, Garner RP, Bishop J, Cameron-Landis L, Eddington DL, Hau G, Spera S, Mielnik T, and Thomas JA (2006) Vaporized hydrogen peroxide (VHP) decontamination of

173
a section of a Boeing 747 cabin. FAA Office of Aerospace Medicine, Washington, D.C., DOT/FAA/AM-06/10.
73. Gale WF, Gale HS, and Watson J (2008) Field evaluation of whole airliner decontamination technologies - Wide-body aircraft with dual use application for railcars. FAA Office of Aerospace Medicine, Washington, D.C., DOT/FAA/AM-08/4.
74. Science Applications Internation Corporation, Report: EPA/600/R-05/036/2005. 75. Asbury ED (1983) in Block SS (ed) Disinfection, sterilization, and preservation, 3rd Ed, Lea
& Febiger, Philadelphia, 964-980. 76. ASTM Designation: E2111-05, ASTM International. 77. Henry PHS (1939) Diffusion in absorbing media. Proc R Soc London, A 171:215-241. 78. Henry PHS (1948) The diffusion of moisture and heat through textiles. Discuss Farad Soc,
3:243-257. 79. Gale WF, Prorok BC, Gale, HS, Sofyan N, Barbaree JM, and Neely WC (2006) Selectrion of
decontamination technologies for further evaluation or implementation. v.1 Air Transportation Center of Excellence for Airliner Cabin Environment Research.
80. Lin W, Biegler LT, and Jacobson AM (2010) Modeling and optimization of a seeded suspension polymerization process. Chem Eng Sci 65:4350-4362.
81. Pang K, Kotek R, and Tonelli A (2006) Review of conventional and novel polymerization processes for polyesters. Prog Polym Sci 31:1009-1037.
82. Miri V, Persyn O, Lefebvre JM, and Seguela R (2009) Effect of water absorption on the plastic deformation behavior of nylon 6. Eur Polym J 45:757-762.
83. Galeski A (2003) Strength and toughness of crystalline polymer systems. Prog Polym Sci 28:1643-1699.
84. Brookeal GM, Mohammed S, and Whiting MC (1999) The synthesis of oligomers related to nylon 4.6 and nylon 6.6. Polymer 40:773-788.
85. Suzuki A, Murata H, and Kunugi T (1998) Application of a high-tension annealing method to nylon 66 fibres. Polymer 39:1351-1355.
86. Krijgsman J, Husken D, and Gaymans RJ (2003) Synthesis and properties of thermoplastic elastomers based on PTMO and tetra-amide. Polymer 44:7573-7588.
87. The development of Nylon, http://ezinearticles.com/?Development-and-History-of-Nylon&id=2835701, Accessed on November 5, 2010.
88. Imrek H (2009) Performance improvement method for Nylon 6 spur gears. Tribol Int 42:503-510.
89. Steinbuch RT (1962) Nylon 6 as a bearing material. Wear 5:458-466. 90. Bortolato SA, Arancibia JA, and Escandar GM (2008) A novel application of nylon
membranes to the luminescent determination of benzo[a]pyrene at ultra trace levels in water samples. Anal Chim Acta 613:218-227.
91. Williams JCL (1995) in Kohan MI (eds), Nylon plastic handbook, Hanser/Gardner Publications, Inc. Cincinnati, OH, 293-331.
92. Bonner RM, Kohan MI, Lacey EM, Richardson PN, Roder TM, and Sherwood LT (1973) in Kohan MI (eds), Nylon plastics, John Wiley and Sons, New York, 327-407.
93. Anonymous (1993) Design handbook for DuPont Engineering Plastics. DuPont, Module II 232409B.
94. Nicolais RGL (1976) Glass transition temperature in nylons. Polymer 17:1049-1053.
174
95. Clark Jr RL, Craven MD, and Kander RG (1999) Nylon 66/poly(vinyl pyrrolidone) reinforced composites: 2 Bulk mechanical properties and moisture effects. Composites Part A 30:37-48.
96. Khan AS and Farrokh B (2006) Thermo-mechanical response of nylon 101 under uniaxial and multi-axial loadings: Part I, Experimental results over wide ranges of temperatures and strain rates. Plasticity 22:1506-1529.
97. Kienle RH and Ferguson CS (1929) Alkyd resins as film-forming materials. Ind Eng Chem 21:349-352
98. Callahan MJ (1914) General Electric Company, US Patent, 1 108 329. 99. Bradley TF (1937) Drying oils and resins: Mechanism of the “Drying” Phenomenon. Ind Eng
Chem 29:440-445. 100. Jackways R, Ward IM, Wilding MA, and Desborough IJ, and Pass MG (1975) Crystal
deformation in aeromatic polyesters. J Plom Sci, Polym Phys Ed 13:799-813. 101. Oudet C and Bunsell AR (1987) Effects of structure on the tensile, creep and fatigue
properties of polyester fibres. J Mater Sci 22:4292-4298. 102. Oudet C and Bunsell AR (1984) Structural changes in polyester fibers during fatigue. J
Appl Polym Sci 29:4363-4376. 103. Sangthong S, Pongprayoon T, and Yanumet N (2009) Mechanical property improvement of
unsaturated polyester composite reinforced with admicellar-treated sisal fibers. Composite Part A 40:687-694.
104. Varga C, Miskolczi N, Bartha L, and Lipóczi G (2010) Improving the mechanical properties of glass-fibre-reinforced polyester composites by modification of fibre surface. Mater Des 31:185-193.
105. Mishra S, Mohanty AK, Drzal LT, Misra M, Parija S, Nayak SK, and Tripathy SS (2003) Studies on mechanical performance of biofibre/glass reinforced polyester hybrid composites. Compos Sci Technol 63:1377-1385.
106. Villar-Rodil S, Martinez-Alonso A, and Tascon JMD (2001) Studies on pyrolysis of Nomex polyaramid fibers. J Anal Appl Pyrolysis 58-59:105-115.
107. Foo CC, Chai GB, and Seah LK (2007) Mechanical properties of Nomex material and Nomex honeycomb structure. Compos Struct 80:588-594.
108. Su F, Zhang Z, and Liu W (2007) Tribological and mechanical properties of Nomex fabric composites filled with polyfluo 150 wax and nano-SiO2. Compos Sci Technol 67:102-110.
109. Su F, Zhang Z, Guo F, Wang K, and Liu W (2006) Study on the friction and wear properties of the composites made of surface modified-Nomex fabrics. Mater Sci Eng A 416:126-133.
110. Su F, Zhang Z, Guo F, Wang K, and Liu W (2006) Effects of solid lubricants on friction and wear properties of Nomex fabric composites. Mater Sci Eng A 424:333-339.
111. Su F, Zhang Z, Guo F, and Liu W (2007) Tribological and mechanical properties of Nomex fabric composites filled with polyfluo 150 wax and nano-SiO2. Compos Sci Technol 424:333-339.
112. Kadolph SJ, Langford AL, Hollen N, and Saddler J (1993) Textiles, 7th edn, Macmillan Publishing Company, New York, 53-63, 179-182, 289.
113. Blob RW and Snelgrove JM (2006) Antler stiffness in moose (Alces alces): Correlated evolution of bone function and material properties? J Morphol 267:1075–1086.
114. Rajaram A and Ramanathan N (1982) Tensile properties of antler bone. Calc Tiss Int 34:301–305.

175
115. Chen PY, Lin AYM, Lin YS, Seki Y, Stokes AG, Peyras J, Olevsky EA, Meyers MA, and McKittrick J (2008) Structure and mechanical properties of selected biological materials. J Mech Behav Biomed Mater, 1:208-226.
116. Astbury WT and Street A (1932) X-ray studies of the structure of hair, wool, and related fibres I – General. Philos Trans R Soc Lond, Ser A 230:75-101.
117. Astbury WT and Woods HJ (1934) X-ray studies of the structure of hair, wool, and related fibres II – The molecular structure and elastic properties of hair keratin. Philos Trans R Soc Lond, Ser A 232:333-394.
118. Astbury WT and Sisson WA (1935) X-ray studies of the structure of hair, wool, and related fibres III – The configuration of the keratin molecule and its orientation in the biological cell. Pro R Soc Lond A 150:533-551.
119. Kreplak L, Doucet J, Dumas P, and Briki F (2004) New aspects of the α-helix to β-sheet transition in stretched hard α-keratin fibers. Biophys J 87:640-647.
120. Cao J and Billows CA (1999) Crystallinity determination of native and stretched wool by X-ray diffraction. Polym Int 48:1027-1033.
121. Tanabe T, Okitsu N, and Yamauchi K (2004) Fabrication and characterization of chemically crosslinked keratin films. Mater Sci Eng C 24:441-446.
122. Katoh K, Tanabe T, and Yamauchi K (2004) Novel approach to fabricate keratin sponge scaffolds with controlled pore size and porosity. Biomaterials 25:4255-4262.
123. Reichi S (2009) Films based on human hair keratin as substrates for cell culture and tissue engineering. Biomaterials 30:6854-6866.
124. Feughelman M (1959) A two phase structure for keratin fibers. Text Res J 29:223-228. 125. Chapman BM (1969) A mechanical model for wool and other keratin fibers. Text Res J
39:1102-1109. 126. Hearle JWS (2000) A critical review of the structural mechanics of wool and hair fibers. Int
J Biol Macromol 27:123-138. 127. Feughelman M (2002) Natural protein fibers. J Appl Polym Sci 83:489-507. 128. Speakman JB (1927) The intracellular structure of wool fibre. J Text Inst Trans 18:431-453. 129. Postle RGA (1988) The mechanics of wool structures. Ellis Horwood, Chichester UK. 130. Bonser RHC (1996) The mechanical properties of feather keratin. J Zool Lond
239:477-484. 131. Bonser RHC and Purslow PP (1995) The Young’s modulus of feather keratin. J Exp Biol
198:1029-1033. 132. Fraser RDB and Parry DAD (2008) Molecular packing in the feather keratin filament. J
Struct Biol 162:1-13. 133. Seki Y, Kad B, Benson D, and Meyers MA (2006) The toucan beak: structure and
mechanical response. Mater Sci and Eng C 26:1412-1420. 134. Meyers MA, Chen PY, Lin AYM, and Seki Y (2008) Biological materials: Structure and
mechanical properties. Prog Mater Sci 53:1-206. 135. Tombolato L, Novitskaya EE, Chen PY, Sheppard FA, and McKittrick J (2010)
Microstructure, elastic properties and deformation mechanisms of horn keratin. Acta Biomater 6:319-330.
136. Franck A, Cocquyt G, Simoens P, and Belie ND (2006) Biomechanical properties of bovine claw horn. Biosyst Eng 93:459-467.
137. Bertram JEA and Gosline J M (1987) Functional design of horse hoof: The modulation of mechanical properties through hydration effects. J Exp Biol 130:121-136.
176
138. Kitchener A (1987) Effect of water on the linear viscoelasticity of horn sheath keratin. J Mat Sci Lett 6:321-322.
139. Bendit EG (1975) Longitudinal and transverse mechanical properties of keratin in compression. Proc 5th Int Wool Text Res Conf, ed. K. Zeigler, 2:351-360.
140. Feughelman M and Druhala M (1975) The lateral mechanical properties of alphakeratin. Proc 5th Int Wool Text Res Conf, ed. K. Zeigler, 2:340-349.
141. Karam GN and Gibson LJ (1994) Biomimicking of animal quills and plant stems: Natural cylindrical shells with foam cores. Mater Sci Eng C, 2:113-132.
142. Karam GN and Gibson LJ (1995) Elastic buckling of cylindrical shells with elastic cores I. Analysis. Int J Solids Struct 32:1259-1283.
143. Andrews EW and Gibson LJ (2001) The influence of cracks, notches and holes on the tensile strength of cellular solids. Acta Mater 49:2975-2979.
144. Gibson LJ (2005) Biomechanics of cellular solids. J Biomech 38:377-399. 145. Lewin M (2006) Handbook of Fiber Chemistry. 3rd edn, Chapter 3, International Fiber and
Science and Technology, 355-414. 146. Hocker H (2002) Simpson WS, and Crawshaw GH (eds) Wool: Science and Technology. 1st
edn, Chapter 3-5, 60-159, Woodhead publishing Ltd and CRC Press LLC, Cambridge UK. 147. Corfield MC, Robson A, and Skinner B (1958) The amino acid compositions of three
fractions from oxidized wool. Wool Ind Res Assoc 348-352. 148. Church JS, Corino GL, and Woodhead AL (1998) The analysis of merino wool cuticle and
cortical cells by Fourier transform Raman spectroscopy. Biopolym 42:7-17. 149. Busson B, Engstrom P, and Doucet J (1999) Existence of various structural zones in
keratinous tissues revealed by X-ray microdifraction. J Synchrotron Rad 6:1021-1030. 150. Meyers MA, Chen PY, Lin AYM, and Seki Yasuaki (2008) Biological materials: Structure
and mechanical properties. Prog Mater Sci 53:1-206. 151. Kitchener A (1987) Fracture toughness of horns and a reinterpretation of the horning
behaviour of bovids. J Zool 213:621–39. 152. Bertram JEA and Gosline JM (1986) Fracture toughness design in horse hoof keratin. J Exp
Biol 125:29–47. 153. Purslow PP and Vincent JFV (1987) Mechanical properties of sound production in chincken
and geese. J Exp Biol 72:251–60. 154. Hearle JWS and Chapman BM (1968) On polymeric materials containing fibrils with a
phase transition. I. General discussion of mechanics applied particularly to wool fibers. J Macromol Sci, Phys 2:663-695.
155. Pauling L, Corey RB, and Branson HR (1951) The structure of proteins. Proc Natl Acad Sci USA 37:205-211.
156. Feughelman M (1959) A two-phase structure for keratin fibers. Text Res J 29:223-228. 157. Feughelman M and Robinson MS (1971) Some mechanical properties of wool fibers in the
“Hookean” region from zero to 100% relative humidity. Text Res J 41:469-474. 158. Feughelman M (1989) A note of the water-impenetrable component of α-keratin fibers.
Text Res J 59:739-742. 159. Feughelman M (1994) A model for the mechanical properties of the α-keratin cortex. Text
Res J 64:236-239. 160. Feughelman M (1997) Mechanical properties and structure of alpha-keratin fibers: wool
human hair and related fibers. 1st edn, University of New South Wales Press Sydney Australia.
177
161. Hearle JWS and Chapman BM (1968) On polymeric materials containing fibrils with a phase transition. II. The mechanical consequences of matrix shear. J Macromol Sci, Phys 2:697-741.
162. Hearle JWS and Chapman BM (1970) On polymeric materials containing fibrils with a phase transition. III. The effect of slip at the fibril matrix. J Macromol Sci, Phys 4:127-151.
163. Hearle JWS and Chapman BM (1971) On polymeric materials containing fibrils with a phase transition. IV. Comparison of model predictions with behavior. J Macromol Sci, Phys 5:633-659.
164. Smith GJ (1992) Singlet oxygen produced by UV irradiation of wool keratin. J Photochem Photobiol B Biol 12:173-178.
165. Smith GJ (1995) New trends in photobiology (invited review) photodegradation of keratin and other structural proteins. J Photochem Photobiol B Biol 27:187-198.
166. Dyer JM, Plowman JE, Krsinic GL, Deb-Choudhury S, Koehn H, Millington KR, and Clerens S (2010) Proteomic evaluation and location of UVB-induced photo-oxidation in wool. J Photochem Photobiol B Biol 98:118-127.
167. Smith GJ and Melhuish WH (1993) Relaxation and quenching of the excited states of tryptophan in keratin. J Photochem Photobiol B Biol 17:63-68.
168. Simpson WS (2002) Wool chemistry. Wool science and technology, Simpson WS and Crawshaw GH (edt), 130-159, Woolhead Publishing Ltd, Cambridge UK.
169. Launer HF (1963) Effect of light upon wool, Part I, Greening and yellowing by germicidal ultraviolet. Text Res J 33:258-263.
170. Launer HF (1963) Effect of light upon wool, Part II, Post-irradiation loss of colour in the dark after germicidal ultraviolet. Text Res J 33:910-918.
171. Inglis AS and Lennox FG (1965) Studies in wool yellowing, Part IX, Irradiation with different UV wavebands. Text Res J 35:104-109.
172. Meybeck A and Meybeck J (1967) Photo-oxidation of the peptide group, I. Fibrous Proteins. Photochem Photobiol 6:355-363.
173. Steinhard J and Harris M (1940) Combination of wool protein with acid and base – HCl and KOH. J Res Natl Bur Standards 24:335-367.
174. Titration Curve of Cystine, http://www2.chemistry.msu.edu/faculty/reusch/VirtTxtJml/proteins.htm, Accessed on November 4, 2010.
175. Cegarra J and Gacen J (1984) The bleaching of wool with hydrogen peroxide. Wool Sci Rev 59, Int Wool Secretariat Technical Centre.
176. Kadolph SJ, Langford AL, Hollen N, and Saddler J (1993) Textiles. 7th edn, 53-63, 179-182, 289, Macmillan Publishing Company, New York.
177. Arifoglu M, Marmer WN, and Carr CM (1989) Effect of urea on bleaching of wool with hydrogen peroxide under alkaline and acidic conditions. Text Res J 59:425-431.
178. Gacen J and Cayuela D (2000) Comparison of wool bleaching with hydrogen peroxide in alkaline and acidic media. Color Technol 116:13-15.
179. Cardamone JM, Yao J, and Nuńez A (2004) Controlling shrinkage in wool fabrics effective hydrogen peroxide systems. Text Res J 74:887-898.
180. ASTM Standard D5034-95, “Standard test method for breaking strength and elongation of textile fabrics (Grab test)”, ASTM International, West Conshohocken, PA, www.astm.org.
178
181. ASTM D2261-96, ‘Standard test method for tearing strength of fabrics by the tongue (Single rip) procedure (Constant-rate-of-extension tensile testing machine)’, ASTM International, West Conshohocken, PA, www.astm.org.
182. ASTM Standard D3822-07, “Standard test method for tensile properties of single textile fibers,” 865-874, ASTM International, West Conshohocken, PA, 2007.
183. Schulz B, Chan D, Bäckström J, and Rübhausen M, “Spectroscopic ellipsometry on biological materials – investigation of hydration dynamics and structural properties,” Thin Solid Films, 455-456 (2004) 731-734.
184. Bendit EG (1966) Infrared absorption spectrum of keratin. I. Spectra of α-, β-, and superconcentrated keratin. Biopolym 4:539-559.
185. Lilliefors H (1967) On the Kolmogorov–Smirnov test for normality with mean and variance unknown. J Am Statistics Assoc 62:399–402.
186. Kitchener A and Vicent JFV (1987) Composite theory and the effect of water on the stiffness of horn keratin. J Matl Sci 22:1385-1389.
187. Bodin A, Linnerborg M, Nilsson JLG, and Karlberg A (2003) Structure elucidation, synthesis, and contact allergenic activity of a major hydroperoxide formed at autoxidation of the ethoxylated surfactant C12E5. Chem Res Toxicol 16:575-582.
188. Docherty KS, Jumboonlert K, Lee IJ, and Ziemann PJ (2004) Gas chromatography of trimethylsilyl derivatives of α-methoxyalkyl hydroperoxides formed in alkene–O3 reactions. J Chromatogr A 1029:205-215.
189. Gäfvert E, G. Nilsson JL, Hagelthorn G, and Karlberg A (2002) Free radicals in antigen formation: reduction of contact allergic response to hydroperoxides by epidermal treatment with antioxidants. Br J Dermatol 146:649-656.
190. Wojciechowska E, Włochowicz A, Wysocki M, Pielesz A, and Wesełucha-Birczyńska A (2002) The application of Fourier-transform infrared (FTIR) and Raman spectroscopy (FTR) to the evaluation of structural changes in wool fibre keratin after deuterium exchange and modification by the orthosilicic acid. J Mol Struct 614:355-363.
191. Hsieh S, Zhang F, and Li H (2006) Anti-ultraviolet and physical properties of woolen fabrics cured with citric acid and TiO2/chitosan. J Appl Polym Sci 100:4311-4319.
192. Varesano A, Aluigi A, Tonin C, and Ferrero F (2006) FT-IR study of dopant-wool interactions during PPy deposition. Fibers and Polymers 7:105-111.
193. Kuzuhara A (2003) Chemical modification of keratin fibers using 2-iminothiorane hydrochloride. J Appl Polym Sci 90:3646-3651.
194. Cook JR and Fleischfresser BE (1990) Ultimate tensile properties of normal and modified wool. Text Res J 60:42-49.
195. Harris M, Mizell LR and Fourt L (1942) Ind Eng Chem Res 34:833-838. 196. Church JS, Corino GL, and Woodhead AL (1997) The analysis of merino wool cuticle and
cortical cells by Fourier transform Raman spectroscopy. Biopolym 42:7-17. 197. Liu H and Yu W (2007) Study of the structure transformation of wool fibers with Raman
spectroscopy. J Appl Polym Sci 103:1-7. 198. Cardamone JM, Nuńez A, Ashby R, and Dudley R (2006) Activated peroxide for enzymatic
control of wool shrinkage part I: elucidation. Text Res J 76:99-108. 199. Shao J, Liu J, and Carr CM (2001) Investigation into the synergistic effect between
UV/ozone exposure and peroxide pad-batch bleaching on the printability of wool. Coloration Technol 117:270-5.

179
200. Gordon G (1989) The role of transition metal ions on oxyhalogen redox reactions. Pure & Appl Chem 61:873-878.
201. Kuzmin AO, Savinova ER, and Parmon VN (1999) Partial oxidation of ethane in H2/O2 fuel cell under mild conditions. React Kinet Catal Lett 66:359-366.
202. Deguillaume L, Leriche M, Monod A, and Chaumerliac N (2004) The role of transition metal ions on HOx radicals in clouds: a numerical evaluation of its impact on multiphase chemistry. Atmos Chem Phys 4:95-110.
203. Al-Bahar S (2005) Moisture effect on selected polymer-based membranes used for waterproofing building basements. Polym Compos 26:276-286.
204. Kim MS and Kang TJ (2002) Dimensional and surface properties of plasma and silicone treated wool fabric. Text Res J 72:113-120.
205. Kang TJ and Moon SJ (1998) Crosslinking of wool with epoxide. Text Res J 68:719-726. 206. Taylor AM, Bonser RHC, and Farrent JW (2004) The influence of hydration on the tensile
and compressive properties of avian keratinous tissues. J Mater Sci 39:939-942. 207. Feughelman M and Robinson MS (1967) The relationship between some mechanical
properties of single wool fibers and relative humidity. Text Res J 77:441-446. 208. Kreplak L, Doucet J, and Briki F (2001) Unraveling double stranded -helical coiled coils:
An x-ray diffraction study on hard -keratin fibers. Biopolym 58:526-533. 209. Paris C, Lecomte S, and Coupry C (2005) ATR-FTIR spectroscopy as a way to identify
natural protein-based materials, tortoiseshell and horn, from their protein-based imitation, galalith. Spectrochim Acta, Part A 62:532-538.
210. Greve T, Anderson KB, and Nielsen OF (2008) ATR-FTIR, FT-NIR and near-FT-Raman spectroscopic studies of molecular composition in human skin in vivo and pig ear skin in vitro. Spectrosc 22:437-457.
211. Laugel C, Yagoubi N, and Baillet A (2005) ATR-FTIR spectroscopy: a chemometric approach for studying the lipid organisation of the stratum corneum. Chem Phys Lipids 135:55-68.
212. Tsai JC, Lo YL, Lin CY, Sheu HM, and Lin JC (2004) Feasibility of rapid quantitation of stratum corneum lipid content by Fourier transform infrared spectrometry. Spectrosc 18:423-431.
213. Rogers GE. Electron microscope studies of hair and wool. Ann NY Acad Sci 1959;60:575-584.
214. Rogers GE. Electron Microscopy of Wool. J Ultrastruct Res 1959;2:309-330. 215. Harland DP, Caldwell JP, Woods JL, Walls RJ, Bryson WG. Arrangement of trichokeratin
intermediate filaments and matrix in the cortex of Merino wool. J Struct Biol 2011;173:29-37.
216. McKinnon AJ. The self-assembly of keratin intermediate filaments into macrofibrils: Is this process mediated by a mesophase? Cuur Appl Phys 2006;6:375-378.
217. Rafik ME, Doucet J, Briki F. The intermediate filament architecture as determined by x-ray diffraction modeling of hard α-keratin. BioPhys J 2004;86:3893-3904.

180
Appendices
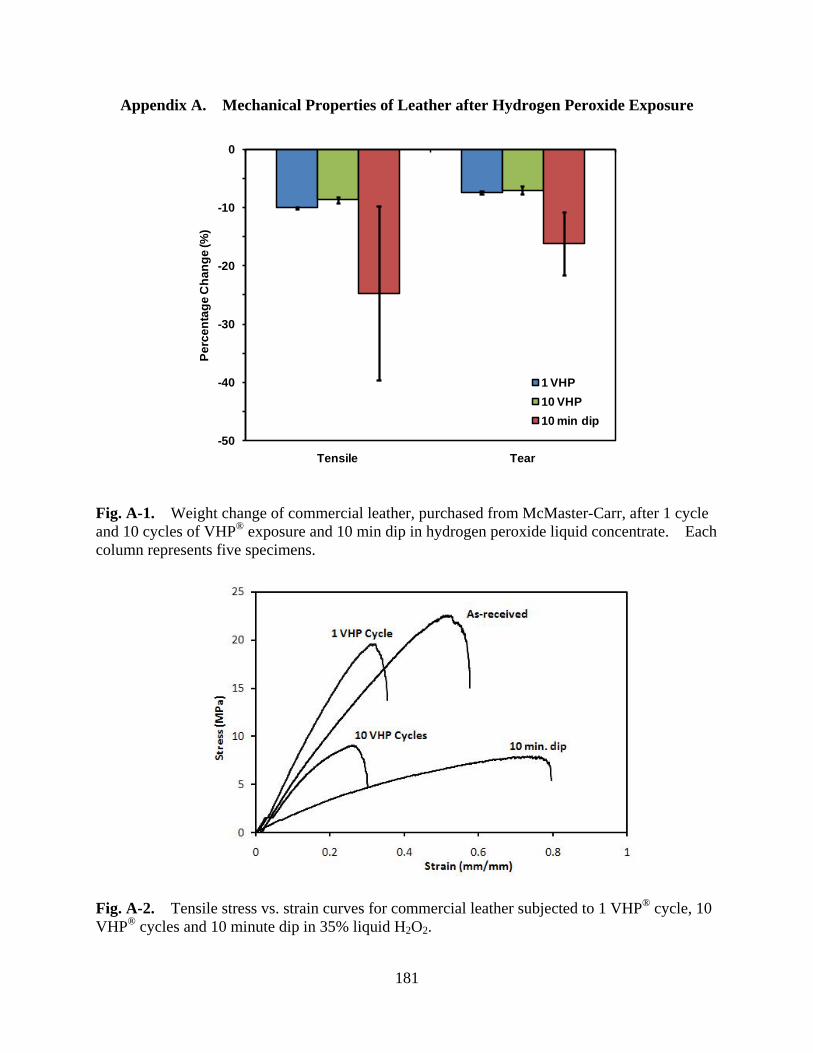
181
Appendix A. Mechanical Properties of Leather after Hydrogen Peroxide Exposure
Fig. A-1. Weight change of commercial leather, purchased from McMaster-Carr, after 1 cycle and 10 cycles of VHP® exposure and 10 min dip in hydrogen peroxide liquid concentrate. Each column represents five specimens.
Fig. A-2. Tensile stress vs. strain curves for commercial leather subjected to 1 VHP® cycle, 10 VHP® cycles and 10 minute dip in 35% liquid H2O2.
-50
-40
-30
-20
-10
0
Tensile Tear
Perc
enta
ge C
hang
e (%
)
1 VHP10 VHP10 min dip
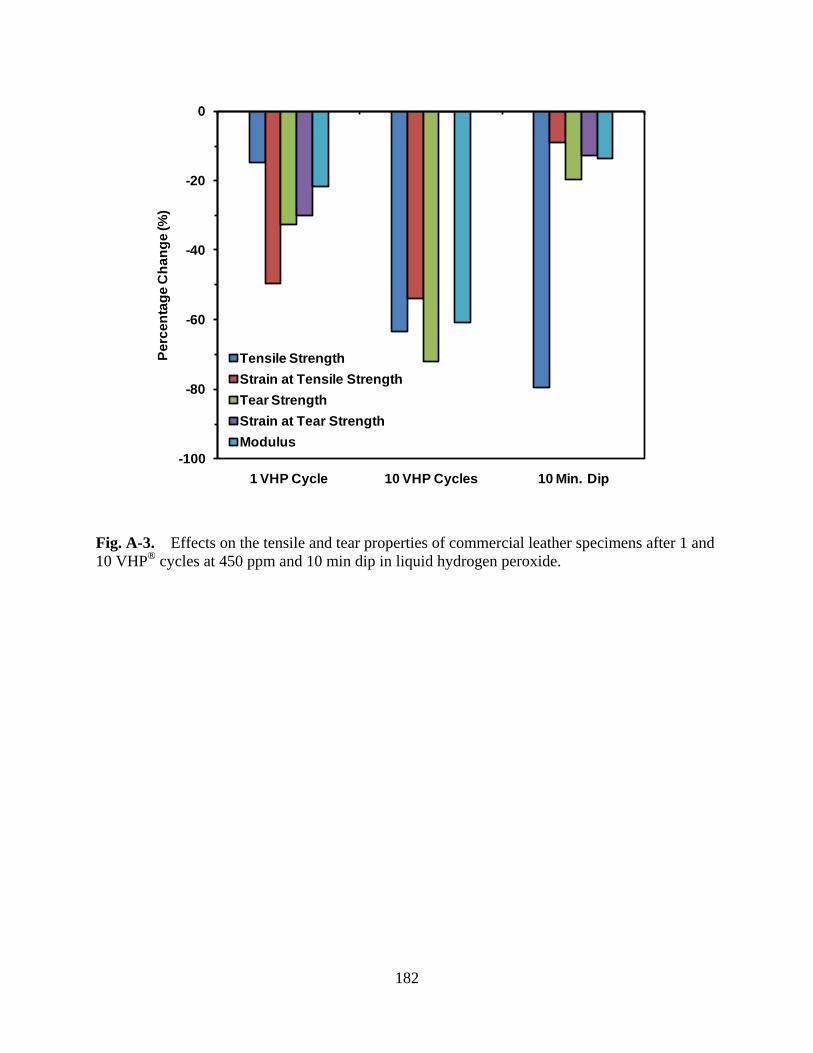
182
Fig. A-3. Effects on the tensile and tear properties of commercial leather specimens after 1 and 10 VHP® cycles at 450 ppm and 10 min dip in liquid hydrogen peroxide.
-100
-80
-60
-40
-20
0
1 VHP Cycle 10 VHP Cycles 10 Min. Dip
Perc
enta
ge C
hang
e (%
)
Tensile StrengthStrain at Tensile StrengthTear StrengthStrain at Tear StrengthModulus
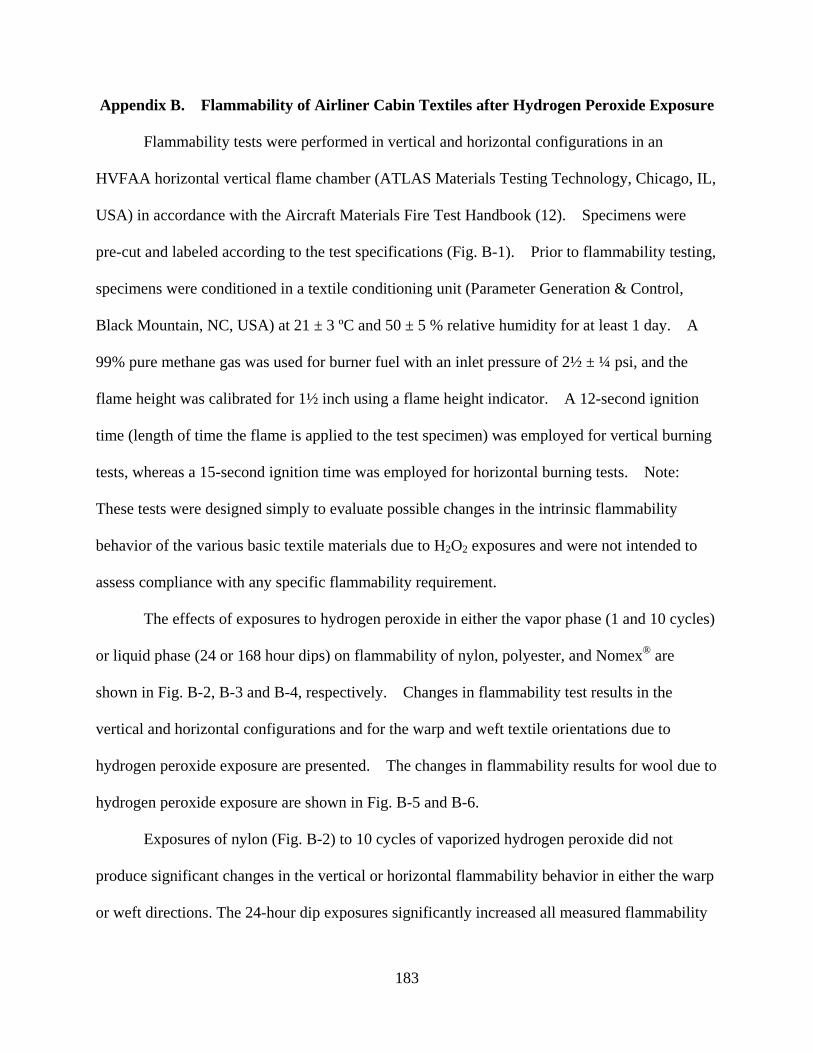
183
Appendix B. Flammability of Airliner Cabin Textiles after Hydrogen Peroxide Exposure
Flammability tests were performed in vertical and horizontal configurations in an
HVFAA horizontal vertical flame chamber (ATLAS Materials Testing Technology, Chicago, IL,
USA) in accordance with the Aircraft Materials Fire Test Handbook (12). Specimens were
pre-cut and labeled according to the test specifications (Fig. B-1). Prior to flammability testing,
specimens were conditioned in a textile conditioning unit (Parameter Generation & Control,
Black Mountain, NC, USA) at 21 ± 3 ºC and 50 ± 5 % relative humidity for at least 1 day. A
99% pure methane gas was used for burner fuel with an inlet pressure of 2½ ± ¼ psi, and the
flame height was calibrated for 1½ inch using a flame height indicator. A 12-second ignition
time (length of time the flame is applied to the test specimen) was employed for vertical burning
tests, whereas a 15-second ignition time was employed for horizontal burning tests. Note:
These tests were designed simply to evaluate possible changes in the intrinsic flammability
behavior of the various basic textile materials due to H2O2 exposures and were not intended to
assess compliance with any specific flammability requirement.
The effects of exposures to hydrogen peroxide in either the vapor phase (1 and 10 cycles)
or liquid phase (24 or 168 hour dips) on flammability of nylon, polyester, and Nomex® are
shown in Fig. B-2, B-3 and B-4, respectively. Changes in flammability test results in the
vertical and horizontal configurations and for the warp and weft textile orientations due to
hydrogen peroxide exposure are presented. The changes in flammability results for wool due to
hydrogen peroxide exposure are shown in Fig. B-5 and B-6.
Exposures of nylon (Fig. B-2) to 10 cycles of vaporized hydrogen peroxide did not
produce significant changes in the vertical or horizontal flammability behavior in either the warp
or weft directions. The 24-hour dip exposures significantly increased all measured flammability

184
parameters for the both vertical and horizontal orientations of the warp weave. In contrast,
168-hour dip exposures produced no statistically significant changes in flammability behavior.
Polyester (Fig. B-3) exhibited significant increases in vertical flammability parameters
for the weft weave during vertical flammability testing, whereas the warp weave showed no
significant changes during vertical flammability testing (vapor or liquid exposures). Horizontal
flammability testing of polyester yielded increases in burn length and burn time for the warp
weave after exposure to 1 or 10 cycles of vaporized hydrogen peroxide; results for the weft
weave were inconclusive. Dip testing of polyester tended to decrease the burn lengths and burn
times during horizontal flammability testing.
Exposures of Nomex® (Fig. B-4) to either the vaporized or the concentrated liquid
hydrogen peroxide did not appear to influence the measured flammability parameters of the
material in either the vertical or horizontal flammability tests for either the warp weave or the
weft weave.
Wool (Fig. B-5) exhibited a consistent trend towards decreases in vertical flammability
parameters for all conditions (vapor exposures, dip exposures, warp and weft weaves). Fig. B-6
shows results for samples of wool (as-received and VHP® treated) after vertical flammability
testing. An expanded brownish region was observed between the flame decomposition product
region and the unburned wool for the VHP® exposed specimens. During horizontal flammability
testing of wool, VHP® treatments usually produced large increases in burn length and burn time,
while dip treatments only produced minor increases in burn length and burn time. This can be
associated with sample weight increases due to moisture sorption in the VHP® process, as well as
in the conditioning unit, thus resulting in incomplete combustion.
185
As noted above, these tests were not intended to evaluate the compliance of any material
with the materials flammability requirements, as outlined in Title 14 of the Code of Federal
Regulations Part § 25.853 and § 25.855 for aircraft compartment interiors of transport category
airplanes. None of these materials had any flame retardants applied.
Nevertheless, it is interesting to note that all flammability results for Nomex® — both
as-received as well as after all exposures to hydrogen peroxide — were within the limits of
§25.853 and § 25.855 for both vertical and horizontal flammability testing.
The horizontal burn rates for nylon and polyester, as-received as well as after all
exposures to hydrogen peroxide, met the requirements of § 25.853 and § 25.855. The
horizontal burn rates for wool (as-received and after all exposures to hydrogen peroxide) did not
meet §25.853 and § 25.855 limits.
Additionally, although the vertical flammability data for wool, nylon and polyester (as
received and as exposed to hydrogen peroxide) met the limits of §25.853 and § 25.855 for drip
flame time, the limits of §25.853 and § 25.855 were not met for these materials with respect to
flame time. The vertical flammability data for nylon and polyester generally met the
requirements of §25.853 and § 25.855 with respect to burn length. The vertical flammability
results regarding burn length for wool showed no consistent trend with respect to meeting the
limits of §25.853 and § 25.855.
Six representative samples of aviation grade, blended wool textiles and six samples of aviation
grade leathers — all presumably with flame retardants applied — were acquired from aviation
suppliers. The wool blends contained either polyamide (5 or 9% by weight) or nylon (8 or 10%
by weight) with the balance natural wool fibers. Any specific flame retardant(s) utilized were
not known for these preliminary tests. Vertical flammability testing was performed on an
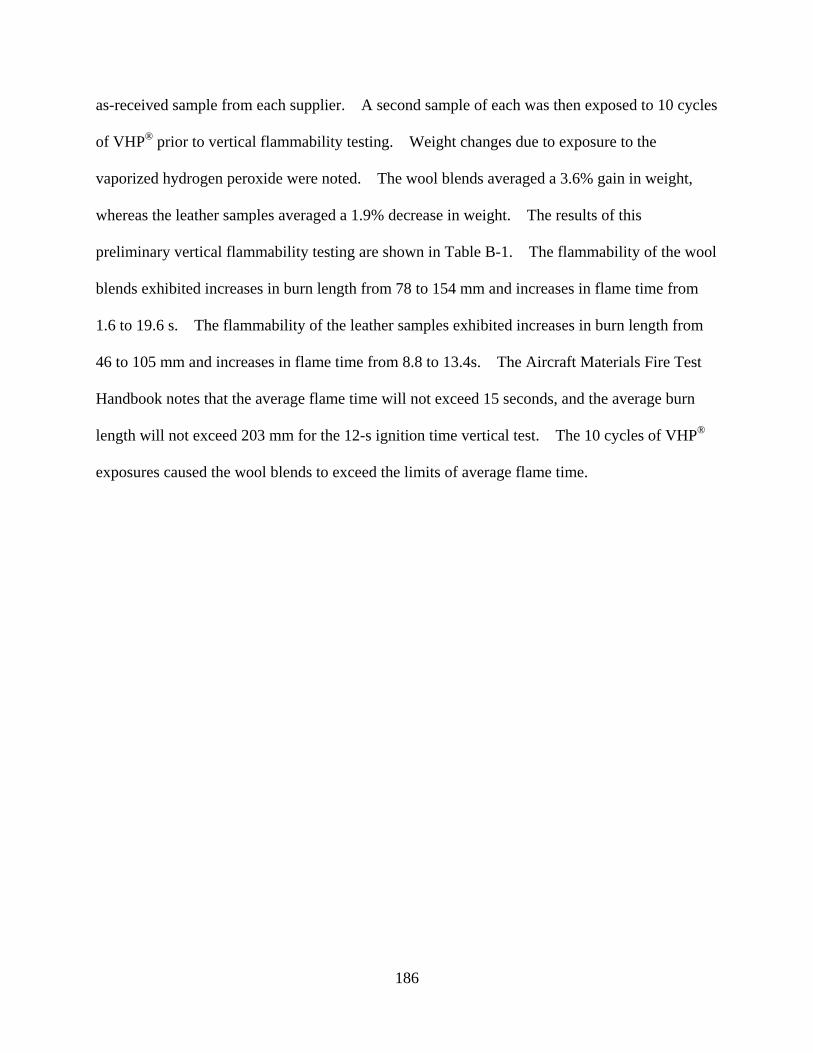
186
as-received sample from each supplier. A second sample of each was then exposed to 10 cycles
of VHP® prior to vertical flammability testing. Weight changes due to exposure to the
vaporized hydrogen peroxide were noted. The wool blends averaged a 3.6% gain in weight,
whereas the leather samples averaged a 1.9% decrease in weight. The results of this
preliminary vertical flammability testing are shown in Table B-1. The flammability of the wool
blends exhibited increases in burn length from 78 to 154 mm and increases in flame time from
1.6 to 19.6 s. The flammability of the leather samples exhibited increases in burn length from
46 to 105 mm and increases in flame time from 8.8 to 13.4s. The Aircraft Materials Fire Test
Handbook notes that the average flame time will not exceed 15 seconds, and the average burn
length will not exceed 203 mm for the 12-s ignition time vertical test. The 10 cycles of VHP®
exposures caused the wool blends to exceed the limits of average flame time.
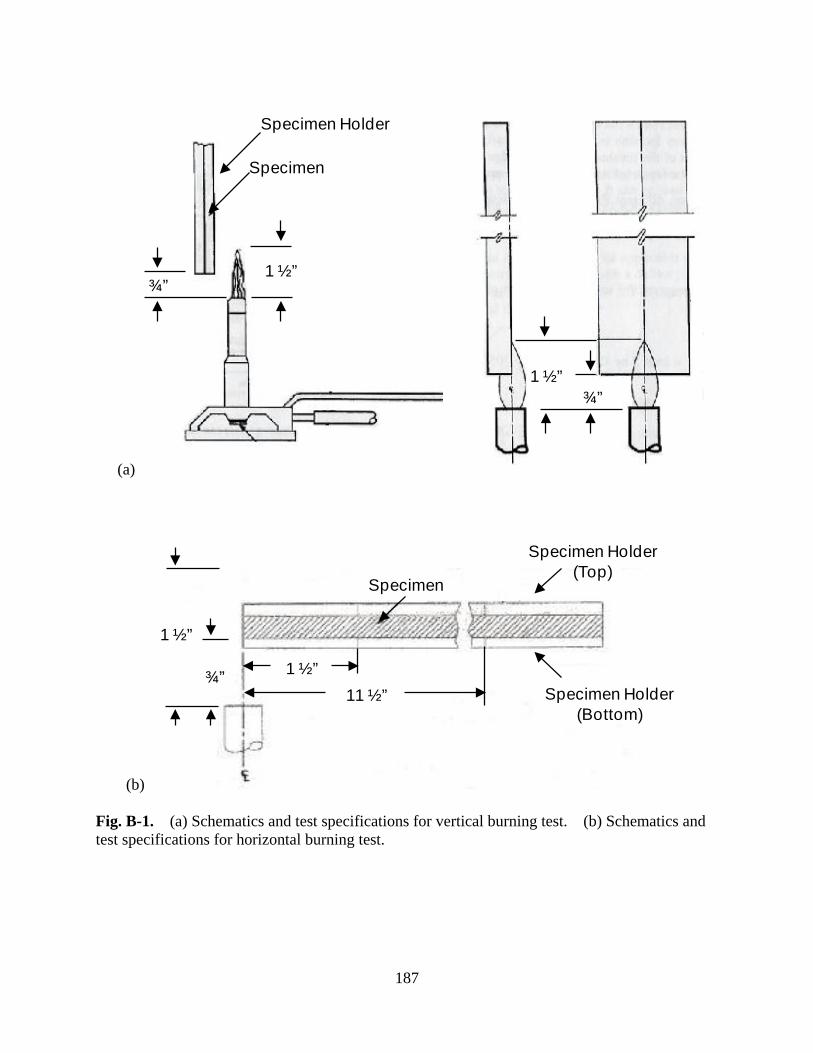
187
(a)
(b)
Fig. B-1. (a) Schematics and test specifications for vertical burning test. (b) Schematics and test specifications for horizontal burning test.
Specimen
Specimen Holder
1 ½”¾”
1 ½”¾”
Specimen Holder(Top)
Specimen Holder(Bottom)
Specimen
¾”
1 ½”
1 ½”11 ½”

188
(a)
(b)
Fig. B-2. (a) Vertical and (b) horizontal flammability test results for nylon.

189
(a)
(b)
Fig. B-3. (a) Vertical and (b) horizontal flammability test results for polyester.

190
(a)
(b)
Fig. B-4. (a) Vertical and (b) horizontal flammability test results for Nomex®.

191
(a)
(b)
Fig. B-5. (a) Vertical and (b) horizontal flammability test results for wool.
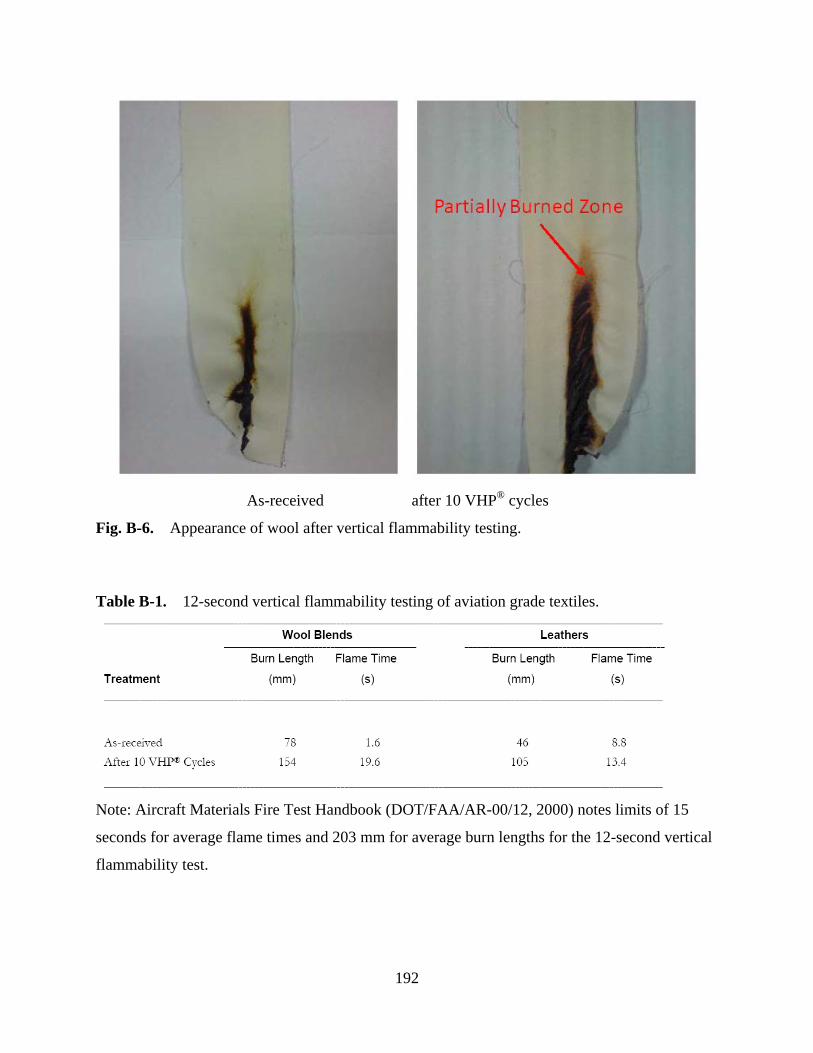
192
As-received after 10 VHP® cycles
Fig. B-6. Appearance of wool after vertical flammability testing.
Table B-1. 12-second vertical flammability testing of aviation grade textiles.
Note: Aircraft Materials Fire Test Handbook (DOT/FAA/AR-00/12, 2000) notes limits of 15
seconds for average flame times and 203 mm for average burn lengths for the 12-second vertical
flammability test.

193
Appendix C. FR4 & Acrylic Coating after Hydrogen Peroxide Exposure
In addition, epoxy impregnated glass fiber fabric composites known as FR4 laminate for
printed circuit board manufacture (3 layer lamination, uncoated: 5.0 mm thick and coated 5.15
mm thick) were acquired from Park Electrochemical Corp. These samples are identified as
FR4 samples in this document. (Fullerton, CA). Some samples of the FR4 laminate were
conformal coated with a 0.075 mm thick 1B31 protective acrylic coating at Humiseal Protective
Coatings (Woodside, NY) before being sectioned into 152 X 12.7 mm test samples for 3 point
bending mechanical tests.
Changes in the various samples after exposures to either 35% liquid hydrogen peroxide
or vaporized hydrogen peroxide were initially examined via straightforward physical observation
(i.e., appearance to the unaided eyes) and weight change. Sample weights were measured by an
accuSeries3 accu-124 balance (Fisher Scientific, Arvada, CO, USA) before and after hydrogen
peroxide exposures. The reported accuracy of this device is +100 µg. Samples were dried in a
vacuum desiccator for 48 hr and then a standard calcium sulfate filled desiccator for 48 hr prior
to measuring the initial weights. The same sample drying procedures were followed after
hydrogen peroxide exposures and prior to post-exposure weight measurements. Weight
changes of the FR4 samples were measured immediately before and after the VHP® processes.
Dipped FR4 specimens were air-dried for at least 1 day prior to weight change measurement.
No visual differences were seen on the surfaces of uncoated FR4 samples after exposure
to hydrogen peroxide (vapor or dip exposures). However, exposing the FR4 samples with the
conformal coating to 35% liquid hydrogen peroxide for 168 hr caused significant blistering and
loss of the acrylic coating, as shown in Fig. C-2. The net changes in weight for the various
samples are shown in Fig. C-3. The carbon fiber/epoxy material exhibited no significant weight
194
change after 10 VHP® exposures but approximately 0.065 % increase in weight after the 168 hr
liquid exposure followed by vacuum drying. The carbon fiberglass fiber/epoxy material
exhibited increases in weight after vacuum drying of about 0.015% after 10 VHP® exposures and
0.035% after the 168 hr liquid exposure.
The FR4 samples (coated and uncoated, longitudinal or transverse orientations) displayed
negligible weight changes after a single VHP® cycle but about 0.02% decrease in weight after 10
VHP® cycles. The 168-hr dip exposures caused increases in weight of about 0.07% for the
uncoated samples and approximately 0.03% for the coated (transverse orientation) samples,
indicating perhaps either some residual absorbed liquid or some slight oxidation of the samples.
The dip exposures of the longitudinally oriented samples shown in Fig. C-2 caused highly
variable weight losses consistent with the blistering of the conformal coating, as shown in Fig.
C-2.
The flexural properties of the FR4 printed circuit board composites are shown in Fig.
C-4. As noted from other composite materials, the flexural properties measured in the
transverse direction were consistently lower than those measured in the longitudinal direction.
No statistically significant differences were found in either the flexural strength or the strain at
peak load as a result of FR4 exposure to hydrogen peroxide vapor or liquid, except for slight
degradation of the FR4 transverse sample strain at peak load after 168 hr dip exposures to 35%
hydrogen peroxide.
FTIR and Raman spectroscopy were used to examine potential changes due to hydrogen
peroxide exposure on the chemical structure of the acrylic conformal coating on the glass
fiber/epoxy FR4 printed circuit board composite (see Fig. C-6), as well as the epoxy matrices of
the carbon fiber/epoxy composite and the FR4 material (see Fig. C-7). The analyses showed no

195
detectable compositional-based changes due to hydrogen peroxide exposures. The usual
characteristic bands observed in the spectra are noted in Fig. C-6 and Fig. C-7.
(a)
(b)
Fig. C-1. Stress vs. strain curve for uncoated FR4 strips utilizing 3-point bending test showing (a) delamination and instant failure behavior in both longitudinal and transverse direction, and (b) elastic recovery curve for longitudinal uncoated FR4 board.
0
100
200
300
400
500
600
700
0 1 2 3 4
Stre
ss (M
Pa)
Strain (%)
Longitudina - Delamination
Longitudinal - Instant Failure
Transverse - Delamination
Transverse - Instant Failure
0
100
200
300
400
0 0.2 0.4 0.6 0.8 1 1.2 1.4 1.6 1.8 2 2.2 2.4
Stre
ss (M
Pa)
Strain (%)
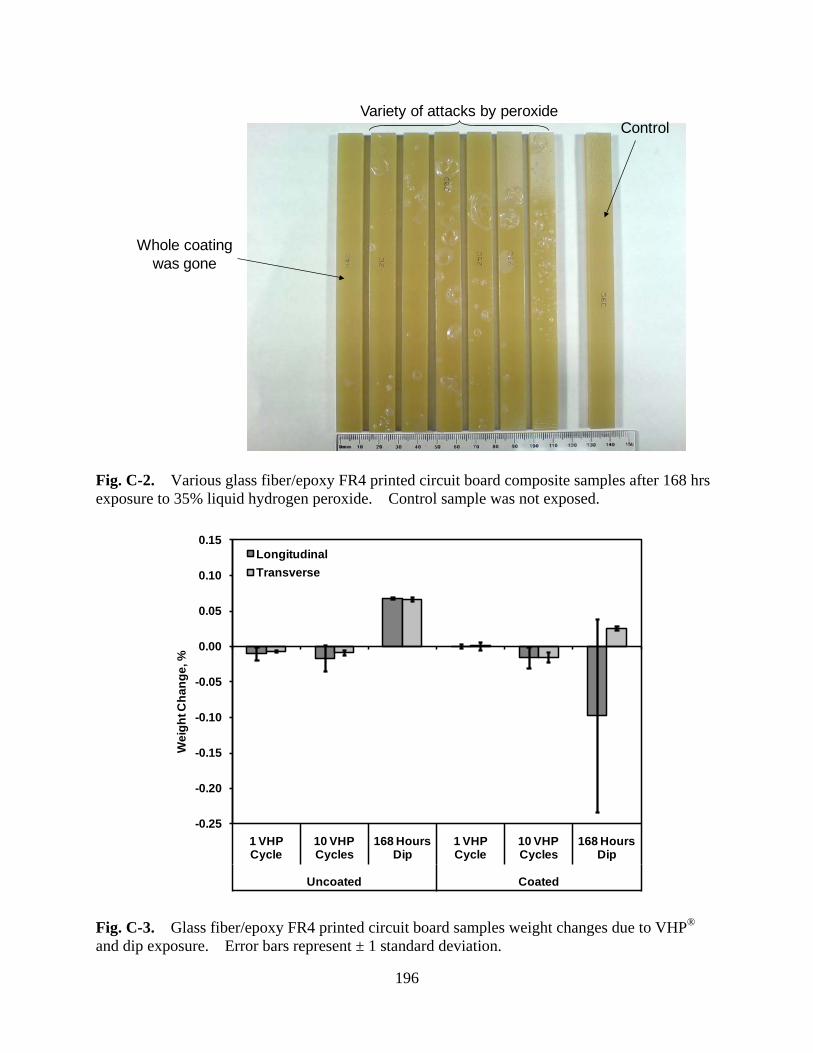
196
Fig. C-2. Various glass fiber/epoxy FR4 printed circuit board composite samples after 168 hrs exposure to 35% liquid hydrogen peroxide. Control sample was not exposed.
Fig. C-3. Glass fiber/epoxy FR4 printed circuit board samples weight changes due to VHP® and dip exposure. Error bars represent ± 1 standard deviation.
Whole coatingwas gone
Variety of attacks by peroxideControl
-0.25
-0.20
-0.15
-0.10
-0.05
0.00
0.05
0.10
0.15
1 VHP Cycle
10 VHP Cycles
168 Hours Dip
1 VHP Cycle
10 VHP Cycles
168 Hours Dip
Uncoated Coated
Wei
ght C
hang
e, %
LongitudinalTransverse
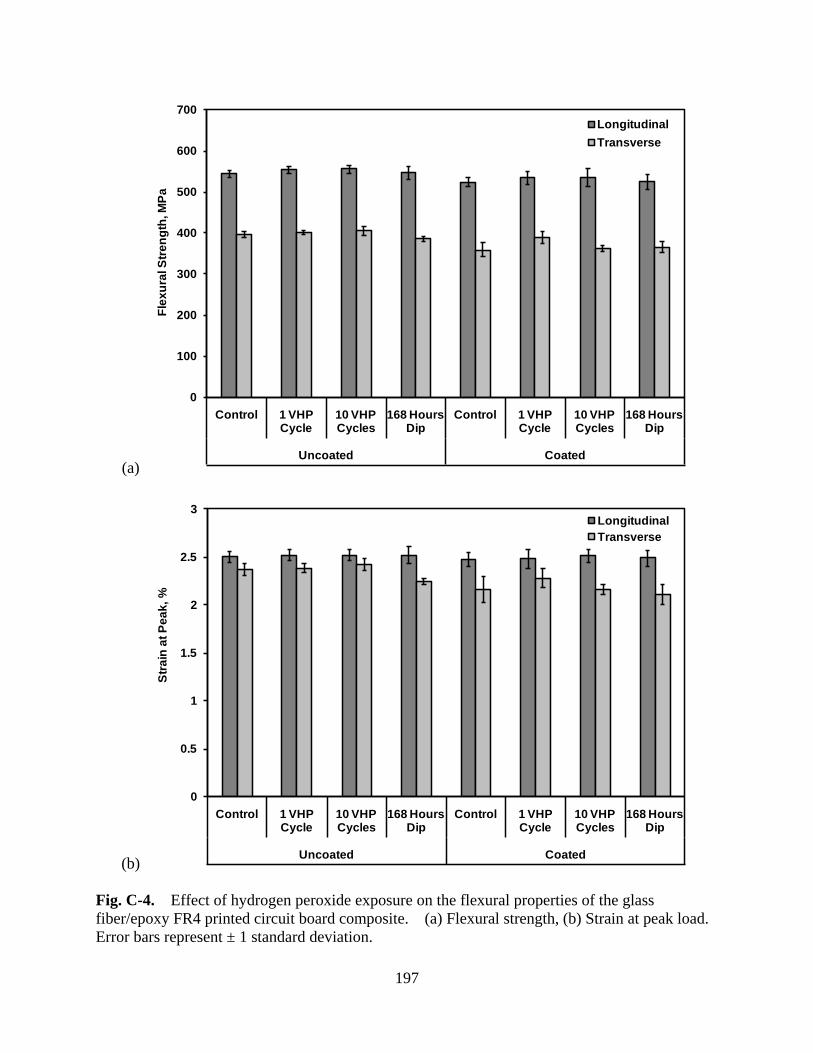
197
(a)
(b)
Fig. C-4. Effect of hydrogen peroxide exposure on the flexural properties of the glass fiber/epoxy FR4 printed circuit board composite. (a) Flexural strength, (b) Strain at peak load. Error bars represent ± 1 standard deviation.
0
100
200
300
400
500
600
700
Control 1 VHP Cycle
10 VHP Cycles
168 Hours Dip
Control 1 VHP Cycle
10 VHP Cycles
168 Hours Dip
Uncoated Coated
Flex
ural
Stre
ngth
, MPa
LongitudinalTransverse
0
0.5
1
1.5
2
2.5
3
Control 1 VHP Cycle
10 VHP Cycles
168 Hours Dip
Control 1 VHP Cycle
10 VHP Cycles
168 Hours Dip
Uncoated Coated
Stra
in a
t Pea
k, %
LongitudinalTransverse

198
Fig. C-5. Fracture surface of FR4 boards.

199
(a)
(b)
Fig. C-6. (a) FTIR and (b) Raman spectroscopy of the acrylic conformal coating from the glass fiber/epoxy FR4 printed circuit board composite.
40
50
60
70
80
90
4008001200160020002400280032003600
Tran
smitt
ance
(%)
Wavenumber (cm-1)
As-received1 VHP Cycle10 VHP Cycles168 Hour Dip
52
62
72
82
6008001000120014001600
Tran
smitt
ance
(%)
Wavenumber (cm-1)
C-O
CH2 rocking,scissoring, and wagging
C=O

200
(a)
(b)
Fig. C-7. Raman spectroscopy of the epoxy matrix from the (a) carbon fiber/epoxy structural composite and (b) glass fiber/epoxy FR4 printed circuit board composite.
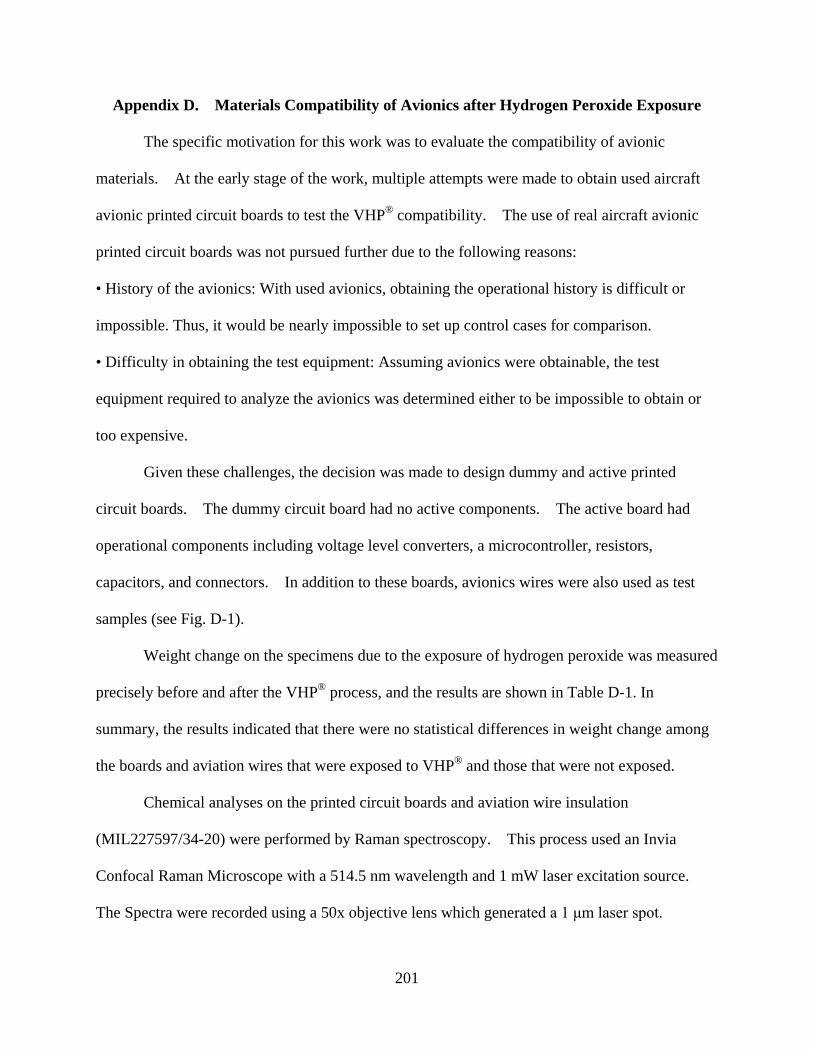
201
Appendix D. Materials Compatibility of Avionics after Hydrogen Peroxide Exposure
The specific motivation for this work was to evaluate the compatibility of avionic
materials. At the early stage of the work, multiple attempts were made to obtain used aircraft
avionic printed circuit boards to test the VHP® compatibility. The use of real aircraft avionic
printed circuit boards was not pursued further due to the following reasons:
• History of the avionics: With used avionics, obtaining the operational history is difficult or
impossible. Thus, it would be nearly impossible to set up control cases for comparison.
• Difficulty in obtaining the test equipment: Assuming avionics were obtainable, the test
equipment required to analyze the avionics was determined either to be impossible to obtain or
too expensive.
Given these challenges, the decision was made to design dummy and active printed
circuit boards. The dummy circuit board had no active components. The active board had
operational components including voltage level converters, a microcontroller, resistors,
capacitors, and connectors. In addition to these boards, avionics wires were also used as test
samples (see Fig. D-1).
Weight change on the specimens due to the exposure of hydrogen peroxide was measured
precisely before and after the VHP® process, and the results are shown in Table D-1. In
summary, the results indicated that there were no statistical differences in weight change among
the boards and aviation wires that were exposed to VHP® and those that were not exposed.
Chemical analyses on the printed circuit boards and aviation wire insulation
(MIL227597/34-20) were performed by Raman spectroscopy. This process used an Invia
Confocal Raman Microscope with a 514.5 nm wavelength and 1 mW laser excitation source.
The Spectra were recorded using a 50x objective lens which generated a 1 μm laser spot.

202
Additional examination of the surface composition of copper layer on the test boards was
accomplished using X-ray photoelectron spectroscopy (XPS) and Auger electron spectroscopy.
The glass transition temperature of the wire insulation layer was measured by differential
scanning calorimetry (DSC). Complete chemical analyses of the epoxy resin on the FR4 board
and the acrylic coating using Raman Spectroscopy can be found in the previous report of effects
of hydrogen peroxide on common aviation structural materials.
Fig. D-2 shows the results from Auger electron spectroscopy on the copper layer of the
print circuit boards. The major peaks include Cu, O, and C. No significant chemical changes
were found even after 25 VHP® cycles. XPS results (Fig. D-3) on the copper layer revealed
small surface changes on the sample exposed to 25 VHP® cycles. The binding energy between
2p1/2 and 2p3/2 increased slightly from 19.4 eV to 20.3 eV. This increase is an indication of an
increase in the presence of CuO. Upon closer inspection of the 2p3/2 peak, one can see that only
CuO feature is present (see the 25 VHP® cycle data in the magnified image in Fig. D-3). Table
D-2 shows the surface elemental composition for the control and exposed specimens. The
percentage of oxygen atoms increased from 27 % for the control sample to 41 % for the exposed
sample, and the presence of Cl and Sn was due to surface contamination.
Results from the Raman spectroscopy of aviation wire insulation (MIL227597/34-20) are
shown in Fig. D-4. Extraction of the characteristic bands from the insulation material was
difficult, because the surface of the insulation layer contains chemicals that raise the fluorescence
noise (curving background). To accomplish the extraction, data were collected from eight tests
and normalized using a fifth-order polynomial. Peaks at 1445 cm-1 and 2970 cm-1 were
assigned to CH2 and CH vibration, respectively. Additionally, the CF vibration band was
observed at 840 cm-1 as shown in the magnified image in Fig. D-4. These characteristic bands
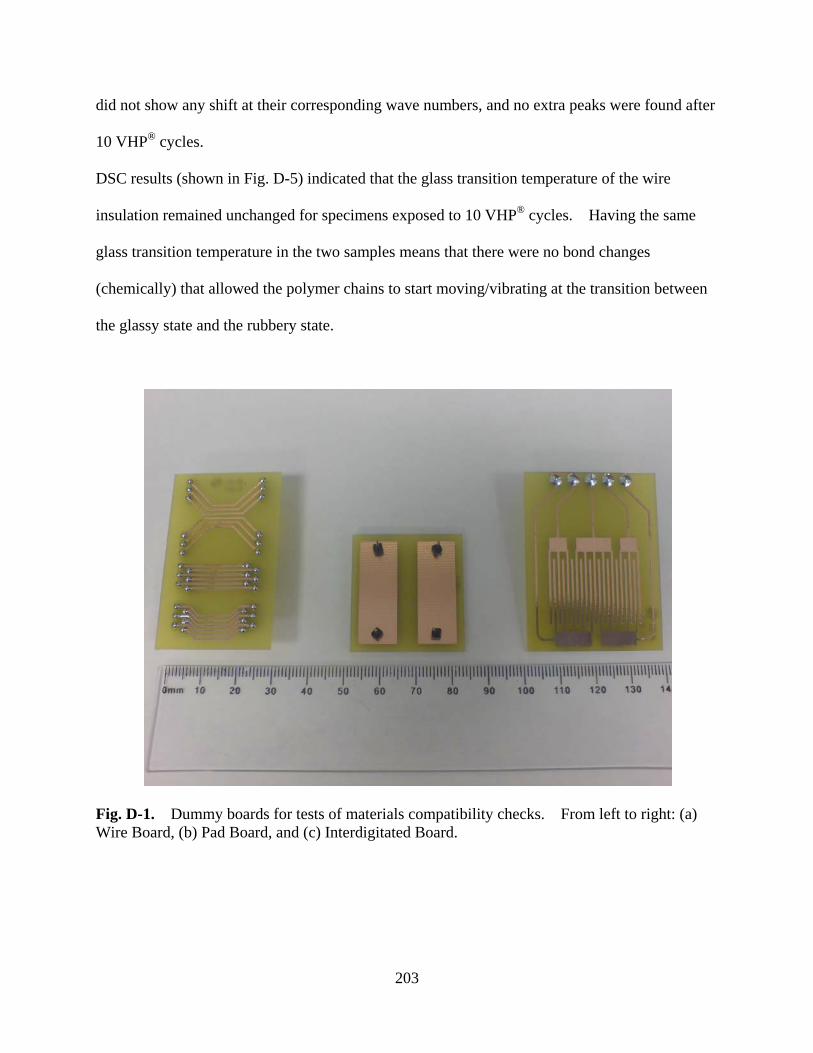
203
did not show any shift at their corresponding wave numbers, and no extra peaks were found after
10 VHP® cycles.
DSC results (shown in Fig. D-5) indicated that the glass transition temperature of the wire
insulation remained unchanged for specimens exposed to 10 VHP® cycles. Having the same
glass transition temperature in the two samples means that there were no bond changes
(chemically) that allowed the polymer chains to start moving/vibrating at the transition between
the glassy state and the rubbery state.
Fig. D-1. Dummy boards for tests of materials compatibility checks. From left to right: (a) Wire Board, (b) Pad Board, and (c) Interdigitated Board.
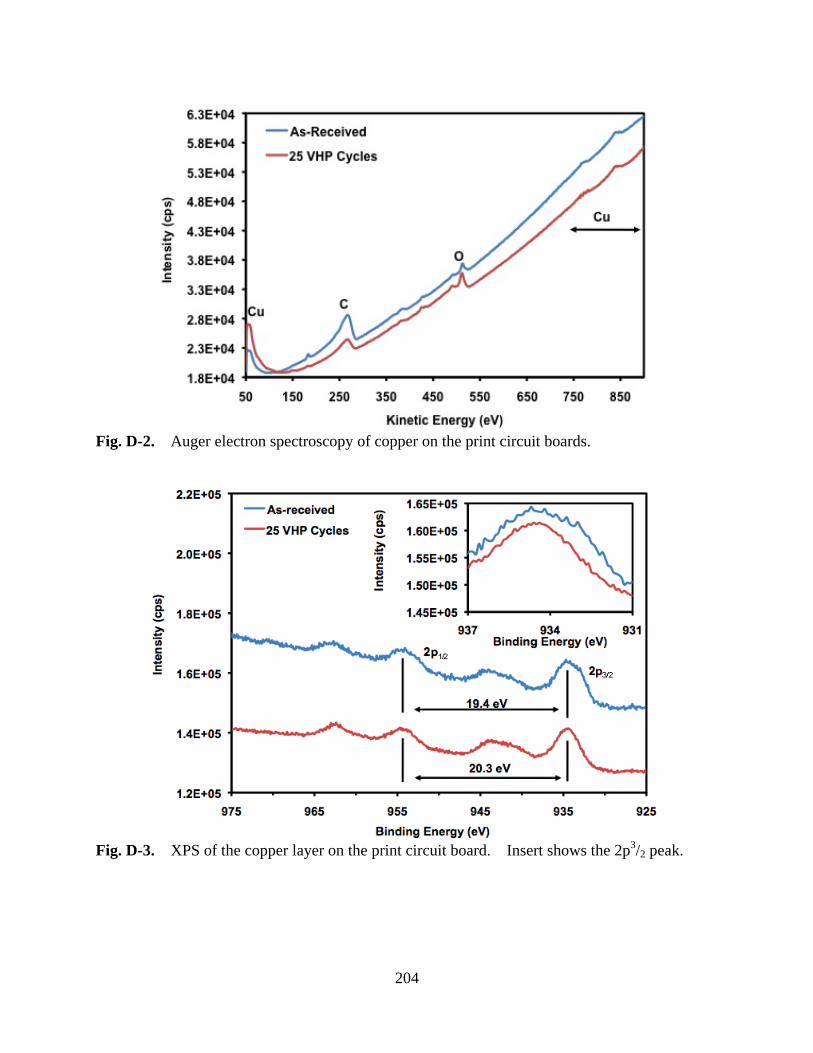
204
Fig. D-2. Auger electron spectroscopy of copper on the print circuit boards.
Fig. D-3. XPS of the copper layer on the print circuit board. Insert shows the 2p3/2 peak.

205
Fig. D-4. Raman spectra of the insulation layer on the aviation wire.
Fig. D-5. DSC diagram of the insulation layer on the aviation wire.

206
Table D-I. Percentage weight change of the printed circuit boards and aviation wire after VHP® treatment.
Percentage Weight Change (Standard Deviation), %
Specimen Uncoated Coated Aviation
Wire Pad Wire Interdigitated Pad Wire Interdigitated -0.04
(0.01) -0.06 (0.01)
-0.07 (0.01)
-0.03 (0.01)
-0.05 (0.02)
-0.07 (0.01)
0.07 (0.01)
Table D-II. Surface elemental composition of the print circuit board by XPS
Surface Elemental Composition (atom %) Specimen Cu O C N Cl Sn Control 14 27 52 1 5 1
25 VHP® 11 41 45 0 0 3