eefit mission: october 8, 2005 kashmir earthquake · eefit mission: october 8, 2005 kashmir...
TRANSCRIPT

EEFIT Mission: October 8, 2005 Kashmir Earthquake Dr Navin Peiris, Arup, London Dr Tiziana Rossetto, University College London Dr Paul Burton, University of East Anglia Mr Suqlain Mahmood, Sir Robert McAlpine
Introduction On October 8, 2005 at 0850 local time (0350 UTC) an earthquake of magnitude 7.6 (Mw) occurred in northern Pakistan, which caused widespread destruction in Azad Jammu Kashmir (AJK) and in the eastern districts of North West Frontier Province (NWFP). As of January 1, 2006, the total casualty figures in Pakistan alone stood at 72,763 deaths and 68,679 injuries. Close to 400,000 homes were fully destroyed and damaged leaving about 2.8million people without shelter. The heaviest damage occurred to cities of Muzaffarabad and Balakot that were nearest to the fault rupture responsible for the earthquake. Ground shaking was felt as far south as Islamabad, resulting in one spectacular building collapse. Heavy damage was also reported from the Indian side of Kashmir. The worst affected towns were Tangadhar in Kupwara district and Uri in Baramula district (see Figure 1) where about 80% of the town was destroyed. At least 946 people killed and 4386 injured in India (USGS, 2005).Furthermore, the ground shaking caused numerous landslides and rockfalls to be triggered that damaged roads and bridges, blocking access to heavily damaged areas and hampering the relief effort. The total losses to public and private assets in amount to US$2.3 billion with an overall cost of US$5.2 billion (including recovery needs).
Figure 1: Earthquake epicentre and aftershocks (USGS, 2005)
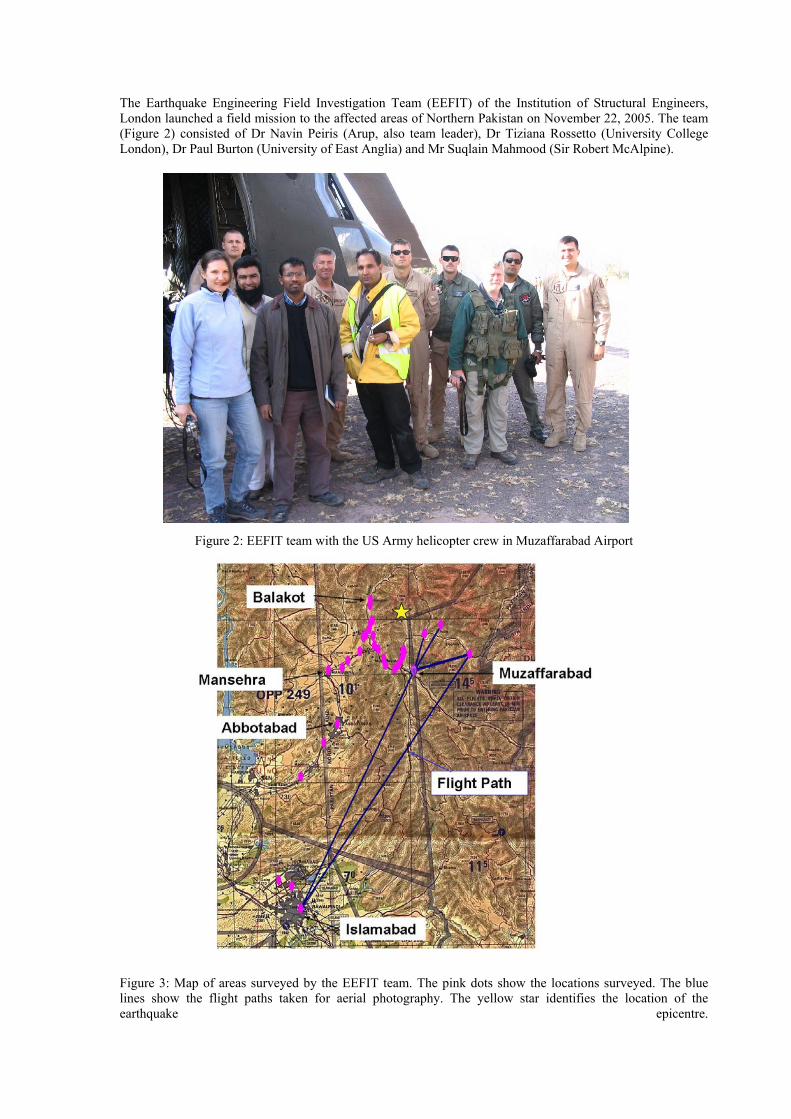
The Earthquake Engineering Field Investigation Team (EEFIT) of the Institution of Structural Engineers, London launched a field mission to the affected areas of Northern Pakistan on November 22, 2005. The team (Figure 2) consisted of Dr Navin Peiris (Arup, also team leader), Dr Tiziana Rossetto (University College London), Dr Paul Burton (University of East Anglia) and Mr Suqlain Mahmood (Sir Robert McAlpine).
Figure 2: EEFIT team with the US Army helicopter crew in Muzaffarabad Airport
Figure 3: Map of areas surveyed by the EEFIT team. The pink dots show the locations surveyed. The blue lines show the flight paths taken for aerial photography. The yellow star identifies the location of the earthquake epicentre.
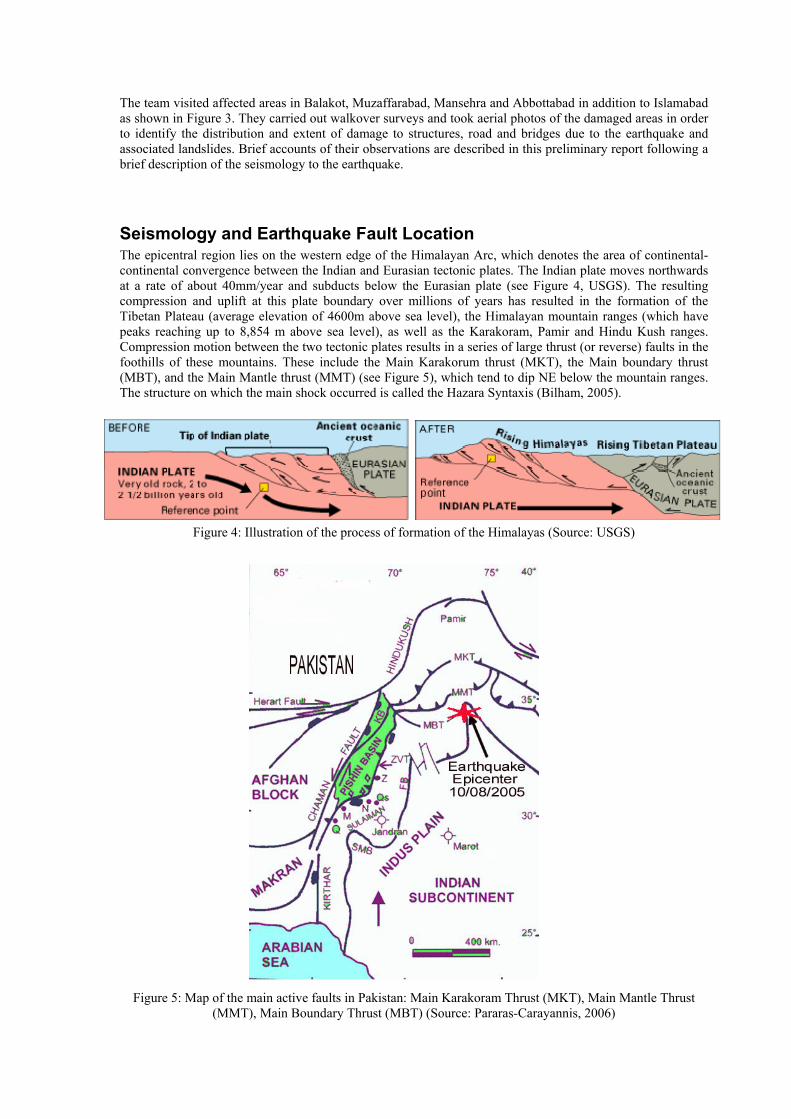
The team visited affected areas in Balakot, Muzaffarabad, Mansehra and Abbottabad in addition to Islamabad as shown in Figure 3. They carried out walkover surveys and took aerial photos of the damaged areas in order to identify the distribution and extent of damage to structures, road and bridges due to the earthquake and associated landslides. Brief accounts of their observations are described in this preliminary report following a brief description of the seismology to the earthquake.
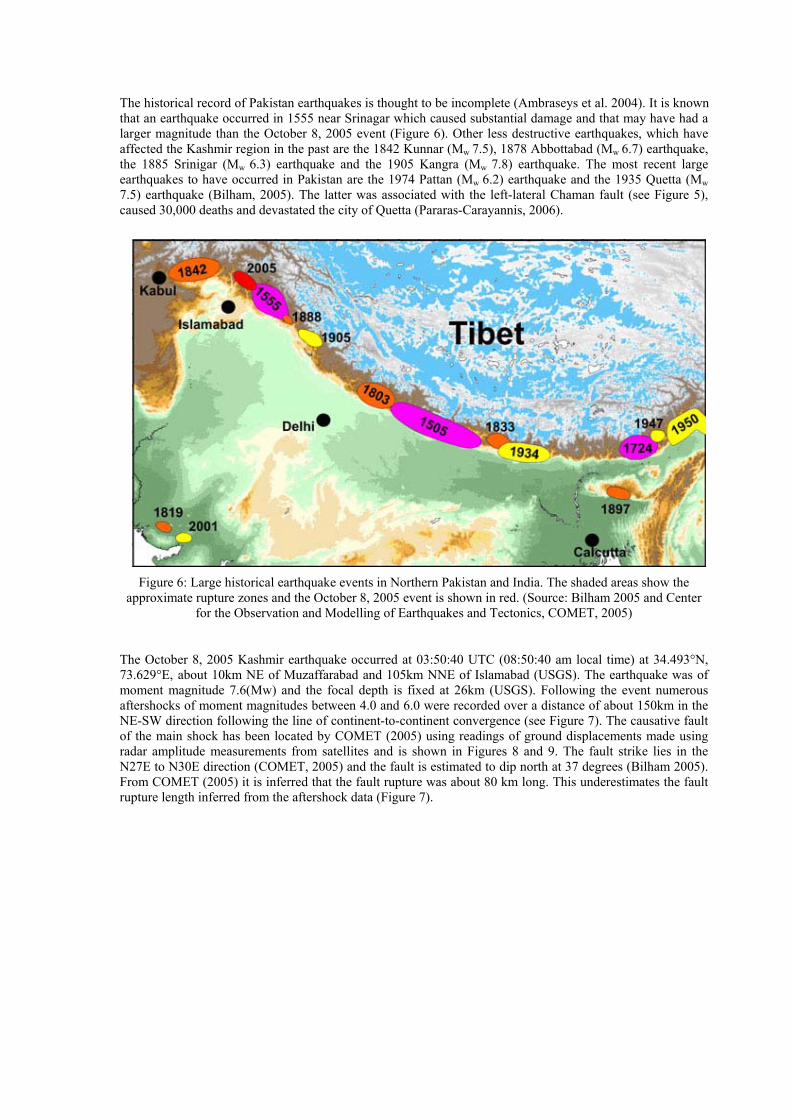
Seismology and Earthquake Fault Location The epicentral region lies on the western edge of the Himalayan Arc, which denotes the area of continental-continental convergence between the Indian and Eurasian tectonic plates. The Indian plate moves northwards at a rate of about 40mm/year and subducts below the Eurasian plate (see Figure 4, USGS). The resulting compression and uplift at this plate boundary over millions of years has resulted in the formation of the Tibetan Plateau (average elevation of 4600m above sea level), the Himalayan mountain ranges (which have peaks reaching up to 8,854 m above sea level), as well as the Karakoram, Pamir and Hindu Kush ranges. Compression motion between the two tectonic plates results in a series of large thrust (or reverse) faults in the foothills of these mountains. These include the Main Karakorum thrust (MKT), the Main boundary thrust (MBT), and the Main Mantle thrust (MMT) (see Figure 5), which tend to dip NE below the mountain ranges. The structure on which the main shock occurred is called the Hazara Syntaxis (Bilham, 2005).
Figure 4: Illustration of the process of formation of the Himalayas (Source: USGS)
Figure 5: Map of the main active faults in Pakistan: Main Karakoram Thrust (MKT), Main Mantle Thrust (MMT), Main Boundary Thrust (MBT) (Source: Pararas-Carayannis, 2006)
The historical record of Pakistan earthquakes is thought to be incomplete (Ambraseys et al. 2004). It is known that an earthquake occurred in 1555 near Srinagar which caused substantial damage and that may have had a larger magnitude than the October 8, 2005 event (Figure 6). Other less destructive earthquakes, which have affected the Kashmir region in the past are the 1842 Kunnar (Mw 7.5), 1878 Abbottabad (Mw 6.7) earthquake, the 1885 Srinigar (Mw 6.3) earthquake and the 1905 Kangra (Mw 7.8) earthquake. The most recent large earthquakes to have occurred in Pakistan are the 1974 Pattan (Mw 6.2) earthquake and the 1935 Quetta (Mw 7.5) earthquake (Bilham, 2005). The latter was associated with the left-lateral Chaman fault (see Figure 5), caused 30,000 deaths and devastated the city of Quetta (Pararas-Carayannis, 2006).
Figure 6: Large historical earthquake events in Northern Pakistan and India. The shaded areas show the approximate rupture zones and the October 8, 2005 event is shown in red. (Source: Bilham 2005 and Center
for the Observation and Modelling of Earthquakes and Tectonics, COMET, 2005)
The October 8, 2005 Kashmir earthquake occurred at 03:50:40 UTC (08:50:40 am local time) at 34.493°N, 73.629°E, about 10km NE of Muzaffarabad and 105km NNE of Islamabad (USGS). The earthquake was of moment magnitude 7.6(Mw) and the focal depth is fixed at 26km (USGS). Following the event numerous aftershocks of moment magnitudes between 4.0 and 6.0 were recorded over a distance of about 150km in the NE-SW direction following the line of continent-to-continent convergence (see Figure 7). The causative fault of the main shock has been located by COMET (2005) using readings of ground displacements made using radar amplitude measurements from satellites and is shown in Figures 8 and 9. The fault strike lies in the N27E to N30E direction (COMET, 2005) and the fault is estimated to dip north at 37 degrees (Bilham 2005). From COMET (2005) it is inferred that the fault rupture was about 80 km long. This underestimates the fault rupture length inferred from the aftershock data (Figure 7).

Figure 7: Map showing the location of the aftershocks of the October 8, 2005 earthquake recorded up to October 24, 2005 (Source: British Geological Survey (BGS), 2005)
The surface trace of the causative fault as interpreted from the map of ground displacements from radar amplitude measurements (COMET, 2005) approximately coincides with that predicted by Bilham (2005) from observation of the location and orientation of large landslides resulting from the event. The majority of the landslides were indeed observed by Bilham (2005) and by EEFIT to extend from Balakot to a few kilometers SE of Muzaffarabad. An extension of this line of landslides was also observed by EEFIT together with Dr Bijan Kazai of the EERI team to coincide with a series of ground cracks running for 200-300m through the town of Balakot that were not associated with any direct land sliding and might be a further surface expression of the fault movement below the earth’s surface (Figure 10). The two black dots plotted on Figure 8 show some of the GPS readings taken of the crack trace. These dots are seen to lie almost directly over the fault line location prediction made by COMET (2005). However, this is a preliminary observation and more detailed follow up work on our observations is required before anything may be concluded.
Balakot
Muzaffarabad

Figure 8: Map showing the location of the causative fault of the October 8, 2005 earthquake (Source: COMET, 2005)
Figure 9: 3D perspective view of the Kashmir earthquake region and Muzaffarabad. The image is formed by draping LANDSAT 7 imagery over NASA SRTM (Shuttle Radar Topography Mission) digital topography. The fault identified by radar imagery is marked as a yellow dotted line. The mountains are higher on the far
(north-eastern) side of the fault. (Source: COMET, 2005).
EEFIT and Kazai observed ground cracks
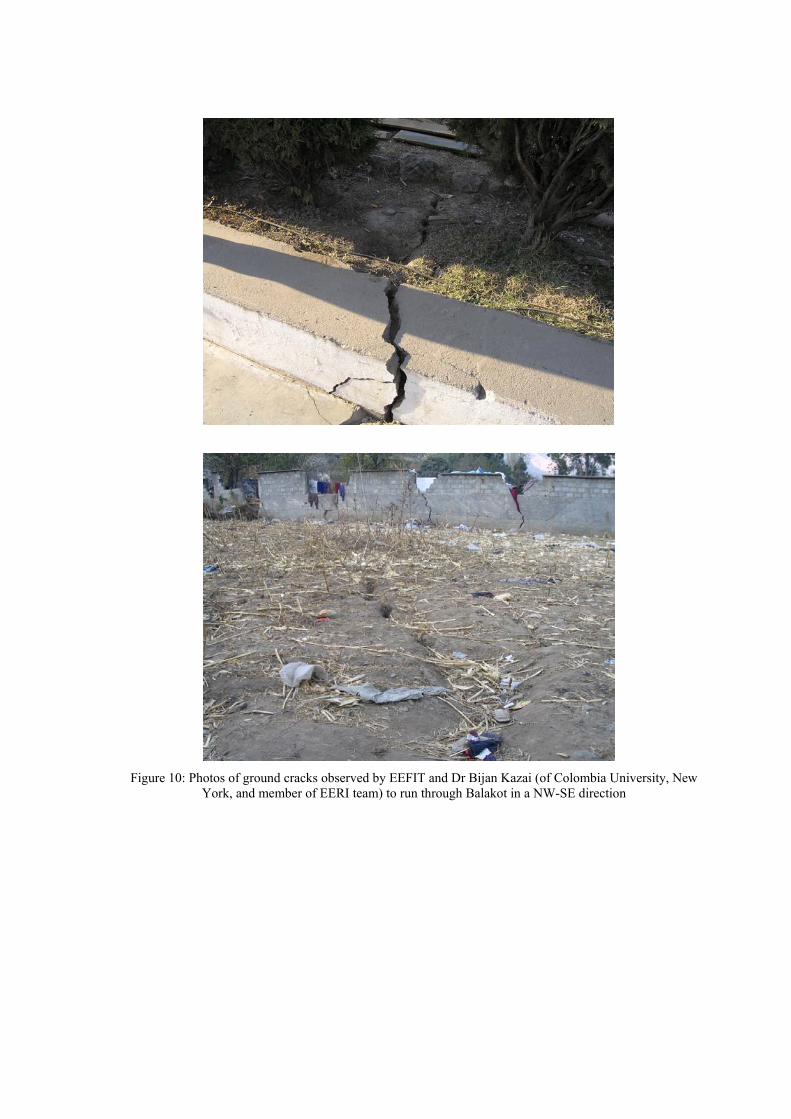
Figure 10: Photos of ground cracks observed by EEFIT and Dr Bijan Kazai (of Colombia University, New York, and member of EERI team) to run through Balakot in a NW-SE direction
Damage Observations in Visited Towns/Cities Figure 3 shows visited cities and towns in the earthquake affected areas of Pakistan’s North West Frontier Province (NWFP) and Azad Jammu Kashmir (AJK) province. The damage observed during the surveys by EEFIT is described below.
Balakot Balakot is one of the worst affected cities with a population of about 80,000. The city is located at approximately 30km northwest of the epicenter and in the aftershock zone as shown in Figure 1.
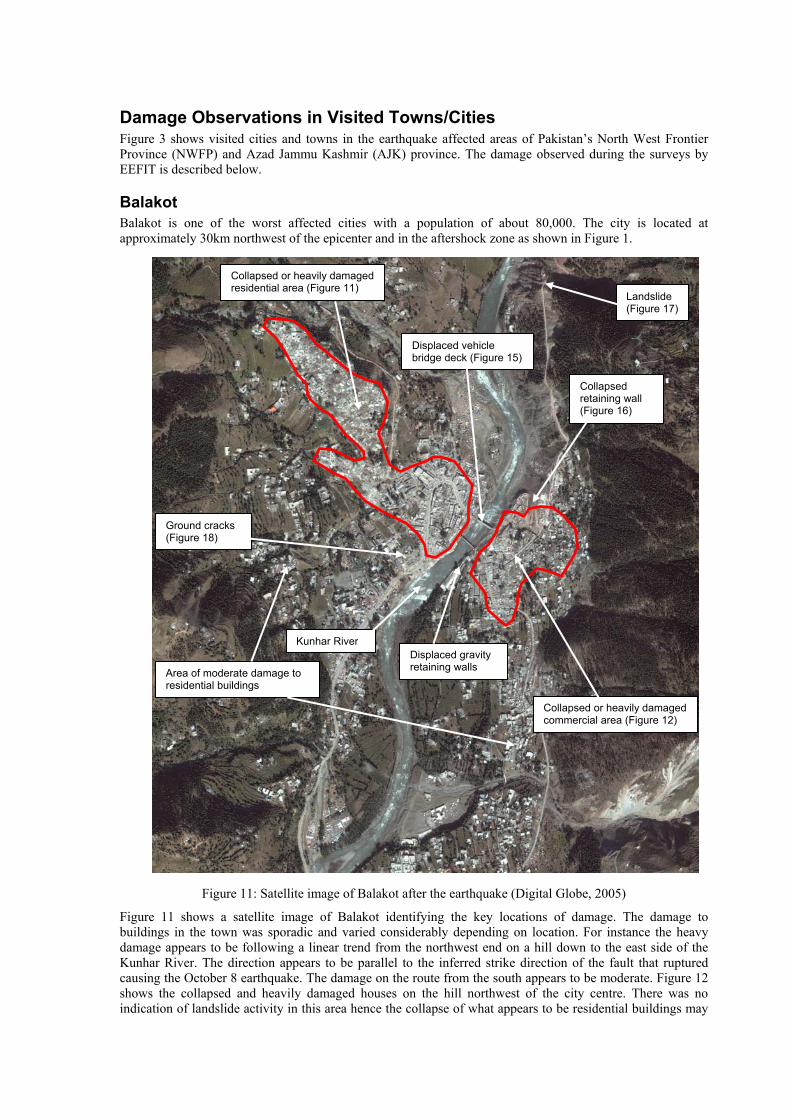
Figure 11: Satellite image of Balakot after the earthquake (Digital Globe, 2005)
Figure 11 shows a satellite image of Balakot identifying the key locations of damage. The damage to buildings in the town was sporadic and varied considerably depending on location. For instance the heavy damage appears to be following a linear trend from the northwest end on a hill down to the east side of the Kunhar River. The direction appears to be parallel to the inferred strike direction of the fault that ruptured causing the October 8 earthquake. The damage on the route from the south appears to be moderate. Figure 12 shows the collapsed and heavily damaged houses on the hill northwest of the city centre. There was no indication of landslide activity in this area hence the collapse of what appears to be residential buildings may
Collapsed or heavily damaged residential area (Figure 11)
Collapsed or heavily damaged commercial area (Figure 12)
Displaced vehicle bridge deck (Figure 15)
Collapsed retaining wall (Figure 16)
Landslide (Figure 17)
Area of moderate damage to residential buildings
Displaced gravity retaining walls
Ground cracks (Figure 18)
Kunhar River
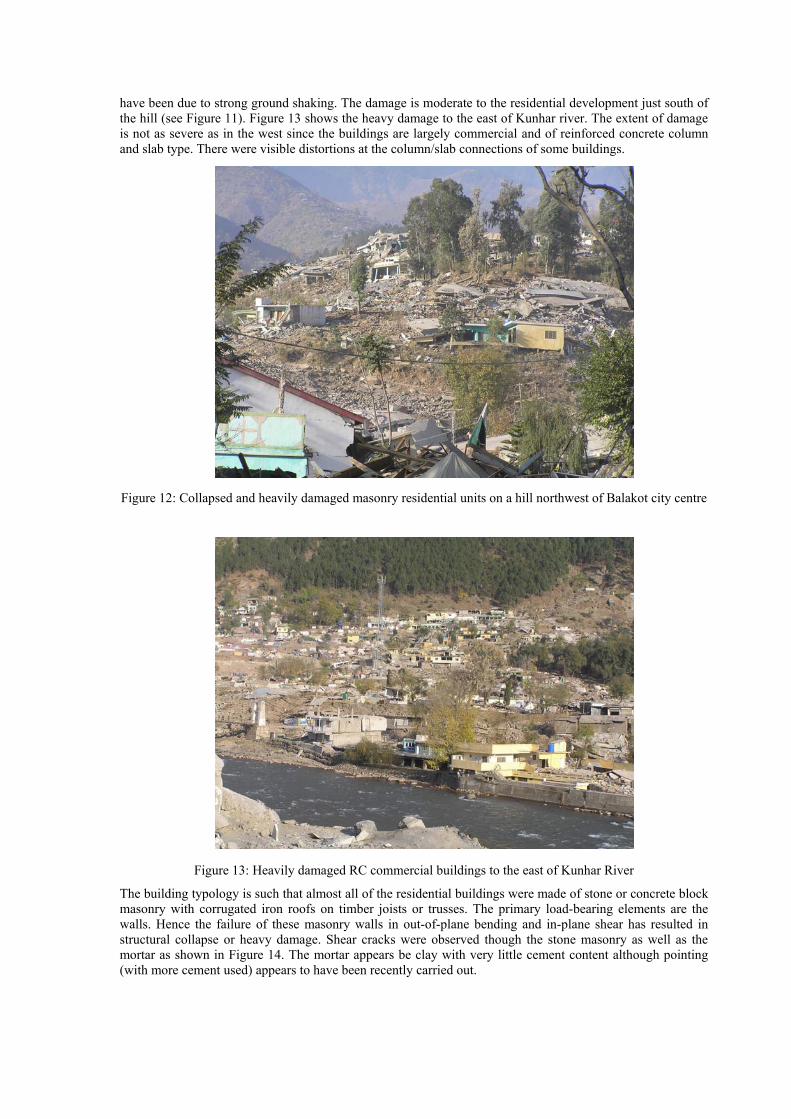
have been due to strong ground shaking. The damage is moderate to the residential development just south of the hill (see Figure 11). Figure 13 shows the heavy damage to the east of Kunhar river. The extent of damage is not as severe as in the west since the buildings are largely commercial and of reinforced concrete column and slab type. There were visible distortions at the column/slab connections of some buildings.
Figure 12: Collapsed and heavily damaged masonry residential units on a hill northwest of Balakot city centre
Figure 13: Heavily damaged RC commercial buildings to the east of Kunhar River
The building typology is such that almost all of the residential buildings were made of stone or concrete block masonry with corrugated iron roofs on timber joists or trusses. The primary load-bearing elements are the walls. Hence the failure of these masonry walls in out-of-plane bending and in-plane shear has resulted in structural collapse or heavy damage. Shear cracks were observed though the stone masonry as well as the mortar as shown in Figure 14. The mortar appears be clay with very little cement content although pointing (with more cement used) appears to have been recently carried out.
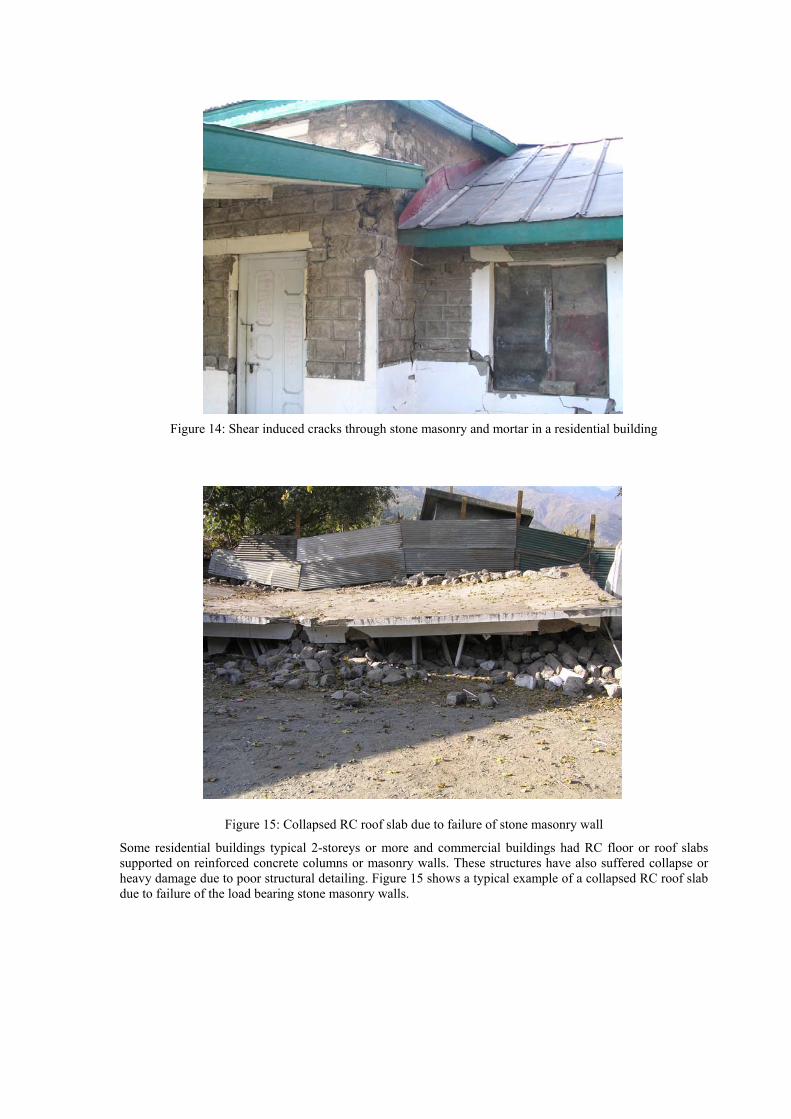
Figure 14: Shear induced cracks through stone masonry and mortar in a residential building
Figure 15: Collapsed RC roof slab due to failure of stone masonry wall
Some residential buildings typical 2-storeys or more and commercial buildings had RC floor or roof slabs supported on reinforced concrete columns or masonry walls. These structures have also suffered collapse or heavy damage due to poor structural detailing. Figure 15 shows a typical example of a collapsed RC roof slab due to failure of the load bearing stone masonry walls.

Figure 16: Laterally displaced RC deck of the vehicle bridge in Balakot (Photo by UET Peshawar)
Figure 17: Collapsed retaining wall on the road east of the city
The pedestrian and vehicle bridges performed well despite a lateral deck displacement of about 1m relative to the piers in the vehicle bridge as shown in Figure 16. Some of the retaining walls protecting the road descending to the city from the east have collapsed (Figure 17) and some concrete gravity retaining walls have also been displaced toward the river. The retaining walls supporting the roads do not appear to have any anchoring to provide sufficient support for the roads. A landslide was observed to the north of the city blocking a supply route from the north (Figure 18). Ground cracks were also seen near the heavily collapsed residential area (see Figure 11). These cracks appear to extend from the road toward the hill (Figure 19) and appear to be responsible for cracking of walls and floor slabs of some residential buildings.
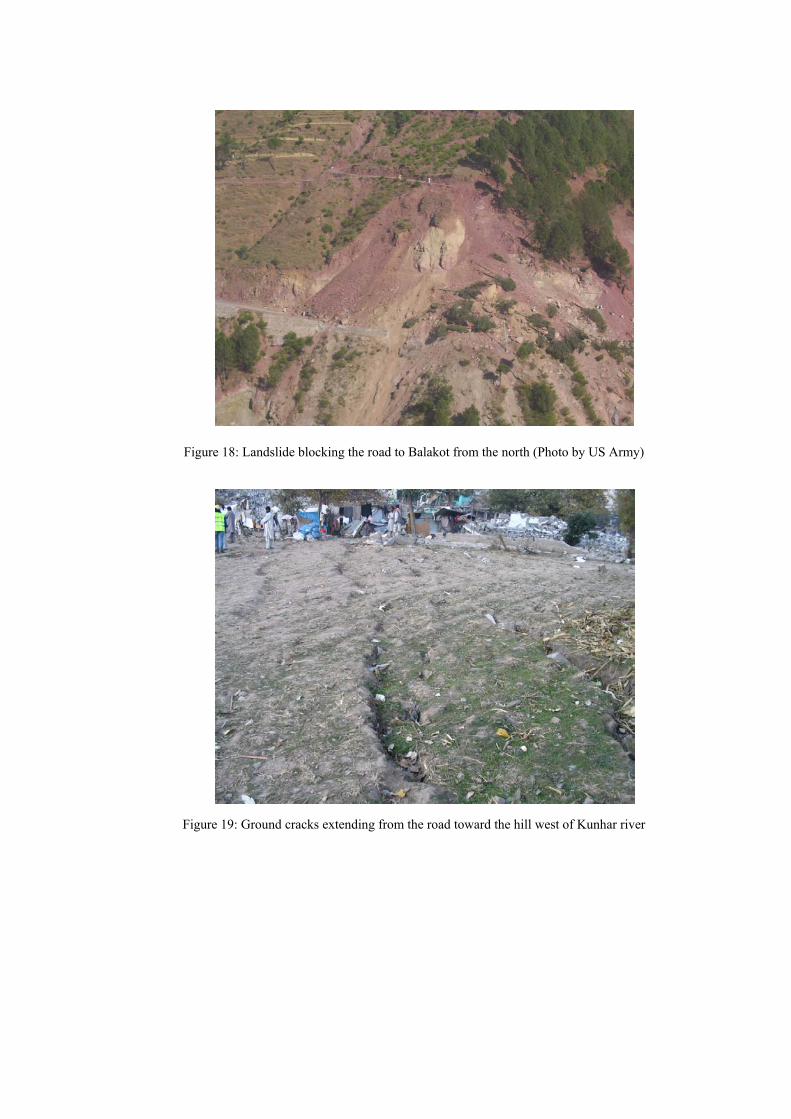
Figure 18: Landslide blocking the road to Balakot from the north (Photo by US Army)
Figure 19: Ground cracks extending from the road toward the hill west of Kunhar river
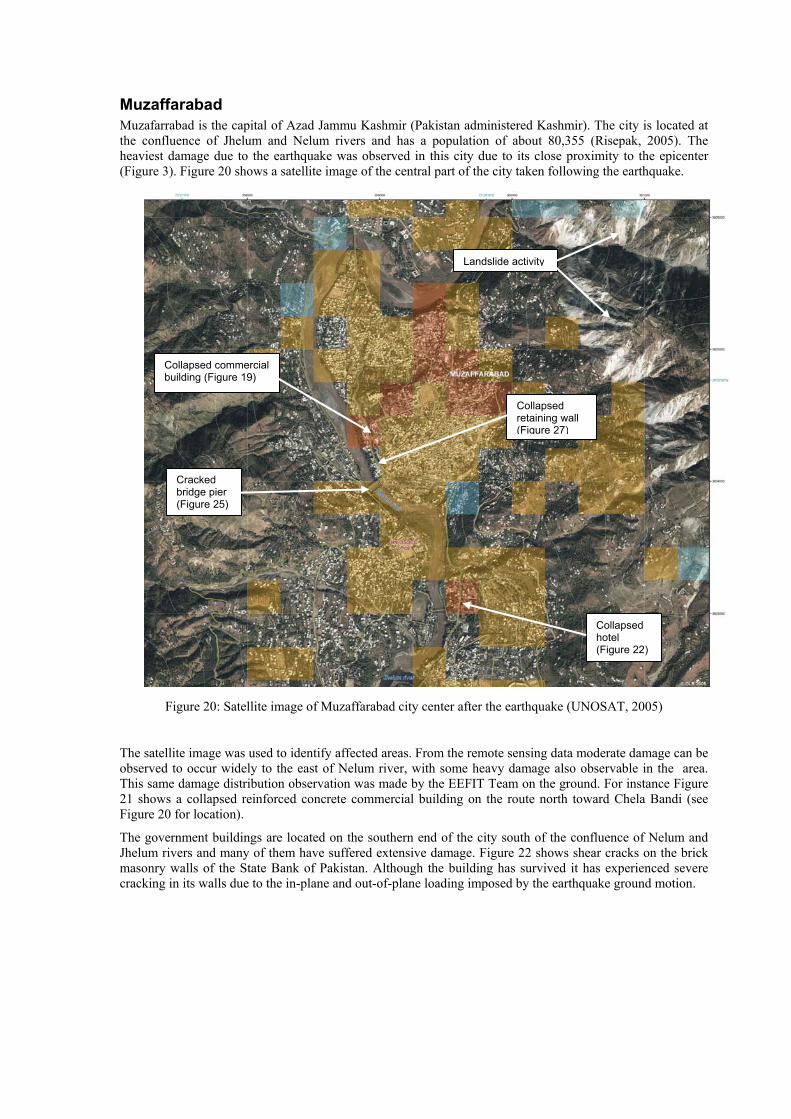
Muzaffarabad Muzafarrabad is the capital of Azad Jammu Kashmir (Pakistan administered Kashmir). The city is located at the confluence of Jhelum and Nelum rivers and has a population of about 80,355 (Risepak, 2005). The heaviest damage due to the earthquake was observed in this city due to its close proximity to the epicenter (Figure 3). Figure 20 shows a satellite image of the central part of the city taken following the earthquake.
Figure 20: Satellite image of Muzaffarabad city center after the earthquake (UNOSAT, 2005)
The satellite image was used to identify affected areas. From the remote sensing data moderate damage can be observed to occur widely to the east of Nelum river, with some heavy damage also observable in the area. This same damage distribution observation was made by the EEFIT Team on the ground. For instance Figure 21 shows a collapsed reinforced concrete commercial building on the route north toward Chela Bandi (see Figure 20 for location).
The government buildings are located on the southern end of the city south of the confluence of Nelum and Jhelum rivers and many of them have suffered extensive damage. Figure 22 shows shear cracks on the brick masonry walls of the State Bank of Pakistan. Although the building has survived it has experienced severe cracking in its walls due to the in-plane and out-of-plane loading imposed by the earthquake ground motion.
Collapsed commercial building (Figure 19)
Collapsed retaining wall (Figure 27)
Cracked bridge pier (Figure 25)
Collapsed hotel (Figure 22)
Landslide activity

Figure 21: Collapsed reinforced concrete commercial building
Figure 22: Shear cracks in the brick masonry walls of the State Bank of Pakistan
Figure 23 shows the Muzaffarabad Court House where the interior walls and the connection between the roof slab and the columns have shear cracks. The ground around the building was being used as a field hospital by the Turkish Red Crescent. The schools in the city have either collapsed or suffered heavy damage. The construction was of reinforced concrete column and slab with masonry infill (Figure 24).
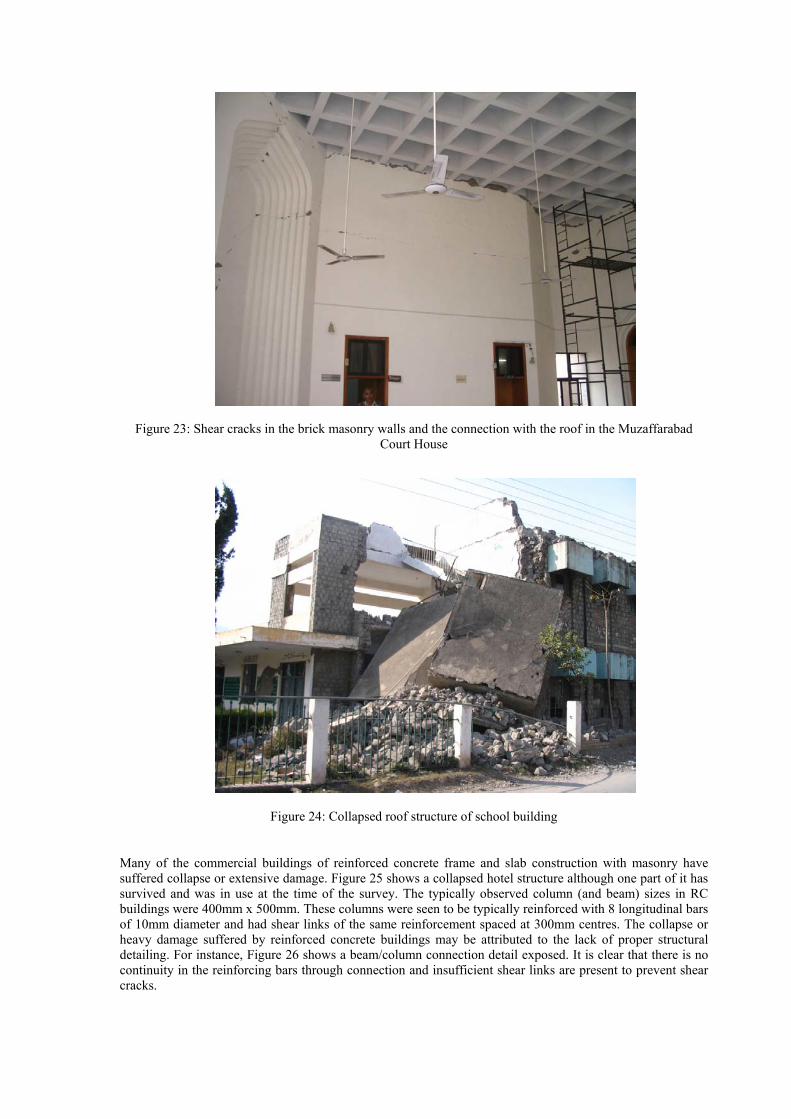
Figure 23: Shear cracks in the brick masonry walls and the connection with the roof in the Muzaffarabad Court House
Figure 24: Collapsed roof structure of school building
Many of the commercial buildings of reinforced concrete frame and slab construction with masonry have suffered collapse or extensive damage. Figure 25 shows a collapsed hotel structure although one part of it has survived and was in use at the time of the survey. The typically observed column (and beam) sizes in RC buildings were 400mm x 500mm. These columns were seen to be typically reinforced with 8 longitudinal bars of 10mm diameter and had shear links of the same reinforcement spaced at 300mm centres. The collapse or heavy damage suffered by reinforced concrete buildings may be attributed to the lack of proper structural detailing. For instance, Figure 26 shows a beam/column connection detail exposed. It is clear that there is no continuity in the reinforcing bars through connection and insufficient shear links are present to prevent shear cracks.
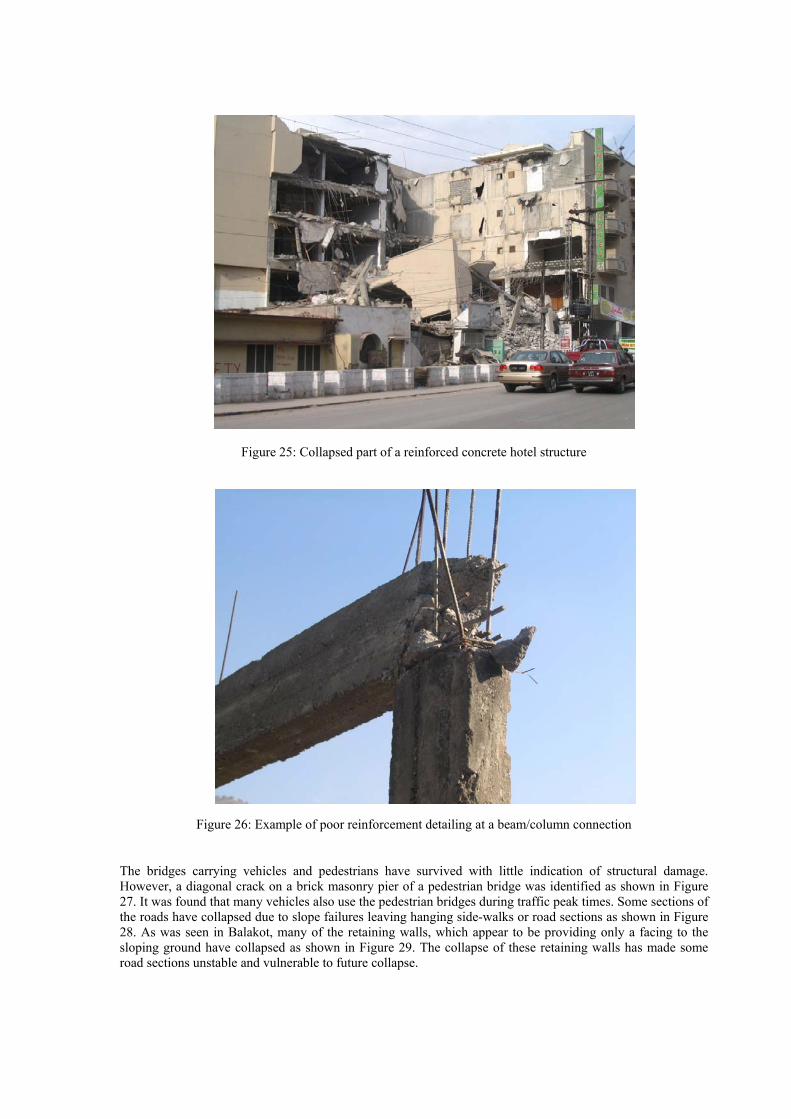
Figure 25: Collapsed part of a reinforced concrete hotel structure
Figure 26: Example of poor reinforcement detailing at a beam/column connection
The bridges carrying vehicles and pedestrians have survived with little indication of structural damage. However, a diagonal crack on a brick masonry pier of a pedestrian bridge was identified as shown in Figure 27. It was found that many vehicles also use the pedestrian bridges during traffic peak times. Some sections of the roads have collapsed due to slope failures leaving hanging side-walks or road sections as shown in Figure 28. As was seen in Balakot, many of the retaining walls, which appear to be providing only a facing to the sloping ground have collapsed as shown in Figure 29. The collapse of these retaining walls has made some road sections unstable and vulnerable to future collapse.
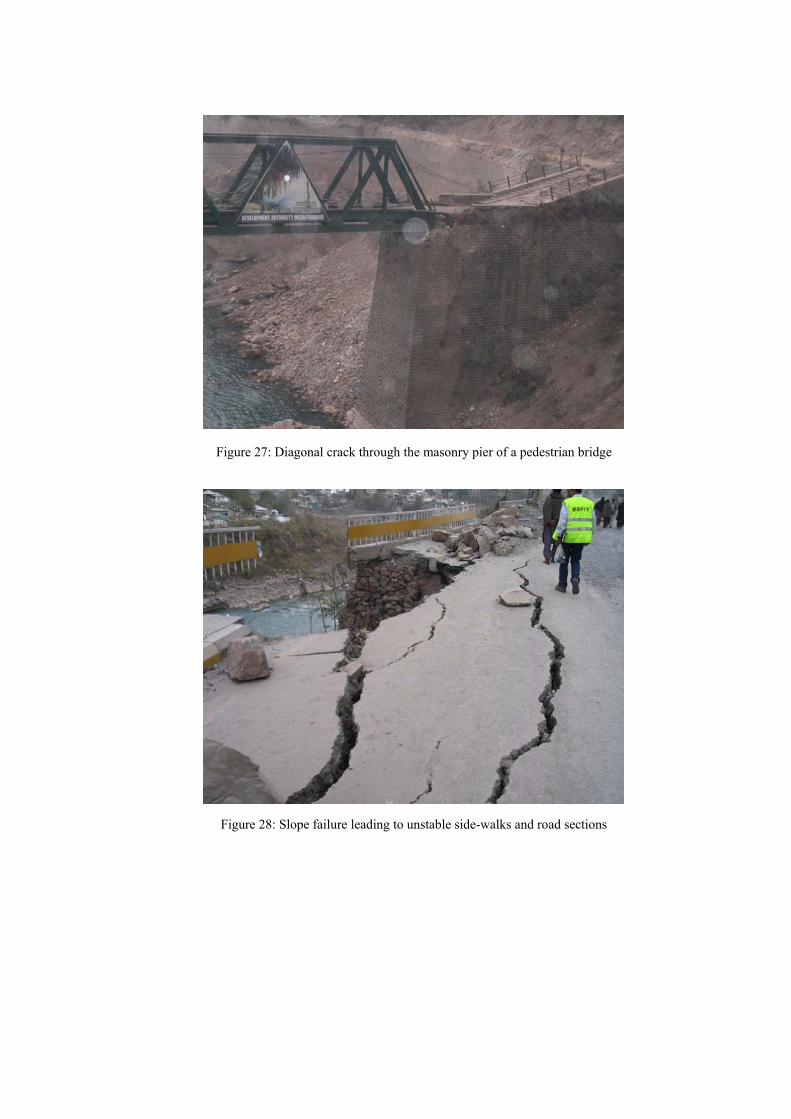
Figure 27: Diagonal crack through the masonry pier of a pedestrian bridge
Figure 28: Slope failure leading to unstable side-walks and road sections
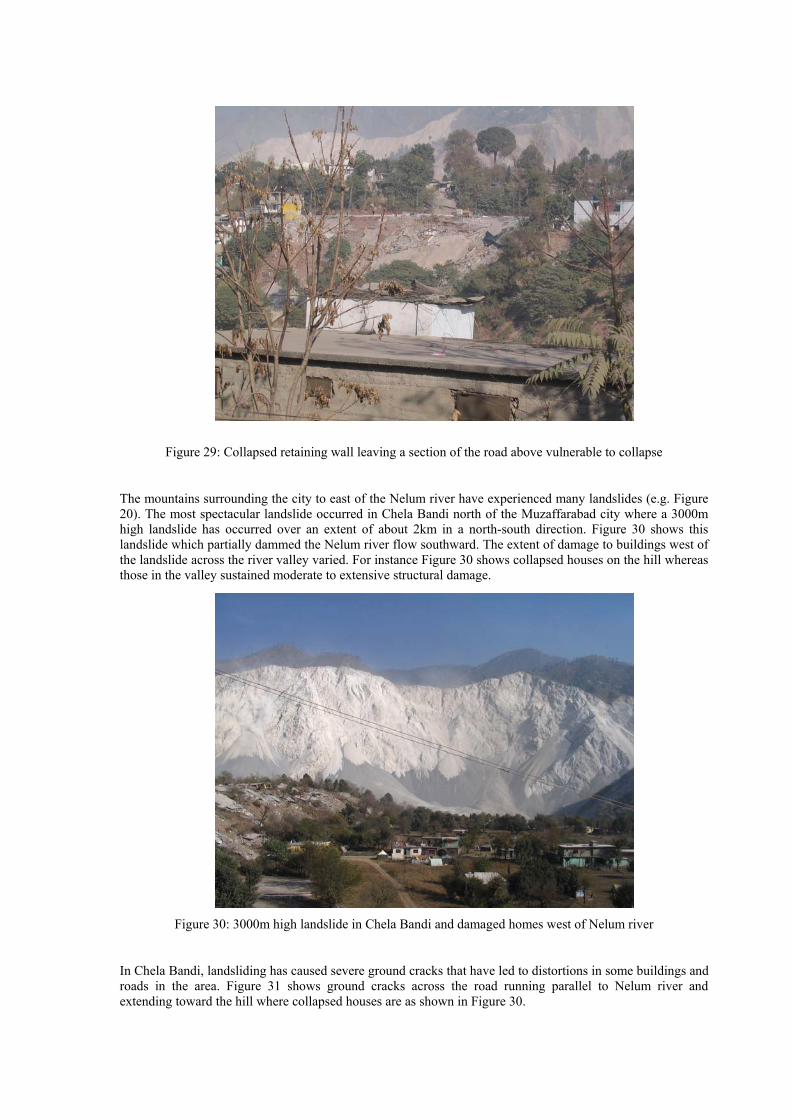
Figure 29: Collapsed retaining wall leaving a section of the road above vulnerable to collapse
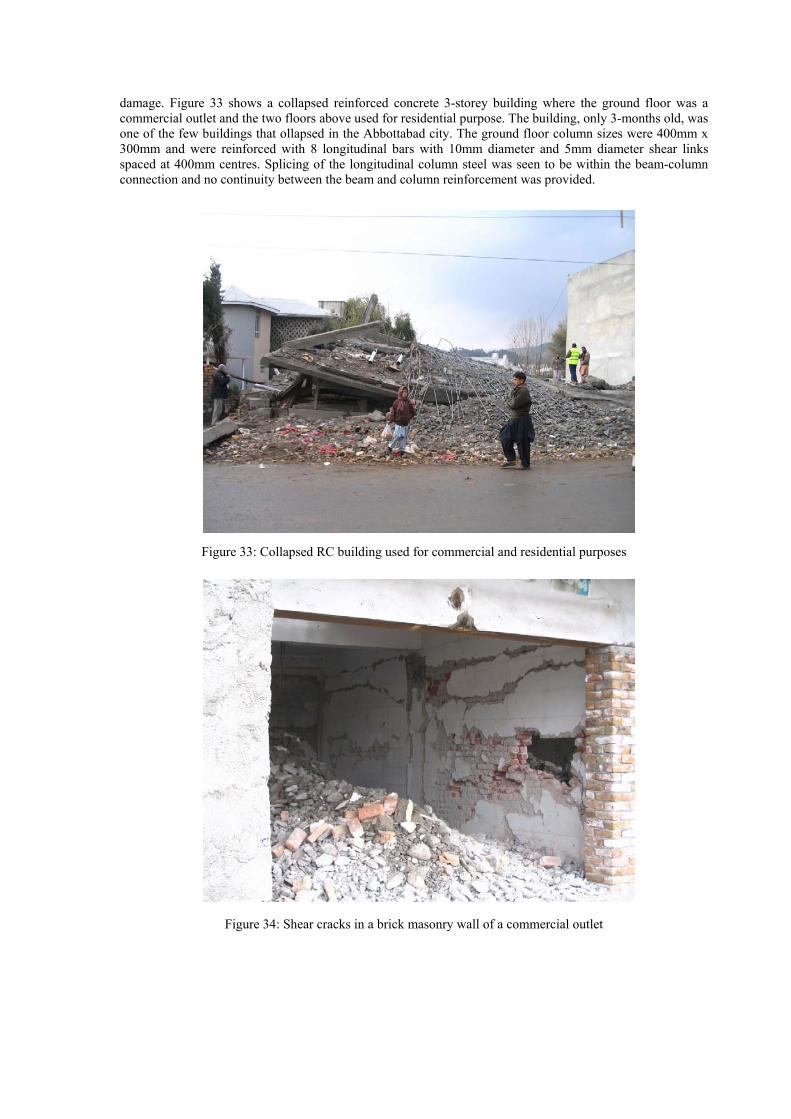
The mountains surrounding the city to east of the Nelum river have experienced many landslides (e.g. Figure 20). The most spectacular landslide occurred in Chela Bandi north of the Muzaffarabad city where a 3000m high landslide has occurred over an extent of about 2km in a north-south direction. Figure 30 shows this landslide which partially dammed the Nelum river flow southward. The extent of damage to buildings west of the landslide across the river valley varied. For instance Figure 30 shows collapsed houses on the hill whereas those in the valley sustained moderate to extensive structural damage.
Figure 30: 3000m high landslide in Chela Bandi and damaged homes west of Nelum river
In Chela Bandi, landsliding has caused severe ground cracks that have led to distortions in some buildings and roads in the area. Figure 31 shows ground cracks across the road running parallel to Nelum river and extending toward the hill where collapsed houses are as shown in Figure 30.

Figure 31: Ground cracks distorting the road, services and other structures
Mansehra Mansehra about 30km southwest of the epicenter did not experience significant damage. The town is being used for locating relief camps, possibly due to the availability of flat terrain. Figure 32 shows a relief camp run by United Pakistan Shelter and Relief.
Figure 32: Relief camp north of Mansehra City
Abbottabad Abottabad city located about 50km southwest of the epicenter suffered very little damage. However, there are some commercial structures in the northern part of the city that have either collapsed or suffered heavy
damage. Figure 33 shows a collapsed reinforced concrete 3-storey building where the ground floor was a commercial outlet and the two floors above used for residential purpose. The building, only 3-months old, was one of the few buildings that ollapsed in the Abbottabad city. The ground floor column sizes were 400mm x 300mm and were reinforced with 8 longitudinal bars with 10mm diameter and 5mm diameter shear links spaced at 400mm centres. Splicing of the longitudinal column steel was seen to be within the beam-column connection and no continuity between the beam and column reinforcement was provided.
Figure 33: Collapsed RC building used for commercial and residential purposes
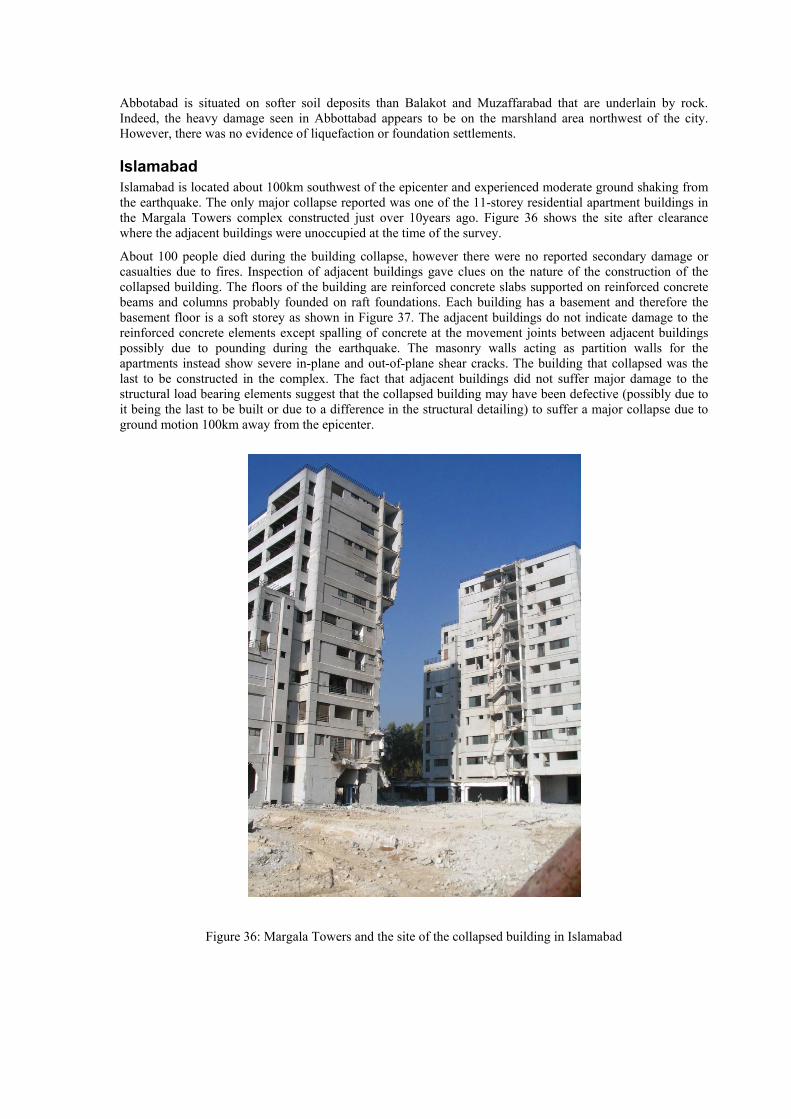
Figure 34: Shear cracks in a brick masonry wall of a commercial outlet
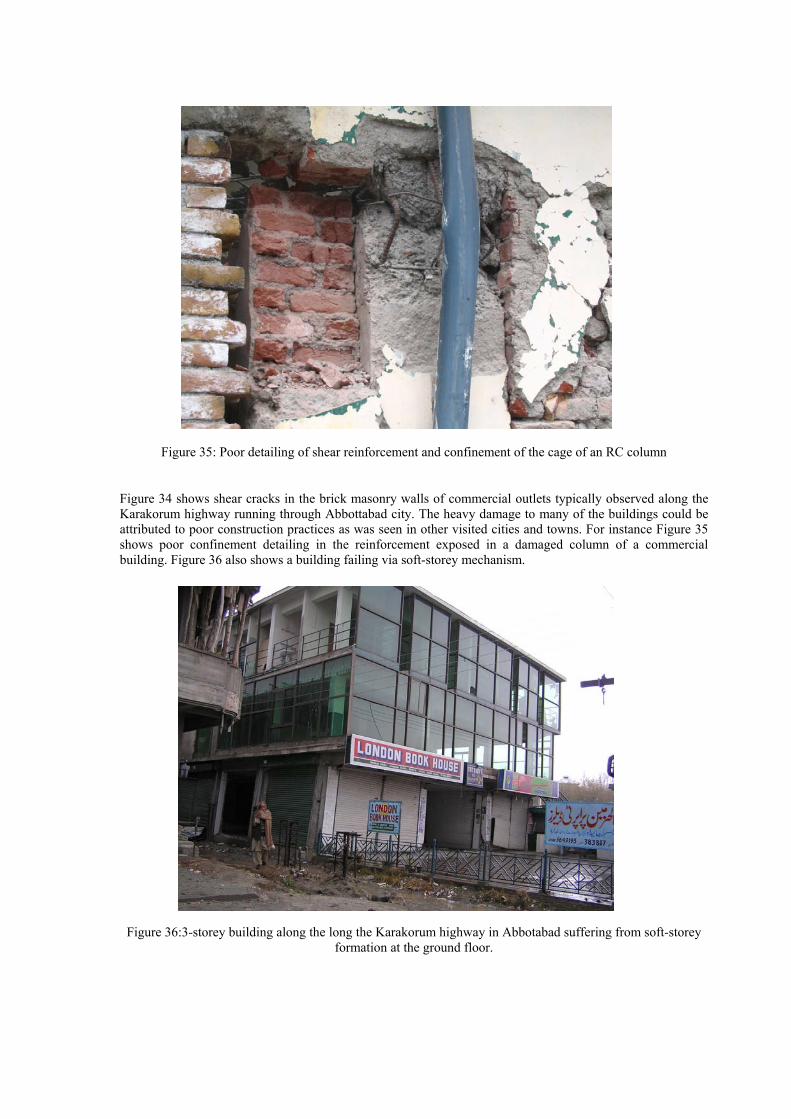
Figure 35: Poor detailing of shear reinforcement and confinement of the cage of an RC column
Figure 34 shows shear cracks in the brick masonry walls of commercial outlets typically observed along the Karakorum highway running through Abbottabad city. The heavy damage to many of the buildings could be attributed to poor construction practices as was seen in other visited cities and towns. For instance Figure 35 shows poor confinement detailing in the reinforcement exposed in a damaged column of a commercial building. Figure 36 also shows a building failing via soft-storey mechanism.
Figure 36:3-storey building along the long the Karakorum highway in Abbotabad suffering from soft-storey formation at the ground floor.
Abbotabad is situated on softer soil deposits than Balakot and Muzaffarabad that are underlain by rock. Indeed, the heavy damage seen in Abbottabad appears to be on the marshland area northwest of the city. However, there was no evidence of liquefaction or foundation settlements.
Islamabad Islamabad is located about 100km southwest of the epicenter and experienced moderate ground shaking from the earthquake. The only major collapse reported was one of the 11-storey residential apartment buildings in the Margala Towers complex constructed just over 10years ago. Figure 36 shows the site after clearance where the adjacent buildings were unoccupied at the time of the survey.
About 100 people died during the building collapse, however there were no reported secondary damage or casualties due to fires. Inspection of adjacent buildings gave clues on the nature of the construction of the collapsed building. The floors of the building are reinforced concrete slabs supported on reinforced concrete beams and columns probably founded on raft foundations. Each building has a basement and therefore the basement floor is a soft storey as shown in Figure 37. The adjacent buildings do not indicate damage to the reinforced concrete elements except spalling of concrete at the movement joints between adjacent buildings possibly due to pounding during the earthquake. The masonry walls acting as partition walls for the apartments instead show severe in-plane and out-of-plane shear cracks. The building that collapsed was the last to be constructed in the complex. The fact that adjacent buildings did not suffer major damage to the structural load bearing elements suggest that the collapsed building may have been defective (possibly due to it being the last to be built or due to a difference in the structural detailing) to suffer a major collapse due to ground motion 100km away from the epicenter.
Figure 36: Margala Towers and the site of the collapsed building in Islamabad
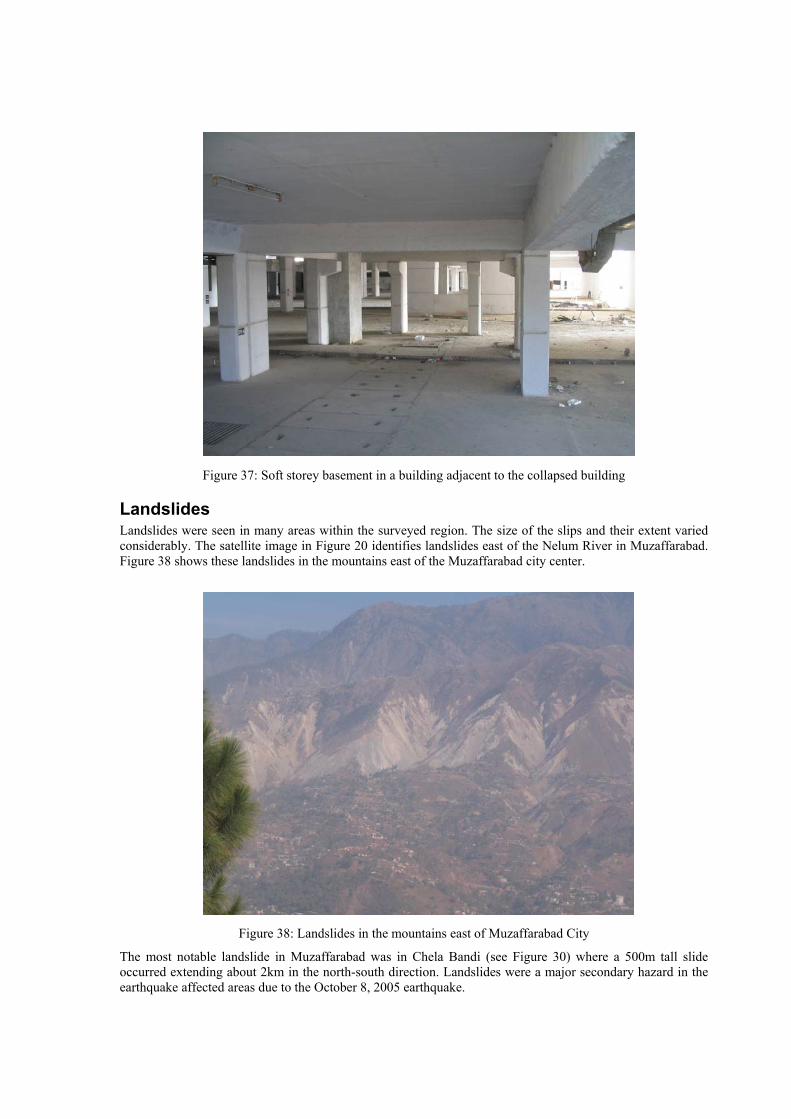
Figure 37: Soft storey basement in a building adjacent to the collapsed building
Landslides Landslides were seen in many areas within the surveyed region. The size of the slips and their extent varied considerably. The satellite image in Figure 20 identifies landslides east of the Nelum River in Muzaffarabad. Figure 38 shows these landslides in the mountains east of the Muzaffarabad city center.
Figure 38: Landslides in the mountains east of Muzaffarabad City
The most notable landslide in Muzaffarabad was in Chela Bandi (see Figure 30) where a 500m tall slide occurred extending about 2km in the north-south direction. Landslides were a major secondary hazard in the earthquake affected areas due to the October 8, 2005 earthquake.

Figure 39: Buried house from a landslide in Muzaffarabad City
Landslide activity resulted in damage to houses, commercial buildings and most notably lifelines, which resulted in numerous casualties and disruption to the post-disaster emergency relief. Figure 39 shows a house that was buried by the soil that has slid down the slope in Muzaffarabad City. The sliding has also created instability to the residential building at the top of the slope and risk of damage to the commercial building at the road level. Impact on the lifelines was seen in Balakot (Figure 18) where the Balakot-Babusar pass which enters the city from the north was completely blocked by the mountain slide. Figure 40 shows blocks and instability at several locations on a road north of Muzaffarabad captured during the aerial survey.
Figure 40: Road blocks and unstable slopes on a road north of Muzaffarabad due to landslides
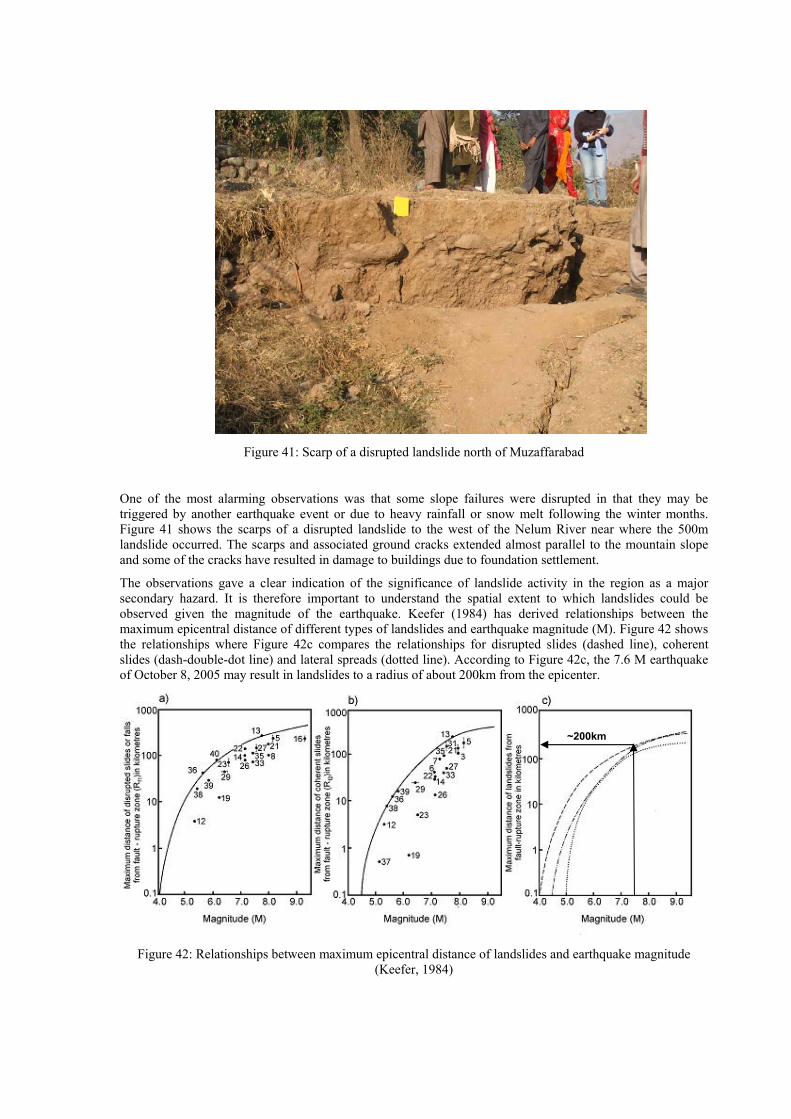
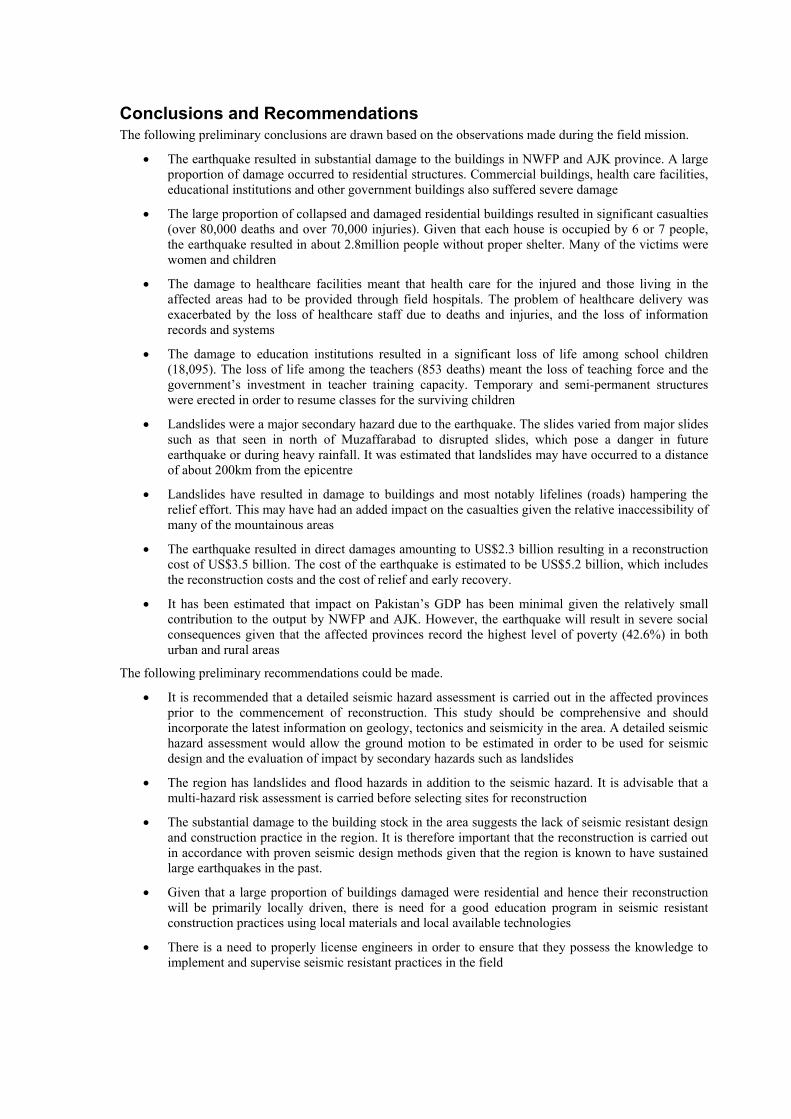
Figure 41: Scarp of a disrupted landslide north of Muzaffarabad
One of the most alarming observations was that some slope failures were disrupted in that they may be triggered by another earthquake event or due to heavy rainfall or snow melt following the winter months. Figure 41 shows the scarps of a disrupted landslide to the west of the Nelum River near where the 500m landslide occurred. The scarps and associated ground cracks extended almost parallel to the mountain slope and some of the cracks have resulted in damage to buildings due to foundation settlement.
The observations gave a clear indication of the significance of landslide activity in the region as a major secondary hazard. It is therefore important to understand the spatial extent to which landslides could be observed given the magnitude of the earthquake. Keefer (1984) has derived relationships between the maximum epicentral distance of different types of landslides and earthquake magnitude (M). Figure 42 shows the relationships where Figure 42c compares the relationships for disrupted slides (dashed line), coherent slides (dash-double-dot line) and lateral spreads (dotted line). According to Figure 42c, the 7.6 M earthquake of October 8, 2005 may result in landslides to a radius of about 200km from the epicenter.
Figure 42: Relationships between maximum epicentral distance of landslides and earthquake magnitude (Keefer, 1984)
~200km

Socio-Economic Impact
Societal Impact Initial estimates suggest that the earthquake resulted in about 80,000 deaths and 70,000 injuries in the earthquake affected North West Frontier Province (NWFP) and Azad Jammu Kashmir (AJK) Province, leaving more than 2.8million people without shelter. These figures are expected to rise as more of the remote areas are accessed. Table 1 summarizes the number of deaths and injuries by district in the affected NWFP and AJK provinces at November 12, 2005. The largest recorded deaths were in the Muzaffarabad district at 33,724 and the Muzaffarabad city with a population of about 80,355 recorded about 23,000 fatalities.
Table 1: Casualties in the affected districts of NWFP and AJK provinces
District Deaths Injuries North West Frontier Province (NWFP)
Shangla 423 957 Mansehra 24,511 30,585 Kohistan 661 639
Abbottabad 515 1,730 Batagram 3,232 3,279 Sub Total 29,342 37,190
Azad Jammu Kashmir (AJK) Neelum 447 1,013
Muzaffarabad 33,724 21,374 Bagh 8,157 6,644
Rawalakot 1,025 1,909 Sudhnoti 4 16 Mirpur 6 11
Sub-Total 43,363 30,967 Total 72,705 68,157
Source: www.ajk.gov.pk, ADB-WB (2005), data at Nov 12, 2005
The majority of the victims were from already vulnerable groups, living in comparatively inaccessible mountain areas with lower levels of income compared to the national average (ADB-WB, 2005). Many of the victims were women and children since many women were caught unaware in houses when the earthquake occurred and the collapse of school buildings resulted in deaths of many school children. Among the injured, many will be permanently disabled due to spinal cord injuries, severe head injuries and injuries to limbs, resulting in a high proportion of amputations. Many victims succumbed to their injuries in the absence of medical treatment as the victims could not be rescued in time due to access difficulties.
The damage to housing, health and education infrastructure also had a profound social impact on the region. Table 2 lists the damage statistics for housing and other institutions by district in the affected NWFP and AJK provinces. In total over 272,019 buildings was totally destroyed and 182,886 buildings suffered partial damage. More buildings were fully damaged than partially damaged in AJK and the trend is reversed in NWFP. Housing constituted the largest proportion of destroyed (96%) and partially damaged (97%) buildings in the affected districts. According to the 1998 population census, a typical house is occupied by 7 people in urban areas and 6 people in rural areas. The damage to housing therefore resulted in more than 2.8million people without proper shelter. Shelter is provided by the Government of Pakistan, United Nations agencies, NGOs and donors in terms of supply of tents and other material to repair partially damaged homes to survive the advancing winter.
The damage to health infrastructure was widespread with 423 health facilities fully damaged or partially damaged (Table 2). Almost 75% of the first level care facilities have been either fully damaged or suffered partial damage (ADB-WB, 2005). Additionally, there were deaths and injuries among the health care staff and particularly among female health workers. The above physical and human losses have resulted in a complete breakdown of the health system with disruption of both primary and secondary care services. In addition the health management at the central level in AJK province, district and at facility level was paralyzed due to loss of information records and systems. Health care is being provided by medical teams through the establishment of 11 field based hospitals with support from the Pakistan Army, Ministry of Health, UN agencies, NGOs and local people.

Substantial damage occurred to the education infrastructure where 95% and 53% of the buildings have been either fully or partially damaged in AJK and NWFP, respectively (Table 2). In addition to physical damage, about 18,095 students and 853 teachers have died in both AJK and NWFP. The loss of teachers meant the loss of teaching force and the government’s investment in teacher training capacity. The most urgent requirement is to resume classes at all levels. This would require setting up temporary and semi-permanent learning spaces, e.g. tents and semi-permanent structures and provision of school equipment.
Table 2: Damage statistics in the affected districts of NWFP and AJK provinces
Housing Medical Facilities
Educational Institutions
Other Govt. Buildings
Misc. Structures
(Shops, Mosques, etc)
Sub-Total District
Full* Partial* Full Partial Full Partial Full Partial Full Partial Full Partial North West Frontier Province (NWFP)
Abbottabad 6961 27051 11 26 295 736 - - - - 7267 27813 Batagram 28712 8656 35 5 268 180 - - - - 29015 8841 Kohistan 4350 18395 - 22 154 320 - - - - 4504 18737 Mansehra 31323 43282 35 19 935 624 - - - - 32293 43925 Shangla 15661 10281 13 19 206 247 - - - - 15880 11087
Sub-Total 87007 108205 94 91 1858 2107 - - - - 88959 110403 Azad Jammu Kashmir (AJK)
Neelum 3692 7215 0 9 0 75 0 2 0 1690 3692 8991 Muzaffarabad 108157 17120 103 0 929 0 77 89 5945 0 115211 17209
Bagh 47619 18226 49 40 511 240 186 76 0 154 48365 18736 Rawalakot 15086 25405 16 19 125 275 78 71 57 0 15362 25770 Sudhnoti 429 1719 0 2 1 54 0 0 0 2 430 1777 Mirpur 0 0 0 0 0 0 0 0 0 0 0 0
Sub-Total 174983 69685 168 70 1566 644 341 238 6002 1846 183060 72483
Total 261990 177890 262 161 3424 2751 341 238 6002 1846 272019 182886
Source: www.ajk.gov.pk, ADB-WB (2005), data for Nov 12, 2005
*Full implies fully damaged structure defined as a structure damaged in excess of 40%. Partial implies partially damaged defined as a structure damaged to an extent 40% or less.
Economic Impact The economic impact of the earthquake includes the estimation of direct, indirect losses, reconstruction costs, and the determination of the macroeconomic impact due to earthquake induced losses. The direct loss is the monetary value of the fully or partially damaged assets such as social, physical and economic infrastructure. Indirect loss arises from the disruption to the flow of goods and services resulting in increased expenses, reduced production and revenue. Reconstruction costs measure the cost of rebuilding the lost assets and restoring the lost services. Table 3 summarizes the preliminary estimates of direct and indirect losses from the October 8, 2005 earthquake and reconstruction costs from the preliminary damage and needs assessment carried out by ADB-WB (2005).
The earthquake has resulted in a direct damages amounting to Rs.135.1 billion (US$2.3 billion). The largest proportion of damage is in the housing sector at Rs.61.2 billion (US$1.0 billion) followed by the transport sector at Rs.20.2 billion (US$343.0 million). The level of direct damage is higher in AJK at Rs.76.4 billion (US$1.3 billion) than in NWFP at Rs.58.7 billion (US$1.0 billion). The reconstruction cost of all assets is estimated at Rs.208.1 billion (US$3.5 billion), which considers the replacement cost of the damaged assets and the additional cost to be incurred due to seismic resistant design.
The economic sectors most affected by the earthquake are agriculture, livestock, industry and services (ADB-WB, 2005). Agriculture and livestock accounts for 33.6% of the employment in AJK and 46.6% in NWFP, where most of the rural population engages in subsistence agriculture. The damage to agricultural assets worth Rs.12.9 billion (US$220 million) is substantial to this sector where the decline in the production capacity could further impair the food security and livelihoods, generating severe social consequences. The service sector, which also provides employment for 35.2% in AJK and 24.5% in NWFP could also lead to similar social problems. The severe social consequences are due to high levels of poverty in the affected provinces, particularly in rural areas. For instance the NWFP has recorded the highest percentage of people considered poor (42.6%) in both urban and rural areas.

Table 3: Preliminary estimates of losses and reconstruction costs as of November 10, 2005 (ADB-WB, 2005)
Sector Direct
Damage (Rs. mill.)
Indirect Losses (Rs.
mill.)
Reconstruction Costs* (Rs.
mill.)
Reconstruction Costs* (US$
mill.)
Share of Total Reconst. Costs
(%) 1. Social Infrastructure
Private Housing** 61,200 7,218 92,160 1,552 44 Health 7,114 1,378 18,012 303 9 Education 19,920 4,133 28,057 472 13 Environment 12 8,985 151 4 Public Administration 2,971 687 4,254 72 2
2. Physical Infrastructure Transport*** 20,165 4,061 24,699 416 12 Water Supply and Sanitation 1,165 1,900 32 1 Irrigation 324 623 10 0 Energy, power and fuel 744 1,561 2,377 40 1
3. Economic Sectors**** Agriculture and livestock 12,933 6,770 17,846 300 9 Industry and services 8,578 8,379 9,178 155 4
4. Total = 1+2+3 (in Rs. million) 135,146 34,187 208,091 3,503 100 O/w: Azad Jammu and Kashmir 76,735 17,671 116,625 1,963 56
: North West Frontier Province 58,771 16,516 91,467 1,540 44
O/w: Public Assets 48,131 12,175 82,187 1,384 39 : Private Assets 87,015 22,012 125,904 2,120 61
O/w: Urban Areas 26,490 13,675 46,163 777 22 : Rural Areas 108,656 20,512 191,928 2,726 78
Source: ADB-WB (2005), data for Nov 12, 2005
*Includes cost of reconstruction of both immovable and movable assets and restoration of public services. **Includes value of household contents such as consumer durables; reconstruction cost excludes replacement of these assets. ***Includes roads and bridges. ****Total losses and reconstruction cost in agriculture, industry and services are over and above what is accounted for by the sectors listed above.
It has been estimated that the impact of the earthquake on Pakistan’s official Gross Domestic Product (GDP), which excludes GDP from AJK is expected to be relatively small at about 0.4%. This is due to the affected districts in AJK and NWFP accounting for only 0.8% and 1.5% of the national GDP respectively.
The overall cost of the earthquake has been estimated to be at US$5.2 billion by ADB-WB (2005). This estimate includes the reconstruction cost of US$3.5 billion and the cost of relief and early recovery as summarized in Table 4.
Table 4: Overall cost of the earthquake
Category US$ million Relief 1,092 Death and injury compensation 205 Early recovery 301 Restoration of livelihoods 97 Reconstruction 3,503
Of which short term reconstruction 450 Of which medium/long term reconstruction 3,053
Total 5,198 Source: ADB-WB (2005), data for Nov 12, 2005, excludes indirect losses (income) of US$576 million
Conclusions and Recommendations The following preliminary conclusions are drawn based on the observations made during the field mission.
• The earthquake resulted in substantial damage to the buildings in NWFP and AJK province. A large proportion of damage occurred to residential structures. Commercial buildings, health care facilities, educational institutions and other government buildings also suffered severe damage
• The large proportion of collapsed and damaged residential buildings resulted in significant casualties (over 80,000 deaths and over 70,000 injuries). Given that each house is occupied by 6 or 7 people, the earthquake resulted in about 2.8million people without proper shelter. Many of the victims were women and children
• The damage to healthcare facilities meant that health care for the injured and those living in the affected areas had to be provided through field hospitals. The problem of healthcare delivery was exacerbated by the loss of healthcare staff due to deaths and injuries, and the loss of information records and systems
• The damage to education institutions resulted in a significant loss of life among school children (18,095). The loss of life among the teachers (853 deaths) meant the loss of teaching force and the government’s investment in teacher training capacity. Temporary and semi-permanent structures were erected in order to resume classes for the surviving children
• Landslides were a major secondary hazard due to the earthquake. The slides varied from major slides such as that seen in north of Muzaffarabad to disrupted slides, which pose a danger in future earthquake or during heavy rainfall. It was estimated that landslides may have occurred to a distance of about 200km from the epicentre
• Landslides have resulted in damage to buildings and most notably lifelines (roads) hampering the relief effort. This may have had an added impact on the casualties given the relative inaccessibility of many of the mountainous areas
• The earthquake resulted in direct damages amounting to US$2.3 billion resulting in a reconstruction cost of US$3.5 billion. The cost of the earthquake is estimated to be US$5.2 billion, which includes the reconstruction costs and the cost of relief and early recovery.
• It has been estimated that impact on Pakistan’s GDP has been minimal given the relatively small contribution to the output by NWFP and AJK. However, the earthquake will result in severe social consequences given that the affected provinces record the highest level of poverty (42.6%) in both urban and rural areas
The following preliminary recommendations could be made.
• It is recommended that a detailed seismic hazard assessment is carried out in the affected provinces prior to the commencement of reconstruction. This study should be comprehensive and should incorporate the latest information on geology, tectonics and seismicity in the area. A detailed seismic hazard assessment would allow the ground motion to be estimated in order to be used for seismic design and the evaluation of impact by secondary hazards such as landslides
• The region has landslides and flood hazards in addition to the seismic hazard. It is advisable that a multi-hazard risk assessment is carried before selecting sites for reconstruction
• The substantial damage to the building stock in the area suggests the lack of seismic resistant design and construction practice in the region. It is therefore important that the reconstruction is carried out in accordance with proven seismic design methods given that the region is known to have sustained large earthquakes in the past.
• Given that a large proportion of buildings damaged were residential and hence their reconstruction will be primarily locally driven, there is need for a good education program in seismic resistant construction practices using local materials and local available technologies
• There is a need to properly license engineers in order to ensure that they possess the knowledge to implement and supervise seismic resistant practices in the field
References ADB-WB (2005), “Preliminary Damage and Needs Assessment – Pakistan 2005 Earthquake”, prepared by Asian Development Bank and World Bank, Islamabad, Pakistan, November 12, 2005.
Ambraseys N.N., Douglas J., Sarma and Smith P.M. (2004), “Equation for the estimation of strong ground motions from shallow crustal earthquakes using data from Europe and the Middle East: Horizontal peak ground acceleration and spectral acceleration”, Bulletin of Earthquake Engineering. 3. pp 1-53.
BGS (2005), Seismic Alert: Pakistan 8 October 2005 03:50 UTC 7.6 Mw. British Geological Survey: http://www.earthquakes.bgs.ac.uk/latest/pakistan_08102005.htm.
Bilham, R. (2005), “The Kashmir Earthquake”. Web report: http://cires.colorado.edu/~bilham/Kashmir%202005.htm.
COMET (2005), “Locating the Kashmir Fault”, Centre for the Observation and Modelling of Earthquakes and Tectonics: http://comet.nerc.ac.uk/news_kashmir.html.
Digital Globe, (2005), www.digitalglobe.com.
Keefer, D.F., (1984), “Landslides caused by earthquakes”, Geol. Soc. Am. Bull., 95, 406-421.
Pararas-Carayannis, G. (2006), “The earthquake of 8 October 2005 in Northern Pakistan”, Web Report: http://www.drgeorgepc.com/Earthquake2005Pakistan.html.
Risepak (2005), www.risepak.com.
UNOSAT (2005), www.unosat.com.
USGS (2005), www.usgs.gov.

Acknowledgments EEFIT extends their gratitude to the University of Engineering and Technology, Peshawar for their generous hospitality and guidance during the field mission.
EEFIT also expresses their gratitude to the US Army for allowing the EEFIT members to be on their relief flights in order to carry out aerial surveys.