edworkingpaper no. 20-261
TRANSCRIPT
The Effects of Absenteeism on Cognitive and Social-Emotional Outcomes: Lessons for COVID-19
In March 2020, most schools in the United States closed their doors and transitioned to distance learning in an effort to contain COVID-19. During the transition a significant number of students did not fully engage in these learning opportunities due to resource or other constraints. An urgent question for schools around the nation is how much did the pandemic impact student academic and social-emotional development. This paper uses administrative panel data from California to approximate the impact of the pandemic by analyzing how absenteeism affects student outcomes. We show wide variation in absenteeism impacts on academic and social-emotional outcomes by grade and subgroup, as well as the cumulative effect of different degrees of absence. Student outcomes generally suffer more from absenteeism in mathematics than in ELA. Negative effects are larger in middle school. Absences negatively affect social emotional development, particularly in middle school, with slight differences across constructs. Our results add to the emerging literature on the impact of COVID-19 and highlight the need for student academic and socialemotional support to make up for lost time.
Suggested citation: Santibanez, Lucrecia, and Cassandra Guarino. (2020). The Effects of Absenteeism on Cognitive and Social-Emotional Outcomes: Lessons for COVID-19. (EdWorkingPaper: 20-261). Retrieved from Annenberg Institute at Brown University: https://doi.org/10.26300/yj9m-x430
VERSION: October 2020
EdWorkingPaper No. 20-261
Lucrecia SantibanezUniversity of California at Los Angeles
Cassandra GuarinoUniversity of California at Riverside
1
The Effects of Absenteeism on Cognitive and Social-Emotional Outcomes: Lessons for
COVID-191
Lucrecia Santibañez
University of California at Los Angeles
Cassandra Guarino
University of California at Riverside
Date of this draft: October 1, 2020
ABSTRACT
In March 2020, most schools in the United States closed their doors and transitioned to distance learning in
an effort to contain COVID-19. During the transition a significant number of students did not fully engage
in these learning opportunities due to resource or other constraints. An urgent question for schools around
the nation is how much did the pandemic impact student academic and social-emotional development. This
paper uses administrative panel data from California to approximate the impact of the pandemic by
analyzing how absenteeism affects student outcomes. We show wide variation in absenteeism impacts on
academic and social-emotional outcomes by grade and subgroup, as well as the cumulative effect of
different degrees of absence. Student outcomes generally suffer more from absenteeism in mathematics
than in ELA. Negative effects are larger in middle school. Absences negatively affect social-emotional
development, particularly in middle school, with slight differences across constructs. Our results add to the
emerging literature on the impact of COVID-19 and highlight the need for student academic and social-
emotional support to make up for lost time.
1 We are grateful to the six CORE districts who provided data for this study through the PACE/CORE Research
Partnership. Our deep thanks go to Heather Hough and Joe Witte at PACE for facilitating the data needed and
answering our multiple questions throughout the duration of this research and for their continued support of this
work. Dave Calhoun at CORE facilitated interactions with districts that helped improve this study. Thank you to
Libby Pier at Education Analytics and Jose Felipe Martinez for answering questions related to SEL and test scores.
We are grateful to Clemence Darriet for research assistance. All errors remain our own. Corresponding author:
2
Introduction
In March 2020, the COVID-19 pandemic forced schools around the nation to close
physical campuses and shift to distance learning. The pandemic exposed deep cracks in our
education system, with low-poverty schools and students transitioning to online participation
quickly and students of color in high poverty schools and English Learners lagging behind
(Burke, 2020; Hamilton et al., 2020; Umansky, 2020). A nationally representative survey of
teachers conducted by the EdWeek Research Center found that in May 2020, 23 percent of
students were considered “truant” (i.e., not logging into any online work, not making contact
with teacher, etc.) and close to 45 percent of teachers reported students had “much lower” levels
of engagement with schoolwork than before the pandemic.2 A report by the Los Angeles Unified
School District, the 2nd largest district in the country, found that participation in online learning
of middle and high school students between March 16 and May 22, 2020 never reached 100
percent and was lower for students in particular subgroups such as low income, English
Learners, students with disabilities, and homeless and foster youth (Besecker, Thomas & Daley,
2020).
When schools closed in March 2020, it is safe to assume students were mostly absent at
least in the first week or two immediately following the closures (Kuhfeld et al., 2020). This
would put most students above average absenteeism levels for regular school years. Students
who were consistently absent from March through June, would have missed 10 weeks of school
(50 days) putting them at the far end of the normal absenteeism spectrum. The analysis presented
here gives some indication of the negative impact absences would have on both academic and
social-emotional learning outcomes. These estimates shed further light on the potential learning
2 EdWeek Research Center Survey. Last update: June 2, 2020. Available:
https://www.edweek.org/ew/articles/2020/04/27/survey-tracker-k-12-coronavirus-response.html
3
and social-emotional costs if students continue to be absent from school for long periods in
2020/21 due to the challenging circumstances posed by the COVID-19 pandemic.
Given the deep inequalities present in our school systems, an increasingly urgent question
for schools around the nation is how much learning has been lost due to the COVID-19
pandemic? And how are different student subgroups affected by this? Are students in the earlier
grades losing more ground than students in middle and high school? And, also importantly, how
is the social-emotional development of students affected by their absence from school?
Although no data currently exist that can directly answer these questions, we can learn
from recent past experience with absenteeism to gauge what the impact will be. Our study uses
administrative panel data from six large school districts in California to analyze the effects of
absenteeism in the recent past. We use data from 2014/15 to 2107/18 for students in grades 3-12
to understand (1) the average patterns of absenteeism occurring during regular school years for
all students and by subgroup? And (2) the impact on test scores and social-emotional learning
outcomes of being away from school for all students and by subgroup.
Our paper makes several key contributions beyond prior literature on this topic. First, we
investigate the impact of absenteeism on both academic and social-emotional outcomes. Second,
we estimate results for a large span of grades, allowing us to see how patterns related to
absenteeism change across K-12 experience. Third, we drill down to results for four vulnerable
student subgroups who may experience the effects of the pandemic in different ways: English
Learners, students with disabilities, low-income students, and homeless/foster youth. Fourth, we
have data from six of the largest, most diverse districts in the most populous US state. Last, our
four-year student-level panel allows us to control for unobserved attributes of students that could
bias the relationship between absenteeism and outcomes.
4
Our findings indicate that absenteeism hurts both academic and social-emotional
outcomes with variation by grade and subgroup, as well as in the cumulative effect of different
degrees of absence. Students generally suffer more from absenteeism in mathematics than in
English Language Arts (ELA), and experience larger negative effects on academic outcomes in
middle school than in elementary grades. With regard to social-emotional development,
absenteeism appears to have the greatest negative impact on social awareness and self-efficacy,
and the negative impact is most pronounced in middle school.
Previous Literature
Effects of Absenteeism on Test Scores
It is well established in the literature that absenteeism negatively impacts academic
outcomes. Using data from elementary students in North Carolina, Aucejo and Romano (2016)
find that being absent for 10 days from school would reduce test scores by about 0.03 SD in ELA
and 0.06 SD in mathematics. The negative impact is greater in upper elementary grades (4th and
5th) than in 3rd grade and larger for low-performing versus high-performing students. In
mathematics, the detrimental effects of absences in one school year can persist into subsequent
grades, suggesting that absences today can have lasting consequences. Other studies have also
found that absences impact mathematics more than ELA (Gottfried 2009; Gottfried, 2011;
Gottfried, 2014) and later grades more than earlier grades (Gershenson, Jacknowitz &
Brannegan, 2017). Liu, Lee and Gershenson (2020) use a high school student panel covering
2002/03 to 2012/13 in one large California school district and find that missing 10 mathematics
classes in the spring semester reduces mathematics test scores by about 0.07 SD, math course
grades by 0.19 SD, and the probability of on-time graduation by 0.08 SD. Results are similar for
ELA outcomes. To account for time-varying classroom influences that could bias the
5
relationship between absenteeism and outcomes, they use class period-level absences and control
for absences in another subject (i.e., ELA or mathematics). The coefficient on spring semester
absences in their student fixed effects model change only slightly when absences in another
subject (class period) are added as a control. Importantly, they find that teacher and subject
preferences are relatively stable across years and do not significantly bias the relationship
between attendance and student outcomes.
Kuhfeld et al. (2020) estimate typical summer learning loss to project the impact of
COVID-19 using a national sample of students in grades 3-7 who took MAP Growth
assessments between 2017/18 and 2018/19. Assuming that students lost the three months (about
60 instructional days) immediately following school closures in March, the authors project
students could lose 32-27 percent of the expected yearly learning gains in ELA and 63-50
percent in mathematics when they come back in the fall of 2020. Effects vary across student
proficiency categories, with the most significant losses concentrated among students at low
proficiency levels. One advantage of our study over studies like this is that we use absences
during the school year to predict academic losses. When students are absent for extended periods
during the year, teachers provide homework and supplemental lesson materials. While these
instructional efforts may not be as intensive as those that have been exerted during the pandemic,
they do mitigate learning losses due to absence in ways that are more relevant to the current
COVID-19 situation than summer learning loss.
Effects of Absenteeism on Social-Emotional Learning Outcomes
Social-emotional learning (SEL) skills, such as self-efficacy, self-management, and
growth mindset, have been found in the literature to be correlated with academic outcomes (e.g.,
Claro, Paunesku & Dweck, 2016; Usher & Pajares, 2009; West et al., 2018b). Recent work using
6
Project CORE data suggests that when social-emotional learning outcomes improve, so do test
scores and behavioral outcomes—this is true across student subgroups and regardless of the
baseline level of social-emotional learning (Kanopka et al., 2020).
Only a handful of quantitative studies have tried to estimate the effect of being absent
from school on social-emotional learning outcomes. Gottfried (2014) finds that chronic
absenteeism reduces educational and social engagement for kindergartners. West et al. (2018a),
using two years of survey data from CORE districts find that students in grades 4-12 with low
ratings on growth management, self-awareness, self-efficacy and self-management miss more
school. They find the strongest negative associations with absences for self-management and
self-efficacy.
Data and Methods
This study uses rich longitudinal student-level data from the CORE districts—a group of
the largest districts in California who formed a collaborative organization in 2010 to cooperate
in efforts to implement new academic standards, improve training for teachers and
administrators, and pool data.3 We use CORE data from six districts to estimate the impact of
absenteeism on academic outcomes and four districts to estimate the impact on social-emotional
outcomes.4 The total number of student-year observations in our analyses is over 1.3 million,
representing close to 600,000 individual students. We use four years of data from 2014/15
through 2017/18.
Outcome Data
3 See http://coredistricts.org/about-us/, accessed on 9/18/20. 4 Two of the six districts used in the academic outcome analysis did not collect SEL data over the period of our
study.
7
The achievement variables are composed of vertically-scaled test scores on the Smarter
Balanced Assessments (SBAC) in ELA and mathematics. These tests are available for grades 3-8
and grade 11. Grades earlier than 3rd grade and grades 9, 10, and 12 are not tested.
Social-emotional data come from CORE surveys of students. The data provide scale
scores generated from survey items using a generalized partial credit model (GPCM)5 measuring
the following constructs: (1) Self-management, the ability to regulate one’s emotions, thoughts,
and behaviors effectively in different situations, (2) Growth mindset, the belief that one’s
intelligence is malleable and can grow with effort, (3) Self-efficacy, the belief in one’s own
ability to succeed in achieving an outcome or reaching a goal, and (4) Social awareness, the
ability to take the perspective of and empathize with others from diverse backgrounds and
cultures, to understand social and ethical norms for behavior, and to recognize family, school,
and community resources and support (Hough, Kalogrides & Loeb, 2017). A validation study
found the CORE-generated SEL constructs to have high structural validity, and high reliability in
most of the factors (Meyer, Wang & Rice, 2018).6 Scaled SEL scores range from 5.5 to 4.6
depending on the construct, but we standardize all scaled scores to a mean of zero and standard
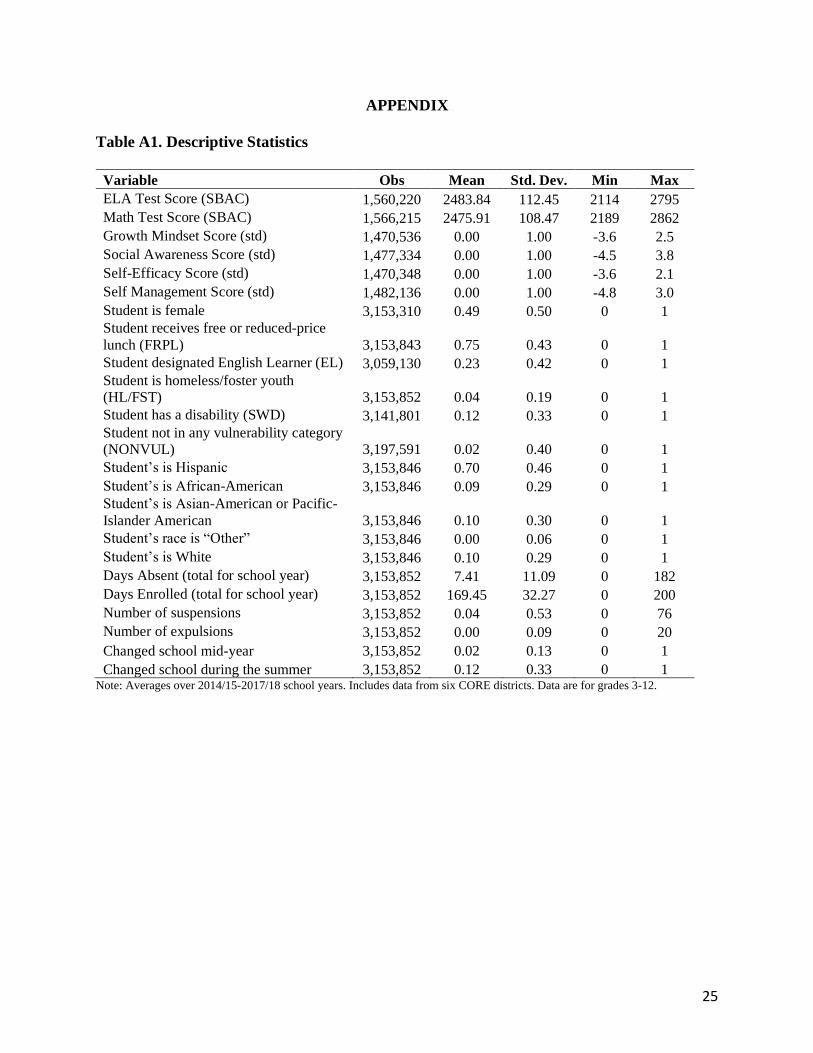
deviation of 1 by school year and by construct.7 Table A1 in the online appendix contains
descriptive statistics on all variables used in our analyses.
Student Characteristics / Designations / Behaviors
Data available for each student for every school year include: days attended, days
enrolled, grade attended, race/ethnicity, gender, English Learner (EL) designation, disability
5 The construct developers at Education Analytics recommend using the GPCM scale scores provided for the type of
analyses we conduct (Education Analytics, 2018; Meyer, Wang & Rice, 2018). 6 The sole exception was the Growth Mindset factor, which had low reliability in grade 4. 7 Loeb et al., (2019) and West et al. (2018a) standardize the scale scores for ease of interpretability, thus we follow
this procedure.
8
status (SWD), whether student is a homeless or foster youth (HL/FST), income proxied by free
and reduced-price lunch (FRPL), behaviors (i.e., suspensions or expulsions during the school
year), and enrollment patterns related to school changes.
Methods
Studying the impact of absenteeism on student outcomes is challenging because of
unobserved factors that could be associated with both absenteeism and student outcomes. If not
accounted for, these unobserved factors could bias estimates of the impact of absenteeism on
outcomes. To mitigate this potential source of bias, we use a student fixed effect model that
essentially uses each student as their own control.8 Such models control for time invariant
qualities of individuals–fixed traits or some persistent degree of ability–that could be important
sources of bias. Our independent variable of interest—days absent—varies almost yearly within
students in the panel, making fixed effects ideally suited to the analysis. A limitation to student
fixed effects is that they do not control for time-varying unobserved nonrandom student-specific
variation that may contribute to both the outcome variables and absenteeism simultaneously. For
example, students might have family problems during a given year, causing absenteeism to go up
and outcomes to go down. If students dislike a particular teacher or subject, this would reveal a
time-varying influence on absenteeism that is difficult to observe. This latter potential source of
bias seems less of a threat since, as mentioned earlier, Liu, Lee and Gershenson (2020) did not
find evidence of teacher- or subject-specific unobserved effects on absenteeism.
Our data allow us to control for several time-varying factors that could be potential time-
varying sources of bias. We include the number of suspensions and expulsions a student has in a
given year, which both controls for some involuntary sources of absenteeism and indicates
8 This is equivalent to adding an indicator variable for each student.
9
problems that manifest in disciplinary behaviors. We also include an indicator for whether or not
the student experienced a change of schools during the course of the year or in the prior summer,
which allows us to control for absences due to adjustment issues or potential underlying factors
that caused the school move (e.g., a change in residence, family divorce). We also include
program designations such as EL or SWD that vary over time.
Equation (1) presents the basic model we estimate in this paper.
𝑌𝑖𝑡 = 𝐴𝑏𝑠𝑖𝑡𝛽1 + 𝐴𝑏𝑠𝑖𝑡2 𝛽2 + 𝐸𝑛𝑟𝑖𝑡𝛽3 + 𝑋𝑖𝑡 + 𝐺𝑖𝑡 + 𝜏𝑡 + 𝛾𝑖 + 𝜀𝑖𝑡 (Eq. 1).
In this model, Absit are the number of days student i was absent at time (year) t. We allow
a squared term to pick up nonlinear relationships with absenteeism at different levels. Enrit are
the number of days student i was enrolled at time (year) t. Xit are time-varying student-level
characteristics (i.e., number of suspensions or expulsions, whether the student changed schools
that year, and program designations). Git is a grade-level indicator. τt is a time (year-level)
indicator. The student fixed effect is denoted by 𝛾𝑖 . To understand the effects of days absent by
grade, we include two-way interactions (e.g., 5th grade * days absent). To estimate the effects of
days absent from school by grade and program designation (e.g., EL status) we allow further
nonlinearities in certain specifications and use three-way interactions (e.g., 5th grade * EL * days
absent). Our findings lend themselves to graphical displays, which we provide. All models are
estimated with robust standard errors to account for the possibility of arbitrary serial correlation
and heteroskedasticity.
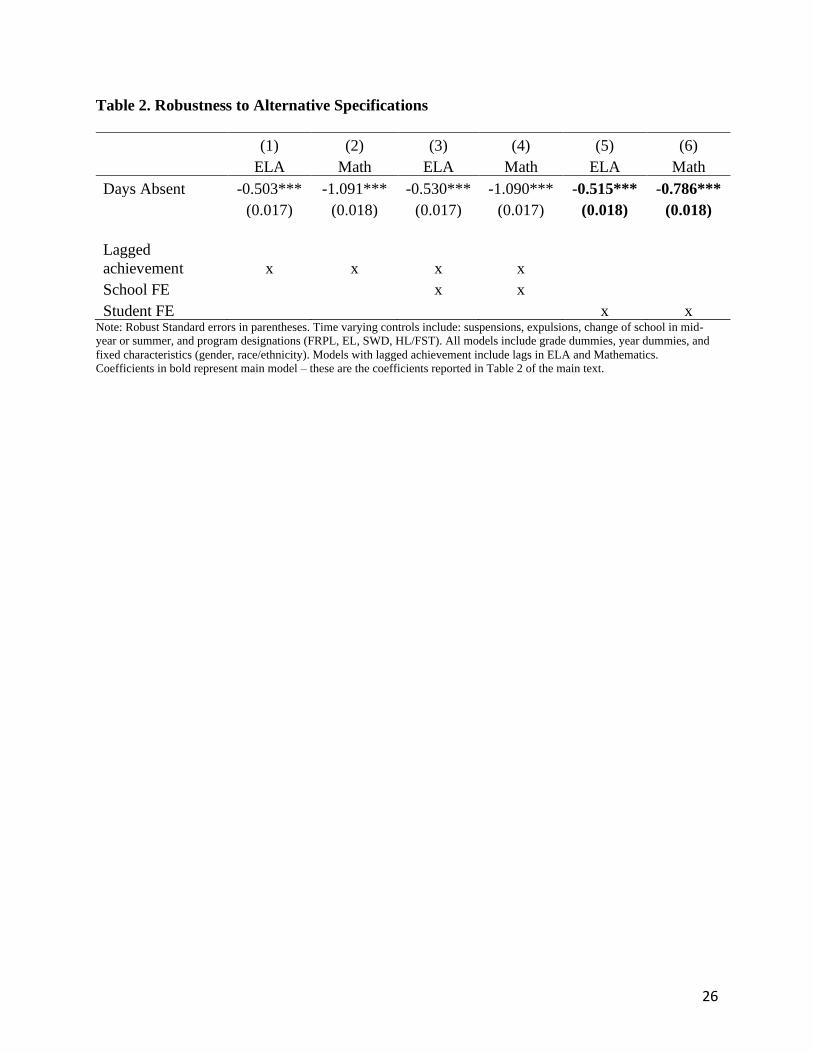
To check our model against other specifications, we ran models that did not include
student fixed effects but did include all observable time-invariant student characteristics, time-
10
varying variables, lagged achievement in one or both subjects, 9 and school-level fixed effects.
The absenteeism coefficients from these approaches differ from those in the student fixed effects
model, suggesting that the student fixed effects go one step further in eliminating sources of bias
(see Table A2 in the online appendix). We are confident that the estimates from the models we
present closely approximate the causal parameters. 10
Findings
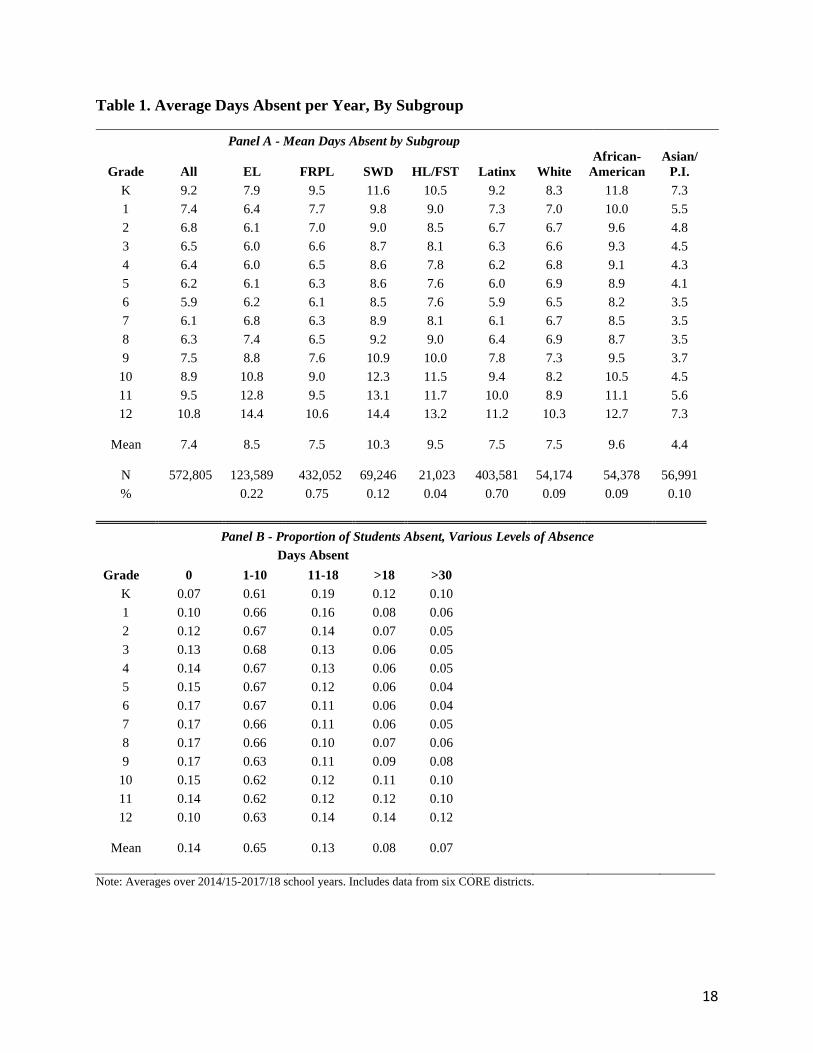
Table 1 displays descriptive patterns of absenteeism. Panel A shows that on average,
students in grades K-12 are absent from school 7.4 days in a regular school year. Absences vary
considerably by grade: elementary and middle school students spend about seven days away
from school in a regular school year, whereas middle school and high school students are absent
six and nine days on average every school year, respectively. Absences are highest for
kindergarten and grades 10 through 12, with 12th graders absent an average of 10.8 days.
Absenteeism rates also vary considerably by student subgroup. African-American students and
those classified as SWDs, ELs, and HL/FST youth are much more likely than all students on
average to be absent from school.
[Table 1 HERE]
Panel B shows that 14 percent of students are absent zero days, 65 percent are absent 1 to
10 days, 13 percent are absent 11 to 18 days per year, and 8 percent are absent 18 days or more –
the level at which absenteeism is considered chronic. Chronic absence is more prevalent in
9 It should be noted that there is virtually no difference in the estimated effects of absenteeism when a lagged
dependent variable (in one or both subjects) is included in the fixed effects model. This is because the student fixed
effects model essentially takes a differencing or averaging type of approach, whereas models without student fixed
effects necessitate the inclusion of lagged outcome variables. The lagged test scores convey little information
beyond what is accounted for in the fixed effects. 10 In all studies of the relationship of absenteeism to outcomes there’s a potential threat of bias due to missing
outcome data that is correlated with absenteeism. In this study, however, because we have a 4-year panel we have
score data for the vast majority of students: 99% have at least 2 or more SBAC scores and 96% have at least 2 or
more SEL scores.
11
grades 9-12 than in the earlier grades. About seven percent of students are absent from school 30
days or more in any given year, indicating that most chronically absent students are absent for
longer periods than 18 days.
Effects of Absences on Test Scores
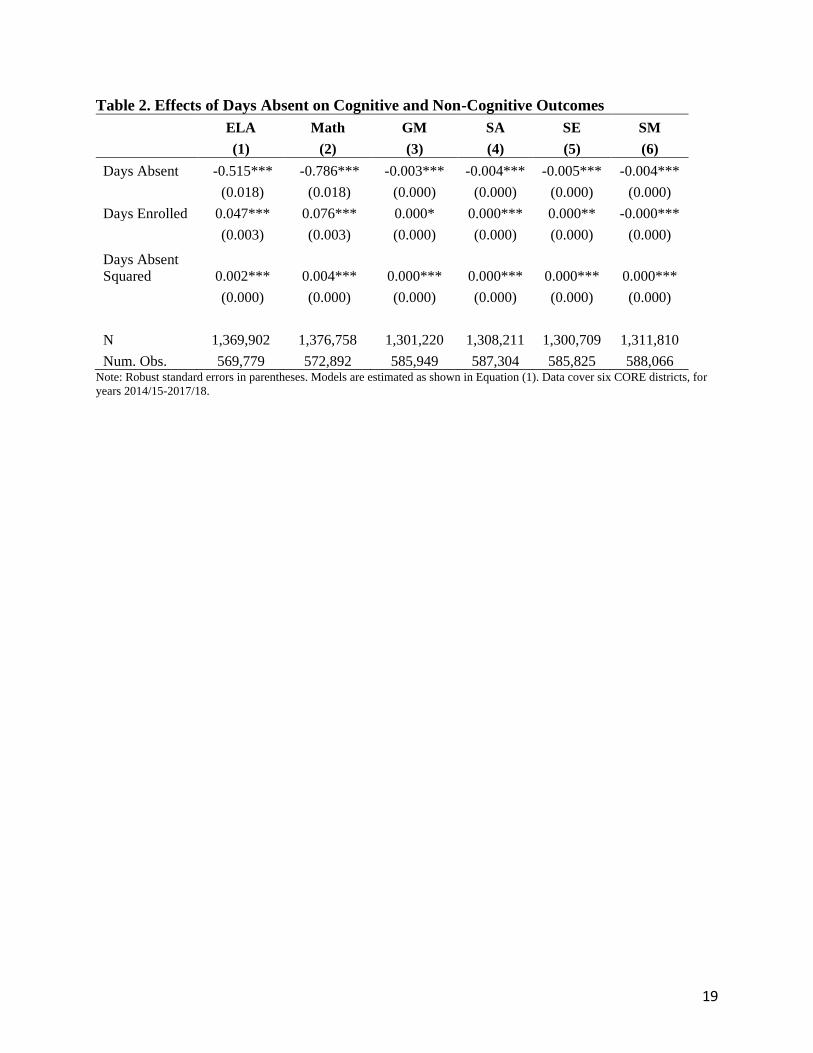
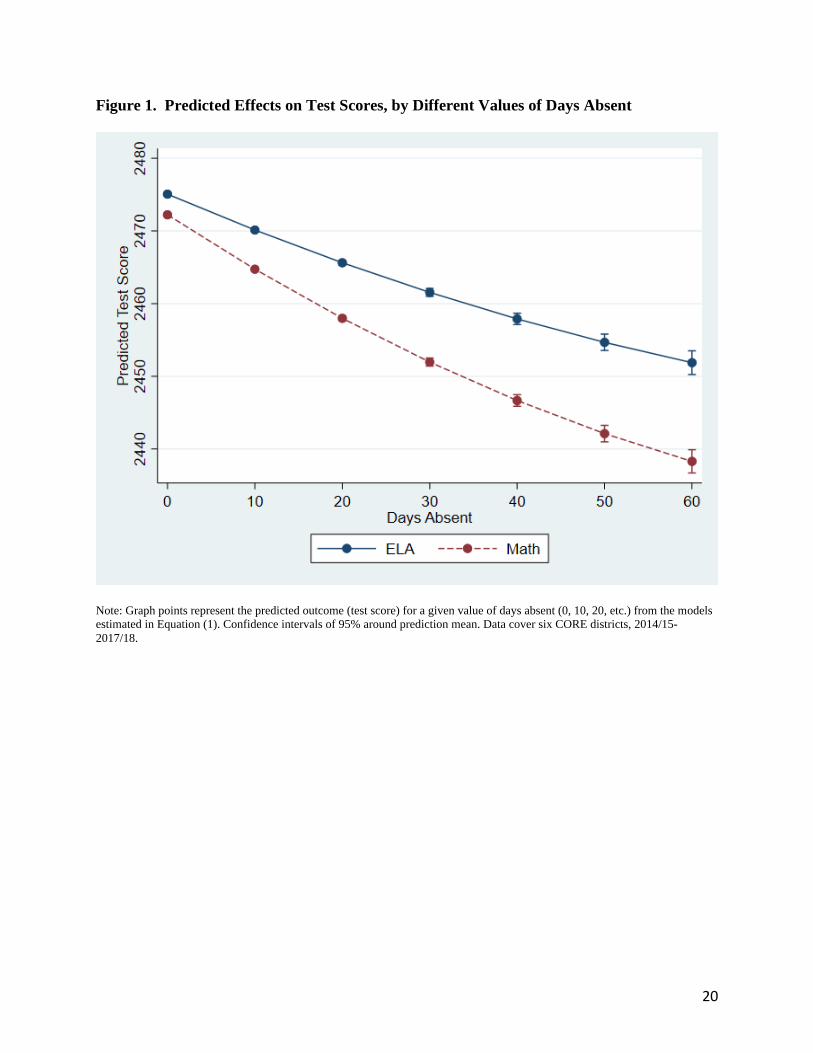
Results from estimating Equation (1) with test scores as outcomes are presented in Table
2 (columns 1 and 2) and Figure 1. We use only grades 3-8 in this analysis.11 In the graphical
display, what is important to note is the slope of the lines. The intercept for ELA and
mathematics differs only because the vertically scaled SBAC scores and their means differ
across the subjects—thus the distance between the lines is not due to a difference in absenteeism
effects.
As the slopes reveal, absences have a clear negative effect on test scores. The rate of loss
due to absenteeism as it accumulates is steeper for mathematics. Being away from school for 10
days results in a five percent of a standard deviation loss in ELA and an eight percent standard
deviation loss in mathematics. The squared absence term is very small but statistically significant
and positive and thus tends to lessen slightly the negative effect of additional days absent on test
scores as absenteeism increases.
[Table 2 HERE]
[Figure 1 HERE]
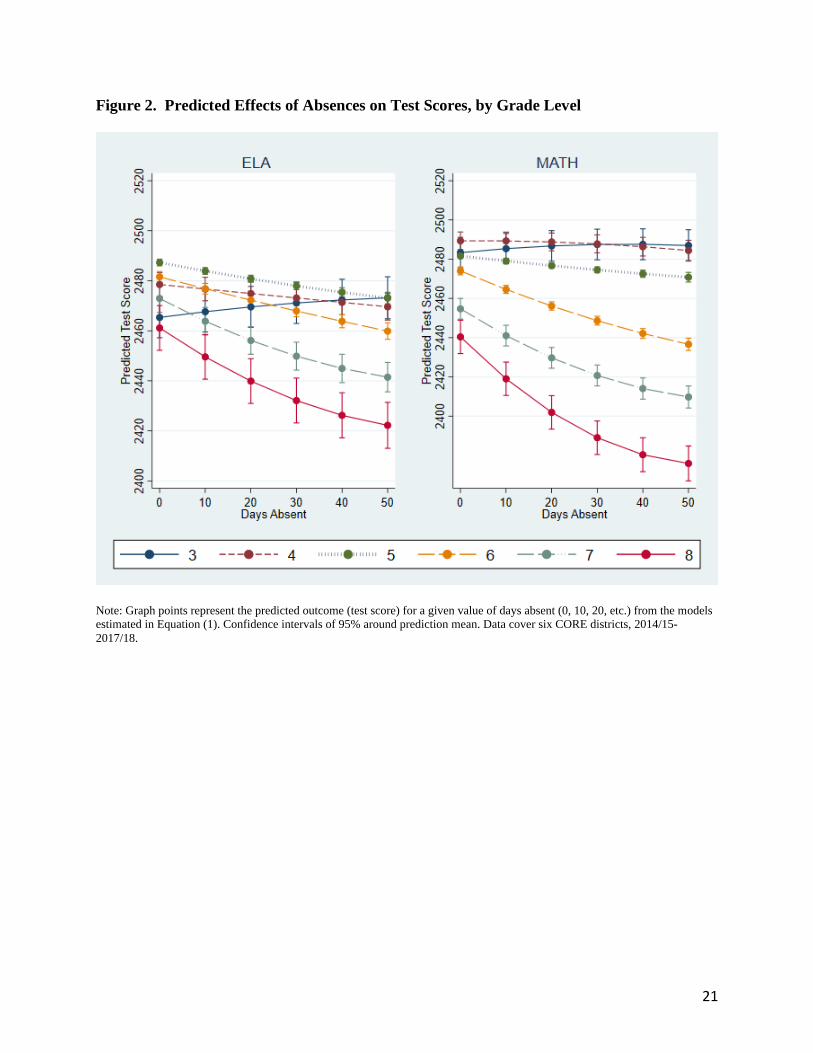
Absences affect test scores differently depending on the student’s grade level. Predicted
effects by grade are found in Figure 2. The slopes on the grade lines are steeper (downward
11 Eleventh grade is excluded from the analysis because in a four-year panel with no test score data between 8th and
11th grade, there are far fewer students with prior test score observations than in other grades, thus constraining the
percentage of 11th grade students with longitudinal data. Moreover, there is evidence that the population of 11th
graders taking the test was a more restrictive group, with higher rates of non-testing. According to Warren and
Lafortune (2019), 6.2 percent of enrolled 11th grade students did not take the 2018 test compared to 2.5 percent of
students in grades 3–8.
12
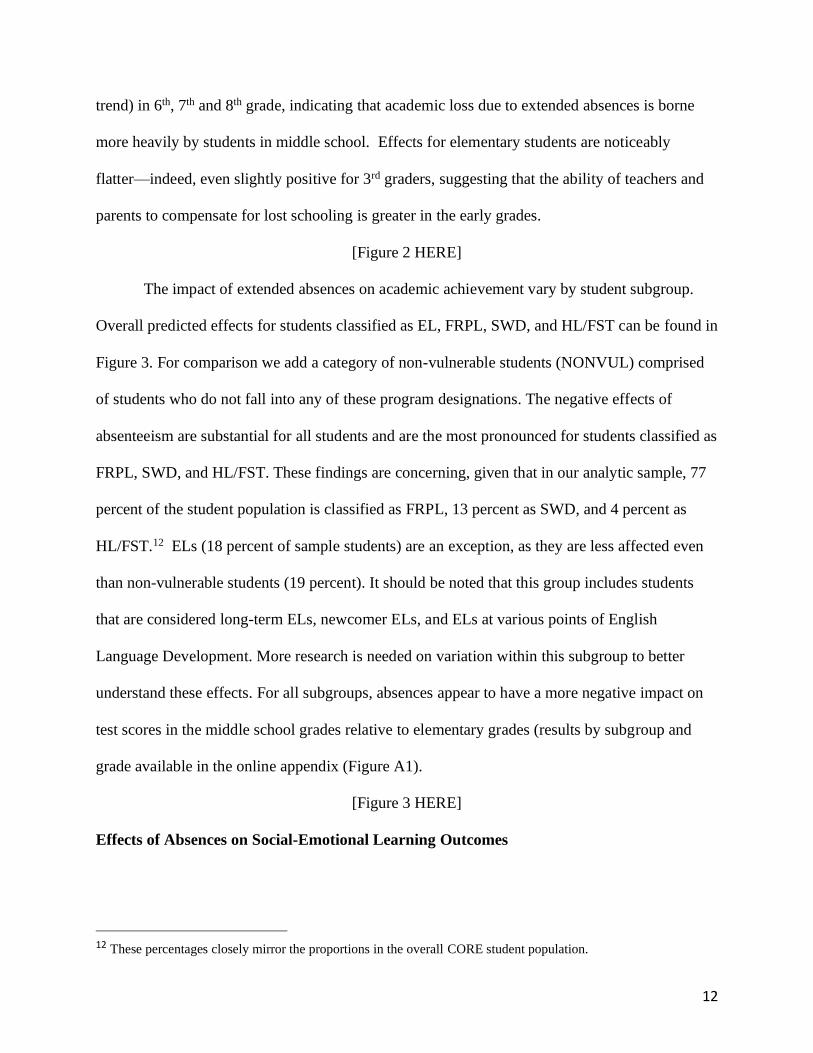
trend) in 6th, 7th and 8th grade, indicating that academic loss due to extended absences is borne
more heavily by students in middle school. Effects for elementary students are noticeably
flatter—indeed, even slightly positive for 3rd graders, suggesting that the ability of teachers and
parents to compensate for lost schooling is greater in the early grades.
[Figure 2 HERE]
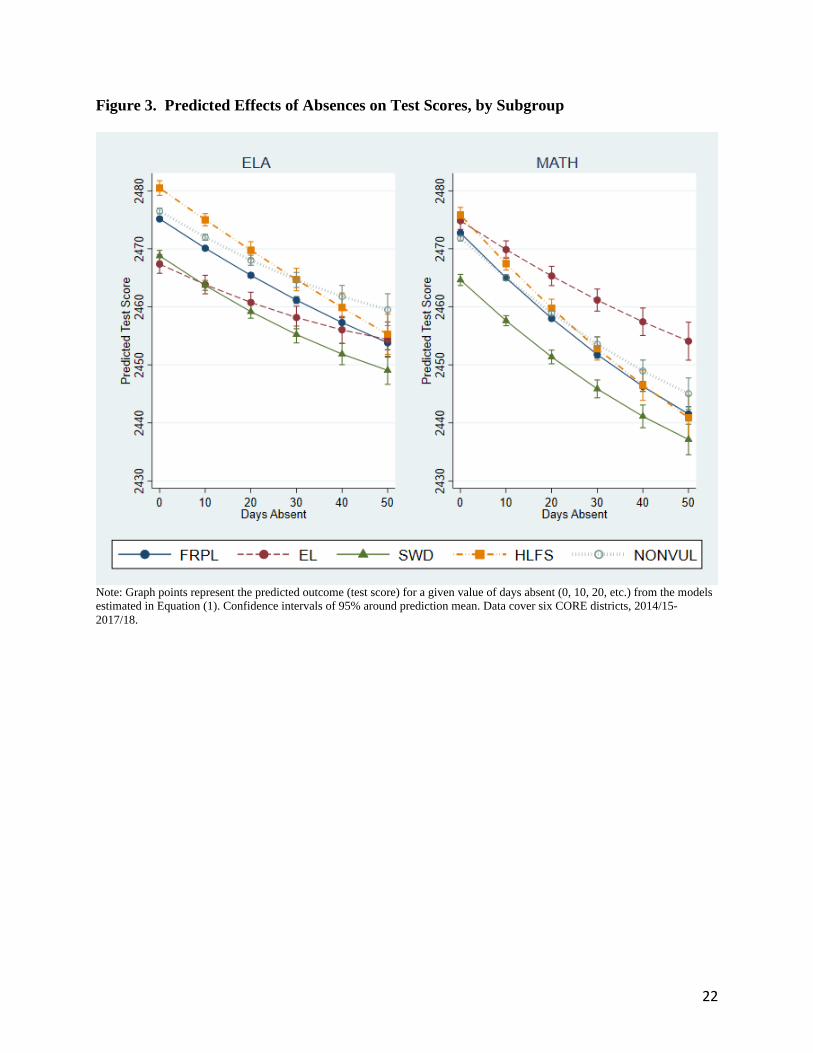
The impact of extended absences on academic achievement vary by student subgroup.
Overall predicted effects for students classified as EL, FRPL, SWD, and HL/FST can be found in
Figure 3. For comparison we add a category of non-vulnerable students (NONVUL) comprised
of students who do not fall into any of these program designations. The negative effects of
absenteeism are substantial for all students and are the most pronounced for students classified as
FRPL, SWD, and HL/FST. These findings are concerning, given that in our analytic sample, 77
percent of the student population is classified as FRPL, 13 percent as SWD, and 4 percent as
HL/FST.12 ELs (18 percent of sample students) are an exception, as they are less affected even
than non-vulnerable students (19 percent). It should be noted that this group includes students
that are considered long-term ELs, newcomer ELs, and ELs at various points of English
Language Development. More research is needed on variation within this subgroup to better
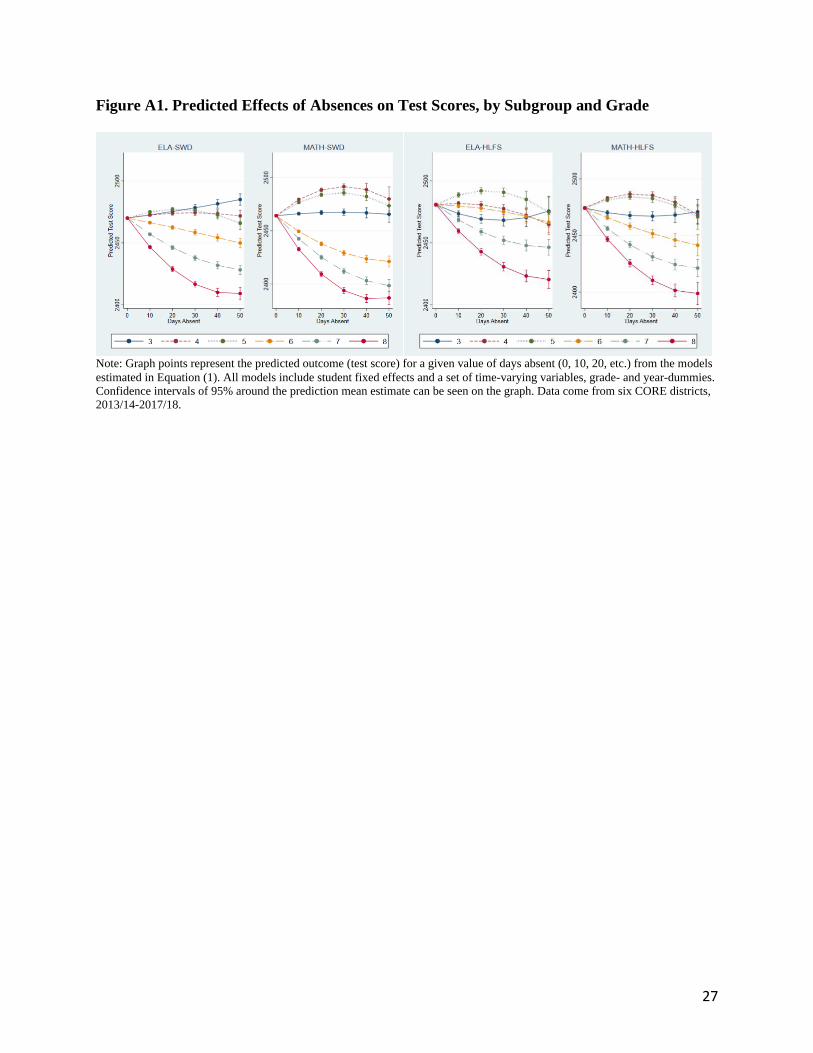
understand these effects. For all subgroups, absences appear to have a more negative impact on
test scores in the middle school grades relative to elementary grades (results by subgroup and
grade available in the online appendix (Figure A1).
[Figure 3 HERE]
Effects of Absences on Social-Emotional Learning Outcomes
12 These percentages closely mirror the proportions in the overall CORE student population.
13
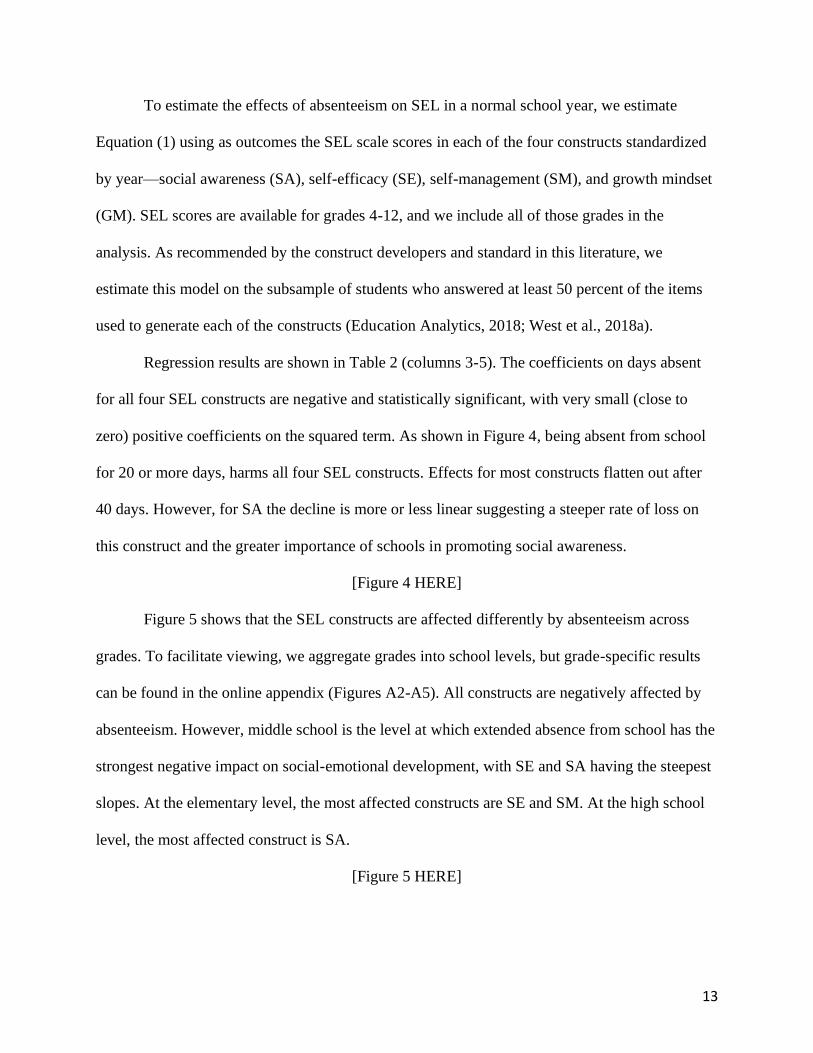
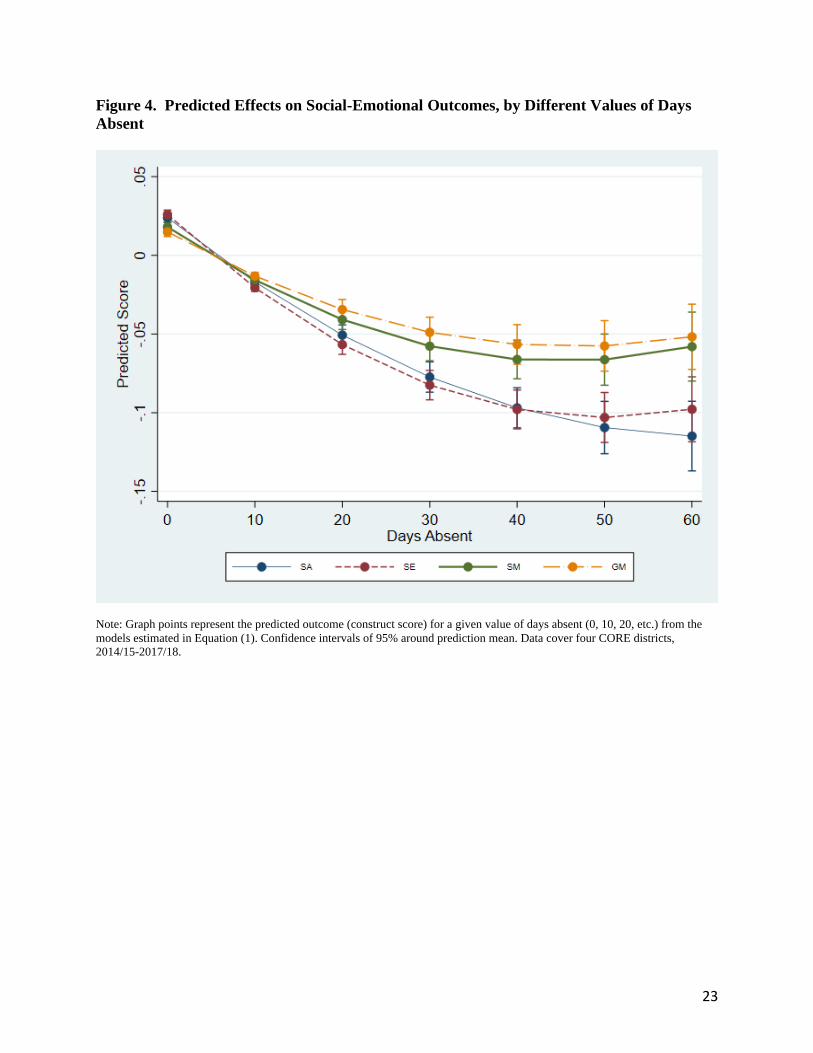
To estimate the effects of absenteeism on SEL in a normal school year, we estimate
Equation (1) using as outcomes the SEL scale scores in each of the four constructs standardized
by year—social awareness (SA), self-efficacy (SE), self-management (SM), and growth mindset
(GM). SEL scores are available for grades 4-12, and we include all of those grades in the
analysis. As recommended by the construct developers and standard in this literature, we
estimate this model on the subsample of students who answered at least 50 percent of the items
used to generate each of the constructs (Education Analytics, 2018; West et al., 2018a).
Regression results are shown in Table 2 (columns 3-5). The coefficients on days absent
for all four SEL constructs are negative and statistically significant, with very small (close to
zero) positive coefficients on the squared term. As shown in Figure 4, being absent from school
for 20 or more days, harms all four SEL constructs. Effects for most constructs flatten out after
40 days. However, for SA the decline is more or less linear suggesting a steeper rate of loss on
this construct and the greater importance of schools in promoting social awareness.
[Figure 4 HERE]
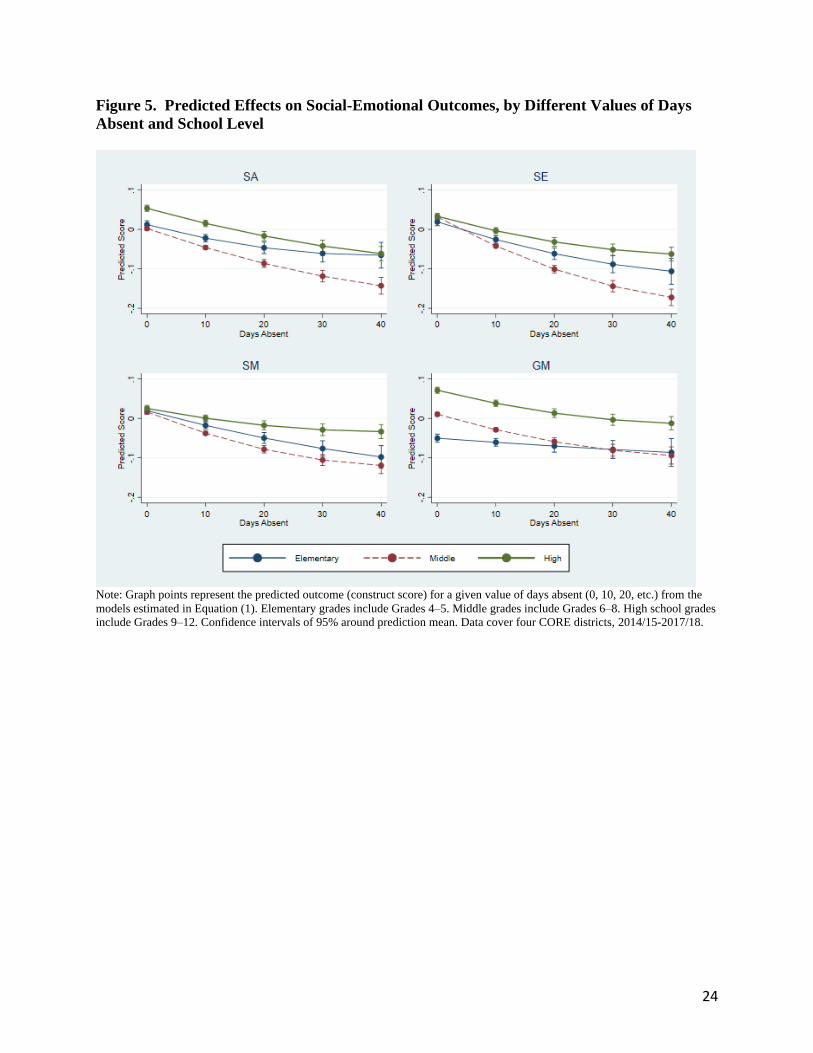
Figure 5 shows that the SEL constructs are affected differently by absenteeism across
grades. To facilitate viewing, we aggregate grades into school levels, but grade-specific results
can be found in the online appendix (Figures A2-A5). All constructs are negatively affected by
absenteeism. However, middle school is the level at which extended absence from school has the
strongest negative impact on social-emotional development, with SE and SA having the steepest
slopes. At the elementary level, the most affected constructs are SE and SM. At the high school
level, the most affected construct is SA.
[Figure 5 HERE]
14
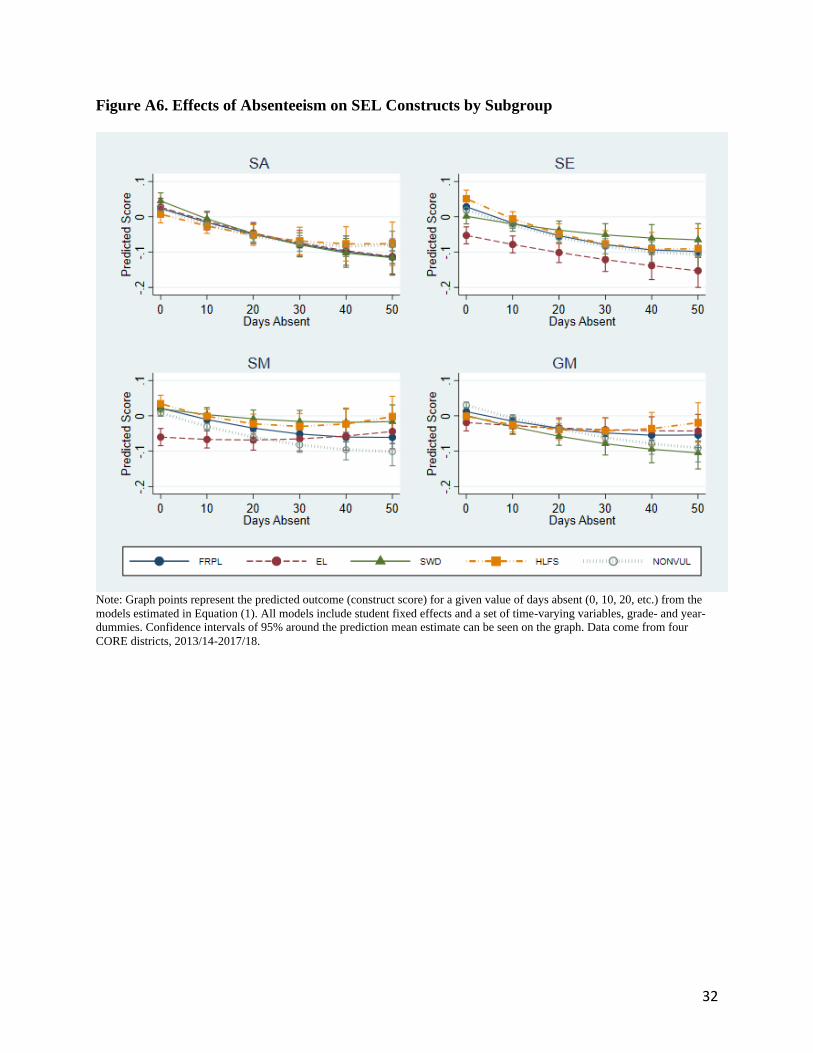
Absences are detrimental to all subgroups (see online appendix Figure A6). Absences
harm SA and SE more or less equally across groups. Absences harm non-vulnerable students
more than others in SM, and they harm non-vulnerable students and SWDs slightly more than
others in GM.
Conclusion
After schools shut down in-person instruction in mid-March 2020, districts across the
nation scrambled to provide various modes of distance instruction within weeks so students
would lose as little learning as possible. In an effort to help assess the possible effects of being
away from school during the pandemic, we estimated the impact of absenteeism on academic
and social-emotional outcomes from recent pre-COVID experience. This study, using data from
six large school districts in California, shows that average absenteeism is low in the regular
school year: about seven days on average, although this is higher in secondary school and for
certain subgroups such as homeless/foster youth and students with disabilities.
This paper adds important information to the growing evidence on the anticipated
negative impact of COVID-19 on student development and its possible differential impacts by
student subgroups. We show that absenteeism negatively affects student achievement, more so
for mathematics than ELA and more so for middle school students than elementary students.
Although all students experience the negative effects of absenteeism on academic outcomes,
certain vulnerable subgroups of students—particularly low-income students, students with
disabilities, and homeless and foster youth—are more subject to the negative impact than other
students.
Being absent from school harms SEL skills, as well, particularly those related to social
awareness, self-efficacy, and self-management and, again, more so for middle school students
15
than others. Absences are detrimental to SEL for all subgroups, with some variation across
groups.
Taken together with evidence that significant numbers of students were absent from
virtual schooling opportunities for longer periods than normal during the COVID-19 pandemic
(EdWeek Research Center, 2020; Hamilton et al., 2020) and that absenteeism was highest among
students of color and disadvantaged groups (Besecker, Thomas & Daley, 2020), our results
suggest that school disruptions brought on by the pandemic will negatively affect both the
academic and social-emotional development of students, particularly for students in certain
grades and vulnerable subgroups. It is increasingly evident that students will need both academic
and social-emotional support to make up for lost time.
Our study raises some questions as to why these effects occur with different patterns for
different groups and grades. For example, heterogeneity within certain groups such as ELs and
SWDs across grades and sub-categorizations may be driving some of the differences we see.
More research is needed with regard to the mechanisms by which absence from school affect
students of all types so that the full effects of the pandemic or other such shocks to the school
system can be better understood.
This study provides an overview of the effects of absenteeism on both academic and
social-emotional development across a large span of grades and for several subgroups of
students. As such, it enables districts to gauge the potential effects of absenteeism to better
predict and proactively address the potential effects of COVID-19.
16
References
Aucejo, E. M., & Romano, T. F. (2016). Assessing the effect of school days and absences on test
score performance. Economics of Education Review, 55, 70-87.
Burke, M (2020). “A Unified plans expanded summer school as ‘just about every’ student is now
connected online” EdSource. Available at:
https://edsource.org/2020/la-unified-plans-expanded-summer-school-as-just-about-every-
student-is-now-connected-online/631280 (last accessed June 23, 2020)
Claro, S., Paunesku, D., & Dweck, C. S. (2016). Growth mindset tempers the effects of poverty
on academic achievement. Proceedings of the National Academy of Sciences, 113(31), 8664-
8668.
Education Analytics (2018). CORE Districts’ SEL Survey Scale Scores (SY2016-17 and
SY2017-18) Technical Memorandum. December 2018.
EdWeek Research Center (2020). Survey Tracker: Monitoring How K-12 Educators Are
Responding to Coronavirus. EdWeek, June 2, 2020. Available at:
https://www.edweek.org/ew/articles/2020/04/27/survey-tracker-k-12-coronavirus-response.html
Gershenson, S., Jacknowitz, A., & Brannegan, A. (2017). Are student absences worth the worry
in US primary schools?. Education Finance and Policy, 12(2), 137-165.
Gottfried, M. A. (2014). Chronic absenteeism and its effects on students’ academic and
socioemotional outcomes. Journal of Education for Students Placed at Risk (JESPAR), 19(2),
53-75.
Gottfried, M.A. (2011). The Detrimental Effects of Missing School: Evidence from Urban
Siblings. American Journal of Education, 117, 147-182.
Gottfried, M. A. (2009). Excused versus unexcused: How student absences in elementary school
affect academic achievement. Educational Evaluation and Policy Analysis, 31(4), 392-415.
Hamilton, L. S., Grant, D., Kaufman, J. H., Diliberti, M., Schwartz, H. L., Hunter, G. P., ... &
Young, C. J. (2020). COVID-19 and the State of K–12 Schools: Results and Technical
Documentation from the Spring 2020 American Educator Panels COVID-19 Surveys.
Hough, H., Kalogrides, D., & Loeb, S. (2017). Using Surveys of Students' Social-Emotional
Learning and School Climate for Accountability and Continuous Improvement. Policy Analysis
for California Education, PACE.
Kanopka, K., Claro, S., Loeb, S., West, M., & Fricke, H. (2020, July). What do changes in
social-emotional learning tell us about changes in academic and behavioral outcomes? [Policy
brief]. Policy Analysis for California Education. https://edpolicyinca.org/publications/changes-
social-emotional-learning.
17
Kuhfeld, Megan, James Soland, Beth Tarasawa, Angela Johnson, Erik Ruzek, and Jing Liu.
(2020). Projecting the potential impacts of COVID-19 school closures on academic achievement.
(EdWorkingPaper: 20-226). Retrieved from Annenberg Institute at Brown University:
https://doi.org/10.26300/cdrv-yw05
Loeb, S., Christian, M. S., Hough, H., Meyer, R. H., Rice, A. B., & West, M. R. (2019). School
differences in social–emotional learning gains: Findings from the first large-scale panel survey of
students. Journal of Educational and Behavioral Statistics, 44(5), 507-542.
Liu, J., Lee, M., & Gershenson, S. (2020). The Short- and Long-Run Impacts of Secondary
School Absences. (EdWorkingPaper: 20-125). Retrieved from Annenberg Institute at Brown
University: https://doi.org/10.26300/xg6s-z169
Meyer, R. H., Wang, C., & Rice, A. B. (2018). Measuring Students' Social-Emotional Learning
among California's CORE Districts: An IRT Modeling Approach. Working Paper. Policy
Analysis for California Education, PACE.
Umansky, I. (2020). COVID-19’s Impact on English Learner Students. Possible Policy
Responses. PACE Commentary. June 9., 2020. Available at:
https://edpolicyinca.org/newsroom/covid-19s-impact-english-learner-students
Umansky, I. M., & Porter, L. (2020). State English Learner Education Policy: A Conceptual
Framework to Guide Comprehensive Policy Action. Education Policy Analysis
Archives, 28(17), n17.
Umansky, I. (2018). State Policies to Advance English Learners' Experiences and Outcomes in
California's Schools. Technical Report. Getting Down to Facts II. Policy Analysis for California
Education, PACE.
Usher, E. L., & Pajares, F. (2009). Sources of self-efficacy in mathematics: A validation
study. Contemporary educational psychology, 34(1), 89-101.
Warren, P., & LaFortune, J. (2019). Achievement in California's Public Schools: What Do Test
Scores Tell Us?. Public Policy Institute of California.
West, M. R., Pier, L., Fricke, H., Loeb, S., Meyer, R. H., & Rice, A. B. (2018a). Trends in
Student Social-Emotional Learning: Evidence from the CORE Districts. Working Paper. Policy
Analysis for California Education, PACE.
West, M. R., Buckley, K., Krachman, S. B., & Bookman, N. (2018b). Development and
implementation of student social-emotional surveys in the CORE Districts. Journal of Applied
Developmental Psychology, 55, 119-129.
18
Table 1. Average Days Absent per Year, By Subgroup
Panel A - Mean Days Absent by Subgroup
Grade All EL FRPL SWD HL/FST Latinx White
African-
American
Asian/
P.I.
K 9.2 7.9 9.5 11.6 10.5 9.2 8.3 11.8 7.3
1 7.4 6.4 7.7 9.8 9.0 7.3 7.0 10.0 5.5
2 6.8 6.1 7.0 9.0 8.5 6.7 6.7 9.6 4.8
3 6.5 6.0 6.6 8.7 8.1 6.3 6.6 9.3 4.5
4 6.4 6.0 6.5 8.6 7.8 6.2 6.8 9.1 4.3
5 6.2 6.1 6.3 8.6 7.6 6.0 6.9 8.9 4.1
6 5.9 6.2 6.1 8.5 7.6 5.9 6.5 8.2 3.5
7 6.1 6.8 6.3 8.9 8.1 6.1 6.7 8.5 3.5
8 6.3 7.4 6.5 9.2 9.0 6.4 6.9 8.7 3.5
9 7.5 8.8 7.6 10.9 10.0 7.8 7.3 9.5 3.7
10 8.9 10.8 9.0 12.3 11.5 9.4 8.2 10.5 4.5
11 9.5 12.8 9.5 13.1 11.7 10.0 8.9 11.1 5.6
12 10.8 14.4 10.6 14.4 13.2 11.2 10.3 12.7 7.3
Mean 7.4 8.5 7.5 10.3 9.5 7.5 7.5 9.6 4.4
N 572,805
123,589 432,052
69,246 21,023
403,581
54,174 54,378
56,991
% 0.22 0.75 0.12 0.04 0.70 0.09 0.09 0.10
Panel B - Proportion of Students Absent, Various Levels of Absence
Days Absent
Grade 0 1-10 11-18 >18 >30
K 0.07 0.61 0.19 0.12 0.10
1 0.10 0.66 0.16 0.08 0.06
2 0.12 0.67 0.14 0.07 0.05
3 0.13 0.68 0.13 0.06 0.05
4 0.14 0.67 0.13 0.06 0.05
5 0.15 0.67 0.12 0.06 0.04
6 0.17 0.67 0.11 0.06 0.04
7 0.17 0.66 0.11 0.06 0.05
8 0.17 0.66 0.10 0.07 0.06
9 0.17 0.63 0.11 0.09 0.08
10 0.15 0.62 0.12 0.11 0.10
11 0.14 0.62 0.12 0.12 0.10
12 0.10 0.63 0.14 0.14 0.12
Mean 0.14 0.65 0.13 0.08 0.07
Note: Averages over 2014/15-2017/18 school years. Includes data from six CORE districts.
19
Table 2. Effects of Days Absent on Cognitive and Non-Cognitive Outcomes
ELA Math GM SA SE SM
(1) (2) (3) (4) (5) (6)
Days Absent -0.515*** -0.786*** -0.003*** -0.004*** -0.005*** -0.004***
(0.018) (0.018) (0.000) (0.000) (0.000) (0.000)
Days Enrolled 0.047*** 0.076*** 0.000* 0.000*** 0.000** -0.000***
(0.003) (0.003) (0.000) (0.000) (0.000) (0.000)
Days Absent
Squared 0.002*** 0.004*** 0.000*** 0.000*** 0.000*** 0.000***
(0.000) (0.000) (0.000) (0.000) (0.000) (0.000)
N 1,369,902 1,376,758 1,301,220 1,308,211 1,300,709 1,311,810
Num. Obs. 569,779 572,892 585,949 587,304 585,825 588,066 Note: Robust standard errors in parentheses. Models are estimated as shown in Equation (1). Data cover six CORE districts, for
years 2014/15-2017/18.
20
Figure 1. Predicted Effects on Test Scores, by Different Values of Days Absent
Note: Graph points represent the predicted outcome (test score) for a given value of days absent (0, 10, 20, etc.) from the models
estimated in Equation (1). Confidence intervals of 95% around prediction mean. Data cover six CORE districts, 2014/15-
2017/18.
21
Figure 2. Predicted Effects of Absences on Test Scores, by Grade Level
Note: Graph points represent the predicted outcome (test score) for a given value of days absent (0, 10, 20, etc.) from the models
estimated in Equation (1). Confidence intervals of 95% around prediction mean. Data cover six CORE districts, 2014/15-
2017/18.
22
Figure 3. Predicted Effects of Absences on Test Scores, by Subgroup
Note: Graph points represent the predicted outcome (test score) for a given value of days absent (0, 10, 20, etc.) from the models
estimated in Equation (1). Confidence intervals of 95% around prediction mean. Data cover six CORE districts, 2014/15-
2017/18.
23
Figure 4. Predicted Effects on Social-Emotional Outcomes, by Different Values of Days
Absent
Note: Graph points represent the predicted outcome (construct score) for a given value of days absent (0, 10, 20, etc.) from the
models estimated in Equation (1). Confidence intervals of 95% around prediction mean. Data cover four CORE districts,
2014/15-2017/18.
24
Figure 5. Predicted Effects on Social-Emotional Outcomes, by Different Values of Days
Absent and School Level
Note: Graph points represent the predicted outcome (construct score) for a given value of days absent (0, 10, 20, etc.) from the
models estimated in Equation (1). Elementary grades include Grades 4–5. Middle grades include Grades 6–8. High school grades
include Grades 9–12. Confidence intervals of 95% around prediction mean. Data cover four CORE districts, 2014/15-2017/18.
25
APPENDIX
Table A1. Descriptive Statistics
Variable Obs Mean Std. Dev. Min Max
ELA Test Score (SBAC) 1,560,220 2483.84 112.45 2114 2795
Math Test Score (SBAC) 1,566,215 2475.91 108.47 2189 2862
Growth Mindset Score (std) 1,470,536 0.00 1.00 -3.6 2.5
Social Awareness Score (std) 1,477,334 0.00 1.00 -4.5 3.8
Self-Efficacy Score (std) 1,470,348 0.00 1.00 -3.6 2.1
Self Management Score (std) 1,482,136 0.00 1.00 -4.8 3.0
Student is female 3,153,310 0.49 0.50 0 1
Student receives free or reduced-price
lunch (FRPL) 3,153,843 0.75 0.43 0 1
Student designated English Learner (EL) 3,059,130 0.23 0.42 0 1
Student is homeless/foster youth
(HL/FST) 3,153,852 0.04 0.19 0 1
Student has a disability (SWD) 3,141,801 0.12 0.33 0 1
Student not in any vulnerability category
(NONVUL) 3,197,591 0.02 0.40 0 1
Student’s is Hispanic 3,153,846 0.70 0.46 0 1
Student’s is African-American 3,153,846 0.09 0.29 0 1
Student’s is Asian-American or Pacific-
Islander American 3,153,846 0.10 0.30 0 1
Student’s race is “Other” 3,153,846 0.00 0.06 0 1
Student’s is White 3,153,846 0.10 0.29 0 1
Days Absent (total for school year) 3,153,852 7.41 11.09 0 182
Days Enrolled (total for school year) 3,153,852 169.45 32.27 0 200
Number of suspensions 3,153,852 0.04 0.53 0 76
Number of expulsions 3,153,852 0.00 0.09 0 20
Changed school mid-year 3,153,852 0.02 0.13 0 1
Changed school during the summer 3,153,852 0.12 0.33 0 1 Note: Averages over 2014/15-2017/18 school years. Includes data from six CORE districts. Data are for grades 3-12.
26
Table 2. Robustness to Alternative Specifications
(1) (2) (3) (4) (5) (6)
ELA Math ELA Math ELA Math
Days Absent -0.503*** -1.091*** -0.530*** -1.090*** -0.515*** -0.786***
(0.017) (0.018) (0.017) (0.017) (0.018) (0.018)
Lagged
achievement x x x x
School FE x x
Student FE x x Note: Robust Standard errors in parentheses. Time varying controls include: suspensions, expulsions, change of school in mid-
year or summer, and program designations (FRPL, EL, SWD, HL/FST). All models include grade dummies, year dummies, and
fixed characteristics (gender, race/ethnicity). Models with lagged achievement include lags in ELA and Mathematics.
Coefficients in bold represent main model – these are the coefficients reported in Table 2 of the main text.
27
Figure A1. Predicted Effects of Absences on Test Scores, by Subgroup and Grade
Note: Graph points represent the predicted outcome (test score) for a given value of days absent (0, 10, 20, etc.) from the models
estimated in Equation (1). All models include student fixed effects and a set of time-varying variables, grade- and year-dummies.
Confidence intervals of 95% around the prediction mean estimate can be seen on the graph. Data come from six CORE districts,
2013/14-2017/18.
28
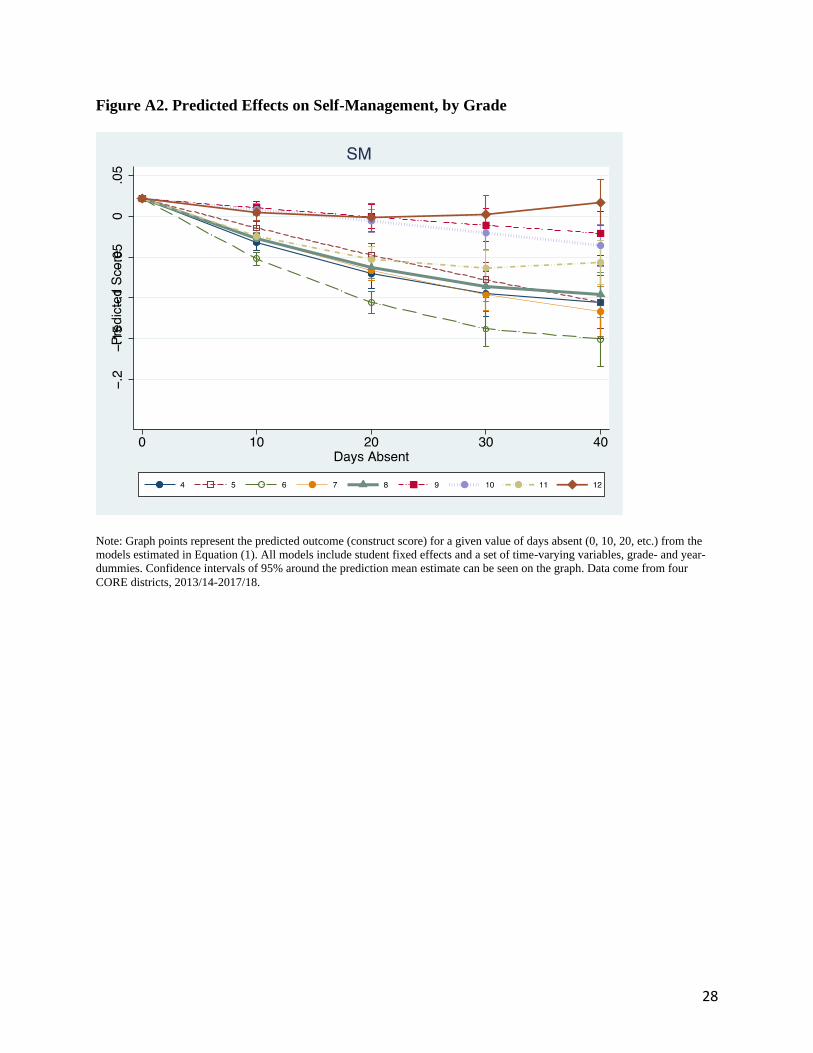
Figure A2. Predicted Effects on Self-Management, by Grade
Note: Graph points represent the predicted outcome (construct score) for a given value of days absent (0, 10, 20, etc.) from the
models estimated in Equation (1). All models include student fixed effects and a set of time-varying variables, grade- and year-
dummies. Confidence intervals of 95% around the prediction mean estimate can be seen on the graph. Data come from four
CORE districts, 2013/14-2017/18.
29
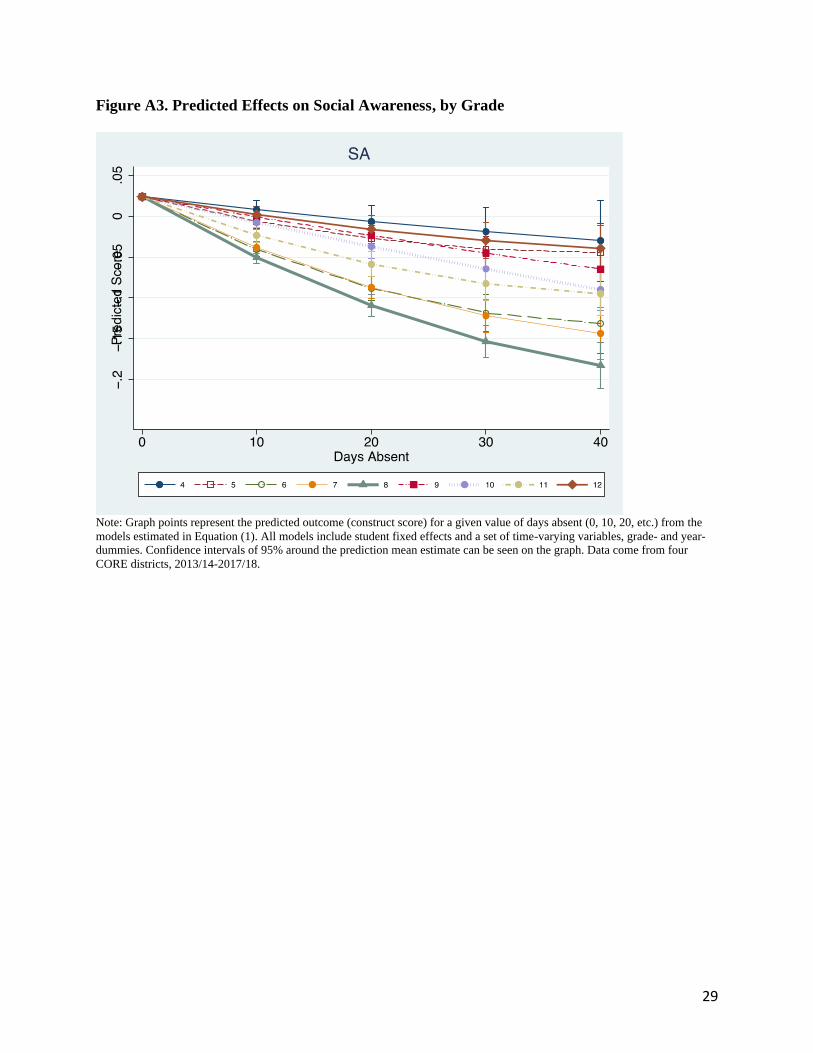
Figure A3. Predicted Effects on Social Awareness, by Grade
Note: Graph points represent the predicted outcome (construct score) for a given value of days absent (0, 10, 20, etc.) from the
models estimated in Equation (1). All models include student fixed effects and a set of time-varying variables, grade- and year-
dummies. Confidence intervals of 95% around the prediction mean estimate can be seen on the graph. Data come from four
CORE districts, 2013/14-2017/18.
30
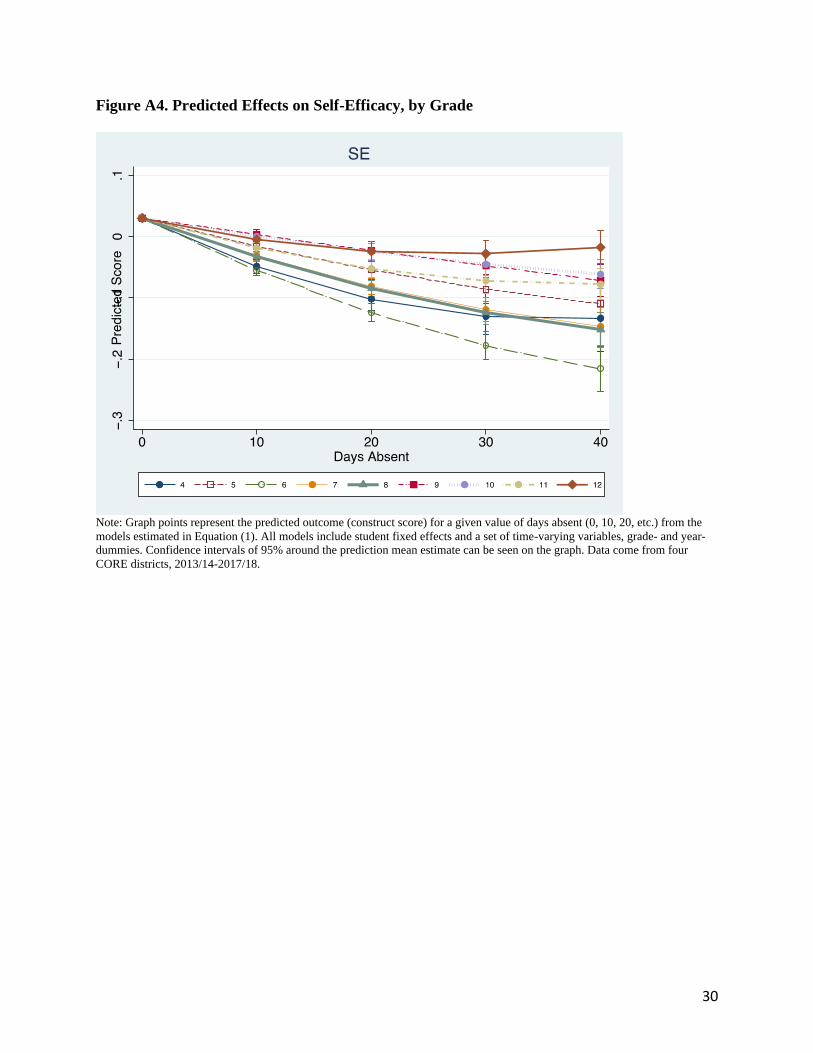
Figure A4. Predicted Effects on Self-Efficacy, by Grade
Note: Graph points represent the predicted outcome (construct score) for a given value of days absent (0, 10, 20, etc.) from the
models estimated in Equation (1). All models include student fixed effects and a set of time-varying variables, grade- and year-
dummies. Confidence intervals of 95% around the prediction mean estimate can be seen on the graph. Data come from four
CORE districts, 2013/14-2017/18.
31
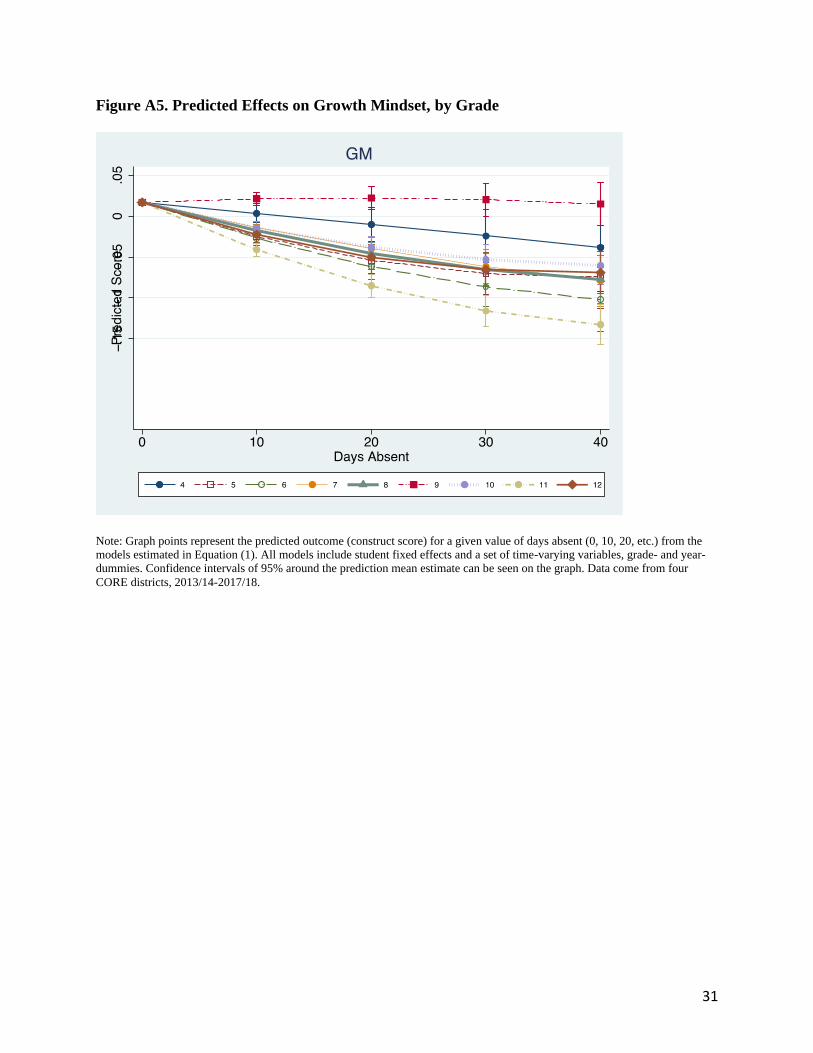
Figure A5. Predicted Effects on Growth Mindset, by Grade
Note: Graph points represent the predicted outcome (construct score) for a given value of days absent (0, 10, 20, etc.) from the
models estimated in Equation (1). All models include student fixed effects and a set of time-varying variables, grade- and year-
dummies. Confidence intervals of 95% around the prediction mean estimate can be seen on the graph. Data come from four
CORE districts, 2013/14-2017/18.
32
Figure A6. Effects of Absenteeism on SEL Constructs by Subgroup
Note: Graph points represent the predicted outcome (construct score) for a given value of days absent (0, 10, 20, etc.) from the
models estimated in Equation (1). All models include student fixed effects and a set of time-varying variables, grade- and year-
dummies. Confidence intervals of 95% around the prediction mean estimate can be seen on the graph. Data come from four
CORE districts, 2013/14-2017/18.