education level, monthly per-capita expenditure, and
TRANSCRIPT

Education Level, Per-Capita Expenditure, and Healthy Aging 95Tohoku J. Exp. Med., 2020, 250, 95-108
95
Received October 29, 2019; revised and accepted January 31, 2020. Published online February 18, 2020; doi: 10.1620/tjem.250.95.Correspondence: Ichiro Tsuji, Division of Epidemiology, Department of Health Informatics and Public Health, School of Public Health,
Tohoku University Graduate School of Medicine, 2-1 Seiryo-machi, Aoba-ku, Sendai, Miyagi 980-8575, Japan.e-mail: [email protected]
©2020 Tohoku University Medical Press. This is an open-access article distributed under the terms of the Creative Commons Attribution-NonCommercial-NoDerivatives 4.0 International License (CC-BY-NC-ND 4.0). Anyone may download, reuse, copy, reprint, or distribute the article without modifications or adaptations for non-profit purposes if they cite the original authors and source properly.https://creativecommons.org/licenses/by-nc-nd/4.0/
Education Level, Monthly Per-Capita Expenditure, and Healthy Aging in the Older Indonesian Population: The Indonesia Family Life Survey 2007 and 2014
Dieta Nurrika,1,2 Shu Zhang,1 Andrea Discacciati,3 Yasutake Tomata,1 Yingxu Liu,1 Yumi Sugawara1 and Ichiro Tsuji1
1Division of Epidemiology, Department of Health Informatics and Public Health, School of Public Health, Tohoku University Graduate School of Medicine, Sendai, Miyagi, Japan
2Banten School of Health Science, Ministry of Research, Technology and Higher Education, Higher Education Service Institutions (LL-DIKTI) Region IV, Bandung, West Java, Indonesia
3Department of Medical Epidemiology and Biostatistics, Karolinska Institutet, Solna, Stockholm, Sweden
In developed countries, the relationship between education level, wealth, and healthy aging have been found to be mediated by modifiable risk factors, such as obesity, physical activities, and smoking status. The present study was to investigate the association between education level, monthly per-capita expenditure (PCE), and healthy aging in the older Indonesian population, and to clarify modifiable risk factors that mediate this association. A 7-year prospective longitudinal study (2007-2014) was conducted on 696 older Indonesian individuals (≥ 50 years) living in 13 different provinces in Indonesia during the survey periods. Data on educational level, PCE, and modifiable risk factors were collected in 2007. Information on healthy aging was obtained in both 2007 and 2014. A multivariate-adjusted logistic regression model was used to estimate the odds ratio (ORs) and 95% confidence intervals (CIs) for healthy aging by education level and PCE. The mediating effects were estimated using a four-way effect decomposition. Out of 696 eligible subjects, 206 (29.6%) were judged as healthy aging in 2014. The OR (95% CI) for healthy aging for participants with a higher education level was 1.81 (1.23-2.65) compared with those with a lower education level, and no significant association was observed between PCE and healthy aging. An association was thus observed between education level and healthy aging, but not PCE. Importantly, the association between education level, PCE, and healthy aging does not appear to be mediated by the modifiable risk factors. Priorities in making health policy would be different between developed countries and developing countries.
Keywords: education level; healthy aging; Indonesia; mediation analysis; monthly per-capita expenditureTohoku J. Exp. Med., 2020 February, 250 (2), 95-108.
IntroductionIndonesia is the fourth most populous country in the
world. As of 2015, the population was nearly 260 million, and is estimated to rise to 295 million by 2030 (World Health Organization 2017). According to census data from Indonesia, the percentage of older persons among the total population increased rapidly, from 4.5% to 7.6%, between 1971 and 2010. This percentage is projected to continue increasing, reaching 15.8% by 2035 and 25.0% by 2050 (Adioetomo and Mujahid 2014; Central Bureau of Statistics
2018). This demographic change is becoming crucial for the Indonesia government to prepare the older society for healthy aging in the future (Adioetomo and Mujahid 2014).
Education level and household wealth, as representa-tive measurements of socioeconomic status, are associated with healthy aging in Europe (Kollia et al. 2018). Previous studies in developed countries have suggested that the asso-ciation between education level, household wealth, and healthy aging is influenced by certain modifiable risk fac-tors (Oshio 2018), including body mass index (BMI), chronic disease, body pain, physical activity level, smoking
D. Nurrika et al.96
status, health insurance status, marital status, and commu-nity participation (Hahn and Truman 2015; White et al. 2015; Oshio 2018; Kollia et al. 2018). To our knowledge, however, the association between education level, house-hold wealth, and healthy aging in Indonesia has not been investigated. Therefore, to promote healthy aging among the older Indonesia population, identifying this association and any modifiable risk factors mediating has become an important issue.
For Indonesia as a developing country, the challenge of an aging population is more complex than that in devel-oped countries. These complex challenges come from not only the different socioeconomic conditions but also the relative delay in enacting health policies (Kaneda and Zimmer 2007; Central Bureau of Statistics 2018). In Indonesia, 34.68% of the older population has not com-pleted elementary school, and 44.45% live below the pov-erty line (i.e., at the bottom 40% of total per-capita expen-diture [PCE]) (Central Bureau of Statistics 2018). Indonesia has not signed the World Health Organization (WHO) Framework Convention on Tobacco Control, and the number of elderly who smoke is quite high, at 24.26% (Central Bureau of Statistics 2018; Mboi et al. 2018). Health insurance protects the community in terms of health; however, because it was not implemented until 2014, its coverage still does not extend to the entire older population (Central Bureau of Statistics 2017; Mboi et al. 2018), which could adversely affect the potential of healthy aging in Indonesia. For these reasons, in the present study, we con-sider whether modifiable risk factors between education level, monthly PCE, and healthy aging among older Indonesians differ from those among older populations in developed countries. Therefore, the aims of the present study were to investigate the association between education level, monthly PCE, and healthy aging in the older Indonesian population, and to clarify any modifiable risk factors that may mediate on the association between educa-tion level, monthly PCE and healthy aging.
MethodsThe Indonesia Family Life Survey (IFLS)
The Indonesia Family Life Survey (IFLS) is an ongo-ing longitudinal study that has been conducted in 1993, 1997, 2000, 2007, and 2014. The present study used the data of IFLS 4 in 2007 and IFLS 5 in 2014. The design of the IFLS study has been described in detail elsewhere (Frankenberg et al. 1995; Strauss et al. 2009, 2016). In brief, in 1993, The IFLS sampling frame was stratified on provinces and urban/rural areas; then, based on these strata, the subjects were selected randomly. Provinces were selected to maximize the representation of the population, capture the socioeconomic diversity of Indonesia, and bal-ance the cost-effectiveness (Frankenberg et al. 1995).
The IFLS sample represented about 83% of the Indonesian population living in 13 of the 27 total provinces. The survey randomly selected 321 areas in the 13 prov-
inces, which represented urban-rural areas, geographical and ethnic comparisons (Frankenberg et al. 1995). Within a selected area, a household was randomly selected; after-ward, an individual age ≥ 50 years and their spouse in the household also were randomly selected from the household members outside the head of the household and their spouses and children aged 0-14 years old. Furthermore, asked to provide the information below.
The IFLS survey involved face-to-face interviews with adult participants. Questionnaires were used to collect indi-vidual information, such as education level, monthly PCE, self-assessed health status, physical ability to carry out activities of daily living, cognitive capacity, body weight, height, chronic diseases, body pain, physical activity level, smoking status, health insurance status, marital status, and community participation and so on (Strauss et al. 2016).
Study populationThe data used in the present study were obtained from
the Indonesia Family Life Survey (IFLS) 2007 and 2014 because information on the outcome variables for measur-ing healthy aging in our study were available only in the IFLS 4 (Strauss et al. 2009) and IFLS 5 (Strauss et al. 2016).
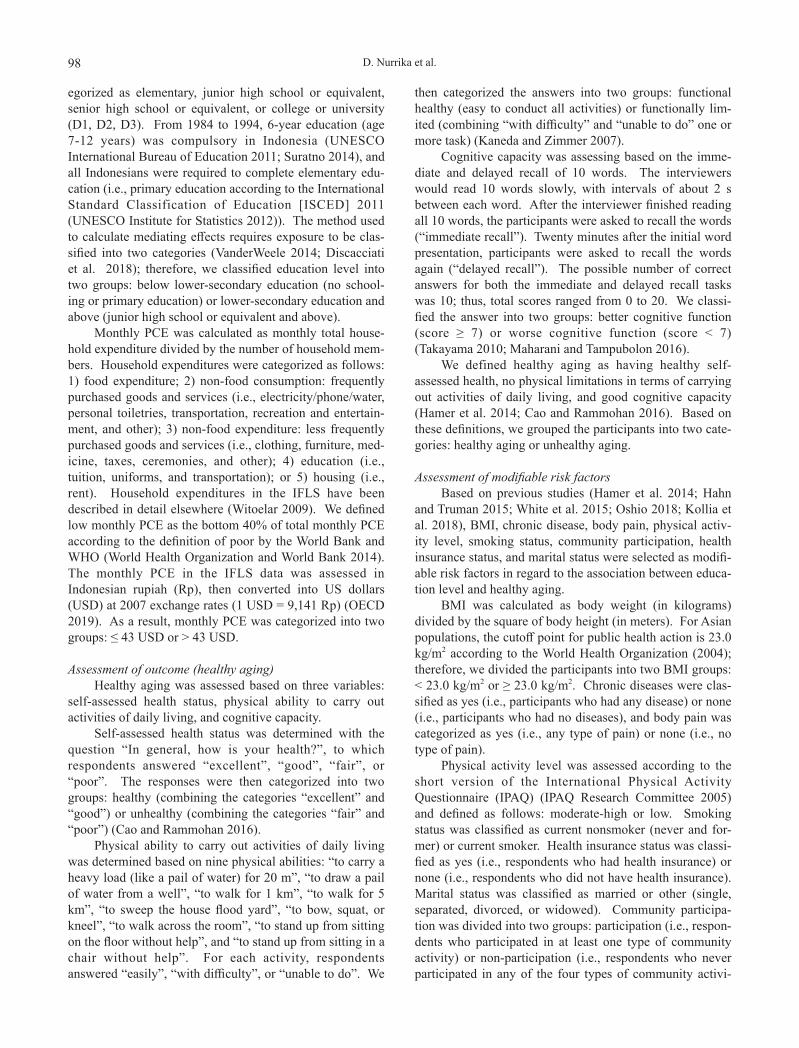
The IFLS 4 survey was conducted between November 2007 and mid-July 2008 and the IFLS 5 from September 2014 until April 2015 (Strauss et al. 2009, 2016). The eli-gible population for the IFLS 4 comprised 7,040 men and women aged ≥ 50 years, among whom, 6,077 responded to the questionnaire that formed our study (Fig. 1).
Among the respondents to the IFLS 4, we excluded 565 with missing data for date of birth, 489 who were aged < 50 years based on birth date, 111 with missing data for exposure (9 for education level and 102 for monthly PCE), 818 with missing data for cognitive capacity, 168 with missing data for modifiable risk factors (including BMI, community participation, physical activity level, and/or health insurance status), and 2,824 who were categorized as unhealthy aging (defined as unhealthy self-assessed health status, physical limitations in terms of carrying out activi-ties of daily living, and/or poor cognitive capacity) in the IFLS 4, leaving 1,102 healthy aging older individuals .
Next, we excluded one participant who was ineligible for the IFLS 5, 102 who had died, 99 who had moved out of the IFLS areas before the IFLS 5, 98 with missing data on self-assessed health, and 106 with missing data on cog-nitive capacity, finally leaving 696 participants eligible for analysis. This 7-year longitudinal study was carried out between 2007 and 2014. In 2014, healthy aging was con-firmed for 206 (29.6%) individuals.
Assessment of exposure (education level and monthly PCE)Education level was assessed using the following
questions: 1) “Have you ever attended school?”, to which respondents answered “yes” or “no”; 2) “What is the high-est education level attained?”, to which the answer was cat-

Education Level, Per-Capita Expenditure, and Healthy Aging 97
7,040
6,077
5,512
5,023
5,014
4,912
4,094
4,059
3,928
3,927
3,926
1,102
1,101
102 (9.3%) All-cause death before IFLS 5
900 (81.7%) Participants
whose responds in IFLS 5
99 (9.0%) Move out before
IFLS 5
802
696
206 (29.6%) Healthy ageing
in IFLS 5
490 (70.4%) Unhealthy ageing
in IFLS 5
Participants (age ≥ 50 years) who were supposed to be interviewed in IFLS 4
Participants who responded to questionnaire in IFLS 4 Participants whose date of birth datawere available in IFLS 4
Participants who aged ≥ 50 yearsaccording to the birth data in IFLS 4
Participants whose education data were available in IFLS 4
Participants whose monthly per-capita expenditure data were available in IFLS 4
Participants whose cognitive function data were available in IFLS 4
Participants whose BMI data were available in IFLS 4
Participants whose communityparticipation data were available in IFLS 4
Participants whose physical activity data were available in IFLS 4
Participants whose insurance data were available in IFLS 4
Participants whose healthy ageing in IFLS 4Participants who were eligible in IFLS 5
Participants whose self-assessed health data were available in IFLS 5
Participants whose cognitive capacity data were available in IFLS 5
Fig. 1. Flow Chart of the study participants: education level, monthly PCE and healthy aging, Indonesia Family Life Survey (IFLS) 2007 and 2014.
D. Nurrika et al.98
egorized as elementary, junior high school or equivalent, senior high school or equivalent, or college or university (D1, D2, D3). From 1984 to 1994, 6-year education (age 7-12 years) was compulsory in Indonesia (UNESCO International Bureau of Education 2011; Suratno 2014), and all Indonesians were required to complete elementary edu-cation (i.e., primary education according to the International Standard Classification of Education [ISCED] 2011 (UNESCO Institute for Statistics 2012)). The method used to calculate mediating effects requires exposure to be clas-sified into two categories (VanderWeele 2014; Discacciati et al. 2018); therefore, we classified education level into two groups: below lower-secondary education (no school-ing or primary education) or lower-secondary education and above (junior high school or equivalent and above).
Monthly PCE was calculated as monthly total house-hold expenditure divided by the number of household mem-bers. Household expenditures were categorized as follows: 1) food expenditure; 2) non-food consumption: frequently purchased goods and services (i.e., electricity/phone/water, personal toiletries, transportation, recreation and entertain-ment, and other); 3) non-food expenditure: less frequently purchased goods and services (i.e., clothing, furniture, med-icine, taxes, ceremonies, and other); 4) education (i.e., tuition, uniforms, and transportation); or 5) housing (i.e., rent). Household expenditures in the IFLS have been described in detail elsewhere (Witoelar 2009). We defined low monthly PCE as the bottom 40% of total monthly PCE according to the definition of poor by the World Bank and WHO (World Health Organization and World Bank 2014). The monthly PCE in the IFLS data was assessed in Indonesian rupiah (Rp), then converted into US dollars (USD) at 2007 exchange rates (1 USD = 9,141 Rp) (OECD 2019). As a result, monthly PCE was categorized into two groups: ≤ 43 USD or > 43 USD.
Assessment of outcome (healthy aging)Healthy aging was assessed based on three variables:
self-assessed health status, physical ability to carry out activities of daily living, and cognitive capacity.
Self-assessed health status was determined with the question “In general, how is your health?”, to which respondents answered “excellent”, “good”, “fair”, or “poor”. The responses were then categorized into two groups: healthy (combining the categories “excellent” and “good”) or unhealthy (combining the categories “fair” and “poor”) (Cao and Rammohan 2016).
Physical ability to carry out activities of daily living was determined based on nine physical abilities: “to carry a heavy load (like a pail of water) for 20 m”, “to draw a pail of water from a well”, “to walk for 1 km”, “to walk for 5 km”, “to sweep the house flood yard”, “to bow, squat, or kneel”, “to walk across the room”, “to stand up from sitting on the floor without help”, and “to stand up from sitting in a chair without help”. For each activity, respondents answered “easily”, “with difficulty”, or “unable to do”. We
then categorized the answers into two groups: functional healthy (easy to conduct all activities) or functionally lim-ited (combining “with difficulty” and “unable to do” one or more task) (Kaneda and Zimmer 2007).
Cognitive capacity was assessing based on the imme-diate and delayed recall of 10 words. The interviewers would read 10 words slowly, with intervals of about 2 s between each word. After the interviewer finished reading all 10 words, the participants were asked to recall the words (“immediate recall”). Twenty minutes after the initial word presentation, participants were asked to recall the words again (“delayed recall”). The possible number of correct answers for both the immediate and delayed recall tasks was 10; thus, total scores ranged from 0 to 20. We classi-fied the answer into two groups: better cognitive function (score ≥ 7) or worse cognitive function (score < 7) (Takayama 2010; Maharani and Tampubolon 2016).
We defined healthy aging as having healthy self-assessed health, no physical limitations in terms of carrying out activities of daily living, and good cognitive capacity (Hamer et al. 2014; Cao and Rammohan 2016). Based on these definitions, we grouped the participants into two cate-gories: healthy aging or unhealthy aging.
Assessment of modifiable risk factorsBased on previous studies (Hamer et al. 2014; Hahn
and Truman 2015; White et al. 2015; Oshio 2018; Kollia et al. 2018), BMI, chronic disease, body pain, physical activ-ity level, smoking status, community participation, health insurance status, and marital status were selected as modifi-able risk factors in regard to the association between educa-tion level and healthy aging.
BMI was calculated as body weight (in kilograms) divided by the square of body height (in meters). For Asian populations, the cutoff point for public health action is 23.0 kg/m2 according to the World Health Organization (2004); therefore, we divided the participants into two BMI groups: < 23.0 kg/m2 or ≥ 23.0 kg/m2. Chronic diseases were clas-sified as yes (i.e., participants who had any disease) or none (i.e., participants who had no diseases), and body pain was categorized as yes (i.e., any type of pain) or none (i.e., no type of pain).
Physical activity level was assessed according to the short version of the International Physical Activity Questionnaire (IPAQ) (IPAQ Research Committee 2005) and defined as follows: moderate-high or low. Smoking status was classified as current nonsmoker (never and for-mer) or current smoker. Health insurance status was classi-fied as yes (i.e., respondents who had health insurance) or none (i.e., respondents who did not have health insurance). Marital status was classified as married or other (single, separated, divorced, or widowed). Community participa-tion was divided into two groups: participation (i.e., respon-dents who participated in at least one type of community activity) or non-participation (i.e., respondents who never participated in any of the four types of community activi-

Education Level, Per-Capita Expenditure, and Healthy Aging 99
ties).More details about the assessment of modifiable risk
factors were described in the IFLS 4 (Strauss et al. 2009).
Ethics approvalThe IFLS data used in the present study are publicly
available. The surveys and procedures of the IFLS study were reviewed and approved by institutional review boards (IRBs) at the RAND Corporation in the US and the University of Gadjah Mada (UGM) in Indonesia. Written informed consent was obtained from all participants before data collection began.
Statistical analysisBaseline characteristics were evaluated using one-fac-
tor analysis of variance for continuous variables and the chi-squared test for categorical variables. A multivariate-adjusted logistic regression model was used to estimate the odd ratios (ORs) and 95% confidence intervals (CIs) for healthy aging according to education level and monthly PCE using below lower-secondary education and ≤ 43 USD, respectively, as reference values. Model 1 was age- (50-59, 60-69, ≥ 70 years) and sex-adjusted. Model 2 was adjusted for model 1 added regions (Sumatra, Java-Bali, West Nusa Tenggara, South Kalimantan, or South Sulawesi) and areas (urban or rural) (more details about the regions and areas were described in the IFLS 4 (Strauss et al. 2009)). To examine whether the association between edu-cation level and healthy aging was attributable to monthly PCE, model 3 was adjusted for model 2 added monthly PCE (≤ 43 or > 43 USD). While to verify the association between monthly PCE and healthy aging was attributable to education level, model 3 was further adjusted for model 2 added education level (below lower-secondary education or lower-secondary education and above).
Logistic regression models were also used to calculate the ORs and 95% CIs for the modifiable risk factors on healthy aging. Model 1 was age- and sex-adjusted. Model 2 was further adjusted for regions, areas, education level, monthly PCE and all modifiable risk factors simultaneously.
To estimate the mediating effects, we used four-way effect decomposition (VanderWeele 2014), where the total effect (overall effect of exposure on healthy aging) was decomposed into: 1) a controlled direct effect (component of the total excess relative risk due to the effect of exposure on healthy aging when the modifiable risk factors are fixed to the referent level [i.e., better level]); 2) reference interac-tion (component of the total excess relative risk due to the interaction only between exposure and modifiable risk fac-tors); 3) mediated interaction (component of the total excess relative risk due to both the mediating effects of modifiable risk factors and the interaction between exposure and the modifiable risk factors); and 4) pure indirect effect or medi-ated main effect (component of the total excess relative risk due to the mediating effects of modifiable risk factors only). Logistic regression models were used for both the outcomes
and the mediators. Age (50-59, 60-69, ≥ 70 years), sex, region, area, monthly PCE, and education level were con-trolled in the models as confounding factors. The modifi-able risk factors were categorized into dichotomous vari-ables: BMI (< 23.0 kg/m2 [reference] or ≥ 23.0 kg/m2), chronic disease (yes or none [reference]), body pain (yes or none [reference]), physical activity level (low or moderate-high [reference]), smoking status (current or nonsmoker [reference]), health insurance status (yes [reference] or no), marital status (married [reference] or other), and commu-nity participation (participation in any community activity [reference] or non-participation). The mediating effect for each of the modifiable risk factors was estimated by consid-ering them one at a time.
The logistic regression model was carried out using the SAS statistical software package (version 9.4; SAS Institute Inc.), and the mediation effects using Stata (Stata/MP 14.2; Stata Corp LLC.) and the med4way package (Discacciati et al. 2018). All statistical tests were two-sided. P values < 0.05 were considered to be statistically significant.
ResultsOut of 696 eligible subjects, 206 (29.6%) were judged
as healthy aging in IFLS 5.
Baseline characteristicsTable 1 shows the baseline characteristics of the par-
ticipants according to education level. Participants with a higher education level were younger and more likely to be men, to live in Java-Bali, to live in an urban area, to have higher monthly PCE, to have a higher BMI, to have hyper-tension and diabetes, to participate in community meeting, and to have health insurance. Those with a higher educa-tion level also less likely to live in West Nusa Tenggara, South Kalimantan, and South Sulawesi, to have low monthly PCE, to have hip pain, and to have a moderate-high physical activity level.
Table 2 shows the baseline characteristics of the par-ticipants according to monthly PCE. Participants with a higher monthly PCE were more likely to live in an urban area, to have a higher education level, to have a higher BMI, to have hypertension, diabetes, and coronary heart disease, to participate in community meeting, and to have health insurance. They were also less likely to have a mod-erate-high physical activity level and be a current smoker.
Education level, monthly PCE, and healthy agingTable 3 shows the association between education level,
monthly PCE, and healthy aging (n = 696). The multivari-ate-adjusted OR (95% CI) for healthy aging was 1.81 (1.23-2.65) for those with a higher education level (Model 3: P < 0.01), as compared with the participant with a lower educa-tion level. However, no evidence of an association was observed between PCE and healthy aging (Model 3, OR [95% CI] 0.88 [0.60-1.30]).

D. Nurrika et al.100
Table 1. Baseline characteristics of the participants by education level in the Indonesia Family Life Survey (IFLS) 2007 (n = 696).
Education levelP valuea
Below lower-secondary education
Lower-secondary education and above
No. of all participants 365 331Age, y (mean ± SDb) 56.6 ± 5.3 55.8 ± 4.7 < 0.05Males (%) 60.6 72.8 < 0.01Region (%) Sumatra 15.3 13.0 0.38 Java-Bali 64.1 74.3 < 0.01 West Nusa Tenggara, South Kalimantan, South Sulawesi 20.6 12.7 < 0.05Urban area (%)c 44.7 76.4 < 0.01Per-capita expenditure, USDd (mean ± SD) 50 ± 52 99 ± 102 < 0.01Low per-capita expendituree (%) 58.1 20.2 < 0.01Body Mass Index, kg/m2 (mean ± SD) 22.3 ± 4.2 24.2 ± 4.0 < 0.01Chronic diseases (%) Hypertension 11.8 17.5 < 0.05 Diabetes 0.6 5.1 < 0.01 Coronary Heart Diseases 1.1 2.1 0.28 Stroke 0.3 0.0 0.34 Depression 0.3 0.0 0.34Body pain (%) Head 24.7 20.9 0.23 Neck 5.5 5.7 0.88 Shoulder 5.8 5.1 0.72 Arm 4.7 8.2 0.06 Wrist/hand/fingers 3.3 6.0 0.08 Back/lower back 9.6 7.9 0.42 Hip 7.7 3.9 < 0.05 Knee 10.1 7.9 0.29 Ankle/foot/toes 4.9 7.3 0.20Physical activity level, moderate-high (%)f 95.1 80.1 < 0.01Current smoker (%) 45.2 42.0 0.39Participation in community activities (%) Community meeting 29.9 55.9 < 0.01 Voluntary labor 40.8 43.2 0.53 Program to improve the village/neighborhood 32.1 33.5 0.68 Religious activities 76.7 76.1 0.86Health insurance, yes (%) 23.6 48.6 < 0.01Married (%) 82.7 87.9 0.05
aObtained using the chi-squared test for categorical variables and one-factor analysis of variance for continuous variables.bSD, standard deviation.cCentral Bureau of Statistics (BPS) Indonesia definition (population density of 5,000 persons per km2; 25% or less of the households work in the agricultural sector; and having eight or more specific kinds of urban facilities, including primary schools, junior high schools, senior high schools, hospitals, maternity [mother-child] hospitals, primary health care centers, roads [to accommodate three- and four-wheeled motorized vehicles], telephones, post offices, markets, cinemas, banks, shopping centers, factories, and restaurants).dUSD at 2007 exchange rates (1 USD = 9,141 Rp). eIn the bottom 40% of monthly per-capita expenditure (about ≤ 43 USD / month).fInternational Physical Activity Questionnaire (IPAQ) categories: moderate: 1) ≥ 3 days of vigorous activity for ≥ 20 min per day; or 2) ≥ 5 days of moderate-intensity activity and/or walking of ≥ 30 min per day; or 3) ≥ 5 days of any combination of walking, moderate-intensity, or vigorous-intensity activities achieving a minimum of 600 MET-min/week; and high: 1) vigorous-intensity activity for ≥ 3 days accumulating ≥ 1,500 MET-min/week; or 2) ≥ 7 days of any combination of walking, moderate-intensity, or vigorous-intensity activities accumulating ≥ 3,000 MET-min/week).

Education Level, Per-Capita Expenditure, and Healthy Aging 101
Table 2. Baseline characteristics of the participants by monthly per-capita expenditure, in the Indonesia Family Life Survey (IFLS) 2007 (n = 696).
Monthly per-capita expenditure (USD)b
P valuea
≤ 43 > 43
No. of all participants 279 417Age, y (mean ± SDc) 56.4 ± 5.4 56.1 ± 4.7 0.38Males (%) 67.4 65.7 0.65Region (%) Sumatra 12.2 15.6 0.21 Java-Bali 67.7 69.8 0.57 West Nusa Tenggara, South Kalimantan, South Sulawesi 20.1 14.6 0.06Urban area (%)d 43.0 71.0 < 0.01Lower-secondary education and above (%) 24.0 63.3 < 0.01Education level (%)e
No schooling 11.1 2.6
< 0.01 Primary education 64.9 34.1 Lower secondary education 13.6 17.3 Upper secondary education 9.0 27.1 University 1.4 18.9Body Mass Index, kg/m2 (mean ± SD) 22.2 ± 4.2 23.8 ± 4.1 < 0.01Chronic diseases (%) Hypertension 10.8 17.0 < 0.05 Diabetes 0.7 4.1 < 0.05 Coronary Heart Disease 0.4 2.4 < 0.05 Stroke 0.0 0.2 0.41 Depression 0.4 0.0 0.22Body pain (%) Head 22.6 23.0 0.89 Neck 5.0 6.0 0.58 Shoulder 4.7 6.0 0.45 Arm 6.5 6.2 0.91 Wrist/hand/fingers 3.6 5.3 0.30 Back/lower back 8.2 9.1 0.69 Hip 6.1 5.8 0.85 Knee 9.3 8.9 0.84 Ankle/foot/toes 6.1 6.0 0.96Physical activity, moderate-high (%)f 95.3 83.0 < 0.01Current smoker (%) 50.5 39.1 < 0.01Participation in community activities (%) Community meeting 36.2 46.3 < 0.05 Voluntary labor 40.5 42.9 0.53 Program to improve the village/neighborhood 36.9 30.0 0.06 Religious activities 76.0 76.7 0.82Health insurance, yes (%) 27.6 40.8 < 0.01Married (%) 85.0 85.4 0.88
aObtained using the chi-squared test for categorical variables and one-factor analysis of variance for continuous variables.bTotal monthly household expenditure divided by the number of household members. USD at 2007 exchange rates (1 USD = 9,141 Rp).cSD, standard deviation.dCentral Bureau of Statistics (BPS) Indonesia definition (population density of 5,000 persons per km2; 25% or less of the households work in the agricultural sector; and having eight or more specific kinds of urban facilities, including primary schools, junior high schools, senior high schools, hospitals, maternity [mother-child] hospitals, primary health care centers, roads [to accommodate three- and four-wheeled motorized vehicles], telephones, post offices, markets, cinemas, banks, shopping centers, factories, and restaurants).eThe International Standard Classification of Education (ISCED) 2011.fInternational Physical Activity Questionnaire (IPAQ) categories: moderate: 1) ≥ 3 days of vigorous activity for ≥ 20 min per day; or 2) ≥ 5 days of moderate-intensity activity and/or walking of ≥ 30 min per day; or 3) ≥ 5 days of any combina-tion of walking, moderate-intensity, or vigorous-intensity activities achieving a minimum of 600 MET-min/week; and high: 1) vigorous-intensity activity for ≥ 3 days accumulating ≥ 1,500 MET-min/week; or 2) ≥ 7 days of any combination of walking, moderate-intensity, or vigorous-intensity activities accumulating ≥ 3,000 MET-min/week).

D. Nurrika et al.102
Modifiable risk factors and healthy agingTable 4 shows the association between modifiable risk
factors and healthy aging. The probability of healthy aging was significantly higher among participants who did not have any body pain, as compared with those who did; the multivariate-adjusted ORs (95% CIs) were 2.16 (1.52-3.07) in model 1, and 2.06 (1.44-2.96) in model 2. However, no other modifiable risk factors had a significant effect on healthy aging.
Mediating effects of modifiable risk factors by education level
Table 5 shows the mediating effects of different modi-fiable risk factors between education level and healthy aging. Compared with participants with a lower education level, those with a higher education level had a higher prob-ability of healthy aging (coefficient of total excess relative risk (tereri) = total effect risk ratio − 1 = 0.822, 0.883, 0.869, 0.814, 0.909, 0.842, 0.816, and 0.807 for BMI, chronic disease, body pain, physical activity level, smoking status, health insurance status, marital status, and commu-nity participation, respectively).
Additionally, when each modifiable risk factor was fixed at the reference level (i.e., the better or healthier level), except for community participation, compared with participants with a lower education level, those with a higher education level had an increased probability of healthy aging (coefficient of excess relative risk due to the controlled direct effect [ereri_cde] = 1.107, 1.163, 1.235, 0.898, 1.152, 1.464, and 0.830, and 0.801 for BMI, chronic disease, body pain, physical activity level, smoking status, health insurance status, and marital status, respectively). While for community participation, compared with a lower
education level, those with a higher education level, coeffi-cient of ereri_cde slightly decrease = 0.801).
Even though tereri and ereri_cde were significant (P < 0.05). However, no significant mediating effect (indicate by excess relative risk due to the pure indirect effect [ereri_pie] was not significant) was observed for any modifiable risk factor on the association between education level and healthy aging.
Mediating effects of modifiable risk factors by monthly PCETable 6 shows the mediating effects of different modi-
fiable risk factors between monthly PCE and healthy aging. No significant mediating effect (indicate by ereri_pie was not significant) was observed for any modifiable risk factor on the association between monthly PCE and healthy aging.
DiscussionIn this population-based longitudinal study, we investi-
gated the association between education level, monthly PCE, and healthy aging in the older Indonesian population and attempted to clarified any modifiable risk factors that may mediate this association. We found that education level was associated with healthy aging; our finding was consistent with a previous study (White et al. 2015). By contrast, monthly PCE was not associated with healthy aging among older Indonesian individuals. No significant mediating effects for predefined modifiable risk factors were observed for education level or monthly PCE on healthy aging. To the best of our knowledge, the present study is the first study to investigate the association between education level, monthly PCE, and healthy aging, as well as any possible mediating factors, in the older Indonesian pop-ulation.
Table 3. Association between education level, monthly per-capita expenditure, and healthy aging in the Indonesia Family Life Survey (IFLS) 2007 and 2014 (n = 696).
Education level
P valuea
Monthly per-capita expenditure (USD)b
P valuea
Below lower-
secondary education
Lower-secondary education and above ≤ 43 > 43
No. of participants (n = 696) 365 331 279 417Healthy aging, n (%) 81 (22.2) 125 (37.8) 75 (26.9) 131 (31.4)Crude 1.00 (Ref.) 2.13 (1.53-2.97) < 0.01 1.00 (Ref.) 1.25 (0.89-1.74) 0.20Model 1c 1.00 (Ref.) 1.91 (1.36-2.68) < 0.01 1.00 (Ref.) 1.19 (0.85-1.68) 0.31Model 2d 1.00 (Ref.) 1.73 (1.21-2.48) < 0.01 1.00 (Ref.) 1.08 (0.75-1.55) 0.68Model 3e 1.00 (Ref.) 1.81 (1.23-2.65) < 0.01 1.00 (Ref.) 0.88 (0.60-1.30) 0.52
aLogistic regression model.bTotal monthly household expenditure divided by the number of household members. USD at 2007 exchange rates (1 USD = 9,141 Rp).cModel 1 was adjusted for age (50-54, 55-59, 60-64, 65-69, and ≥ 70 years) and sex.dModel 2 was adjusted for Model 1 plus region (Sumatra, Java-Bali, West Nusa Tenggara, South Kalimantan, or South Sulawesi) and area (urban or rural).eModel 3 was adjusted for Model 2 plus monthly PCE (≤ 43 or > 43 USD) [when exposure was education level] and educa-tion level (below lower-secondary or lower-secondary and above) [when exposure was monthly per-capita expenditure].

Education Level, Per-Capita Expenditure, and Healthy Aging 103
Our findings showed that monthly PCE was not asso-ciated with healthy aging. Previous studies among Indonesian individuals have reported that income does not have a significant effect on self-assessed health status (Chung 2004), and that Indonesians with a higher socioeco-nomic status have a higher probability of experiencing health complaints such as obesity and hypertension (Wijayanti et al. 2018; Sudharsanan 2019). The reason might be because Indonesians with a higher socioeconomic status consume more fats, salt, and processed foods and have a lower physical activity level (Allen et al. 2017). Our baseline characteristics showed that participants with a higher monthly PCE were more likely to have a higher BMI and hypertension, but less likely to have a moderate-high physical activity level.
Interestingly, although education level was positively associated with healthy aging, no significant mediating effects were identified in regard to the association between education level and healthy aging. One possible reason
may be that in the present study, except for body pain, no association was observed between predefined modifiable risk factors and healthy aging. This result is quite different from the situation in developed countries (Hamer et al. 2014; Hahn and Truman 2015; White et al. 2015; Oshio 2018; Kollia et al. 2018). Prior studies in European coun-tries have found that non-smoker and marriage were associ-ated with cognitive function (a component of healthy aging) (Mousavi-Nasab et al. 2012; Kollia et al. 2018). In addi-tion, other studies in the Netherlands and the US reported that engaging in social activities and having health insur-ance were associated with higher rates of healthy self-reported health status (also a component of healthy aging) (Hadley and Waidmann 2006; Sirven and Debrand 2008).
Regarding body pain, a previous study in Europe reported that individuals with a higher education level were less likely than those with a lower education level to report having chronic pain (Saastamoinen et al. 2005), and that body pain was significantly associated with the healthy
Table 4. Association between modifiable risk factors and healthy aging in the Indonesia Family Life Survey (IFLS) 2007 and 2014 (n = 696)a.
Modifiable risk factors No. of participants Healthy aging, n (%) Model 1b (95% CI) Model 2c (95% CI)
Body Mass Index, kg/m2
< 23.0 371 110 (29.7) 1.00 (0.71-1.39) 1.13 (0.78-1.64) ≥ 23.0 325 96 (29.5) 1.00 (Reference) 1.00 (Reference)Chronic diseases None 572 176 (30.8) 1.37 (0.87-2.16) 1.37 (0.84-2.23) Any disease 124 30 (24.2) 1.00 (Reference) 1.00 (Reference)Body pain None 388 141 (36.3) 2.16 (1.52-3.07) 2.06 (1.44-2.96) Any pain 308 65 (21.1) 1.00 (Reference) 1.00 (Reference)Physical activity Moderate-high 612 180 (29.4) 0.92 (0.56-1.53) 1.14 (0.66-1.99) Low 84 26 (31.0) 1.00 (Reference) 1.00 (Reference)Smoking status Never-former 392 105 (26.8) 0.99 (0.67-1.46) 0.96 (0.63-1.45) Current 304 101 (33.2) 1.00 (Reference) 1.00 (Reference)Health insurance Yes 247 79 (32.0) 1.21 (0.86-1.71) 1.09 (0.75-1.58) No 449 127 (28.3) 1.00 (Reference) 1.00 (Reference)Marital status Married 593 181 (30.5) 0.89 (0.52-1.51) 0.93 (0.54-1.62) Others 103 25 (24.3) 1.00 (Reference) 1.00 (Reference)Community participation Any participated 610 181 (29.7) 0.95 (0.57-1.59) 0.92 (0.54-1.62) None 86 25 (29.1) 1.00 (Reference) 1.00 (Reference)
aLogistic regression model.bModel 1 was adjusted for age (50-54, 55-59, 60-64, 65-69, and ≥ 70 years) and sex.cModel 2 was adjusted for Model 1 plus region (Sumatra, Java-Bali, West Nusa Tenggara, South Kalimantan, or South Sulawesi), area (rural or urban), Body Mass Index (< 23.0 or ≥ 23.0 kg.m2), chronic disease (yes or no), body pain (yes or no), physical activity level (low or moderate-high), smoking status (current or former/never), community participation (any or none), health insurance (yes or no), marital status (married or other), educational level (below lower-secondary education or lower-secondary education and above), and monthly PCE (≤ 43 or > 43 USD).

D. Nurrika et al.104
Table 5. Mediation analyses of the association between education level (education level: below-lower secondary [reference] vs. lower-secondary and above) and healthy aging in the Indonesia Family Life Survey (IFLS) 2007 and 2014 (n = 696)a.
Modifiable risk factors Effectb Coefficient P value 95% Confidence interval
Body Mass Index, kg/m2
≥ 23.00 vs. < 23.00 (Ref.) tereri 0.822 0.022 0.118 1.525ereri_cde 1.107 0.031 0.099 2.114ereri_intref –0.178 0.362 –0.561 0.205ereri_intmed –0.099 0.369 –0.315 0.117ereri_pie –0.008 0.889 –0.116 0.100
Chronic diseaseYes vs. None (Ref.) tereri 0.883 0.018 0.149 1.617
ereri_cde 1.163 0.008 0.306 2.020ereri_intref –0.187 0.023 –0.349 –0.026ereri_intmed –0.115 0.088 –0.248 0.017ereri_pie 0.022 0.543 –0.049 0.094
Body painYes vs. None (Ref.) tereri 0.869 0.024 0.116 1.623
ereri_cde 1.235 0.032 0.104 2.365ereri_intref –0.363 0.142 –0.846 0.121ereri_intmed –0.002 0.965 –0.072 0.068ereri_pie –0.001 0.965 –0.053 0.051
Physical activitiesLow vs. Moderate-high (Ref.) tereri 0.814 0.023 0.115 1.512
ereri_cde 0.898 0.018 0.156 1.640ereri_intref –0.041 0.381 –0.132 0.051ereri_intmed –0.079 0.384 –0.257 0.099ereri_pie 0.036 0.643 –0.116 0.188
Smoking statusCurrent vs. Non-current (Ref.) tereri 0.909 0.018 0.153 1.665
ereri_cde 1.152 0.013 0.248 2.056ereri_intref –0.261 0.195 –0.656 0.134ereri_intmed 0.055 0.300 –0.049 0.158ereri_pie –0.036 0.276 –0.100 0.029
Health insuranceNo vs. Yes (Ref.) tereri 0.842 0.021 0.125 1.559
ereri_cde 1.464 0.007 0.409 2.518ereri_intref –0.774 0.054 –1.561 0.014ereri_intmed 0.246 0.066 –0.016 0.508ereri_pie –0.095 0.131 –0.217 0.028
Marital statusNo vs. Yes (Ref.) tereri 0.816 0.022 0.116 1.516
ereri_cde 0.830 0.025 0.104 1.556ereri_intref –0.014 0.876 –0.184 0.156ereri_intmed 0.001 0.887 –0.013 0.015ereri_pie –0.002 0.786 –0.013 0.010
Community participationNone vs. Any (Ref.) tereri 0.807 0.023 0.112 1.503
ereri_cde 0.801 0.027 0.093 1.508ereri_intref 0.009 0.927 –0.184 0.202ereri_intmed –0.001 0.929 –0.020 0.018ereri_pie –0.001 0.821 –0.012 0.009
tereri, total excess relative risk; ereri_cde, excess relative risk due to controlled direct effect; ereri_intref, excess relative risk due to reference interaction; ereri_intmed, excess relative risk due to mediated interaction; ereri_pie, excess relative risk due to pure indirect effect.aLogistic regression model.bAdjusted for age (50-54, 55-59, 60-64, 65-69, and ≥ 70 years), sex, region (Sumatra, Java-Bali, West Nusa Teng-gara, South Kalimantan, or South Sulawesi), area (urban or rural), and monthly PCE (≤ 43 or > 43 USD).

Education Level, Per-Capita Expenditure, and Healthy Aging 105
Table 6. Mediation analyses of the association between monthly per-capita expenditure (≤ 43 USD [reference] vs. > 43 USD] and healthy aging in the Indonesia Family Life Survey (IFLS) 2007 and 2014 (n = 696)a.
Modifiable risk factors Effectb Coefficient P value 95% Confidence interval
Body Mass Index, kg/m2
≥ 23.00 vs. < 23.00 (Ref.) tereri –0.132 0.450 –0.474 0.210ereri_cde –0.245 0.310 –0.718 0.228ereri_intref 0.120 0.369 –0.142 0.381ereri_intmed 0.033 0.395 –0.043 0.110ereri_pie –0.040 0.241 –0.107 0.027
Chronic diseasesYes vs. None (Ref.) tereri –0.102 0.567 –0.452 0.248
ereri_cde –0.016 0.940 –0.424 0.392ereri_intref –0.062 0.331 –0.188 0.063ereri_intmed –0.026 0.391 –0.085 0.033ereri_pie 0.002 0.947 –0.046 0.049
Body painYes vs. None (Ref.) tereri –0.171 0.327 –0.513 0.171
ereri_cde –0.380 0.144 –0.890 0.130ereri_intref 0.223 0.073 –0.021 0.467ereri_intmed 0.017 0.480 –0.030 0.064ereri_pie –0.031 0.450 –0.112 0.050
Physical activitiesLow vs. Moderate-high (Ref.) tereri –0.129 0.463 –0.473 0.215
ereri_cde –0.037 0.842 –0.399 0.326ereri_intref –0.076 0.267 –0.211 0.058ereri_intmed –0.082 0.295 –0.235 0.071ereri_pie 0.066 0.379 –0.081 0.213
Smoking statusCurrent vs. Non-current (Ref.) tereri –0.063 0.742 –0.440 0.314
ereri_cde 0.182 0.474 –0.316 0.679ereri_intref –0.255 0.083 –0.542 0.033ereri_intmed 0.052 0.228 –0.032 0.136ereri_pie –0.042 0.249 –0.114 0.029
Health insuranceNo vs. Yes (Ref.) tereri –0.100 0.581 –0.456 0.256
ereri_cde 0.394 0.225 –0.242 1.029ereri_intref –0.502 0.036 –0.972 –0.033ereri_intmed 0.021 0.521 –0.043 0.086ereri_pie –0.012 0.533 –0.051 0.027
Marital statusNo vs. Yes (Ref.) tereri –0.116 0.508 –0.461 0.228
ereri_cde –0.102 0.584 –0.467 0.263ereri_intref –0.015 0.795 –0.124 0.095ereri_intmed –0.001 0.893 –0.008 0.007ereri_pie 0.001 0.882 –0.009 0.011
Community participationNone vs. Any (Ref.) tereri –0.115 0.516 –0.461 0.231
ereri_cde –0.188 0.295 –0.541 0.164ereri_intref 0.094 0.246 –0.065 0.252ereri_intmed –0.033 0.321 –0.100 0.033ereri_pie 0.013 0.493 –0.025 0.052
tereri, total excess relative risk; ereri_cde, excess relative risk due to controlled direct effect; ereri_intref, excess relative risk due to reference interaction; ereri_intmed, excess relative risk due to mediated interaction; ereri_pie, excess relative risk due to pure indirect effect.aLogistic regression model.bAdjusted for age (50-54, 55-59, 60-64, 65-69, and ≥ 70 years), sex, region (Sumatra, Java-Bali, West Nusa Teng-gara, South Kalimantan, or South Sulawesi), area (urban or rural), and education level (below lower-secondary or lower-secondary and above).

D. Nurrika et al.106
aging index score (Wilkie et al. 2013). By contrast, among Indonesian individuals, although body pain was inversely associated with healthy aging, the prevalence of pain was similar between different education levels.
The present study also found that participants with a higher education level tended to have a higher BMI, were more likely to have a chronic disease, and were less likely to have a moderate-high physical activity level. By con-trast, previous studies in developed countries have found that individuals with a higher education level tended to have a lower BMI (Roskam and Kunst 2008; Hermann et al. 2011) were less likely to have a chronic disease (Mielck et al. 2012), and were more likely to engage in regular vig-orous activity (Shaw and Spokane 2008). In addition, nor-mal BMI was associated with healthy life expectancy (Stenholm et al. 2017), while participation in moderate or vigorous physical activity was associated with healthy aging (Hamer et al. 2014), and not having a chronic disease was associated with a better quality of life (Barile et al. 2013; Wijers et al. 2019).
Taking all the above into consideration, the different distributions of mediating factors between exposure groups and the lack of an observed association between mediating factors and healthy aging may be the main reason that fac-tors that have been recognized as mediators in developed countries failed to be identified as mediators in Indonesia. There was difference in modifiable risk factors on the asso-ciation between education level, monthly PCE, and healthy aging in developed countries and such developing coun-tries. It is suggested that the results obtained in developed countries may not be applicable to Indonesia as developing countries.
The strengths of the present study are as follows. First, this was the first known longitudinal study to investi-gate the role of modifiable risk factors in the association between education level, monthly PCE, and healthy aging among the older adult Indonesian population. Second, as national survey data were used, the findings can be consid-ered highly representative.
However, this study also had several limitations. First, the information in regard to modifiable risk factors might have changed between the IFLS 4 and the IFLS 5. Second, some unmeasured mediators (e.g., working conditions, retirement benefits, health knowledge, and social support) may not have been considered. Third, in view of the possi-ble bias caused by excluding individuals with missing data for modifiable risk factors, 4,094 participants, including those for whom such data were missing, were analyzed, but the association between education level, monthly PCE, and healthy aging did not change substantially. Therefore, the association between education level, monthly PCE, and healthy aging is unlikely to be the result of selection bias.
In conclusion, education level was significantly associ-ated with healthy aging among the older adult Indonesian population, whereas monthly PCE was not. However, no mediating effects were observed for the predefined modifi-
able risk factors for education level and monthly PCE on healthy aging. Additional studies are needed to identify other important potential mediators for healthy aging in Indonesia. The present results also suggest that priorities in making health policy would be different between developed countries and developing countries.
AcknowledgmentsThis work was supported by Tohoku University
Graduate School of Medicine. The funder played no role in the design, methods, subject recruitment, data collections, analysis and preparation of paper. We would also like to thank RAND Corporation for making the data publicly available. We are also grateful to Yoshiko Nakata and Yuko Miyoshi for technical assistance.
Authors ContributionsD.N. and S.Z designed the research; D.N., S.Z. and
A.D. analyzed the data; D.N. wrote the paper; S.Z., A.D., Y.T., Y.L., Y.S. and I.T. gave constructive suggestions; D.N. had primary responsibility for the final content. All authors read and approved the final manuscript.
Conflict of InterestThe authors declare no conflict of interest.
ReferencesAdioetomo, S.M. & Mujahid, G. (2014) Monograph series No. 1:
Indonesia on the threshold of population ageing. https://indonesia.unfpa.org/en/publications/monograph-series-
no-1-indonesia-threshold-population-ageing [Accessed: April 18, 2019].Allen, L., Williams, J., Townsend, N., Mikkelsen, B., Roberts, N.,
Foster, C. & Wickramasinghe, K. (2017) Socioeconomic status and non-communicable disease behavioural risk factors in low-income and lower-middle-income countries: a system-atic review. Lancet Global Health, 5, e277-e289.
Barile, J.P., Thompson, W.W., Zack, M.M., Krahn, G.L., Horner-Johnson, W. & Bowen, S.E. (2013) Multiple chronic medical conditions and health-related quality of life in older adults, 2004-2006. Prev. Chronic Dis., 10, E162-E173.
Cao, J. & Rammohan, A. (2016) Social capital and healthy ageing in Indonesia. BMC Public Health, 16, 631-644.
Central Bureau of Statistics (2017) Elderly Population Statistics 2016.
https://www.bps.go.id/publication/2017/11/17/107752aa20f3f8cb08d9dabe/statistik-penduduk-lanjut-usia-2016.html
[Accessed: March 18, 2019] (in Indonesian).Central Bureau of Statistics (2018) Elderly Population Statistics
2018. https://www.bps.go.id/publication/2018/12/21/eadbab
6507c06294b74adf71/statistik-penduduk-lanjut-usia-2018.html
[Accessed: May 14, 2019] (in Indonesian).Chung, W. (2004) Income Inequality and Health: Evidence from
Indonesia. https://webarchive.nla.gov.au/tep/102621 [Accessed: March 1, 2018].Discacciati, A., Bellavia, A., Lee, J.J., Mazumdar, M. & Valeri, L.
(2018) Med4way: a Stata command to investigate mediating and interactive mechanisms using the four-way effect decom-position. Int. J. Epidemiol., 48, 15-20.

Education Level, Per-Capita Expenditure, and Healthy Aging 107
Frankenberg, E., Karoly, L.A., Gertler, P., Achmad, S., Agung, I.G.N., Hatmadji, S.H. & Sudharto, P. (1995) The 1993 Indo-nesian Family Life Survey: Overview and Field Report.
https://www.rand.org/pubs/drafts/DRU1195z1.html [Accessed: November 1, 2018].Hadley, J. & Waidmann, T. (2006) Health insurance and health at
age 65: implications for medical care spending on new Medi-care beneficiaries. Health Serv. Res., 41, 429-451.
Hahn, R.A. & Truman, B.I. (2015) Education improves public health and promotes health equity. Int. J. Health Serv., 45, 657-678.
Hamer, M., Lavoie, K.L. & Bacon, S.L. (2014) Taking up physical activity in later life and healthy ageing: the English longitu-dinal study of ageing. Br. J. Sports Med., 48, 239-243.
Hermann, S., Rohrmann, S., Linseisen, J., May, A.M., Kunst, A., Besson, H., Romaguera, D., Travier, N., Tormo, M.J., Molina, E., Dorronsoro, M., Barricarte, A., Rodriguez, L., Crowe, F.L., Khaw, K.T., et al. (2011) The association of education with body mass index and waist circumference in the EPIC-PANACEA study. BMC Public Health, 11, 169-181.
IPAQ Research Committee (2005) Guidelines for Data Processing and Analysis of the International Physical Activity Question-naire (IPAQ) – Short and Long Forms.
http://www.ipaq.ki.se [Accessed: May 29, 2018].Kaneda, T. & Zimmer, Z. (2007) Education, gender, and func-
tional transitions among Indonesian elderly. J. Cross Cult. Gerontol., 22, 303-322.
Kollia, N., Caballero, F.F., Sanchez-Niubo, A., Tyrovolas, S., Ayuso-Mateos, J.L., Haro, J.M., Chatterji, S. & Panagiotakos, D.B. (2018) Social determinants, health status and 10-year mortality among 10,906 older adults from the English longitu-dinal study of aging: the ATHLOS project. BMC Public Health, 18, 1357-1366.
Maharani, A. & Tampubolon, G. (2016) National economic devel-opment status may affect the association between central adiposity and cognition in older adults. PLoS One, 11, e0148406.
Mboi, N., Surbakti, I.M., Trihandini, I., Elyazar, I., Smith, K.H., Ali, P.B., Kosen, S., Flemons, K., Ray, S.E., Cao, J., Glenn, S.D., Miller-Petrie, M.K., Mooney, M.D., Ried, J.L., Ningrum, D.N.A., et al. (2018) On the road to universal health care in Indonesia, 1990-2016: a systematic analysis for the Global Burden of Disease Study 2016. Lancet, 392, 581-591.
Mielck, A., Reitmeir, P., Vogelmann, M. & Leidl, R. (2012) Impact of educational level on health-related quality of life (HRQL): results from Germany based on the EuroQol 5D (EQ-5D). Eur. J. Public Health, 23, 45-49.
Mousavi-Nasab, S.M., Kormi-Nouri, R., Sundstrom, A. & Nilsson, L.G. (2012) The effects of marital status on episodic and semantic memory in healthy middle-aged and old individuals. Scand. J. Psychol., 53, 1-8.
OECD (2019) Exchange rates (indicator). https://data.oecd.org/conversion/exchange-rates.htm [Accessed: April 12, 2019].Oshio, T. (2018) Widening disparities in health between educa-
tional levels and their determinants in later life: evidence from a nine-year cohort study. BMC Public Health, 18, 278-288.
Roskam, A.J. & Kunst, A.E. (2008) The predictive value of different socio-economic indicators for overweight in nine European countries. Public Health Nutr., 11, 1256-1266.
Saastamoinen, P., Leino-Arjas, P., Laaksonen, M. & Lahelma, E. (2005) Socio-economic differences in the prevalence of acute, chronic and disabling chronic pain among ageing employees. Pain, 114, 364-371.
Shaw, B.A. & Spokane, L.S. (2008) Examining the association between education level and physical activity changes during early old age. J. Aging Health, 20, 767-787.
Sirven, N. & Debrand, T. (2008) Social participation and healthy
ageing: an international comparison using SHARE data. Soc. Sci. Med., 67, 2017-2026.
Stenholm, S., Head, J., Aalto, V., Kivimaki, M., Kawachi, I., Zins, M., Goldberg, M., Platts, L.G., Zaninotto, P., Magnusson Hanson, L.L., Westerlund, H. & Vahtera, J. (2017) Body mass index as a predictor of healthy and disease-free life expectancy between ages 50 and 75: a multicohort study. Int. J. Obes. (Lond.), 41, 769-775.
Strauss, J., Witoelar, F. & Sikoki, B. (2016) The Fifth Wave of the Indonesia Family Life Survey (IFLS 5): Overview and Field Report.
https://www.rand.org/pubs/working_papers/WR1143z1.html [Accessed: November 1, 2018].Strauss, J., Witoelar, F., Sikoki, B. & Wattie, A.M. (2009) The
Fourth Wave of the Indonesia Family Life Survey (IFLS 4): Overview and Field Report.
https://microdata.worldbank.org/index.php/catalog/1044/download/20909
[Accessed: November 1, 2018].Sudharsanan, N. (2019) The association between socioeconomic
status and adult mortality in a developing country: evidence from a nationally representative longitudinal survey of Indo-nesian adults. J. Gerontol. B. Psychol. Sci. Soc. Sci., 74, 484-495.
Suratno, T. (2014) The education system in Indonesia at a time of significant changes.
http://ries.revues.org/3814 [Accessed: April 15, 2019].Takayama, Y. (2010) A delayed recall battery as a sensitive
screening for mild cognitive impairment follow-up study of memory clinic patients after 10 year. J. Med. Dent. Sci., 57, 177-184.
UNESCO Institute for Statistics (2012) International Standard Classification of Education ISCED 2011.
http://uis.unesco.org/sites/default/files/documents/interna tional-standard-classification-of-education-isced-2011-en.pdf
[Accessed: October 1, 2018].UNESCO International Bureau of Education (2011) Indonesia:
World Data on Education. http://www.ibe.unesco.org/fileadmin/user_upload/Publica
tions/WDE/2010/pdf-versions/Indonesia.pdf [Accessed: April 12, 2019].VanderWeele, T.J. (2014) A unification of mediation and interac-
tion: a 4-way decomposition. Epidemiology, 25, 749-761.White, C.M., St John, P.D., Cheverie, M.R., Iraniparast, M. &
Tyas, S.L. (2015) The role of income and occupation in the association of education with healthy aging: results from a population-based, prospective cohort study. BMC Public Health, 15, 1181-1192.
Wijayanti, W., Pratomo, D.S. & Khusaini, M. (2018) The effects of socio-economic factors on health of elderly in East Java. Scientific Annals of Economics and Business, 65, 205-213.
Wijers, I.G.M., Ayala, A., Rodriguez-Blazquez, C., Rodriguez-Laso, A., Rodriguez-García, P., Prados-Torres, A., Rodriguez-Rodriguez, V. & Forjaz, M.J. (2019) The disease burden morbidity assessment in older adults and its association with mortality and other health outcomes. Eur. J. Ageing, 16, 193-203.
Wilkie, R., Tajar, A. & McBeth, J. (2013) The onset of widespread musculoskeletal pain is associated with a decrease in healthy ageing in older people: a population-based prospective study. PLoS One, 8, e59858.
Witoelar, F. (2009) Note on the Construction of the IFLS Consumption Expenditure Aggregates.
https://dokumen.tips/documents/ifls-consumption-expendi ture-aggregatespdf.html
[Accessed: June 18, 2018].World Health Organization (2004) Appropriate body-mass index
for Asian populations and its implications for policy and inter-

D. Nurrika et al.108
vention strategies. The Lancet, 363, 157-163.World Health Organization (2017) State of health inequality: Indo-
nesia. http://www.who.int/iris/handle/10665/259685 [Accessed: December 21, 2017].World Health Organization; World Bank (2014) Monitoring prog-
ress towards universal health coverage at country and global levels: Framework, measures and targets.
https://www.who.int/healthinfo/universal_health_coverage/report/2014/en/
[Accessed: March 6, 2019].