eds with microcalorimeters - ltd10ltd-10.ge.infn.it/trasparencies/f/f02_hollerith.pdf · eds with...
TRANSCRIPT

EDS with Microcalorimeters
Usage of Microcalorimeters on ScanningElectron Microscopes (SEM) for
determination of elemental constitution of samples
C. Hollerith1, M. Bühler³, F. v. Feilitzsch1,T.Hertrich³, J. Höhne³, M. Huber1,J. Jochum1, K. Phelan3, B. Simmnacher², R. Weiland², D. Wernicke1,3, 1:Physik-Department E15, TU München, James-Franck-Straße, 85747 Garching2: Infineon Technologies AG, Otto-Hahn-Ring 6, 81739 München3: VeriCold Technologies GmbH, Bahnhofstr. 21, 85757 Ismaning

What´s EDS ?
• Measurement of Energy of characteristic X-rayradiation excited by an electron beam in a Scanning Electron Microscope (SEM) givesinformation on elemental constitution of samplein SEM
• In the SEM an Image and an EDS spectrum canbe measured at the same time
⇒ Elemental analysis of small structures

David Joy, Monte Carlo Modeling for Electron Microscopy and Microanalysis, Oxford University Press, 1995
Electron beam
Surface
X-Ray Excitation Volumes with 2 keV and 5 keV Electron Energies
Excitation region of X-raysExcitation point of secondaryelectrons that are measuredfor SEM-Image (Information of few nm beneath surface)

Separation of X-ray lines at low energies requiresdifferent analysis method or different detector technology
⇒⇒⇒⇒Low temperature detectors
Motivation
3 keV10 keV
?
Si(Li)-detector: spectrum of TiN @ Vacc= 3keV⇒⇒⇒⇒ Overlap of X-ray lines at low energies
geometrical dimensions andX-ray emitting volume
Vacc= 3keV

2-stage pulse tube70K heat exchanger4K heat exchanger
ADR coolersalt pillmagnet
heat shields at 70 and 4K
thermal transfer rod
experimental space
snout with thermalshields , transfer rod,
, detector andx-ray windows
high pressure inlet
Setup of Spectrometer
Vibration performance
• Insert picture

SQUID
Rdetector
RS
L
IO∆∆∆∆ R
∆∆∆∆T
Detector Setup
Au - absorber (250µm x 250µm x 0.5µm) Ir/Au - thermometer (400µm x 400µm)
SiN-membrane
collimator(200µm x 200µm)
X-ray
Transition Curve of Ir/Aufilm
Detector responseafter absorption of X-Ray

ResolutionParameter: energy resolution @ Al-Kαααα (1,5 keV)Target Specification: 15 eVResult: typical: around 10eV, best result: 6.4 eV
6.4 eV
Energy resolution @ Al-Kαααα (1.5 keV)
FWHM / eV
0
10
20
30
40
0 1000 2000 3000 4000 5000energy / eV
FWH
M /
eV
CKαααα
TiKββββ
TiKαααα
ClKαααα
SiKααααAlKαααα
NaKαααα
OKαααα
Energy resolution vs Energy
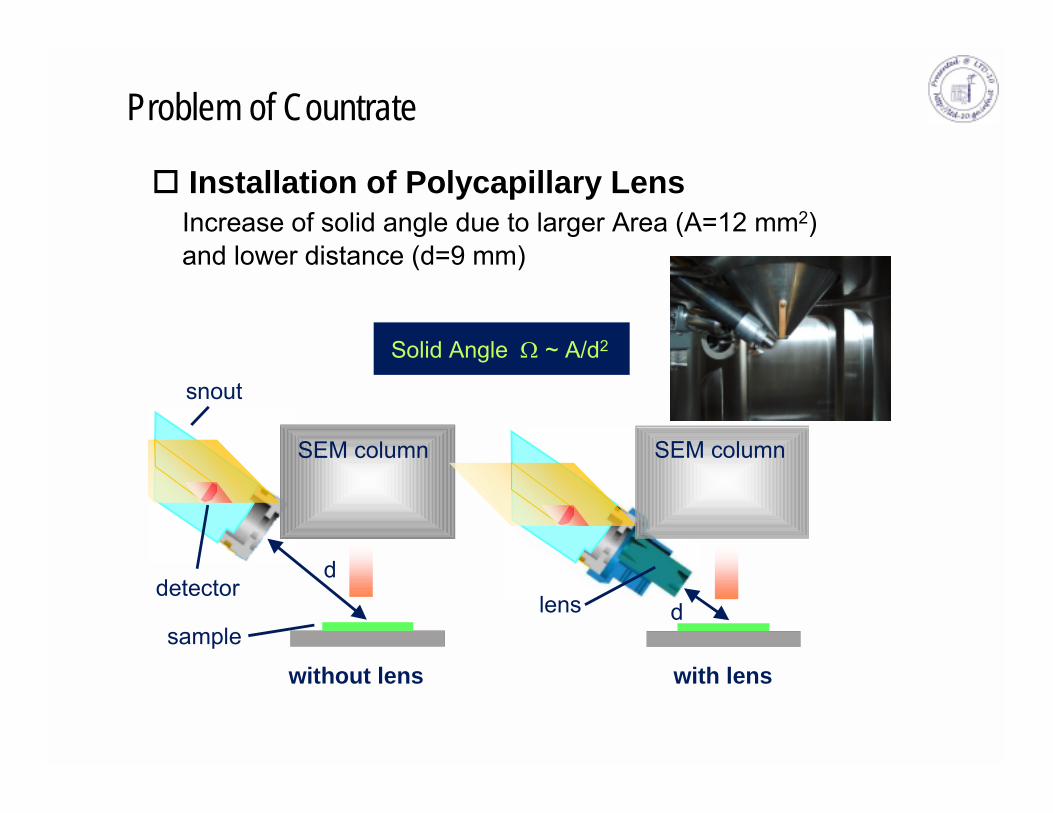
Solid Angle Ω ~ A/d2
dlens
SEM columnSEM column
ddetector
sample
without lens with lens
snout
Problem of Countrate
! Installation of Polycapillary LensIncrease of solid angle due to larger Area (A=12 mm2)and lower distance (d=9 mm)

Countrate
• small detectoraperture size: 200 µm
• large detector(factor 3 @ 5kV)aperture size: 600 µm
• small detector with X-ray lens(factor 120 @ 5kV),aperture size: 20 µm,converted to 120 µm byprobe current ratio
491
12
4
Count rate of detector vs. acceleration voltage for differentconcepts of count rate increase, sample: bulk silicon
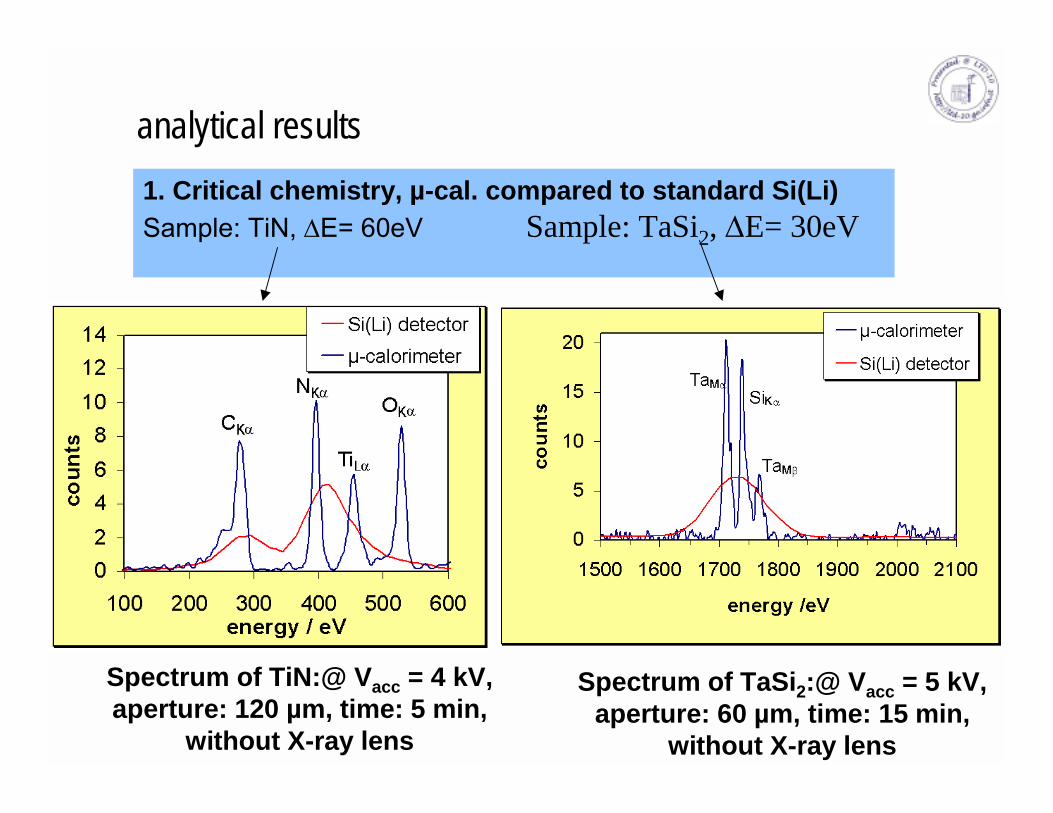
analytical results1. Critical chemistry, µ-cal. compared to standard Si(Li)Sample: TiN, ∆E= 60eV Sample: TaSi2, ∆E= 30eV
Spectrum of TaSi2:@ Vacc = 5 kV, aperture: 60 µm, time: 15 min,
without X-ray lens
Spectrum of TiN:@ Vacc = 4 kV, aperture: 120 µm, time: 5 min,
without X-ray lens

analytical resultsAnalysis of light elementsSample: BPSG oxide (boron phosphorous silicon glass); conc.(B) = 3%
Spectrum of BPSG: @ Vacc = 5 kV, aperture: 120 µm,time: 8 min, with X-ray lens

analytical results! example: Phosphor-doped Si, ND=4 x 1019 cm-3
"<1‰ with NSi = 5 x 1022 cm-3
Spectrum von n-Si @ Vacc = 5 kV, aperture: 30 µm,Measurement time: 6h, with X-ray Lens
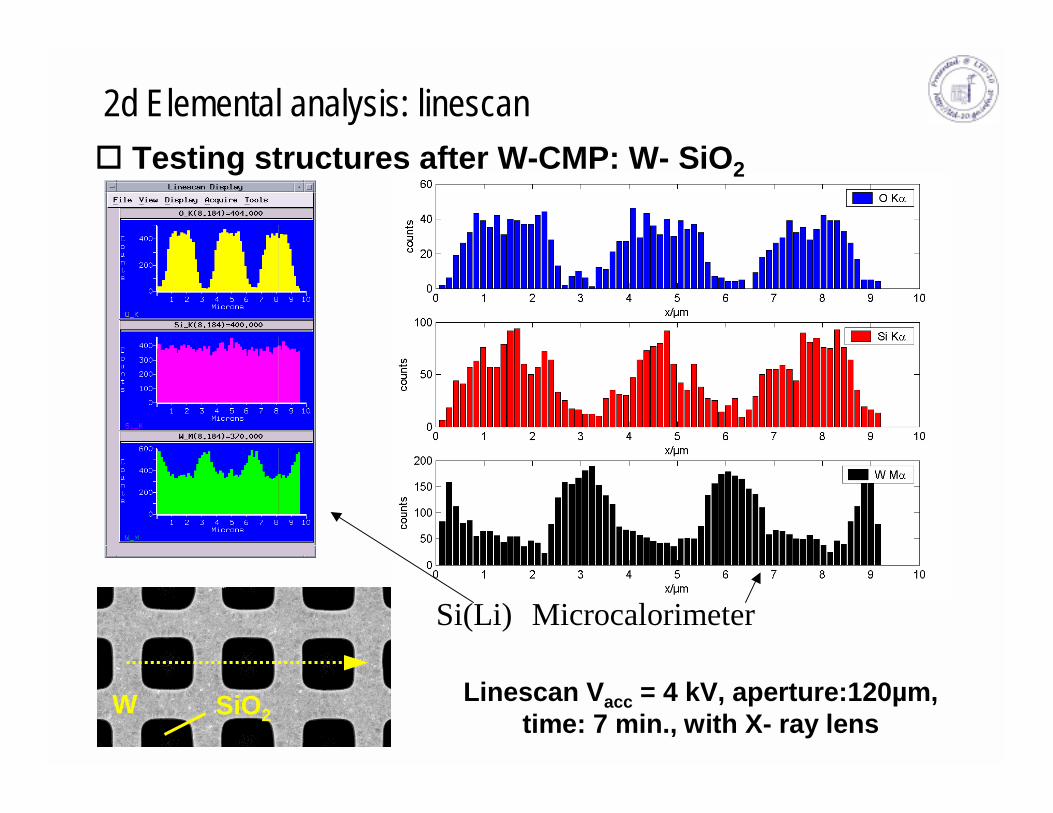
2d Elemental analysis: linescan
W SiO2Linescan Vacc = 4 kV, aperture:120µm,
time: 7 min., with X- ray lens
! Testing structures after W-CMP: W- SiO2
Si(Li) Microcalorimeter

• Microcalorimeter showssuperior performancecompared to Si(Li) detectors
• Microcalorimeter basedspectrometercommercially available
Conclusions
•Related Posters:• F06: Development of Ir/Au Transition Edge Sensors for high Resolution X-
Ray Spectroscopy in Material Science by Doreen Wernicke
• F07: STJ Detector for Material Analysis: Implementation and First Results by Michael Huber
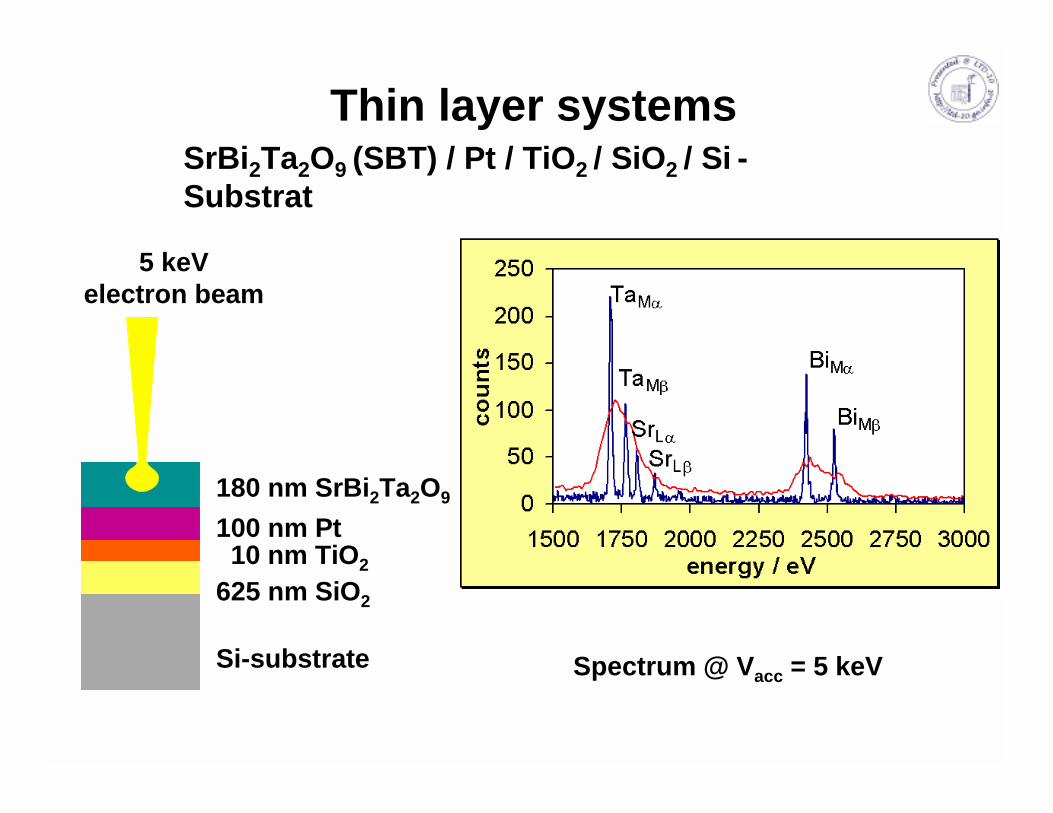
Thin layer systemsSrBi2Ta2O9 (SBT) / Pt / TiO2 / SiO2 / Si -Substrat
5 keVelectron beam
Si-substrate
625 nm SiO2
10 nm TiO2
100 nm Pt180 nm SrBi2Ta2O9
Spectrum @ Vacc = 5 keV

10keVelectron beam
SrBi2Ta2O9 (SBT) / Pt / TiO2 / SiO2 / Si -SubstratThin layer systems
Si-substrate
625 nm SiO2
10 nm TiO2
100 nm Pt180 nm SrBi2Ta2O9
Spectrum @ Vacc = 10 keV

Linescan: 2d Elementanalyse! Flipchip bumping: Cu / SnAg
Si
Cu3SnCu6Sn5
Ag3Sn
Cu
Vacc = 7 kV, 60 µm ,16 min., mit X- ray Linse
Vacc = 7 kV, 60 µm ,7 min., mit X- ray Linse
Ag
SnAg

analytical results3. Analysis of samples with small volumeSample: TiN surface w/o oxygen film
Microcalorimeter @ Vacc = 4 kV,time: 40 min, without X-ray lens
Si(Li)-detector @ Vacc = 4 kV,
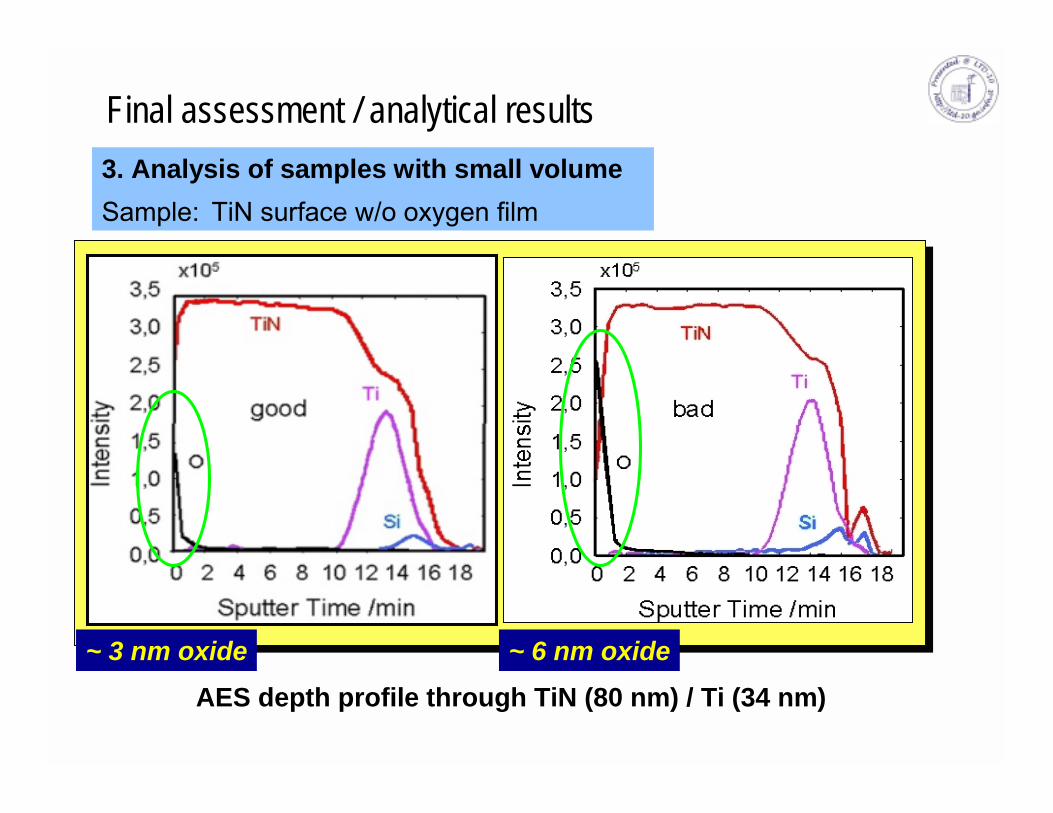
Final assessment / analytical results3. Analysis of samples with small volumeSample: TiN surface w/o oxygen film
AES depth profile through TiN (80 nm) / Ti (34 nm)~ 6 nm oxide~ 3 nm oxide

Problem: low countrate
!Detector area ~ 200µm·200µm (Si(Li) ~ 3mm ·3mm)⇒low countrate: 0,2cps (Vacc = 5kV, Ipr = 100pA)⇒long measurement time⇒high electron beam induced damage
⇒ different Types of analysis impossible:- Linescans- Elemental Mappings- Measurement of low concentrations
• Possible Solutions:– Large area detectors
⇒ 600µm x 600µm Design tested• Transition wide⇒Resolution quite bad
– Use of polycapillary X-ray optics

Particle analysis
reference particle
Vacc= 5 keV100 nm
Ti or TiN?Ti or TiN?unknown particle below tungsten layer
CKαααα TiLααααNKαααα
OKααααTiLI
CKαααα TiLααααNKαααα
OKαααα
TiLI

Clean room

Energy calibration / heat pulses
Detector resistance not exactlylinear in temperature"Problems for analysis of pulsheights
•Energy nonlinearity in pulsheights •Pulsheight depends on detector temperature

Possible Solutions:•Take calibration spectrum before measurements•Use artificial pulses to determine detector response
"current pulses heat up the detector
Example of current pulse Detector circuit
Energy calibration / heat pulses

Calibration of whole energy area is possible with 5 different kinds of heat pulses simulating O-Kα, Na-Kα, Si-Kα, Cl-Kα, Ti-Kα
Red points: heatpulsesBlue points: real pulsesO Na Si Cl Ti
Heat pulses show:•same pulsheight as real pulses•same temperature dependence as real pulses
Energy calibration / heat pulses
BUT: Reproducibility of calibration at only 10eV⇒Heatpulses have to be faster and more intensive
( )2
2
2
2
11
+
⋅−
+
+⋅=
Shunt
SL
BiasSL
Shunt
NL
BiasHeizNL
RR
IR
RR
IIRP
assumption: IHeat >Icritical
spots
ref.
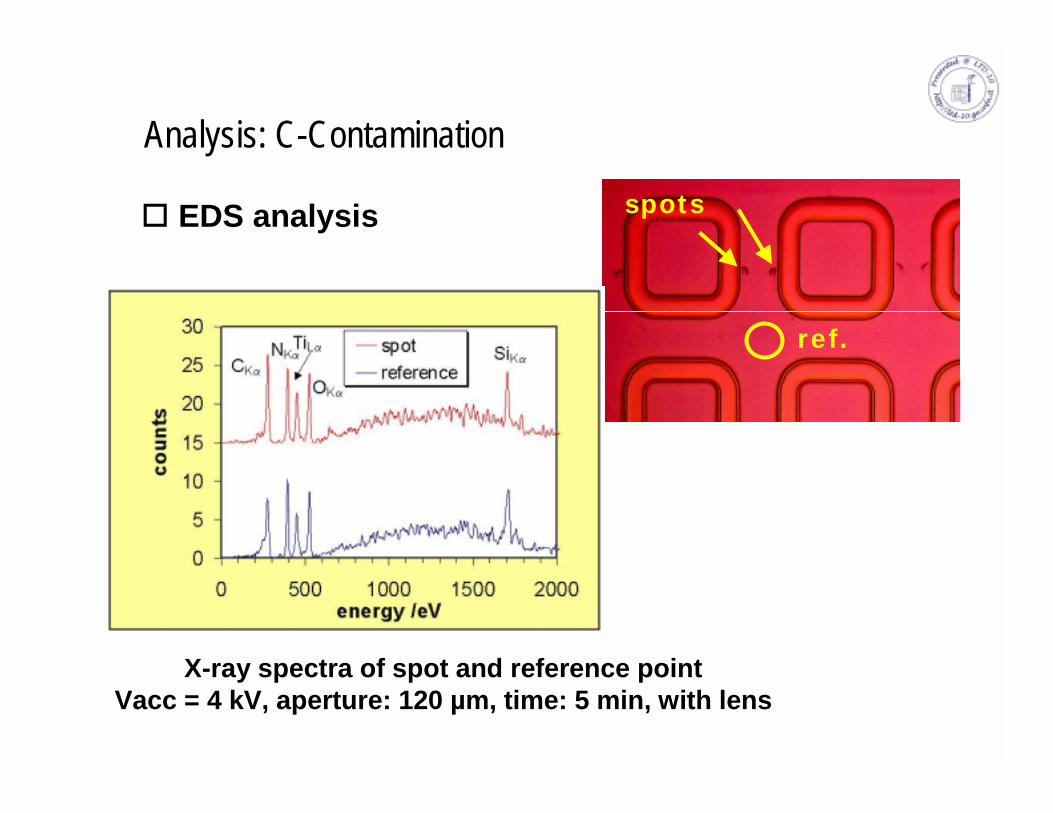
Analysis: C-Contamination
X-ray spectra of spot and reference pointVacc = 4 kV, aperture: 120 µm, time: 5 min, with lens
! EDS analysis
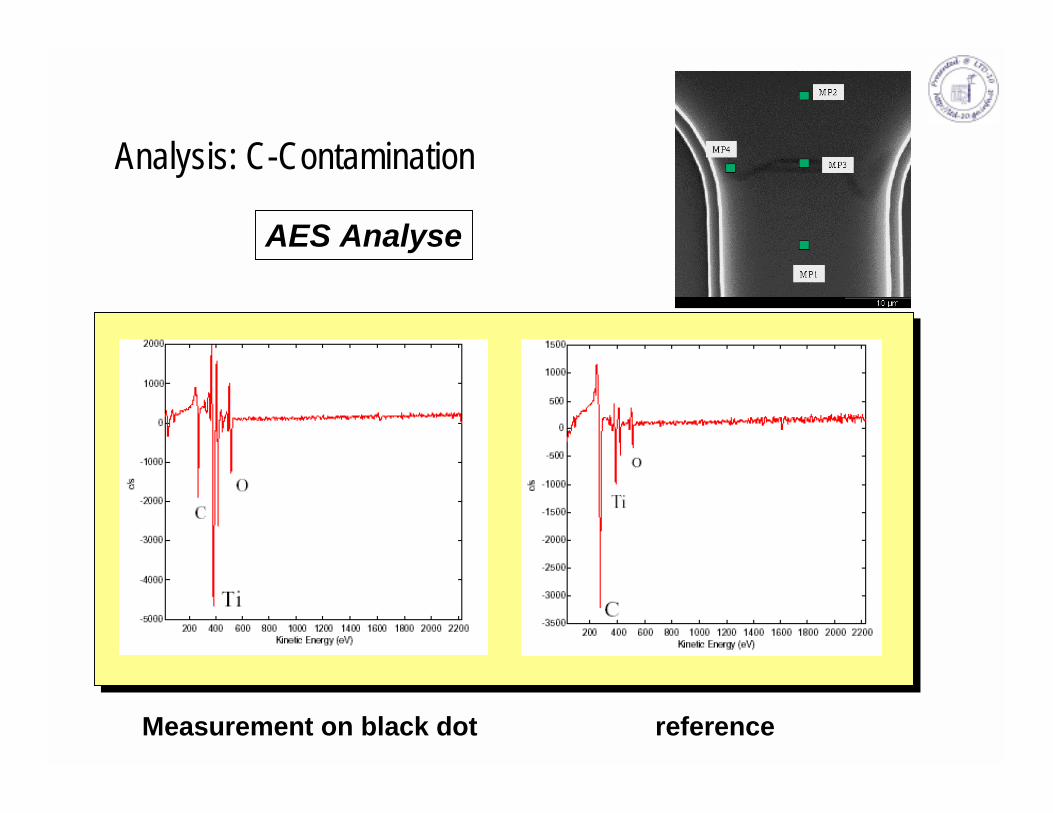
Analysis: C-Contamination
Measurement on black dot reference
AES Analyse