edmonton socio-economic outlook 2009-2014 - city of edmonton :: home
TRANSCRIPT
EdmontonSocio-Economic
Outlook 2009-2014
Prepared by: Nichols Applied Management, Management and Economic Consultants, For: City of Edmonton
.
.
.
.
.
.
.
.
.
.
.
.
.
.
.


TABLE OF CONTENTS PAGE
TABLE OF CONTENTS I
PAGE I
1. INTRODUCTION 1
2. ECONOMIC SITUATION AND TRENDS 2
2.1 The Global Context 2
2.2 The Provincial Context 5 2.2.1 Current Spending 5 2.2.2 Investment 7 2.2.3 Energy Prices 9
2.3 The Economy of The Edmonton Region 11
2.4 Implications 15
3. SOCIAL SITUATION AND TRENDS 20
3.1 Global Trends 20 3.1.1 Aging Population 20 3.1.2 The Environment 21 3.1.3 Changing Face of Work 21
3.2 Edmonton‐Specific Trends 24 3.2.1 Population and Migration 24 3.2.2 Social Aspects of Growth 25 3.2.3 Safety 27 3.2.4 Health and Recreation 28
3.3 Implications 29 Appendix A: Monthly Indicators Table. Appendix B: Most Likely Scenario, Forecasted Values, Selected Indicators.
1. INTRODUCTION
Background
The Edmonton Socio-Economic Outlook provides an overview of the social and economic forces
that are likely to affect Edmonton and the Capital region between 2009 and 2014. It also
interprets what the social and economic developments mean for the people of the region and the
City of Edmonton as a municipal corporation.
This document is an input into planning and budget initiatives of the City of Edmonton. In
addition, public sector agencies, private businesses and individuals use it as an input for their
longer-term planning.
The Context
The current economic recession has made it clear that the Alberta and Edmonton economies are
inextricably linked to global economic and financial systems. What will happen over the next five
years will depend largely on how and when the global economy recovers. This 2009 edition of
the Edmonton Socio-Economic Outlook will try to clarify these linkages and explore their
implications.
Similarly, many of the social trends affecting Edmonton mirror those in many developed nations.
This Outlook will draw out these linkages and explore the implications. It will also explore the
linkages between the recession and its aftermath and selected social trends. The impact of the
2008/09 recession on work and retirement is one such linkage.
The Limitations of the Edmonton Socio-Economic Outlook
This edition of the Edmonton Socio-Economic Outlook reflects a mid 2009 consensus view that
modest economic growth will return in late 2009 or early 2010. However, the timing of the
recovery is very uncertain and subject to events and initiatives around the globe. It may take
longer.
Edmonton and the Edmonton region
This document will use the Edmonton region as the relevant unit and define it as the Edmonton
Census Metropolitan Area (CMA). Where appropriate, this edition of the Outlook will identify
Edmonton-specific issues or trends. The document uses the Capital region and Edmonton region
interchangeably; both refer to the Edmonton CMA.
- 1 -

2. ECONOMIC SITUATION AND TRENDS
2.1 THE GLOBAL CONTEXT
Recession
The Alberta and Edmonton region economies are strongly linked to the global economy. The key
linkage is energy, which Alberta produces and exports and the US and other advanced
economies and increasingly China and other emerging economies consume. The energy sector
has been a dominant factor in the development of the Alberta economy and the energy prices are
a key in determining Alberta’s and Edmonton’s economic performance.1 Alberta and Edmonton
are also linked to the global economy through the financial and global manufacturing systems.
Our banks are, by-and-large based in Toronto and New York, energy investment competes with
projects around the world for internationally mobile capital, and the supply chain for large-scale
industrial projects and many consumer goods are global.
In the fall of 2008, the combination of a downturn in the real estate market and dubious lending
practices in the US turned into a loss of confidence in the US and then the global financial
systems. This caused the credit market to cease and the global economy to shrink. The global
economic turmoil was transmitted quickly to the Capital region’s economy through plummeting
energy prices and strongly curtailed credit availability.
‐6
‐4
‐2
0
2
4
6
8
% change
from Previous Year
GDP Growth
USA Euro Area Canada
Source: OECD 2009. OECD Outlook, June 2009.
The consensus in August 2009 is that a calamitous economic meltdown has been prevented by
rapid and extraordinary government actions around the world. Governments intervened heavily
1 R. Mansell and R. Schlenker. 2006.Energy and Alberta’s Economy: Past and Future Impacts and Implications
- 2 -
to restore some measure of confidence in financial institutions and unlock frozen credit markets.
Central banks lowered interest rates aggressively and employed other expansionary monetary
measures. Many governments rolled out stimulus spending packages, all aimed at restoring
economic growth. Canada’s macro-economic actions reflect those taken around the world.
Alberta did not formulate a specific economic stimulus. It did, however, maintain a high level of
spending despite shrinking revenues.
Recovery
The jury is still out if the bottom of the recession has been reached in mid 2009. Some indicators
remain bearish; others are more bullish. As for all advanced economies, economic indicators for
Canada, Alberta and the Edmonton region give mixed signals:
the economy started to shrink in the last quarter of 2008 and continued a
downward trend in the first two quarters of 2009;
unemployment levels are increasing as the economy shrinks;
housing starts have declined but the market is showing signs of life with
increased sales and steady or marginally firming prices; and
oil prices have recovered from their lows.
There will be a recovery. Its timing, however, is uncertain.
Inflation
There is also an ongoing debate whether inflation or deflation is more likely in the near and
medium term. There has been some deflation in Canada in May 2009, mostly due to falling
gasoline prices. In addition, there continue to be some deflationary forces, including spare
productive capacity in the economy and reduced global demand for commodities.
Deflation may be an issue in the near term, especially if the recession lasts into 2010. However,
inflation is more likely once confidence and economic growth have been restored as:
governments have been printing money (quantitative easing) which may
debase currencies; and
there has emerged a moral hazard for governments of using inflation to reduce
their debt burden as this will allow them to pay back bond holders in reduced
value dollars.
- 3 -
One thing is certain, policy makers are in uncharted waters and much will depend on how the
transition from government stimulus spending to private sector investment and individual
spending is managed.
Exchange Rate
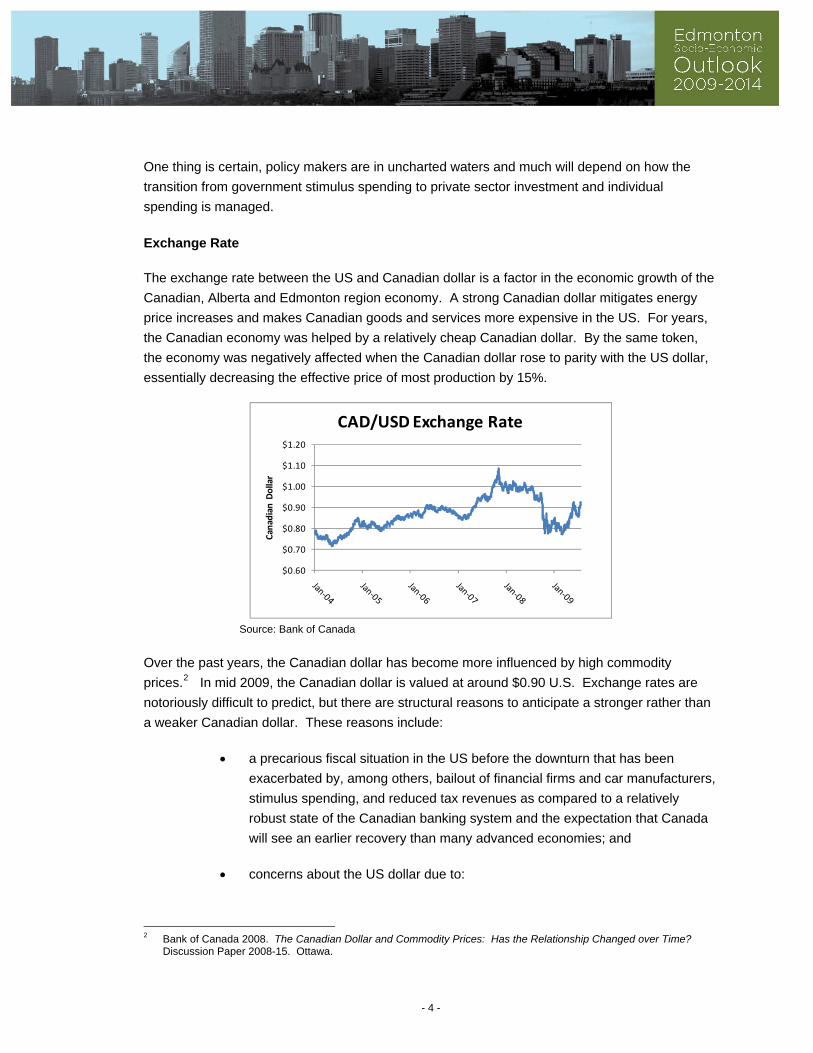
The exchange rate between the US and Canadian dollar is a factor in the economic growth of the
Canadian, Alberta and Edmonton region economy. A strong Canadian dollar mitigates energy
price increases and makes Canadian goods and services more expensive in the US. For years,
the Canadian economy was helped by a relatively cheap Canadian dollar. By the same token,
the economy was negatively affected when the Canadian dollar rose to parity with the US dollar,
essentially decreasing the effective price of most production by 15%.
$0.60
$0.70
$0.80
$0.90
$1.00
$1.10
$1.20
Canadian Dollar
CAD/USD Exchange Rate
Source: Bank of Canada
Over the past years, the Canadian dollar has become more influenced by high commodity
prices.2 In mid 2009, the Canadian dollar is valued at around $0.90 U.S. Exchange rates are
notoriously difficult to predict, but there are structural reasons to anticipate a stronger rather than
a weaker Canadian dollar. These reasons include:
a precarious fiscal situation in the US before the downturn that has been
exacerbated by, among others, bailout of financial firms and car manufacturers,
stimulus spending, and reduced tax revenues as compared to a relatively
robust state of the Canadian banking system and the expectation that Canada
will see an earlier recovery than many advanced economies; and
concerns about the US dollar due to:
2 Bank of Canada 2008. The Canadian Dollar and Commodity Prices: Has the Relationship Changed over Time?
Discussion Paper 2008-15. Ottawa.
- 4 -
trade imbalances and high budgetary deficits and the possibility that
inflation and a creeping currency devaluation will be in part the way in
which these imbalances are addressed; and
a movement away from the US dollar as a reserve currency towards the
use of a basket of currencies, including the Euro, Yen and Yuan.
2.2 THE PROVINCIAL CONTEXT
2.2.1 Current Spending
Consumer Spending
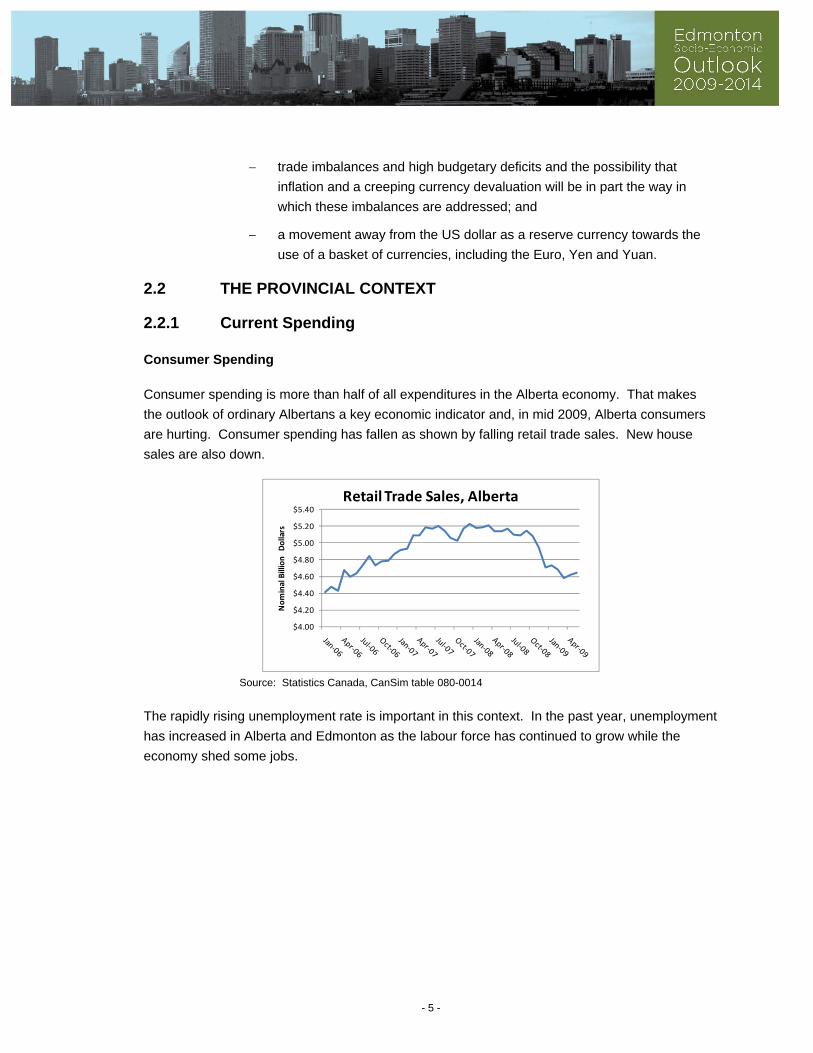
Consumer spending is more than half of all expenditures in the Alberta economy. That makes
the outlook of ordinary Albertans a key economic indicator and, in mid 2009, Alberta consumers
are hurting. Consumer spending has fallen as shown by falling retail trade sales. New house
sales are also down.
$4.00
$4.20
$4.40
$4.60
$4.80
$5.00
$5.20
$5.40
Nominal Billion Dollars
Retail Trade Sales, Alberta
Source: Statistics Canada, CanSim table 080-0014
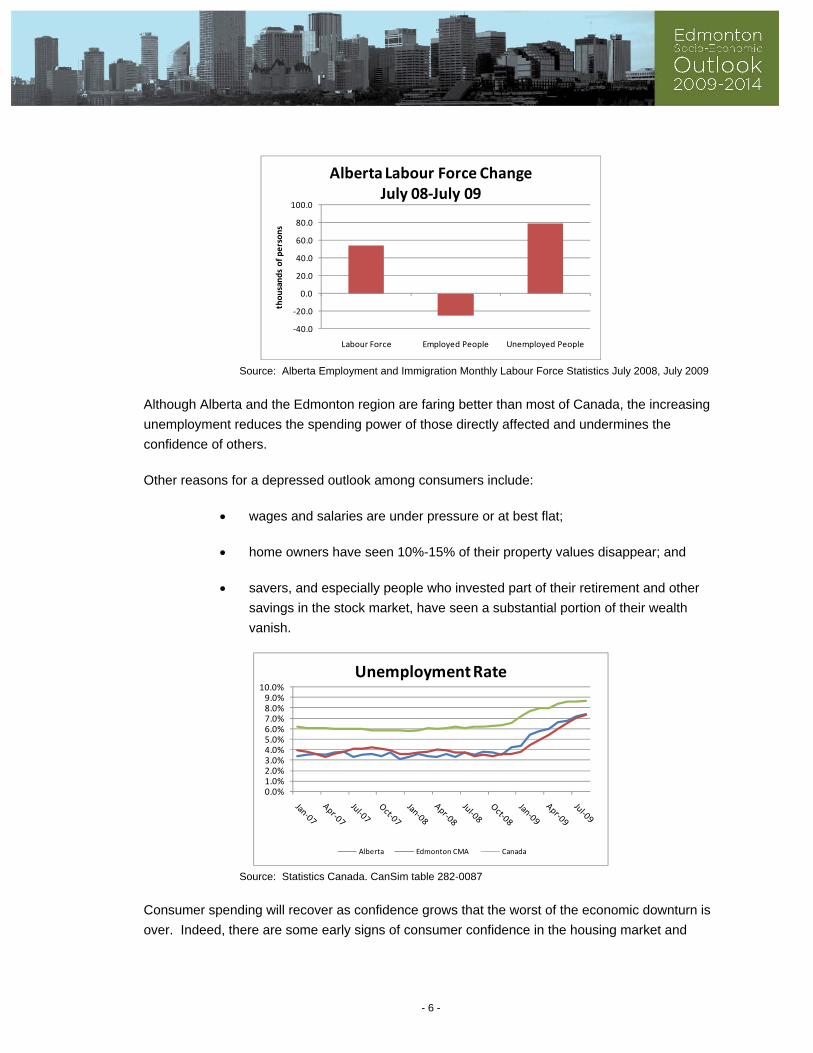
The rapidly rising unemployment rate is important in this context. In the past year, unemployment
has increased in Alberta and Edmonton as the labour force has continued to grow while the
economy shed some jobs.
- 5 -
‐40.0
‐20.0
0.0
20.0
40.0
60.0
80.0
100.0
Labour Force Employed People Unemployed People
thousands of persons
Alberta Labour Force ChangeJuly 08‐July 09
Source: Alberta Employment and Immigration Monthly Labour Force Statistics July 2008, July 2009
Although Alberta and the Edmonton region are faring better than most of Canada, the increasing
unemployment reduces the spending power of those directly affected and undermines the
confidence of others.
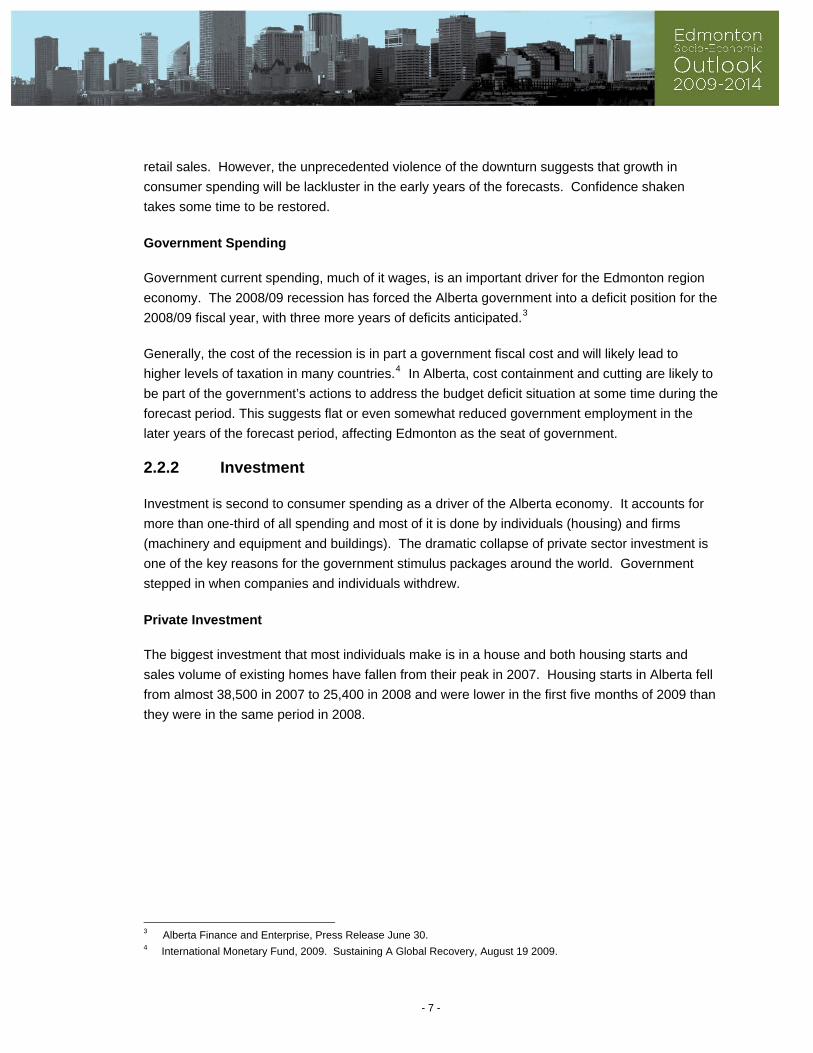
Other reasons for a depressed outlook among consumers include:
wages and salaries are under pressure or at best flat;
home owners have seen 10%-15% of their property values disappear; and
savers, and especially people who invested part of their retirement and other
savings in the stock market, have seen a substantial portion of their wealth
vanish.
0.0%1.0%2.0%3.0%4.0%5.0%6.0%7.0%8.0%9.0%
10.0%
Unemployment Rate
Alberta Edmonton CMA Canada
Source: Statistics Canada. CanSim table 282-0087
Consumer spending will recover as confidence grows that the worst of the economic downturn is
over. Indeed, there are some early signs of consumer confidence in the housing market and
- 6 -
retail sales. However, the unprecedented violence of the downturn suggests that growth in
consumer spending will be lackluster in the early years of the forecasts. Confidence shaken
takes some time to be restored.
Government Spending
Government current spending, much of it wages, is an important driver for the Edmonton region
economy. The 2008/09 recession has forced the Alberta government into a deficit position for the
2008/09 fiscal year, with three more years of deficits anticipated.3
Generally, the cost of the recession is in part a government fiscal cost and will likely lead to
higher levels of taxation in many countries.4 In Alberta, cost containment and cutting are likely to
be part of the government’s actions to address the budget deficit situation at some time during the
forecast period. This suggests flat or even somewhat reduced government employment in the
later years of the forecast period, affecting Edmonton as the seat of government.
2.2.2 Investment
Investment is second to consumer spending as a driver of the Alberta economy. It accounts for
more than one-third of all spending and most of it is done by individuals (housing) and firms
(machinery and equipment and buildings). The dramatic collapse of private sector investment is
one of the key reasons for the government stimulus packages around the world. Government
stepped in when companies and individuals withdrew.
Private Investment
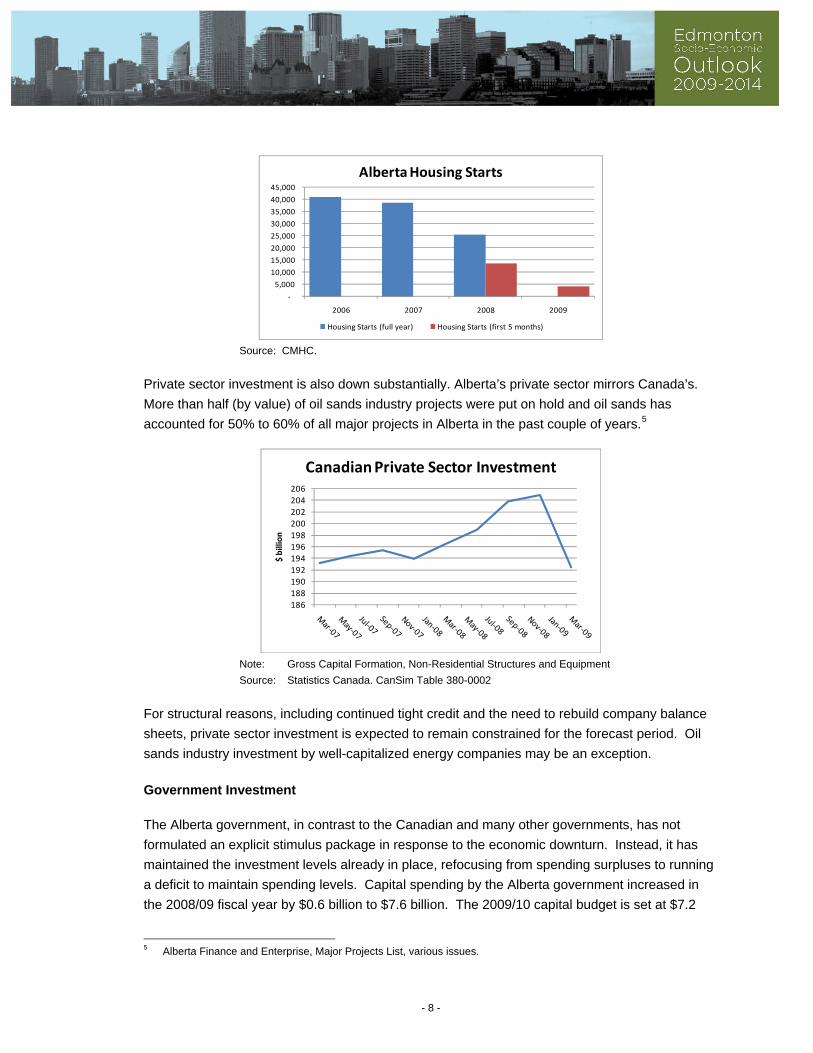
The biggest investment that most individuals make is in a house and both housing starts and
sales volume of existing homes have fallen from their peak in 2007. Housing starts in Alberta fell
from almost 38,500 in 2007 to 25,400 in 2008 and were lower in the first five months of 2009 than
they were in the same period in 2008.
3 Alberta Finance and Enterprise, Press Release June 30. 4 International Monetary Fund, 2009. Sustaining A Global Recovery, August 19 2009.
- 7 -
‐
5,000
10,000
15,000
20,000
25,000
30,000
35,000
40,000
45,000
2006 2007 2008 2009
Alberta Housing Starts
Housing Starts (full year) Housing Starts (first 5 months)
Source: CMHC.
Private sector investment is also down substantially. Alberta’s private sector mirrors Canada’s.
More than half (by value) of oil sands industry projects were put on hold and oil sands has
accounted for 50% to 60% of all major projects in Alberta in the past couple of years.5
186
188
190
192
194
196
198
200
202
204
206
$ billion
Canadian Private Sector Investment
Note: Gross Capital Formation, Non-Residential Structures and Equipment
Source: Statistics Canada. CanSim Table 380-0002
For structural reasons, including continued tight credit and the need to rebuild company balance
sheets, private sector investment is expected to remain constrained for the forecast period. Oil
sands industry investment by well-capitalized energy companies may be an exception.
Government Investment
The Alberta government, in contrast to the Canadian and many other governments, has not
formulated an explicit stimulus package in response to the economic downturn. Instead, it has
maintained the investment levels already in place, refocusing from spending surpluses to running
a deficit to maintain spending levels. Capital spending by the Alberta government increased in
the 2008/09 fiscal year by $0.6 billion to $7.6 billion. The 2009/10 capital budget is set at $7.2
5 Alberta Finance and Enterprise, Major Projects List, various issues.
- 8 -
billion and the three-year capital spending plan for 2009/10 to 2011/12 is $23.1 billion. This
spending may come under pressure if deficit reduction moves higher on the political agenda.
2.2.3 Energy Prices
Energy prices are and will remain a key indicator for private investment decisions in the
Alberta/Edmonton economy for the foreseeable future. They also influence employment and
possibly inflation levels, as well as government revenues.
Rebounding Oil Prices
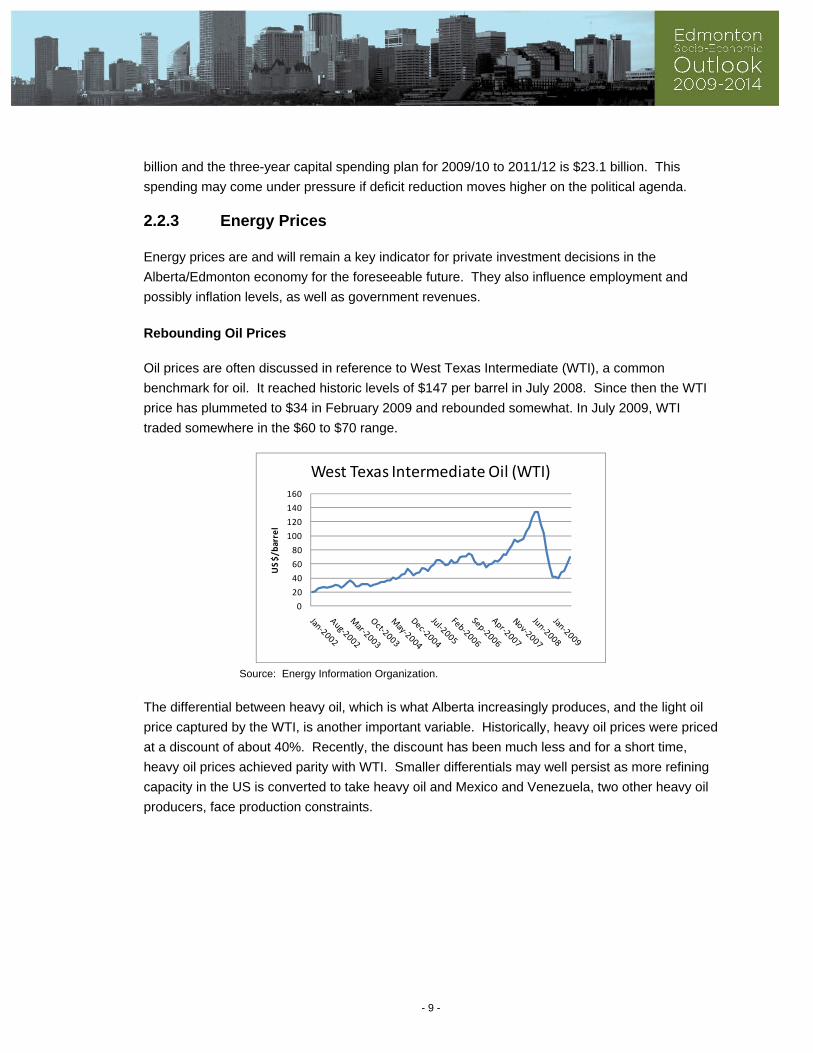
Oil prices are often discussed in reference to West Texas Intermediate (WTI), a common
benchmark for oil. It reached historic levels of $147 per barrel in July 2008. Since then the WTI
price has plummeted to $34 in February 2009 and rebounded somewhat. In July 2009, WTI
traded somewhere in the $60 to $70 range.
0
20
40
60
80
100
120
140
160
US $/barrel
West Texas Intermediate Oil (WTI)
Source: Energy Information Organization.
The differential between heavy oil, which is what Alberta increasingly produces, and the light oil
price captured by the WTI, is another important variable. Historically, heavy oil prices were priced
at a discount of about 40%. Recently, the discount has been much less and for a short time,
heavy oil prices achieved parity with WTI. Smaller differentials may well persist as more refining
capacity in the US is converted to take heavy oil and Mexico and Venezuela, two other heavy oil
producers, face production constraints.
- 9 -
Oil pricing is influenced by its supply and demand, with much attention paid to cutbacks in supply
by the Organization of Petroleum Exporting Countries (OPEC), flagging demand in advanced
economies and (re)surging demand in some emerging economies. Oil is also a very political
commodity and its price is also influenced by considerations other than supply and demand
forces. For example, the first oil shock was the result of an export embargo by OPEC in
response to the political situation around the 1973 Yom Kippur war. Other examples include
energy security considerations and the operation of a large strategic reserve by, among others,
the US and Japanese governments. In mid 2009, the OPEC target price appears to be
somewhere between US$65 and $75 per barrel.
Falling Natural Gas Prices
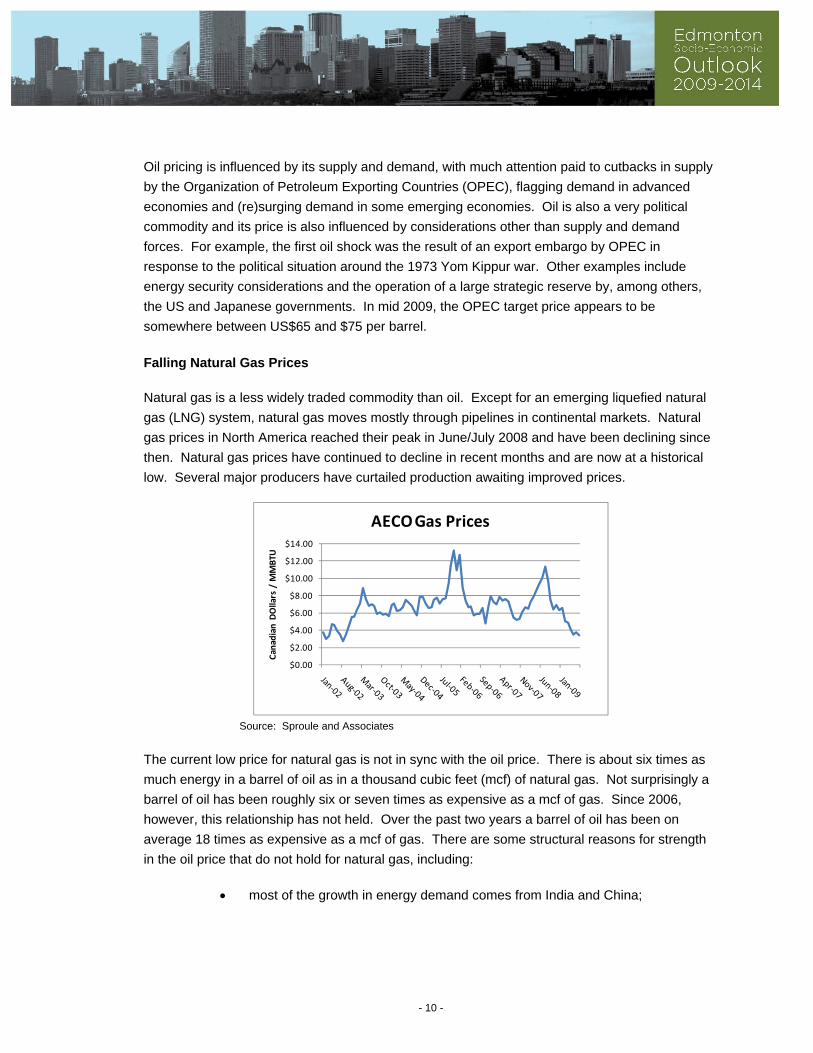
Natural gas is a less widely traded commodity than oil. Except for an emerging liquefied natural
gas (LNG) system, natural gas moves mostly through pipelines in continental markets. Natural
gas prices in North America reached their peak in June/July 2008 and have been declining since
then. Natural gas prices have continued to decline in recent months and are now at a historical
low. Several major producers have curtailed production awaiting improved prices.
$0.00
$2.00
$4.00
$6.00
$8.00
$10.00
$12.00
$14.00
Canadian DOllars / M
MBTU
AECO Gas Prices
Source: Sproule and Associates
The current low price for natural gas is not in sync with the oil price. There is about six times as
much energy in a barrel of oil as in a thousand cubic feet (mcf) of natural gas. Not surprisingly a
barrel of oil has been roughly six or seven times as expensive as a mcf of gas. Since 2006,
however, this relationship has not held. Over the past two years a barrel of oil has been on
average 18 times as expensive as a mcf of gas. There are some structural reasons for strength
in the oil price that do not hold for natural gas, including:
most of the growth in energy demand comes from India and China;
- 10 -
oil production in North America is decreasing; natural gas production is
increasing marginally, in part due to recent technological advances in
unconventional gas extraction.
Over the longer term, the natural gas price is likely to regain a more balanced relationship with oil
as these commodities are close substitutes. Market forces already have caused a reduction in
supply and demand is likely to pick up in the winter. More generally environmental considerations
will favour natural gas over oil or coal in many uses.
2.3 THE ECONOMY OF THE EDMONTON REGION
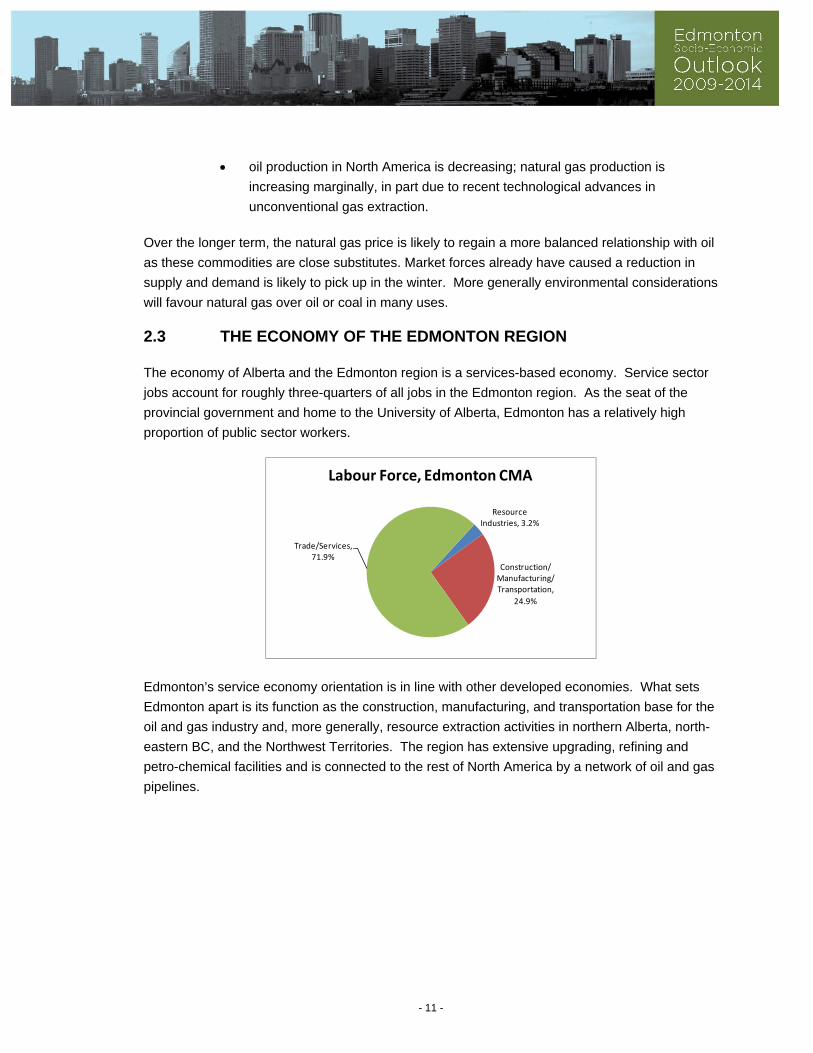
The economy of Alberta and the Edmonton region is a services-based economy. Service sector
jobs account for roughly three-quarters of all jobs in the Edmonton region. As the seat of the
provincial government and home to the University of Alberta, Edmonton has a relatively high
proportion of public sector workers.
Resource Industries, 3.2%
Construction/Manufacturing/Transportation,
24.9%
Trade/Services, 71.9%
Labour Force, Edmonton CMA
Edmonton’s service economy orientation is in line with other developed economies. What sets
Edmonton apart is its function as the construction, manufacturing, and transportation base for the
oil and gas industry and, more generally, resource extraction activities in northern Alberta, north-
eastern BC, and the Northwest Territories. The region has extensive upgrading, refining and
petro-chemical facilities and is connected to the rest of North America by a network of oil and gas
pipelines.
- 11 -
85.00 90.00 95.00 100.00 105.00 110.00 115.00
Other Alberta
Alberta
Edmonton CMA
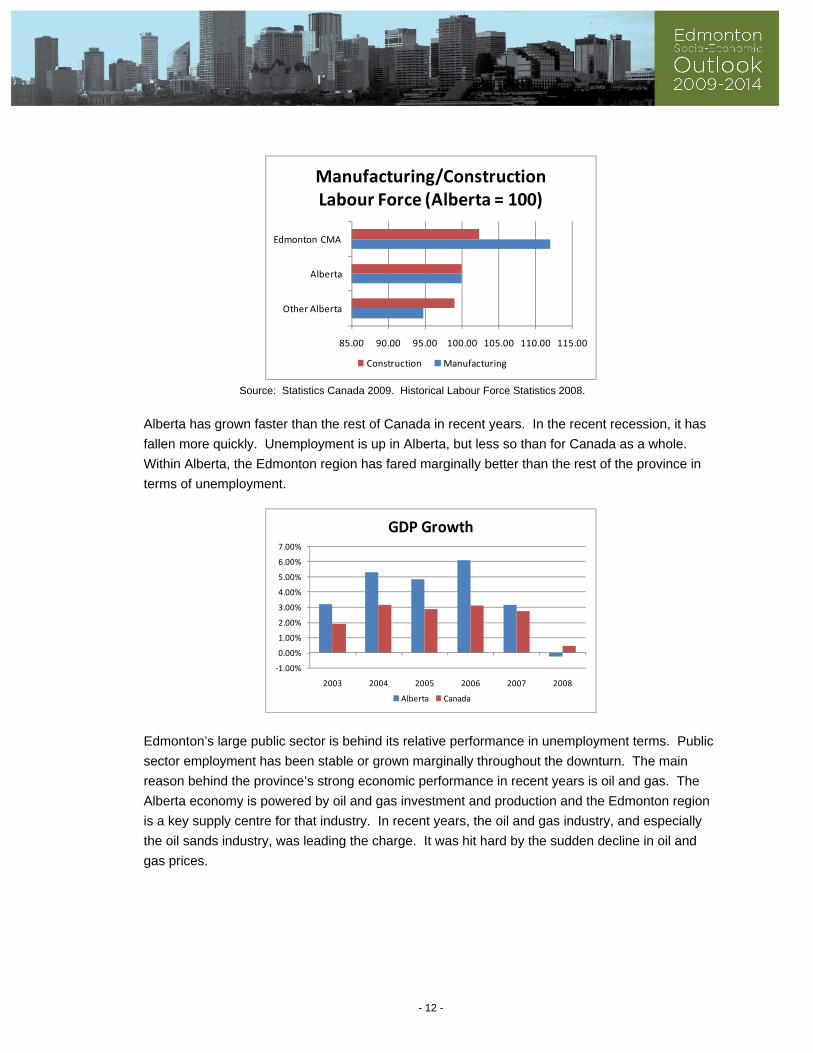
Manufacturing/Construction Labour Force (Alberta = 100)
Construction Manufacturing
Source: Statistics Canada 2009. Historical Labour Force Statistics 2008.
Alberta has grown faster than the rest of Canada in recent years. In the recent recession, it has
fallen more quickly. Unemployment is up in Alberta, but less so than for Canada as a whole.
Within Alberta, the Edmonton region has fared marginally better than the rest of the province in
terms of unemployment.
‐1.00%
0.00%
1.00%
2.00%
3.00%
4.00%
5.00%
6.00%
7.00%
2003 2004 2005 2006 2007 2008
GDP Growth
Alberta Canada
Edmonton’s large public sector is behind its relative performance in unemployment terms. Public
sector employment has been stable or grown marginally throughout the downturn. The main
reason behind the province’s strong economic performance in recent years is oil and gas. The
Alberta economy is powered by oil and gas investment and production and the Edmonton region
is a key supply centre for that industry. In recent years, the oil and gas industry, and especially
the oil sands industry, was leading the charge. It was hit hard by the sudden decline in oil and
gas prices.
- 12 -
Private Investment
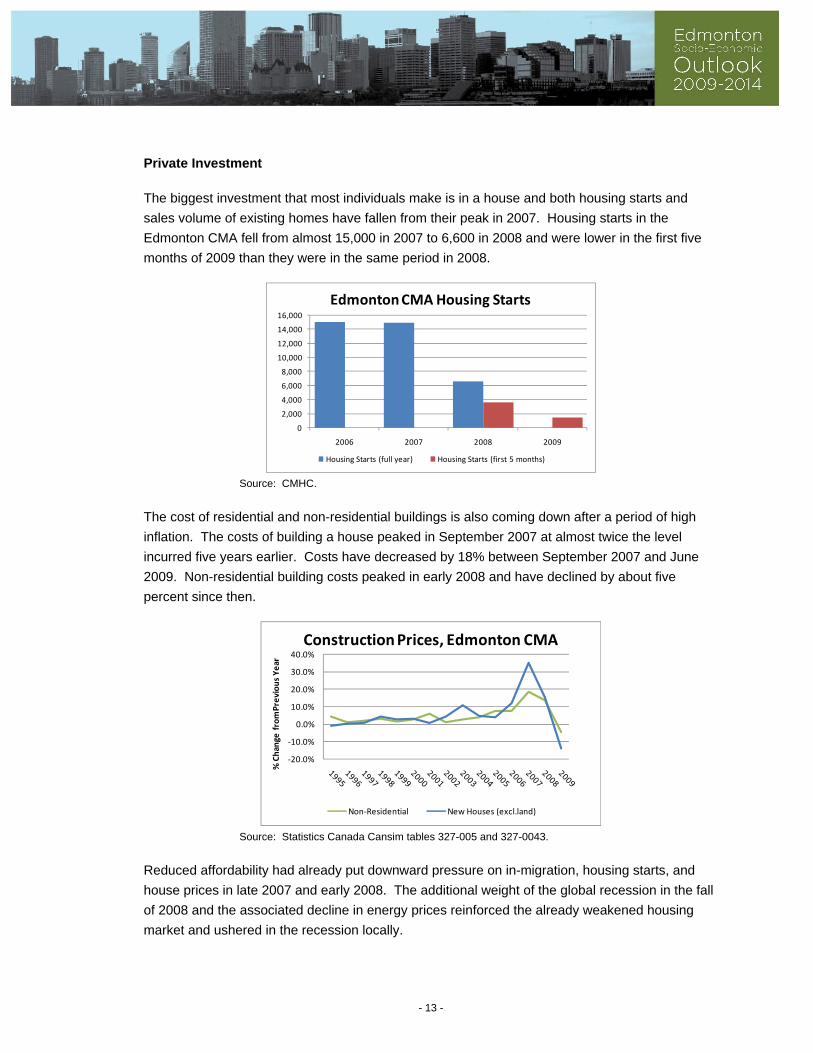
The biggest investment that most individuals make is in a house and both housing starts and
sales volume of existing homes have fallen from their peak in 2007. Housing starts in the
Edmonton CMA fell from almost 15,000 in 2007 to 6,600 in 2008 and were lower in the first five
months of 2009 than they were in the same period in 2008.
0
2,000
4,000
6,000
8,000
10,000
12,000
14,000
16,000
2006 2007 2008 2009
Edmonton CMA Housing Starts
Housing Starts (full year) Housing Starts (first 5 months)
Source: CMHC.
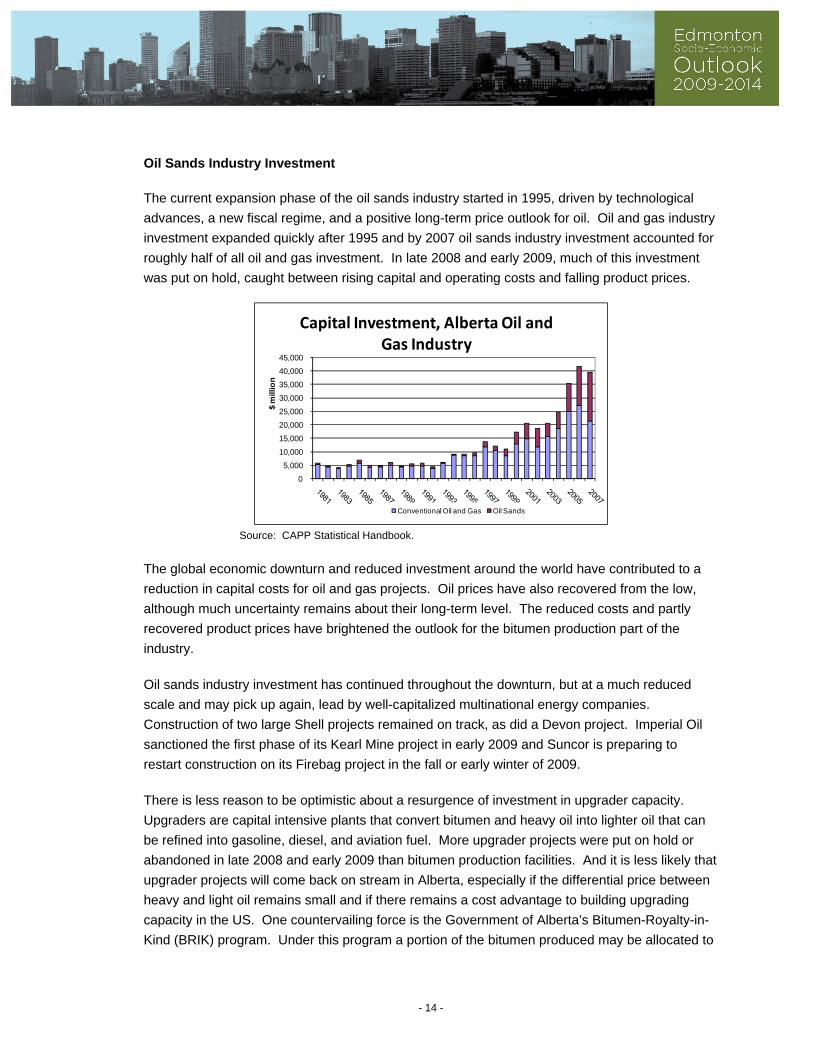
The cost of residential and non-residential buildings is also coming down after a period of high
inflation. The costs of building a house peaked in September 2007 at almost twice the level
incurred five years earlier. Costs have decreased by 18% between September 2007 and June
2009. Non-residential building costs peaked in early 2008 and have declined by about five
percent since then.
‐20.0%
‐10.0%
0.0%
10.0%
20.0%
30.0%
40.0%
% Change
fromPrevious Year
Construction Prices, Edmonton CMA
Non‐Residential New Houses (excl.land)
Source: Statistics Canada Cansim tables 327-005 and 327-0043.
Reduced affordability had already put downward pressure on in-migration, housing starts, and
house prices in late 2007 and early 2008. The additional weight of the global recession in the fall
of 2008 and the associated decline in energy prices reinforced the already weakened housing
market and ushered in the recession locally.
- 13 -
Oil Sands Industry Investment
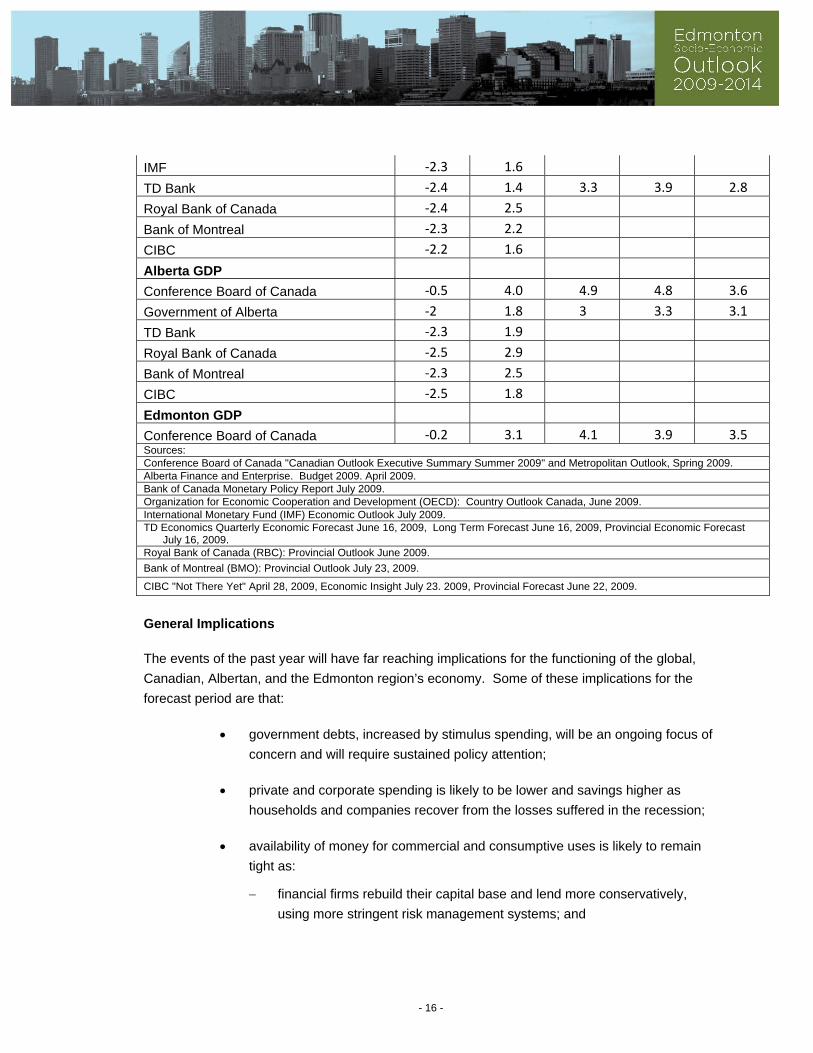
The current expansion phase of the oil sands industry started in 1995, driven by technological
advances, a new fiscal regime, and a positive long-term price outlook for oil. Oil and gas industry
investment expanded quickly after 1995 and by 2007 oil sands industry investment accounted for
roughly half of all oil and gas investment. In late 2008 and early 2009, much of this investment
was put on hold, caught between rising capital and operating costs and falling product prices.
0
5,000
10,000
15,000
20,000
25,000
30,000
35,000
40,000
45,000
$ m
illio
n
Capital Investment, Alberta Oil and Gas Industry
Conventional Oil and Gas Oil Sands
Source: CAPP Statistical Handbook.
The global economic downturn and reduced investment around the world have contributed to a
reduction in capital costs for oil and gas projects. Oil prices have also recovered from the low,
although much uncertainty remains about their long-term level. The reduced costs and partly
recovered product prices have brightened the outlook for the bitumen production part of the
industry.
Oil sands industry investment has continued throughout the downturn, but at a much reduced
scale and may pick up again, lead by well-capitalized multinational energy companies.
Construction of two large Shell projects remained on track, as did a Devon project. Imperial Oil
sanctioned the first phase of its Kearl Mine project in early 2009 and Suncor is preparing to
restart construction on its Firebag project in the fall or early winter of 2009.
There is less reason to be optimistic about a resurgence of investment in upgrader capacity.
Upgraders are capital intensive plants that convert bitumen and heavy oil into lighter oil that can
be refined into gasoline, diesel, and aviation fuel. More upgrader projects were put on hold or
abandoned in late 2008 and early 2009 than bitumen production facilities. And it is less likely that
upgrader projects will come back on stream in Alberta, especially if the differential price between
heavy and light oil remains small and if there remains a cost advantage to building upgrading
capacity in the US. One countervailing force is the Government of Alberta’s Bitumen-Royalty-in-
Kind (BRIK) program. Under this program a portion of the bitumen produced may be allocated to
- 14 -

Alberta-based upgraders. The volume of bitumen upgraded in Alberta under the BRIK program is
expected to remain relatively small.
2.4 IMPLICATIONS
Economists and economic forecasts are receiving much attention as individuals, businesses and
governments try to assess their situation and possible courses of action. Having been caught
flat-footed by the recession, this renewed interest in forecasts comes at a time of humility for the
profession.6 Noting the uncertainty about the timing and vigour of the recovery, this edition of the
Socio-Economic Outlook presents its Most Likely scenario, outlining the main drivers and key
implications on selected economic indicators. It also discusses a Downside Risk scenario that
addresses the uncertainty that surrounds these forecasts that cover years in which the world
economy is in uncharted waters.
Overview of Forecasts
The general consensus is that growth in the world economy, Canada, and Alberta will be negative
in 2009 and will regain a positive momentum in 2010. A number of organizations, including the
Bank of Canada, have upped their forecasts marginally in mid 2009 as compared to ones made
earlier in the year. Economic growth in the forecast period will be lower than in the period before
the recession.
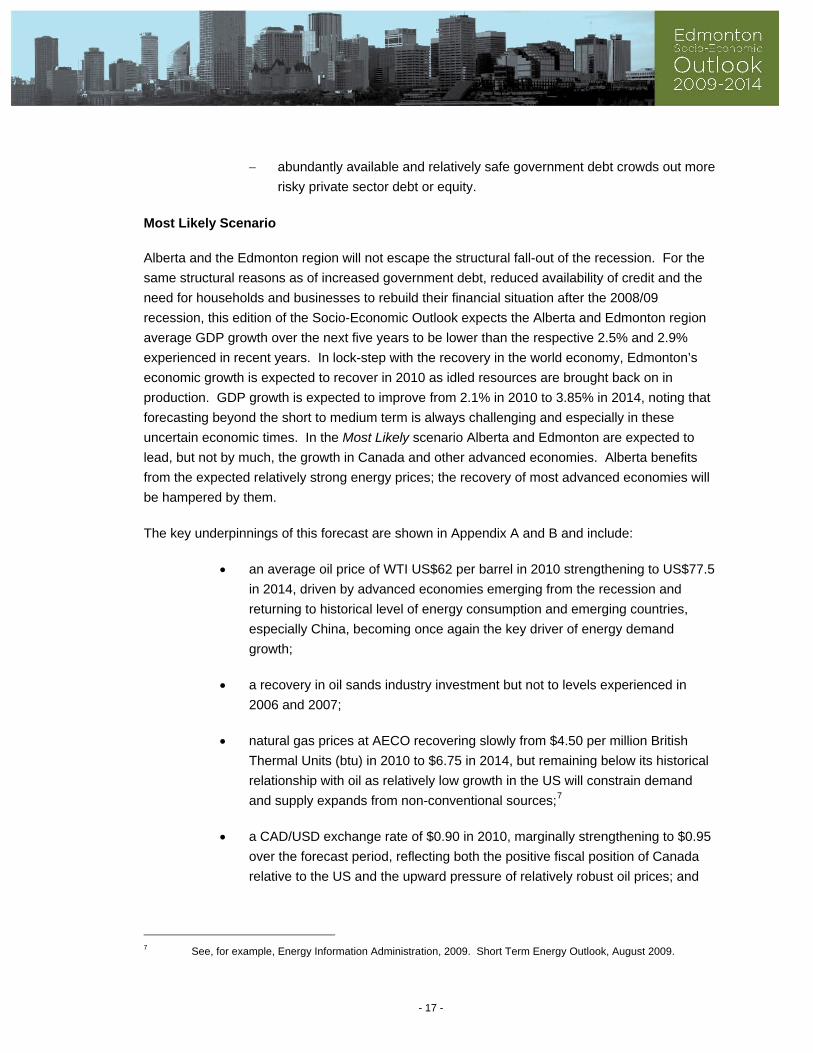
Forecasts place the Alberta GDP growth at between 1.8% and 4.0% for 2010 and between 3.0%
and 4.9% for the following years. This compared with an average growth rate of 4.5% per year in
the five years up to 2008.
GDP Growth Forecasts
2009 2010 2011 2012 2013 Percentage Change Over Previous Year
World GDP
Conference Board of Canada ‐1.6 2.1
OECD ‐2.2 2.3
IMF ‐1.4 2.5
TD Bank ‐1.9 2.7
CIBC ‐1.5 2
Canadian GDP
Conference Board of Canada ‐1.9 2.7
Bank of Canada ‐2.3 3 3.5
OECD ‐2.6 0.7
6 See for example, The Observer, July 26, 2009, “This is how we let the credit crunch happen” and The Economist, July
16, 2009, “What went wrong with Economics?”
- 15 -
IMF ‐2.3 1.6
TD Bank ‐2.4 1.4 3.3 3.9 2.8
Royal Bank of Canada ‐2.4 2.5
Bank of Montreal ‐2.3 2.2
CIBC ‐2.2 1.6
Alberta GDP
Conference Board of Canada ‐0.5 4.0 4.9 4.8 3.6
Government of Alberta ‐2 1.8 3 3.3 3.1
TD Bank ‐2.3 1.9
Royal Bank of Canada ‐2.5 2.9
Bank of Montreal ‐2.3 2.5
CIBC ‐2.5 1.8
Edmonton GDP
Conference Board of Canada ‐0.2 3.1 4.1 3.9 3.5 Sources: Conference Board of Canada "Canadian Outlook Executive Summary Summer 2009" and Metropolitan Outlook, Spring 2009. Alberta Finance and Enterprise. Budget 2009. April 2009. Bank of Canada Monetary Policy Report July 2009. Organization for Economic Cooperation and Development (OECD): Country Outlook Canada, June 2009. International Monetary Fund (IMF) Economic Outlook July 2009. TD Economics Quarterly Economic Forecast June 16, 2009, Long Term Forecast June 16, 2009, Provincial Economic Forecast
July 16, 2009. Royal Bank of Canada (RBC): Provincial Outlook June 2009.
Bank of Montreal (BMO): Provincial Outlook July 23, 2009.
CIBC "Not There Yet" April 28, 2009, Economic Insight July 23. 2009, Provincial Forecast June 22, 2009.
General Implications
The events of the past year will have far reaching implications for the functioning of the global,
Canadian, Albertan, and the Edmonton region’s economy. Some of these implications for the
forecast period are that:
government debts, increased by stimulus spending, will be an ongoing focus of
concern and will require sustained policy attention;
private and corporate spending is likely to be lower and savings higher as
households and companies recover from the losses suffered in the recession;
availability of money for commercial and consumptive uses is likely to remain
tight as:
financial firms rebuild their capital base and lend more conservatively,
using more stringent risk management systems; and
- 16 -
abundantly available and relatively safe government debt crowds out more
risky private sector debt or equity.
Most Likely Scenario
Alberta and the Edmonton region will not escape the structural fall-out of the recession. For the
same structural reasons as of increased government debt, reduced availability of credit and the
need for households and businesses to rebuild their financial situation after the 2008/09
recession, this edition of the Socio-Economic Outlook expects the Alberta and Edmonton region
average GDP growth over the next five years to be lower than the respective 2.5% and 2.9%
experienced in recent years. In lock-step with the recovery in the world economy, Edmonton’s
economic growth is expected to recover in 2010 as idled resources are brought back on in
production. GDP growth is expected to improve from 2.1% in 2010 to 3.85% in 2014, noting that
forecasting beyond the short to medium term is always challenging and especially in these
uncertain economic times. In the Most Likely scenario Alberta and Edmonton are expected to
lead, but not by much, the growth in Canada and other advanced economies. Alberta benefits
from the expected relatively strong energy prices; the recovery of most advanced economies will
be hampered by them.
The key underpinnings of this forecast are shown in Appendix A and B and include:
an average oil price of WTI US$62 per barrel in 2010 strengthening to US$77.5
in 2014, driven by advanced economies emerging from the recession and
returning to historical level of energy consumption and emerging countries,
especially China, becoming once again the key driver of energy demand
growth;
a recovery in oil sands industry investment but not to levels experienced in
2006 and 2007;
natural gas prices at AECO recovering slowly from $4.50 per million British
Thermal Units (btu) in 2010 to $6.75 in 2014, but remaining below its historical
relationship with oil as relatively low growth in the US will constrain demand
and supply expands from non-conventional sources;7
a CAD/USD exchange rate of $0.90 in 2010, marginally strengthening to $0.95
over the forecast period, reflecting both the positive fiscal position of Canada
relative to the US and the upward pressure of relatively robust oil prices; and
7 See, for example, Energy Information Administration, 2009. Short Term Energy Outlook, August 2009.
- 17 -

a ramp-up in oil sands industry investment, but not to the level seen between
2006 and 2008, in response to relatively robust oil prices, availability of workers
and fabrication facilities, and reduced costs of selected inputs.
For Alberta and Edmonton, the implications of this forecast are:
increasing employment that marginally lags GDP growth situation, resulting in a
falling annual average unemployment rate from 5.7% in 2010 to 4.1% in 2014
as oil sands investment stimulates the oil and gas manufacturing sector and
buoys consumer confidence;
job creation in 2010 that makes up most of the losses of 2009 and that ranges
from 14,500 in 2010 to 20,900 in 2014; job creation is expected to remain
below levels seen in 2006 and 2008 reflecting lower economic growth
expectations;
in-migration averages 11,000 persons per year, ranging from 4,000 in 2010 to
14,700 in 2010, below levels seen in 2006 and 2008 reflecting both lower
growth and positive economic performance relative to other provinces;
housing starts ranging from 7,500 in 2010 to 12,600 in 2011, below levels seen
in 2006 and 2008 reflecting the need to absorb unsold inventory in 2010 and
2011 and lower in-migration.
The lower growth relative to recent years will spill over into other parts of the economy.
Construction costs faced by people, businesses, and municipalities have already been reduced
after a period of high inflation. Construction cost increases are likely to remain muted and the
labour market less tight over the early years of the forecast period. The recent increases in
unemployment, which have been felt more in the private than in the public sector, are likely to
temper wage demands and make public sector employment relatively more attractive.
The lower growth than in 2006 and 2007 will also spill over into the fiscal position of Alberta and
Edmonton. Relatively low natural gas prices will put pressure on the provincial budget.
Provincial income tax levels will also be effected by lower growth in employment and less wage
inflation than in recent years. Edmonton’s fiscal position will be affected by investment income
that is likely to be lower than in recent years as companies rebuild their balance sheets.
Provincial grant income is expected to be under pressure as is already evident by a reduction in
the Municipal Sustainability Initiative funding in the 2009 Provincial Budget. Further increases in
the education tax requisition will affect the City’s tax room.
- 18 -

Several of these implications of the current economic situation and trends are reinforced by social
trends. Economic growth, for example, will also be affected by increased environmental
regulation and the graying of the economy. A more detailed discussion of social trends follows in
the next section.
Downside Risk Scenario
There is more risk on the downside than on the upside. Large-scale government intervention has
avoided a catastrophic meltdown of the global financial system. But it is still unclear if all required
write-downs of opaque financial assets have taken place and there remain concerns about
residential, commercial mortgage and credit card defaults. Credit markets remain jittery in mid
2009 and consumer and business confidence shaky. Layered over this remaining uncertainty
about the robustness of the financial sector is the challenge facing governments of how to reduce
their central role in recession management. Once non-government spending has returned to
more normal levels, governments can and need to reign in their stimulus spending and reverse
their loose monetary policy.
If not managed well, jittery credit markets, tightening monetary policy or premature reduction of
government stimulus spending will have negative effects on growth. Another period of low or
negative growth globally is likely to depress energy prices and that will weigh heavily on the
Alberta and Edmonton economy. In general terms, the Downside Risk scenario will mean that
the Alberta’s and Edmonton’s economy performance will lag other advanced economies. The
implications for the Edmonton economy of the Downside Risk scenario include:
one or more quarters of negative GDP growth, likely in early to mid 2010;
reduced government income from resource royalties and an increased need for
initiatives to address budget deficits;
job losses, including public sector job losses, and rising unemployment, likely
above levels seen in the recession to mid 2009.
Migration into the Edmonton region is likely to slow under the Downside Risk Scenario, mirroring
the historical experience of the early 1990s.
- 19 -
3. SOCIAL SITUATION AND TRENDS
3.1 GLOBAL TRENDS
Edmonton mirrors a set of fundamental social trends that will have an effect over the forecast
period and beyond. The key ones are discussed here.
3.1.1 Aging Population
The population of all advanced economies is aging and the population of many developing
nations are only a few decades behind. Over time, the inexorable rise in number of elderly, both
in absolute numbers and as a percentage of the overall population, will have profound
consequences. Many of these are social in nature and pertain to, for example, the type of
housing required and the way we organize and finance health care. Many will feed back into the
economy through, for example, changes in the labour force and changes in savings/spending
behaviour.
Low Birth Rates
One key reason for our aging population is that families have fewer children. On average, Alberta
women will have 1.7 children, well below the replacement rate of 2.1. There has been a small
increase in birth rate in the Edmonton region from 11.6 live births per 1,000 population in 2000 to
12.3 in 2006.8 This trend is reflected across Alberta and Canada and is linked to the children of
baby boomers entering their child-bearing years.9
Longer Lives
Another reason for the aging population is an increased life expectancy. In Canada, life
expectancy at birth has increased from 69 in the late 1950s to almost 81 in 2009. It may increase
to 85 by 2050.10 In part this is due to falling mortality rates among children. In advanced
economies, we also actually live longer. The difference matters as falling infant mortality
increases the labour force and longer lives increase dependency ratios. Much of the social
implications of an aging population are linked to more people living longer. It is directly related to
health care costs.
8 City of Edmonton, 2008, Report on Edmonton’s Children and Youth. 9 Statistics Canada 2008. Birth 2006. Catalogue 84F0210X. 10 United Nations, 2009. The World Population Prospects, 2008 Revision (median variant).
- 20 -
3.1.2 The Environment
The “Environment” is very much on the agenda, showing up under many guises. Some
regulatory examples include:
international agreements on emissions (e.g. the soon-to-be-renewed Kyoto
Protocol limiting greenhouse gas, the Montreal protocol that addresses CFCs
and others);
emerging regulation of emissions, such as the EU and US carbon trading
schemes and Alberta’s Climate Change and Emissions Management
Amendment Act and its accompanying Specified Gas Emitters Regulation; and
the new Land Use Framework, which aims to balance environmental, social,
and economic claims on Alberta’s land base.
Consumers are also moving in a green direction. Edmontonians have embraced curbside
recycling and farmers’ markets. Some use green power or drive hybrid vehicles. Most green
consumer activities to date are small and symbolic. The car and truck are still firmly entrenched
and the single family home in the suburb remains the dominant urban development idea. But
change has started and it will continue over the forecast period.
3.1.3 Changing Face of Work
Reflecting trends throughout advanced economies, the labour force and the work place are
changing. The key elements include:11
the increasing need for post secondary education for most jobs, something that
holds equally true in new industries, such as telecommunications and for
traditional ones, such as the oil and gas industry;
current unemployment notwithstanding, skills shortages as the jobs of retiring
baby boomers need to be filled by the numerically smaller generations; and
more diversity in the work place as traditionally under-represented groups
(aboriginal people, recent immigrants, people with disabilities) are brought into
the workforce to fill positions.
Edmonton faces substantial challenges in meeting the demands of the changing labour force.
11 Alberta Human Resources and Employment, 2005. Understanding Alberta’s Labour Force: Looking to the Future.
- 21 -
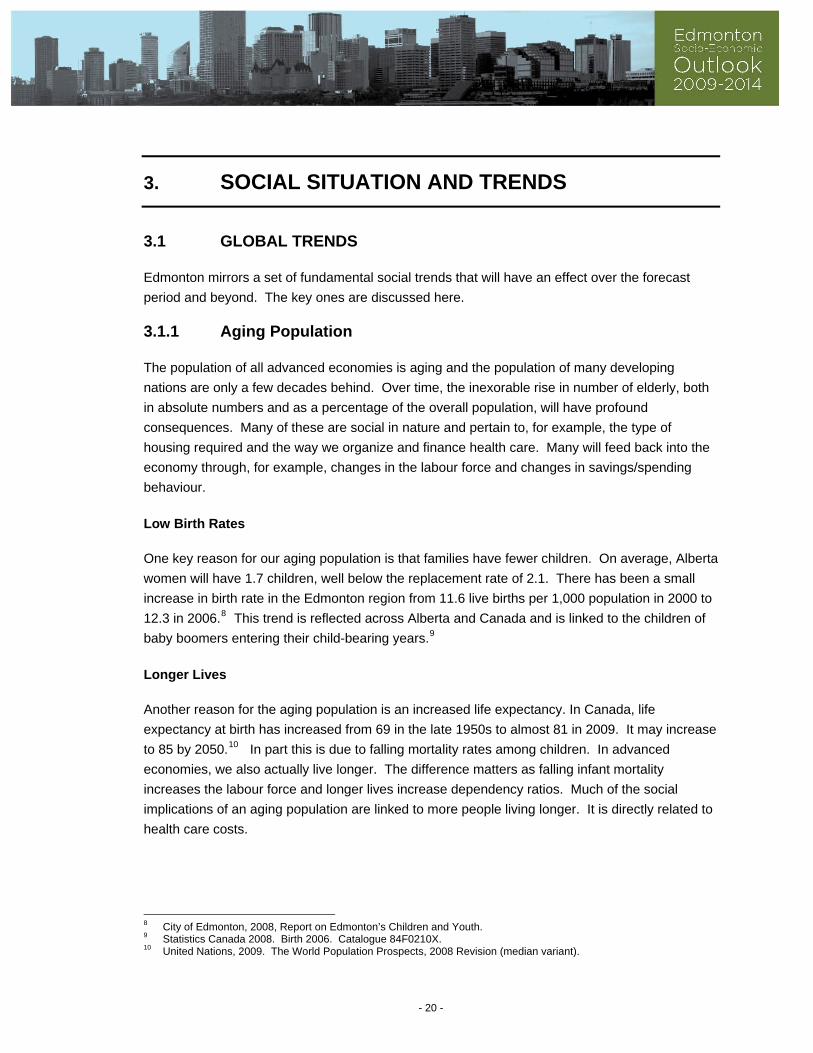
Older Workers
The current recession’s impact on (private) sector pensions and private savings is likely to
increase the number of older workers who remain in the workforce. This phenomenon is already
evident and will likely be an aspect of the labour force in the forecast period. However, the baby
boomer generation will retire eventually, necessitating increased in-migration and engagement
with traditionally under-represented groups. In the end, productivity gains – working smarter –
will need to be the larger part of the answer to the aging labour force.
30
40
50
60
70
80
90
Participation Rate (%)
Edmonton Labour Force Participation Older Workers
Men Women Both Sexes
Note: Older workers are defined as workers 55 to 64 years of age.
Source: Statistics Canada, Labour Force Historical Review 2008.
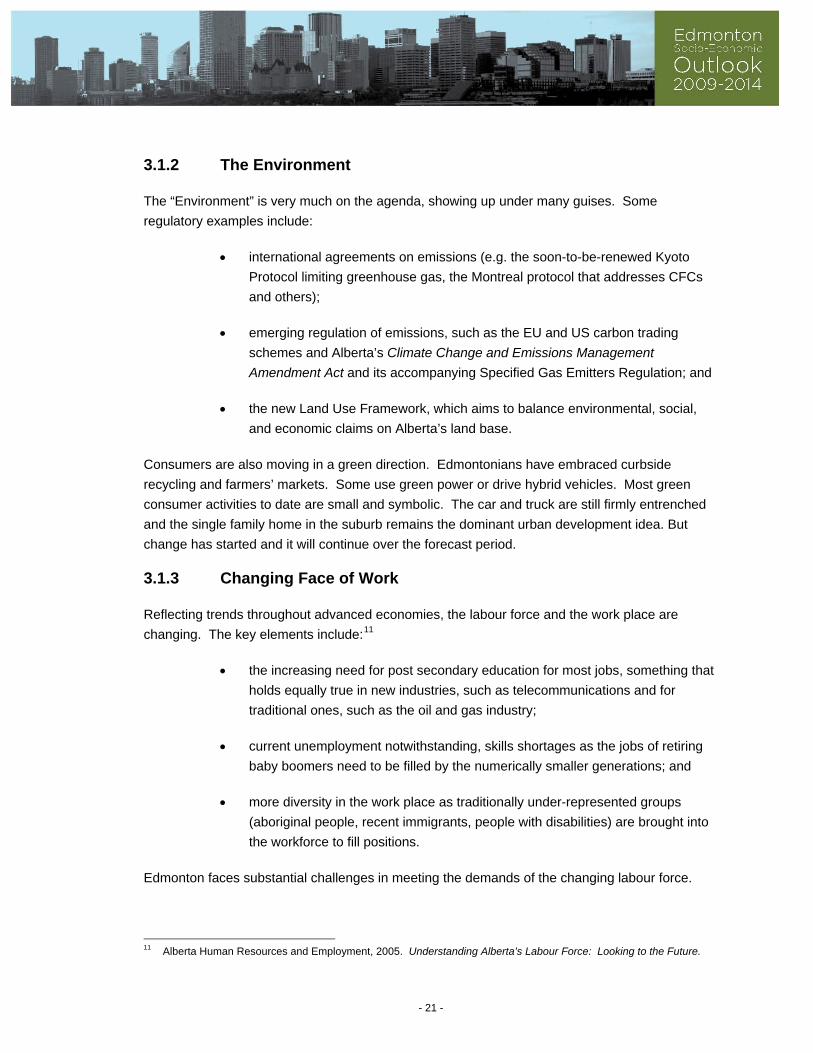
Educational Attainment
The percentage of Edmonton’s population that is university educated has grown marginally
between 2001 and 2006 from 22.9% to 24.4% of the total population 15 years and older.
Edmonton is trailing key other cities in Canada in the number of university educated people,
suggesting that the region is not ideally situated for a more knowledge-intensive economy.
Edmonton fares better relative to other cities in the percentage of the population that has college-
level degrees and apprenticeship training.
- 22 -
0% 10% 20% 30% 40% 50%
Alberta
Canada
Edmonton
Calgary
Toronto
Vancouver
Post Secondary Education, 2006
University Certificate, Diploma or Degree
College or other non‐university certificate/diploma
Apprenticeship or trades certificate or diploma
Source: Statistics Canada 2006 Census..
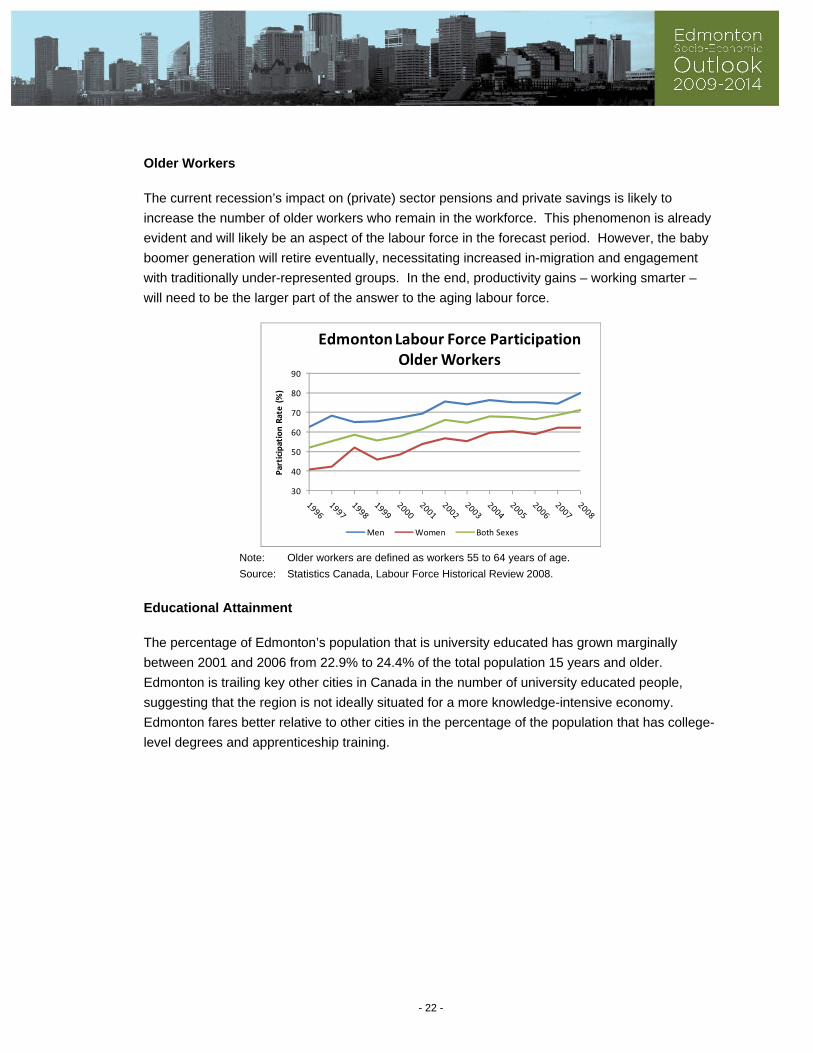
Diversity
Edmonton’s population and labour force is still overwhelmingly of European descent. But
diversity will increase as more persons from under-represented groups, especially Aboriginal
persons and new immigrants are drawn into the labour force. Aboriginal people are the largest
visible minority. There are an estimated 49,910 people (or about 7 percent of the population) of
First Nation or Inuit status or Métis heritage.
India is the country of origin of the majority of recent immigrants in the Edmonton region and fully
85% of recent landed immigrants living in Edmonton hail from non-European countries. Many of
the non-permanent residents are part of visible minorities as well.
0%
10%
20%
30%
40%
50%
60%
70%
India South Korea US China Paraguay
Recently Landed ImmigrantsLiving in Edmonton CMA
Note: Immigrants landed in Canada between 1996 and 2006
Source: Statistics Canada, Census 2006
Increased diversity implies challenges in integrating currently under-represented groups into the
labour force. The Aboriginal community is younger than the population as a whole and, as a
- 23 -

group, has lower levels of education. Employment-related challenges of recent immigrants
include limited language skills, issues with foreign credentials, and lack of “Alberta” experience.
3.2 EDMONTON-SPECIFIC TRENDS
3.2.1 Population and Migration
By and large, people come to Alberta and the Edmonton region for work. Strong economic
performance in 2004 through 2007 is mirrored in an increase in population. The population
growth has continued through the recent downturn. The City’s population grew by some 30,000
people (or 4.0%) from May 2008 to May 2009 to 782,439. Population growth in 2008 exceeded
the average growth in the five years prior; lower unemployment than elsewhere is likely a
contributing factor.
0
5,000
10,000
15,000
20,000
25,000
30,000
35,000
2007 2008 2009
No of persons
Population Growth, Edmonton
Annual Growth Avg Growth 01‐06
Source: City of Edmonton, Municipal Census
Although an uptick in the number of births helps, the real source of population growth for Alberta
and the Edmonton region has been in-migration. Immigration has, of course, long been the key
driver of population growth for the province and the region. Most people, except the First
Nations, are relatively new arrivals either from other parts of Canada or from other countries. The
sources of international in-migrants for Alberta and Edmonton have shifted. Whereas the original
settlers were mostly from the British Isles, subsequent waves of immigrants have been from
Eastern Europe and more recently from Asia and Africa.
- 24 -

0
20,000
40,000
60,000
80,000
100,000
120,000
Population Growth, Alberta
Natural Increase Net Interprovincial Migration
Net International Net Non‐Permanent Residents
Source: Alberta Finance and Enterprise, Alberta Population Report, various issues.
In-migration is linked to housing affordability relative to other jurisdictions. Although the
Edmonton region has become less affordable, it remains on par with major population centres in
Canada. Toronto and Vancouver are more expensive and Montreal and Halifax a little less. As
most metropolitan centres it is more expensive than rural areas from which some in-migrants
come.
3.2.2 Social Aspects of Growth
The Edmonton region has gone through a period of rapid economic growth, which only stopped in
2008. Growth is expected to resume in 2010, although at a slower pace than before. The
experience of the recent period of growth has been that economic growth had outpaced social
investment in the region and the province. Indeed, a focus on debt reduction in the 1990s
involved substantial cuts to social housing, reduced income support benefit rates, and a focus on
moving people off assistance into jobs. Despite increases in social spending in recent years, the
province’s social infrastructure remains under pressure. The demand for social housing still
outstrips the supply. And people with lower skill levels may be off income support, but many have
only been able to find lower-paying jobs. This situation holds during the recession and is likely to
exacerbate as growth restarts.
Economic expansion leads to employment opportunities and increases in income and wealth.
Experience shows that it also leads to reduced access to affordable housing, health care,
education and training, child care, transportation, and human services for people on the lower
end of the income scale. The recession has reduced job opportunities, but the population growth
and the associated pressures on the social sphere have not abated.
Housing Affordability
Housing affordability is the central concern that emerged in recent years. For years, both rental
and owned housing in the Edmonton region was cheap relative to many jurisdictions and to
- 25 -
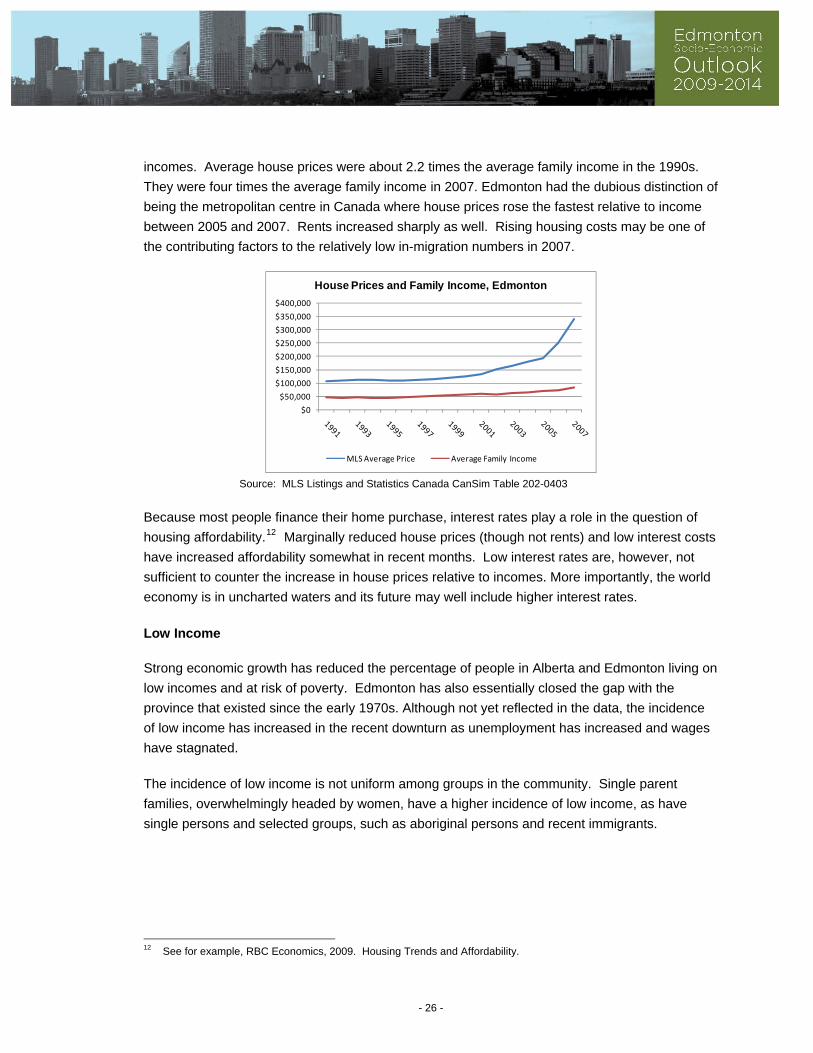
incomes. Average house prices were about 2.2 times the average family income in the 1990s.
They were four times the average family income in 2007. Edmonton had the dubious distinction of
being the metropolitan centre in Canada where house prices rose the fastest relative to income
between 2005 and 2007. Rents increased sharply as well. Rising housing costs may be one of
the contributing factors to the relatively low in-migration numbers in 2007.
$0
$50,000
$100,000
$150,000
$200,000
$250,000
$300,000
$350,000
$400,000
House Prices and Family Income, Edmonton
MLS Average Price Average Family Income
Source: MLS Listings and Statistics Canada CanSim Table 202-0403
Because most people finance their home purchase, interest rates play a role in the question of
housing affordability.12 Marginally reduced house prices (though not rents) and low interest costs
have increased affordability somewhat in recent months. Low interest rates are, however, not
sufficient to counter the increase in house prices relative to incomes. More importantly, the world
economy is in uncharted waters and its future may well include higher interest rates.
Low Income
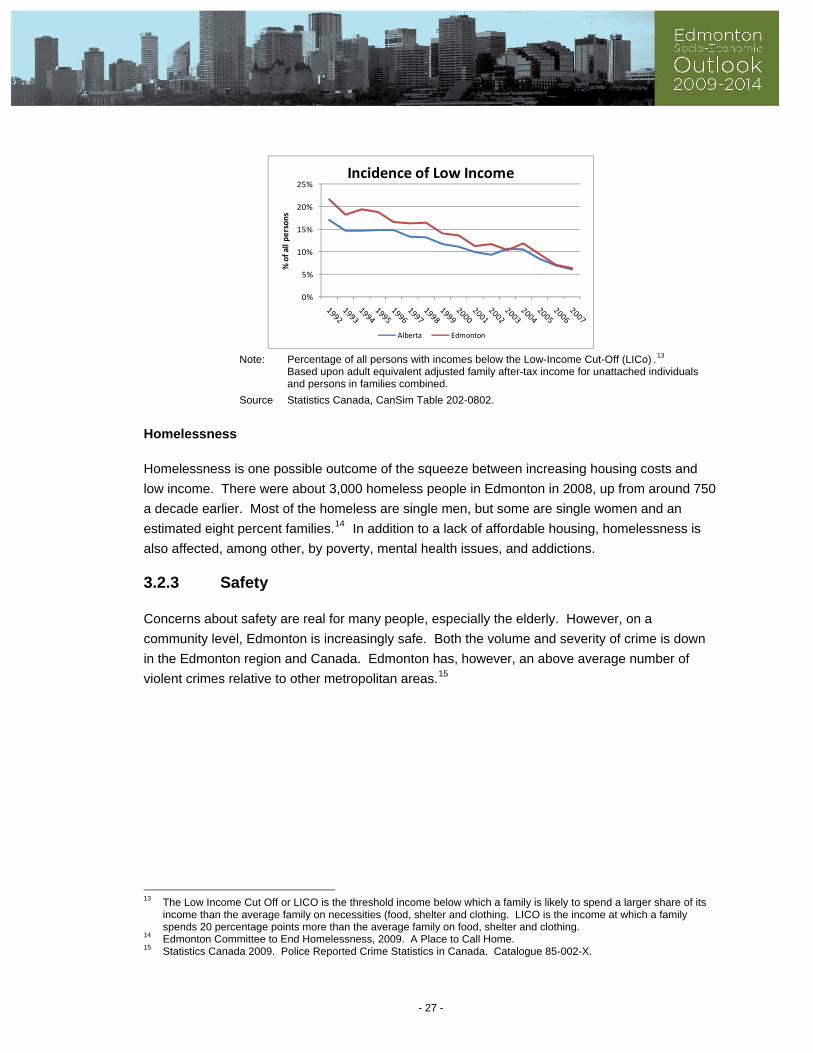
Strong economic growth has reduced the percentage of people in Alberta and Edmonton living on
low incomes and at risk of poverty. Edmonton has also essentially closed the gap with the
province that existed since the early 1970s. Although not yet reflected in the data, the incidence
of low income has increased in the recent downturn as unemployment has increased and wages
have stagnated.
The incidence of low income is not uniform among groups in the community. Single parent
families, overwhelmingly headed by women, have a higher incidence of low income, as have
single persons and selected groups, such as aboriginal persons and recent immigrants.
12 See for example, RBC Economics, 2009. Housing Trends and Affordability.
- 26 -
0%
5%
10%
15%
20%
25%
% of all persons
Incidence of Low Income
Alberta Edmonton
Note: Percentage of all persons with incomes below the Low-Income Cut-Off (LICo) .13
Based upon adult equivalent adjusted family after-tax income for unattached individuals and persons in families combined.
Source Statistics Canada, CanSim Table 202-0802.
Homelessness
Homelessness is one possible outcome of the squeeze between increasing housing costs and
low income. There were about 3,000 homeless people in Edmonton in 2008, up from around 750
a decade earlier. Most of the homeless are single men, but some are single women and an
estimated eight percent families.14 In addition to a lack of affordable housing, homelessness is
also affected, among other, by poverty, mental health issues, and addictions.
3.2.3 Safety
Concerns about safety are real for many people, especially the elderly. However, on a
community level, Edmonton is increasingly safe. Both the volume and severity of crime is down
in the Edmonton region and Canada. Edmonton has, however, an above average number of
violent crimes relative to other metropolitan areas.15
13 The Low Income Cut Off or LICO is the threshold income below which a family is likely to spend a larger share of its
income than the average family on necessities (food, shelter and clothing. LICO is the income at which a family spends 20 percentage points more than the average family on food, shelter and clothing.
14 Edmonton Committee to End Homelessness, 2009. A Place to Call Home. 15 Statistics Canada 2009. Police Reported Crime Statistics in Canada. Catalogue 85-002-X.
- 27 -
0
2,000
4,000
6,000
8,000
Rate per 100,000 population
Violent and Property Crime
Violent Crime AB Violent Crime Edmonton
Property Crime Alberta Property Crime Edmonton
Source: Statistics Canada, CanSim Table 252-0013
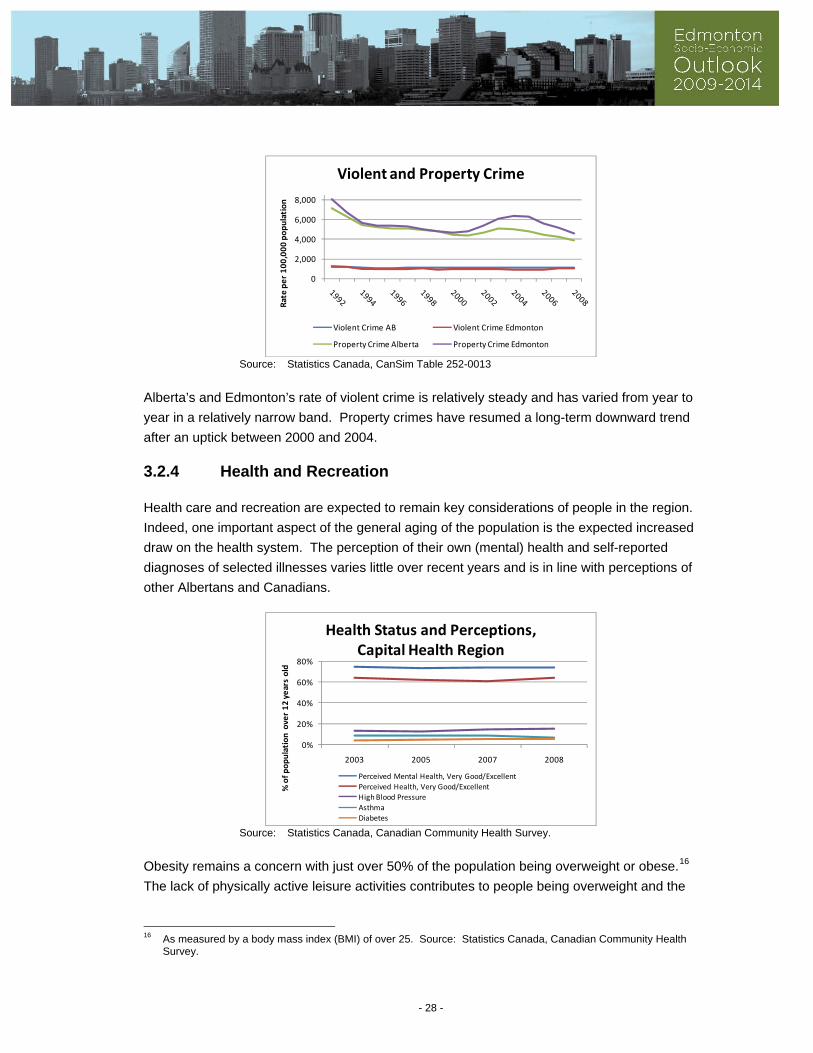
Alberta’s and Edmonton’s rate of violent crime is relatively steady and has varied from year to
year in a relatively narrow band. Property crimes have resumed a long-term downward trend
after an uptick between 2000 and 2004.
3.2.4 Health and Recreation
Health care and recreation are expected to remain key considerations of people in the region.
Indeed, one important aspect of the general aging of the population is the expected increased
draw on the health system. The perception of their own (mental) health and self-reported
diagnoses of selected illnesses varies little over recent years and is in line with perceptions of
other Albertans and Canadians.
0%
20%
40%
60%
80%
2003 2005 2007 2008
% of population over 12 years old
Health Status and Perceptions,Capital Health Region
Perceived Mental Health, Very Good/Excellent
Perceived Health, Very Good/Excellent
High Blood Pressure
Asthma
Diabetes Source: Statistics Canada, Canadian Community Health Survey.
Obesity remains a concern with just over 50% of the population being overweight or obese.16
The lack of physically active leisure activities contributes to people being overweight and the
16 As measured by a body mass index (BMI) of over 25. Source: Statistics Canada, Canadian Community Health
Survey.
- 28 -
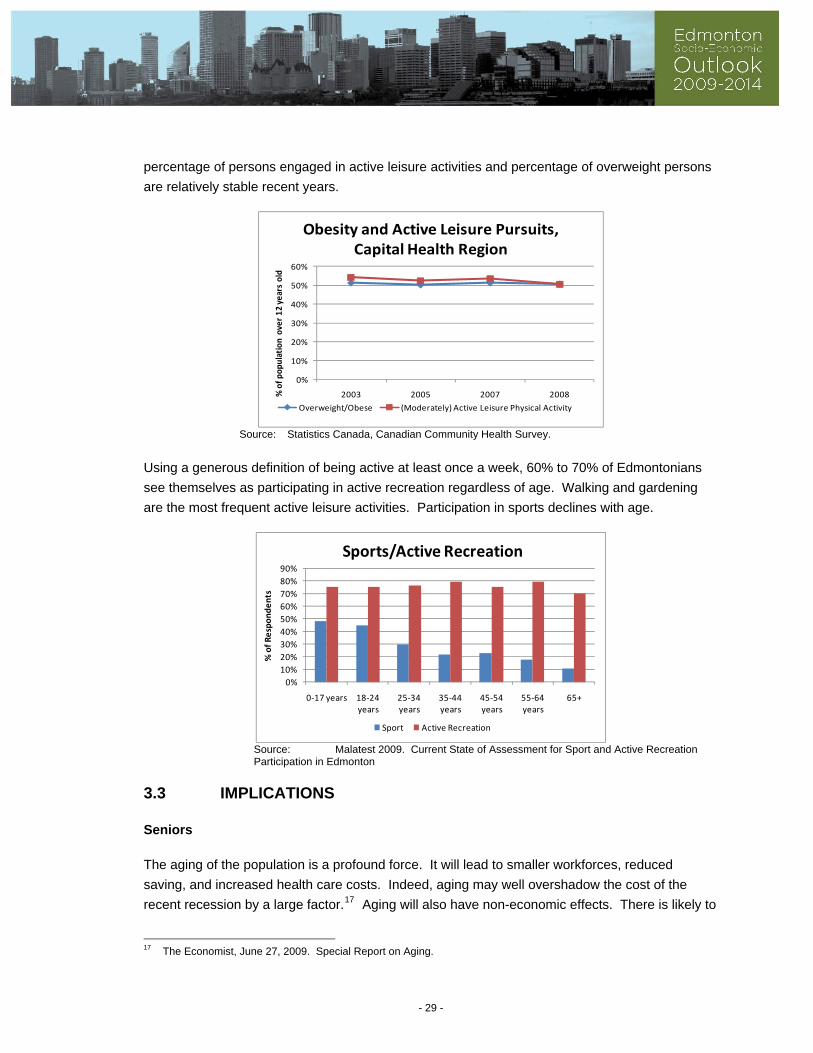
percentage of persons engaged in active leisure activities and percentage of overweight persons
are relatively stable recent years.
0%
10%
20%
30%
40%
50%
60%
2003 2005 2007 2008% of population over 12 years old
Obesity and Active Leisure Pursuits,Capital Health Region
Overweight/Obese (Moderately) Active Leisure Physical Activity
Source: Statistics Canada, Canadian Community Health Survey.
Using a generous definition of being active at least once a week, 60% to 70% of Edmontonians
see themselves as participating in active recreation regardless of age. Walking and gardening
are the most frequent active leisure activities. Participation in sports declines with age.
0%
10%
20%
30%
40%
50%
60%
70%
80%
90%
0‐17 years 18‐24 years
25‐34 years
35‐44 years
45‐54 years
55‐64 years
65+
% of Respondents
Sports/Active Recreation
Sport Active Recreation
Source: Malatest 2009. Current State of Assessment for Sport and Active Recreation Participation in Edmonton
3.3 IMPLICATIONS
Seniors
The aging of the population is a profound force. It will lead to smaller workforces, reduced
saving, and increased health care costs. Indeed, aging may well overshadow the cost of the
recent recession by a large factor.17 Aging will also have non-economic effects. There is likely to
17 The Economist, June 27, 2009. Special Report on Aging.
- 29 -

be a move towards smaller, more accessible, and more centrally-located housing. Access to
health care will increase in importance and recreational pursuits will shift towards those that can
be done when older.
The implications of aging will be starting to be felt in the Alberta and Edmonton region economy
during the forecast period. However, relatively strong in-migration of mostly younger people and
the retention of older workers who need to save more for retirement are likely to mute the
economic effect for the private sector. The public sector, where defined benefits pension plans
have shielded near-retirement baby boomers from some of the effect of the recession, may start
to see the effects in the composition of its workforce.
Diversity
Maintaining economic growth in the context of an aging population means the need to attract
persons from currently under-represented groups into the workforce and stimulate in-migrants.
Increasingly that means more diversity and work places will need to become more inclusive and
more accommodating of cultural differences.
Aboriginal People
Aboriginal people are one group that is currently under-represented in the workforce. It is also a
growing group, reflecting a young population and a high birth rate. There are economic and
social drivers to facilitate more involvement of Aboriginal people in the workforce. It also poses a
number of challenges. Most jobs require at least some post secondary education and Aboriginal
people as a group have lower education levels than Albertans.
Youth
Ultimately increased productivity will need to resolve the countervailing forces of economic growth
and a shrinking work force. Education will, therefore, be a key element of labour force
development. Continuing education notwithstanding, youths are the focus of most education
initiatives. Edmonton has a strong track record with regards to technical and college-level
education. However, it trails competing metropolitan areas in Canada with respect to a
university-educated labour force. This will dampen the region’s ability to compete in an
increasingly knowledge-based economy.
Environment
The emerging green shift among consumers is likely to influence how people in the region will
interact with local and provincial governments. Increasingly, environmental considerations will
need to be incorporated in decision making in such areas as land use, neighbourhood, and
- 30 -
- 31 -
transportation planning. Over time and likely outside the forecast period, the green shift is likely
to favour more intensive urban growth over extensive sub-urban growth.
However, the biggest impact of the increased emphasis on the environment will be on economic
growth. In the near term, and including the forecast period, increased regulation and possible
trade barriers are likely to increase the costs of doing business for all sectors of the economy, but
especially for the oil and gas industry. That means less economic growth than otherwise would
have been the case. Beyond the forecast period and assuming a structural adjustment of the
economy, the focus on the environment may well create new economic opportunities.

APPENDIX A
MONTHLY INDICATOR TABLE
32
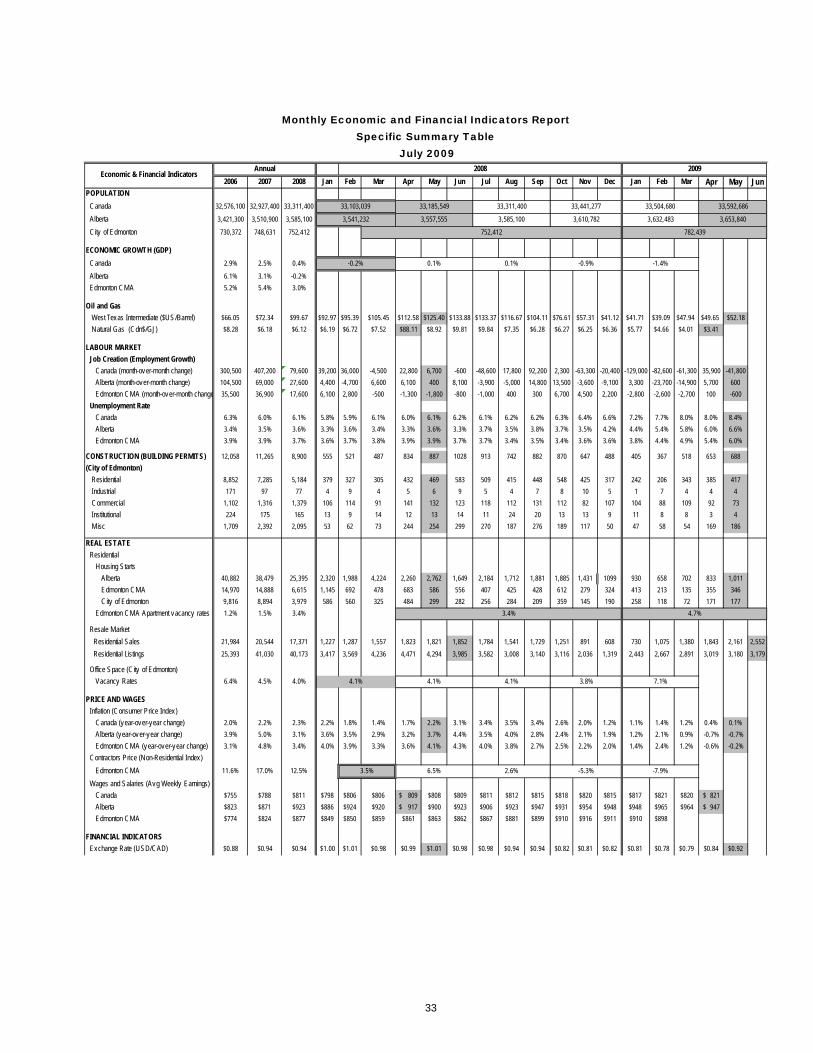
2006 2007 2008 Jan Feb Mar Apr May Jun Jul Aug Sep Oct Nov Dec Jan Feb Mar Apr May JunPOPULATION
Canada 32,576,100 32,927,400 33,311,400
Alberta 3,421,300 3,510,900 3,585,100
City of Edmonton 730,372 748,631 752,412
ECONOMIC GROWTH (GDP)
Canada 2.9% 2.5% 0.4%
Alberta 6.1% 3.1% -0.2%
Edmonton CMA 5.2% 5.4% 3.0%
Oil and Gas
West Texas Intermediate ($US/Barrel) $66.05 $72.34 $99.67 $92.97 $95.39 $105.45 $112.58 $125.40 $133.88 $133.37 $116.67 $104.11 $76.61 $57.31 $41.12 $41.71 $39.09 $47.94 $49.65 $52.18
Natural Gas (Cdn$/GJ) $8.28 $6.18 $6.12 $6.19 $6.72 $7.52 $88.11 $8.92 $9.81 $9.84 $7.35 $6.28 $6.27 $6.25 $6.36 $5.77 $4.66 $4.01 $3.41
LABOUR MARKET
Job Creation (Employment Growth)
Canada (month-over-month change) 300,500 407,200 79,600 39,200 36,000 -4,500 22,800 6,700 -600 -48,600 17,800 92,200 2,300 -63,300 -20,400 -129,000 -82,600 -61,300 35,900 -41,800
Alberta (month-over-month change) 104,500 69,000 27,600 4,400 -4,700 6,600 6,100 400 8,100 -3,900 -5,000 14,800 13,500 -3,600 -9,100 3,300 -23,700 -14,900 5,700 600
Edmonton CMA (month-over-month change 35,500 36,900 17,600 6,100 2,800 -500 -1,300 -1,800 -800 -1,000 400 300 6,700 4,500 2,200 -2,800 -2,600 -2,700 100 -600
Unemployment Rate
Canada 6.3% 6.0% 6.1% 5.8% 5.9% 6.1% 6.0% 6.1% 6.2% 6.1% 6.2% 6.2% 6.3% 6.4% 6.6% 7.2% 7.7% 8.0% 8.0% 8.4%
Alberta 3.4% 3.5% 3.6% 3.3% 3.6% 3.4% 3.3% 3.6% 3.3% 3.7% 3.5% 3.8% 3.7% 3.5% 4.2% 4.4% 5.4% 5.8% 6.0% 6.6%
Edmonton CMA 3.9% 3.9% 3.7% 3.6% 3.7% 3.8% 3.9% 3.9% 3.7% 3.7% 3.4% 3.5% 3.4% 3.6% 3.6% 3.8% 4.4% 4.9% 5.4% 6.0%
CONSTRUCTION (BUILDING PERMITS) 12,058 11,265 8,900 555 521 487 834 887 1028 913 742 882 870 647 488 405 367 518 653 688
(City of Edmonton)
Residential 8,852 7,285 5,184 379 327 305 432 469 583 509 415 448 548 425 317 242 206 343 385 417
Industrial 171 97 77 4 9 4 5 6 9 5 4 7 8 10 5 1 7 4 4 4
Commercial 1,102 1,316 1,379 106 114 91 141 132 123 118 112 131 112 82 107 104 88 109 92 73
Institutional 224 175 165 13 9 14 12 13 14 11 24 20 13 13 9 11 8 8 3 4
Misc 1,709 2,392 2,095 53 62 73 244 254 299 270 187 276 189 117 50 47 58 54 169 186
REAL ESTATE
Residential
Housing Starts
Alberta 40,882 38,479 25,395 2,320 1,988 4,224 2,260 2,762 1,649 2,184 1,712 1,881 1,885 1,431 1099 930 658 702 833 1,011
Edmonton CMA 14,970 14,888 6,615 1,145 692 478 683 586 556 407 425 428 612 279 324 413 213 135 355 346
City of Edmonton 9,816 8,894 3,979 586 560 325 484 299 282 256 284 209 359 145 190 258 118 72 171 177
Edmonton CMA Apartment vacancy rates 1.2% 1.5% 3.4%
Resale Market
Residential Sales 21,984 20,544 17,371 1,227 1,287 1,557 1,823 1,821 1,852 1,784 1,541 1,729 1,251 891 608 730 1,075 1,380 1,843 2,161 2,552
Residential Listings 25,393 41,030 40,173 3,417 3,569 4,236 4,471 4,294 3,985 3,582 3,008 3,140 3,116 2,036 1,319 2,443 2,667 2,891 3,019 3,180 3,179
Office Space (City of Edmonton)
Vacancy Rates 6.4% 4.5% 4.0%
PRICE AND WAGES
Inflation (Consumer Price Index)
Canada (year-over-year change) 2.0% 2.2% 2.3% 2.2% 1.8% 1.4% 1.7% 2.2% 3.1% 3.4% 3.5% 3.4% 2.6% 2.0% 1.2% 1.1% 1.4% 1.2% 0.4% 0.1%
Alberta (year-over-year change) 3.9% 5.0% 3.1% 3.6% 3.5% 2.9% 3.2% 3.7% 4.4% 3.5% 4.0% 2.8% 2.4% 2.1% 1.9% 1.2% 2.1% 0.9% -0.7% -0.7%
Edmonton CMA (year-over-year change) 3.1% 4.8% 3.4% 4.0% 3.9% 3.3% 3.6% 4.1% 4.3% 4.0% 3.8% 2.7% 2.5% 2.2% 2.0% 1.4% 2.4% 1.2% -0.6% -0.2%
Contractors Price (Non-Residential Index)
Edmonton CMA 11.6% 17.0% 12.5%
Wages and Salaries (Avg Weekly Earnings)
Canada $755 $788 $811 $798 $806 $806 809$ $808 $809 $811 $812 $815 $818 $820 $815 $817 $821 $820 821$
Alberta $823 $871 $923 $886 $924 $920 917$ $900 $923 $906 $923 $947 $931 $954 $948 $948 $965 $964 947$
Edmonton CMA $774 $824 $877 $849 $850 $859 $861 $863 $862 $867 $881 $899 $910 $916 $911 $910 $898
FINANCIAL INDICATORS
Exchange Rate (USD/CAD) $0.88 $0.94 $0.94 $1.00 $1.01 $0.98 $0.99 $1.01 $0.98 $0.98 $0.94 $0.94 $0.82 $0.81 $0.82 $0.81 $0.78 $0.79 $0.84 $0.92
33,185,549
2008
33,592,686
3,653,840
782,439
3.4%
3,585,100
-1.4%0.1%0.1%
3,610,782
752,412
3,541,232
33,441,277
3,557,555
Monthly Economic and Financial Indicators ReportSpecific Summary Table
July 20092009
Economic & Financial IndicatorsAnnual
-7.9%
7.1%
4.7%
-5.3%
33,103,039
3,632,483
-0.2% -0.9%
33,504,68033,311,400
4.1% 3.8%
3.5%
4.1% 4.1%
6.5% 2.6%
33

APPENDIX B
MOST LIKELY SCENARIO FORECASTED VALUES, SELECTED INDICATORS
34
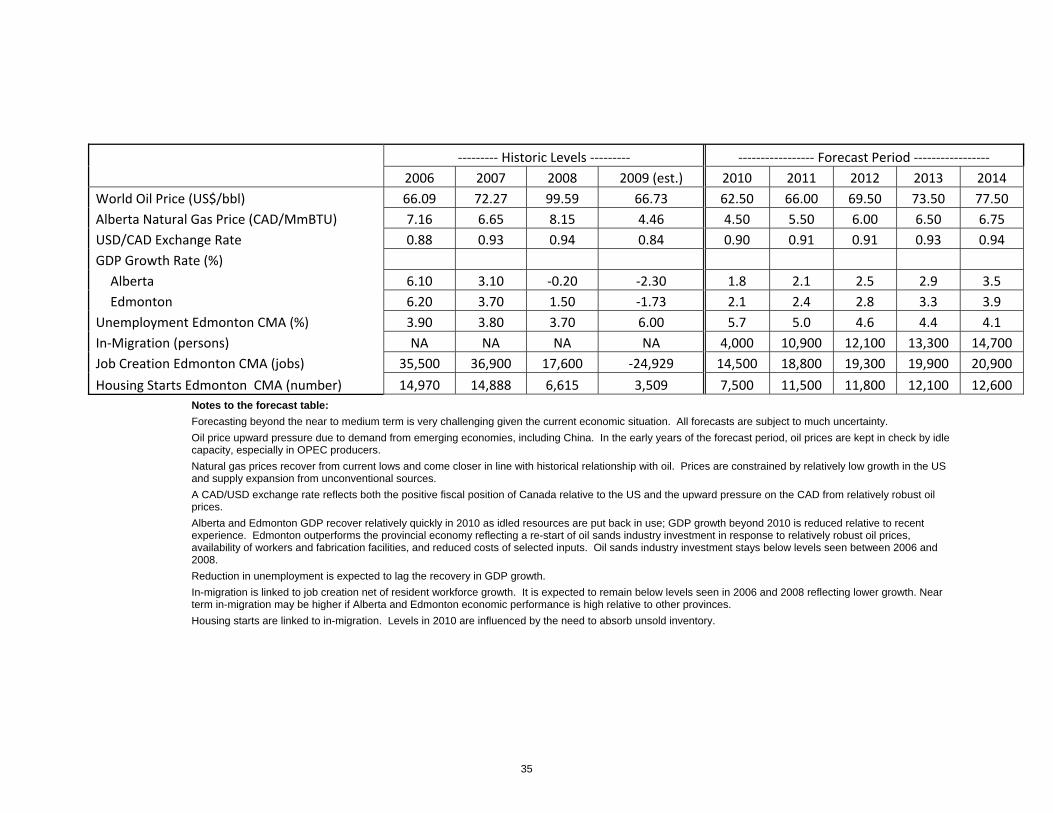
‐‐‐‐‐‐‐‐‐ Historic Levels ‐‐‐‐‐‐‐‐‐ ‐‐‐‐‐‐‐‐‐‐‐‐‐‐‐‐‐ Forecast Period ‐‐‐‐‐‐‐‐‐‐‐‐‐‐‐‐‐
2006 2007 2008 2009 (est.) 2010 2011 2012 2013 2014
World Oil Price (US$/bbl) 66.09 72.27 99.59 66.73 62.50 66.00 69.50 73.50 77.50
Alberta Natural Gas Price (CAD/MmBTU) 7.16 6.65 8.15 4.46 4.50 5.50 6.00 6.50 6.75
USD/CAD Exchange Rate 0.88 0.93 0.94 0.84 0.90 0.91 0.91 0.93 0.94
GDP Growth Rate (%)
Alberta 6.10 3.10 ‐0.20 ‐2.30 1.8 2.1 2.5 2.9 3.5
Edmonton 6.20 3.70 1.50 ‐1.73 2.1 2.4 2.8 3.3 3.9
Unemployment Edmonton CMA (%) 3.90 3.80 3.70 6.00 5.7 5.0 4.6 4.4 4.1
In‐Migration (persons) NA NA NA NA 4,000 10,900 12,100 13,300 14,700
Job Creation Edmonton CMA (jobs) 35,500 36,900 17,600 ‐24,929 14,500 18,800 19,300 19,900 20,900
Housing Starts Edmonton CMA (number) 14,970 14,888 6,615 3,509 7,500 11,500 11,800 12,100 12,600
Notes to the forecast table:
Forecasting beyond the near to medium term is very challenging given the current economic situation. All forecasts are subject to much uncertainty.
Oil price upward pressure due to demand from emerging economies, including China. In the early years of the forecast period, oil prices are kept in check by idle capacity, especially in OPEC producers.
Natural gas prices recover from current lows and come closer in line with historical relationship with oil. Prices are constrained by relatively low growth in the US and supply expansion from unconventional sources.
A CAD/USD exchange rate reflects both the positive fiscal position of Canada relative to the US and the upward pressure on the CAD from relatively robust oil prices.
Alberta and Edmonton GDP recover relatively quickly in 2010 as idled resources are put back in use; GDP growth beyond 2010 is reduced relative to recent experience. Edmonton outperforms the provincial economy reflecting a re-start of oil sands industry investment in response to relatively robust oil prices, availability of workers and fabrication facilities, and reduced costs of selected inputs. Oil sands industry investment stays below levels seen between 2006 and 2008.
Reduction in unemployment is expected to lag the recovery in GDP growth.
In-migration is linked to job creation net of resident workforce growth. It is expected to remain below levels seen in 2006 and 2008 reflecting lower growth. Near term in-migration may be higher if Alberta and Edmonton economic performance is high relative to other provinces.
Housing starts are linked to in-migration. Levels in 2010 are influenced by the need to absorb unsold inventory.
35