african socio-economic outlook - african development … · african socio-economic outlook ......
TRANSCRIPT

African Socio-Economic Outlook
Overview of Bank Group Operations
Financial Profile & Capital Market Activities
1
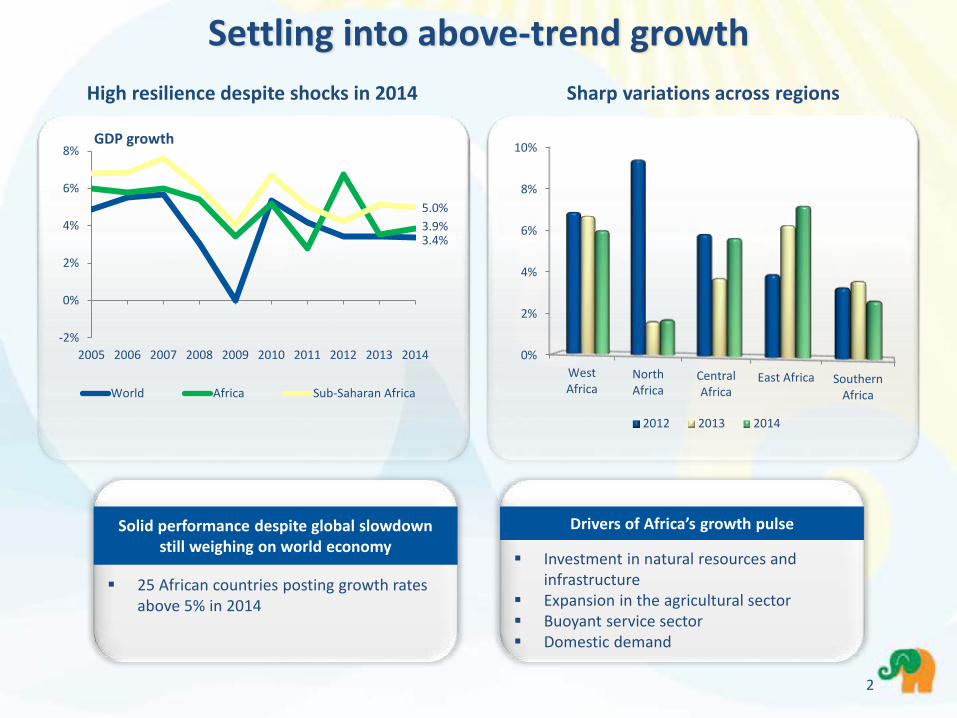
High resilience despite shocks in 2014 Sharp variations across regions
Solid performance despite global slowdown still weighing on world economy
25 African countries posting growth rates above 5% in 2014
Drivers of Africa’s growth pulse
Investment in natural resources and infrastructure
Expansion in the agricultural sector Buoyant service sector Domestic demand
3.4%3.9%
5.0%
-2%
0%
2%
4%
6%
8%
2005 2006 2007 2008 2009 2010 2011 2012 2013 2014
GDP growth
World Africa Sub-Saharan Africa
Settling into above-trend growth
0%
2%
4%
6%
8%
10%
WestAfrica
NorthAfrica
CentralAfrica
East Africa SouthernAfrica
2012 2013 2014
2

Wide disparities in growth
Solid performance in spite of the onset of Ebola (GDP loss of USD 1.6 billion for the 3 most affected countries) and declining oil prices. Côte d’Ivoire, 8.3%, highest growth rate of the region; Nigeria, 6.3%, more diversified economy and service sector doubled after GDP rebalancing; Benin, Mali, Niger, Sierra Leone and Togo with growth rates above 5%
West Africa: 6.0%
Strongest region, propelled by Ethiopia at 10.3%, Rwanda at 7.0%, and Tanzania at 7.2%. Djibouti, Uganda and Kenya also performing well with growth rates above 5%. South Sudan: Resumption of oil production driving blistering growth at 30.7%
East Africa: 7.1%
Central Africa: 5.6% Sluggish growth in South Africa, 1.5%, due to structural bottlenecks, tense industrial relations, and low investor and consumer confidenceGrowth rates above 5% in Botswana, Malawi, Mozambique and Namibia
Southern Africa: 2.7%
Considerable resilience to shocks supported by higher agricultural production, infrastructure investments and mining output in DRC, 8.9%, and the expansion of non-oil sector in Gabon, 5.1%. Cameroon, Chad and Congo with growth rates above 5%
Recovery on course despite complex socio-economic and political conditions:
North Africa: 1.7%
- Algeria: 4%, resurgence of growth- Tunisia: 2.4%, led by a smooth transition
- Libya: -19.8%, continued instability
- Mauritania: 6.4%, highest in the region
3

Africa’s share of global economy likely to increase
Note: GDP rebasing involves replacing the old base year used for compiling the constant price estimates to a new and more recent base year 4
Nigeria GDP doubled to USD
549 billion, making it the
continent’s largest economy
Kenya economy
expanded by 25% to USD
55 billion
Tanzania GDP 28% higher at USD 41
billion
Uganda GDP 13% higher at USD 27
billion
Zambia GDP 25% higher at USD 17 billion
Some African countries have rebased their economies to take into account changing structures

Lower commodity prices, fiscal vulnerabilities
-8%
-4%
0%
4%
8%
12%
Fiscal Balance (% GDP)Current Account Balance (% GDP)Inflation
* Expected
Inflation high but stable,fiscal and current account vulnerabilities
Softer commodity prices keeping inflation in check
* March 2015
30
60
90
120
150
180
Energy Agriculture Food Metals/Minerals
*
5
Measures implemented to align budgetary expenses with the reality of falling oil revenues
Fiscal tensions in oil-exporting countries leading to reduced fiscal buffers and limited scope for policy response
Current account balances pressured by: Strong demand for capital
goods due to public and private spending on infrastructure
Weaker prices and lower external demand, particularly from China, weighing down on export receipts
Prices rebased to 100 in 2010
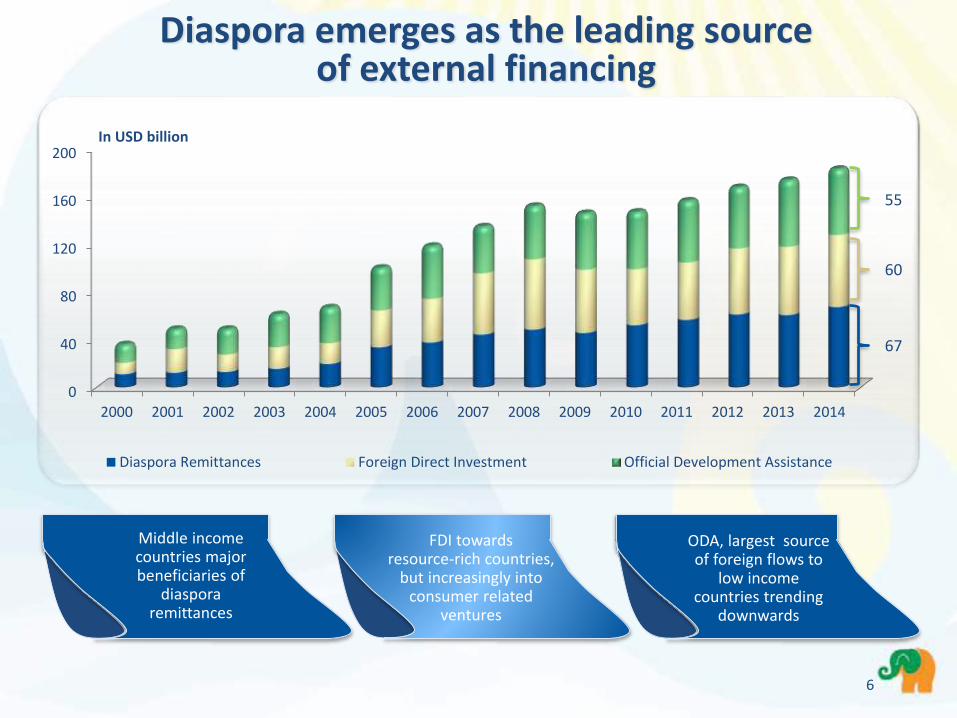
Diaspora emerges as the leading source of external financing
Middle income countries major beneficiaries of
diaspora remittances
FDI towards resource-rich countries,
but increasingly into consumer related
ventures
ODA, largest source of foreign flows to
low income countries trending
downwards
0
40
80
120
160
200
2000 2001 2002 2003 2004 2005 2006 2007 2008 2009 2010 2011 2012 2013 2014
Diaspora Remittances Foreign Direct Investment Official Development Assistance
In USD billion
55
67
60
6

Stronger domestic demand Natural resource investments Increased infrastructure investments Expansion of the agricultural sector Improved public financial management Moderate public expenditure growth as many
countries rein-in government spending and expand fiscal buffers
Strong private sector consumption
Favorable medium term outlook driven by
Lower commodity prices Tightening financial conditions Fiscal vulnerabilities on the basis of optimistic
revenues from recurrent expenditures and elections
Security risks
….with some headwinds
Africa expected to remain the second fastest growing continent after Asia
5%
4.5%
3.9%
Growing concerns about the quality and inclusiveness of Africa’s growth as income
inequality widens and poverty remains widespread
7

Best performersGoals
Goal 3: Promote gender equality and empower women
Angola, Botswana, Ethiopia, The Gambia, Ghana, Mauritius, Mozambique, Rwanda, São Tomé and Príncipe, Seychelles, South Africa
Goal 2: Achieve universal primary education
Algeria, Egypt, Ghana, Morocco, Rwanda, São Tomé and Príncipe, Tanzania, Zambia
Goal 6: Combat HIV/AIDS, malaria and other diseases
Algeria, Botswana, Cabo Verde, Comoros, Côte d’Ivoire, Egypt, Libya, Mauritius, Namibia, Rwanda, São Tomé and Príncipe, South Africa, Sudan, Tunisia, Zimbabwe
Areas of most progress
Africa’s Millenium Development Goals Performance
8

Goal 4: Reduce child mortality
Egypt, Ethiopia, Liberia, Libya, Malawi, Rwanda, Seychelles, Tanzania, Tunisia
Goal 5: Improve maternal health
Egypt, Equatorial Guinea, Eritrea, Ghana, Guinea-Bissau, Libya, Mauritius, Rwanda, São Tomé and Príncipe, South Africa, Swaziland, Tunisia
Goal 7: Ensure environmental sustainability
Algeria, Botswana, Burkina Faso, Comoros, Egypt,Ethiopia, Gabon, Libya, Mali, Mauritius, Morocco, Namibia, Nigeria, Swaziland
Goal 1: Eradicate extreme poverty and hunger
Algeria, Benin, Burkina Faso, Egypt, Ethiopia, Gabon, Ghana, Guinea, Guinea-Bissau, Mali, Morocco, South Africa, Togo, Tunisia, Zimbabwe
Goal 8: Global partnership for development
Kenya, Libya, Rwanda, Seychelles, Sudan, Uganda, Zambia
Areas of least progress
Africa’s Millenium Development Goals Performance
Best performersGoals
9
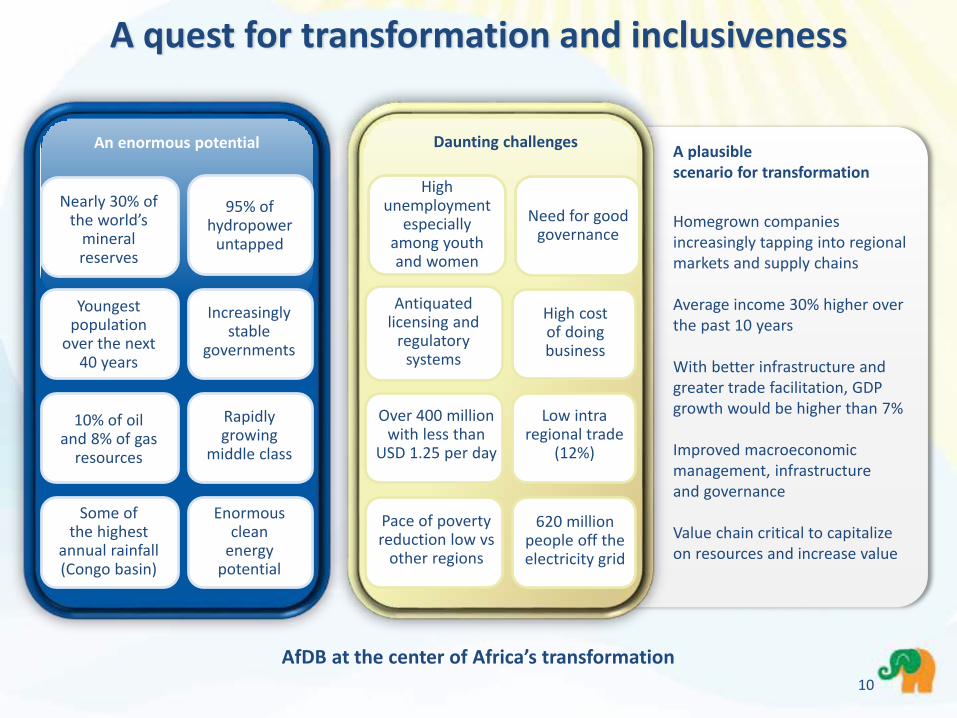
AfDB at the center of Africa’s transformation
A quest for transformation and inclusiveness
Homegrown companies increasingly tapping into regional markets and supply chains
Average income 30% higher over the past 10 years
With better infrastructure and greater trade facilitation, GDP growth would be higher than 7%
Improved macroeconomic management, infrastructure and governance
Value chain critical to capitalize on resources and increase value
An enormous potential Daunting challenges
Nearly 30% of the world’s
mineral reserves
Youngest population
over the next 40 years
10% of oil and 8% of gas
resources
Some of the highest
annual rainfall (Congo basin)
Enormousclean
energypotential
Rapidly growing
middle class
Increasingly stable
governments
95% of hydropower
untapped
A plausible scenario for transformation
620 million people off the electricity grid
Low intra regional trade
(12%)
High cost of doing business
Need for good governance
Antiquatedlicensing and
regulatory systems
Over 400 million with less than
USD 1.25 per day
Pace of poverty reduction low vs
other regions
High unemployment
especially among youth and women
10
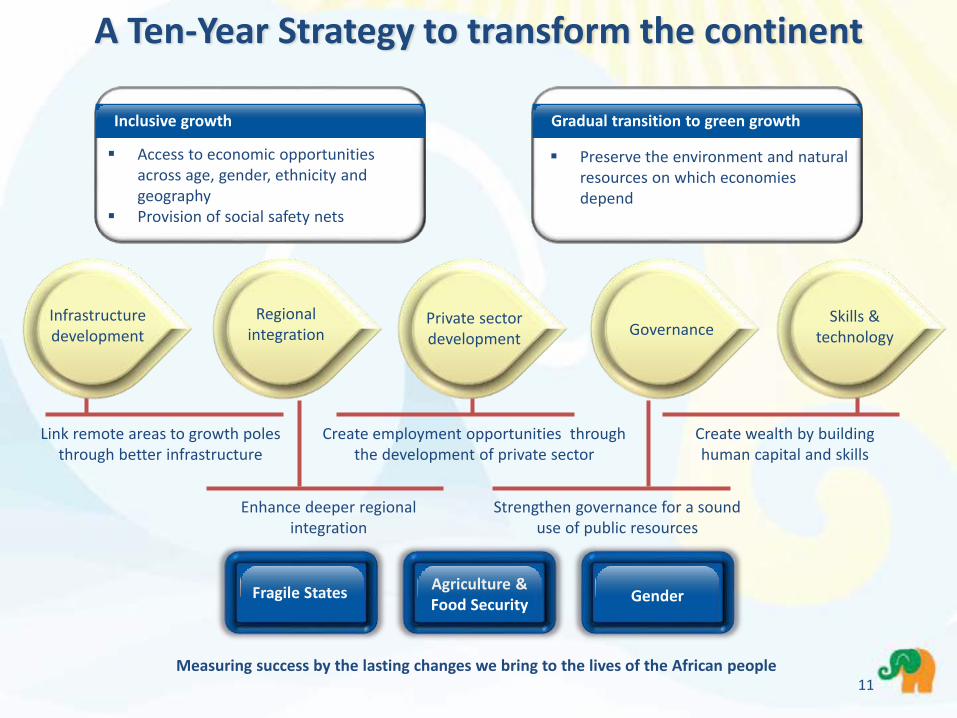
Measuring success by the lasting changes we bring to the lives of the African people
Link remote areas to growth poles through better infrastructure
Create employment opportunities through the development of private sector
Create wealth by building human capital and skills
Private sector development
GovernanceSkills &
technology
Infrastructure development
Regional integration
Enhance deeper regional integration
Strengthen governance for a sound use of public resources
Fragile StatesAgriculture & Food Security
Gender
A Ten-Year Strategy to transform the continent
Access to economic opportunities across age, gender, ethnicity and geography
Provision of social safety nets
Inclusive growth
Preserve the environment and natural resources on which economies depend
Gradual transition to green growth
11

African Socio-Economic Outlook
Financial Profile & Capital Market Activities
12
Overview of Bank Group Operations

0
1 500
3 000
4 500
6 000
7 500
9 000
10 500
12 000
2005 2006 2007 2008 2009 2010 2011 2012 2013 2014
3,2743,896
4,8235,348
12,590
6,219
8,476
6,103 6,3176,954
Total approvals
In USD million
AfDB disbursements ADF disbursements
Operations doubled over the past decade
13
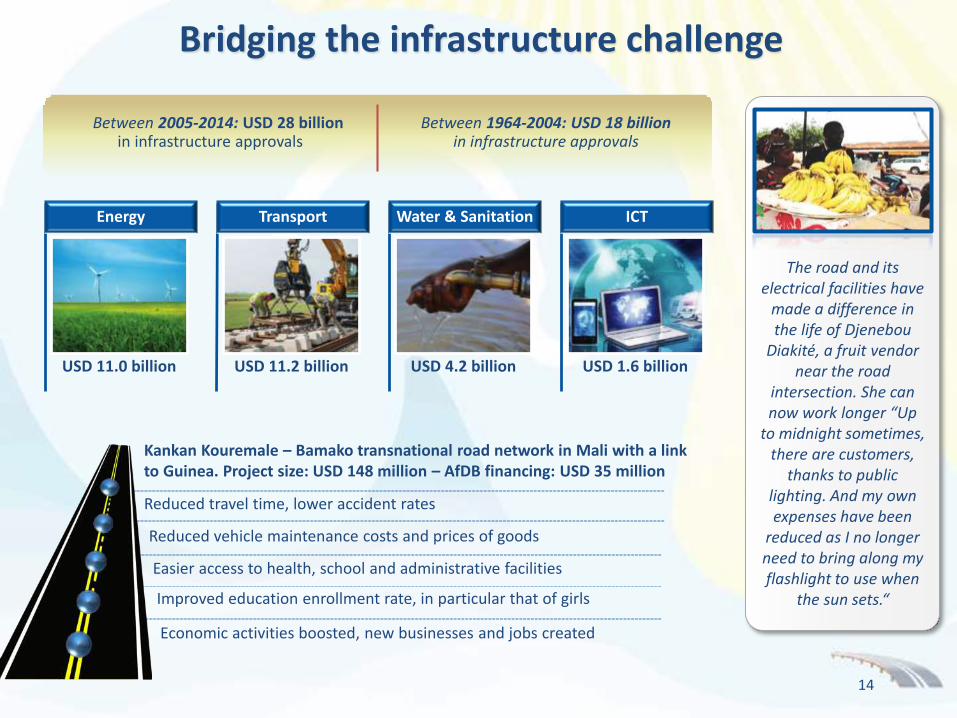
Bridging the infrastructure challenge
Reduced travel time, lower accident rates
Reduced vehicle maintenance costs and prices of goods
Easier access to health, school and administrative facilities
Improved education enrollment rate, in particular that of girls
Economic activities boosted, new businesses and jobs created
Kankan Kouremale – Bamako transnational road network in Mali with a link to Guinea. Project size: USD 148 million – AfDB financing: USD 35 million
14
The road and its electrical facilities have
made a difference in the life of Djenebou
Diakité, a fruit vendor near the road
intersection. She can now work longer “Up
to midnight sometimes, there are customers,
thanks to public lighting. And my own expenses have been
reduced as I no longer need to bring along my flashlight to use when
the sun sets.“
Between 2005-2014: USD 28 billion in infrastructure approvals
Between 1964-2004: USD 18 billion in infrastructure approvals
USD 11.0 billion
Energy
USD 11.2 billion
Transport
USD 4.2 billion
Water & Sanitation
USD 1.6 billion
ICT

Energy to fuel economic inclusion
Kenya Last Mile Connectivity
Project cost USD 143 million with AfDBfinancing USD 130
million
Improve electricity access to over 1 million people
Improve household education, health and access to information
Benefit populations in rural areas, low income groups and small businesses
Angola Power Sector Reform
Program, USD 935 million
Improve the power sector regulatory environment
Expand access to electricity for the local population, particularly rural dwellers (45.2% of population) at an affordable cost
Half of Africa’s infrastructure needs are in electric power
Majority of countries facing regular power outages at an economic cost of 1% to 2% of GDP per annum
USD 1.9 billion energy projects approved in 2014
Committed to providing reliable and affordable energy supply
15

Tapping water for the benefit of all
16
USD 1.9 billion for 49 projects in 33 countries
Provided access to water supply for more than 107 million people and access to improved
sanitation services for more than 72 million people
Rural Water Supply and Sanitation Initiative
Promotes effective water management policies and
practices
Operationalizes the Bank’s Integrated Water Resources
Management Policy in member countries
Multi-Donor Water Partnership Program
Project preparation activitieswill improve sanitation facilities
for 3 million people and drinking water resources for 2.4 million people
About 2 million people have improved access to water for
multiple uses
African Water Facility
USD 2.0 billion for 49 projects for enhanced efficiency, sustainability and access
to water
Providing waste watertreatment and reuse
Urban Water Supply and Sanitation
Achievements and results in the water sector over
the past 10 years

2000
Fewer than 20 million fixed
phone lines in Africa (2% penetration rate)
2013
Over 823 million mobile phone subscriptions –more than either the United States or the
European Union
More than 60% of the population now
has access to telephone services
Africa has leap-frogged landline
development and gone straight to mobile networks
Gateway to financial systems, government services and the wider world
Extending ICT to underserved areas and expanding broadband infrastructure
Creating an enabling environment for affordable connectivity
Scaling ICT applications to transform public service delivery and regional integration.
Information and Communication Technology, an African success story
2000 2013 Now
17
AfDB commitments
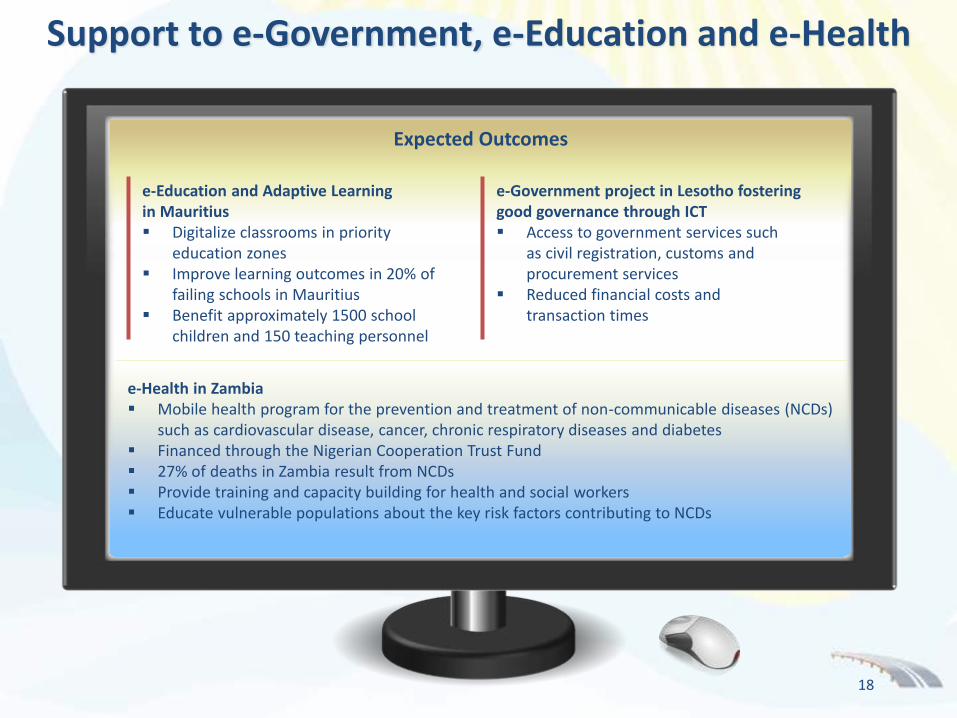
Expected Outcomes
Support to e-Government, e-Education and e-Health
e-Education and Adaptive Learning in Mauritius Digitalize classrooms in priority
education zones Improve learning outcomes in 20% of
failing schools in Mauritius Benefit approximately 1500 school
children and 150 teaching personnel
e-Government project in Lesotho fostering good governance through ICT Access to government services such
as civil registration, customs and procurement services
Reduced financial costs and transaction times
e-Health in Zambia Mobile health program for the prevention and treatment of non-communicable diseases (NCDs)
such as cardiovascular disease, cancer, chronic respiratory diseases and diabetes Financed through the Nigerian Cooperation Trust Fund 27% of deaths in Zambia result from NCDs Provide training and capacity building for health and social workers Educate vulnerable populations about the key risk factors contributing to NCDs
18

Innovative vehicle for financing game changing infrastructure in Africa to support economic transformation
Aims to create USD 100 billion of project opportunities for global market players
AfDB provided USD 128 million seed capital
USD 500 million of financing commitments secured
African institutional and private investors and non-African
investors
Incorporated in Morocco in 2014 25 projects across Africa in the pipeline
AfDB concept creator, designer, anchor investor and promoter
Africa50, building the Africa of the 21st century
Business opportunities Commercial returns
Rigor of private sector Convening power of AfDB Political commitment of African
governments
Target capitalization of USD 1 billion in the short term and USD 3 billion in the medium term
19

The Sahel Program Approved in 2014 and centered on building climate resilience,
regional integration and trade facilitation through infrastructure development and capacity building in Burkina Faso, Chad, Gambia, Mali, Mauritania, Niger, and Senegal
Addresses fragility and builds the resilience of vulnerable populations against food and nutrition insecurity while promoting regional integration
Since 2010, Intra-African trade up 18% to USD 148 billion
Represents 12% of total exports vs 25% in Southeast Asia, 49% in North America and 65% in the European Union
Achievements over the past decade… More than 70 multinational
projects financed for USD 3.8 billion
Spearheading public-private partnership in infrastructure development
Creating larger and more attractive markets
African Export-Import Bank USD 262 million approved in
2014 to cover lines of credit, trade finance and risk participation
Promotes intra-African and extra-African trade
Regional integration strategy and policy
Regional integration for Africa’s full growth potential
20
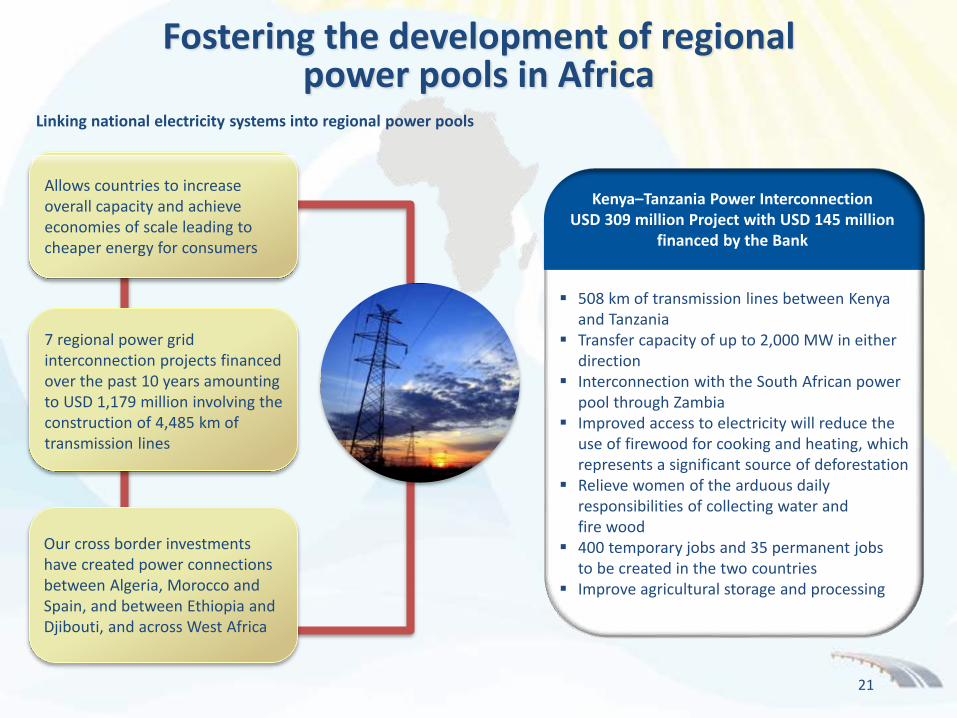
508 km of transmission lines between Kenya and Tanzania
Transfer capacity of up to 2,000 MW in either direction
Interconnection with the South African power pool through Zambia
Improved access to electricity will reduce the use of firewood for cooking and heating, which represents a significant source of deforestation
Relieve women of the arduous daily responsibilities of collecting water and fire wood
400 temporary jobs and 35 permanent jobs to be created in the two countries
Improve agricultural storage and processing
Kenya–Tanzania Power Interconnection USD 309 million Project with USD 145 million
financed by the Bank
Linking national electricity systems into regional power pools
Allows countries to increase overall capacity and achieve economies of scale leading to cheaper energy for consumers
7 regional power grid interconnection projects financed over the past 10 years amounting to USD 1,179 million involving the construction of 4,485 km of transmission lines
Our cross border investments have created power connections between Algeria, Morocco and Spain, and between Ethiopia and Djibouti, and across West Africa
Fostering the development of regional power pools in Africa
21
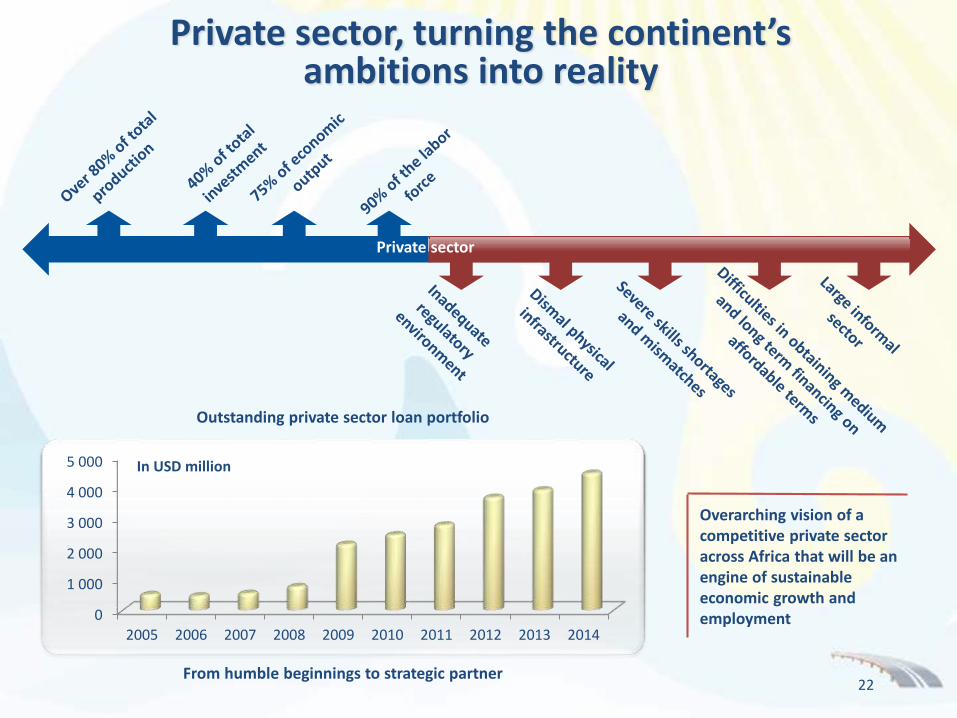
Outstanding private sector loan portfolio
Overarching vision of a competitive private sector across Africa that will be an engine of sustainable economic growth and employment
From humble beginnings to strategic partner
Private sector, turning the continent’s ambitions into reality
0
1 000
2 000
3 000
4 000
5 000
2005 2006 2007 2008 2009 2010 2011 2012 2013 2014
In USD million
22
Private sector
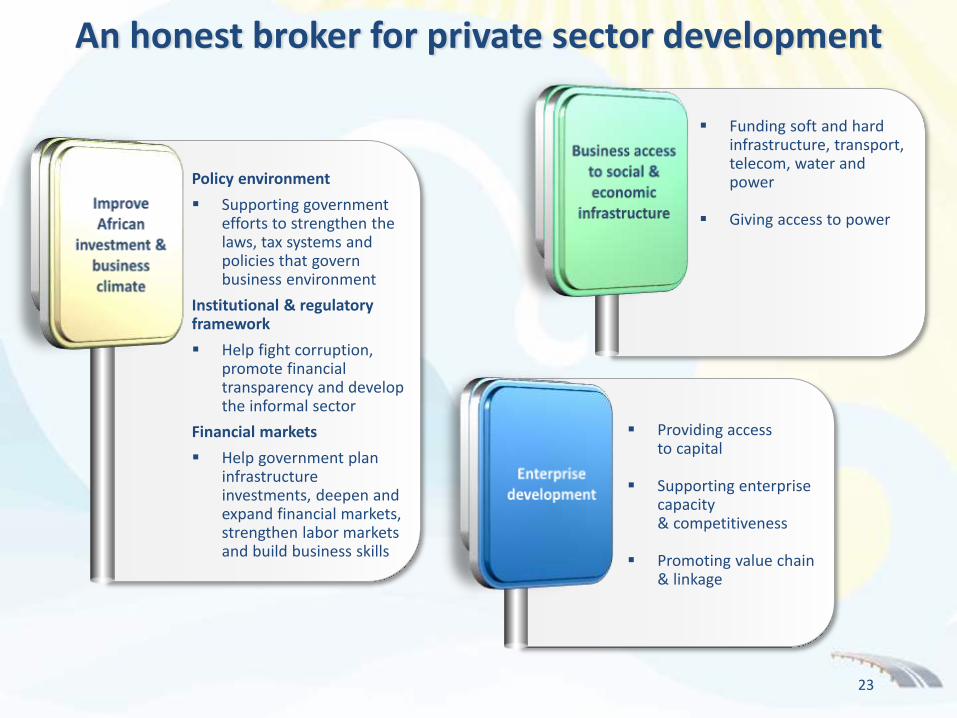
An honest broker for private sector development
Funding soft and hard infrastructure, transport, telecom, water and power
Giving access to power
Policy environment
Supporting government efforts to strengthen the laws, tax systems and policies that govern business environment
Institutional & regulatory framework
Help fight corruption, promote financial transparency and develop the informal sector
Financial markets
Help government plan infrastructure investments, deepen and expand financial markets, strengthen labor markets and build business skills
Providing access to capital
Supporting enterprise capacity & competitiveness
Promoting value chain & linkage
23

Loan Products
Non-sovereign guaranteed loans
Local currency loans
Syndicated loans: A/B structures
Guarantees
Partial risk guarantees
Partial credit guarantees
Equity & Quasi Equity
Equity
Convertible debt
Subordinated debt
Mezzanine debt
Trade Finance
Risk participation agreements
Trade finance lines of credit
Soft commodity finance facility
Risk Management Products
Interest rate swaps
Currency swaps
Commodity/Index swaps
Interest rate caps & collars
Technical Assistance
Capacity building
Legal reform support
Grant funding
Wider use of Public Private Partnership and co-financing
Every AfDB dollar attracts an additional six dollars from investors
A palette of instruments to unlock significant funding for development
24

Private sector delivering service and providing opportunities
South Africa’s rail company: Transnet
ZAR 312 billion (USD 28.6 billion) with AfDB financing USD 247 million
Nigeria: Dangote oil refinery and fertilizer plant
Total cost ofUSD 9 billion with AfDB financing USD 282 million
Expected outcomes: Provide over 32,000 jobs Save USD 65 billion in foreign exchange Government to receive USD 1.08 billion in revenues
from taxes and fees
Expected outcomes: Increase freight capacity Create 6,146 jobs Generate USD 650 million in government revenue Transport and logistics costs reduced by 4% - 7%
25As of 31 December 2014
Equity Funds9%
Commercial Banks19%
Development Finance Instutions
14%
Trade Finance11%
Others2%
Energy18%
Transport8%
Telecoms2%
Mining9%
Agribusiness5%
Manufacturing3%

Offshoots and home-grown partners
26
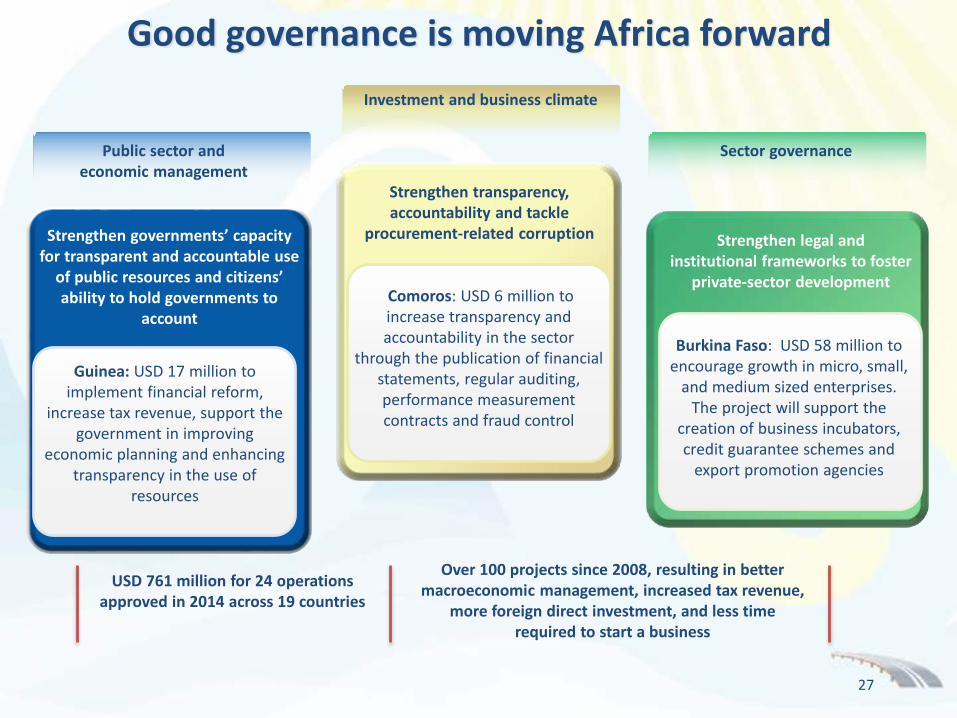
Strengthen transparency, accountability and tackle
procurement-related corruption
Comoros: USD 6 million to increase transparency and accountability in the sector
through the publication of financial statements, regular auditing, performance measurement contracts and fraud control
Over 100 projects since 2008, resulting in better macroeconomic management, increased tax revenue,
more foreign direct investment, and less time required to start a business
Strengthen governments’ capacity for transparent and accountable use
of public resources and citizens’ ability to hold governments to
account
Guinea: USD 17 million to implement financial reform,
increase tax revenue, support the government in improving
economic planning and enhancing transparency in the use of
resources
Strengthen legal and institutional frameworks to foster
private-sector development
Burkina Faso: USD 58 million to encourage growth in micro, small,
and medium sized enterprises. The project will support the
creation of business incubators, credit guarantee schemes and
export promotion agencies
Good governance is moving Africa forward
Public sector and economic management
Sector governance
Investment and business climate
USD 761 million for 24 operations approved in 2014 across 19 countries
27
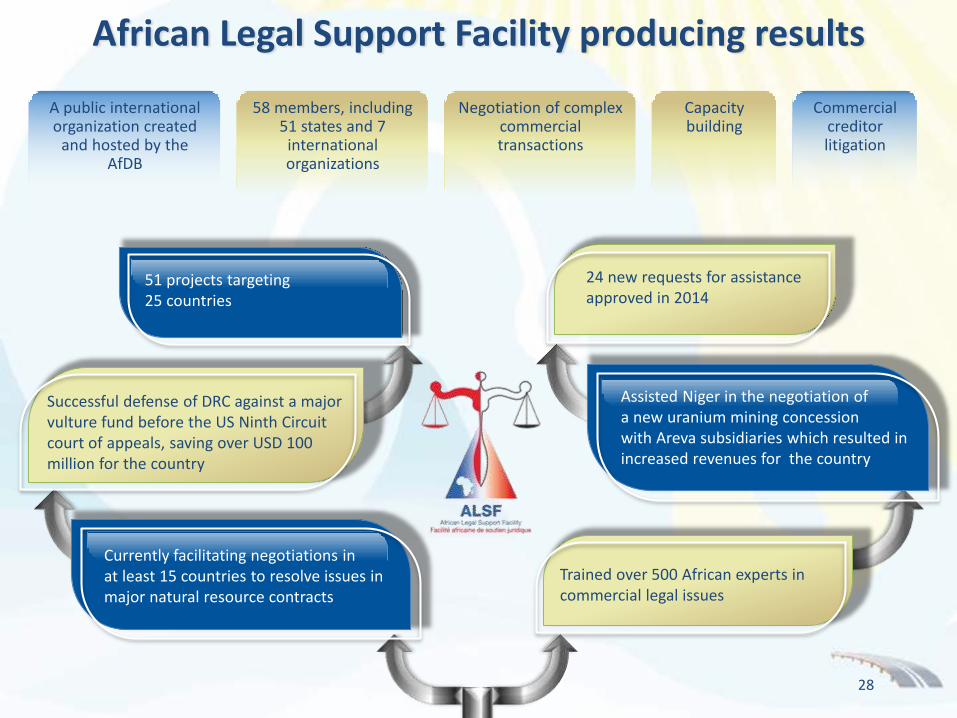
51 projects targeting 25 countries
24 new requests for assistance approved in 2014
Successful defense of DRC against a major vulture fund before the US Ninth Circuit court of appeals, saving over USD 100 million for the country
Assisted Niger in the negotiation of a new uranium mining concession with Areva subsidiaries which resulted in increased revenues for the country
Currently facilitating negotiations in at least 15 countries to resolve issues in major natural resource contracts
Trained over 500 African experts in commercial legal issues
A public international organization created
and hosted by the AfDB
58 members, including 51 states and 7
international organizations
Negotiation of complex commercial transactions
Capacity building
Commercial creditor litigation
African Legal Support Facility producing results
28
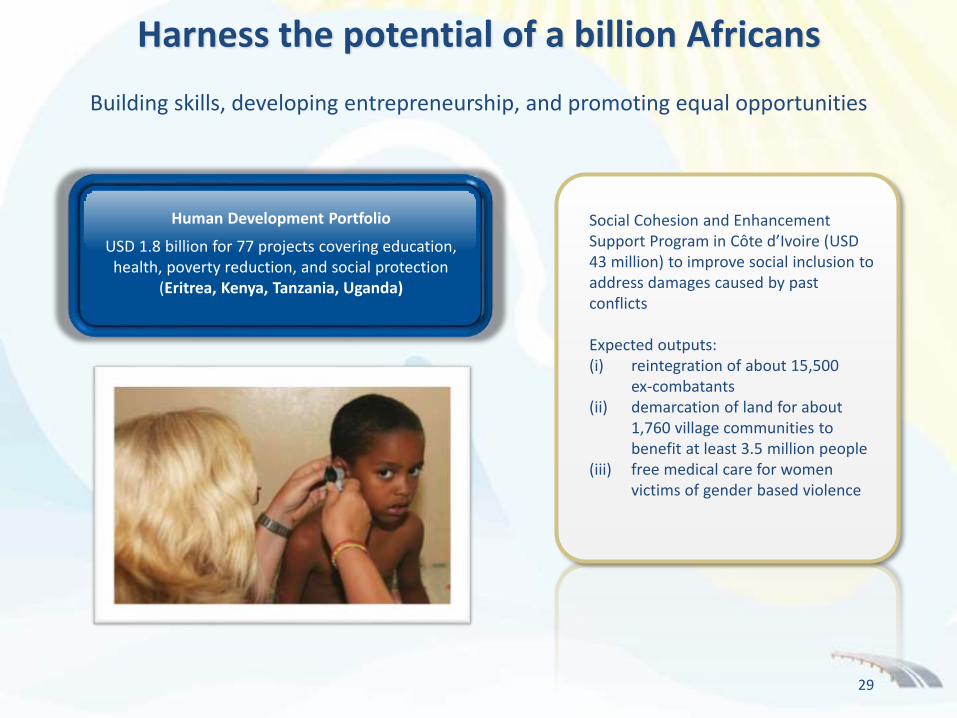
Building skills, developing entrepreneurship, and promoting equal opportunities
Social Cohesion and Enhancement Support Program in Côte d’Ivoire (USD 43 million) to improve social inclusion to address damages caused by past conflicts
Expected outputs: (i) reintegration of about 15,500
ex-combatants(ii) demarcation of land for about
1,760 village communities to benefit at least 3.5 million people
(iii) free medical care for women victims of gender based violence
Human Development Portfolio
USD 1.8 billion for 77 projects covering education, health, poverty reduction, and social protection
(Eritrea, Kenya, Tanzania, Uganda)
Harness the potential of a billion Africans
29
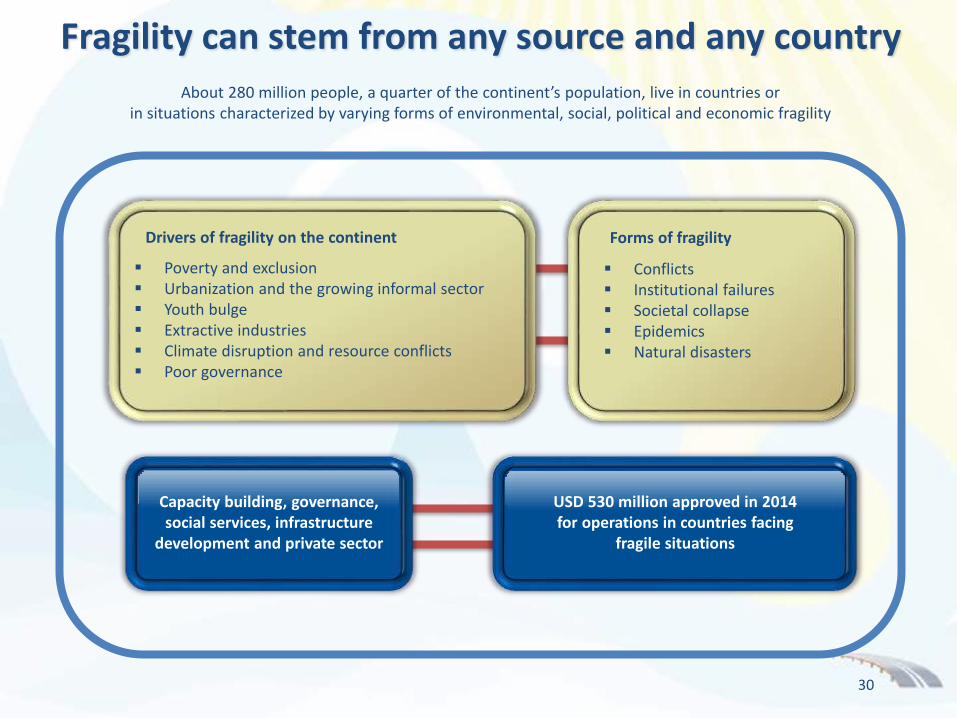
About 280 million people, a quarter of the continent’s population, live in countries or in situations characterized by varying forms of environmental, social, political and economic fragility
Poverty and exclusion Urbanization and the growing informal sector Youth bulge Extractive industries Climate disruption and resource conflicts Poor governance
Drivers of fragility on the continent
Conflicts Institutional failures Societal collapse Epidemics Natural disasters
Forms of fragility
USD 530 million approved in 2014 for operations in countries facing
fragile situations
Capacity building, governance, social services, infrastructure
development and private sector
Fragility can stem from any source and any country
30
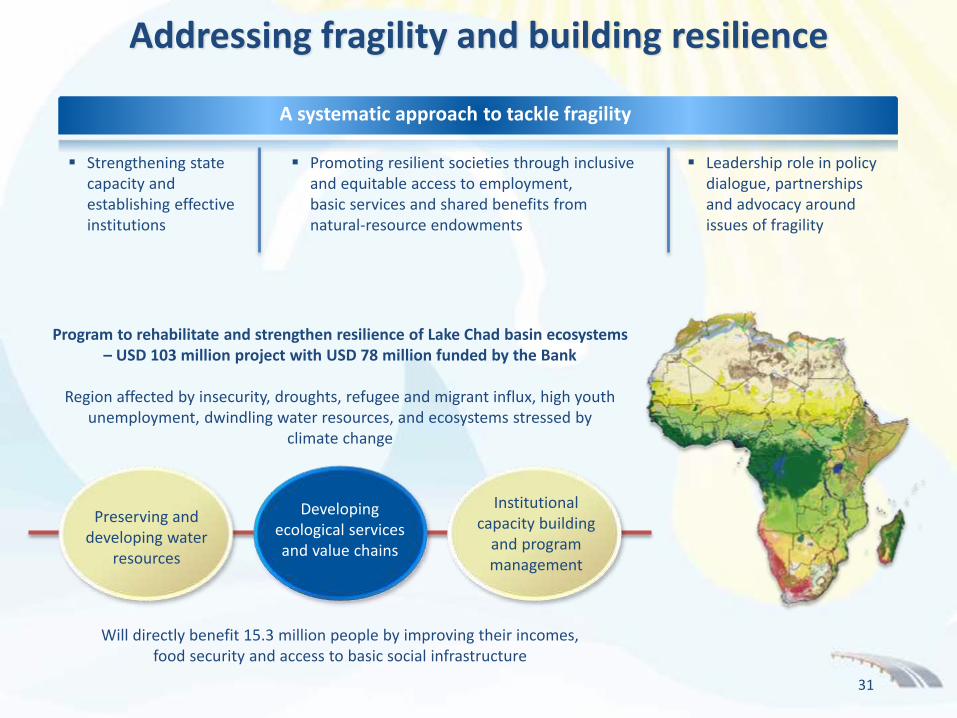
Will directly benefit 15.3 million people by improving their incomes, food security and access to basic social infrastructure
Program to rehabilitate and strengthen resilience of Lake Chad basin ecosystems – USD 103 million project with USD 78 million funded by the Bank
Region affected by insecurity, droughts, refugee and migrant influx, high youth unemployment, dwindling water resources, and ecosystems stressed by
climate change
Preserving and developing water
resources
Developing ecological services and value chains
Institutional capacity building
and program management
A systematic approach to tackle fragility
Leadership role in policy dialogue, partnerships and advocacy around issues of fragility
Promoting resilient societies through inclusive and equitable access to employment, basic services and shared benefits from natural-resource endowments
Strengthening state capacity and establishing effective institutions
Addressing fragility and building resilience
31

USD 223 million approved to
fight and prevent Ebola
Post-Ebola livelihoods restoration project
Restore agricultural production systems and livelihoods for farm households
Reopen health facilities & provide psycho-social support
Develop skills and technology Create a Social Investment Fund to strengthen
economic support systems Strengthen regional surveillance systems jointly
with West African Health Organization and Mano River Union
African Center for Disease Control and Prevention led by the African Union
Establish a surveillance and prevention epidemiological center of excellence on the continent
Establish regional centers Enhance early warning systems Harmonize national health regulations
and interventions
AfDB was the first Multilateral Development Bank to respond to the Ebola crisis, and is at the forefront of
supporting affected countriesTwo more operations under preparation
Additional USD 300 million to support countries’ post-Ebola recovery programs announced in April 2015
Fragility is a concern for all
Providing equipment and emergency support
Establishing nutrition, food security and social
programs
Strengthening public health infrastructure
Training health
workers
Road infrastructure
Nigeria
IvoryCoast
Liberia
DRC
GuineaSierra Leone
32
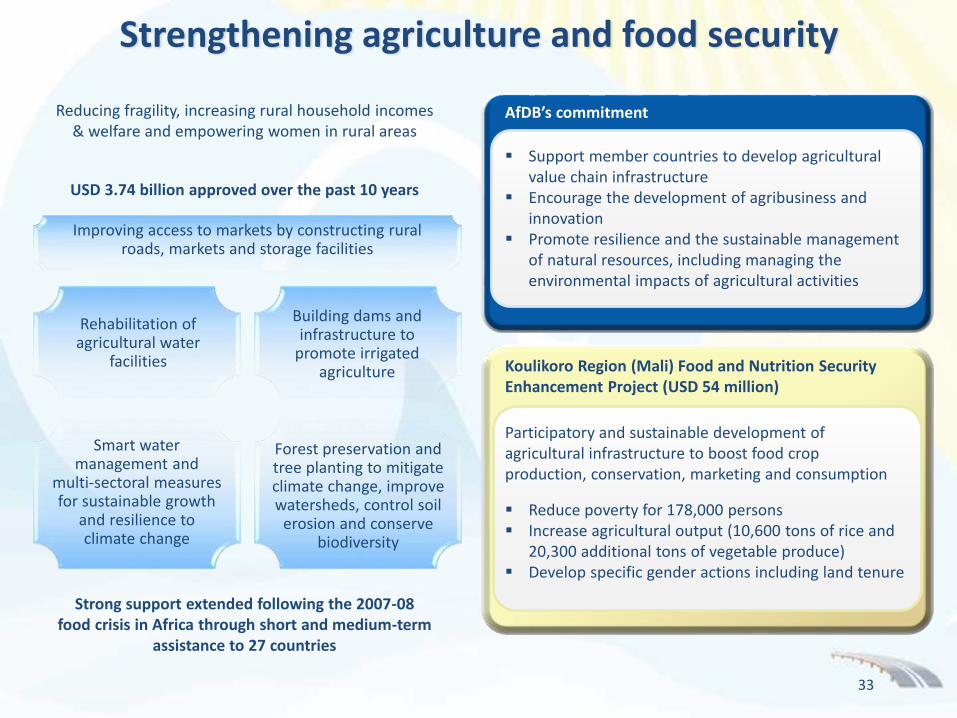
Strengthening agriculture and food security
Reducing fragility, increasing rural household incomes & welfare and empowering women in rural areas
Strong support extended following the 2007-08 food crisis in Africa through short and medium-term
assistance to 27 countries
Koulikoro Region (Mali) Food and Nutrition Security Enhancement Project (USD 54 million)
Participatory and sustainable development of agricultural infrastructure to boost food crop production, conservation, marketing and consumption
Reduce poverty for 178,000 persons Increase agricultural output (10,600 tons of rice and
20,300 additional tons of vegetable produce) Develop specific gender actions including land tenure
AfDB’s commitment
USD 3.74 billion approved over the past 10 years
Smart water management and
multi-sectoral measures for sustainable growth
and resilience to climate change
Forest preservation and tree planting to mitigate climate change, improve watersheds, control soil
erosion and conserve biodiversity
Building dams and infrastructure to
promote irrigated agriculture
Rehabilitation of agricultural water
facilities
Improving access to markets by constructing rural roads, markets and storage facilities
33
Support member countries to develop agricultural value chain infrastructure
Encourage the development of agribusiness and innovation
Promote resilience and the sustainable management of natural resources, including managing the environmental impacts of agricultural activities
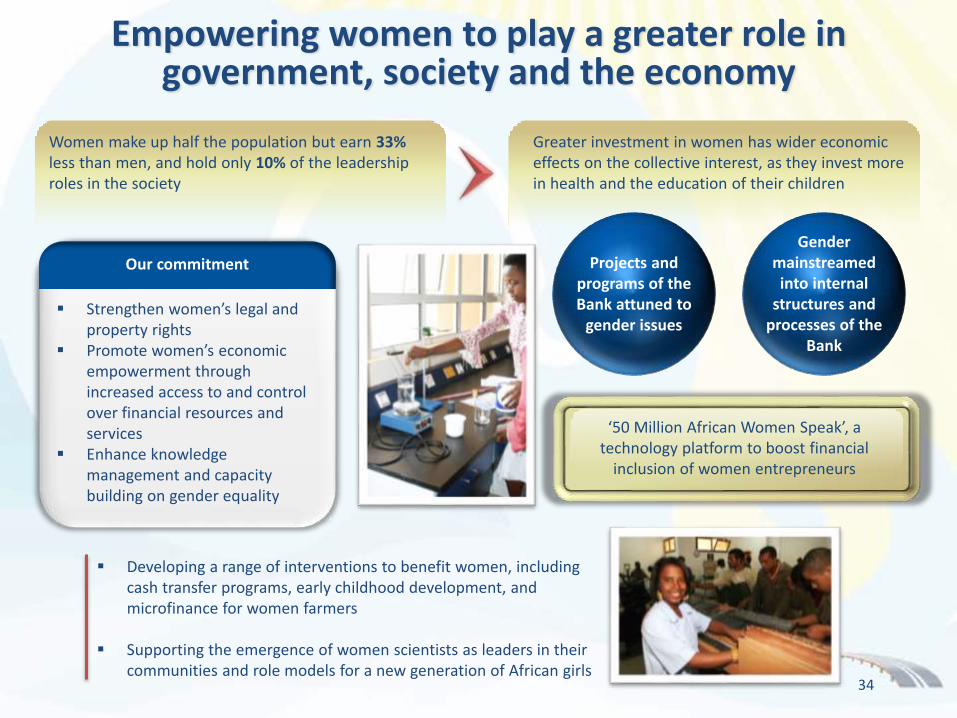
Women make up half the population but earn 33%less than men, and hold only 10% of the leadership roles in the society
Greater investment in women has wider economic effects on the collective interest, as they invest more in health and the education of their children
Empowering women to play a greater role in government, society and the economy
Our commitment
Strengthen women’s legal and property rights
Promote women’s economic empowerment through increased access to and control over financial resources and services
Enhance knowledge management and capacity building on gender equality
Developing a range of interventions to benefit women, including cash transfer programs, early childhood development, and microfinance for women farmers
Supporting the emergence of women scientists as leaders in their communities and role models for a new generation of African girls
‘50 Million African Women Speak’, a technology platform to boost financial
inclusion of women entrepreneurs
34
Projects and programs of the Bank attuned to
gender issues
Gender mainstreamed into internal
structures and processes of the
Bank

AfDB’s Climate Change Action Plan 2011-2015
Reducing deforestation and alleviating poverty in the Virunga-Hoyo Region
(DRC)
Improve conservation and management of 1,500 km2 of forest
Contribute to the livelihoods of people through carbon income
Reduce household charcoal use via efficient stoves
Raise environmental awareness and reforestation via school tree nurseries
Committed to invest USD 9.3 billion over
the 5-year period 2011-2015
Enhancing Africa’s transition to Green Growth
Approved to increase total power generating capacity to approximately 500 MW
Thermodynamic solar technology that can store energy for about 5 hours
Cumulative emission reduction of 700,000 tons of CO2/year
Phase II of Ouarzazate Solar Complex project in Morocco (USD 250 million
from CIF and AfDB)
Strengthen capacity to respond to climate change
Mobilize resources from private sector and market mechanisms to address climate changeP
illar
1
Pill
ar 2
Pill
ar 3
35

36
Scaling up climate finance to amplify impact on the continent
Own Resources
Managed Donor
Resources
Additional External
Resources
AfDBClimate Finance
Instrument Panel
Global Environment
Facility
Climate Investment
Funds
Mobilized USD 7 billion for climate finance since 2011 with more than USD 1 billion from climate focused funds
Newcomer projects in Benin, Ghana, Lesotho, Madagascar, Malawi, Rwanda, Sierra Leone, Uganda and Zambia
Facilitating private sector engagement via innovative projects in Ghana, Kenya, Mali, Mozambique and Nigeria
Solar
Energy efficiency
Climate forecasting
Climate-resilient land and water solutions
Geothermal
Wind Sustainable forest
solutions
Early warning systems
Climate finance readiness
Rolling out climate-smart projects across most African countries
Africa Climate
Change Fund
Congo Basin Forest Fund
Clim-Dev Africa Special
Fund
Sustainable energy fund
for Africa
African water facility
Rural Water Supply and Sanitation Initiative
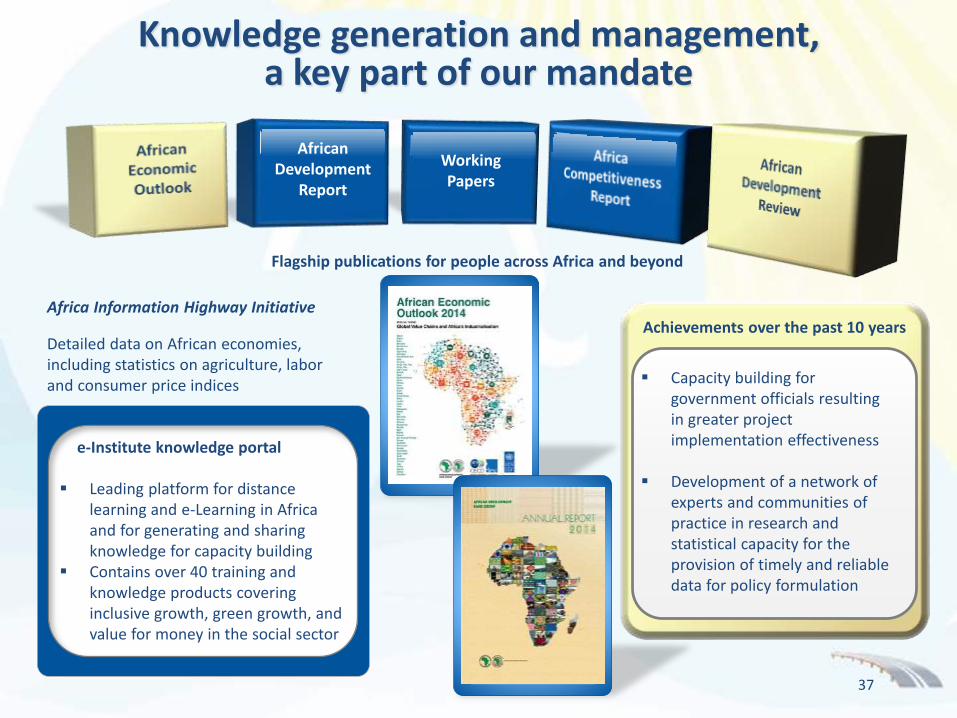
Knowledge generation and management, a key part of our mandate
Achievements over the past 10 years
Capacity building for government officials resulting in greater project implementation effectiveness
Development of a network of experts and communities of practice in research and statistical capacity for the provision of timely and reliable data for policy formulation
Africa Information Highway Initiative
Detailed data on African economies, including statistics on agriculture, labor and consumer price indices
e-Institute knowledge portal
Leading platform for distance learning and e-Learning in Africa and for generating and sharing knowledge for capacity building
Contains over 40 training and knowledge products covering inclusive growth, green growth, and value for money in the social sector
African Development
Report
Working Papers
Flagship publications for people across Africa and beyond
37

Strong support to the most vulnerable through ADF
Close to USD 31 billion delivered through ADF since 2005
ADF-X (2005-2007) ADF-11 (2008-2010) ADF-12 (2011-2013) ADF-13 (2014-2016)
5,730
8,889 8,941
7,430
40 beneficiary countries 27 non-African Donors Pledges and contributions from 5 African
donors: Angola, Botswana, Egypt, Libya and South Africa
ADF at a glance
38
In USD million

Developing Africa’s financial sector
Financial Sector Development Policy and Strategy (2014-2019)
Increasing access to the underserved
Broadening and deepening
Africa’s financial systems
Financial stability & governance
39
Africa SME Program
Flagship program designed to enhance financial inclusion and reduce the SME financing gap
Beneficiaries include AB Microfinance Bank (USD 4.8 million), Advans Cameroon (USD 1.3 million) and Finadev S.A. (USD 1.3 million)
Risk Participation Agreements (RPAs)
RPAs amounting to USD 200 million with two new confirming banks - Afrexim Bank and EcoBank
Projected to support at least USD 1.2 billion worth of trade, including a substantial share of intra-African trade
LAPO Microfinance Bank
USD 12 million line of credit Largest microfinance bank in Nigeria
with 327 branches and over 1 million clients, 90% of whom are women
Development Bank of Nigeria PLC
USD 500 million hybrid investment Innovative governance structure and
product offerings for the underserved SME sector

African Socio-Economic Outlook
Financial Profile & Capital Market Activities
40
Overview of Bank Group Operations

A critical development mandate, a very strong public policy role, a preferred creditor
Prudent governance and management
Solid capital position and adequate earnings
Strong and stable access to funding
A highly rated institution driven to deliver on its mandate
Strong and stable support from shareholders
Preferred creditor status
Ample liquidity
Diversified wholesale funding
profile
Robust capitalization
Sound and solid financial risk management
policies
Aaa/AAA/AAA
41
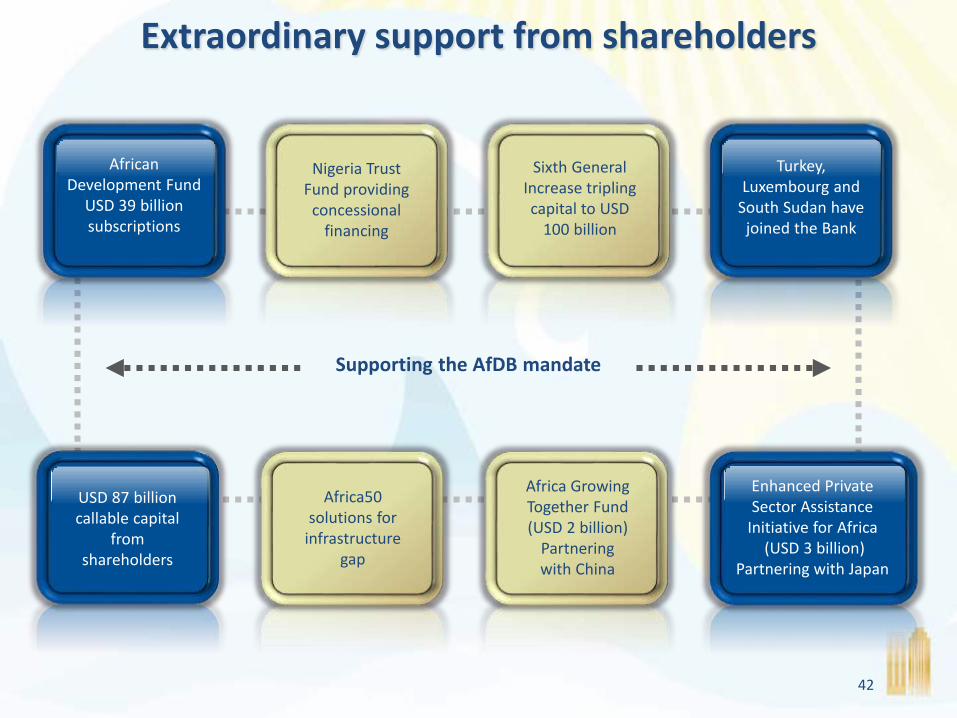
Extraordinary support from shareholders
African Development Fund
USD 39 billion subscriptions
Nigeria Trust Fund providing
concessional financing
Sixth General Increase tripling capital to USD
100 billion
Turkey, Luxembourg and
South Sudan have joined the Bank
Africa50solutions for
infrastructure gap
Africa Growing Together Fund (USD 2 billion)
Partnering with China
Enhanced Private Sector Assistance
Initiative for Africa(USD 3 billion)
Partnering with Japan
USD 87 billion callable capital
from shareholders
Supporting the AfDB mandate
42
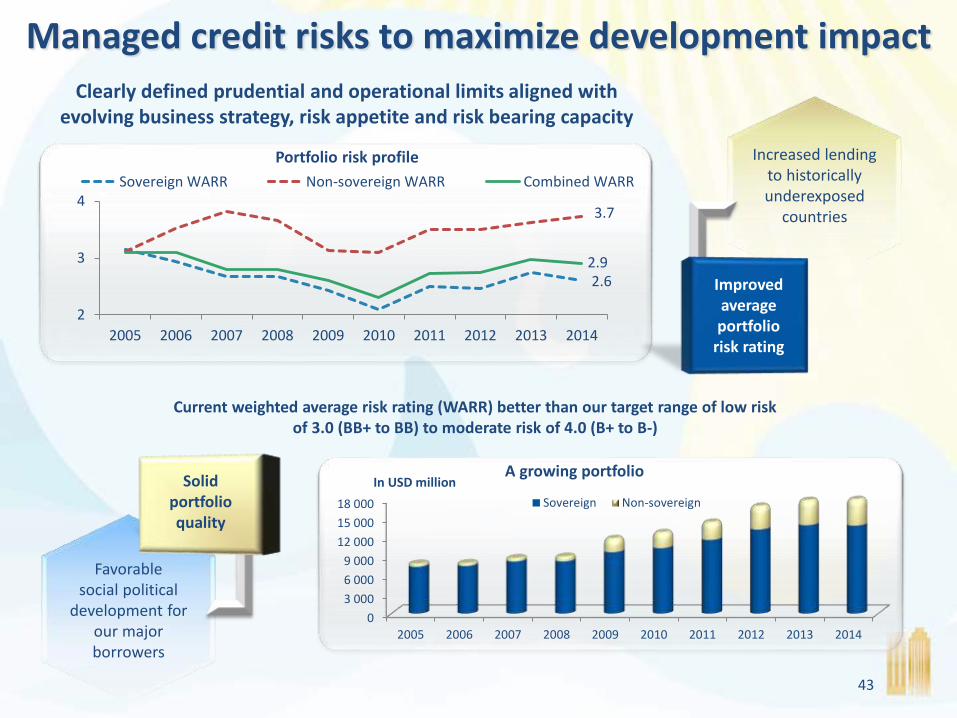
0
3 000
6 000
9 000
12 000
15 000
18 000
2005 2006 2007 2008 2009 2010 2011 2012 2013 2014
Sovereign Non-sovereign
2.6
3.7
2.9
2
3
4
2005 2006 2007 2008 2009 2010 2011 2012 2013 2014
Sovereign WARR Non-sovereign WARR Combined WARR
Clearly defined prudential and operational limits aligned with evolving business strategy, risk appetite and risk bearing capacity
Managed credit risks to maximize development impact
Portfolio risk profile
Current weighted average risk rating (WARR) better than our target range of low risk of 3.0 (BB+ to BB) to moderate risk of 4.0 (B+ to B-)
A growing portfolioIn USD million
43
Increased lending to historically underexposed
countries
Improved average portfolio
risk rating
Favorable social political
development for our major borrowers
Solid portfolio quality

Robust capitalization
0
1 000
2 000
3 000
4 000
5 000
6 000
7 000
8 000
9 000
5,307
2,844
1,130
792443
252 77
-232
5,307
3,366
In USD million
Available risk
capital (39%)
8,673*
Sufficient capital to support additional lending operations
Risk capital utilized (61%)
* Total risk capital after adjustments for valuations of equity investments and borrowing
Risk capital utilization ratio stable in 2014 helped by improved diversification and increased risk bearing capacity
Risk capital utilization rate = Σ [[ Exposure] * [Risk capital charge]]/Total risk capital
Risk capital = Paid-in capital + Reserves + Adjustments
44

Reinforcing the foundations of our financial strength
Risk-bearing capacity increased by 39% since 2005
7,432 7,424 7,494
8,2078,818 8,673
7,1787,440
6,6996,257
0
1 000
2 000
3 000
4 000
5 000
6 000
7 000
8 000
9 000
2005 2006 2007 2008 2009 2010 2011 2012 2013 2014
In USD million
Paid-in Capital Reserves
45
Additional paid-in capital of USD 2.24 billion expected from 2015 to 2026

Protecting investors with conservative policy-based prudential ratios
Leverage and gearing track comfortably within limits
(Limit)
= Σ (Paid-in capital, Reserves, Callable capital of non-borrowing countries rated A- and above)
Usable Capital
= Loans (including undisbursed) + Equity investments and Guarantees / (Unimpaired subscribed capital + Surplus + Reserves)
Gearing
0%
20%
40%
60%
80%
100%
2005 2006 2007 2008 2009 2010 2011 2012 2013 2014
Debt to Usable Capital ratio Gearing ratio
GCI-VI negotiated as key levels approached 90%
46

USD 1.12 billion allocated to reserves
USD 217 million allocated to the surplus account
USD 1.88 billion allocated to development initiatives
Addressing key continent wide development initiatives…
…to support the needs of low income countries
…to support project preparation and capacity
building in middle income countries
…to provide humanitarian aid
African Development Fund
Middle Income Country Trust Fund
Special Relief Fund
0
50
100
150
200
250
300
350
400
450
500
2005 2006 2007 2008 2009 2010 2011 2012 2013 2014
In USD million
Development initiatives Retained in reserves
Allocable income
Strengthening our capital base and capacity to deliver
Stable internal capital generation
47
USD 3.2 billion of allocable income since
2005

Special relief for humanitarian causes
Special Relief Fund
1973: Provide humanitarian assistance to regional member countries affected by natural disasters
Over USD 126 million disbursed
since inception
Displaced persons in
Katanga (DRC)
Flood victims in Malanville/Karimama
(Benin)
Assistance to the conflict affected
vulnerable population in South Sudan
Assistance to refugees in Cameroon
Assistance to Chibok Girls
School in Nigeria
Emergency assistance to
control Ebola in DRC
Emergency aid to control the
plague in Madagascar
Assistance to the victims of drought in
Somalia
Examples of commitments in 2014
48

Serving Africa’s growing needs
Africa needs substantial resources
to transform its economies
Scarce concessional resources not
enough
African countries borrowing at
commercial terms in the capital
markets
Relevant and responsive to the needs of its members
Profile of beneficiaries of the new AfDB credit policy
Transport Sector Support Project in
Rwanda to improve mobility and living
conditions(USD 73 million)
Markets and Agricultural Trade
Improvement Project in Uganda to
redevelop local markets
(USD 83 million)
Amendment to the credit policy targeted
at projects maximizing
development impact
Profile of African
Eurobond issuers
Low/moderate risk of debt distress
Stable macroeconomic environment
High economic growth
49
Stringent criteria to determine eligibility
Sustainable debt profiles Sound macroeconomic position Available headroom for
non-concessional borrowing
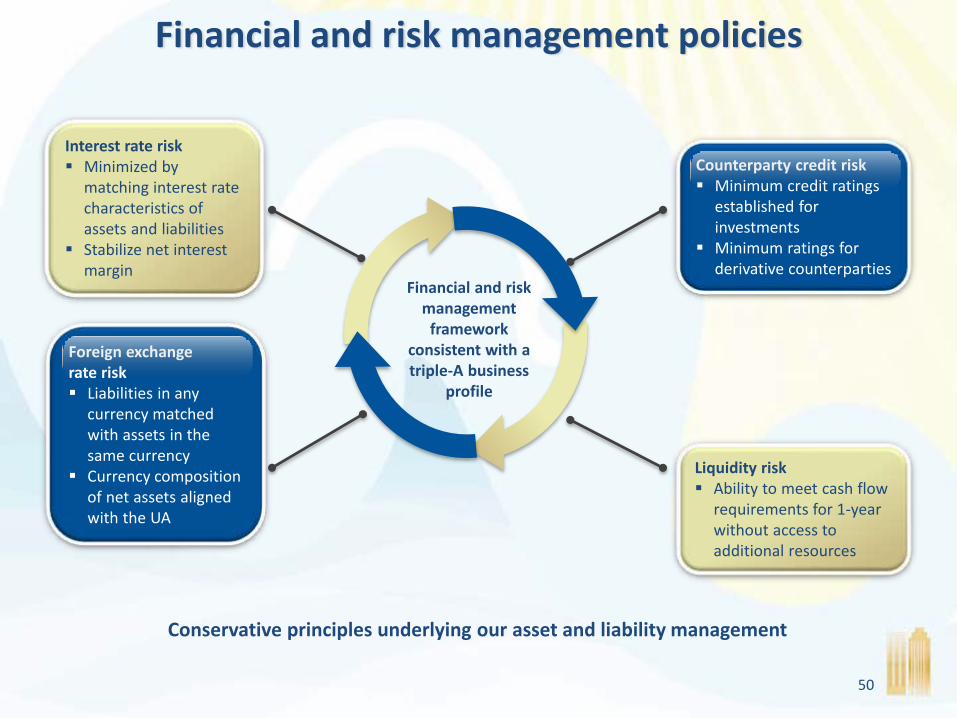
Financial and risk management policies
Conservative principles underlying our asset and liability management
Counterparty credit risk Minimum credit ratings
established for investments
Minimum ratings for derivative counterparties
Interest rate risk Minimized by
matching interest rate characteristics of assets and liabilities
Stabilize net interest margin
Liquidity risk Ability to meet cash flow
requirements for 1-year without access to additional resources
Foreign exchange rate risk Liabilities in any
currency matched with assets in the same currency
Currency composition of net assets aligned with the UA
Financial and risk management
framework consistent with a triple-A business
profile
50
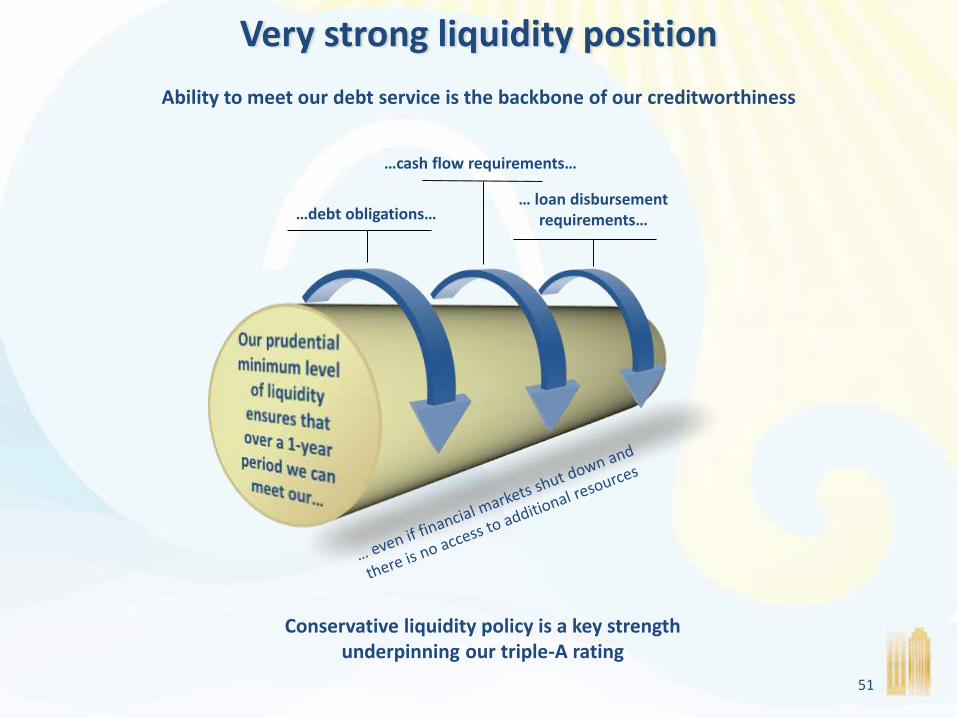
Very strong liquidity position
…debt obligations…
…cash flow requirements…
… loan disbursement requirements…
Conservative liquidity policy is a key strength underpinning our triple-A rating
Ability to meet our debt service is the backbone of our creditworthiness
51

Targeting high-quality assets
* ABS/MBS = Asset/Mortgage Backed Securities
Investment portfolio by currency
54% 10%
USD GBP
5%Other
31%
EUR
AAA48%
AA+ to AA-50%
A+ and below2%
Conservative investment policy for liquidity
Amortized cost portfolio USD 5.2 billion
Longer term assets to stabilize net interest
margin
Fair value portfolio USD 5.4 billion
Liquid assets to meet short & medium-term
operational needs
Total treasury assets (USD 10.6 billion)
Sovereign Supranational and Agencies
70%
Banks 15%
Corporates 6%
ABS/MBS* 5% Money market 4%
Still able to outperform benchmarks…
… despite low interest rate environment
52

Growing borrowing program in line with our planned operations on the continent
Established access to the capital markets as a reputable & diverse wholesale borrower
EMEA Finance Achievement Award
Winner in 2014
Best Supranational Borrower
Best Sterling Bond
Financial crisis
0
1 000
2 000
3 000
4 000
5 000
6 000
7 000
8 000
2005 2006 2007 2008 2009 2010 2011 2012 2013 2014 2015
783 1,113 1,236
2,015
7,546
2,793
3,879 3,844
5,668
4,663
6,530
In USD million
53

Comprehensive market access
Global benchmarksPublic domestic
benchmarksPlain vanilla private
placementsStructured private
placementsAfrican currency linked
notesAfrican local currency
benchmarksUridashis
LoansECP
AustraliaBotswana
BrazilCanada
ChileEuropeGhana
IndonesiaJapanKenya
MexicoNew Zealand
Nigeria
RussiaSingapore
South AfricaSweden
SwitzerlandTurkeyUganda
UAEUK
USAVietnamZambia
AEDAUDBRLBWPCADCHFCLPEURGBPGHSIDRJPYKES
MXNNGNNZDRUBSEKSGDTRYUGXUSDVNDZARZMK
Breadth of access across markets and currencies over the past 10 years
54

55
Global benchmark hat-trick seals AfDB’s premier league position
Flagship benchmark funding program of the Bank
USD 1 billion0.875% due May 2017
Barclays, Deutsche Bank, Morgan Stanley, TD Securities
March 2014
USD 1 billion2.375% due September 2021
BNP Paribas, Citigroup, Goldman Sachs, Nomura
September 2014
USD 1 billion1.375% due February 2020
Daiwa, Deutsche Bank, Morgan Stanley, TD Securities
February 2015
Global benchmark books more than 200% oversubscribed within 4 hours
Banks25%
Funds19%
Central Banks/OIs*
56%
Distribution by investor type
EMEA Americas Asia
35%33% 32%
Distribution by region
* Official Institutions

Cementing our footprint in Australasia
Australian dollars, the second currency of funding for the third year running
Building AfDB’s A$ benchmark curve since 2011…
… with A$3.7 billion currently outstanding in the
kangaroo market
NZD 100 million Kauri bond due August 2019
Diversifying the Bank’s funding sources into New
Zealand after a 6-year absence
A$1,000 million due 2022
A$500 million due 2018 A$500 million due 2016
A$300 million due 2025
A$75 million due 2026
A$250 million due 2019
A$650 million due 2024
A$100 million due 2018
A$300 million due 2020
56
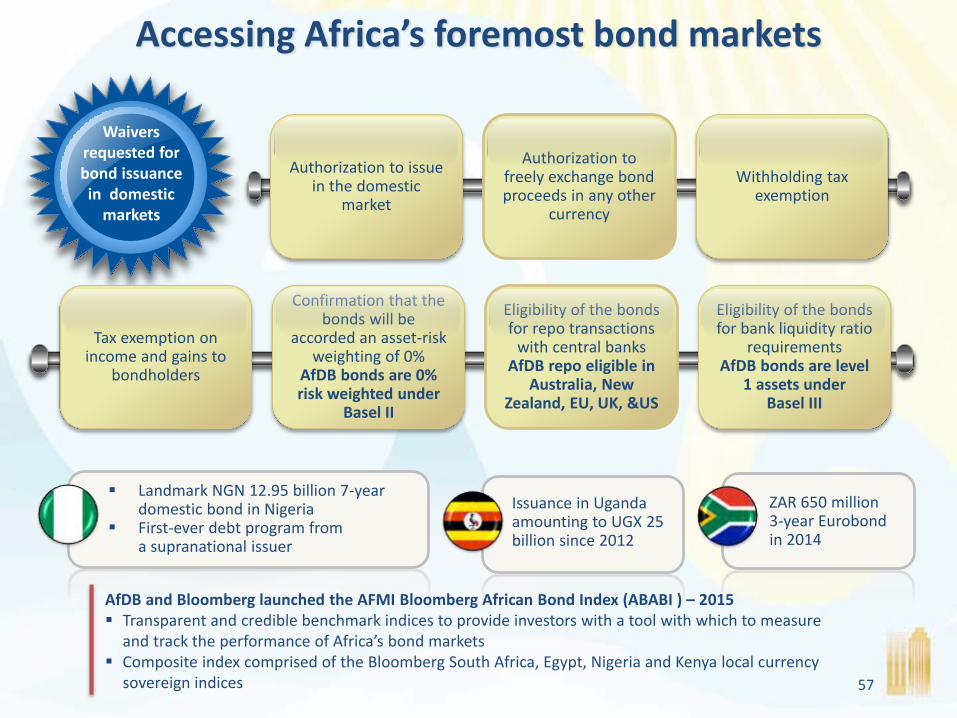
Accessing Africa’s foremost bond markets
57
Landmark NGN 12.95 billion 7-year domestic bond in Nigeria
First-ever debt program from a supranational issuer
Issuance in Uganda amounting to UGX 25 billion since 2012
ZAR 650 million 3-year Eurobond in 2014
AfDB and Bloomberg launched the AFMI Bloomberg African Bond Index (ABABI ) – 2015 Transparent and credible benchmark indices to provide investors with a tool with which to measure
and track the performance of Africa’s bond markets Composite index comprised of the Bloomberg South Africa, Egypt, Nigeria and Kenya local currency
sovereign indices
Authorization to issue in the domestic
market
Authorization to freely exchange bond proceeds in any other
currency
Withholding tax exemption
Waivers requested for bond issuance in domestic
markets
Confirmation that the bonds will be
accorded an asset-risk weighting of 0%
AfDB bonds are 0% risk weighted under
Basel II
Eligibility of the bonds for repo transactions
with central banksAfDB repo eligible in
Australia, New Zealand, EU, UK, &US
Eligibility of the bonds for bank liquidity ratio
requirementsAfDB bonds are level
1 assets under Basel III
Tax exemption on income and gains to
bondholders

Clean energy Education Education support Food security Gender
USD 200 million infrastructure bond
BRL 271 million food security uridashi bond
Catering to socially responsible investors
Green Infrastructure Powering Africa Social Water
AfDB Green bond program launched in 2013
To finance eligible climate change mitigation and adaptation
USD 1.2 billion issued under the program since 2013
Dedicated green bond website and newsletter
Harmonized impact reporting with other MDBs
58
AfDB Socially Responsible bonds
since 2010. Proceeds used on a best-efforts basis towards lending in the relevant areas
of interest
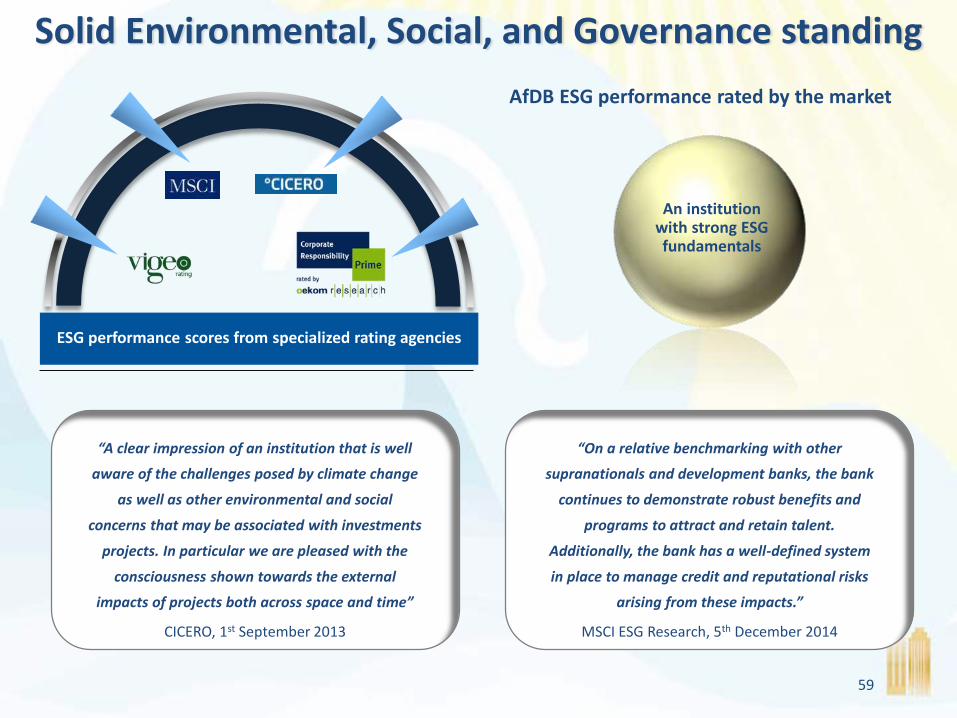
Solid Environmental, Social, and Governance standing
“A clear impression of an institution that is well
aware of the challenges posed by climate change
as well as other environmental and social
concerns that may be associated with investments
projects. In particular we are pleased with the
consciousness shown towards the external
impacts of projects both across space and time”
CICERO, 1st September 2013
“On a relative benchmarking with other
supranationals and development banks, the bank
continues to demonstrate robust benefits and
programs to attract and retain talent.
Additionally, the bank has a well-defined system
in place to manage credit and reputational risks
arising from these impacts.”
MSCI ESG Research, 5th December 2014
ESG performance scores from specialized rating agencies
An institution with strong ESG fundamentals
AfDB ESG performance rated by the market
59
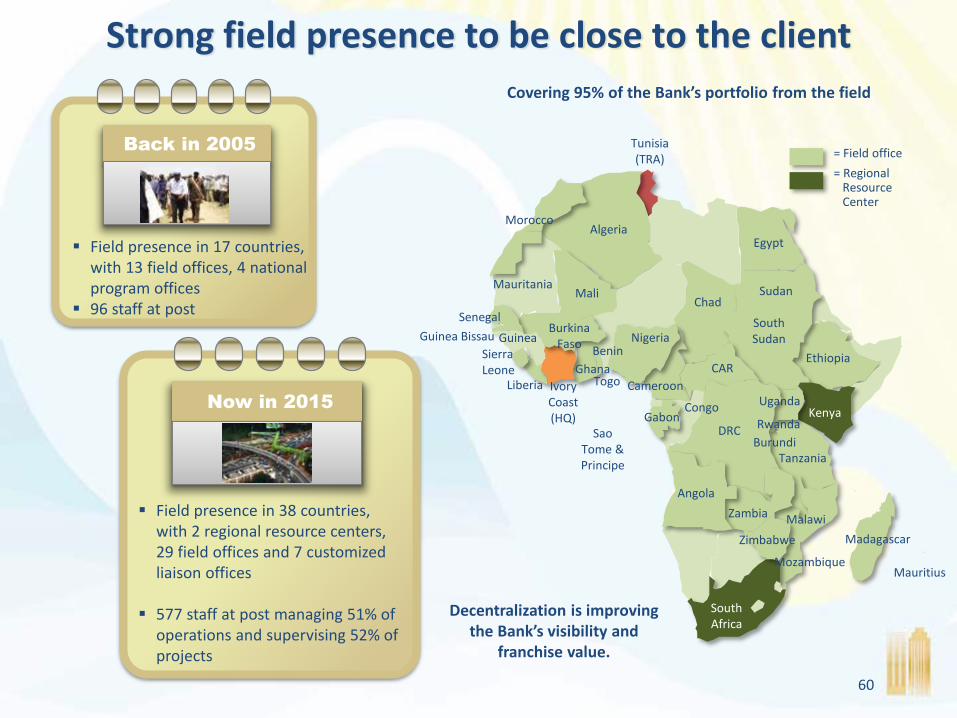
Strong field presence to be close to the client
Covering 95% of the Bank’s portfolio from the field
= Field office
= Regional ResourceCenter
Tunisia(TRA)
Egypt
Uganda
Malawi
Ghana
South Africa
Madagascar
Gabon
Mali
Nigeria
Tanzania
Zambia
Algeria
Ethiopia
Sudan
Kenya
Chad
Angola
Zimbabwe
Burundi
TogoCAR
Ivory Coast(HQ)
South Sudan
MauritiusMozambique
Liberia
Burkina Faso
Senegal
Sierra Leone
RwandaDRC
Morocco
Mauritania
Guinea Bissau GuineaBenin
Congo
Sao Tome & Principe
60
Decentralization is improving the Bank’s visibility and
franchise value.
Cameroon
Field presence in 17 countries, with 13 field offices, 4 national program offices
96 staff at post
Back in 2005
Field presence in 38 countries, with 2 regional resource centers, 29 field offices and 7 customized liaison offices
577 staff at post managing 51% of operations and supervising 52% of projects
Now in 2015

Returned to Headquarters
61

Inaugural meeting of Board of Governors in Lagos, Nigeria in 1964
Headquarters open in Abidjan, Cote D’Ivoire
Operational activities begin in July 1966 with 10 people
In 1967, first loan to finance the construction of a road in Kenya
Initial authorized capital of USD 387 million
Bank loans and grants reach USD 8 million in 1968
ADF created in 1972 by 13 state participants
Nigerian Trust Fund established in 1975
1st General Capital Increase to USD 620 million
Bank loans and grants reach USD 136 million in 1974
45 members countries
Non-regional countries admitted to the Bank
2nd General Capital Increase to USD 1.2 billion
Bank loans and grants reach USD 520 million in 1979
48 members countries
August 4th 1963, Khartoum, 23 newly independent African states established the AfDB
1st President 1964Mamoun Beheiry (Sudan)
2nd President 1970Abdelwahab Labidi
(Tunisia)
3rd President 1976Kwame Donkor Fordwor
(Ghana)
62

AfDB leaders 1980 - 2005
4th President 1980Willa D. Mung’Omba
(Zambia)
5th President 1985Babacar N’diaye (Senegal)
6th President 1995Omar Kabbaj (Morocco)
AfDB is rated AAA by Moody’s and AA by S&P in 1984
3rd General Capital Increase to USD 3.7 billion
Bank loans and grants reach USD 879 million in 1984
74 members countries
AfDB rated AAA by Fitch in 1992 4th General Capital Increase to
USD 25.1 billion Bank loans and grants reach USD
1.4 billion in 1994 77 members countries
New vision of economic growth with equity and poverty reduction as goals
AfDB regains its AAA rating by S&P in 2003
Temporary relocation of the Bank to Tunis
5th General Capital Increase to USD 33.9 billion
Decentralization is launched Bank loans and grants reach
USD 2.7 billion in 2004
63

64
Focus on reducing the infrastructure
gap
Expanding privatesector operations
Decentralization
African LegalSupport Facility
USD 3 billion Enhanced Private Sector Assistance
for Africa
Extractive Industries
TransparencyInitiative
Climate Change Action Plan
Tripling of the Bank’s capital to USD 100 billion
Response to the 2008 global
financial and economic crisis
Strong response to the 2007 food crisis
Integrated Safeguards
System
USD 2 billion Africa Growing Together Fund
3 new countries joining the Bank
Africa50
Return of the Bank to
Headquarters
Loans and grants reaching USD 6.5
billion in 2014
Response to the Ebola Virus
Disease
Amendment of the credit policy
AfDB 2005 - 2015
Strategic foresightin navigating extra-
ordinary economic & political challenges
7th President 2005Donald Kaberuka
(Rwanda)
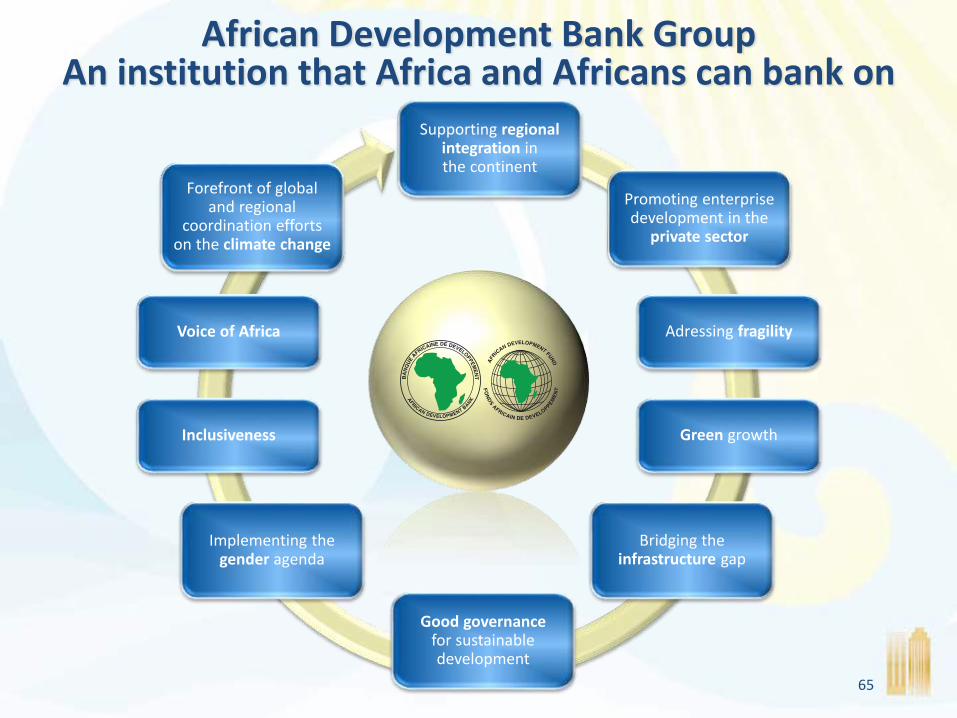
Supporting regional integration in the continent
Promoting enterprise development in the
private sector
Bridging the infrastructure gap
Good governancefor sustainable development
Implementing the gender agenda
Forefront of global and regional
coordination efforts on the climate change
African Development Bank GroupAn institution that Africa and Africans can bank on
65
Adressing fragility
Green growthInclusiveness
Voice of Africa

66
(216) 71 10 39 00(216) 71 35 19 33
Investor Contact:[email protected]
www.afdb.org
afdb_acc AfDB_Group
For More Information
African Development Bank Group
67
Appendix
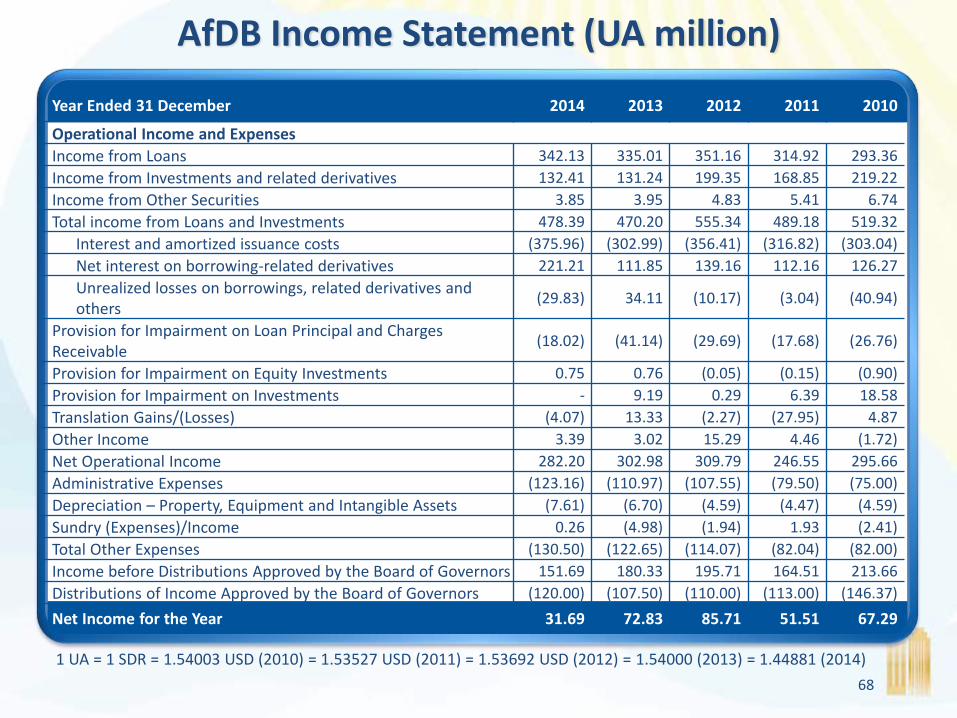
AfDB Income Statement (UA million)
Year Ended 31 December 2014 2013 2012 2011 2010
Operational Income and Expenses
Income from Loans 342.13 335.01 351.16 314.92 293.36
Income from Investments and related derivatives 132.41 131.24 199.35 168.85 219.22
Income from Other Securities 3.85 3.95 4.83 5.41 6.74
Total income from Loans and Investments 478.39 470.20 555.34 489.18 519.32
Interest and amortized issuance costs (375.96) (302.99) (356.41) (316.82) (303.04)
Net interest on borrowing-related derivatives 221.21 111.85 139.16 112.16 126.27
Unrealized losses on borrowings, related derivatives and others
(29.83) 34.11 (10.17) (3.04) (40.94)
Provision for Impairment on Loan Principal and Charges Receivable
(18.02) (41.14) (29.69) (17.68) (26.76)
Provision for Impairment on Equity Investments 0.75 0.76 (0.05) (0.15) (0.90)
Provision for Impairment on Investments - 9.19 0.29 6.39 18.58
Translation Gains/(Losses) (4.07) 13.33 (2.27) (27.95) 4.87
Other Income 3.39 3.02 15.29 4.46 (1.72)
Net Operational Income 282.20 302.98 309.79 246.55 295.66
Administrative Expenses (123.16) (110.97) (107.55) (79.50) (75.00)
Depreciation – Property, Equipment and Intangible Assets (7.61) (6.70) (4.59) (4.47) (4.59)
Sundry (Expenses)/Income 0.26 (4.98) (1.94) 1.93 (2.41)
Total Other Expenses (130.50) (122.65) (114.07) (82.04) (82.00)
Income before Distributions Approved by the Board of Governors 151.69 180.33 195.71 164.51 213.66
Distributions of Income Approved by the Board of Governors (120.00) (107.50) (110.00) (113.00) (146.37)
Net Income for the Year 31.69 72.83 85.71 51.51 67.29
1 UA = 1 SDR = 1.54003 USD (2010) = 1.53527 USD (2011) = 1.53692 USD (2012) = 1.54000 (2013) = 1.44881 (2014)
68
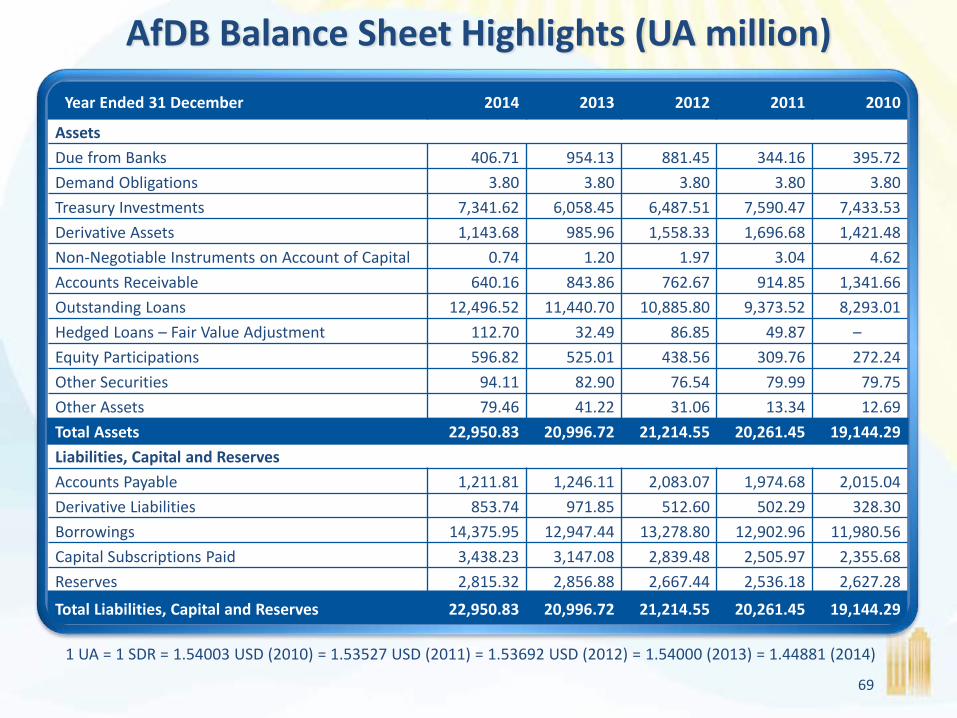
Year Ended 31 December 2014 2013 2012 2011 2010
Assets
Due from Banks 406.71 954.13 881.45 344.16 395.72
Demand Obligations 3.80 3.80 3.80 3.80 3.80
Treasury Investments 7,341.62 6,058.45 6,487.51 7,590.47 7,433.53
Derivative Assets 1,143.68 985.96 1,558.33 1,696.68 1,421.48
Non-Negotiable Instruments on Account of Capital 0.74 1.20 1.97 3.04 4.62
Accounts Receivable 640.16 843.86 762.67 914.85 1,341.66
Outstanding Loans 12,496.52 11,440.70 10,885.80 9,373.52 8,293.01
Hedged Loans – Fair Value Adjustment 112.70 32.49 86.85 49.87 –
Equity Participations 596.82 525.01 438.56 309.76 272.24
Other Securities 94.11 82.90 76.54 79.99 79.75
Other Assets 79.46 41.22 31.06 13.34 12.69
Total Assets 22,950.83 20,996.72 21,214.55 20,261.45 19,144.29
Liabilities, Capital and Reserves
Accounts Payable 1,211.81 1,246.11 2,083.07 1,974.68 2,015.04
Derivative Liabilities 853.74 971.85 512.60 502.29 328.30
Borrowings 14,375.95 12,947.44 13,278.80 12,902.96 11,980.56
Capital Subscriptions Paid 3,438.23 3,147.08 2,839.48 2,505.97 2,355.68
Reserves 2,815.32 2,856.88 2,667.44 2,536.18 2,627.28
Total Liabilities, Capital and Reserves 22,950.83 20,996.72 21,214.55 20,261.45 19,144.29
AfDB Balance Sheet Highlights (UA million)
1 UA = 1 SDR = 1.54003 USD (2010) = 1.53527 USD (2011) = 1.53692 USD (2012) = 1.54000 (2013) = 1.44881 (2014)
69