ecoregion-based conservation assessments of the southwestern
TRANSCRIPT

ECOREGION-BASED CONSERVATION ASSESSMENTS OF THE SOUTHWESTERN UNITED STATES AND NORTHWESTERN MEXICO
A GEODATABASE FOR SIX ECOREGIONS, INCLUDING THE APACHE HIGHLANDS, ARIZONA-NEW MEXICO MOUNTAINS, COLORADO PLATEAU, MOJAVE DESERT, SONORAN DESERT, AND
SOUTHERN ROCKY MOUNTAINS
ROB MARSHALL, MICHAEL LIST, AND CAROLYN ENQUIST
MAY 2006

PREFERRED CITATION:
Marshall, R., M. List, and C. Enquist. 2006. Ecoregion-Based Conservation Assessments of the Southwestern United States and Northwestern Mexico: A Geodatabase for Six Ecoregions, Including the Apache Highlands, Arizona-New Mexico Mountains, Colorado Plateau, Mojave Desert, Sonoran Desert, and Southern Rocky Mountains. Prepared by The Nature Conservancy, Tucson, AZ. 37 pp. Available at www.azconservation.org

EXECUTIVE SUMMARY
In 1995 The Nature Conservancy developed a new conservation framework – ecoregional assessments – to guide development of a blueprint for regional-scale conservation efforts. Ecoregions are large areas of land and water – on the scale of tens of millions of acres – characterized by distinct plant and animal communities, similar landforms, and environmental conditions such as climate. The framework’s foundation was a systematic and comprehensive scientific analysis intended to serve as a guide for prioritizing the organization’s work, engaging collaborators, and providing a context for understanding how individual projects fit into a larger conservation vision. Agency, university, institutional, and tribal resource professionals played a major role in the development of the assessments. Conservation assessments were completed for the southwestern U.S. and northwestern Mexico between 1999 and 2004.
Ecoregions are based on ecological rather than political boundaries. As a result they often bisect federal, state, private, and tribal jurisdictional boundaries, complicating the use of assessment data by public land managers and others. The six assessments covering the southwestern U.S. and northwestern Mexico were completed independent of one another; the methodology used did not ensure that data could be aggregated by simply combining the six assessments. Without additional data standardization and reconciliation, the utility of ecoregional assessments would be limited to the boundaries of each respective ecoregion. To solve this problem and to create a cross-ecoregional dataset that would facilitate analyses at multiple scales, we aggregated and standardized data from the six assessments into a single spatial dataset, referred to as the “six-ecoregion geodatabase.”
A primary goal in compiling the six-ecoregion geodatabase was to facilitate conservation-related analyses and problem-solving at multiple scales and across jurisdictional and political boundaries. Several additional goals included:
� Enable review and analysis with a single dataset of conservation priorities across a large multi-state region.
� Introduce conservation priorities for a large region that shares similar challenges of habitat loss and fragmentation and increasing pressures on limited water resources from rapid urban and ex-urban growth, and, likely, climate-induced changes in the distribution of habitat for the region’s biological diversity.
� Enable land managers, planners, policy-makers, and conservationists to evaluate, visualize, plan, and implement conservation actions across jurisdictional and political boundaries.
The six assessments compiled in this study evaluated 238 million acres across 11 states and two countries. Overall, more than 1300 species and 350 native plant communities and ecological systems were analyzed as part of the assessment process. The end result was a network of lands comprising 100 million acres (42% of the study area) where conservation should play a significant role if we are to maintain the region’s biological diversity. The median size class of the areas comprising the network is from 50,000 to 250,000 acres. The comprehensive datasets and systematic analyses used to identify the network represent a new, synthetic data source for agencies, institutions, and organizations engaged in land-use planning and conservation land management.
Sixty-five percent of the network occurs on federal lands with Bureau of Land Management (BLM) and U.S. Forest Service (USFS) lands comprising 47% of the total network. Private lands, the next largest category, comprise 19% of the network. Underscoring the importance of the federal estate for conservation management, the U.S. Forest Service, Department of Defense, and Bureau of Land Management each has between 44% and 51% of their holdings within the network; the U.S. Fish and
i

Wildlife Service and National Park Service have 84% and 78%, respectively, of their holdings within the network. Moreover, 54% of the individual areas that make up the network have at least three major land managers responsible for on-the-ground management, affirming the fact that ecosystems don’t stop at jurisdictional boundaries.
Conservation assessments purporting to identify priorities, typically, are identifying a set of tradeoffs. Identifying tradeoffs explicitly is one of the purposes of ecoregional assessments. In rapidly-growing areas, such as the southwestern U.S., conservation options are foreclosed on a daily basis and resources are inadequate to protect all important lands and waters. The assessment work represents the first attempt for this region at a systematic, comprehensive analysis and identification of conservation priorities at a scale commensurate with the scope and magnitude of change caused by human activities. The comprehensive, systematic, and explicit nature of the assessments can better enable decision-makers and other leaders in institutions and agencies to plan, fund, and implement conservation-related activities in a manner that enhances biological diversity while carrying out unrelated activities in a manner that minimizes further losses of biological diversity.
There are several important applications of ecoregional data. The network represents an important geography on federal, state, and private lands for which land-use allocations may be evaluated for their compatibility with the conservation values present. The broad diversity of systems and species used to represent the region’s biological diversity provide a starting point for evaluations of the extent to which natural disturbance regimes – important for perpetuating habitat – are operating on the landscape. Furthermore, reducing stressors and threats in this geography will increase the likelihood that the region’s ecological systems and species remain viable, an important component of management focused on maintaining “healthy ecosystems.” Action to promote natural disturbance processes at appropriate scales and minimize known stressors and threats throughout the network should, over time, limit the need for additional listings under the Endangered Species Act.
Many federal, state, county, and municipal agencies are completing land-use, land management, wildlife conservation, or habitat conservation plans. These efforts typically encourage or require collaboration and planning across jurisdictional boundaries to leverage limited funding and increase overall effectiveness. Ecoregional data are well-suited for these purposes and have been integrated into numerous planning efforts throughout the U.S. Among the unique aspects of ecoregional assessments is the integration of aquatic/riparian- and terrestrial-based data into unified geographies that lend themselves to “watershed” or “ecosystem-based” management. With the proliferation of planning efforts underway, such as the National Fish Habitat Initiative, State Comprehensive Wildlife Conservation Plans, federal land management plans etc., ensuring integration of the terrestrial and aquatic realms into a cohesive and effective set of management strategies will be paramount. The prospect of achieving large-scale system-level restoration and management presents a unique challenge for all planning efforts because funding for such work remains limited. If large-scale, cooperative conservation planning is the new prerequisite for capturing federal, state, and private conservation funds, then a first step for emerging efforts might be to critically evaluate the opportunities that can be leveraged with contemporary, cross-boundary ecoregional assessments that unify terrestrial and aquatic conservation priorities before additional investments are made in new priority-setting exercises.
ii

ACKNOWLEDGMENTS
Development of the standardized geodatabase benefited from the assistance of Anne Gondor, Steven Yanoff, Gen Green, Brian McCready, Ty Guthrie, and Betsy Neely. We thank Joni Ward and Tim Sullivan for reviewing earlier drafts of this report. Funding for this project was provided by the Wallace Research Foundation. Special thanks to Carter Roberts and Roger Sayre whose encouragement and financial support helped get the project underway.
iii

TABLE OF CONTENTS
EXECUTIVE SUMMARY...................................................................................................................... i
ACKNOWLEDGMENTS ..................................................................................................................... iii
INTRODUCTION .................................................................................................................................1
ECOREGIONAL ASSESSMENT OVERVIEW ...................................................................................................... 2Ecoregions ....................................................................................................................................... 2 Ecoregional assessment approach.................................................................................................... 2 The role of partner agencies, institutions, and tribes ....................................................................... 5 Ecoregional assessment components ............................................................................................... 5
Conservation targets ........................................................................................................... 6 Conservation goals.............................................................................................................. 7Viability assessment ........................................................................................................... 7 Identification of conservation areas .................................................................................... 9
The conservation area network ...................................................................................................... 11
USE OF ECOREGIONAL ASSESSMENT DATA............................................................................................ 14 Land management status and the network of conservation areas .................................................. 14 Cooperative land management focused on ecosystem health ........................................................ 15 State wildlife conservation plans ................................................................................................... 16 National Fish Habitat Initiative...................................................................................................... 17
THE SIX-ECOREGION GEODATABASE ..............................................................................................19Development of the geodatabase ................................................................................................... 19
Data content and attributes................................................................................................ 19 Data standardization ......................................................................................................... 20Reconciling spatial overlap of conservation areas at ecoregional boundaries .................. 20 Database schema and conventions.................................................................................... 23
Geodatabase function..................................................................................................................... 24 Generating conservation target lists per conservation area............................................... 24 Generating conservation area lists for particular conservation targets ............................. 24 Generating comparison data for the 568 conservation areas ............................................ 24
LITERATURE CITED.........................................................................................................................25
APPENDICES....................................................................................................................................27
Appendix 1. Reference list for conservation areas in which boundaries were evaluated for modification in the six-ecoregion geodatabase............................................................................................... 27
iv

LIST OF TABLES
Table 1. Comparison of Attributes and Summary Statistics for Six Ecoregional Assessments in the Southwestern United States and Northwestern Mexico................................................................... 3
Table 2. The Number of Fine Filter Conservation Targets by Taxonomic Group for Six Ecoregions of the Southwestern United States and Northwestern Mexico................................................................... 7
Table 3. The Number of Fine Filter Conservation Targets by Level of Rarity for Six Ecoregions of the Southwestern United states and Northwestern Mexico ................................................................... 8
Table 4. Example Conservation Goals for Conservation Targets in Six Ecoregional Assessments for the Southwestern United States and Northwestern Mexico................................................................... 8
Table 5. Example Data Records for Eleven Standardized Attributes in the Six-Ecoregion Geodatabase..... 22
LIST OF FIGURES
Figure 1. Six Ecoregions of the Southwestern United States and Northwestern Mexico .............................. 4
Figure 2. Fine Filter Species Occurrence Data for the Huachuca Mountains Grassland Valley Complex Conservation Area ......................................................................................................................... 9
Figure 3. Ecological Systems Data for the Huachuca Mountains Grassland Valley Complex Conservation Area ............................................................................................................................................... 10
Figure 4. Apache Highlands Cost Surface for the Huachuca Mountains Grassland Valley Complex and Environs......................................................................................................................................... 10
Figure 5. Conservation Areas Delineated for the Six Ecoregions ................................................................. 12
Figure 6. Frequency Distribution for the Size of Conservation Areas in the Six-Ecoregion Study Area...... 13
Figure 7. Management Status for Conservation Areas Identified in the Six-Ecoregion Study area.............. 14
Figure 8. The Conservation Area Network Identified in the Six-Ecoregion Study Area as a Function of the Total Area Managed by Major Land Managers....................................................................... 15
Figure 9. Historical Fire Frequency for the Primary Vegetation Types in Southeastern Arizona ................. 16
Figure 10. The Conservation Area Network by the Number of Terrestrial ESA-Listed Species and Non-Listed Rare Species ....................................................................................................................... 17
Figure 11. The Conservation Area Network by the Number of Aquatic and Riparian ESA-Listed Species and Non-Listed Rare Species ........................................................................................................ 18
Figure 12. Six-Ecoregion Geodatabase Schema ............................................................................................. 23
v

THIS PAGE INTENTIONALLY LEFT BLANK.
vi

INTRODUCTION
In 1995 The Nature Conservancy (TNC) developed a conservation framework – ecoregional assessments – to guide development of a blueprint for regional-scale conservation efforts. The framework’s foundation was a systematic and comprehensive scientific analysis to identify conservation needs of biodiversity at large scales that would serve as a guide for prioritizing the organization’s work, engaging collaborators, and provide a context for understanding how individual projects fit into a larger conservation vision. By the late 1990s TNC began completing ecoregional assessments for the United States and portions of the 27 countries in which the Conservancy works. Ecoregions are large areas of land and water – on the scale of tens of millions of acres – characterized by distinct plant and animal communities, similar landforms, and environmental conditions such as climate. In using biological and physical characteristics to evaluate biodiversity rather than political boundaries, ecoregional assessments facilitated two important elements missing in most conservation efforts: an evaluation of the ecological systems, or habitat, across broad geographies that species rely upon for their survival; and the identification of geographies where collaboration across jurisdictional boundaries could leverage limited funds for conservation land management and, therefore, improve the overall chances that conservation at meaningful scales could be accomplished.
Ecoregions provide useful analytical units for evaluating the needs of biological diversity because they capture large proportions, if not entire distributions, of major ecological systems and individual species. However, because ecoregions are based on biological features, their boundaries often bisect federal, state, private, and tribal jurisdictional boundaries, which complicates use of individual ecoregional datasets by public land managers and others. In the southwestern U.S. and northwestern Mexico six ecoregional assessments were completed between 1999 and 2004 (Table 1), including the Apache Highlands (Marshall et al. 2004), Colorado Plateau (Tuhy et al. 2002), Southern Rocky Mountains (Neely et al. 2001), Mojave Desert (The Nature Conservancy 2001), Sonoran Desert (Marshall et al. 2000), and Arizona-New Mexico Mountains (Bell et al. 1999). Each assessment was completed independent of the others, and the methodology used did not ensure that data could be aggregated together by simply combining data from the six assessments. Without additional data standardization and reconciliation, ecoregional assessments would provide important ecological and conservation information, but the information would be limited to the boundaries of each respective ecoregion. To solve this problem and to create a cross-ecoregional dataset that would facilitate analyses at multiple scales, we aggregated and standardized data from the six assessments into a single spatial dataset, referred to hereafter as the “six-ecoregion geodatabase.”
A primary goal in compiling the six-ecoregion geodatabase was to facilitate conservation-related analyses and problem-solving at multiple scales and across jurisdictional and political boundaries. Several additional goals included:
� Enable review and analysis with a single dataset of conservation priorities across a large multi-ecoregion, multi-state, and multi-country region.
� Introduce conservation priorities, as identified by the ecoregional assessment work completed since 1999, for a large region that shares similar challenges of habitat loss and fragmentation and increasing pressures on limited water resources from rapid urban and ex-urban growth, and, likely, climate-induced changes in the distribution of habitat for the region’s biological diversity.
� Enable land managers, planners, and conservationists to visualize, plan, and implement conservation actions across jurisdictional and political boundaries.
This report provides brief background information on ecoregional assessments, describes the contents and process used to compile the geodatabase, and provides example applications for ecoregional
Ecoregion-Based Conservation Assessments for the Southwestern U.S. and Northwestern Mexico Page 1

assessment data. The geodatabase, metadata, and this document may be downloaded from the Ecoregional Assessments page at http://www.azconservation.org.
ECOREGIONAL ASSESSMENT OVERVIEW
Ecoregions
The Nature Conservancy used the U.S.D.A. Forest Service ECOMAP framework (Bailey 1994, 1995, 1998) as the basis for delineating North American ecoregions. Modifications to Bailey’s framework were made where regional datasets or expertise resulted in enhanced boundaries for conservation-based analyses. The geographic bounds of the six-ecoregion study area are illustrated in Figure 1. Combined, the six-ecoregion study area totals approximately 238 million acres.
Ecoregional assessment approach
Ecoregional assessments are comprehensive and systematic analyses of existing and newly-developed data that address the status and condition of native species, ecological systems, and abiotic resources such as water. Assessments also integrate data on human activities that directly or indirectly affect the distribution and abundance of native organisms and habitats. The goal of these conservation assessments is to identify an efficient network of lands that are still intact and support native species, and if managed to reduce threats would decrease the chances that species would go extinct or habitats would be lost past a threshold where they no longer could support species. Ecoregional assessments integrate data from multiple taxonomic groups (e.g., amphibians, birds, fish, invertebrates, mammals, plants, reptiles, etc.) and focus on identifying biologically and ecologically important lands systematically across any geography. For example, of the 238 million acres evaluated in the six ecoregional assessments covered in this report, approximately 101 million acres, or 42% of the lands in the southwestern U.S. and northwestern Mexico, were identified as important for maintaining the viability of the region’s biological diversity. Ecoregional assessments also serve several conservation, management, and scientific purposes, including:
1. A spatial hypothesis on how to maximize the viability (or reduce the chances of extinction) of a region’s native species and ecological systems.
2. A spatial delineation of the areas where land-uses and land management activities should be evaluated to identify and minimize potential adverse effects to the viability of species and ecological systems.
3. A spatial delineation of the areas that land managers and others interested in promoting conservation should evaluate first to ensure that disturbance processes that perpetuate native ecological systems (e.g., fire, flooding) are maintained at a scale, frequency, and intensity that falls within the historical range of variation.
4. A network of cross-jurisdictional conservation priorities that could serve as a basis for collaboration among public and private land managers that focus limited conservation funds to maximize conservation values.
Combined, the six assessments represent the most comprehensive identification of areas in the southwestern U.S. and northwestern Mexico where enhanced conservation management would benefit biodiversity conservation. With the extensive integration and synthesis of traditional and contemporary datasets, ecoregional assessments also represent a new source of information to better frame conservation issues, support development of conservation strategies, and support partner needs for new scientific assessment information.
Ecoregion-Based Conservation Assessments for the Southwestern U.S. and Northwestern Mexico Page 2
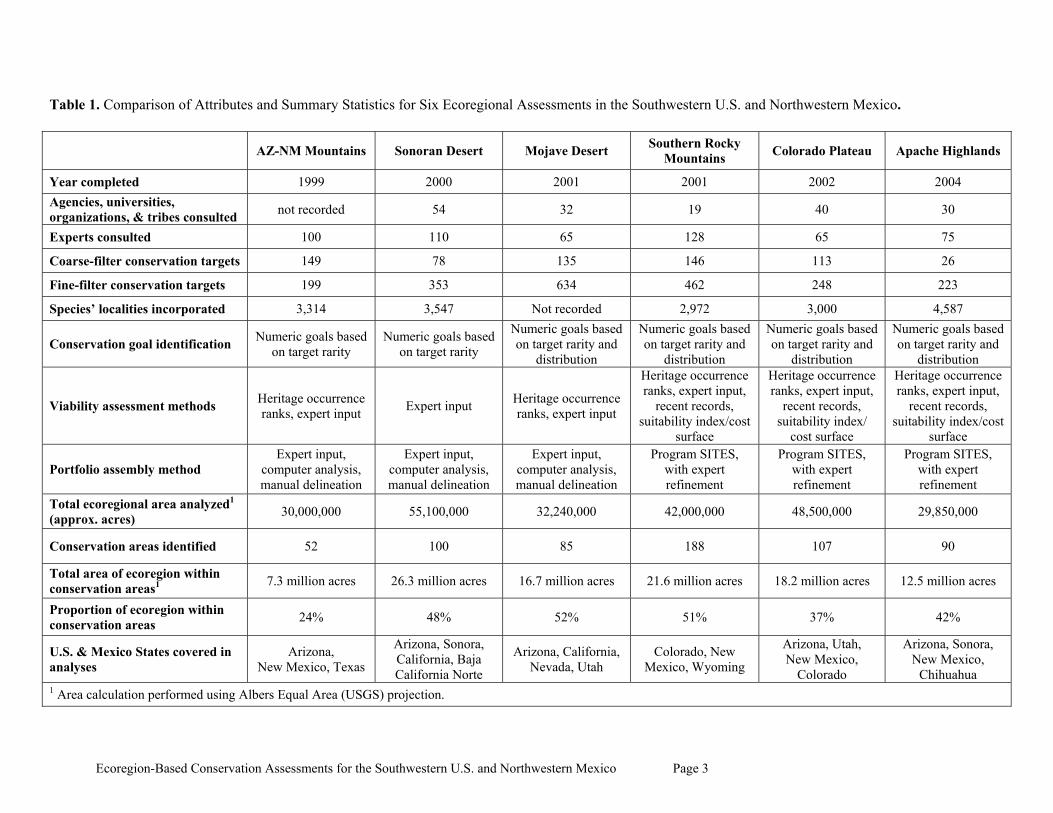
Table 1. Comparison of Attributes and Summary Statistics for Six Ecoregional Assessments in the Southwestern U.S. and Northwestern Mexico.
AZ-NM Mountains Sonoran Desert Mojave Desert Southern Rocky Mountains Colorado Plateau Apache Highlands
Year completed 1999 2000 2001 2001 2002 2004 Agencies, universities, organizations, & tribes consulted not recorded 54 32 19 40 30
Experts consulted 100 110 65 128 65 75
Coarse-filter conservation targets 149 78 135 146 113 26
Fine-filter conservation targets 199 353 634 462 248 223
Species’ localities incorporated 3,314 3,547 Not recorded 2,972 3,000 4,587
Conservation goal identification Numeric goals based on target rarity
Numeric goals based on target rarity
Numeric goals based on target rarity and
distribution
Numeric goals based on target rarity and
distribution
Numeric goals based on target rarity and
distribution
Numeric goals based on target rarity and
distribution
Viability assessment methods Heritage occurrence ranks, expert input Expert input Heritage occurrence
ranks, expert input
Heritage occurrence ranks, expert input,
recent records, suitability index/cost
surface
Heritage occurrence ranks, expert input,
recent records, suitability index/
cost surface
Heritage occurrence ranks, expert input,
recent records, suitability index/cost
surface
Portfolio assembly method Expert input,
computer analysis, manual delineation
Expert input, computer analysis, manual delineation
Expert input, computer analysis, manual delineation
Program SITES, with expert refinement
Program SITES, with expert refinement
Program SITES, with expert refinement
Total ecoregional area analyzed1
(approx. acres) 30,000,000 55,100,000 32,240,000 42,000,000 48,500,000 29,850,000
Conservation areas identified 52 100 85 188 107 90
Total area of ecoregion within conservation areas1 7.3 million acres 26.3 million acres 16.7 million acres 21.6 million acres 18.2 million acres 12.5 million acres
Proportion of ecoregion within conservation areas 24% 48% 52% 51% 37% 42%
U.S. & Mexico States covered in analyses
Arizona, New Mexico, Texas
Arizona, Sonora, California, Baja California Norte
Arizona, California, Nevada, Utah
Colorado, New Mexico, Wyoming
Arizona, Utah, New Mexico,
Colorado
Arizona, Sonora, New Mexico,
Chihuahua 1 Area calculation performed using Albers Equal Area (USGS) projection.
Ecoregion-Based Conservation Assessments for the Southwestern U.S. and Northwestern Mexico Page 3

Ecoregion-Based Conservation Assessments for the Southwestern U.S. and Northwestern Mexico Page 4
The role of partner agencies, institutions, and tribes
Agencies, institutions, organizations, and tribes played several important roles in the development of ecoregional assessments. The compilation and analysis of data involved dozens of scientists, land managers, and other technical experts familiar with specific ecoregions. For example, the Sonoran Desert Ecoregional Assessment relied on data and input from 110 experts from 54 public agencies, academic institutions, conservation organizations, tribes, and private resource professionals (Marshall et al. 2000). Refer to Table 1 for basic summary information on partners engaged in the individual assessments.
To help ensure broad understanding of the assessment process and its goals, assessment projects typically started with a series of outreach meetings. For example, prior to initiating the Apache Highlands assessment, 14 meetings were convened with the U.S. Forest Service, Natural Resources Conservation Service, Bureau of Land Management, U.S. Fish & Wildlife Service, U.S.D.A. Agricultural Research Station, White Mountain Apache and Phelps Dodge (Marshall et al. 2004).
Partners were also incorporated into the core working teams charged with completing the assessments. For example, the Sonoran and Apache Highlands assessments were completed as bi-national projects; subject experts and institutional representatives from Mexico participated on working teams and were provided funding to facilitate transportation to meetings, development of data, etc. The New Mexico Natural Heritage Program was represented on the AZ-NM Mountains assessment team, the Arizona Game & Fish Department was represented on both the Apache Highlands and Sonoran Desert assessment teams, and the Southern Rocky Mountains had representation from USFS, BLM, and Colorado Division of Wildlife.
Finally, partners often provided funding for the assessment efforts; the Sonoran and Mojave desert assessments benefited from Department of Defense funding and the Southern Rocky Mountains assessment was funded by the U.S. Forest Service, Colorado Division of Wildlife, and Bureau of Land Management.
Ecoregional assessment components
The methodology used to derive ecoregional assessments was developed by The Nature Conservancy and partners and is described in several publications (Groves et al. 2002, Groves 2003, The Nature Conservancy 1997, 2000a, 2000b). For specific details on the application of this methodology to the six ecoregions described herein, consult the individual ecoregional assessments highlighted in the sections below. Below is a brief description of the four major components of an ecoregional assessment and an example that illustrates how the integration of assessment components influences the identification of conservation areas.
There are four components of the assessment methodology that distinguish ecoregional assessments and associated datasets from other conservation assessment exercises (Groves et al. 2000, The Nature Conservancy 2000a), including:
1) Identification of conservation targets, which are the ecological systems and broad group of species used to represent an ecoregion’s biological diversity.
2) Identification of conservation goals, the number of populations or patch sizes and spatial distribution assigned to each conservation target as a hypothesis for the minimum needed to maintain viability and to facilitate basic accounting during the analytical process of identifying conservation areas.
3) Assessment of viability for conservation targets to minimize inclusion of data on non-viable locations, non-viable patch sizes or species for which viability or long-term persistence is
Ecoregion-Based Conservation Assessments for the Southwestern U.S. and Northwestern Mexico Page 5

questionable. Viability is shorthand for species or species’ locations that are likely to persist over the long-term and not go extinct.
4) Identification of conservation areas sufficient in size and distribution to meet the conservation goals identified for each targets.
Conservation targets
Conservation targets are species, native plant communities, and ecological systems. They are the basic unit of analysis that, along with conservation goals, drive the ecoregional assessment process. Conservation targets are identified based on the “coarse filter – fine filter” approach (The Nature Conservancy 2000). The method attempts to integrate several different strategies for conserving biological diversity by evaluating and synthesizing data at the ecological system and species levels (Groves 2003). It also is referred to as a “representative” approach to conservation based on the underlying premise that protecting representative examples of ecosystems would also protect the vast majority of species contained within them.
The coarse filter is represented by a continuous dataset of ecological systems with all systems across an ecoregion having equal conservation value. For example, a commonly-used dataset to derive ecological systems is plant community data from the USGS GAP Analysis Program. In the assessment process, all plant communities would be selected as conservation targets and the conservation value of creosote-bursage desertscrub would be equal to that of an aspen stand (however, the conservation goals identified for each may differ). Analyzing biological organization at this scale has two advantages. First, it enables one to factor in the role of ecological processes, such as the dominant disturbance regimes, that play an important role in maintaining the structure and function of ecological systems. Second, larger scales of analysis are more likely to capture two important components of biological diversity - ecological and genetic variation. A total of 366 coarse-filter conservation targets were analyzed in the 6 ecoregion study area. Table 1 provides a basic comparison of coarse-filter targets across the 6 ecoregion dataset. Note, the AZ-NM Mountains assessment team concluded that available vegetation data for New Mexico, at that time, was not suitable for use as a continuous dataset that could accurately represent the coarse filter. In its place, the analysis relied on vegetation community data from U.S. Forest Service, NM Natural Heritage Program, and Sevilleta National Wildlife Refuge. Thus, the assessment integrated data for selected declining and representative species and vegetation communities as surrogates for the biodiversity of the ecoregion, but did not include a continuous, coarse-filter dataset.
The premise of the fine filter is to evaluate the individual species whose rarity or some aspect of life-history requirements might not be adequately captured by coarse-filter analyses. Candidates for the fine filter include, but are not limited to, species with narrow habitat requirements, rare or declining species, species extirpated from systems where their re-introduction is still feasible and important from an ecological standpoint, and species that have specific dispersal needs across multiple ecological systems and, therefore, may be particularly vulnerable to habitat fragmentation. The selection of fine filter species is necessarily biased by available data. However, ecoregional assessments typically include dozens of fine filter targets selected from a variety of taxonomic groups and spanning all levels of rarity (i.e., rare to common). For example, 223 species from 7 taxonomic groups were analyzed for the Apache Highlands (Table 1; Marshall et al. 2004). For the six-ecoregion study area, 1374 fine-filter conservation targets were analyzed. Table 2 summarizes the taxonomic breadth of fine filter targets and Table 3 summarizes levels of rarity for fine filter targets based on global Heritage Program ranks. For a more detailed discussion of conservation targets refer to the Colorado Plateau Ecoregional Assessment (Tuhy et al. 2002).
Ecoregion-Based Conservation Assessments for the Southwestern U.S. and Northwestern Mexico Page 6

Table 2. The Number of Fine-Filter Conservation Targets by Taxonomic Group for Six Ecoregions of the Southwestern U.S. and Northwestern Mexico.
Ecoregion Amphi-bian Bird Crusta-
cean Fish Insect Other
Inverte-brate
Mammal Mollusk Vascu-
lar Plant
Non-Vasc. Plant
Reptile
All Ecoregions1 35 88 4 74 148 25 108 94 716 2 80
Apache Highlands 12 24 1 21 11 1 28 16 95 0 14
AZ-NM Mountains 6 10 1 21 6 0 17 28 99 0 5
Colorado Plateau 3 16 0 10 30 4 17 3 152 0 5
Mojave Desert 18 37 1 35 20 1 36 30 167 1 34
Sonoran Desert 10 31 0 22 24 17 31 12 170 1 32
Southern Rocky Mountains 4 23 1 9 99 16 34 16 172 0 4 1 Total for all ecoregions is for mutually exclusive targets; thus, the total for all ecoregions does not equal the sum of individual ecoregions because
ecoregions share some of the same targets.
Conservation goals
Conservation goals are identified for both coarse-filter and fine-filter targets. They are used for two purposes in ecoregional assessments: first, as a hypothesis for the number and distribution of each conservation target needed to maximize its viability; and, second, as an accounting unit to aid in determining the degree to which the identification of conservation areas meets established conservation goals. Conservation goals, typically, are expressed as a number and distribution of populations for species, and as an overall acreage, minimum patch size, and geographic distribution for ecological systems. Refer to Table 4 for example conservation goals and to the Southern Rocky Mountains Ecoregional Assessment (Neely et al. 2001) or Apache Highlands Ecoregional Assessment (Marshall et al. 2004) for a more detailed description of conservation goals. Note, due to time and funding constraints this iteration of the six-ecoregion geodatabase does not contain attributes for conservation goals.
Viability assessment
A primary focus of the field of conservation is to keep species viable and reduce the chances of extinction. The term viability is shorthand for maximizing the persistence of a species over time. Viability assessments were used to minimize inclusion of particular geographic areas within an ecoregion that no longer support intact ecological systems or occurrences of conservation targets with low chances of persistence. In the six ecoregional assessments described here, viability was assessed by one or more of the following methods; (1) review of Heritage Program/NatureServe evaluations of species occurrences (i.e., occurrence viability ranks); (2) review of the temporal distribution of target occurrence data for records lacking contemporary verification; (3) development of “cost surfaces/suitability indices” that depict variation in levels of infrastructure such as urban development, tilled agricultural areas, mines, and roads to predict where species viability might be impaired (see example below); and (4) contemporary expert input on the selection of targets and distribution of high-quality species habitat. Table 1 provides a listing of the viability assessment techniques used in ecoregional assessments. A more detailed description of a viability assessment may be found in the Southern Rocky Mountains Ecoregional Assessment (Neely et al. 2001).
Ecoregion-Based Conservation Assessments for the Southwestern U.S. and Northwestern Mexico Page 7
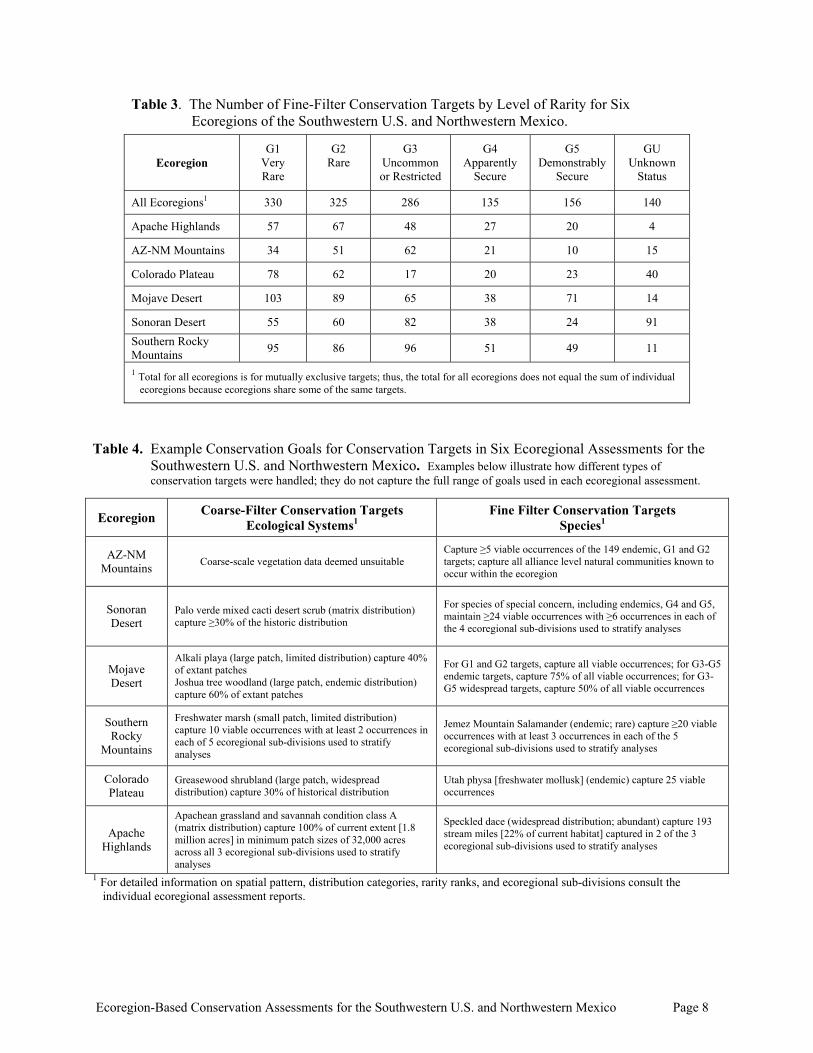
Table 3. The Number of Fine-Filter Conservation Targets by Level of Rarity for Six Ecoregions of the Southwestern U.S. and Northwestern Mexico.
Ecoregion G1
Very Rare
G2 Rare
G3 Uncommon or Restricted
G4 Apparently
Secure
G5 Demonstrably
Secure
GU Unknown
Status
All Ecoregions1 330 325 286 135 156 140
Apache Highlands 57 67 48 27 20 4
AZ-NM Mountains 34 51 62 21 10 15
Colorado Plateau 78 62 17 20 23 40
Mojave Desert 103 89 65 38 71 14
Sonoran Desert 55 60 82 38 24 91 Southern Rocky Mountains 95 86 96 51 49 11
1 Total for all ecoregions is for mutually exclusive targets; thus, the total for all ecoregions does not equal the sum of individual ecoregions because ecoregions share some of the same targets.
Table 4. Example Conservation Goals for Conservation Targets in Six Ecoregional Assessments for the Southwestern U.S. and Northwestern Mexico. Examples below illustrate how different types of conservation targets were handled; they do not capture the full range of goals used in each ecoregional assessment.
Ecoregion Coarse-Filter Conservation Targets Ecological Systems1
Fine Filter Conservation Targets Species1
AZ-NM Mountains Coarse-scale vegetation data deemed unsuitable
Capture ≥5 viable occurrences of the 149 endemic, G1 and G2 targets; capture all alliance level natural communities known to occur within the ecoregion
Sonoran Desert
Palo verde mixed cacti desert scrub (matrix distribution) capture ≥30% of the historic distribution
For species of special concern, including endemics, G4 and G5, maintain ≥24 viable occurrences with ≥6 occurrences in each of the 4 ecoregional sub-divisions used to stratify analyses
Mojave Desert
Alkali playa (large patch, limited distribution) capture 40% of extant patches Joshua tree woodland (large patch, endemic distribution) capture 60% of extant patches
For G1 and G2 targets, capture all viable occurrences; for G3-G5 endemic targets, capture 75% of all viable occurrences; for G3-G5 widespread targets, capture 50% of all viable occurrences
Southern Rocky
Mountains
Freshwater marsh (small patch, limited distribution) capture 10 viable occurrences with at least 2 occurrences in each of 5 ecoregional sub-divisions used to stratify analyses
Jemez Mountain Salamander (endemic; rare) capture ≥20 viable occurrences with at least 3 occurrences in each of the 5 ecoregional sub-divisions used to stratify analyses
Colorado Plateau
Greasewood shrubland (large patch, widespread distribution) capture 30% of historical distribution
Utah physa [freshwater mollusk] (endemic) capture 25 viable occurrences
Apache Highlands
Apachean grassland and savannah condition class A (matrix distribution) capture 100% of current extent [1.8 million acres] in minimum patch sizes of 32,000 acres across all 3 ecoregional sub-divisions used to stratify analyses
Speckled dace (widespread distribution; abundant) capture 193 stream miles [22% of current habitat] captured in 2 of the 3 ecoregional sub-divisions used to stratify analyses
1 For detailed information on spatial pattern, distribution categories, rarity ranks, and ecoregional sub-divisions consult the individual ecoregional assessment reports.
Ecoregion-Based Conservation Assessments for the Southwestern U.S. and Northwestern Mexico Page 8

Identification of conservation areas
Conservation areas are one of the primary outcomes of an ecoregional assessment. They delineate the lands and waters that (1) contain ecological systems of sufficient size and functioning to maintain dominant disturbance regimes, and (2) contain populations of target species in sufficient number and distribution to maximize their persistence over time. They represent the integration and synthesis of conservation target data, conservation goals, and assessments of target viability. Conservation areas were identified using a combination of computer analyses and manual delineation for ecoregional assessments completed prior to 2001. The GIS-based site selection algorithm, SITES (Andelman et al. 1999), was the primary tool used to identify conservation areas for assessments completed after 2001 (see Table 1). For a description of the parameters and parameter values used to generate conservation areas with SITES refer to Appendix 6 of the Apache Highlands Ecoregional Assessment (Marshall et al. 2004).
Below, we use a series of figures to illustrate the integration of conservation targets, conservation goals, and a viability assessment in the identification of a conservation area in the Apache Highlands Assessment – the 1.4 million-acre Huachuca Mountains Grassland Valley Complex along the Arizona-Sonora borderlands (Marshall et al. 2004). In each figure the conservation area is identified by the green polygon outline. This series of figures demonstrates the effects of the coarse-filter and viability assessment on the delineation of conservation areas.
Figure 2 depicts the distribution of data for 101 fine filter conservation targets. The points represent species locations with colors used to distinguish among taxonomic groups. Note the number of taxonomic groups captured in this conservation area and the significant disparity in fine filter data available between the U.S. and Mexico.
Figure 3 depicts the distribution of 18 ecological systems. High quality native grasslands, as mapped by Gori and Enquist (2003), are depicted in green. The ecoregion-wide conservation goal for this system consisted of a total amount of grassland to be captured (1.8 million acres or 100% of the remainder of this system) and a minimum patch size. Although the overall conservation goal for this system appears high, conserving 100% represents only 24% of the historical extent of this grassland type (Gori and Enquist 2003). We selected a relatively large minimum patch size of 32,000 acres based on an analysis of the distribution of patch sizes and an assumption that larger, unfragmented patches maintained as high quality
Ecoregion-Based Conservation Assessments for the Southwestern U.S. and Northwestern Mexico Page 9

Ecoregion-Based Conservation Assessments for the Southwestern U.S. and Northwestern Mexico Page 10

native grasslands would maximize viability for grassland species. Note that despite the lack of fine filter data for the Mexico portion, 47% of the conservation area lies on the Mexico side of the border. This is largely the result of the extensive grassland that occurs in the Mexico portion. This graphic illustrates how good coarse filter data, combined with conservation goals at a meaningful scale, can compensate for gaps in fine filter data in the delineation of conservation areas.
Figure 4 illustrates one type of viability assessment used in the ecoregional assessment process – a “cost” surface or suitability index. The graphic illustrates the effect of “cost” on the delineation of conservation areas. Increasing cost is depicted by increasingly dark shades of red. Cost is an additive but unit-free value represented by the extent of human infrastructure, such as mines and other industrial development, agriculture, urban development, and roads (see Marshall et al. 2004). The algorithm that delineated conservation areas was programmed to avoid high cost areas where conservation may be incompatible and or prohibitively costly. The Huachuca Mountains conservation area is delineated in green; the graphic illustrates how higher cost areas were largely avoided, such as the major highway corridor that borders the western boundary. Some high cost areas, such as the east side of the Huachuca Mountains adjacent to the city of Sierra Vista, were included, however. This is due to the high number of endemic species occurring in this mountain range. The inclusion of “high cost” areas indicates there are limited or no other alternatives in the ecoregion in which to protect those conservation targets. Cost analyses were used in the Apache Highlands, Colorado Plateau and Southern Rocky Mountain ecoregional assessments (Table 1).
The conservation area network
Carried out across an entire ecoregion, the process of identifying conservation areas described in Figures 2 – 4 yields the primary end product of the ecoregional assessment process, a network of “conservation areas.” The term “conservation area” is shorthand for the locations identified that capture the most important places to protect the 366 ecological systems and 1374 species analyzed over the six-ecoregion study area. The term does not convey special status to those areas; rather, the network of conservation areas is a blueprint for where enhanced attention to conservation management would contribute to a larger regional conservation vision. The purpose of this project was to aggregate and standardize conservation area data across the six-ecoregion study area.
The aggregation and standardization process resulted in a network of 568 conservation areas comprising nearly 100 million acres, or 42% of the six-ecoregion study area. Figure 5 depicts this network as a series of irregularly shaped polygons in green. Conservation areas range in size from just over 100 acres to approximately 5.7 million acres. Figure 6 provides a frequency distribution for the size of conservation areas. The vast majority of conservation areas (82%) are less than 250,000 acres in size; the median for all conservation areas was 50,000 acres. There are at least five factors that account for the size, shape, and distribution of the conservation area network, including:
1. The distribution of species and ecological systems is not uniform across the southwestern U.S. and northwestern Mexico. The considerable range in elevation (sea level to 14,000 feet) and complex topography in the six-ecoregion study area yields a non-uniform distribution of systems and species.
2. Habitat and other life-history requirements of target systems and species differ. For example, the San Fransciso groundsel (Senecio franciscanus) is restricted to alpine areas on the San Francisco Peaks in the Arizona – New Mexico Mountains ecoregion, whereas the endangered Sonoran pronghorn (Antilocapra americana sonoriensis) roams across nearly 6 million acres along the Arizona – Sonora borderlands in the Sonoran Desert ecoregion. The net result is that the size and shape of conservation areas is, in part, a function of the spatial occurrence of the conservation targets selected and the requirements of those targets as expressed by conservation goals.
Ecoregion-Based Conservation Assessments for the Southwestern U.S. and Northwestern Mexico Page 11

3. Species-level target data are not uniformly sampled across the landscape. Species-level datasets often contain taxonomic and geographic sampling biases. These biases are inherent in any analysis using species-level data. However, coarse-filter conservation targets may help overcome this bias as hypothesized in Figures 2-4.
4. The advent of computerized conservation area selection algorithms enabled assessment teams to program boundary modifier values that affect perimeter to interior ratios and the degree to which conservation areas were “connected.” Assessments, such as the Apache Highlands used higher values for the boundary modifier which yielded large, “connected” conservation areas.
5. Conservation area selection algorithms are programmed to identify an “efficient” network where conservation goals are met with a minimum amount of area. Thus, if a conservation target is found in two locations, but one location includes two additional conservation targets, the algorithm will select the area with the additional conservation targets (assuming viability and other factors are equal).
Ecoregion-Based Conservation Assessments for the Southwestern U.S. and Northwestern Mexico Page 12

Up to 10,000
10,001 - 50,00 0
50,001 - 250,000
250,001 - 500,00 0
500,001 - 1,000,00 0
1,000,001 - 5,700,000
0.40
0.35
0.30
0.25
0.20
0.15
0.10
0.05
0.00
250
200
150
100
50
0
Cou
nt
Prop
ortio
n of
Cou
nt
Acres
Figure 6. Frequency Distribution for the Size of Conservation Areas in the Six-Ecoregion Study Area.
One conclusion that might be drawn from inspection of the conservation area network in Figure 5 is that areas outside the network are not important biologically. This conclusion would be false for the following reasons: First, conservation area boundaries were intended to generally, rather than precisely, delineate the areas across the landscape harboring the most viable occurrences of species and ecological systems. Data precision across species and systems varies. Therefore, conservation area boundaries should be considered first approximations of areas that should be the focus of enhanced conservation management. Second, most lands and waters on Earth support life forms, food webs, and nutrient cycles, so any analysis purporting to identify priorities ultimately is identifying a set of tradeoffs. Identifying tradeoffs more explicitly is one of the purposes of ecoregional assessments. In rapidly-growing areas, such as the six-ecoregion study area, conservation options are foreclosed on a daily basis. The conservation area network represents the first attempt for the study area at a systematic and comprehensive analysis of scientific data and identification of a blueprint for biological diversity conservation at a scale commensurate with the scope and magnitude of change caused by human activities. The comprehensive, systematic, and explicit nature of the assessments can better enable decision-makers and other leaders in institutions and agencies to plan, fund, and implement conservation-related activities in a manner that enhances biological diversity or unrelated activities in a manner that minimizes further losses of biological diversity.
Ecoregion-Based Conservation Assessments for the Southwestern U.S. and Northwestern Mexico Page 13

USE OF ECOREGIONAL ASSESSMENT DATA
Land management status and the network of conservation areas
A basic use of ecoregional data is in visualizing the scale of needed conservation management, the geography in which to focus management, and in identifying the key agencies, institutions, and organizations that are positioned to affect conservation management. To facilitate the latter, we used the USGS Regap Provisional Land Stewardship dataset for AZ, CO, NM, NV, and UT and Gap-related products for portions of the study area in CA, WY, and TX to derive surface management statistics for the conservation area network. Figure 7 shows the relationship between land management status in the U.S. portion of the six-ecoregion study area and the network of conservation areas. Sixty-five percent of the conservation area network occurs on federal lands with Bureau of Land Management (BLM) and U.S. Forest Service (USFS) lands comprising 47% of the network. Private lands, the next largest category, comprise 19% of the network.
Figure 8 graphs the conservation area network as a proportion of the total
BLM 25%
USFS 22%
Private 19%
USFWS Other lands managed by each of the region’s 4% 2% primary land managers. In rank order, DoD
84% of U.S. Fish & Wildlife Service 4%
(USFWS), 78% of National Park Service NPS (NPS), 51% of USFS, 48% of 10% Department of Defense (DoD), 44% of BLM, 34% of private, 33% of state, and State Land 22% of Tribal lands were included within 6% the conservation area network. The “other” category includes the Bureau of Reclamation, county and municipal land Tribal
holdings; 68% of those lands were 8%
included in the network. The large amount of federal land in the conservation area network reflects, to a large degree, the overall land management pattern in the southwestern Figure 7. Management Status for Conservation Areas U.S. It also underscores the significant Identified in the Six-Ecoregion Study Area. diversity of ecological systems and species found on federal lands and the importance those lands for the maintenance of biological diversity.
Although the federal estate is subject to land exchanges, in many areas it still retains a relatively high level of intactness when compared to surrounding private lands. Moreover, as private land is converted from native habitat to other uses and is increasingly fragmented, federal lands will increasingly serve as refugia for rare species and ecological systems. Thus, an important conservation application of ecoregional data is in the identification of geographies within the federal estate for which land-use allocations may be evaluated for their compatibility with the conservation values present. Second, the systems and species that comprise conservation targets provide a starting point for evaluating the extent to which natural disturbance regimes are in place at a scale, frequency, intensity, seasonality, etc., that will
Ecoregion-Based Conservation Assessments for the Southwestern U.S. and Northwestern Mexico Page 14

BLMPri
vate
USFSTrib
al
State
Land
NPS DoD
USFW
SOthe
r
60,000,000
50,000,000
40,000,000
30,000,000
20,000,000
10,000,000
0
Acr
es
Total Acres Managed
Acres Identified in Conservation Area Network
Figure 8. The Conservation Area Network Identified in the Six-Ecoregion Study Area as a Function of the Total Area Managed by Major Land Managers.
increase the likelihood that the area’s systems and species remain viable, an important component of management focused on maintaining “healthy ecosystems.”
Cooperative land management focused on ecosystem health
An example of a cooperative effort that took into account natural disturbance regimes as one basis for land management can be found in southeastern Arizona where wildfire and drought are the predominant disturbance regimes. Figure 9 illustrates the frequency with which wildfire occurs in southeastern Arizona in the absence of suppression (figure adapted from Schussman et al. 2006). Recognizing the important role of fire ten federal, state, and private land managers recently developed a cooperative fire management plan for the area centered on the Huachuca Mountains Grassland Valley Complex referred to in Figures 2-4. The goal of the Huachuca Area Fire Partners was “to take on projects that participants are unable to accomplish on their own” (Huachuca Area Fire Partners 2005). Furthermore, “the fire partnership aims to work together to let natural fires burn when feasible, suppress unwanted wildfires, conduct prescribed burns, and use non-fire means to reduce fuels around developed areas.” Partnership projects “will cross political boundaries to manage fire along natural features and roadways.” The plan delineates fire management zones and identifies a series of treatments for the partners to pursue collaboratively. This effort is notable for several reasons. First, in an environment of decreasing budgets, the Huachuca Area Fire Partners pooled funding an expertise around a shared land management objective. Second, the scale of the project is significant for it focuses on the total extent of fire-adapted ecosystems rather than a portion that occurs within a single jurisdictional boundary. This aspect, combined with the shared objective of integrating natural disturbance processes into land management, has enabled the Huachuca Area Fire Partnership to transcend the single species approach to conservation land management. If the partnership succeeds in getting to the implementation phase they will have made significant strides in enhancing the viability of this important regional conservation area.
Ecoregion-Based Conservation Assessments for the Southwestern U.S. and Northwestern Mexico Page 15

State wildlife conservation plans
In 2001 Congress created the State Wildlife Grants program as the nation’s core program for keeping wildlife from becoming endangered. Federal funding to states is predicated on the completion of State Wildlife Conservation Plans. These plans, also referred to as State Wildlife Action Plans, define a vision of conservation success for the nation’s wildlife. Among the eight elements state plans address is a requirement for states to coordinate implementation of conservation measures with federal, state, and local agencies and Tribes. This requirement provides an opportunity for states to play a leadership role in focusing state and federal funding on geographies and approaches that will enable states to meet the vision intended by Congress. Many states have integrated ecoregional assessment data, in whole or part, into their plans. And some groups, such as the Huachuca Area Fire Partners described above, have already begun collaborative efforts that focus on enhancing ecosystem health at conservation areas identified through the ecoregional assessment process.
However, there is a considerable need to expand the number of outcome-focused collaborations working to improve ecosystem health at a meaningful scale. As an example, Figure 10 ranks the network of conservation areas based on the number of terrestrial species with status under the Endangered Species Act or that are non-listed but rare. Sixty-two percent of the conservation areas (over 350 areas) support rare or endangered terrestrial species and their habitat. Eighty-two conservation areas support habitat for between 5 and 20 rare or endangered species, comprising approximately 47.8 million acres. Maintaining healthy ecosystems for these species as well as limiting the need for additional listings under the ESA presents a significant challenge in an era of decreasing budgets. Collaborative, cross-boundary projects
Ecoregion-Based Conservation Assessments for the Southwestern U.S. and Northwestern Mexico Page 16

focused on ecosystem condition provide one avenue to meet this challenge. Consider that 54% of the conservation areas in the U.S. portion of Figure 10 are managed by at least three major land managers. More than 100 conservation areas are managed by USFS and BLM and 84 are managed by USFS, BLM and a state agency. These data affirm the well-known fact that ecosystems don’t stop at jurisdictional boundaries. Given the median size for conservation areas is from 50,000 to 250,000 acres, these data also underscore that the conservation and land management community will have to increase the scale of conservation management, a significant challenge in an era of limited funding. Under the auspices of State Wildlife Conservation Plans, and armed with regional datasets, states have an opportunity to play a leadership role in convening, implementing, and learning how to manage ecosystems for the benefit of biodiversity.
National Fish Habitat Initiative
The International Association of Fish and Wildlife Agencies, in conjunction with the U.S. Fish & Wildlife Service and National Marine Fisheries Service, is leading a nation-wide effort to address the loss and degradation of aquatic habitats that supports the nation’s fish biodiversity – the National Fish Habitat Initiative (NFHI). Noting significant gains made in the enhancement of aquatic habitat with the advent of environmental regulations introduced in the 1970s, NFHI’s Action Plan cautions that “these efforts have not kept pace with impacts resulting from population growth and land-use changes” (NFHI 2006). The Plan includes a number of ambitious goals, including: preparation of a Status of Fish Habitats in the United States by 2010; protection of all healthy and intact fish habitats by 2015; and improvement in the condition of 90% of priority habitats and species targeted by Fish Habitat Partnerships by 2020. Among the Initiative’s strategies is support to foster new partnerships and communicate the status and needs of aquatic habitats. A science and data strategy notes the need to “utilize an integrated landscape approach that includes the upstream/downstream linkages of large scale habitat condition factors” (NFHI 2006).
The Plan’s ambitious goals and strategies will require biological and ecological assessments and data syntheses to support effective use of funds and successful outcomes. The six-ecoregion geodatabase provides one source of contemporary assessment information that can be used to quickly identify high priority aquatic systems and species. Native aquatic- and riparian-dependent species were a major focal point of ecoregional assessment for the southwestern U.S. Of the 1374 fine-filter conservation targets analyzed in the six-ecoregion study area, 39% were aquatic- or riparian-obligate species. Each conservation target was assigned a conservation goal and is represented in one or more conservation areas throughout the network. Moreover, conservation areas typically capture several or more aquatic systems
Ecoregion-Based Conservation Assessments for the Southwestern U.S. and Northwestern Mexico Page 17

and species (Figure 11) and, thus, form a good starting point for evaluating the conservation activities needed to maintain the viability of those systems and species.
In Figure 11 conservation areas are ranked by the number of aquatic and riparian species that are rare or have status under the ESA. This analysis demonstrates the importance of aquatic habitat throughout the arid Southwest; it is also a sobering illustration of the state of imperilment of our aquatic systems with several large conservation areas harboring nearly 30 rare and endangered aquatic and riparian species. Although NFHI’s goals extend to introduced sport fisheries, ecoregional assessment data provide highly synthesized data for those efforts that wish to pursue native fish conservation. Moreover, ecoregional assessment data also facilitate NFHI’s intent to “utilize an integrated landscape approach,” because locations identified to capture aquatic systems and species are imbedded within their larger terrestrial conservation areas providing NFHI efforts an opportunity to evaluate system-level management actions that might benefit terrestrial as well as aquatic and riparian systems and species. For example, Gori and Backer (2005) found a ten-fold increase in populations of Gila chub (Gila intermedia), proposed for listing under the ESA, over the course of a 12-year period where grazing rest and prescribed burning were used to improve watershed conditions on a 50,000-acre watershed jointly managed by BLM and TNC in southeastern Arizona. The study also documented significant improvement in aquatic habitats, such as increasing pool depth, number of pools per km, and extent of bank cover. These changes occurred during a period of decreasing stream flows indicating that the habitat improvements likely resulted from structural changes in the stream channel rather than increases in stream flow.
The National Fish Habitat Initiative’s caution about the causes of current aquatic habitat loss and degradation – impacts from population growth and land-use changes – are the same issues facing conservation efforts within the terrestrial domain. Thus, the prospect of unifying aquatic- and terrestrial-based conservation efforts around a shared geography with shared priorities and the gamut of strategies, including large-scale system-level restoration and management, presents a unique challenge for efforts like NFHI and State Wildlife Conservation Plans. If large-scale, cooperative conservation planning is the new prerequisite for capturing federal, state, and private conservation funds then a first step for existing and emerging efforts might be to critically evaluate the opportunities that can be leveraged with contemporary, cross-boundary assessments that unify terrestrial and aquatic conservation priorities before additional investments are made in new priority-setting exercises.
Ecoregion-Based Conservation Assessments for the Southwestern U.S. and Northwestern Mexico Page 18

THE SIX-ECOREGION GEODATABASE
Development of the geodatabase
Our primary goal in developing the geodatabase was to compile a standardized, cross-ecoregional dataset with a limited number of common attributes that would be useful for conservation-related analyses. We limited the number of attributes standardized across ecoregions to eleven for two reasons; data standardization is costly and we viewed the geodatabase as a demonstration project that could be enhanced over time as needs dictated and funding permitted. The geodatabase differs from the individual ecoregional datasets in several ways, which are described below. However, the geodatabase was developed in a manner that facilitates referencing back to the original ecoregional datasets and documentation. In fact, we adopted the original ecoregional assessment documents as the standard reference; users can cross-reference output from the geodatabase with the original ecoregional documentation to evaluate changes made in the geodatabase. The information contained in the following section is intended for the technical user interested in using the six-ecoregion geodatabase for tabular and spatial-based analyses.
The data are packaged as an E.S.R.I. personal geodatabase in the format of a single Microsoft Access “.mdb” file. Some of the tabular data can be queried and manipulated in MS Access. All spatial and tabular data can be queried and manipulated in E.S.R.I.’s suite of ArcGIS products. The geodatabase includes:
1. a polygon spatial layer (i.e. feature class) with summary attributes for each of the 568 conservation areas identified; overlap of conservation area polygons at ecoregional boundaries was eliminated to facilitate accurate target accounting in cross-ecoregional analyses (see section on reconciling spatial overlap, below);
2. six related tables with standardized, cross-ecoregional attributes for conservation targets as well as source information that preserves the lineage of nomenclature between the original ecoregional datasets and the geodatabase;
3. six feature classes (packaged as a feature dataset) for each of the original ecoregional datasets to facilitate single-ecoregional analyses.
Development of the geodatabase required four steps, which are briefly described below: (1) selecting a common set of attributes; (2) standardizing attributes across ecoregions; (3) developing the database schema and conventions; (3) reconciling spatial overlap for conservation areas at ecoregional boundaries.
Data content and attributes
The geodatabase includes 31 attributes. Seventeen attributes describe conservation targets and include nomenclatural and unique identifiers, taxonomic and habitat descriptors, and conservation status descriptors. Nine attributes characterize summary statistics for conservation areas. The remaining attributes characterize source information or provide functional links among the six data tables. For a complete description of the dataset and attribute values, refer to the companion metadata file (six ecoregion geodatabase.html available at http://www.azconservation.org).
Note that individual state heritage program policies prohibit third-party distribution of point locality data for species-level conservation targets. As a result, the geodatabase does not include specific
Ecoregion-Based Conservation Assessments for the Southwestern U.S. and Northwestern Mexico Page 19

locality data for fine-filter species. However, a unique identifier used by NatureServe and affiliated Heritage Programs was included in the geodatabase to facilitate user requests for species locality data from NatureServe or affiliated state Heritage programs and analysis of these data with the six-ecoregion geodatabase.
Data standardization
A primary goal of the data standardization process was to facilitate map overlays with third-party data with results resolved to the bounds of the conservation areas. For example, we wanted to facilitate accurate summaries and comparisons of conservation targets across conservation areas at any scale; provide conservation-related attributes that would enable users to filter data queries by those attributes (e.g., taxonomic group, ESA status, or distinguishing between terrestrial and aquatic targets); and perform accurate area calculations across conservation areas at any scale.
Eleven attributes associated with conservation targets were standardized to facilitate cross-ecoregional analyses (Table 5). NatureServe Explorer (http://www.natureserve.org/explorer/) was used as the primary source to facilitate standardization. First, we standardized common, scientific names and taxonomic affiliation for all species-level targets. We added two taxonomic grouping attributes that reconcile the various approaches used to assign taxonomic categories to species targets (see Table 5). Second, ecological system target data varied among the six ecoregions with some assessments using association-level data described by predominant species (e.g., Populus fremontii-Salix gooddingii-Salix exigua) and others using less specific descriptors. We added a higher level grouping attribute that enables users to quickly identify major ecological systems (e.g., Fremont cottonwood riparian woodland), regardless of the species’ modifiers used to describe the system. Third, we standardized four conservation attributes, including Global Heritage Program rank, Endangered Species Act status, distribution, and habitat association. The distribution attribute enables users to distinguish between endemic and widespread species and the habitat association enables users to distinguish between terrestrial and riparian/aquatic conservation targets. The remaining attributes include source information, which were left in their original form, referencing attributes that serve as functional links among the dataset’s six tables, or summary statistics associated with conservation areas.
Reconciling spatial overlap of conservation areas at ecoregional boundaries
Two artefacts of the methods used to delineate ecoregional conservation areas required spatial reconciliation when merging data from two adjacent ecoregions. First, most ecoregional assessments identified conservation areas that included portions of adjacent ecoregions, either because the occurrence of conservation targets crossed ecoregional boundaries or because conservation areas were delineated in a coarse fashion. Ecoregional boundaries were intended only to serve as coarse scale analytical units rather than fixed boundaries to constrain the delineation of conservation areas. Subsequent ecoregional assessment efforts for adjacent ecoregions often identified similar geographies for inclusion in conservation areas; the process of aggregating ecoregional datasets created spatial overlap of conservation areas at the margins of ecoregions.
The spatial overlap generated when aggregating ecoregional data introduces errors when performing area calculations and conservation target summaries. As an example, the Gila River spans three ecoregions in southwestern New Mexico and southeastern Arizona – the AZ-NM Mountains, Apache Highlands, and Sonoran Desert ecoregions. Among the three assessments, six conservation areas were delineated that included contiguous portions of the entire Gila River and major tributaries above where all flow is diverted in Florence, AZ. A query of the three original ecoregional datasets to determine the number of conservation targets present on the entire river would yield 195 targets. This number is inaccurate, however, because each of the three assessments had conservation targets in
Ecoregion-Based Conservation Assessments for the Southwestern U.S. and Northwestern Mexico Page 20

common. A query of the aggregated, “scrubbed” data in the six-ecoregion geodatabase yields the true number of conservation targets associated with the Gila River, 118.
To eliminate errors, all overlapping conservation areas were evaluated to determine whether the overlap was due to a generalized delineation of conservation areas – and, therefore, had no conservation targets in common – or was the result of a fairly precise delineation of conservation areas that shared common targets across ecoregional boundaries. In the former cases, generalized boundaries were “trimmed” to eliminate overlap. In the latter case, adjacent conservation areas were merged. Merging conservation areas across ecoregional boundaries sometimes resulted in the creation of large conservation areas. Because this operation introduces its own set of tradeoffs in performing analyses on ecoregional data, decisions on when to merge overlapping conservation areas were guided by the following rationale. If overlapping conservation areas shared conservation targets, particularly ecological systems, this was taken as an indication that the adjacent ecoregional assessments were analyzing the same geographies for the same targets. In these cases the conservation areas were merged under the assumption that determinations of conservation area boundaries at the margins of ecoregional planning units were an artefact of the planning unit rather than the distribution of conservation targets on the ground. Thus, had the assessment been conducted at a larger scale, or used different planning unit boundaries, it is likely that the larger area containing the full distribution of the conservation targets would have been delineated. Appendix 1 provides source information for modifications made to conservation areas in the geodatabase.
The second artefact of the methodology relates to the manner in which riverine-based conservation areas were delineated. In contrast to terrestrial conservation areas, assessment teams often used ecoregional boundaries to delimit the extent of riverine- and riparian-based conservation areas. A primary rationale was that many river systems extend well past ecoregional boundaries creating technical and resource challenges for assessment teams that were already considering geographies that spanned tens of millions of acres. For the six-ecoregion geodatabase, we “re-connected” riverine-based conservation areas that were adjacent and/or overlapped at ecoregional boundaries to facilitate analyses of the entire portions of river systems delineated as conservation areas. In several cases linear, riverine-based conservation areas in one ecoregion were adjacent to large non-linear conservation areas containing both terrestrial and aquatic/riparian conservation targets. In these cases we applied an “aquatics area rule” where the riverine- and riparian-based geographies were extracted to create a consistent riverine-based conservation area geometry imbedded within the larger terrestrial conservation area. Consult Appendix 1 for information on modifications made based on the aquatic area rule.
THIS SECTION INTENTIONALLY LEFT BLANK.
Ecoregion-Based Conservation Assessments for the Southwestern U.S. and Northwestern Mexico Page 21

Table 5. Example Data Records for the Eleven Standardized Attributes in the Six-Ecoregion Geodatabase.
Attribute from “Source Target
Data” Table (see Figure 12)
Attributes from the “Rollup Target Data” Table (see Figure 12)
Target Aggregate Name
Target Rollup Name
[standardized name]
Target Other Name
Rollup Gelcode
[Target Element Occurrence Code]
Level of Biological
Organization
Taxonomic Group
[Specific]
General Taxonomic
Group
Global Rank
Endangered Species Act
Rank
Rollup Distribution
General Habitat
Type
− Empidonax traillii
extimus Southwestern
Willow Flycatcher ABPAE33043 Species Bird Bird G2 (rare)
LE (endangered) Widespread Aquatic/
Riparian
− Acroloxus
coloradensis Rocky Mountain Capshell Limpet IMGASK8010 Species Mollusk Invertebrate G3
(uncommon) − Limited Aquatic/ Riparian
− Callophrys mossii
schryveri Schryver's Elfin IILEPE2205 Species Insect Invertebrate G3 (uncommon) − Endemic Terrestrial
Alpine-Subapline Meadow
Alpine dry tundra & alpine/ subalpine
wet meadow −
NEWE54 (Unique coding was added for
entities not tracked by NatureServe)
Ecological System − − GU
(unranked) − Limited Terrestrial
Ponderosa Pine Forest
Ponderosa Pine Forest Community
(specific)
Ponderosa Pine / Gambel Oak Woodland
NEWC05 Community − − GU (unranked) − − Terrestrial
Ecoregion-Based Conservation Assessments for the Southwestern U.S. and Northwestern Mexico Page 22

Database schema and conventions
The schema used in the development of the geodatabase applies standard, normal forms to the 31 attributes. The result is an economical dataset with a small number of important attributes that enable a variety of conservation-related analyses with consistency and accuracy across ecoregional boundaries. Refer to Figure 12 for a depiction of the data schema and to the companion metadata document for a complete description of attributes. Conventions for attributes common to all six ecoregions follow standards established by the Conservancy’s Ecoregional Data Standards Technical Team (2004). Additional attributes, unique to the six-ecoregion geodatabase, are further described in the associated metadata file.
Ecoregion-Based Conservation Assessments for the Southwestern U.S. and Northwestern Mexico Page 23

Geodatabase function
To facilitate use of the geodatabase for common queries examples are provided below that relate query parameters to the data schema depicted in Figure 12. Note that the term “rollup” refers to data merged and standardized across ecoregions as opposed to original data from the six source assessments.
Generating conservation target lists per conservation area
To determine which conservation targets are associated with one or more conservation areas, users should trace the relationships from the “Rollup Conservation Areas” feature class to the “Rollup Target Data” table (see Figure 12). This will provide the lists of conservation targets per conservation area. It is important to note that the “TGT Rollup Name” field provides both a standardized nomenclature and a basic level of aggregation for coarse-filter targets that harmonizes variation in how coarse-filter targets were named in the source assessments. To honor the rationale of the source assessment documents, certain coarse-filter rollup target names are called out with both general (e.g., “Riparian Woodland”) and specific names (e.g., “Riparian Woodland Community (specific)”). Table 6 illustrates the decision-making that yielded a “Rollup Target Name” for riparian areas. Note, given these conventions, a specific or non-specific rollup target name may be repeated per conservation area; thus, users may want to sum across repeated entries.
Generating conservation area lists for particular conservation targets
Users may determine the conservation areas in which a particular conservation target occurs by querying either the “”Rollup Target Data” or “Source Target Data” tables and trace the selection back to the “Rollup Conservation Areas” feature class (Figure 12). The “TGT Aggregate Name” field in the “Source Target Data” table enables users to select all similar coarse-filter targets, regardless of the conventions applied in the “Rollup Target Data” table. This field provides a secondary level of aggregation for coarse-filter targets. Refer to Table 6 for example data records and the aggregation feature built into the dataset.
Table 6. Example Relationship Between Two Data Tables in the Geodatabase Containing Information on Conservation Targets. Refer to Figure 12 to trace field and table names listed below.
“Rollup Target Data” Table “Source Target Data” Table
TGT Rollup Name TGT Scientific Name TGT Aggregate Name Riparian Woodland Riparian Forest and Woodland
Montane Riparian Woodland and Shrubland Riparian Forest and Woodland
Mesquite Bosque Riparian Forest and Woodland
Riparian Woodland Community (specific) Alnus oblongifolia/Leersia oryzoides Riparian Forest and Woodland
Riparian Woodland Community (specific) Baccharis salicifolia/Scirpus pungens Riparian Forest and Woodland
Riparian Woodland Community (specific) Juglans major/Foresteria pubescens var. pubescens Riparian Forest and Woodland
Generating comparison data for the 568 conservation areas
Users needing tallies of conservation target attributes by conservation area should use the “Rollup Conservation Areas” table. This table provides conservation target summary information for each conservation area and lends itself to basic queries that provide comparisons among the conservation areas.
Ecoregion-Based Conservation Assessments for the Southwestern U.S. and Northwestern Mexico Page 24

LITERATURE CITED
Andelman, S., I. Ball, F. Davis, and D. Stoms. 1999. SITES v. 1.0: An Analytical Toolbox for Designing Ecoregional Conservation Portfolios. Manual prepared for The Nature Conservancy. http://www.biogeog.ucsb.edu/projects/tnc/toolbox.html
Bailey, R.G. 1995. Description of Ecoregions of the United States. U.S. Forest Service Miscellaneous Publications Number 1391. Washington, DC. USDA Forest Service.
Bell, G., J. Baumgartner, J. Humke, A. Laurenzi, P. McCarthy, P. Mehlhop, K. Rich, M. Silbert, E. Smith, B. Spicer, T. Sullivan, S. Yanoff. 1999. Ecoregion Conservation Analysis of the Arizona-New Mexico Mountains. Prepared by The Nature Conservancy with support from agency and institutional partners. 151 pp. Document available at http://www.azconservation.org.
Gori, D.F. and D. Backer. 2005. Watershed Improvement Using Prescribed Burns as a Way to Restore Aquatic Habitat for Native Fish. Pp. 403-406 In (Gottfried, G., Gebow, B. Eskew, L.G., Edminster, C.B., eds.). Connecting Mountain Islands and Desert Seas: Biodiversity and Management of the Madrean Archipelago II. 2004 May 11-15, Tucson, AZ. Proceedings RMRS-P-36. Fort Collins, CO. U.S.D.A. Forest Service Rocky Mountain Research Station. Document available at http://www.azconservation.org.
Groves, C.R. 2003. Drafting a Conservation Blueprint: A Practitioner's Guide to Planning for Biodiversity. Washington, DC: Island Press.
Groves, C.R., D.B. Jensen, L.L. Valutis, K.H. Redford, M.L. Shaffer, M. Scott, J. Baumgartner, J. Higgins, M.W. Beck, and M.G. Anderson. 2002. Planning for Biodiversity Conservation: Putting Conservation Science into Practice. 52, (6): 499-512.
Huachuca Area Fire Partners. 2005. Fire Management Plan 2005: Restoring Healthy Landscapes and Ecosystems. A collaborative effort by the Appleton-Whittell Research Ranch, National Audubon Society; Arizona State Land Department; Babocomari Ranch; Coronado National Memorial, National Park Service; Fort Huachuca, U.S. Army; San Pedro Riparian National Conservation Area, Bureau of Land Management; San Rafael Ranch; San Rafael Ranch State Park, Arizona State Parks; Sierra Vista Ranger District, Coronado National Forest, USDA Forest Service; and The Nature Conservancy. Available at the ecological land management page at http://www.azconservation.org.
Marshall, R.M., S. Anderson, M. Batcher, P. Comer, S. Cornelius, R. Cox, A. Gondor, D.F. Gori, J. Humke, R.P. Aguilar, I.E. Parra, and S. Schwartz. 2000. An Ecological analysis of conservation priorities in the Sonoran Desert ecoregion. Prepared by the Nature Conservancy Arizona Chapter, Sonoran Institute, and Instituto del Medio Ambiente y el Desarrollo Sustentable del Estado de Sonora with support from Department of defense Legacy Program, Agency and Institutional partners. 146 pp. Document available at http://www.azconservation.org.
Marshall, R.M., D. Turner, A. Gondor, D.F. Gori, C. Enquist, G. Luna, R.P. Aguilar, S. Anderson, S. Schwartz, C. Watts, E. Lopez, and P. Comer. 2004. An Ecological analysis of conservation priorities in the Apache Highlands ecoregion. Prepared by The Nature Conservancy of Arizona, Instituto del Medio Ambiente y el Desarrollo Sustentable del Estado de Sonora, agency and institutional partners. 152 pp. Document available at http://www.azconservation.org.
Ecoregion-Based Conservation Assessments for the Southwestern U.S. and Northwestern Mexico Page 25

National Fish Habitat Intitiative. 2006. National Fish Habitat Action Plan: Cooperation-Investment-Stewardship. International Association of Fish and Wildlife Agencies. www.fishhabitat.org
Neely, B., P. Comer, C. Moritz, M. Lammert, R. Rondeau, C. Pague, G. Bell, H. Copeland, J. Humke, S. Spackman, T. Schulz, D. Thoebold, L. Valutis. 2001. Southern Rocky Mountains: An Ecoregional Assessment and Conservation Blueprint. Prepared by The Nature Conservancy with support from U.S. Forest Service, Rocky Mountain Region, Colorado Division of Wildlife, and Bureau of Land Management. 354 pp. Document available at http://www.azconservation.org.
Schussman, H., C. Enquist, and M. List. 2006. Historic Fire Return Intervals for Arizona and New Mexico: A Regional Perspective for Southwestern Land Managers. Prepared by The Nature Conservancy as part of the Southwest Forest Assessment Project. Available at http://www.azconservation.org.
The Nature Conservancy. 1997. Designing a Geography of Hope. Guidelines for Ecoregion-Based Conservation in The Nature Conservancy. The Nature Conservancy. Arlington, VA. 84 pp.
The Nature Conservancy. 2000a. Designing a Geography of Hope. A Practitioner’s Handbook to Ecoregional Conservation Planning. Volume I. The Nature Conservancy. Arlington, VA.
The Nature Conservancy. 2000b. Designing a Geography of Hope. A Practitioner’s Handbook to Ecoregional Conservation Planning. Volume II. The Nature Conservancy. Arlington, VA.
The Nature Conservancy. 1998. Ecoregion-based conservation in the Central Shortgrass Prairie. Prepared by The Nature Conservancy of Colorado with support from agency and institutional partners. 221 pp.
The Nature Conservancy. 2001. Ecoregion-based conservation in the Mojave Desert. Prepared by The Nature Conservancy of Nevada with support from agency and institutional partners. 332 pp. Document available at http://www.azconservation.org.
The Nature Conservancy Ecoregional Data Standards Technical Team. 2004. Ecoregional Assessment Data Standard, Version 1.0. Available at http://conserveonline.org/docs/2004/09/ERA_Data_Standard_Version_1.0.zip
Tuhy, J.S., P. Comer, D. Dorfman, M. Lammert, J. Humke, B. Cholvin, G. Bell, B. Neely, S. Silbert, L. Whitham, B. Baker, The Nature Conservancy, and The Colorado Plateau Ecoregional Planning Team. 2002. A Conservation assessment of the Colorado Plateau ecoregion. Prepared by The Nature Conservancy of Utah with support from agency and institutional partners. 110 pp. + appendices. Document available at http://www.azconservation.org.
U.S. Fish & Wildlife Service. 2004. National Advisory Acceptance Team Review Guide for the Members. Letter to Agency Directors dated July 14, 2004, from Paul Schmidt, Chairman, NAAT. Washington DC.
Ecoregion-Based Conservation Assessments for the Southwestern U.S. and Northwestern Mexico Page 26

Appendix 1. Reference List for Conservation Areas in which Boundaries were Evaluated for Modification in the Six-Ecoregion Geodatabase.
Conservation Area Identifiers from Original Ecoregional Datasets by Pairs of Adjacent
Ecoregions Evaluation/Rationale for Modification
Geodatabase Identifier
(Rollup CAID)
Sonoran Desert Apache Highlands #53 Atascosa Mtns #65 Atascosa/Pajarito
Mtns Areas merged based on overlap of boundaries and target lists.
1
#78 Baboquivari Mtns #63 Altar Valley Areas merged based on overlap of boundaries and target lists.
2
#17 Altar Valley #2 #63 Altar Valley Areas merged based on overlap of boundaries and target lists.
2
#17 Altar Valley #2 #61 Sierrita Mtns/Black Hills
Areas merged based on overlap of boundaries and target lists.
2
#78 Baboquivari Mtns #60 Baboquivari Mtns Areas merged based on overlap of boundaries and target lists.
2
#15 Cienega Creek #66 Huachuca Mtns Grassland Valley Complex
Areas merged based on overlap of boundaries and target lists.. Aquatic area rule applied.
3
#16 Santa Rita #57 Helmet Peak Areas merged based on overlap of boundaries and target lists.
16
#22 Magdalena/Asuncion River
#75 Arroyo Bambuto/Rio Magdalena
Areas merged based on overlap of boundaries and target lists. Aquatic area rule applied.
22
#54 Tubutama #75 Arroyo Bambuto/Rio Magdalena
Areas merged based on overlap of boundaries and target lists. Aquatic area rule applied.
22
#21 Salt/Verde Tonto Creek
#26 Salt River Watershed Areas merged based on overlap of boundaries and target lists. Aquatic area rule applied.
26
#21 Salt/Verde Tonto Creek
#21 Tonto Creek/Hellsgate Widerness
Areas merged based on overlap of boundaries and target lists. Aquatic area rule applied.
26
#98 Upper Gila River #36 Mescal Creek/Upper Gila River
Areas merged based on overlap of boundaries and target lists. Aquatic area rule applied.
39
#98 Upper Gila River #38 Bonita Creek/Gila Box Wilderness
Aquatic area rule applied. 39
#95 Sabino Canyon #50 Pusch Ridge/Sabino Creek
Areas merged based on overlap of boundaries and target lists. Aquatic area rule applied.
50
#52 Canon La Palma #81 Canon La Palma Areas merged based on overlap of boundaries and target lists. Aquatic area rule applied.
81
#83 Agua Fria Watershed #15 Agua Fria River/Sycamore Mesa
Areas merged based on overlap of boundaries and target lists. Aquatic area rule applied.
83
#83 Agua Fria Watershed #19 Castle Creek/Black Canyon
Areas merged based on overlap of boundaries and target lists. Aquatic area rule applied.
83
#83 Agua Fria Watershed #22 New River Mtns Areas merged based on overlap of boundaries and target lists. Aquatic area rule applied.
83
#85 Superstition Mtns #32 Barge Canyon/Superstition Mtns
Areas merged based on overlap of boundaries and target lists.
85
#85 Superstition Mtns #28 Campaign Creek/Superstition Mtns
Areas merged based on overlap of boundaries and target lists.
85
#85 Superstition Mtns #33 Sawtooth Ridge/Superstition Mtns
Areas merged based on overlap of boundaries and target lists.
85
#99 San Pedro River/Aravaipa Creek
#43 Aravaipa Watershed Areas merged based on overlap of boundaries and target lists. Aquatic area rule applied.
99
Ecoregion-Based Conservation Assessments for the Southwestern U.S. and Northwestern Mexico Page 27
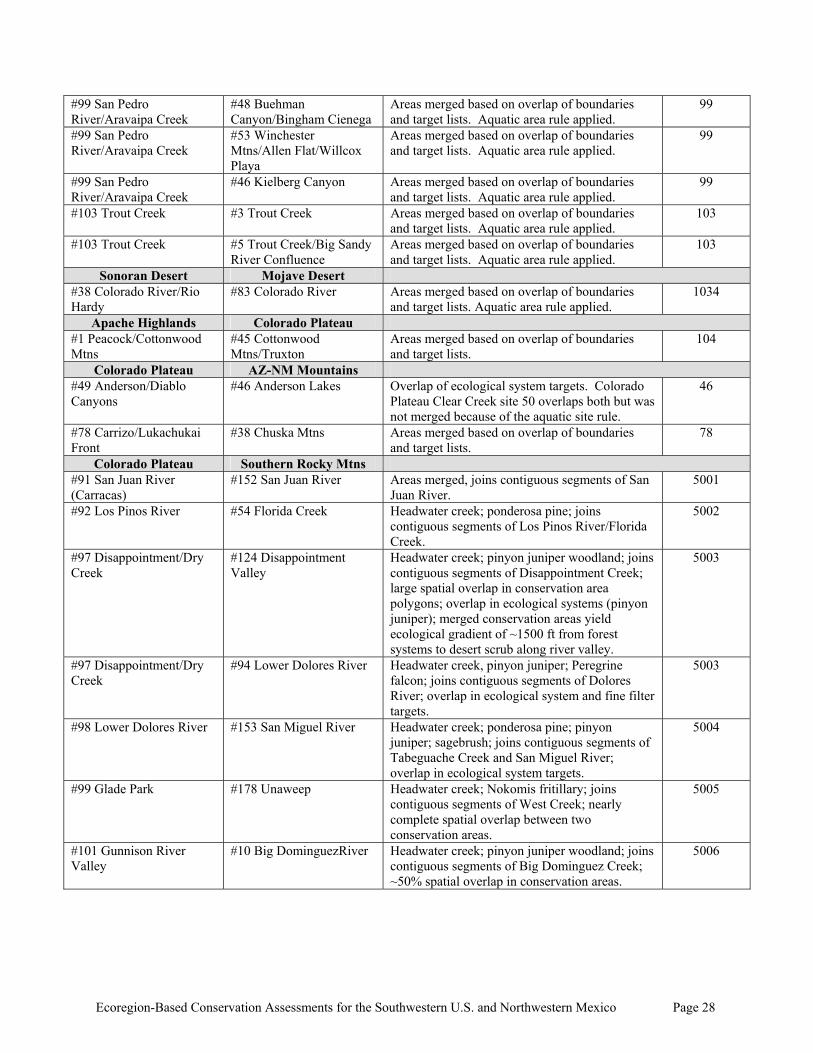
#99 San Pedro River/Aravaipa Creek
#48 Buehman Canyon/Bingham Cienega
Areas merged based on overlap of boundaries and target lists. Aquatic area rule applied.
99
#99 San Pedro River/Aravaipa Creek
#53 Winchester Mtns/Allen Flat/Willcox Playa
Areas merged based on overlap of boundaries and target lists. Aquatic area rule applied.
99
#99 San Pedro River/Aravaipa Creek
#46 Kielberg Canyon Areas merged based on overlap of boundaries and target lists. Aquatic area rule applied.
99
#103 Trout Creek #3 Trout Creek Areas merged based on overlap of boundaries and target lists. Aquatic area rule applied.
103
#103 Trout Creek #5 Trout Creek/Big Sandy River Confluence
Areas merged based on overlap of boundaries and target lists. Aquatic area rule applied.
103
Sonoran Desert Mojave Desert #38 Colorado River/Rio Hardy
#83 Colorado River Areas merged based on overlap of boundaries and target lists. Aquatic area rule applied.
1034
Apache Highlands Colorado Plateau #1 Peacock/Cottonwood Mtns
#45 Cottonwood Mtns/Truxton
Areas merged based on overlap of boundaries and target lists.
104
Colorado Plateau AZ-NM Mountains #49 Anderson/Diablo Canyons
#46 Anderson Lakes Overlap of ecological system targets. Colorado Plateau Clear Creek site 50 overlaps both but was not merged because of the aquatic site rule.
46
#78 Carrizo/Lukachukai Front
#38 Chuska Mtns Areas merged based on overlap of boundaries and target lists.
78
Colorado Plateau Southern Rocky Mtns #91 San Juan River (Carracas)
#152 San Juan River Areas merged, joins contiguous segments of San Juan River.
5001
#92 Los Pinos River #54 Florida Creek Headwater creek; ponderosa pine; joins contiguous segments of Los Pinos River/Florida Creek.
5002
#97 Disappointment/Dry Creek
#124 Disappointment Valley
Headwater creek; pinyon juniper woodland; joins contiguous segments of Disappointment Creek; large spatial overlap in conservation area polygons; overlap in ecological systems (pinyon juniper); merged conservation areas yield ecological gradient of ~1500 ft from forest systems to desert scrub along river valley.
5003
#97 Disappointment/Dry Creek
#94 Lower Dolores River Headwater creek, pinyon juniper; Peregrine falcon; joins contiguous segments of Dolores River; overlap in ecological system and fine filter targets.
5003
#98 Lower Dolores River #153 San Miguel River Headwater creek; ponderosa pine; pinyon juniper; sagebrush; joins contiguous segments of Tabeguache Creek and San Miguel River; overlap in ecological system targets.
5004
#99 Glade Park #178 Unaweep Headwater creek; Nokomis fritillary; joins contiguous segments of West Creek; nearly complete spatial overlap between two conservation areas.
5005
#101 Gunnison River Valley
#10 Big DominguezRiver Headwater creek; pinyon juniper woodland; joins contiguous segments of Big Dominguez Creek; ~50% spatial overlap in conservation areas.
5006
Ecoregion-Based Conservation Assessments for the Southwestern U.S. and Northwestern Mexico Page 28

#101 Gunnison River Valley
#50 Escalante River Headwater creek; pinyon juniper woodland; target overlap limited but joins contiguous segments of Escalante Creek and reconciles substantial spatial overlap in two conservation areas.
5006
#102 Roubideau #149 Roubideau Headwater creek; riparian woodland; pinyon juniper; joins contiguous segments of Roubideau, Monitor, and Cottonwood creeks and reconciles considerable spatial overlap between two conservation areas
5007
#104 Uncompahgre Badlands
#89 Lawhead Gulch Headwater creek; reconciles nearly complete spatial overlap between the two conservation areas centered on Gunnison River.
5008
#104 Uncompahgre Badlands
#181 Ute Trail Montane shrubland; reconciles nearly complete spatial overlap between the two conservation areas; little overlap in targets.
5008
#104 Uncompahgre Badlands
#11 Billy Creek Uplands Areas not merged. No overlap in targets nor contiguous creek segments. GIS overlay update Colorado Plateau by S. Rocky Mnts.
n/a
#104 Uncompahgre Badlands
#25 Colona Mountain Areas not merged. No overlap in targets. GIS update overlay Colorado Plateau by S. Rocky Mnts.
n/a
#104 Uncompahgre Badlands
#6 Beaton Creek East Areas not merged. No overlap in targets. GIS update overlay Colorado Plateau by S. Rocky Mnts.
n/a
#103 Hotchkiss Hills #32 Crested Butte Areas not merged. Little spatial overlap. Target lists differ, no major river valley connecting high and low elevation systems. GIS update overlay Colorado Plateau by S. Rocky Mnts.
n/a
#103 Hotchkiss Hills #91 Little Coal Creek Areas not merged. Little spatial overlap. No overlap in targets. Update S. Rocky Mtns. by Colorado Plateau.
n/a
AZ-NM Mountains Apache Highlands #45 Mogollon Canyons Complex
#12 Cinch Hook Butte Areas merged based on overlap of boundaries and target lists.
45
#45 Mogollon Canyons Complex
#10 Twentynine Mile Lake Areas merged based on overlap of boundaries and target lists.
45
#45 Mogollon Canyons Complex
#13 Webber Creek Areas merged based on overlap of boundaries and target lists.
45
#43 Black River/White River Headwaters
#26 Salt River Watershed Areas merged based on overlap of boundaries and target lists. Aquatic area rule applied.
26
#39 Blue River/San Francisco River
#39 Blue River/Eagle Creek
Areas merged based on overlap of boundaries and target lists. Aquatic area rule applied.
39
#27 Gila River #39 Blue River/Eagle Creek
Areas merged based on overlap of boundaries and target lists. Aquatic area rule applied.
39
Ecoregion-Based Conservation Assessments for the Southwestern U.S. and Northwestern Mexico Page 29