chapter 12 eastern cascades slopes and foothills ecoregion · chapter 12 eastern cascades slopes...
TRANSCRIPT

Chapter 12
Eastern Cascades Slopes and Foothills Ecoregion
the ecoregion to 3,000 mm in the area bordering the higher Cascade Range to the west. Precipitation (either rain or snow) falls mostly in the fall, through winter into spring. Elevations range from near sea level at the Columbia River to more than 3,300 m; most of the region is between 900 and 2,000 m high.
By Daniel G. Sorenson
Ecoregion Description
The Eastern Cascades Slopes and Foothills Ecoregion (Omernik, 1987; U.S. Environmental Protection Agency, 1997) covers approximately 57,329 km² (22,135 mi²) in the states of Washington, Oregon, and California (fig. 1). The ecoregion is bounded on the east by the Columbia Plateau, Blue Mountains, and Northern Basin and Range Ecoregions; on the south by the Sierra Nevada Ecoregion; on the west by the Klamath Moun-tains and Cascades Ecoregions; and on the north by the North Cascades Ecoregion (fig. 1). Because the Eastern Cascades Slopes and Foothills Ecoregion lies within the rain shadow of the Cascade Range, the annual amount of precipitation varies greatly, from 500 mm in the eastern and southern sections of
Status and Trends of Land Change in the Western United States—1973 to 2000 Edited by Benjamin M. Sleeter, Tamara S. Wilson, and William Acevedo U.S. Geological Survey Professional Paper 1794–A, 2012
Figure 1. Map of Eastern Cascades Slopes and Foothills Ecoregion and surrounding ecoregions, showing land-use/land-cover classes from 1992 National Land Cover Dataset (Vogel-mann and others, 2001); note that not all land-use/land-cover classes shown in explanation may be depicted on map; note also that, for this “Status and Trends of Land Change” study, transitional land-cover class was subdivided into mechanically disturbed and nonmechanically disturbed classes. Map shows that land cover is more diverse in southern part of ecoregion. Squares indicate locations of 10 x 10 km sample blocks analyzed in study. Index map shows locations of geographic features mentioned in text. Abbreviations for Western United States ecoregions are listed in appendix 2. See appendix 3 for definitions of land-use/land-cover classifications.
Cascades
Sierra Nevada
C
Northern Basinand Range
Coast Range
BlueMountains
ColumbiaPlateau
Willamette Valley
BLM
CR
Central Basinand Range
Sierra Nevada
SCCCOW
NC
PL
KM
KM
PACI
FIC
OCE
AN
122°
120°
124°
46°
44°
42°
0 50 100 150 MILES
0 50 100 150 KLOMETERS
Ecoregion boundary
Sample block (10 x 10 km)
Forest
Grassland/Shrubland
Agriculture
Wetland
Ice/Snow
Land-use/land-cover class
Water
Developed
Transitional
Mining
Barren
EXPLANATION
WA S H I N G T O N
O R E G O N
CALIFORNIA NEVADA
Bend
Klamath Falls
CA
SC
AD
E
R
AN
GE Columb ia R iver
Desc h
utes
Ri
ver
Klamath R.

134 Status and Trends of Land Change in the Western United States—1973 to 2000
In the plateaus, elevation generally varies from 60 to 600 m (McNab and Avers, 1994).
The Eastern Cascades Slopes and Foothills Ecoregion formed from tectonic uplift with mountain ranges and val-leys oriented north-to-south; it is a relatively young ecoregion with numerous lava flows, volcanic cones, and buttes (U.S. Environmental Protection Agency, 2010). Population is sparse: the two largest cities are Bend, Oregon, with a population of 52,029, and Klamath Falls, Oregon, with 19,462 residents (U.S. Census Bureau, 2000).
Forest is the primary land cover in the Eastern Cascades Slopes and Foothills Ecoregion (figs. 1,2), and fire plays an important role in forest composition. Ponderosa pine (Pinus ponderosa) is the dominant tree species, and lodgepole pine (Pinus contorta) is common in the drier parts of the ecoregion (Risser, 2000). The bark on older, larger ponderosa pines is thick, providing protection from fires. Ponderosa pines are usu-ally little affected if 50 percent or less of the crown is destroyed by fire, giving them an advantage over less fire-tolerant tree species (Oliver and Ryker, 1990). Lodgepole pines have seroti-nous or closed cones that only open and release seeds when exposed to extreme heat during a fire. As a result, postfire colo-nization of burned areas by lodgepole pines is rapid, outpacing most other species (Lotan and Chritchfield, 1990).
The northern part of the Eastern Cascades Slopes and Foothills Ecoregion drains into the Deschutes and Colum-bia Rivers. Spring-fed tributaries and snow melt provide most of the rivers’ water. The southern section is drained by the Klamath River, which is fed by a vast interior wet-land. Approximately 75 percent of the historic wetlands of the Klamath Basin have been drained for crops. The most common crops grown in the Eastern Cascades Slopes and
Foothills Ecoregion are hay, alfalfa, cereal grains, potatoes, onions, and sugar beets (Risser, 2000).
Contemporary Land-Cover Change (1973 to 2000)
Between 1973 and 2000, the areal extent of land-use/land-cover change (the footprint of change, or the area that experienced change at least once during the 27-year study period) in the Eastern Cascades Slopes and Foothills Ecore-gion was 12.1 percent, or 6,943 km² (table 1). Compared with other western United States ecoregions, change in the Eastern Cascades Slopes and Foothills Ecoregion was above average (fig. 3). Overall, an estimated 2,637 km² (4.6 per-cent) of the ecoregion changed in one time period; 3,268 km²
Figure 2. Grassy meadow and forested hillsides in Eastern Cascades Slopes and Foothills Ecoregion. Dominant land-cover class in Eastern Cascades Slopes and Foothills Ecoregion is forest, although grassland/shrubland makes up about one-third of ecore-gion. Forests tend to be at higher elevations, in areas with more precipitation, whereas grassland/shrubland areas are found mostly in valley bottoms and drier locations. Photograph by Terry Sohl.
Figure 3. Overall spatial change in Eastern Cascades Slopes and Foothills Ecoregion (ECSF; darker bars) compared with that of all 30 Western United States ecoregions (lighter bars). Each horizontal set of bars shows proportions of ecoregion that changed during one, two, three, or four time periods; highest level of spatial change in Eastern Cascades Slopes and Foothills Ecoregion (four time periods) labeled for clarity. See table 2 for years covered by each time period. See appendix 2 for key to ecoregion abbreviations.
0 10 20 30
Area, as percent of ecoregion
CDSRK
ANMPMA
CBRWB
WUMSBR
MBRCLRP
ANMMSN
SCMNBRBLMCRK
MVFPSRB
MRKCLMP
SCCCOWKMNC
ECSFCCVNRKWV
CCRPL
Ecor
egio
n
Change in four time periods
EXPLANATION
Change in one time period
Change in two time periods
Change in three time periods
Change in four time periods
Chapter 12—Eastern Cascades Slopes and Foothills Ecoregion 135
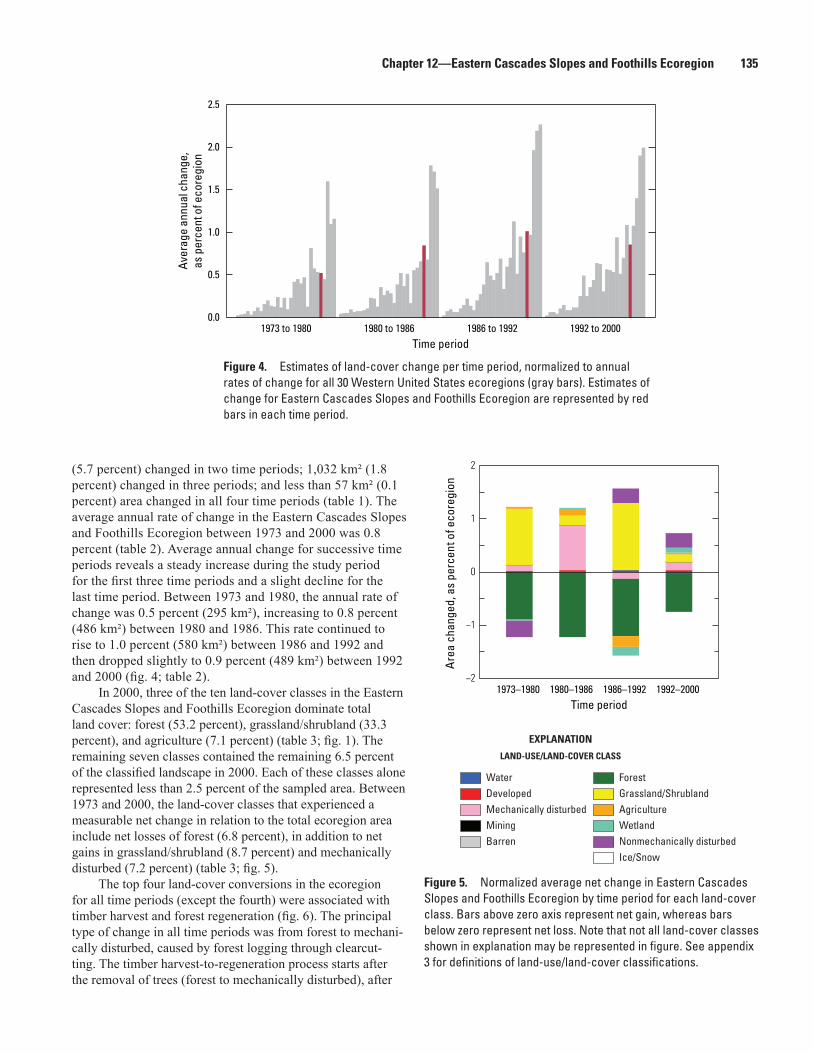
(5.7 percent) changed in two time periods; 1,032 km² (1.8 percent) changed in three periods; and less than 57 km² (0.1 percent) area changed in all four time periods (table 1). The average annual rate of change in the Eastern Cascades Slopes and Foothills Ecoregion between 1973 and 2000 was 0.8 percent (table 2). Average annual change for successive time periods reveals a steady increase during the study period for the first three time periods and a slight decline for the last time period. Between 1973 and 1980, the annual rate of change was 0.5 percent (295 km²), increasing to 0.8 percent (486 km²) between 1980 and 1986. This rate continued to rise to 1.0 percent (580 km²) between 1986 and 1992 and then dropped slightly to 0.9 percent (489 km²) between 1992 and 2000 (fig. 4; table 2).
In 2000, three of the ten land-cover classes in the Eastern Cascades Slopes and Foothills Ecoregion dominate total land cover: forest (53.2 percent), grassland/shrubland (33.3 percent), and agriculture (7.1 percent) (table 3; fig. 1). The remaining seven classes contained the remaining 6.5 percent of the classified landscape in 2000. Each of these classes alone represented less than 2.5 percent of the sampled area. Between 1973 and 2000, the land-cover classes that experienced a measurable net change in relation to the total ecoregion area include net losses of forest (6.8 percent), in addition to net gains in grassland/shrubland (8.7 percent) and mechanically disturbed (7.2 percent) (table 3; fig. 5).
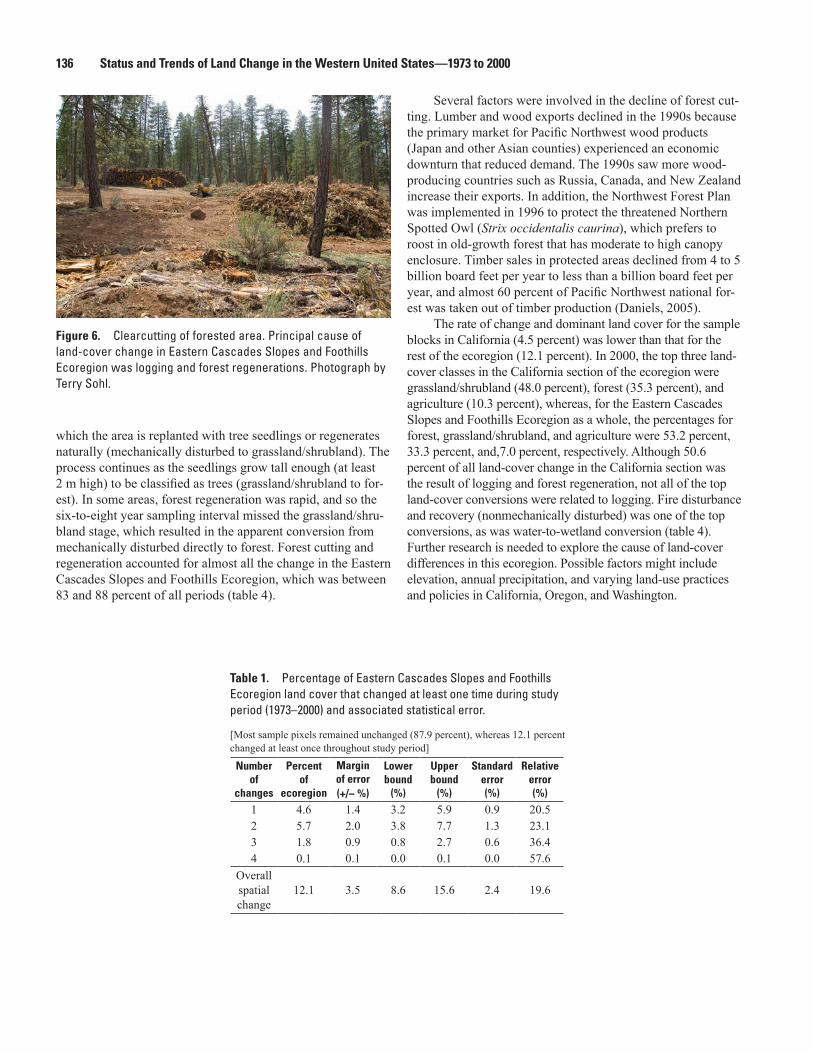
The top four land-cover conversions in the ecoregion for all time periods (except the fourth) were associated with timber harvest and forest regeneration (fig. 6). The principal type of change in all time periods was from forest to mechani-cally disturbed, caused by forest logging through clearcut-ting. The timber harvest-to-regeneration process starts after the removal of trees (forest to mechanically disturbed), after
Figure 4. Estimates of land-cover change per time period, normalized to annual rates of change for all 30 Western United States ecoregions (gray bars). Estimates of change for Eastern Cascades Slopes and Foothills Ecoregion are represented by red bars in each time period.
Figure 5. Normalized average net change in Eastern Cascades Slopes and Foothills Ecoregion by time period for each land-cover class. Bars above zero axis represent net gain, whereas bars below zero represent net loss. Note that not all land-cover classes shown in explanation may be represented in figure. See appendix 3 for definitions of land-use/land-cover classifications.
0.5
0.0
1.0
1.5
2.0
2.5
1973 to 1980 1980 to 1986 1986 to 1992 1992 to 2000
Aver
age
annu
al c
hang
e,as
per
cent
of e
core
gion
Time period
−2
−1
0
1
2
1973–1980 1980–1986 Time period
1986–1992 1992–2000
Are
a ch
ange
d, a
s pe
rcen
t of e
core
gion
WaterDevelopedMechanically disturbedMiningBarren
ForestGrassland/ShrublandAgricultureWetlandNonmechanically disturbedIce/Snow
EXPLANATION
LAND-USE/LAND-COVER CLASS
136 Status and Trends of Land Change in the Western United States—1973 to 2000
which the area is replanted with tree seedlings or regenerates naturally (mechanically disturbed to grassland/shrubland). The process continues as the seedlings grow tall enough (at least 2 m high) to be classified as trees (grassland/shrubland to for-est). In some areas, forest regeneration was rapid, and so the six-to-eight year sampling interval missed the grassland/shru-bland stage, which resulted in the apparent conversion from mechanically disturbed directly to forest. Forest cutting and regeneration accounted for almost all the change in the Eastern Cascades Slopes and Foothills Ecoregion, which was between 83 and 88 percent of all periods (table 4).
Figure 6. Clearcutting of forested area. Principal cause of land-cover change in Eastern Cascades Slopes and Foothills Ecoregion was logging and forest regenerations. Photograph by Terry Sohl.
Several factors were involved in the decline of forest cut-ting. Lumber and wood exports declined in the 1990s because the primary market for Pacific Northwest wood products (Japan and other Asian counties) experienced an economic downturn that reduced demand. The 1990s saw more wood-producing countries such as Russia, Canada, and New Zealand increase their exports. In addition, the Northwest Forest Plan was implemented in 1996 to protect the threatened Northern Spotted Owl (Strix occidentalis caurina), which prefers to roost in old-growth forest that has moderate to high canopy enclosure. Timber sales in protected areas declined from 4 to 5 billion board feet per year to less than a billion board feet per year, and almost 60 percent of Pacific Northwest national for-est was taken out of timber production (Daniels, 2005).
The rate of change and dominant land cover for the sample blocks in California (4.5 percent) was lower than that for the rest of the ecoregion (12.1 percent). In 2000, the top three land-cover classes in the California section of the ecoregion were grassland/shrubland (48.0 percent), forest (35.3 percent), and agriculture (10.3 percent), whereas, for the Eastern Cascades Slopes and Foothills Ecoregion as a whole, the percentages for forest, grassland/shrubland, and agriculture were 53.2 percent, 33.3 percent, and,7.0 percent, respectively. Although 50.6 percent of all land-cover change in the California section was the result of logging and forest regeneration, not all of the top land-cover conversions were related to logging. Fire disturbance and recovery (nonmechanically disturbed) was one of the top conversions, as was water-to-wetland conversion (table 4). Further research is needed to explore the cause of land-cover differences in this ecoregion. Possible factors might include elevation, annual precipitation, and varying land-use practices and policies in California, Oregon, and Washington.
Table 1. Percentage of Eastern Cascades Slopes and Foothills Ecoregion land cover that changed at least one time during study period (1973–2000) and associated statistical error.
[Most sample pixels remained unchanged (87.9 percent), whereas 12.1 percent changed at least once throughout study period]
Numberof
changes
Percentof
ecoregion
Marginof error(+/− %)
Lowerbound
(%)
Upperbound
(%)
Standarderror(%)
Relativeerror(%)
1 4.6 1.4 3.2 5.9 0.9 20.52 5.7 2.0 3.8 7.7 1.3 23.13 1.8 0.9 0.8 2.7 0.6 36.44 0.1 0.1 0.0 0.1 0.0 57.6
Overall spatial change
12.1 3.5 8.6 15.6 2.4 19.6

Chapter 12—Eastern Cascades Slopes and Foothills Ecoregion 137
Table 2. Raw estimates of change in Eastern Cascades Slopes and Foothills Ecoregion land cover, computed for each of four time periods between 1973 and 2000, and associated error at 85-percent confidence level.
[Estimates of change per period normalized to annual rate of change for each period]
Period Total change(% of ecoregion)
Margin of error
(+/− %)
Lower bound
(%)
Upper bound
(%)
Standard error(%)
Relative error(%)
Average rate
(% per year)Estimate of change, in percent stratum
1973–1980 3.6 1.3 2.3 4.9 0.9 25.3 0.51980–1986 5.1 1.9 3.2 7.0 1.3 24.9 0.81986–1992 6.1 2.2 3.9 8.2 1.5 24.2 1.01992–2000 6.8 2.1 4.7 8.9 1.4 21.0 0.9
Estimate of change, in square kilometers1973–1980 2,065 771 1,294 2,836 522 25.3 2951980–1986 2,917 1,074 1,843 3,990 727 24.9 4861986–1992 3,478 1,243 2,235 4,721 842 24.2 5801992–2000 3,915 1,212 2,702 5,127 821 21.0 489
Table 3. Estimated area (and margin of error) of each land-cover class in Eastern Cascades Slopes and Foothills Ecoregion, calculated five times between 1973 and 2000. See appendix 3 for definitions of land-cover classifications.
Water Developed Mechanically disturbed Mining Barren Forest Grassland/
Shrubland Agriculture WetlandNon-
mechanically disturbed
% +/− % +/− % +/− % +/− % +/− % +/− % +/− % +/− % +/− % +/−
Area, in percent stratum1973 1.5 1.1 0.1 0.1 1.4 0.7 0.0 0.0 0.2 0.2 57.1 7.6 30.6 6.7 7.1 3.7 1.6 0.7 0.3 0.41980 1.5 1.2 0.1 0.1 1.5 0.7 0.0 0.0 0.2 0.2 56.2 7.4 31.7 6.5 7.2 3.7 1.6 0.7 0.0 0.01986 1.5 1.2 0.1 0.1 2.3 1.0 0.0 0.0 0.2 0.2 55.0 7.3 31.9 6.4 7.3 3.7 1.6 0.7 0.0 0.01992 1.6 1.2 0.2 0.1 2.2 0.9 0.0 0.0 0.2 0.2 54.0 7.1 33.1 6.3 7.1 3.7 1.5 0.7 0.3 0.32000 1.5 1.1 0.2 0.1 2.3 1.0 0.0 0.0 0.2 0.2 53.2 6.9 33.3 6.2 7.1 3.7 1.5 0.7 0.6 0.8
Netchange 0.0 0.1 0.1 0.1 1.0 1.0 0.0 0.0 0.0 0.0 − 3.9 1.7 2.7 1.7 0.0 0.2 − 0.1 0.1 0.2 0.9
Grosschange 0.7 0.4 0.1 0.1 6.0 1.9 0.0 0.0 0.0 0.0 6.4 2.2 6.3 2.1 0.6 0.6 0.7 0.4 1.4 1.2
Area, in square kilometers1973 850 652 73 40 781 421 4 4 115 129 32,761 4,385 17,555 3,857 4,093 2,105 917 412 179 2571980 856 679 78 42 843 414 4 4 115 129 32,247 4,265 18,171 3,723 4,110 2,101 904 412 0 01986 870 673 83 45 1,327 586 5 5 115 129 31,550 4,158 18,276 3,692 4,177 2,103 925 419 0 01992 889 660 90 49 1,262 541 5 5 114 128 30,930 4,042 18,990 3,583 4,057 2,122 832 383 160 1612000 867 630 108 65 1,344 589 5 5 114 128 30,525 3,942 19,085 3,531 4,076 2,120 886 392 317 455
Netchange 17 53 35 29 563 557 1 1 − 1 1 − 2,236 955 1,531 986 − 17 131 − 31 59 138 529
Grosschange 377 218 35 29 3,442 1,076 1 1 1 1 3,643 1,281 3,587 1,191 334 336 377 231 816 696

138 Status and Trends of Land Change in the Western United States—1973 to 2000
Table 4. Principal land-cover conversions in Eastern Cascades Slopes and Foothills Ecoregion, showing amount of area changed (and margin of error, calculated at 85-percent confidence level) for each conversion during each of four time periods and also during overall study period. See appendix 3 for definitions of land-cover classifications.
[Values given for “other” class are combined totals of values for other land-cover classes not listed in that time period. Abbreviations: n/a, not applicable]
Period From class To classArea
changedMargin of
errorStandard
error Percent of ecoregion
Percent of all changes
(km2) (+/− km2) (km2)
1973–1980 Forest Mechanically disturbed 835 409 277 1.5 40.4Mechanically disturbed Grassland/Shrubland 558 343 232 1.0 27.0Mechanically disturbed Forest 206 163 111 0.4 10.0Nonmechanically disturbed Grassland/Shrubland 165 236 160 0.3 8.0Grassland/Shrubland Forest 85 63 42 0.1 4.1Other Other 216 n/a n/a 0.4 10.5
Totals 2,065 3.6 100.01980–1986 Forest Mechanically disturbed 1,310 582 394 2.3 44.9
Mechanically disturbed Grassland/Shrubland 594 341 231 1.0 20.4Grassland/Shrubland Forest 378 302 204 0.7 13.0Mechanically disturbed Forest 238 155 105 0.4 8.1Grassland/Shrubland Agriculture 164 222 150 0.3 5.6Other Other 233 n/a n/a 0.4 8.0
Totals 2,917 5.1 100.01986–1992 Forest Mechanically disturbed 1,190 538 364 2.1 34.2
Mechanically disturbed Grassland/Shrubland 1,011 500 339 1.8 29.1Grassland/Shrubland Forest 384 219 148 0.7 11.0Mechanically disturbed Forest 296 182 123 0.5 8.5Agriculture Grassland/Shrubland 164 232 157 0.3 4.7Other Other 433 n/a n/a 0.8 12.4
Totals 3,478 6.1 100.01992–2000 Forest Mechanically disturbed 1,309 587 398 2.3 33.4
Mechanically disturbed Grassland/Shrubland 983 484 328 1.7 25.1Grassland/Shrubland Forest 686 432 293 1.2 17.5Grassland/Shrubland Nonmechanically disturbed 268 384 260 0.5 6.8Mechanically disturbed Forest 236 165 112 0.4 6.0Other Other 432 n/a n/a 0.8 11.0
Totals 3,915 6.8 100.0
1973–2000(overall)
Forest Mechanically disturbed 4,645 1,751 1,186 8.1 37.5Mechanically disturbed Grassland/Shrubland 3,146 1,434 971 5.5 25.4Grassland/Shrubland Forest 1,533 766 519 2.7 12.4Mechanically disturbed Forest 977 591 400 1.7 7.9Grassland/Shrubland Nonmechanically disturbed 316 387 262 0.6 2.6Other Other 1,758 n/a n/a 3.1 14.2
Totals 12,375 21.6 100.0

Chapter 12—Eastern Cascades Slopes and Foothills Ecoregion 139
References Cited
Daniels, J.M., 2005, The rise and fall of the Pacific Northwest log export market: U.S. Department of Agriculture, Forest Service, Pacific Northwest Research Station, General Tech-nical Report PNW-GTR-624, 80 p.
Lotan, James E., and Critchfield, William B., 1990, Silvics of North America: 1 Conifers, Lodgepole Pine: U.S. Depart-ment of Agriculture, Forest Service, Agriculture Handbook 654, v. 1, accessed June 23, 2009, at http://www.na.fs.fed.us/spfo/pubs/silvics_manual/Volume_1/pinus/contorta.htm.
McNab, W. Henry, and Avers, Peter E., 1994, Ecological sub-regions of the United States: U.S. Department of Agricul-ture, Forest Service, WO-WSA-5, chap. 25.
Oliver, William W., and Ryker, Russell A., 1990, Silvics of North America: 1 Conifers, Ponderosa Pine: U.S. Depart-ment of Agriculture, Forest Service, Agriculture Handbook 654, v. 1, accessed June 23, 2009, at http://www.na.fs.fed.us/spfo/pubs/silvics_manual/Volume_1/pinus/ponderosa.htm.
Omernik, J.M., 1987, Ecoregions of the conterminous United States: Annals of the Association of American Geographers, v. 77, p. 118–125.
Risser, P.G., 2000, East Cascades Slope and Foothills Ecore-gion, in Oregon State of the Environment Report 2000—Statewide Summary: State of the Environment Report Science Panel, Oregon Progress Board, chap. 4.4, accessed June 23, 2009, at http://oregon.gov/DAS/OPB/docs/SOER2000/Ch4_4.pdf.
U.S. Census Bureau, 2000, U.S. Census, 2000, accessed April 1, 2009, at http://www.census.gov/prod/www/abs/decennial/index.htm.
U.S. Environmental Protection Agency, 1997, Descriptions of level III ecological regions for the CEC report on ecological regions of North America: U.S. Environmental Protection Agency database, accessed April 12, 2006, at http://www.epa.gov/wed/pages/ecoregions/na_eco.htm#Downloads.
U.S. Environmental Protection Agency, 2010, Primary dis-tinguishing characteristics of Level III ecoregions of the continental United States: U.S. Environmental Protection Agency database, available at ftp://ftp.epa.gov/wed/ecore-gions/us/Eco_Level_III_descriptions.doc.
Vogelmann, J.E., Howard, S.M., Yang L., Larson, C.R., Wylie B.K., and van Driel N., 2001, Completion of the 1990s National Land Cover Data Set for the conterminous United States from Landsat Thematic Mapper data and ancillary data sources: Photogrammetric Engineering & Remote Sensing, v. 67, p. 650–662.