economic viability of an unconventional gas play in ireland
TRANSCRIPT

Economic Viability of an
Unconventional Gas Play in Ireland
by
Peadar O’Sullivan 13200461
Supervised by
Dr Yousef Husein Eiadat
University College Dublin Michael Smurfit Graduate Business School
Masters in Project Management August 2014

© 2014 Peadar O’Sullivan [email protected]
Abstract
This study evaluates the economic viability of an unconventional gas play in Ireland. The economic viability is assessed through the modelling of a hypothetical gas field containing 100 wells drilled at a rate of 10 wells per year over a 10 year period. The gas production of the field, associated costs and revenue are monitored over a 25 year lifecycle.
The analysis used to evaluate the project is based on a generic discounted cash flow analysis which identifies the projects Net Present Value (NPV), Internal Rate of Return (IRR) and breakeven cost. Following the designation of a base case scenario, the model is subjected to a number of different economic scenarios via one-way sensitivity analysis. The sensitivity analysis is used to stress test the projects continued viability when subjected to varying economic conditions. The inputs altered during the sensitivity analysis are capital (CAPEX) and operating (OPEX) costs, initial gas production and forecasted gas prices.
The results of the analysis show that in all but one of the scenarios a positive NPV was returned. Overall the study illustrates that an unconventional gas play could have an economically viable future in Ireland, under the correct economic conditions. The study also highlights the key conditions required for project success. These being future gas prices and the initial gas production of each well, variables that potential producers have little control over.
i

© 2014 Peadar O’Sullivan [email protected]
Acknowledgements
I would like to express my appreciation to all those who provided me with the possibility to complete this report. A special gratitude I give to my report supervisor, Dr. Yousef Husein Eiadat, whose contribution in stimulating suggestions and encouragement, helped me to coordinate and structure my project.
Furthermore I would also like to acknowledge with much appreciation the crucial role of the staff of Michael Smurfit Graduate Business School, who gave the permission to use all required equipment and the necessary material to complete this project.
Finally, a special thanks goes to my family, friends and loved ones who supported me and stood by me throughout this project.
ii

© 2014 Peadar O’Sullivan [email protected]
Table of Contents
Abstract ........................................................................................................................................ i
Acknowledgements ...................................................................................................................... ii
List of Figures ............................................................................................................................... v
List of Tables ................................................................................................................................ vi
Acronyms .................................................................................................................................... vii
1. Introduction ......................................................................................................................... 1
2. Background .......................................................................................................................... 3
2.1. Conventional Gas & Unconventional Gas ........................................................................................ 3
2.2. Irelands Unconventional Gas Industry ............................................................................................ 5
2.2.1. Progress to Date .............................................................................................................. 5
2.2.2. Estimated Resources ....................................................................................................... 6
3. Economics of Unconventional Gas ......................................................................................... 7
3.1. Shift in Global Natural Gas Prices .................................................................................................... 7
3.2. Impact on Irish & UK Markets ......................................................................................................... 9
4. Research Methodology ....................................................................................................... 12
4.1. Methodology Overview ................................................................................................................. 12
4.2. Development & Production Costs ................................................................................................. 14
4.2.1. Drilling Costs .................................................................................................................. 16
4.2.2. Fracturing Costs ............................................................................................................. 17
4.2.3. Production / Operating Costs ........................................................................................ 18
4.2.4. Land Access ................................................................................................................... 19
4.3. Future Gas Prices ........................................................................................................................... 20
4.4. Well Production Profiles & EUR ..................................................................................................... 24
4.5. Taxation ......................................................................................................................................... 27
4.5.1. Petroleum Production Tax ............................................................................................. 27
4.5.2. Corporation Tax ............................................................................................................. 28
5. Analysis of Results .............................................................................................................. 29
5.1. Sensitivity Analysis ......................................................................................................................... 31
5.2. IRR & Breakeven Analysis .............................................................................................................. 37
5.3. Limitations of Analysis ................................................................................................................... 39
6. Discussion & Conclusions .................................................................................................... 40
7. References .......................................................................................................................... 44
8. Bibliography ....................................................................................................................... 46
iii

© 2014 Peadar O’Sullivan [email protected]
9. Appendices ......................................................................................................................... 49
Maps of Irelands Potential Shale Gas Locations .................................................... Appendix A.
Sample PPT Calculation .......................................................................................... Appendix B.
Breakdown of Forecasted Gas Prices ..................................................................... Appendix C.
Breakdown of Forecasted Drilling & Completion Costs (CAPEX) ........................... Appendix D.
Breakdown of Land Access Calculation .................................................................. Appendix E.
DCF Model – P50 Base Case Scenario .................................................................... Appendix F.
DCF Model – P10 / P90 Variable Gas Prices .......................................................... Appendix G.
DCF Model – P10 / P90 Variable Initial Gas Production ........................................ Appendix H.
DCF Model – P10 / P90 Variable CAPEX .................................................................. Appendix I.
DCF Model – P10 / P90 Variable OPEX ................................................................... Appendix J.
iv

© 2014 Peadar O’Sullivan [email protected]
List of Figures
Figure 1 - Criteria For a Successful Unconventional Gas Play – Source (Kuhn and Umbach, 2011) ....... 1 Figure 2 - Typical Location of Unconventional Gas in Rock Formation (Source: oilprice.com) .............. 3 Figure 3 – Locations of Onshore Petroleum Licencing Options in Ireland .............................................. 5 Figure 4 - Cross Border Trading of Natural Gas – Source (Bassi et al., 2013).......................................... 7 Figure 5 - Main European Gas Hub's – Source (DECC, 2012) .................................................................. 8 Figure 6 - Historical Oil and Gas Price Trends ......................................................................................... 8 Figure 7 - Irelands Primary Energy Supply 2012 – Source (Sustainable Energy Authority of Ireland [SEAI], 2013) .......................................................................................................................................... 11 Figure 8 - Forecasted Future UK Gas Supply – Source (Bassi et al., 2013) ............................................ 11 Figure 9 - Sample of DCF With Varying Discount Rates ........................................................................ 12 Figure 10 - D&C Cost Breakdown in the Haynesville Basin USA – Source (Gény, 2010) ....................... 14 Figure 11 - Approximate Size Required for a 20 Well Drill Site – Source (Moorman and Rollins, 2012) ............................................................................................................................................................... 19 Figure 12 - Irelands Primary Energy Supply Forecast ............................................................................ 20 Figure 13 - Irelands Gas Distribution Network (Source – bordgais.ie) .................................................. 21 Figure 14 - Fluctuation between UK NBP Prices in Sterling and Euro ................................................... 22 Figure 15- DECC Projected UK Gas Prices .............................................................................................. 23 Figure 16 - Price Breakdown of Irish Wholesale Gas Price .................................................................... 24 Figure 17 -Example Illustrating Production Decline of 3 Wells with Different Initial Production Rates 25 Figure 18 - Example Illustrating the Difference in EUR as a Result of Differing Initial Production Rates ............................................................................................................................................................... 25 Figure 19 - Decline Curves with Various B Values ................................................................................. 26 Figure 20 – P50 Gas Production of 100 Well Program .......................................................................... 29 Figure 21 - P50 Lifecycle Revenue ......................................................................................................... 30 Figure 22 - P50 Project Cost Breakdown ............................................................................................... 30 Figure 23 - P50 DCF Analysis ................................................................................................................. 31 Figure 24- Variable Gas Prices ............................................................................................................... 32 Figure 25 - DCF Analysis of Variable Gas Prices..................................................................................... 32 Figure 26 - Variable Well Decline Curve ................................................................................................ 33 Figure 27 - Variable Cumulative Well Production ................................................................................. 33 Figure 28 - Production Profile of 100 Well Program Over 25 Year Lifecycle ......................................... 34 Figure 29 - Cumulative Production Profile of 100 Well Program Over 25 Year Lifecycle ..................... 35 Figure 30 - DCF Analysis of Variable Initial Gas Production .................................................................. 35 Figure 31 - DCF Analysis of Variable CAPEX Per Well ............................................................................ 36 Figure 32 - DCF Analysis of Variable OPEX / Well .................................................................................. 36 Figure 33 - One Way Sensitivity Analysis Tornado Diagram ................................................................. 37 Figure 34 - Minimum Gas Prices Required For Projects to Breakeven ................................................. 38 Figure 35 - Potential State Tax Revenue ............................................................................................... 43
v
© 2014 Peadar O’Sullivan [email protected]
List of Tables
Table 1- DCF Model Variables ............................................................................................................... 13 Table 2 - Indicative Production Costs – Source IEA ............................................................................... 15 Table 3 - Rig Site Construction Costs ..................................................................................................... 16 Table 4 - Cumulative Day Rate Costs ..................................................................................................... 17 Table 5 - Variable Costs Associated Depth Based Costs ........................................................................ 17 Table 6 - Variable Fracture Costs ........................................................................................................... 18 Table 7 - PPT Rates ................................................................................................................................ 27 Table 8 - Model Input Variables ............................................................................................................ 31 Table 9- NPV / IRR / Breakeven Point of Variable Inputs ...................................................................... 38
vi
© 2014 Peadar O’Sullivan [email protected]
Acronyms
bcf Billion Cubic Feet
CAPEX Capital Expenditure
CER Commission of Energy Regulation
CPO Compulsory Purchase Order
CT Corporation Tax
DCENR Department of Communications, Energy & Natural Resources
DCF Discounted Cash-Flow
DECC Department of Energy & Climate Change
DETI Department of Enterprise, Trade and Investment
EPA Environmental Protection Agency
EUR Estimated Ultimate Recovery
F&D Finding & Developing
GIIP Gas Initially In Place
IEA International Energy Agency
IGP Initial Gas Production
IRR Internal Rate of Return
JRC Joint Research Centre
LNG Liquefied Natural Gas
Mcf Million Cubic Feet
MCF/D Million Cubic Feet / Day
NBP National Balancing Point
NPV Net Present Value
NWCB Northwest Carboniferous Basin
OPEX Operational Expenditure
PPT Petroleum Production Tax
SEAI Sustainable Energy Authority of Ireland
tcf Trillion Cubic Feet
vii

© 2014 Peadar O’Sullivan [email protected]
1. Introduction
A renewed global interest in natural gas has occurred, mainly fuelled by developments in the US, where unconventional gas, (predominately shale gas) has increased rapidly in the last decade. So much so that it accounted for 58% of domestic production in 2010 causing the US to surpass Russia as the largest gas producer in the world (Bassi et al., 2013).
Many other regions around the world have begun to investigate the potential of establishing unconventional gas industries within their own regions and assessing the impact that such an industry may have on their gas prices.
This study looks at the potential of a viable unconventional gas play in Ireland from an economical perspective. The study takes a look at conventional gas at the micro level, what is the current status of the industry in Ireland and what factors need to be considered when trying to establish such an industry in the country. And at the macro level, how is the production of unconventional gas in other regions likely to impact the potential success of the industry in Ireland.
By means of an economic model using a generic discounted cash-flow analysis, the viability of such an unconventional gas play in Ireland will be assessed to determine the project potential financial success via establishing its Net Present Value (NPV), Internal Rate of Return (IRR) and breakeven costs. The inputs into the model will be specific to an Irish situation where possible and focus on those outlined in Figure 1, well costs via capital (CAPEX) and operational (OPEX) costs, Initial gas production from each well, forecasted gas prices and fiscal regime.
Figure 1 - Criteria For a Successful Unconventional Gas Play – Source (Kuhn and Umbach, 2011)
1

© 2014 Peadar O’Sullivan [email protected]
As a means of identifying the gas plays sensitivity to changing economic factors, the model will be subjected to one-way sensitivity analysis by altering the input variables of CAPEX and OPEX costs, initial gas production and forecasted gas prices to assess the changes in the projects NPV, IRR and breakeven costs. The sensitivity analysis will illustrate the robustness of such an investment under varying economic conditions.
Throughout this study, neither environmental nor social factors have been taken into consideration with regards to the economic viability of an unconventional gas play in Ireland. The study solely focuses on the associated economic factors.
2

© 2014 Peadar O’Sullivan [email protected]
2. Background
2.1. Conventional Gas & Unconventional Gas Natural gas resources are generally classified as ‘conventional’ or ‘unconventional’, depending on where the gas is trapped. Conventional gas is typically found in multiple discrete well defined reservoirs. This gas is often difficult to find however once discovered, is typically the most cost effective to extract. The rock formations where conventional gas is found are typically in sandstone, siltstone and carbonate (European Commission DG CLIMA, 2012) and can be usually extracted through vertical wells, with recovery rates in excess of 80% of the original volume of gas in place (Bassi et al., 2013).
Unconventional gas is found in less permeable rock formations typically classified into three typologies (Joint Research Centre [JRC], 2012) :
• Tight Gas: Trapped in relatively impermeable hard rock like limestone and sandstone. • Coal Bed Methane (CBM): Trapped in the fractures and on the surface of coal beds. • Shale Gas: Trapped in the fine-grained sedimentary rock called shale which is characterised
by its very low permeability.
The schematic in Figure 2 below illustrates the location of these unconventional gas deposits in a typical rock formation.
Figure 2 - Typical Location of Unconventional Gas in Rock Formation (Source: oilprice.com)
The term ‘unconventional’ in this context refers to the characteristics of the reservoir or bearing rock formation in which the gas is extracted from. not the composition of the extracted gas, which has a similar composition to that of ‘conventional’ natural gas (Bassi et al., 2013).
3

© 2014 Peadar O’Sullivan [email protected]
As Figure 2 illustrates the gas shale’s or shale beds are continuous deposits over very large areas, typically thousands of square kilometres. As a result of the rock formations low permeability, artificial stimulation is required to enable commercial extraction of the gas deposits. Techniques pioneered in the USA such as horizontal drilling and hydraulic fracturing (fracking) are used to facilitate the extraction process. Recovery rates for unconventional gas are typically much lower than that of conventional extraction, usually in the region of 15 – 30% (JRC, 2012).
4

© 2014 Peadar O’Sullivan [email protected]
2.2. Irelands Unconventional Gas Industry
2.2.1. Progress to Date
At present, there is no exploratory or commercial drilling underway in relation to unconventional gas on the Island of Ireland. The unconventional gas potential in Ireland lies in its shale rock formations, i.e. shale gas. Ireland is estimated to have potential shale gas resources, yet no proven reserves have been found as the countries exploration into its unconventional gas resources is in its infancy (International Energy Agency [IEA], 2012a).
In February 2011, three exploration companies were granted two year Onshore Petroleum Licencing Options by the Republic of Irelands Department of Communications, Energy & Natural Resources (DCENR). The licences in question were granted for the (Environmental Protection Agency [EPA], 2012):
Northwest Carboniferous Basin (NWCB)
Tamboran Resources PTY Ltd - 986 square kilometre (sq km) area
Lough Allen Natural Gas Company Ltd - 467 sq km area
Clare Basin
Enegi Oil Plc - 495 sq km area
(Appendix A illustrates detailed maps of the Clare and Northwest Carboniferous Basins.)
These options were valid for 24 months and enabled the holders to assess the natural gas potential of the licenced area, using largely desktop based studies of existing data from previous petroleum exploration activity. The Licensing Options did permit some shallow geological sampling but exploration drilling, including drilling that would involve hydraulic fracturing, was excluded under these options. The licences were due to expire in February 2013 at which time the holders would have had to reapply for another licence or relinquish the acreage (Rabbitte, 2013).
In Northern Ireland, Tamboran Resources PTY Ltd. also secured a Petroleum Licence from the Department of Enterprise, Trade and Investment (DETI) to explore for shale gas reserves over a 746 sq km area of the Northwest Carboniferous Basin in Co. Fermanagh. The licence in place in Northern Ireland was a 'drill or drop' type licence where the company had to relinquish the licence if it didn’t conduct a exploration programme on the acreage within a given timeframe (EPA, 2012).
Figure 3 – Locations of Onshore Petroleum Licencing Options in Ireland
5

© 2014 Peadar O’Sullivan [email protected]
In January 2013, in response to a growing public concern regarding unconventional hydrocarbon exploration and extraction, the EPA initiated a public consultation process on the terms of reference for a comprehensive study. This more comprehensive study is due to be published in the second quarter of 2016 at which date a decision on the future of unconventional gas exploration and of hydraulic fracturing in Ireland will be made (Department of Communications Energy & Natural Resources [DCENR], 2014).
To date of the three exploration companies issued licensing options in 2011, Tamboran Resources PTY Ltd. and Enegi Oil Plc have undertaken their own desktop studies to establish an estimate of the volume of shale gas in place. During this same period Lough Allen Natural Gas Company Ltd failed to carry out any further investigations on their licenced area and surrendered their licence in February 2013 once it had expired (Keeley, 2014).
2.2.2. Estimated Resources
In February 2012, the Australian based Tamboran Resources estimated the NWCB had a potential ultimate production of up to 4.4 trillion cubic feet (tcf) of gas. The gas potential is split between both Northern and the Republic of Ireland, with an estimated 2.2 tcf reserves of gas in each. Tamboran Resources at the time highlighted the extraction of the shale gas would require a €7 billion investment from Tamboran Resources and in turn generate up to €4.9 billion in tax revenues over the lifetime of the project for the Republic of Ireland with the lifespan of the project expected to last until the year 2050.
The find was also estimated to generate similar tax revenues in Northern Ireland with a £6 billion investment to be made by Tamboran which would generate £6.9 billion in taxes to the Northern Irish economy. Tamboran had hoped to apply for an exploration licence and commence exploration drilling in 2014, which has now been put on hold until the EPA’s comprehensive report is published. (Natural Gas Europe, 2012).
In November 2012, Enegi Oil Plc., an independent oil and gas company located in Manchester, UK concluded their desktop study with an estimated 13.05 tcf (most likely) of gas initially in place (GIIP) and 5.59 tcf (pessimistic case). Of this Enegi estimated a total recoverable amount of between 1.49 tcf and 3.86 tcf. Similar to Tamboran Resources, Enegi have applied for an exploration licence following their desktop study however all licence approvals were put on hold until the EPA’s report is published (Enegi Oil Plc, 2012).
Lough Allen Natural Gas Company Ltd have since ceased to trade but a report published by a related party Finavera Gas, in 2006 estimated a P50 resource of 9.4tcf across the NWCB based on a study undertaken by Schlumberger (Keeley, 2014).
Based the analysis conducted on these three shale gas plays alone an estimated ultimate recovery of approximately 10tcf of gas has been estimated for potential extraction.
6

© 2014 Peadar O’Sullivan [email protected]
3. Economics of Unconventional Gas
3.1. Shift in Global Natural Gas Prices
Traditionally the international trade of natural gas is constrained by high transportation and storage costs, as a result only one third of global gas supplies are traded across borders, in comparisons to two-thirds of oil as illustrated in Figure 4. Thus the natural gas industry is dominated by a segmented geographical structure rather than one global market similar to that of oil trading. As it stands three regional markets exist, North America, Asia and Europe (Bassi et al., 2013).
Figure 4 - Cross Border Trading of Natural Gas – Source (Bassi et al., 2013)
Unlike oil which has a global price each of these regional markets has its own pricing structure. These markets are dependent on their maturity, the sources of their gas supply, their dependence on imports plus other geographical and political factors. Asian and European markets mainly rely on long term contracts which are oil indexed (i.e. their prices fluctuates with the price of oil). The North American market is the most mature and liberalised gas market and is thus less influenced by the fluctuation in oil prices (Bassi et al., 2013). North American gas is usually priced at infrastructure hubs with the most commonly quoted being the Henry Hub in Louisiana (Department of Energy & Climate Change [DECC], 2012).
Competitive pricing hubs are also in existence in Europe with the UK’s National Balancing Point (NBP) being the most well known and heavily traded European gas hub. The price of gas traded on the NBP is also influenced by oil indexed pricing through the UK’s connection with continental Europe (DECC, 2012). As Ireland import 95% of their natural gas requirements with 100% of that gas being purchased on the UK’s NBP market, movements on this market for Ireland are of great interest.
Though gas prices in the regional markets are calculated differently, global oil and gas prices have historically followed similar trends, however in more recent times with the dawn of the ‘shale gas boom’ in the US, since the middle of the 2000’s gas prices in the US began to break this trend as illustrated in Figure 6.
7

© 2014 Peadar O’Sullivan [email protected]
Figure 5 - Main European Gas Hub's – Source (DECC, 2012)
Figure 6 - Historical Oil and Gas Price Trends
8
© 2014 Peadar O’Sullivan [email protected]
The renewed interest in natural gas has been fuelled by these developments in the US, which have transformed the global perception of the role natural gas has to play in future energy systems. Unconventional gas, (predominately shale gas) production in the US has increased rapidly in the last decade. So much so that it accounted for 58% of domestic production in 2010 causing the US to surpass Russia as the largest gas producer in the world.
Prior to the advent of shale gas production in the US expectations were that the country would need to import large volumes of liquefied natural gas (LNG) to meet its domestic energy needs by 2015. This expectation in turn led to large investment into the construction of import LNG facilitates. However in reality due to the revolution of the ‘shale gas boom’, the US is gas self sufficient is now on the verge of becoming an exporter of LNG due to the surplus of natural gas being produced. A number of these import LNG facilitates are now being converted to export LNG globally (JRC, 2012).
Similarly in preparation for the much anticipated increase of LNG imports into the US a number of LNG export facilities were built in West Africa and the Middle East to cater for the US market. However as a result of its newly acquired self sufficiency in meeting its own energy needs, LNG destined for the US now needed to find a new market. This indirectly had an effect on global markets as prices dropped due to the abundance of LNG for sale on the global market (DECC, 2012).
The question is, is this the start of a move away from regional pricing to a more global pricing structure. Currently the main issue is the lack of connectivity between the producer and the consumer. Transport via pipeline is expensive and inflexible, transport via LNG shipping is more flexible but require significant capital investment in constructing export and import facilitates. Over time it is expected that trading of LNG will increase between regional markets and the production of LNG will increase in North America and other region around the world such as the Gulf and Pacific.
3.2. Impact on Irish & UK Markets
Between the years 1990 and 2010 the demand for natural gas as a primary energy source doubled in Ireland mainly due to the country’s increased reliance on gas for electricity generation and home heating, largely due to the fact it provided a much cleaner alternative to solid fuels. Natural gas now comprises approximately one third of the country’s energy needs as illustrated in Figure 7 (DCENR, 2014).
Ireland currently imports 95% of its natural gas requirements with the remaining supply coming from the country’s declining indigenous Kinsale gas field leaving the country highly vulnerable to supply disruptions and to price volatility. Though Ireland is also awaiting the Corrib gas field to come on line, this field will not meet the long term needs of the country’s gas demands.
In genera, Ireland being a price taker on the international gas market has limited control over its gas prices. Whether the economy is growing and demand for gas is increasing, it doesn’t necessarily mean prices will increase in the country and similarly if a drop in economic growth occurs it may not result in reduced gas prices Being an island nations with a geographically dispersed population and high reliance on fossil fuels generally results in Irish energy prices being higher than those of many of its European neighbours (DCENR, 2014).
9

© 2014 Peadar O’Sullivan [email protected]
With all of the gas imported into Ireland coming from the UK, what happens to gas prices on the UK’s NBP market is of great importance to Ireland. The UK’s gas prices are set by a number of factors, some which are local, regional and others which are global. Local issues relate to local gas demand, the outlook of its own conventional gas production in the North Sea, its own prospects of an unconventional gas industry. Regional issues are its connection with the European gas network and Europe’s overall reliance on gas supplies from Russia. Global factors are those as outlined previously, fluctuations in the prices of imported LNG supplies from other regions (DECC, 2012).
Conventional gas resources in the UK are declining quickly. After reaching their peak in the year 2000, production in 2013 had almost halved. As a result of this depletion in its own natural resources, the UK has become a net importer of natural gas since 2004 with over 40% of the UK gas demand being satisfied by imports in 2011 (National Grid, 2012).
As can be seen in Figure 8 the UK’s indigenous gas supply is forecasted to only meet approximately 14% of the countries needs within the next 15 years, with the remainder of the demand being made up of imported gas and domestic shale gas. The UK estimates its shale gas industry could provide up to 34% of its gas demand by 2030 however this is dependent on the industry overcoming all its critics. Thus the best case scenario is that the UK will be reliant on gas imports for 52% of its needs and if its unconventional gas industry is unsuccessful, it could be reliant on imported gas for 86% of its needs by 2030. Thus it could be even more highly susceptible to global gas prices in the future. As Ireland is practically fully reliant on the UK for its gas supply, Figure 8 equally represents the future supply of gas to Ireland minus what the Corrib gas field will supply.
10

© 2014 Peadar O’Sullivan [email protected]
Figure 7 - Irelands Primary Energy Supply 2012 – Source (Sustainable Energy Authority of Ireland [SEAI], 2013)
Figure 8 - Forecasted Future UK Gas Supply – Source (Bassi et al., 2013)
11
© 2014 Peadar O’Sullivan [email protected]
4. Research Methodology
4.1. Methodology Overview
As previously outlined, this study focuses on the hypothetical development of an unconventional gas field in Ireland. The project is assessed by assuming a uniform field development plan of an estimated 100 well program drilled at 10 wells per year for the first 10 years of the gas field’s life. The study monitors the performance of the field over a 25 year period to determine its economical viability within that time.
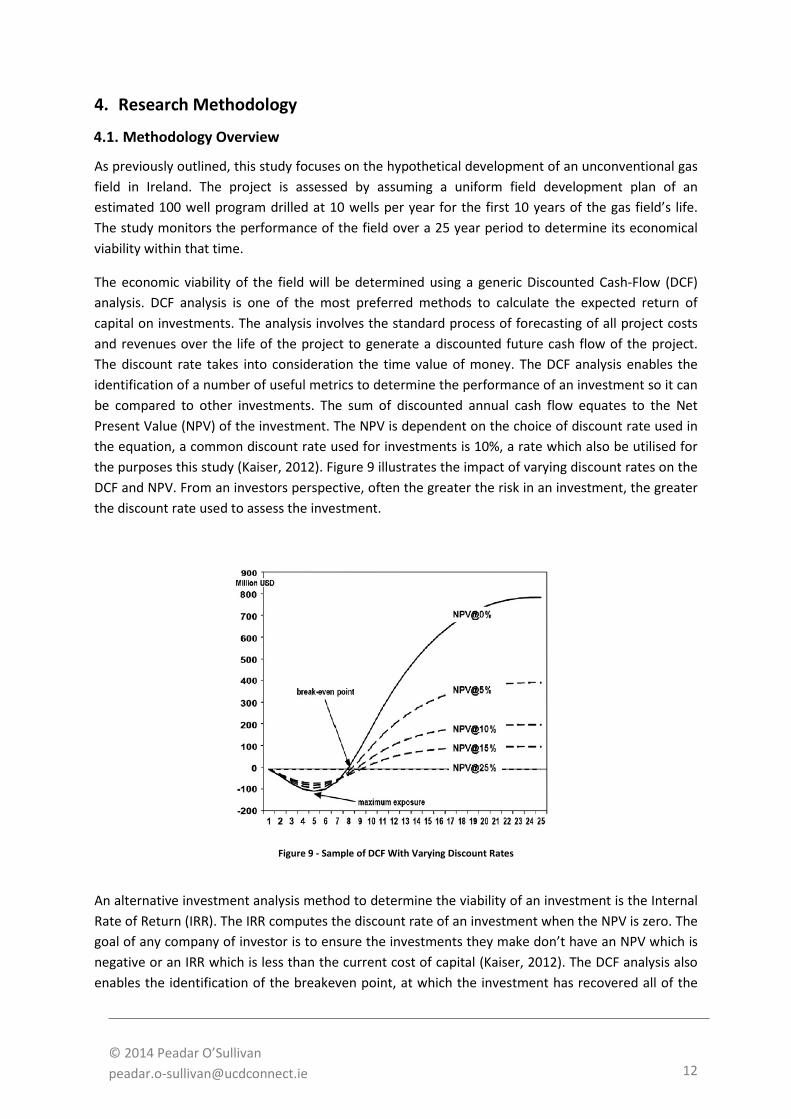
The economic viability of the field will be determined using a generic Discounted Cash-Flow (DCF) analysis. DCF analysis is one of the most preferred methods to calculate the expected return of capital on investments. The analysis involves the standard process of forecasting of all project costs and revenues over the life of the project to generate a discounted future cash flow of the project. The discount rate takes into consideration the time value of money. The DCF analysis enables the identification of a number of useful metrics to determine the performance of an investment so it can be compared to other investments. The sum of discounted annual cash flow equates to the Net Present Value (NPV) of the investment. The NPV is dependent on the choice of discount rate used in the equation, a common discount rate used for investments is 10%, a rate which also be utilised for the purposes this study (Kaiser, 2012). Figure 9 illustrates the impact of varying discount rates on the DCF and NPV. From an investors perspective, often the greater the risk in an investment, the greater the discount rate used to assess the investment.
Figure 9 - Sample of DCF With Varying Discount Rates
An alternative investment analysis method to determine the viability of an investment is the Internal Rate of Return (IRR). The IRR computes the discount rate of an investment when the NPV is zero. The goal of any company of investor is to ensure the investments they make don’t have an NPV which is negative or an IRR which is less than the current cost of capital (Kaiser, 2012). The DCF analysis also enables the identification of the breakeven point, at which the investment has recovered all of the
12

© 2014 Peadar O’Sullivan [email protected]
costs it has incurred to date. It determines a timeframe in which the investor can expect to have their investment repaid in full (see Figure 9).
This study intends to utilise NPV, IRR and breakeven point as a means to determine the viability of this project.
The simulation of the unconventional gas field DCF over 25 years has been modelled using a standard Microsoft Excel software package. The economic viability of the project will initially be conducted on a base case scenario, also known as a ‘most likely scenario’ (P50). This will be followed by One-Way Sensitivity analysis that evaluates the impact on the DCF of the model based on a ‘pessimistic scenario’ (P90) and an ‘optimistic scenario’ (P10).
Variables assessed during the sensitivity analysis were future gas prices, initial well production rates, well CAPEX and well OPEX. The ranges of variables used in the analysis are outlined below in Table 1.
Table 1- DCF Model Variables
To determine the DCF of each scenario, the DCF model determines the annual cash flow of the project.
𝑪𝒂𝒔𝒉 𝑭𝒍𝒐𝒘 (𝑨) = (𝑷 ∗ 𝑸) − 𝑪𝑨𝑷𝑬𝑿 −𝑶𝑷𝑬𝑿 − 𝑻𝒂𝒙
where:
• 𝑃 equals annual gas production in (Mcf) • 𝑄 equals current gas price (€/Mcf)
The formulation of gas production rates, future gas prices, capital expenditure, operating costs and taxation are expanded on further in the following sections.
The annual discounted cash flow is determined by the following equation:
𝑫𝑪𝑭 = 𝑨𝒕(𝟏 + 𝑭)𝒕�
where:
• 𝐴 equals annual cash-flow • 𝐹 equals discount rate accounting for the time value of money
Variables Distribution Unit P90 P50 P10Gas Prices - €/Mcf - - 6.97€ 8.91€ 11.69€ Initial Gas Production Uniform Mcf / day 900 2212 1031 1556 2081Well CAPEX - € / well - - 10,049,499€ 7,427,746€ 5,846,374€ Well OPEX - € / Mcf - - 2.60€ 2.00€ 1.54€
Range
13

© 2014 Peadar O’Sullivan [email protected]
• 𝑡 equals time
The Net Present Value (NPV) is determined by the cumulative discounted cash flow as outlined above. The Internal rate of return (IRR) is equal to the NPV when F is equal to zero.
𝑵𝑷𝑽 = � [𝑨𝒕 (𝟏 + 𝑭)𝒕⁄ ]
4.2. Development & Production Costs
The costs associated with the development and production of unconventional gas wells are made up of several factors, capital costs (CAPEX), operational costs (OPEX), taxes and royalties (IEA, 2012b).
Capital costs or alternatively referred to as finding and development (F&D) costs, are usually dominated by the cost of finding and developing gas reserves, i.e. acquiring land access, exploring it, drilling and completing the wells. In the US land acquisition accounts for approximately 50% of total F&D costs with the remaining costs split 50/50 between drilling and completing. Figure 10 illustrates the typical breakdown of drilling and completion costs on a shale gas well in the Haynesville basin in the USA. In more recent times the cost of completions have begun to over take drilling costs as a result of the additional costs incurred to undertake more intense multistage hydraulic fracturing to increase the flow of gas to the surface(Gény, 2010).
Figure 10 - D&C Cost Breakdown in the Haynesville Basin USA – Source (Gény, 2010)
The operating costs also referred to as the lifting costs are the variable costs directly associated with a wells production activity after it has been drilled and completed. These costs usually include the cost of gathering, processing and transporting the gas to the nearest gas network grid. These costs are variable as they’re dependent on the characteristics of each reservoir, the chemical composition of the gas, pressure in the well and the general location of the well. Transportation costs like
14

© 2014 Peadar O’Sullivan [email protected]
conventional extraction are distance dependent, determined by the distance of the well to the nearest gas network grid that enables the sale of the gas to the market (IEA, 2012b, Gény, 2010).
Published historical data in relation to unconventional gas development and production costs in Ireland and even Europe are little to none as the industry is still in its infancy. To date all studies and economic models published in relation to unconventional gas in Europe are heavily reliant on the large volume of data gathered in the US in recent years as their domestic unconventional gas industry has flourished.
However even this data carries significant variability in the development and production costs found in the different basins across the US, as illustrated in Table 2 with costs known to vary between $3 to $7 per Mcf. Analysts assume that costs in Europe would be approximately 50% greater than those in the US due to the infancy of the industry and more rigorous regulations (DECC, 2012, IEA, 2012b).
Table 2 - Indicative Production Costs – Source IEA
To apply the data gathered in the US to an Irish scenario, further analysis needs to be conducted on the economic factors that make up these costs and how they may vary in Ireland. To date only two reports, Gény (2010) and (JRC, 2012) have taken a detailed looks at these factors from a European perspective. The general consensus is that a number of factors will increase the cost of development and production significantly in comparisons to the US:
• Geological Depth – The depth of European shale is known to be on average 1.5 times greater than that in the US resulting in the need for more powerful and sophisticated equipment to drill and fracture to those depths.
• Regulation – Generally labour laws and environmental and safety laws in Europe would be more robust than that of the US resulting in higher wage demands and more expensive drilling and completion costs.
• Higher Cost Supply Chain – Europe lacks the necessary supply chain of specialist companies and personnel to service an unconventional gas industry which would therefore contribute to increased rates for these services due to a lack of competition amongst providers.
• Lack of Supporting Infrastructure – Europe lack the same network of pipelines and processing facilities that are in existence in the US as a result of the legacy left behind by their hydrocarbon industry. For example there is 53km of transmission pipeline for every
15

© 2014 Peadar O’Sullivan [email protected]
100km2 in the US in comparisons to 29km in the EU. To factor these costs into a European scenario could make many potential unconventional gas plays uneconomical.
The analysis conducted by the (JRC, 2012) will be utilised or the purposes of this study with adjustment made for inflation. The JRC report takes a much more detailed look at well development costs in comparisons to Gény (2010).
4.2.1. Drilling Costs
The JRC reports takes on a similar approach to this study in trying to establish the viability of an unconventional gas field subjected to three different development and production cost scenarios. For the purposes of the DCF model the same cost variables established by the JRC will be utilised in this study with the necessary adjustments made for inflation. These variables resulted in drilling costs ranging from approximately €1.7 million to €4.2 million per well. In addition to the JRC variables, these costs are also based on the following key assumptions:
• The average length of each well bore is estimated at 2500m which includes the length of both vertical and horizontal drilling as identified by data published by Tamboran Resources (Moorman and Rollins, 2012).
• The number of well located on each well pad is assumed to be 20 (Moorman and Rollins, 2012).
The above drilling costs are defined by a number of factors, the rig site costs, depth based costs and day rate based costs. Each of which is expanded on in more detail below.
Rig Site Costs – the rig site cost is defined by the size of the pad and the number of wells drilled on each pad. Rig site costs are estimated to be three to five times higher than those of the USA as a result of more rigorous environmental regulation (JRC, 2012). As illustrated in Table 3 the number of wells per pad has been assumed to be 20 where the pad construction costs are those established by the JRC report.
Table 3 - Rig Site Construction Costs
Description Unit P90 P50 P10 Comments
Construction Cost Per Pad € 5,200,000€ 4,680,000€ 3,640,000€ Estimated cost per pad considering a concrete rig site, surface water management system,
Number of wells per pad wells 20 20 20 Dependent on local geology
Cost per well € / well 260,000€ 234,000€ 182,000€
Typical Rig Site Configuration
16

© 2014 Peadar O’Sullivan [email protected]
Day Rate Costs – Drilling rigs are typically charged at a day rate with the rate varying relevant to the size of the rig. Rates ranging from €15,500 to €29,000 per day are standard within the industry. Other day rate costs include directional drilling costs, mud service costs, drill bit costs and well evaluation equipment costs. Table 4 illustrates the cumulative day rate cost of all these services combined.
Table 4 - Cumulative Day Rate Costs
Depth Based Costs – All depth related costs are associated with materials used to construct and line a well, ranging from cement and casing material to line the length of the well, the volume of drilling mud required to lubricate the drilling process and the amount of waste water management required to treat the extracted waste water. Table 5 illustrates the variable costs associated with the different depth related factors which are defined as an overall cost per metre drilled.
Table 5 - Variable Costs Associated Depth Based Costs
4.2.2. Fracturing Costs
The main costs associated with the fracturing of unconventional gas wells is driven by the cost of the fracturing equipment, the volume of water, proppant (treated sand or man-made ceramic material designed to keep an induced hydraulic fracture open) and fracturing additives used. These costs are usually expressed in the form of cost per fracturing stage. With a limited number of fractures having taken place in Europe all costs are derived from US examples (JRC, 2012). As illustrated in Table 6, the number of fracture stages per well has been assumed to be 14 in the DCF model.
Description Unit P90 P50 P10 Comments
Drilling Operations Day Rate Based Costs
Drill RigDirectional DrillingMud ServicingDrill BitWell Evaluation Equipment
€ / day 81,120€ 51,480€ 36,192€
Description Unit P90 P50 P10 Comments
Casing, cementing and wellhead costs € / m 312€ 286€ 260€ The cost of well installations in terms of casing, cement and wellhead
Mud Re-Use Factor - 5 5 5 Mud may be re-used for multiple wells, so cost is distributed over multiple wells
Mud matierial costs € / m3 2,080€ 1,040€ 416€ Higher mud cost will typically lead to higher performance due to a reduction in wellbore related problems
Waste & Water Management costs € / m3 1,373€ 686€ 275€
Total Depth Based Cost € / m 542€ 401€ 306€
Depth Based Cost Scenario
17

© 2014 Peadar O’Sullivan [email protected]
Table 6 - Variable Fracture Costs
Based on the variable costs outlined above, the total cost associated with the drilling and completion (fracturing) cost of each well is estimated at €10,033,747, €7,411,993 and €5,830,621. These costs were utilised in the DCF model to represent the P90, P50 and P10 scenarios respectively. Refer to Appendix D for a detailed breakdown of these capital costs (CAPEX). 4.2.3. Production / Operating Costs
As previously outlined the costs associated with gas gathering and processing systems are highly dependent on the local situation of an individual gas field. Costs can vary significantly based on the complexity of existing infrastructure (piping and processing capacity) if any. The possibility of reusing existing infrastructure such as transmission pipelines can greatly reduce costs in certain regions while in other regions where no existing infrastructure is present costs can be significantly higher.
Considering the large degree of uncertainty in trying to establish a suitable operating cost for each well, a simplified approach was used for the purposes of the DCF model. Data provided by Schlumberger to Gény (2010) outlined a operating cost (OPEX) of $2.5/Mcf for European production. This cost sits at the upper end of the scale in comparisons to current US figures and will thus be used in the DCF model as a most likely scenario (P50). Making inflation adjustments and currency allowances, this rate equates to an approximate operating cost of €2 / Mcf. To simply analyse the potential impact of fluctuating operating costs on the project DCF, a value of €1.54 / Mcf and €2.6 / Mcf will be utilised to represent the P10 and P90 variables.
Note: One important factor which hasn’t been considered in the DCF model is the learning curve of an unconventional gas industry in Ireland and across Europe where construction costs should decrease over time similar to a manufacturing process as understanding of the geology, drilling techniques improve and supply chain efficiencies increase as has occurred in the US. Gény (2010) and (DECC, 2012) estimate that drilling and completion costs in Europe could reduce as much as 50% over the initial 10 to 15 year period. With regards to the DCF model CAPEX and OPEX costs remained static over the lifespan of the project.
Additionally, the gas field is assumed to only produce dry gas, it has been assumed that no liquids were be extracted from these wells.
Description Unit P90 P50 P10 Comments
Number of Fractures stages 14 14 14
Fixed Fracturing Costs € 728,000€ 624,000€ 520,000€ Costs related to infrastructre set-up, mobilisation etc.
Cost per Fracture Stage € / stage 364,000€ 312,000€ 260,000€ Materials and services required per fracture stageTotal Completion Cost € 5,824,000€ 4,992,000€ 4,160,000€
Fracturing Costs
18

© 2014 Peadar O’Sullivan [email protected]
4.2.4. Land Access
Unlike in the US where landowners own the mineral rights beneath their properties, in Ireland these minerals are owned by the State. Not alone does the State own the rights to the resources beneath a private landowners land but they also have the right to compulsory purchase that land for the purposes of resource exploration. Compulsory Purchase Orders (CPO’s) enable the State to acquire lands so projects which are for the ‘greater and common good’ of the State can proceed.
The current Irish regulatory framework surrounding the extraction of onshore resources (Petroleum and Other Minerals Development Act, 1960) wasn’t originally formulated with onshore exploration in mind and is therefore limited in relation to any type of onshore activities. However, as the regulation stands, upon the granting of a petroleum lease by the Minister of the DCENR, the Petroleum Development Act allows the lease holder to gain access to such lands as are necessary for the purposes of carrying out production activities. The Minister of the DCENR with consent of the Minister of Finance has the right to compulsory purchase that land off the private land holder as is seen necessary for the purpose of resource exploration (DCENR, 1960).
Figure 11 - Approximate Size Required for a 20 Well Drill Site – Source (Moorman and Rollins, 2012)
For the purposes of the DCF model it has been assumed that each well pad in order to cater for the drilling of 20 wells would require 2.5 hectares of land as illustrated in Figure 11. In addition, it has been assumed that each drill pad would require an additional 3km x 20m corridor of land for construction of access tracks and transmission pipelines. At present the average value of agricultural land in Ireland is €10,000 per acre (Busteed, 2014). Considering the potential contention surrounding
19
© 2014 Peadar O’Sullivan [email protected]
the CPO of land for unconventional gas production this cost has been increased by 50% to €15,000 per acre in the DCF model. Based on these figures the cost to each drill pad will be €315,053 or €15,753 per well based on a 20 well drill pad. See Appendix E for a breakdown of land access costs.
4.3. Future Gas Prices
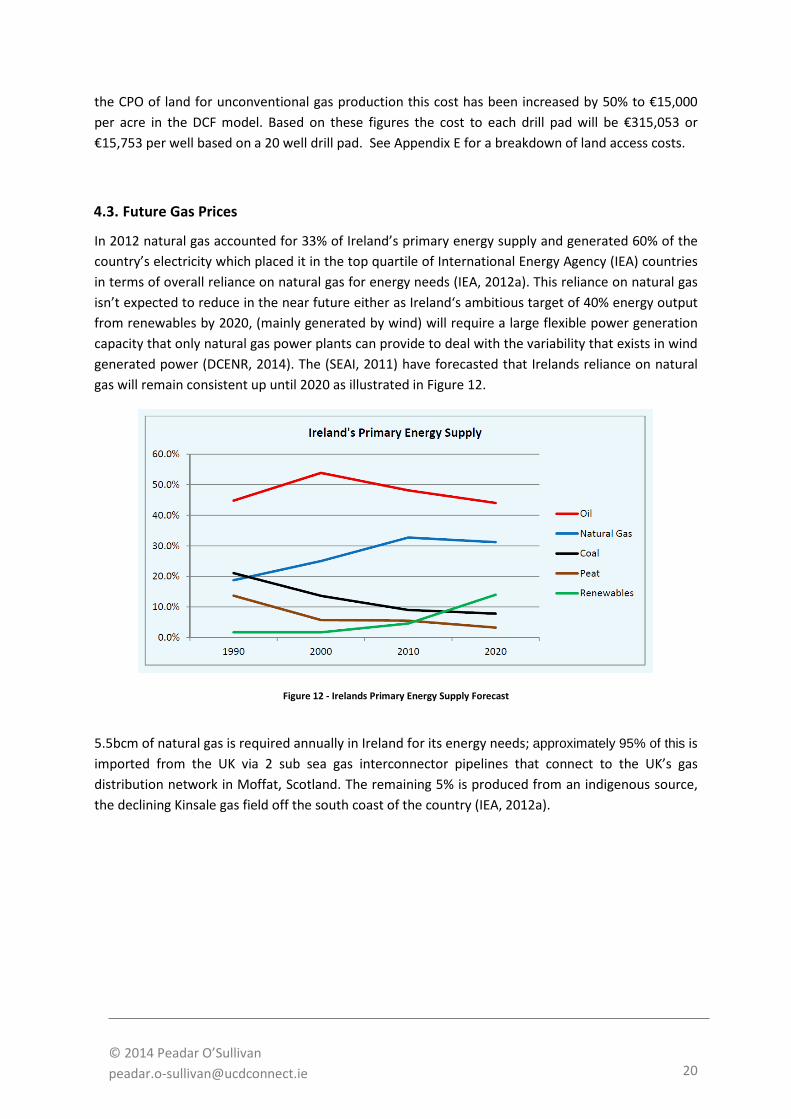
In 2012 natural gas accounted for 33% of Ireland’s primary energy supply and generated 60% of the country’s electricity which placed it in the top quartile of International Energy Agency (IEA) countries in terms of overall reliance on natural gas for energy needs (IEA, 2012a). This reliance on natural gas isn’t expected to reduce in the near future either as Ireland‘s ambitious target of 40% energy output from renewables by 2020, (mainly generated by wind) will require a large flexible power generation capacity that only natural gas power plants can provide to deal with the variability that exists in wind generated power (DCENR, 2014). The (SEAI, 2011) have forecasted that Irelands reliance on natural gas will remain consistent up until 2020 as illustrated in Figure 12.
Figure 12 - Irelands Primary Energy Supply Forecast
5.5bcm of natural gas is required annually in Ireland for its energy needs; approximately 95% of this is imported from the UK via 2 sub sea gas interconnector pipelines that connect to the UK’s gas distribution network in Moffat, Scotland. The remaining 5% is produced from an indigenous source, the declining Kinsale gas field off the south coast of the country (IEA, 2012a).
20

© 2014 Peadar O’Sullivan [email protected]
Figure 13 - Irelands Gas Distribution Network (Source – bordgais.ie)
As a result of the country’s reliance on imported gas from the UK, there is little the Irish regulator (The Commission for Energy Regulation – CER) can do to regulate Irish wholesale gas pricing as the largest proportion in the gas price is the cost involved in buying it on the UK wholesale gas market, known as the UK NBP or National Balancing Point. The UK in itself is also becoming heavily reliant on imported gas to the extent that in 2011 the UK for the first time its history imported more gas than it produced (Irish Academy of Engineering, 2013).
Thus it can be seen that Irish gas prices are already highly susceptible to changes or disruptions in global gas markets as the UK increasingly enters the global gas market to meet its own annual needs. In addition to global market effects, the gas in the UK is traded in sterling and as result Irish gas prices are also susceptible to fluctuations in currency exchange rates. Figure 14 illustrates the fluctuation of the UK NBP hub prices between the Sterling rate and Euro rate between January 2009 and June 2014 and the effect that the exchange rate can have on the gas price.
Therefore the wholesale price of gas in the Irish market is determined by the price of gas on the UK’s NBP wholesale gas market, the currency exchange between the euro and sterling at the time plus the cost of transporting the gas to Ireland via the subsea interconnectors.
21

© 2014 Peadar O’Sullivan [email protected]
Figure 14 - Fluctuation between UK NBP Prices in Sterling and Euro
The tariff in transporting gas through these interconnectors is currently a topic of great contention in Ireland due to the structure of its tariffing model. As it stands, €50 million is required annually to operate and maintain these interconnectors, the tariff charged to the different shippers wanting to transport gas to Ireland is not charged at a set rate per volume of gas, but on a rate which is dependent on the total volume of gas transported through the interconnectors annually. Thus, the greater the volume of gas transported annually, the smaller the cost to all shippers or vice versa, the smaller the volume of gas transported, the greater the cost to all shippers (McCarthy, 2011, The Commission of Energy Regulation [CER], 2012).
This model has worked well previously as the volume of gas to be imported into the country was predictable and the country’s gas network only had two entry points, Moffat in Scotland and Kinsale gas field. Thus with the limited production from the Kinsale gas field, shippers could easily predict interconnector tariff rates and incorporate those costs into their prices. However this is due to change, with more indigenous resources like Shells Corrib gas field due to come on line in the near future and begin supplying the Irish market, i.e. creating a third entry point.
As a result if the current tariffing model were to stay in place, Shell could charge just under the current price of Irish wholesale gas (cost of purchase on the UK market and transport tariff) and take market share from the current suppliers. The knock on effect of this would be less gas flowing through the interconnectors and therefore higher rates for the current shippers. This would create a continuous cycle of decreasing gas flowing through the interconnectors; increasing tariffs for shippers and the elimination of competition for Shell, thus enabling them to eventfully increase their prices.
To eliminate this possibility, the CER have proposed to impose a tariff on all gas imported or produced in Ireland to cover the annual operating costs of the two interconnectors. This proposal has resulted in the recent abandonment of the proposed Shannon LNG project which was to construct the country’s first LNG import facility as its developer believed the tariff made their project
22
© 2014 Peadar O’Sullivan [email protected]
uneconomical. They couldn’t justify paying for the operation of these interconnectors when they had no intention of utilising them (Ryan, 2014, McCarthy, 2011).
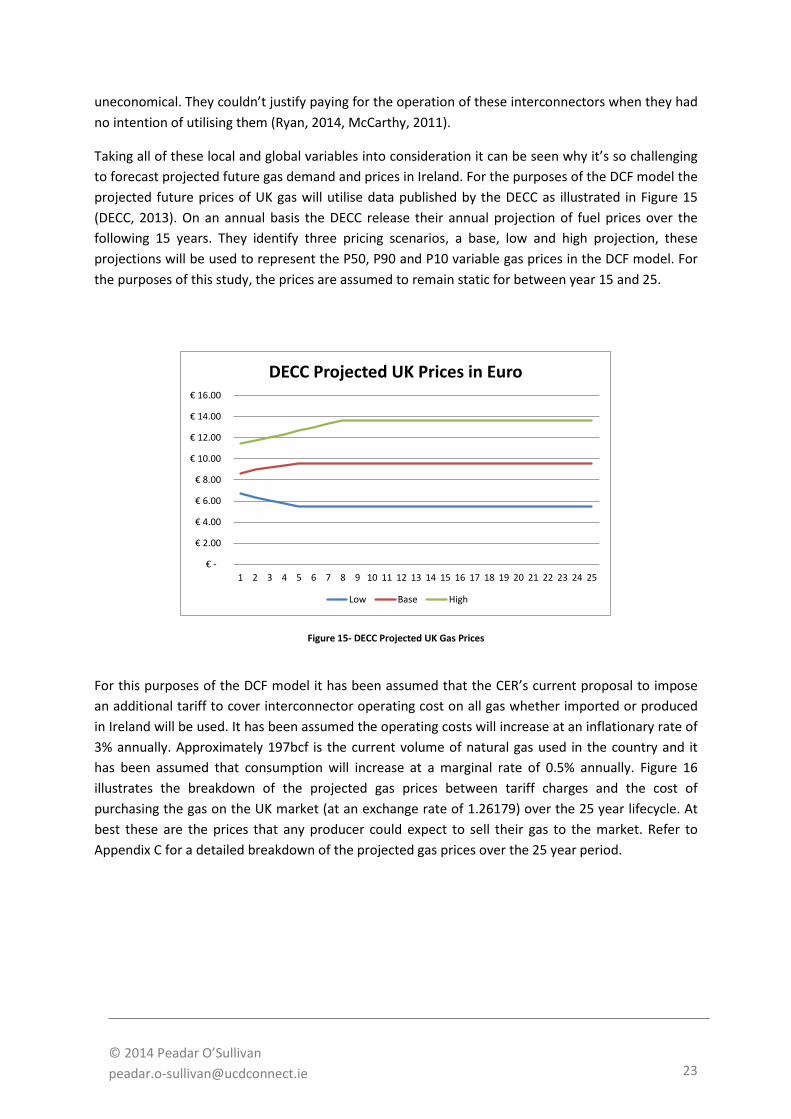
Taking all of these local and global variables into consideration it can be seen why it’s so challenging to forecast projected future gas demand and prices in Ireland. For the purposes of the DCF model the projected future prices of UK gas will utilise data published by the DECC as illustrated in Figure 15 (DECC, 2013). On an annual basis the DECC release their annual projection of fuel prices over the following 15 years. They identify three pricing scenarios, a base, low and high projection, these projections will be used to represent the P50, P90 and P10 variable gas prices in the DCF model. For the purposes of this study, the prices are assumed to remain static for between year 15 and 25.
Figure 15- DECC Projected UK Gas Prices
For this purposes of the DCF model it has been assumed that the CER’s current proposal to impose an additional tariff to cover interconnector operating cost on all gas whether imported or produced in Ireland will be used. It has been assumed the operating costs will increase at an inflationary rate of 3% annually. Approximately 197bcf is the current volume of natural gas used in the country and it has been assumed that consumption will increase at a marginal rate of 0.5% annually. Figure 16 illustrates the breakdown of the projected gas prices between tariff charges and the cost of purchasing the gas on the UK market (at an exchange rate of 1.26179) over the 25 year lifecycle. At best these are the prices that any producer could expect to sell their gas to the market. Refer to Appendix C for a detailed breakdown of the projected gas prices over the 25 year period.
€ -
€ 2.00
€ 4.00
€ 6.00
€ 8.00
€ 10.00
€ 12.00
€ 14.00
€ 16.00
1 2 3 4 5 6 7 8 9 10 11 12 13 14 15 16 17 18 19 20 21 22 23 24 25
DECC Projected UK Prices in Euro
Low Base High
23

© 2014 Peadar O’Sullivan [email protected]
Figure 16 - Price Breakdown of Irish Wholesale Gas Price
4.4. Well Production Profiles & EUR
The production profile of a well is generally characterised by the type of curve and decline curve analysis. Many factors define the type of curve, geology, geographic region, drilling techniques to name a few. One common trait exists among all unconventional gas well, the very large production decline experienced in its first year.
Unlike conventional gas wells, the production rate of an unconventional gas well peaks at the beginning of its life and decreases rapidly in its first and second year of production. Research conducted by Gény (2010) found that the production decline in most wells in their first year varied from 70 – 90% with a continuous but slower decline there after.
Thus the initial production rates achieved by each well is critical in evaluating its economic potential as it represents the wells maximum production rate over its lifetime unless the well is stimulated further in the future at great cost.
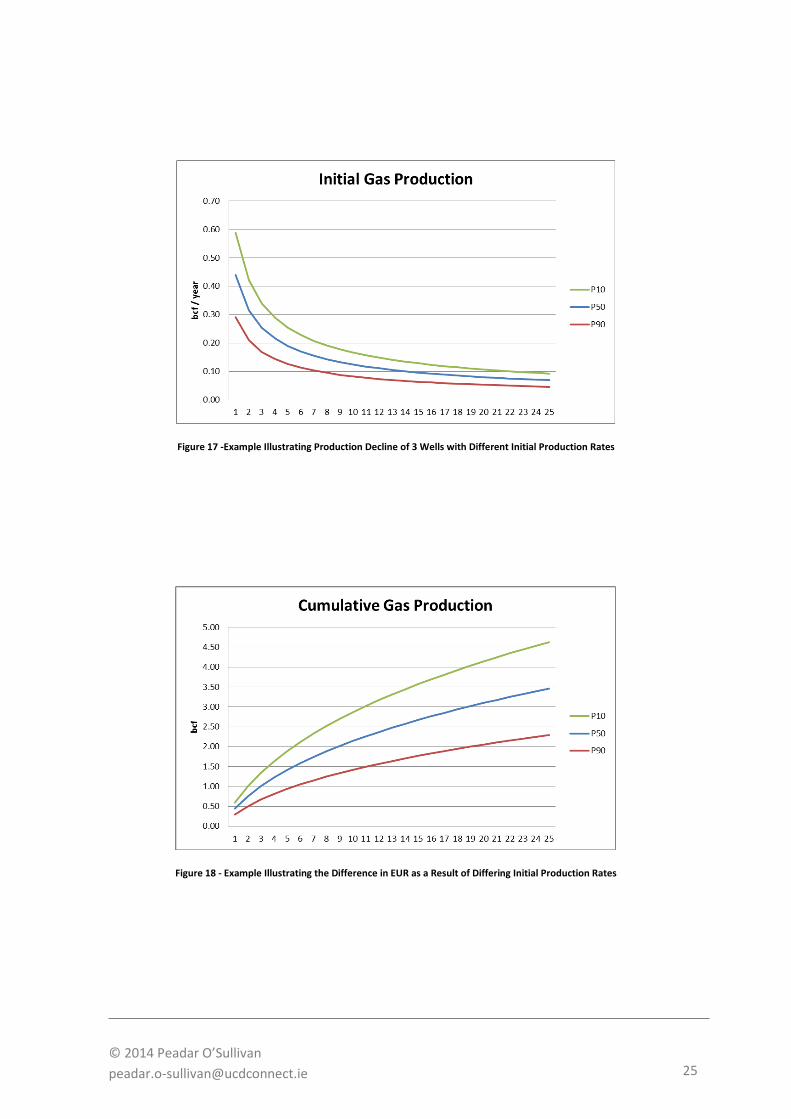
Figure 17 illustrates an example of three hypothetical wells with different initial production rates and their forecasted decline curves over a 25 year lifecycle. Figure 18 illustrates the EUR achieved by these three wells over their lifecycle. The difference in Estimated Ultimate Recovery (EUR) between the optimistic (P10) and pessimistic (P90) performer in this instance could result in a loss of approximately €20 million in revenue based on a rate of €10/Mcf for the producer.
€ 7.50
€ 8.00
€ 8.50
€ 9.00
€ 9.50
€ 10.00
€ 10.50
1 2 3 4 5 6 7 8 9 10 11 12 13 14 15 16 17 18 19 20 21 22 23 24 25
Price Breakdown of Irish Wholesale Gas Base Case
UK NBP Gas Price Interconnector Tariff Fee
24
© 2014 Peadar O’Sullivan [email protected]
Figure 17 -Example Illustrating Production Decline of 3 Wells with Different Initial Production Rates
Figure 18 - Example Illustrating the Difference in EUR as a Result of Differing Initial Production Rates
25
© 2014 Peadar O’Sullivan [email protected]
A number of methods to calculate wells EUR exist with one of the most popular being the “decline curve” method. This method involves the estimation of the wells initial daily production rate and rate of decline there after. This decline trend is extrapolated over the forecasted life of the well to determine the wells EUR.
Asps (1945) was the first to develop an equation for the decline curve method as outlined below:
𝑞(𝑡) = 𝑞𝑖
(1 + 𝑏𝐷𝑡)(1𝑏)
where 𝑞(𝑡) is production of gas at a specific in time (Mcf/time), 𝑞𝑖 is the intial production rate of the well (Mcf/time), 𝑏 is a dimensionless component. 𝐷 is the loss ratio or decline constant and 𝑡 is time (day / month / year).
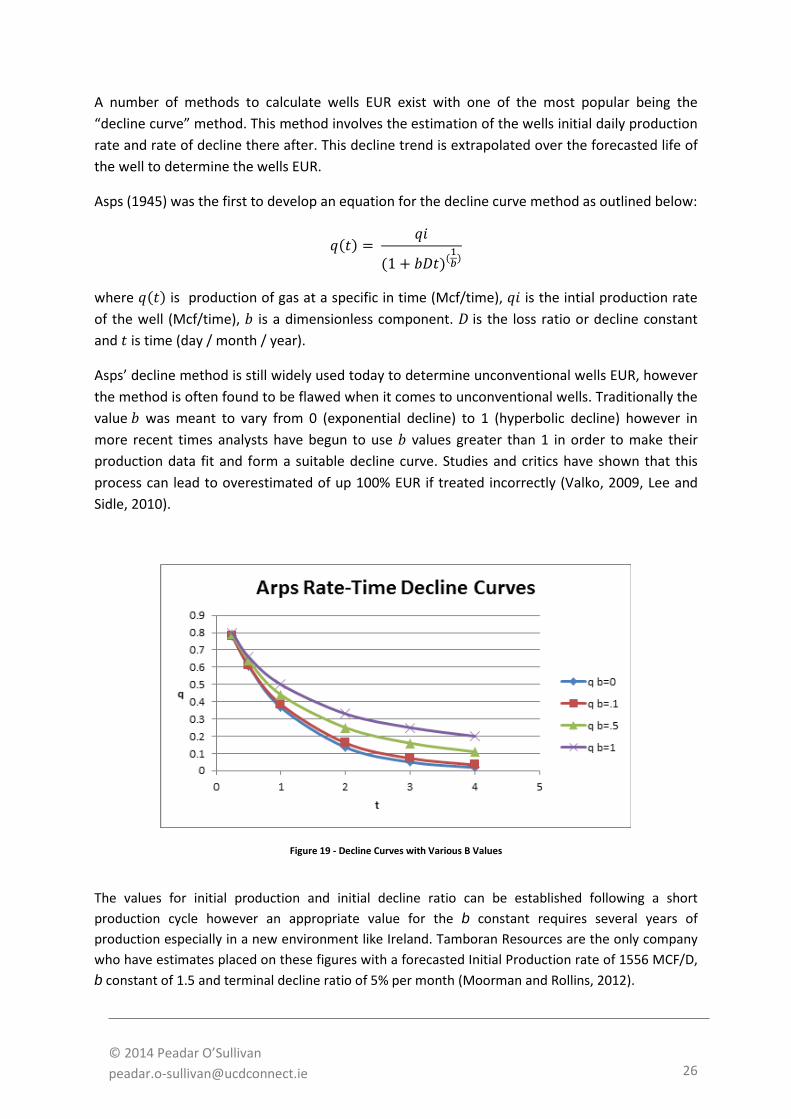
Asps’ decline method is still widely used today to determine unconventional wells EUR, however the method is often found to be flawed when it comes to unconventional wells. Traditionally the value 𝑏 was meant to vary from 0 (exponential decline) to 1 (hyperbolic decline) however in more recent times analysts have begun to use 𝑏 values greater than 1 in order to make their production data fit and form a suitable decline curve. Studies and critics have shown that this process can lead to overestimated of up 100% EUR if treated incorrectly (Valko, 2009, Lee and Sidle, 2010).
Figure 19 - Decline Curves with Various B Values
The values for initial production and initial decline ratio can be established following a short production cycle however an appropriate value for the b constant requires several years of production especially in a new environment like Ireland. Tamboran Resources are the only company who have estimates placed on these figures with a forecasted Initial Production rate of 1556 MCF/D, b constant of 1.5 and terminal decline ratio of 5% per month (Moorman and Rollins, 2012).
26

© 2014 Peadar O’Sullivan [email protected]
For the purposes of the DCF model the Tamboran Resources figures will be utilised to establish the P50 base case scenario.
4.5. Taxation
Ireland doesn’t currently have any specific taxation system in place for the extraction of onshore unconventional gas. Therefore the tax structure utilised in DCF model is the same Irish taxation model recently proposed to be applied to the extraction of offshore natural resource.
A recent review and recommendations of the existing fiscal natural resources taxation system put forward by Wood Mackenzie (2014) has resulted in a reformed model being created by the Irish Government. This model is currently going through an official approval process and will apply to all future exploration and petroleum licences (Rabbitte, 2014). As this study aims to use the latest information available, the new fiscal taxation system has been implemented in the DCF model. The new taxation model is broken into two forms of taxation, one is a variable production tax, who’s rate varies depending on the amount of hydrocarbon being produced and the other is a standard fixed corporate tax which is applied to all profits. The following outlines how these taxes are applied in detail.
4.5.1. Petroleum Production Tax
The Petroleum Production Tax (PPT) is a variable tax rate which is dependent on the profitability of a specific exploration licence. The PPT profit ratio is determined by the “R Factor” which is defined as:
𝑅 𝐹𝑎𝑐𝑡𝑜𝑟 = 𝐶𝑢𝑚𝑢𝑙𝑎𝑡𝑖𝑣𝑒 𝐺𝑟𝑜𝑠𝑠 𝑅𝑒𝑣𝑒𝑛𝑢𝑒 − 𝐶𝑢𝑚𝑢𝑙𝑎𝑡𝑖𝑣𝑒 𝑃𝑃𝑇 𝑃𝑎𝑖𝑑
𝐶𝑢𝑚𝑢𝑙𝑎𝑡𝑖𝑣𝑒 𝐸𝑥𝑝𝑒𝑛𝑑𝑖𝑡𝑢𝑟𝑒
where:
• the cumulative expenditure is inclusive of both capital expenditure and operating expenditure.
The R Factor ensures that taxation on a field is low when a field is being established and increases accordingly as the fields profitability increases. The PPT rates associated with a specific R Factor are based on the following tax rate bands:
R Factor PPT < 1.5 5% 1.5 10%
1.5 < R < 4.5 Pro rata > 4.5 40%
Table 7 - PPT Rates
27

© 2014 Peadar O’Sullivan [email protected]
In instances where the R Factor is less than 1.5, the PPT will be 5% of the licences Gross Revenue. However in instances where the R Factor is 1.5 or greater, the PPT rate will be multiplied by the Pre Tax Net Income of the field where the cumulative expenditure (both capital and operational) is 100% deductible from the taxable income. The cumulative expenditure can amount to all costs incurred in exploration and production for a period of 25 years prior to commercial production associated with that specific licence.
Refer to Appendix B for a sample PPT calculation of a hypothetical project.
4.5.2. Corporation Tax
The PPT will be the first levy incurred on oil and gas companies in Ireland followed by a Corporation Tax (CT) rate of 25% on their pre-tax net income minus the PPT levy already deducted.
Therefore the combined PPT and CT rate in this model is maximised at an effective 55% tax rate, (i.e. 40% PPT + (25%CT * (100% - 40%PPT) = 55%). This is the maximum amount in which the government can’t take in taxation from a highly profitable licence.
Note: That 100% of past (the last 25 years prior to production) and current exploration and production losses associated with specific licence can be carried forward and offset against future taxable income.
28

© 2014 Peadar O’Sullivan [email protected]
5. Analysis of Results
As previously outlined the goal of this analysis was to evaluate the economic viability of a unconventional gas play (100 well / 10 wells per year drilling program over a 25 year lifespan) in Ireland through the construction of a financial business model that reflected the true costs and revenue that an oil and gas exploration company could expect to incur if such an investment was undertaken.
The premise of the study was to create a base case scenario and subject it to a generic DCF analysis to evaluate the potential profitability of the project. From this analysis the NPV, IRR, breakeven cost and breakeven point of the investment could be determined. Figure 20 to Figure 23 illustrates the key outputs of the DCF model in relation the P50 base case scenario, the estimated cumulative gas production of the field, the forecasted revenue that the field should generate and the costs the project should expect to incur over its lifespan defined by capital and operational costs and state taxes. Finally, Figure 23 illustrates the DCF analysis of the P50 base scenario and thus its economic viability. With an NPV of approximately €270 million and IRR of 33% it can be confirmed that this project is viable based on the P50 inputs.
Refer to Appendix F for a detailed breakdown of the base case scenario P50 DCF model which was utilised to formulate this analysis.
Figure 20 – P50 Gas Production of 100 Well Program
29

© 2014 Peadar O’Sullivan [email protected]
Figure 21 - P50 Lifecycle Revenue
Figure 22 - P50 Project Cost Breakdown
30

© 2014 Peadar O’Sullivan [email protected]
Figure 23 - P50 DCF Analysis
5.1. Sensitivity Analysis
As a means of stress testing the base case scenario, the model was subjected to one way sensitivity analysis where a number of input variables were adjusted (one at a time) to monitor the impact they may have on the potential profitability of the project. These adjustments were both optimistic (P10) and pessimistic (P90). As indicated in Section 4, the input variables adjusted in the model were the project CAPEX, OPEX, Initial Gas Production (IGP) and gas prices.
Table 8 - Model Input Variables
Variable Gas Prices
Figure 24 illustrates the different forecasted gas prices utilised in the DCF model to represent the three different scenarios. The variation in gas prices is significant as it represents a true reflection of the difficulty in which analyst have in predicting future gas prices as a result of the many variables at a local and global level can have on prices. The P90 scenario is less than half of that for the P10 scenario and similarly both P10 and P90 gas prices are approximately 50% either side of the base case P50 scenario.
Figure 25 illustrates the DCF of the project subjected to the different gas prices. Both the P50 and P10 scenarios return a positive DCF however the difference in NPV between both is in the region of €250 million. In relation to the P90 scenario, the forecasted DCF is negative thus making the project
Pessimistics Most Likely OptimisticVariables Distribution Unit P90 P50 P10
Gas Prices - €/Mcf - - 6.97€ 8.91€ 11.69€ Initial Gas Production Uniform Mcf / day 900 2212 1031 1556 2081Well CAPEX - € / well - - 10,049,499€ 7,427,746€ 5,846,374€ Well OPEX - € / Mcf - - 2.60€ 2.00€ 1.54€
Range
31

© 2014 Peadar O’Sullivan [email protected]
uneconomical and unviable. The NPV range between the P10 and P90 scenarios is approximately €500 million which represent the high impact in which variable gas prices could have on the viability of such a project.
Refer to Appendix G for a detailed breakdown of the variable gas price DCF models for both P10 and P90 scenarios that were used in formulate the DCF analysis illustrated in Figure 25.
Figure 24- Variable Gas Prices
Figure 25 - DCF Analysis of Variable Gas Prices
32

© 2014 Peadar O’Sullivan [email protected]
Variable Initial Gas Production
Figure 26 to Figure 29 illustrate the potential variable production rates of three different wells and their impact on overall production. Figure 26 and Figure 27 illustrate the difference in initial gas production of the three wells in the three different scenarios and how much that initial production rate can impact on the cumulative production of each well. As illustrated in Figure 27, the difference in cumulative production of a P10 and P90 well over their lifetime could be as much as 2 bcf. Assuming gas prices are similar to those outlined above for a P50 scenario (€10 / Mcf), over the lifetime of the two wells, the P10 well could return €20 million in additional revenue more than the P90 well.
Figure 26 - Variable Well Decline Curve
Figure 27 - Variable Cumulative Well Production
33

© 2014 Peadar O’Sullivan [email protected]
Figure 28 and Figure 29 illustrate the production profiles of the 100 well program over its lifetime. Figure 28 illustrates the increasing production output of the field over its initial 10 years as 10 wells are brought online annually followed by the sharp drop in production once the drilling program is complete. Similarly Figure 29 illustrates the sharp increase in cumulative production over the fields initial 10 years followed by a plateauing of production as the production rate from the wells decreases rapidly. It should be noted as illustrated above, in instances where producers enter into long term supply contracts, a long term continuous drilling program would be required to maintain production levels.
Figure 30 illustrates the DCF analysis of the field subjected to the different forecasted initial gas production rates. As is evident, in each of the scenarios a positive DCF is returned, though minimal of the P90 scenario, an NPV of approximately €55 million is still returned. Similar to the variation in gas prices, the range between the NPV of both P10 and P90 scenarios is significant with a potential difference in profit of approximately €400 million.
Refer to Appendix H for a detailed breakdown of the variable initial gas production DCF models for both P10 and P90 scenarios that were used in formulate the DCF analysis illustrated in Figure 30.
Figure 28 - Production Profile of 100 Well Program Over 25 Year Lifecycle
34

© 2014 Peadar O’Sullivan [email protected]
Figure 29 - Cumulative Production Profile of 100 Well Program Over 25 Year Lifecycle
Figure 30 - DCF Analysis of Variable Initial Gas Production
Variable Well CAPEX
As outlined in Table 8 the input variables for Well CAPEX were €5,846,374 (P10), €7,427,746 (P50) and €10,049,499 (P90) per well mainly based on research conducted by the (JRC, 2012). Figure 31 illustrates the DCF of the three scenarios subjected to variable CAPEX costs. Again in this case, all three scenarios return a positive DCF making the all three scenarios economically viable. Unlike the large range between the P10 and P90 NPV’s in the analysis conducted on variable gas prices and intial gas production, the gap in the range of profit between P10 and P90 in this scenario is much less at approximately €200 million, thus making the viability of the project less susceptible to variations in CAPEX costs.
35

© 2014 Peadar O’Sullivan [email protected]
Refer to Appendix I for a detailed breakdown of the variable CAPEX DCF models for both P10 and P90 scenarios that were used in formulate the DCF analysis illustrated in Figure 31.
Figure 31 - DCF Analysis of Variable CAPEX Per Well
Variable Well OPEX
The OPEX variables used in the DCF model were €1.54 / Mcf (P10), €2.00 / Mcf (P50) and €2.60 / Mcf (P90). Based on these variables, Figure 32 illustrates their impact on the project DCF. As can be seen the impact of fluctuating OPEX has minimal impact on the project viability. In all instances the projects remains profitable and the range between P10 and P90 NPV’s minimal at €83 million in comparisons to some of the other variables.
Figure 32 - DCF Analysis of Variable OPEX / Well
36

© 2014 Peadar O’Sullivan [email protected]
One-Way Sensitivity Analysis – Tornado Diagram
One the main purposes of conducting one-way sensitivity analysis on a potential investment is to determine the key variables that could have the greatest impact on your investment, i.e. which variables as an investor need the closest attention paid to them. A means of illustrating these key variables is through the construction of a Tornado Diagram. Figure 33 illustrates the Tornado Diagram relevant to this project and the four input variables. The tornado diagram illustrates the variables which can have the greatest impact on the success of your project from top to bottom. In this instance, the unconventional gas play is most susceptible to fluctuations in gas prices, followed by the initial gas production, well CAPEX and finally well OPEX. For example fluctuations in gas prices could result in the project profits ranging from a negative -€53.7 million to a positive €540.6 million. However in contrast variations in well OPEX have a minimal impact on project profit, therefore being of least concern to investors.
Figure 33 - One Way Sensitivity Analysis Tornado Diagram
5.2. IRR & Breakeven Analysis
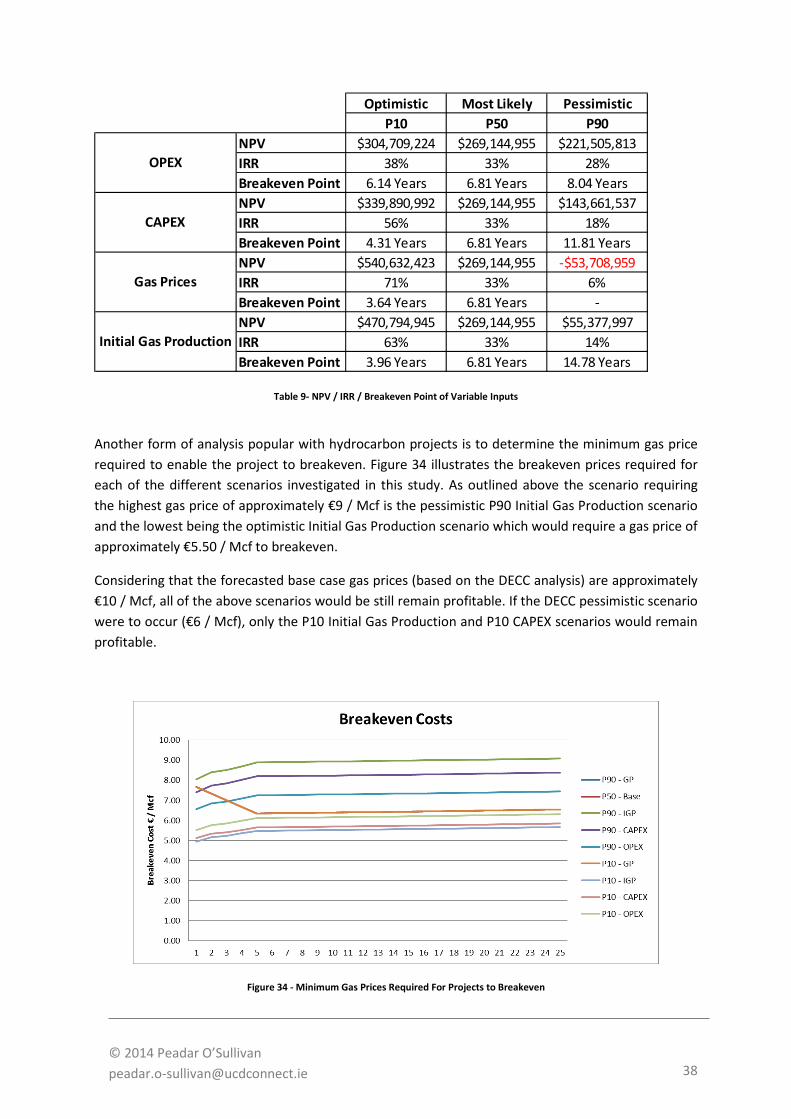
Table 9 below illustrates the IRR and breakeven point of each of the scenarios outlined previously as well as the NPV of each scenario. As illustrated in the table in only one scenario is a negative NPV returned, in the pessimistic P90 gas price scenario, in all other scenarios positive NPV’s are returned with the most profitable scenario being the optimistic P10 scenario which returned an NPV of approximately €540 million, an IRR of 71% and a breakeven period of 3.64 years.
37
© 2014 Peadar O’Sullivan [email protected]
Table 9- NPV / IRR / Breakeven Point of Variable Inputs
Another form of analysis popular with hydrocarbon projects is to determine the minimum gas price required to enable the project to breakeven. Figure 34 illustrates the breakeven prices required for each of the different scenarios investigated in this study. As outlined above the scenario requiring the highest gas price of approximately €9 / Mcf is the pessimistic P90 Initial Gas Production scenario and the lowest being the optimistic Initial Gas Production scenario which would require a gas price of approximately €5.50 / Mcf to breakeven.
Considering that the forecasted base case gas prices (based on the DECC analysis) are approximately €10 / Mcf, all of the above scenarios would be still remain profitable. If the DECC pessimistic scenario were to occur (€6 / Mcf), only the P10 Initial Gas Production and P10 CAPEX scenarios would remain profitable.
Figure 34 - Minimum Gas Prices Required For Projects to Breakeven
Optimistic Most Likely PessimisticP10 P50 P90
NPV $304,709,224 $269,144,955 $221,505,813IRR 38% 33% 28%Breakeven Point 6.14 Years 6.81 Years 8.04 YearsNPV $339,890,992 $269,144,955 $143,661,537IRR 56% 33% 18%Breakeven Point 4.31 Years 6.81 Years 11.81 YearsNPV $540,632,423 $269,144,955 -$53,708,959IRR 71% 33% 6%Breakeven Point 3.64 Years 6.81 Years -NPV $470,794,945 $269,144,955 $55,377,997IRR 63% 33% 14%Breakeven Point 3.96 Years 6.81 Years 14.78 Years
OPEX
CAPEX
Gas Prices
Initial Gas Production
38
© 2014 Peadar O’Sullivan [email protected]
5.3. Limitations of Analysis
Some key short comings of this analysis require acknowledgement. First and foremost, the lack of available data to input into the DCF model. Information regarding the extraction of unconventional gas is commercially sensitive and thus not freely available to the public. Secondly with the unconventional gas industry in its infancy in Europe the majority of the data in this study is still heavily reliant on data sources in the US, which may not give a true reflection of the production profile of unconventional gas wells in Europe due to their differing geology and depth.
Finally, the one way sensitivity analysis takes a simplified view of variability in project inputs by assuming only one variable changes at a time. In reality input variables may be interrelated and thus a change in one input variable would result in a change in another input variable having a more significant impact on the economic viability of an individual project scenario.
39

© 2014 Peadar O’Sullivan [email protected]
6. Discussion & Conclusions
This study has taken on the premise of a 100 well program over a 10 year period with an annual drilling program of 10 wells. A minor drilling program in comparisons to some in the US which can often undertake annual programs in excess of a thousand wells. A small scale program was utilised in this analysis as a means of reflecting the pace at which the industry is expected to progress over the coming years in Ireland and Europe as a result of the number of investment barriers that currently exist within the region.
Such as, an inadequate supply chain of drilling rigs and support services to undertake large scale drilling programs. Ireland and Europe currently lack the quantity of required equipment and expertise to undertake such large scale programs and control costs. For example one recent count of rigs and fracking crews in the US amounted to 1,900 and 500 respectively, while Europe had 77 active rigs and 10 frack crews (DECC, 2012). The formation of an adequate supply chain will take a number of years and significant investment from both producers and support service companies before large scale programs will be possible and competition among suppliers begins to decrease costs within the supply chain.
Another reason behind a small scale program is the pace in which petroleum licences are expected to be approved and issued throughout Europe. Slow and complex decision making processes have been identified as key barrier to investment in the industry in Europe (Weijermars, 2013), especially if the industry is lacking the necessary social and political support within the country in question. An unconventional gas industry requires a proper framework of standards that enables producers’ operational flexibility within those standards and minimum delay.
From an investor’s perspective into Ireland, this study has highlighted some key findings with regards to the economic viability of an unconventional gas play in the country:
• Of the nine different scenarios analysed through the adjustment of four variables (gas prices, initial gas production, CAPEX and OPEX costs): All but one scenario illustrated a viable project by returning a positive NPV, the only
unviable project was the pessimistic P90 Gas Price scenario which forecasted a negative NPV of €53 million when future gas prices were forecasted to be €6.97 / Mcf. Proving that such an investment could remain viable when subjected to a number of differing economic environments.
The scenario which illustrated the most profitable project was the optimistic P10 Gas Price scenario which returned a positive NPV of €540 million when the future gas price was forecasted at €11.69 / Mcf, an IRR of 71% and a breakeven point of just over three and a half years.
• The sensitivity analysis illustrated that future gas prices and initial well gas production will have the greatest bearing on the economic success of any play. The study has also highlighted that potential investors will also have least control over these variables during the lifetime of the project as outlined below.
40
© 2014 Peadar O’Sullivan [email protected]
• The conditions in which potential producers have the greatest control, OPEX and CAPEX
costs have the least bearing on the economic success of a play and thus are of the least importance when it comes to assessing the potential viability of an unconventional gas play in the country.
Future Gas Prices
As previously outlined in Section 5 the forecasting of future gas prices is a deeply complex and difficult task. The success of the shale gas industry in the US has been a doubled edged sword for producers, as the extraction of large volumes of shale gas has resulted in persistently low natural gas prices within the country due to supply outstripping demand. Some analysts believe that gas prices are now below the economic viability of many existing shale gas plays (Weijermars, 2013).
A Europe unconventional gas industry is not expected to replicate the same impact that shale gas has had on US wholesale gas prices as it doesn’t possess the same volume of shale gas, however the success of the industry will have some impact (DECC, 2012) on European prices but to what extent is difficult to determine. In a country like Ireland where the country is a taker of gas prices, there is very little price control or stability in which the government can guarantee any potential producer.
From the perspective of an investor looking to invest in an Irish unconventional gas play, the main concern is that UK NBP gas prices will be pushed lower by the supply of new cheaper sources of shale gas from continental Europe or the other global gas regions making the transportation of natural gas via pipeline to Ireland more economical than indigenous gas production. However the influx of foreign or alternative European gas isn’t going to occur over night, therefore the first movers into the Irish unconventional gas industry will have the greatest opportunity to make large profit margins, where late movers, relatively speaking, while benefiting from the knowledge of earlier movers will have to pay an entry premium as gas prices begin to fall as supply increases.
Similarly when you consider the production profile of any unconventional gas well, though its lifespan could be as long as 25 years plus, the majority of the revenue generated by the well occurs during the first two years, thus the price at which the gas is sold during these initial years makes up the largest part of the total revenue generated from the well over its lifetime. Hence those early movers who begin producing unconventional gas in Ireland the soonest will definitely benefit the most from high gas prices.
As indicated in the above analysis, if gas prices were to replicate those of the DECC’s pessimistic future gas price of approximately €6 / Mcf, only 2 of the scenarios outlined in this study would remain viable.
Well Initial Gas Production
Remaining cash-flow positive is one of the keys to any business / investment; the investment in an unconventional gas play is no different. Project costs need to be forecasted against future project
41
© 2014 Peadar O’Sullivan [email protected]
revenue to estimate the initial investment amount required to maintain a positive cash flow. In an unconventional gas play you’re dependent on the revenue generated from your initial wells to fund the drilling of future wells. Thus the amount of gas being produced from these initial wells is imperative to the ongoing success of the drilling program. As a means of ensuring this occurs; producers initially focus on the areas which are estimated to return the largest volume of gas, also known as the ‘sweet spots’ (Weijermars and Van der Linden, 2012). Experience in the US has proven that gas well production can actually be very variable. In areas where a basin’s geology isn’t properly understood, wells run the risk of producing low or no gas at all.
In untested basins such as those in Ireland, little historical data is available or known about the geology of the basins shale porosity or permeability, therefore a large degree of uncertainty exists when trying to identify these ‘sweet spots’. As a result, one most assume lower productivity from the preliminary wells drilled in a new basin and in parallel lower revenue. As knowledge about the basins geology is being gathered over time, drilling locations and techniques can be improved and equally the expected production from the wells.
The main impact on any potential producer in this scenario is the need to raise a much larger amount of initial capital to fund the investment, thus increasing investment risk and cost of capital.
From an Irish political / policy maker’s perspective, two economic areas of interest arise, one being the potential tax revenue generated by such an industry and secondly, energy security.
Tax Revenue
With regards to the potential return to the State of Ireland through taxation of the indigenous gas production, from the above analysis we can see in Figure 35 the state could at the height of production receive up to nearly €80 million annually from the production of the gas alone. Based on the nine scenarios analysed, over the projects lifetime the government could generate between €200 million to €1.1 billion in revenue from direct taxation without incorporating revenue generated from support services and wages. As it stands this is revenue that the government need to collect annually through other means to pay for imported natural gas.
42

© 2014 Peadar O’Sullivan [email protected]
Figure 35 - Potential State Tax Revenue
Energy Security
As previously outlined in Section 4.3, the country is heavily dependent on imported oil and gas. A dependence which isn’t expected to decrease in the coming years as a result of the country’s push to create 40% energy output from renewables by 2020. This is being achieved mainly through wind generation, a technique that requires a large flexible backup power generation capacity to deal with the variability that comes with wind generated power, something natural gas power plants are very efficient at doing (DCENR, 2014).
As 95% of its natural gas is currently imported from the UK, Ireland has been advised by the International Energy Agency (IEA) to increase its level of energy security by sourcing alternative gas supply sources. With 95% of its current supply coming through two interconnected pipelines from the UK (IEA, 2012a) and minimal gas storage facilities on the island, the country could suffer from a gas shortage overnight if anything were to occur to these pipelines.
A number of alternative sources have been identified / recommended over the years, one of these being the development of the Corrib gas field, which is due to come online next year. Another as previously discussed in Section 4.3 was the proposed Shannon LNG project, which was going to be developed with the intentions of selling natural gas to the network via LNG imports. However this project has recently been abandoned due to network tariff depute with the government which according to its developers made the project unviable.
Therefore from an overall economic perspective, there is potential for an unconventional gas industry in Ireland that warrants the current interest from investors. Though like any new industry, those who invest early will reap the greatest rewards due to higher gas prices while also carrying the largest amount of risk due to unfamiliar basin geology and unpredictable well production. As a means of encouraging governmental support, an unconventional gas industry would increase the country’s level of energy security while also generating substantial tax revenue which would otherwise be spent on importing natural gas.
43

© 2014 Peadar O’Sullivan [email protected]
7. References
ASPS, J. 1945. Analysis of decline curves. Transactions of the American Institute of Mining, Metallurgical and Petroleum Engineers, 160, 228-247.
BASSI, S., RYDGE, J., KHOR, C. S., SAM FRANKHAUSER, HIRST, N. & WARD, B. 2013. A UK 'dash' for Smart Gas.
BUSTEED, S. 2014. Land Price Report: Price Steady But Vulnerable As National Average Slips [Online]. The Farmers Journal. Available: http://www.farmersjournal.ie/land-price-report-price-steady-but-vulnerable-as-national-average-slips-155512/ [Accessed 1st August 2014.
DEPARTMENT OF COMMUNICATIONS ENERGY AND NATURAL RESOURCES 1960. PETROLEUM AND OTHER MINERALS DEVELOPMENT ACT. In: RESOURCES, D. O. C. E. A. N. (ed.). Dublin: Irish Government.
DEPARTMENT OF COMMUNICATIONS ENERGY AND NATURAL RESOURCES 2014. Green Paper on Energy Policy in Ireland. In: DEPARTMENT OF COMMUNICATIONS, E. A. N. R. (ed.). Dublin: Department of Communications, Energy and Natural Resources.
DEPARTMENT OF ENERGY & CLIMATE CHANGE 2012. Unconventional Gas. Thve Potential Impact on UK Gas Prices. London.
DEPARTMENT OF ENERGY & CLIMATE CHANGE 2013. DECC Fossil Fuel Price Projections. London. ENEGI OIL PLC 2012. Clare Basin Update. Enegi Oil Plc. ENVIRONMENTAL PROTECTION AGENCY 2012. Proposed Terms of Reference for EPA/DCENR/NIEA
Research Programme on Environmental Impacts of Unconventional Gas Exploration & Extraction (UGEE).
EUROPEAN COMMISSION DG CLIMA 2012. Climate Impact of Potential Shale Gas Production in the EU.
GÉNY, F. 2010. Can unconventional gas be a game changer in European gas markets?, Oxford Institute for Energy Studies.
INTERNATIONAL ENERGY AGENCY 2012a. Energy Policies of IEA Countries Ireland 2012 Review. France: International Energy Agency,.
INTERNATIONAL ENERGY AGENCY 2012b. Golden Rules for a Golden Age of Gas. World Energy Outlook Special Report on Unconventional Gas. Paris, France: International Energy Agency.
IRISH ACADEMY OF ENGINEERING 2013. The Future of Oil and Gas in Ireland. Irish Academy of Engineering.
JOINT RESEARCH CENTRE 2012. Unconventional Gas: Potential Energy Market Impacts in the European Union. In: INSTITUTE FOR ENERGY AND TRANSPORT (ed.). Luxembourg: Office of the European Union.
KAISER, M. J. 2012. Profitability Assessment of Haynesville Shale Gas Wells. Energy, 38, 315-330. KEELEY, D. M. 2014. RE: Lough Allen Natural Gas Company Ltd - Northwest Carboniferous Basin. Type
to O'SULLIVAN, P. KUHN, M. & UMBACH, F. 2011. Strategic perspectives of unconventional gas: a game changer with
implications for the EU's energy security, European Centre for Energy and Resource Security. LEE, W. J. & SIDLE, R. 2010. Gas-Reserves Estimation in Resource Plays. SPE Economics &
Management, 2, 86-91. MCCARTHY, C. 2011. Interconector Tariffs and Competition in the Irish Gas Market. University
College Dublin: School of Economics. MOORMAN, R. & ROLLINS, L. 2012. Northwest Carboniferous Basin Natural Gas Project [Online].
Available: https://www.engineersireland.ie/EngineersIreland/media/SiteMedia/groups/Divisions/energy-environment/Unconventional-Gas-in-Ireland.pdf?ext=.pdf [Accessed 1st of June 2014.
NATIONAL GRID 2012. UK Future Energy Scenarios. London: National Grid.
44
© 2014 Peadar O’Sullivan [email protected]
NATURAL GAS EUROPE. 2012. Natural Gas Find for Tamboran in Ireland (Update) [Online]. Natural Gas Europe. Available: http://www.naturalgaseurope.com/tamboran-roi-and-ni-gas-find-could-create-1200-jobs-and-ensure-supply-security-4700 [Accessed 30th May 2014.
RABBITTE, P. 2013. Decisions on Fracking Will Be Based on Scientific Evidence. Dublin: Department of Communications, Energy and Natural Resources.
RABBITTE, P. 2014. Rabbitte Announces New Tax Regime For Offshore Petroleum. Dublin: Department of Communications, Energy and Natural Resources.
RYAN, C. 2014. Dismay as Company Pulls Plug on Shannon LNG Project [Online]. Cork, Ireland: The Examiner. Available: http://www.irishexaminer.com/ireland/dismay-as-company-pulls-plug-on-shannon-lng-project-276103.html [Accessed 21st of May 2014.
SUSTAINABLE ENERGY AUTHORITY OF IRELAND 2011. Energy Forecasts for Ireland to 2020. SUSTAINABLE ENERGY AUTHORITY OF IRELAND 2013. Energy in Ireland - Key Statistics 2013. Dublin. THE COMMISSION OF ENERGY REGULATION 2012. The Regulatory Treatment of the BGE
Interconnectors and Future Gas Transmission Tariff Regime. Dublin: Commission for Energy Regulation.
VALKO, P. P. Assigning value to Stimulation in the Barnett Shale: a Simultaneous Analysis of 7000 Plus Production Hystories and Well Completion Records. SPE Hydraulic Fracturing Technology Conference, 2009. Society of Petroleum Engineers.
WEIJERMARS, R. 2013. Economic appraisal of shale gas plays in Continental Europe. Applied Energy, 106, 100-115.
WEIJERMARS, R. & VAN DER LINDEN, J. 2012. Assessing the economic margins of sweet spots in shale gas plays. First Break, 30.
WOOD MACKENZIE 2014. Review of Irelands Oil & Gas Fiscal System.
45
© 2014 Peadar O’Sullivan [email protected]
8. Bibliography
ASPS, J. 1945. Analysis of decline curves. Transactions of the American Institute of Mining, Metallurgical and Petroleum Engineers, 160, 228-247.
BASSI, S., RYDGE, J., KHOR, C. S., SAM FRANKHAUSER, HIRST, N. & WARD, B. 2013. A UK 'dash' for Smart Gas.
BOOZ & COMPANY 2010. Unconventional Gas Projects Big Gains from Lean Supply Chains. BUSTEED, S. 2014. Land Price Report: Price Steady But Vulnerable As National Average Slips [Online].
The Farmers Journal. Available: http://www.farmersjournal.ie/land-price-report-price-steady-but-vulnerable-as-national-average-slips-155512/ [Accessed 1st August 2014.
DEPARTMENT OF COMMUNICATIONS ENERGY AND NATURAL RESOURCES 1960. PETROLEUM AND OTHER MINERALS DEVELOPMENT ACT. In: RESOURCES, D. O. C. E. A. N. (ed.). Dublin: Irish Government.
DEPARTMENT OF COMMUNICATIONS ENERGY AND NATURAL RESOURCES 2014. Green Paper on Energy Policy in Ireland. In: DEPARTMENT OF COMMUNICATIONS, E. A. N. R. (ed.). Dublin: Department of Communications, Energy and Natural Resources.
DEPARTMENT OF ENERGY & CLIMATE CHANGE 2012. Unconventional Gas. Thve Potential Impact on UK Gas Prices. London.
DEPARTMENT OF ENERGY & CLIMATE CHANGE 2013. DECC Fossil Fuel Price Projections. London: Department of Energy & Climate Change.
DREYER, I. & STANG, G. 2013. The shale gas revolution: challenges and implications for the EU'. EUISS, Paris.
DUMAN, R. J. 2012. Economic viability of shale gas production in the Marcellus shale; indicated by production rates, costs and current natural gas prices. Michigan Technological University.
ENVIRONMENTAL PROTECTION AGENCY 2012. Proposed Terms of Reference for EPA/DCENR/NIEA Research Programme on Environmental Impacts of Unconventional Gas Exploration & Extraction (UGEE).
EUROPEAN COMMISSION 2014. Energy Economic Developments in Europe. In: AFFARIS, E. A. F. (ed.). Brussels: European Commission.
EUROPEAN COMMISSION DG CLIMA 2012. Climate Impact of Potential Shale Gas Production in the EU.
EUROPEAN UNION 2011. Energy Markets in the European Union in 2011. In: UNION, O. O. T. E. (ed.). Luxembourg: Office of the European Union.
GASMI, F. & OVIEDO, J. D. 2010. Investment in transport infrastructure, regulation, and gas–gas competition. Energy Economics, 32, 726-736.
GUARNONE, M., ROSSI, F., NEGRI, E., GRASSI, C., GENAZZI, D. & ZENNARO, R. 2012. An unconventional mindset for shale gas surface facilities. Journal of Natural Gas Science and Engineering, 6, 14-23.
HAMMOND, C. D. 2013. Economic analysis of shale gas wells in the United States. Massachusetts Institute of Technology.
HEALY, D. D. 2012. Hydraulic Fracturing or ‘Fracking’: A Short Summary of Current Knowledge and Potential Environmental Impacts. Aberdeen: University of Aberdeen.
INSTITUTE OF DIRECTORS 2012. Britains Shale Gas Potential. INTERNATIONAL ENERGY AGENCY 2012a. Energy Policies of IEA Countries Ireland 2012 Review.
France: International Energy Agency,. INTERNATIONAL ENERGY AGENCY 2012b. Golden Rules for a Golden Age of Gas. Paris Cedex:
International Energy Agency. IRISH ACADEMY OF ENGINEERING 2013. The Future of Oil and Gas in Ireland. Irish Academy of
Engineering.
46

© 2014 Peadar O’Sullivan [email protected]
JOINT RESEARCH CENTRE 2012. Unconventional Gas: Potential Energy Market Impacts in the European Union. In: INSTITUTE FOR ENERGY AND TRANSPORT (ed.). Luxembourg: Office of the European Union.
KAISER, M. J. 2012a. Haynesville shale play economic analysis. Journal of Petroleum Science and Engineering, 82, 75-89.
KAISER, M. J. 2012b. Profitability Assessment of Haynesville Shale Gas Wells. Energy, 38, 315-330. KEELEY, D. M. 2014. RE: Lough Allen Natural Gas Company Ltd - Northwest Carboniferous Basin. Type
to O'SULLIVAN, P. KHATER, M. 2013. Assessing the Economic Feasibility of Shale Gas. A North American Perspective. An
Economic Insight into Production Decline Curve Analysis. University Laval Quebec. KUHN, M. & UMBACH, F. 2011. Strategic perspectives of unconventional gas: a game changer with
implications for the EU's energy security, European Centre for Energy and Resource Security. LEE, W. J. & SIDLE, R. 2010. Gas-Reserves Estimation in Resource Plays. SPE Economics &
Management, 2, 86-91. MATTAR, L. Production analysis and forecasting of shale gas reservoirs: case history-based approach.
SPE Shale Gas Production Conference, 2008. Society of Petroleum Engineers. MCCARTHY, C. 2011. Interconector Tariffs and Competition in the Irish Gas Market. University
College Dublin: School of Economics. MOORMAN, R. & ROLLINS, L. 2012. Northwest Carboniferous Basin Natural Gas Project [Online].
Available: https://www.engineersireland.ie/EngineersIreland/media/SiteMedia/groups/Divisions/energy-environment/Unconventional-Gas-in-Ireland.pdf?ext=.pdf [Accessed 1st of June 2014.
NATIONAL GRID 2012. UK Future Energy Scenarios. London: National Grid. NATURAL GAS EUROPE. 2012. Natural Gas Find for Tamboran in Ireland (Update) [Online]. Natural
Gas Europe. Available: http://www.naturalgaseurope.com/tamboran-roi-and-ni-gas-find-could-create-1200-jobs-and-ensure-supply-security-4700 [Accessed 30th May 2014.
NORTON ROSE FULBRIGHT 2013. Shale Gas Handbook, Norton Rose Fulbright. POYRY MANAGEMENT CONSULTING UK LTD. 2011. The Impact of Unconventional Gas on Europe. PRICEWATERHOUSECOOPER 2013. Maximising Your Returns. Tax Issues For the Exploration and
Production of Irish Oil and Gas. Dublin. RABBITTE, P. 2013. Decisions on Fracking Will Be Based on Scientific Evidence. Dublin: Department of
Communications, Energy and Natural Resources. RABBITTE, P. 2014. Rabbitte Announces New Tax Regime For Offshore Petroleum. Dublin:
Department of Communications, Energy and Natural Resources. REGENERIS CONSULTING 2011. Economic Impact of Shale Gas Exploration & Production in Lancashire
and the UK. Cheshire. ROGNER, H.-H. 1997. An assessment of world hydrocarbon resources. Annual review of energy and
the environment, 22, 217-262. RYAN, C. 2014. Dismay as Company Pulls Plug on Shannon LNG Project [Online]. Cork, Ireland: The
Examiner. Available: http://www.irishexaminer.com/ireland/dismay-as-company-pulls-plug-on-shannon-lng-project-276103.html [Accessed 21st of May 2014.
SIEMEK, J., NAGY, S. & SIEMEK, P. 2013. Challenges for Sustainable Development: The Case of Shale Gas Exploitation in Poland. Problemy Ekorozwoju–Problems of Sustainable Development, 8, 91-104.
SUSTAINABLE ENERGY AUTHORITY OF IRELAND 2011. Energy Forecasts for Ireland to 2020. SUSTAINABLE ENERGY AUTHORITY OF IRELAND 2013a. Electricity & Gas Prices in Ireland. SUSTAINABLE ENERGY AUTHORITY OF IRELAND 2013b. Energy in Ireland - Key Statistics 2013. Dublin. TAMBORAN RESOURCES 2012. 7bn gas investment could create 600 full time jobs and deliver
security of energy supply in Ireland for up to 40 years. Tamboran Resources.
47

© 2014 Peadar O’Sullivan [email protected]
THE COMMISSION OF ENERGY REGULATION 2012. The Regulatory Treatment of the BGE Interconnectors and Future Gas Transmission Tariff Regime. Dublin: Commission for Energy Regulation.
US ENERGY INFORMATION ADMINISTRATION 2011. World Shale Gas Resources: An Initial Assessment of 14 Regions Outside the United States. Washington: US Department of Energy.
US ENERGY INFORMATION ADMINISTRATION 2013. International Energy Outlook 2013. Washington: US Depatment of Energy.
US ENERGY INFORMATION ADMINISTRATION 2014. Annual Energy Outlook 2014 with Projections to 2040. Washington: US Department of Energy.
VALKO, P. P. Assigning value to Stimulation in the Barnett Shale: a Simultaneous Analysis of 7000 Plus Production Hystories and Well Completion Records. SPE Hydraulic Fracturing Technology Conference, 2009. Society of Petroleum Engineers.
WEIJERMARS, R. 2013. Economic appraisal of shale gas plays in Continental Europe. Applied Energy, 106, 100-115.
WEIJERMARS, R. & VAN DER LINDEN, J. 2012. Assessing the economic margins of sweet spots in shale gas plays. First Break, 30.
WOOD MACKENZIE 2014. Review of Irelands Oil & Gas Fiscal System. WORLD ECONOMIC FORUM 2011. Energy Vison Update 2011. A New Era For Gas. Switzerland: World
Economic Forum.
48


© 2014 Peadar O’Sullivan [email protected]
Maps of Irelands Potential Shale Gas Locations Appendix A.
50

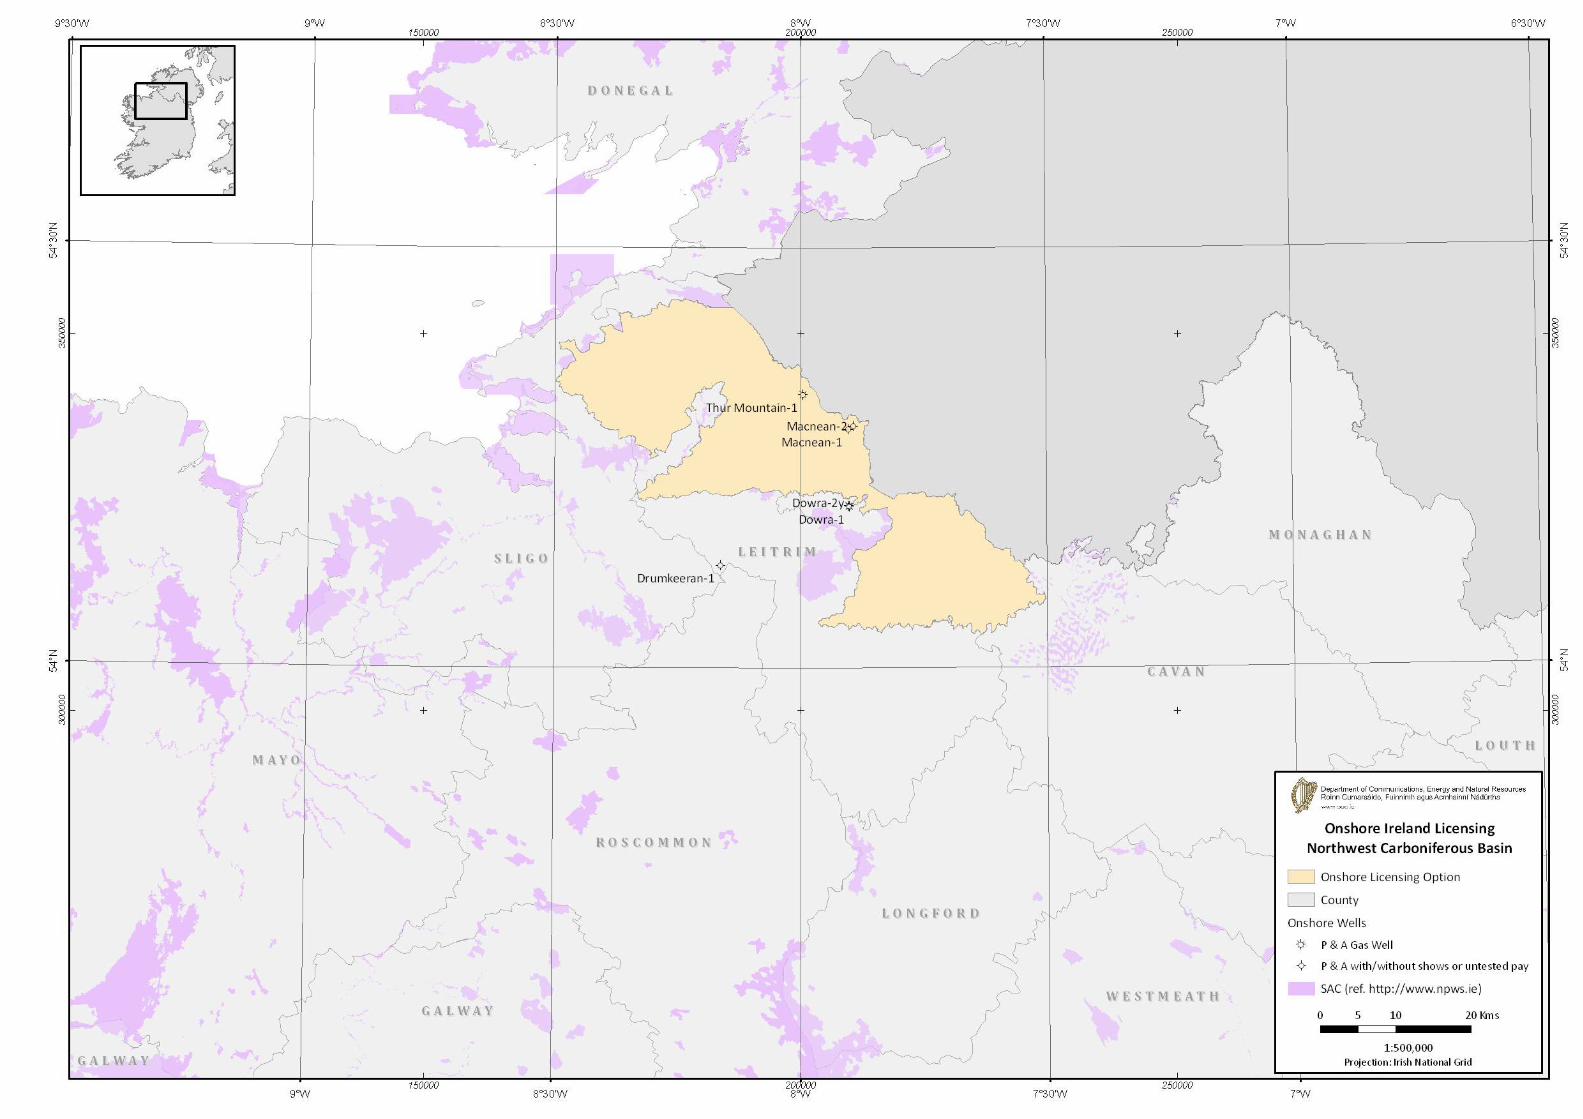
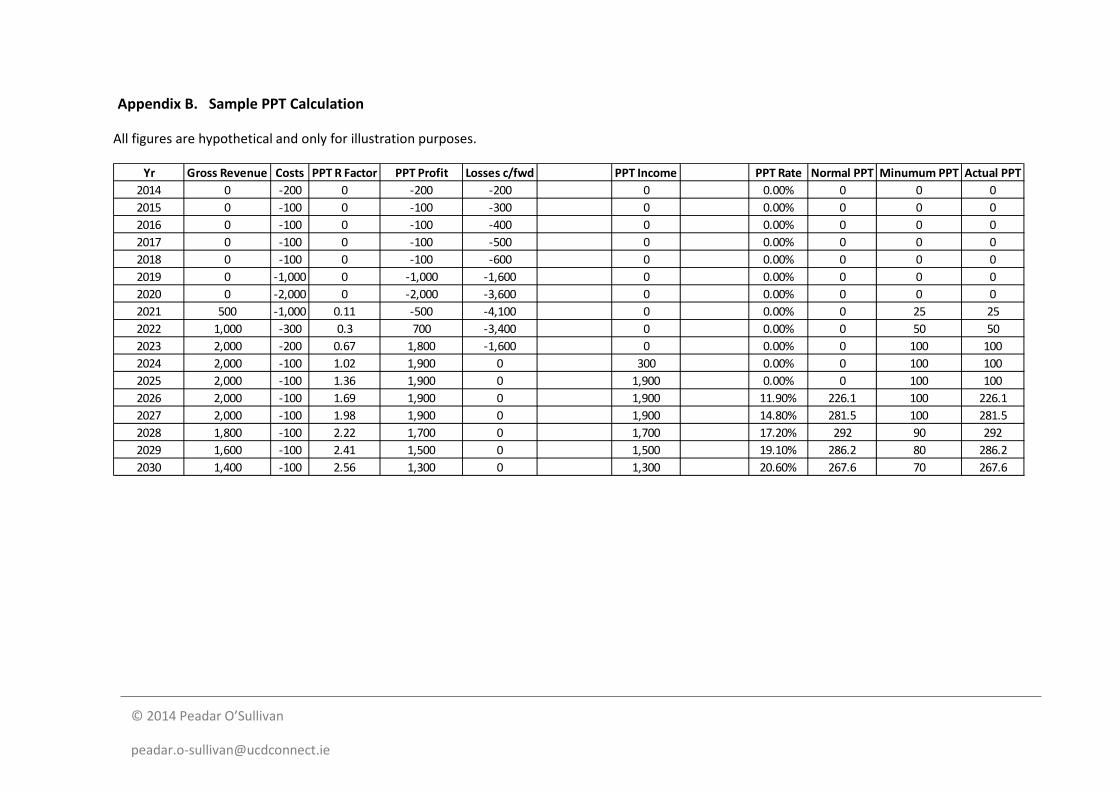
© 2014 Peadar O’Sullivan
Sample PPT Calculation Appendix B.
All figures are hypothetical and only for illustration purposes.
Yr Gross Revenue Costs PPT R Factor PPT Profit Losses c/fwd PPT Income PPT Rate Normal PPT Minumum PPT Actual PPT2014 0 -200 0 -200 -200 0 0.00% 0 0 02015 0 -100 0 -100 -300 0 0.00% 0 0 02016 0 -100 0 -100 -400 0 0.00% 0 0 02017 0 -100 0 -100 -500 0 0.00% 0 0 02018 0 -100 0 -100 -600 0 0.00% 0 0 02019 0 -1,000 0 -1,000 -1,600 0 0.00% 0 0 02020 0 -2,000 0 -2,000 -3,600 0 0.00% 0 0 02021 500 -1,000 0.11 -500 -4,100 0 0.00% 0 25 252022 1,000 -300 0.3 700 -3,400 0 0.00% 0 50 502023 2,000 -200 0.67 1,800 -1,600 0 0.00% 0 100 1002024 2,000 -100 1.02 1,900 0 300 0.00% 0 100 1002025 2,000 -100 1.36 1,900 0 1,900 0.00% 0 100 1002026 2,000 -100 1.69 1,900 0 1,900 11.90% 226.1 100 226.12027 2,000 -100 1.98 1,900 0 1,900 14.80% 281.5 100 281.52028 1,800 -100 2.22 1,700 0 1,700 17.20% 292 90 2922029 1,600 -100 2.41 1,500 0 1,500 19.10% 286.2 80 286.22030 1,400 -100 2.56 1,300 0 1,300 20.60% 267.6 70 267.6
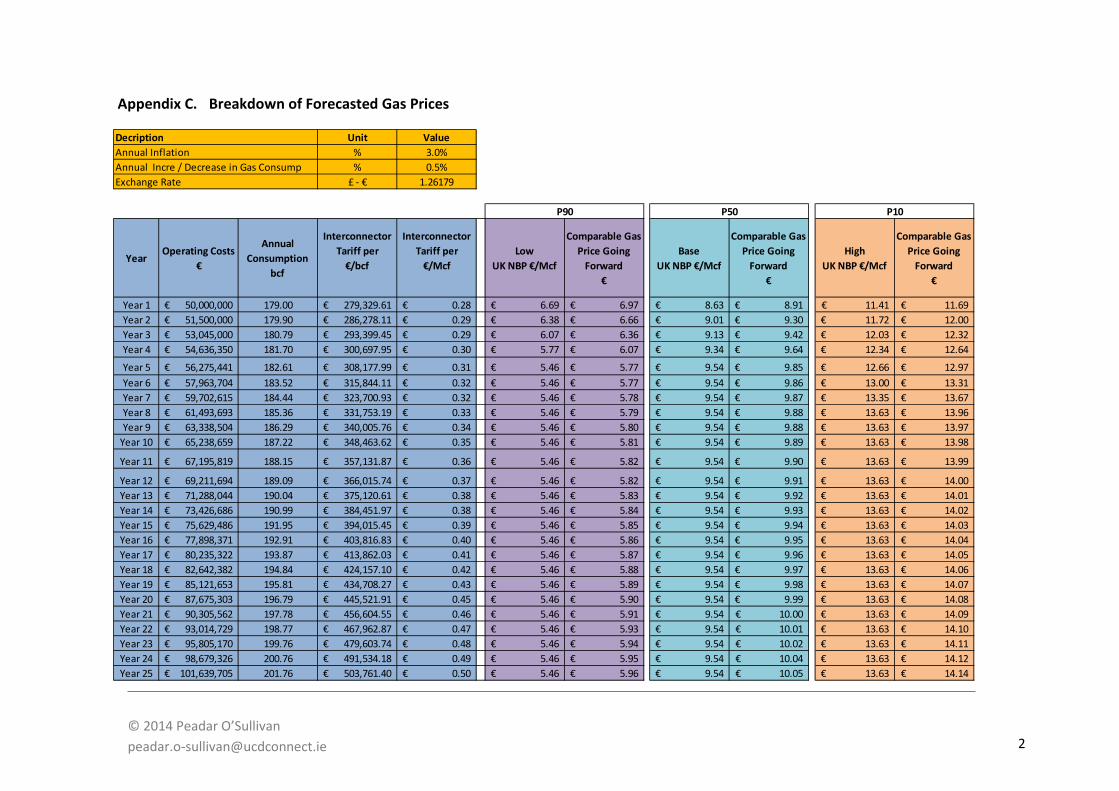
© 2014 Peadar O’Sullivan [email protected]
Breakdown of Forecasted Gas Prices Appendix C.
Unit Value% 3.0%% 0.5%
£ - € 1.26179
YearOperating Costs
€
Annual Consumption
bcf
InterconnectorTariff per
€/bcf
InterconnectorTariff per
€/McfLow
UK NBP €/Mcf
Comparable Gas Price Going
Forward€
BaseUK NBP €/Mcf
Comparable Gas Price Going
Forward€
HighUK NBP €/Mcf
Comparable Gas Price Going
Forward€
Year 1 50,000,000€ 179.00 279,329.61€ 0.28€ 6.69€ 6.97€ 8.63€ 8.91€ 11.41€ 11.69€ Year 2 51,500,000€ 179.90 286,278.11€ 0.29€ 6.38€ 6.66€ 9.01€ 9.30€ 11.72€ 12.00€ Year 3 53,045,000€ 180.79 293,399.45€ 0.29€ 6.07€ 6.36€ 9.13€ 9.42€ 12.03€ 12.32€ Year 4 54,636,350€ 181.70 300,697.95€ 0.30€ 5.77€ 6.07€ 9.34€ 9.64€ 12.34€ 12.64€
Year 5 56,275,441€ 182.61 308,177.99€ 0.31€ 5.46€ 5.77€ 9.54€ 9.85€ 12.66€ 12.97€ Year 6 57,963,704€ 183.52 315,844.11€ 0.32€ 5.46€ 5.77€ 9.54€ 9.86€ 13.00€ 13.31€ Year 7 59,702,615€ 184.44 323,700.93€ 0.32€ 5.46€ 5.78€ 9.54€ 9.87€ 13.35€ 13.67€ Year 8 61,493,693€ 185.36 331,753.19€ 0.33€ 5.46€ 5.79€ 9.54€ 9.88€ 13.63€ 13.96€ Year 9 63,338,504€ 186.29 340,005.76€ 0.34€ 5.46€ 5.80€ 9.54€ 9.88€ 13.63€ 13.97€
Year 10 65,238,659€ 187.22 348,463.62€ 0.35€ 5.46€ 5.81€ 9.54€ 9.89€ 13.63€ 13.98€
Year 11 67,195,819€ 188.15 357,131.87€ 0.36€ 5.46€ 5.82€ 9.54€ 9.90€ 13.63€ 13.99€
Year 12 69,211,694€ 189.09 366,015.74€ 0.37€ 5.46€ 5.82€ 9.54€ 9.91€ 13.63€ 14.00€ Year 13 71,288,044€ 190.04 375,120.61€ 0.38€ 5.46€ 5.83€ 9.54€ 9.92€ 13.63€ 14.01€ Year 14 73,426,686€ 190.99 384,451.97€ 0.38€ 5.46€ 5.84€ 9.54€ 9.93€ 13.63€ 14.02€ Year 15 75,629,486€ 191.95 394,015.45€ 0.39€ 5.46€ 5.85€ 9.54€ 9.94€ 13.63€ 14.03€ Year 16 77,898,371€ 192.91 403,816.83€ 0.40€ 5.46€ 5.86€ 9.54€ 9.95€ 13.63€ 14.04€ Year 17 80,235,322€ 193.87 413,862.03€ 0.41€ 5.46€ 5.87€ 9.54€ 9.96€ 13.63€ 14.05€ Year 18 82,642,382€ 194.84 424,157.10€ 0.42€ 5.46€ 5.88€ 9.54€ 9.97€ 13.63€ 14.06€ Year 19 85,121,653€ 195.81 434,708.27€ 0.43€ 5.46€ 5.89€ 9.54€ 9.98€ 13.63€ 14.07€ Year 20 87,675,303€ 196.79 445,521.91€ 0.45€ 5.46€ 5.90€ 9.54€ 9.99€ 13.63€ 14.08€ Year 21 90,305,562€ 197.78 456,604.55€ 0.46€ 5.46€ 5.91€ 9.54€ 10.00€ 13.63€ 14.09€ Year 22 93,014,729€ 198.77 467,962.87€ 0.47€ 5.46€ 5.93€ 9.54€ 10.01€ 13.63€ 14.10€ Year 23 95,805,170€ 199.76 479,603.74€ 0.48€ 5.46€ 5.94€ 9.54€ 10.02€ 13.63€ 14.11€ Year 24 98,679,326€ 200.76 491,534.18€ 0.49€ 5.46€ 5.95€ 9.54€ 10.04€ 13.63€ 14.12€ Year 25 101,639,705€ 201.76 503,761.40€ 0.50€ 5.46€ 5.96€ 9.54€ 10.05€ 13.63€ 14.14€
P50 P10
DecriptionAnnual InflationAnnual Incre / Decrease in Gas ConsumpExchange Rate
P90
2

© 2014 Peadar O’Sullivan peadar.o-sullivan@ucdconnect,ie
Breakdown of Forecasted Drilling & Completion Costs (CAPEX) Appendix D.
Description Unit P90 P50 P10 Comments
Average well length m 2500 2500 2500 Dependent on local geology
Mud volume per well m3 321 321 321 Assumed wellbore is 12.25 inches over entire wellbore length
Construction Cost Per Pad € 5,200,000€ 4,680,000€ 3,640,000€ Estimated cost per pad considering a concrete rig site, surface water management system,
Number of wells per pad wells 20 20 20 Dependent on local geology
Cost per well € / well 260,000€ 234,000€ 182,000€
Casing, cementing and wellhead costs € / m 312€ 286€ 260€ The cost of well installations in terms of casing, cement and wellhead
Mud Re-Use Factor - 5 5 5 Mud may be re-used for multiple wells, so cost is distributed over multiple wells
Mud material costs € / m3 2,080€ 1,040€ 416€ Higher mud cost will typically lead to higher performance due to a reduction in wellbore related problems
Waste & Water Management costs € / m3 1,373€ 686€ 275€
Total Depth Based Cost € / m 542€ 401€ 306€
Drilling PerformanceDrilling Performance m / day 80 110 130 Drilling performance is derived from
past European experience.
Number of drilling days days 32 23 20
Drilling Operations Day Rate Based Costs
Drill RigDirectional DrillingMud ServicingDrill BitWell Evaluation Equipment
€ / day 81,120€ 51,480€ 36,192€
Total Drilling Costs Per Well € 4,209,747€ 2,419,993€ 1,670,621€
Number of Fractures stages 14 14 14
Fixed Fracturing Costs € 728,000€ 624,000€ 520,000€ Costs related to infrastructre set-up, mobilisation etc.
Cost per Fracture Stage € / stage 364,000€ 312,000€ 260,000€ Materials and services required per fracture stageTotal Completion Cost Per Well € 5,824,000€ 4,992,000€ 4,160,000€
Total Drilling & Completion Costs Per Well
€ 10,033,747€ 7,411,993€ 5,830,621€
Typical Well Configuration
Depth Based Cost Scenario
Fracturing Costs
Typical Rig Site Configuration

© 2014 Peadar O’Sullivan [email protected]
Breakdown of Land Access Calculation Appendix E.
Description Unit Rate Quantity CostAverage Cost of Agricultural Land in Ireland € / acre 15,000€ 1 Acre = 2.471 Hectares € / Hectares 37,065€
Well Pad Site € / Hectares 37,065€ 2.5 92,663€ Access Corridor (3km x 20m) € / Hectares 37,065€ 6 222,390€ Total Well Pad Cost € 315,053€ Cost Per Well (based on 20 wells per pad) € 15,753€
Cumpulsory Purchase Order of Agricultural Land

© 2014 Peadar O’Sullivan peadar.o-sullivan@ucdconnect,ie
DCF Model – P50 Base Case Scenario Appendix F.
P50Units Value
bcf/year 0.4396% 5%- 1.5
€/Well 7,427,746$ €/Mcf 2.00$
% 25%
% 10%
No. of YearsSingle Well Production bcf / year
Single Well Cumulative
bcf / year
Year 1Wells x 10
bcf
Year 2Wells x 10
bcf
Year 3Wells x 10
bcf
Year 4Wells x 10
bcf
Year 5Wells x 10
bcf
Year 6Wells x 10
bcf
Year 7Wells x 10
bcf
Year 8Wells x 10
bcf
Year 9Wells x 10
bcf
Year 10Wells x 10
bcf
Field Production
Totalbcf
Cumulative Production
bcf
0 0.0000 0.000 0.000 0.00 0.001 0.4396 0.440 4.396 0.000 4.40 4.402 0.3157 0.755 3.157 4.396 0.000 7.55 11.953 0.2542 1.010 2.542 3.157 4.396 0.000 10.10 22.044 0.2161 1.226 2.161 2.542 3.157 4.396 0.000 12.26 34.305 0.1896 1.415 1.896 2.161 2.542 3.157 4.396 0.000 14.15 48.456 0.1701 1.585 1.701 1.896 2.161 2.542 3.157 4.396 0.000 15.85 64.317 0.1549 1.740 1.549 1.701 1.896 2.161 2.542 3.157 4.396 0.000 17.40 81.718 0.1427 1.883 1.427 1.549 1.701 1.896 2.161 2.542 3.157 4.396 0.000 18.83 100.549 0.1326 2.015 1.326 1.427 1.549 1.701 1.896 2.161 2.542 3.157 4.396 0.000 20.15 120.69
10 0.1242 2.140 1.242 1.326 1.427 1.549 1.701 1.896 2.161 2.542 3.157 4.396 21.40 142.0911 0.1170 2.257 1.170 1.242 1.326 1.427 1.549 1.701 1.896 2.161 2.542 3.157 18.17 160.2612 0.1107 2.367 1.107 1.170 1.242 1.326 1.427 1.549 1.701 1.896 2.161 2.542 16.12 176.3813 0.1052 2.473 1.052 1.107 1.170 1.242 1.326 1.427 1.549 1.701 1.896 2.161 14.63 191.0114 0.1004 2.573 1.004 1.052 1.107 1.170 1.242 1.326 1.427 1.549 1.701 1.896 13.47 204.4815 0.0961 2.669 0.961 1.004 1.052 1.107 1.170 1.242 1.326 1.427 1.549 1.701 12.54 217.0216 0.0922 2.761 0.922 0.961 1.004 1.052 1.107 1.170 1.242 1.326 1.427 1.549 11.76 228.7717 0.0886 2.850 0.886 0.922 0.961 1.004 1.052 1.107 1.170 1.242 1.326 1.427 11.10 239.8718 0.0855 2.935 0.855 0.886 0.922 0.961 1.004 1.052 1.107 1.170 1.242 1.326 10.52 250.3919 0.0825 3.018 0.825 0.855 0.886 0.922 0.961 1.004 1.052 1.107 1.170 1.242 10.02 260.4220 0.0798 3.098 0.798 0.825 0.855 0.886 0.922 0.961 1.004 1.052 1.107 1.170 9.58 270.0021 0.0774 3.175 0.774 0.798 0.825 0.855 0.886 0.922 0.961 1.004 1.052 1.107 9.18 279.1822 0.0751 3.250 0.751 0.774 0.798 0.825 0.855 0.886 0.922 0.961 1.004 1.052 8.83 288.0123 0.0729 3.323 0.729 0.751 0.774 0.798 0.825 0.855 0.886 0.922 0.961 1.004 8.50 296.5124 0.0709 3.394 0.709 0.729 0.751 0.774 0.798 0.825 0.855 0.886 0.922 0.961 8.21 304.7225 0.0691 3.463 0.691 0.709 0.729 0.751 0.774 0.798 0.825 0.855 0.886 0.922 7.94 312.66
b Constant
Discount Rate
Well CAPEXOPEXCorporate Tax
Annual Productivity Decline
AssumptionsWell Flowrate Year 1
25 Y
EAR
PRO
DUCT
ION
PRO
GRAM
PRODUCTION OF 100 WELL DRILLING PROGRAM OVER 10 YEARS @ 10 WELLED DRILLED PER YEAR
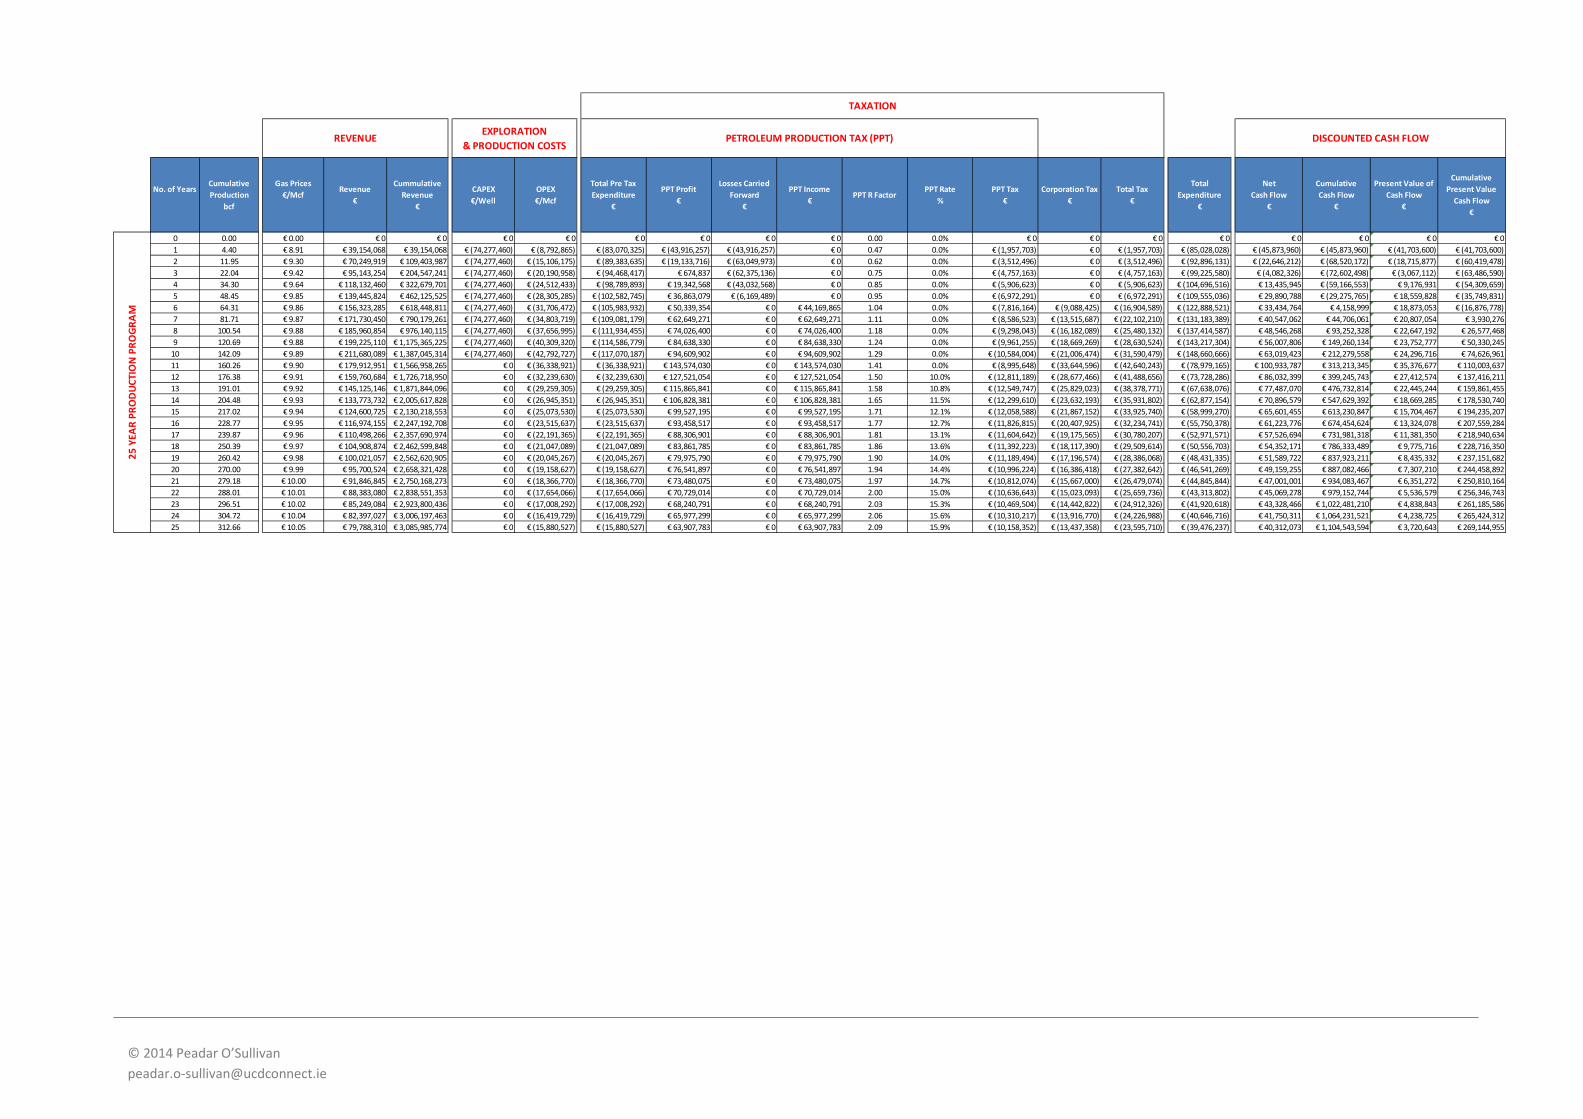
© 2014 Peadar O’Sullivan [email protected]
No. of YearsCumulative Production
bcf
Gas Prices€/Mcf
Revenue€
Cummulative Revenue
€
CAPEX€/Well
OPEX€/Mcf
Total Pre Tax Expenditure
€
PPT Profit€
Losses Carried Forward
€
PPT Income€
PPT R FactorPPT Rate
%PPT Tax
€Corporation Tax
€Total Tax
€
Total Expenditure
€
Net Cash Flow
€
Cumulative Cash Flow
€
Present Value of Cash Flow
€
CumulativePresent Value
Cash Flow€
0 0.00 € 0.00 € 0 € 0 € 0 € 0 € 0 € 0 € 0 € 0 0.00 0.0% € 0 € 0 € 0 € 0 € 0 € 0 € 0 € 01 4.40 € 8.91 € 39,154,068 € 39,154,068 € (74,277,460) € (8,792,865) € (83,070,325) € (43,916,257) € (43,916,257) € 0 0.47 0.0% € (1,957,703) € 0 € (1,957,703) € (85,028,028) € (45,873,960) € (45,873,960) € (41,703,600) € (41,703,600)2 11.95 € 9.30 € 70,249,919 € 109,403,987 € (74,277,460) € (15,106,175) € (89,383,635) € (19,133,716) € (63,049,973) € 0 0.62 0.0% € (3,512,496) € 0 € (3,512,496) € (92,896,131) € (22,646,212) € (68,520,172) € (18,715,877) € (60,419,478)3 22.04 € 9.42 € 95,143,254 € 204,547,241 € (74,277,460) € (20,190,958) € (94,468,417) € 674,837 € (62,375,136) € 0 0.75 0.0% € (4,757,163) € 0 € (4,757,163) € (99,225,580) € (4,082,326) € (72,602,498) € (3,067,112) € (63,486,590)4 34.30 € 9.64 € 118,132,460 € 322,679,701 € (74,277,460) € (24,512,433) € (98,789,893) € 19,342,568 € (43,032,568) € 0 0.85 0.0% € (5,906,623) € 0 € (5,906,623) € (104,696,516) € 13,435,945 € (59,166,553) € 9,176,931 € (54,309,659)5 48.45 € 9.85 € 139,445,824 € 462,125,525 € (74,277,460) € (28,305,285) € (102,582,745) € 36,863,079 € (6,169,489) € 0 0.95 0.0% € (6,972,291) € 0 € (6,972,291) € (109,555,036) € 29,890,788 € (29,275,765) € 18,559,828 € (35,749,831)6 64.31 € 9.86 € 156,323,285 € 618,448,811 € (74,277,460) € (31,706,472) € (105,983,932) € 50,339,354 € 0 € 44,169,865 1.04 0.0% € (7,816,164) € (9,088,425) € (16,904,589) € (122,888,521) € 33,434,764 € 4,158,999 € 18,873,053 € (16,876,778)7 81.71 € 9.87 € 171,730,450 € 790,179,261 € (74,277,460) € (34,803,719) € (109,081,179) € 62,649,271 € 0 € 62,649,271 1.11 0.0% € (8,586,523) € (13,515,687) € (22,102,210) € (131,183,389) € 40,547,062 € 44,706,061 € 20,807,054 € 3,930,2768 100.54 € 9.88 € 185,960,854 € 976,140,115 € (74,277,460) € (37,656,995) € (111,934,455) € 74,026,400 € 0 € 74,026,400 1.18 0.0% € (9,298,043) € (16,182,089) € (25,480,132) € (137,414,587) € 48,546,268 € 93,252,328 € 22,647,192 € 26,577,4689 120.69 € 9.88 € 199,225,110 € 1,175,365,225 € (74,277,460) € (40,309,320) € (114,586,779) € 84,638,330 € 0 € 84,638,330 1.24 0.0% € (9,961,255) € (18,669,269) € (28,630,524) € (143,217,304) € 56,007,806 € 149,260,134 € 23,752,777 € 50,330,245
10 142.09 € 9.89 € 211,680,089 € 1,387,045,314 € (74,277,460) € (42,792,727) € (117,070,187) € 94,609,902 € 0 € 94,609,902 1.29 0.0% € (10,584,004) € (21,006,474) € (31,590,479) € (148,660,666) € 63,019,423 € 212,279,558 € 24,296,716 € 74,626,96111 160.26 € 9.90 € 179,912,951 € 1,566,958,265 € 0 € (36,338,921) € (36,338,921) € 143,574,030 € 0 € 143,574,030 1.41 0.0% € (8,995,648) € (33,644,596) € (42,640,243) € (78,979,165) € 100,933,787 € 313,213,345 € 35,376,677 € 110,003,63712 176.38 € 9.91 € 159,760,684 € 1,726,718,950 € 0 € (32,239,630) € (32,239,630) € 127,521,054 € 0 € 127,521,054 1.50 10.0% € (12,811,189) € (28,677,466) € (41,488,656) € (73,728,286) € 86,032,399 € 399,245,743 € 27,412,574 € 137,416,21113 191.01 € 9.92 € 145,125,146 € 1,871,844,096 € 0 € (29,259,305) € (29,259,305) € 115,865,841 € 0 € 115,865,841 1.58 10.8% € (12,549,747) € (25,829,023) € (38,378,771) € (67,638,076) € 77,487,070 € 476,732,814 € 22,445,244 € 159,861,45514 204.48 € 9.93 € 133,773,732 € 2,005,617,828 € 0 € (26,945,351) € (26,945,351) € 106,828,381 € 0 € 106,828,381 1.65 11.5% € (12,299,610) € (23,632,193) € (35,931,802) € (62,877,154) € 70,896,579 € 547,629,392 € 18,669,285 € 178,530,74015 217.02 € 9.94 € 124,600,725 € 2,130,218,553 € 0 € (25,073,530) € (25,073,530) € 99,527,195 € 0 € 99,527,195 1.71 12.1% € (12,058,588) € (21,867,152) € (33,925,740) € (58,999,270) € 65,601,455 € 613,230,847 € 15,704,467 € 194,235,20716 228.77 € 9.95 € 116,974,155 € 2,247,192,708 € 0 € (23,515,637) € (23,515,637) € 93,458,517 € 0 € 93,458,517 1.77 12.7% € (11,826,815) € (20,407,925) € (32,234,741) € (55,750,378) € 61,223,776 € 674,454,624 € 13,324,078 € 207,559,28417 239.87 € 9.96 € 110,498,266 € 2,357,690,974 € 0 € (22,191,365) € (22,191,365) € 88,306,901 € 0 € 88,306,901 1.81 13.1% € (11,604,642) € (19,175,565) € (30,780,207) € (52,971,571) € 57,526,694 € 731,981,318 € 11,381,350 € 218,940,63418 250.39 € 9.97 € 104,908,874 € 2,462,599,848 € 0 € (21,047,089) € (21,047,089) € 83,861,785 € 0 € 83,861,785 1.86 13.6% € (11,392,223) € (18,117,390) € (29,509,614) € (50,556,703) € 54,352,171 € 786,333,489 € 9,775,716 € 228,716,35019 260.42 € 9.98 € 100,021,057 € 2,562,620,905 € 0 € (20,045,267) € (20,045,267) € 79,975,790 € 0 € 79,975,790 1.90 14.0% € (11,189,494) € (17,196,574) € (28,386,068) € (48,431,335) € 51,589,722 € 837,923,211 € 8,435,332 € 237,151,68220 270.00 € 9.99 € 95,700,524 € 2,658,321,428 € 0 € (19,158,627) € (19,158,627) € 76,541,897 € 0 € 76,541,897 1.94 14.4% € (10,996,224) € (16,386,418) € (27,382,642) € (46,541,269) € 49,159,255 € 887,082,466 € 7,307,210 € 244,458,89221 279.18 € 10.00 € 91,846,845 € 2,750,168,273 € 0 € (18,366,770) € (18,366,770) € 73,480,075 € 0 € 73,480,075 1.97 14.7% € (10,812,074) € (15,667,000) € (26,479,074) € (44,845,844) € 47,001,001 € 934,083,467 € 6,351,272 € 250,810,16422 288.01 € 10.01 € 88,383,080 € 2,838,551,353 € 0 € (17,654,066) € (17,654,066) € 70,729,014 € 0 € 70,729,014 2.00 15.0% € (10,636,643) € (15,023,093) € (25,659,736) € (43,313,802) € 45,069,278 € 979,152,744 € 5,536,579 € 256,346,74323 296.51 € 10.02 € 85,249,084 € 2,923,800,436 € 0 € (17,008,292) € (17,008,292) € 68,240,791 € 0 € 68,240,791 2.03 15.3% € (10,469,504) € (14,442,822) € (24,912,326) € (41,920,618) € 43,328,466 € 1,022,481,210 € 4,838,843 € 261,185,58624 304.72 € 10.04 € 82,397,027 € 3,006,197,463 € 0 € (16,419,729) € (16,419,729) € 65,977,299 € 0 € 65,977,299 2.06 15.6% € (10,310,217) € (13,916,770) € (24,226,988) € (40,646,716) € 41,750,311 € 1,064,231,521 € 4,238,725 € 265,424,31225 312.66 € 10.05 € 79,788,310 € 3,085,985,774 € 0 € (15,880,527) € (15,880,527) € 63,907,783 € 0 € 63,907,783 2.09 15.9% € (10,158,352) € (13,437,358) € (23,595,710) € (39,476,237) € 40,312,073 € 1,104,543,594 € 3,720,643 € 269,144,955
TAXATION
DISCOUNTED CASH FLOWPETROLEUM PRODUCTION TAX (PPT)25
YEA
R PR
ODU
CTIO
N P
ROGR
AMEXPLORATION
& PRODUCTION COSTSREVENUE

© 2014 Peadar O’Sullivan [email protected]
DCF Model – P10 / P90 Variable Gas Prices Appendix G.
P90 Model
P90Units Value
bcf/year 0.4396% 5%- 1.5
$M/Well 7,427,746$ $/Mcf 2.00$
% 25%% 10%
No. of YearsSingle Well Production bcf / year
Single Well Cumulative
bcf / year
Year 1Wells x 10
bcf
Year 2Wells x 10
bcf
Year 3Wells x 10
bcf
Year 4Wells x 10
bcf
Year 5Wells x 10
bcf
Year 6Wells x 10
bcf
Year 7Wells x 10
bcf
Year 8Wells x 10
bcf
Year 9Wells x 10
bcf
Year 10Wells x 10
bcf
Field Production
Totalbcf
Cumulative Production
bcf
0 0.0000 0.000 0.000 0.00 0.001 0.4396 0.440 4.396 0.000 4.40 4.402 0.3157 0.755 3.157 4.396 0.000 7.55 11.953 0.2542 1.010 2.542 3.157 4.396 0.000 10.10 22.044 0.2161 1.226 2.161 2.542 3.157 4.396 0.000 12.26 34.305 0.1896 1.415 1.896 2.161 2.542 3.157 4.396 0.000 14.15 48.456 0.1701 1.585 1.701 1.896 2.161 2.542 3.157 4.396 0.000 15.85 64.317 0.1549 1.740 1.549 1.701 1.896 2.161 2.542 3.157 4.396 0.000 17.40 81.718 0.1427 1.883 1.427 1.549 1.701 1.896 2.161 2.542 3.157 4.396 0.000 18.83 100.549 0.1326 2.015 1.326 1.427 1.549 1.701 1.896 2.161 2.542 3.157 4.396 0.000 20.15 120.69
10 0.1242 2.140 1.242 1.326 1.427 1.549 1.701 1.896 2.161 2.542 3.157 4.396 21.40 142.0911 0.1170 2.257 1.170 1.242 1.326 1.427 1.549 1.701 1.896 2.161 2.542 3.157 18.17 160.2612 0.1107 2.367 1.107 1.170 1.242 1.326 1.427 1.549 1.701 1.896 2.161 2.542 16.12 176.3813 0.1052 2.473 1.052 1.107 1.170 1.242 1.326 1.427 1.549 1.701 1.896 2.161 14.63 191.0114 0.1004 2.573 1.004 1.052 1.107 1.170 1.242 1.326 1.427 1.549 1.701 1.896 13.47 204.4815 0.0961 2.669 0.961 1.004 1.052 1.107 1.170 1.242 1.326 1.427 1.549 1.701 12.54 217.0216 0.0922 2.761 0.922 0.961 1.004 1.052 1.107 1.170 1.242 1.326 1.427 1.549 11.76 228.7717 0.0886 2.850 0.886 0.922 0.961 1.004 1.052 1.107 1.170 1.242 1.326 1.427 11.10 239.8718 0.0855 2.935 0.855 0.886 0.922 0.961 1.004 1.052 1.107 1.170 1.242 1.326 10.52 250.3919 0.0825 3.018 0.825 0.855 0.886 0.922 0.961 1.004 1.052 1.107 1.170 1.242 10.02 260.4220 0.0798 3.098 0.798 0.825 0.855 0.886 0.922 0.961 1.004 1.052 1.107 1.170 9.58 270.0021 0.0774 3.175 0.774 0.798 0.825 0.855 0.886 0.922 0.961 1.004 1.052 1.107 9.18 279.1822 0.0751 3.250 0.751 0.774 0.798 0.825 0.855 0.886 0.922 0.961 1.004 1.052 8.83 288.0123 0.0729 3.323 0.729 0.751 0.774 0.798 0.825 0.855 0.886 0.922 0.961 1.004 8.50 296.5124 0.0709 3.394 0.709 0.729 0.751 0.774 0.798 0.825 0.855 0.886 0.922 0.961 8.21 304.7225 0.0691 3.463 0.691 0.709 0.729 0.751 0.774 0.798 0.825 0.855 0.886 0.922 7.94 312.66
OPEX
AssumptionsWell Flowrate Year 1Annual Productivity Declineb ConstantWell CAPEX
25 Y
EAR
PRO
DUCT
ION
PRO
GRAM
Corporate TaxDiscount Rate
PRODUCTION OF 100 WELL DRILLING PROGRAM OVER 10 YEARS @ 10 WELLED DRILLED PER YEAR

© 2014 Peadar O’Sullivan [email protected]
No. of YearsCumulative Production
bcf
Gas Prices€/Mcf
Revenue€
Cummulative Revenue
€
CAPEX€/Well
OPEX€/Mcf
Total Pre Tax Expenditure
€
PPT Profit€
Losses Carried Forward
€
PPT Income€
PPT R FactorPPT Rate
%PPT Tax
€Corporation Tax
€Total Tax
€
Total Expenditure
€
Net Cash Flow
€
Cumulative Cash Flow
€
Present Value of Cash Flow
€
CumulativePresent Value
Cash Flow€
0 0.00 € 0.00 € 0 € 0 € 0 € 0 € 0 € 0 € 0 € 0 0.00 0.0% € 0 € 0 € 0 € 0 € 0 € 0 € 0 € 01 4.40 € 6.97 € 30,624,979 € 30,624,979 € (74,277,460) € (8,792,865) € (83,070,325) € (52,445,345) € (52,445,345) € 0 0.37 0.0% € (1,531,249) € 0 € (1,531,249) € (84,601,574) € (53,976,594) € (53,976,594) € (49,069,631) € (49,069,631)2 11.95 € 6.66 € 50,321,831 € 80,946,810 € (74,277,460) € (15,106,175) € (89,383,635) € (39,061,804) € (91,507,150) € 0 0.46 0.0% € (2,516,092) € 0 € (2,516,092) € (91,899,726) € (41,577,896) € (95,554,490) € (34,361,897) € (83,431,529)3 22.04 € 6.36 € 64,198,558 € 145,145,368 € (74,277,460) € (20,190,958) € (94,468,417) € (30,269,859) € (121,777,009) € 0 0.53 0.0% € (3,209,928) € 0 € (3,209,928) € (97,678,345) € (33,479,787) € (129,034,277) € (25,153,860) € (108,585,388)4 34.30 € 6.07 € 74,382,622 € 219,527,990 € (74,277,460) € (24,512,433) € (98,789,893) € (24,407,271) € (146,184,280) € 0 0.58 0.0% € (3,719,131) € 0 € (3,719,131) € (102,509,024) € (28,126,402) € (157,160,679) € (19,210,711) € (127,796,099)5 48.45 € 5.77 € 81,604,854 € 301,132,844 € (74,277,460) € (28,305,285) € (102,582,745) € (20,977,891) € (167,162,171) € 0 0.62 0.0% € (4,080,243) € 0 € (4,080,243) € (106,662,987) € (25,058,134) € (182,218,813) € (15,559,129) € (143,355,229)6 64.31 € 5.77 € 91,532,095 € 392,664,939 € (74,277,460) € (31,706,472) € (105,983,932) € (14,451,837) € (181,614,007) € 0 0.66 0.0% € (4,576,605) € 0 € (4,576,605) € (110,560,537) € (19,028,441) € (201,247,254) € (10,741,059) € (154,096,288)7 81.71 € 5.78 € 100,610,132 € 493,275,071 € (74,277,460) € (34,803,719) € (109,081,179) € (8,471,047) € (190,085,054) € 0 0.69 0.0% € (5,030,507) € 0 € (5,030,507) € (114,111,685) € (13,501,553) € (214,748,807) € (6,928,432) € (161,024,719)8 100.54 € 5.79 € 109,009,956 € 602,285,027 € (74,277,460) € (37,656,995) € (111,934,455) € (2,924,499) € (193,009,553) € 0 0.73 0.0% € (5,450,498) € 0 € (5,450,498) € (117,384,952) € (8,374,997) € (223,123,804) € (3,906,998) € (164,931,717)9 120.69 € 5.80 € 116,854,268 € 719,139,295 € (74,277,460) € (40,309,320) € (114,586,779) € 2,267,488 € (190,742,064) € 0 0.76 0.0% € (5,842,713) € 0 € (5,842,713) € (120,429,493) € (3,575,225) € (226,699,029) € (1,516,244) € (166,447,961)
10 142.09 € 5.81 € 124,234,482 € 843,373,776 € (74,277,460) € (42,792,727) € (117,070,187) € 7,164,295 € (183,577,769) € 0 0.79 0.0% € (6,211,724) € 0 € (6,211,724) € (123,281,911) € 952,571 € (225,746,458) € 367,257 € (166,080,704)11 160.26 € 5.82 € 105,655,496 € 949,029,272 € 0 € (36,338,921) € (36,338,921) € 69,316,574 € (114,261,195) € 0 0.85 0.0% € (5,282,775) € 0 € (5,282,775) € (41,621,696) € 64,033,800 € (161,712,658) € 22,443,456 € (143,637,248)12 176.38 € 5.82 € 93,880,003 € 1,042,909,275 € 0 € (32,239,630) € (32,239,630) € 61,640,373 € (52,620,822) € 0 0.91 0.0% € (4,694,000) € 0 € (4,694,000) € (36,933,630) € 56,946,373 € (104,766,285) € 18,144,869 € (125,492,379)13 191.01 € 5.83 € 85,334,665 € 1,128,243,941 € 0 € (29,259,305) € (29,259,305) € 56,075,360 € 0 € 3,454,538 0.96 0.0% € (4,266,733) € 0 € (4,266,733) € (33,526,039) € 51,808,627 € (52,957,659) € 15,007,114 € (110,485,265)14 204.48 € 5.84 € 78,711,745 € 1,206,955,685 € 0 € (26,945,351) € (26,945,351) € 51,766,393 € 0 € 51,766,393 1.00 0.0% € (3,935,587) € (11,957,702) € (15,893,289) € (42,838,640) € 35,873,105 € (17,084,554) € 9,446,510 € (101,038,755)15 217.02 € 5.85 € 73,363,746 € 1,280,319,432 € 0 € (25,073,530) € (25,073,530) € 48,290,216 € 0 € 48,290,216 1.04 0.0% € (3,668,187) € (11,155,507) € (14,823,694) € (39,897,225) € 33,466,522 € 16,381,968 € 8,011,619 € (93,027,136)16 228.77 € 5.86 € 68,920,681 € 1,349,240,113 € 0 € (23,515,637) € (23,515,637) € 45,405,044 € 0 € 45,405,044 1.07 0.0% € (3,446,034) € (10,489,753) € (13,935,787) € (37,451,424) € 31,469,258 € 47,851,225 € 6,848,627 € (86,178,509)17 239.87 € 5.87 € 65,150,902 € 1,414,391,015 € 0 € (22,191,365) € (22,191,365) € 42,959,538 € 0 € 42,959,538 1.10 0.0% € (3,257,545) € (9,925,498) € (13,183,043) € (35,374,408) € 29,776,494 € 77,627,720 € 5,891,121 € (80,287,388)18 250.39 € 5.88 € 61,899,802 € 1,476,290,817 € 0 € (21,047,089) € (21,047,089) € 40,852,713 € 0 € 40,852,713 1.13 0.0% € (3,094,990) € (9,439,431) € (12,534,421) € (33,581,510) € 28,318,292 € 105,946,012 € 5,093,294 € (75,194,094)19 260.42 € 5.89 € 59,059,178 € 1,535,349,995 € 0 € (20,045,267) € (20,045,267) € 39,013,911 € 0 € 39,013,911 1.16 0.0% € (2,952,959) € (9,015,238) € (11,968,197) € (32,013,464) € 27,045,714 € 132,991,726 € 4,422,190 € (70,771,904)20 270.00 € 5.90 € 56,550,466 € 1,591,900,461 € 0 € (19,158,627) € (19,158,627) € 37,391,839 € 0 € 37,391,839 1.18 0.0% € (2,827,523) € (8,641,079) € (11,468,602) € (30,627,229) € 25,923,237 € 158,914,963 € 3,853,324 € (66,918,580)21 279.18 € 5.91 € 54,314,921 € 1,646,215,382 € 0 € (18,366,770) € (18,366,770) € 35,948,151 € 0 € 35,948,151 1.20 0.0% € (2,715,746) € (8,308,101) € (11,023,847) € (29,390,617) € 24,924,304 € 183,839,267 € 3,368,035 € (63,550,544)22 288.01 € 5.93 € 52,307,545 € 1,698,522,927 € 0 € (17,654,066) € (17,654,066) € 34,653,479 € 0 € 34,653,479 1.23 0.0% € (2,615,377) € (8,009,526) € (10,624,903) € (28,278,969) € 24,028,577 € 207,867,843 € 2,951,814 € (60,598,731)23 296.51 € 5.94 € 50,493,167 € 1,749,016,094 € 0 € (17,008,292) € (17,008,292) € 33,484,875 € 0 € 33,484,875 1.25 0.0% € (2,524,658) € (7,740,054) € (10,264,712) € (27,273,005) € 23,220,162 € 231,088,006 € 2,593,185 € (58,005,546)24 304.72 € 5.95 € 48,843,823 € 1,797,859,917 € 0 € (16,419,729) € (16,419,729) € 32,424,094 € 0 € 32,424,094 1.26 0.0% € (2,442,191) € (7,495,476) € (9,937,667) € (26,357,395) € 22,486,427 € 253,574,433 € 2,282,948 € (55,722,598)25 312.66 € 5.96 € 47,336,946 € 1,845,196,863 € 0 € (15,880,527) € (15,880,527) € 31,456,419 € 0 € 31,456,419 1.28 0.0% € (2,366,847) € (7,272,393) € (9,639,240) € (25,519,768) € 21,817,179 € 275,391,612 € 2,013,638 € (53,708,959)
DISCOUNTED CASH FLOW25
YEA
R PR
OD
UCT
ION
PRO
GRA
M
TAXATION
REVENUE EXPLORATION & PRODUCTION COSTS
PETROLEUM PRODUCTION TAX (PPT)

© 2014 Peadar O’Sullivan [email protected]
P10 Model
P10Units Value
bcf/year 0.4396% 5%- 1.5
$M/Well 7,427,746$ $/Mcf 2.00$
% 25%% 10%
No. of YearsSingle Well Production bcf / year
Single Well Cumulative
bcf / year
Year 1Wells x 10
bcf
Year 2Wells x 10
bcf
Year 3Wells x 10
bcf
Year 4Wells x 10
bcf
Year 5Wells x 10
bcf
Year 6Wells x 10
bcf
Year 7Wells x 10
bcf
Year 8Wells x 10
bcf
Year 9Wells x 10
bcf
Year 10Wells x 10
bcf
Field Production
Totalbcf
Cumulative Production
bcf
0 0.0000 0.000 0.000 0.00 0.001 0.4396 0.440 4.396 0.000 4.40 4.402 0.3157 0.755 3.157 4.396 0.000 7.55 11.953 0.2542 1.010 2.542 3.157 4.396 0.000 10.10 22.044 0.2161 1.226 2.161 2.542 3.157 4.396 0.000 12.26 34.305 0.1896 1.415 1.896 2.161 2.542 3.157 4.396 0.000 14.15 48.456 0.1701 1.585 1.701 1.896 2.161 2.542 3.157 4.396 0.000 15.85 64.317 0.1549 1.740 1.549 1.701 1.896 2.161 2.542 3.157 4.396 0.000 17.40 81.718 0.1427 1.883 1.427 1.549 1.701 1.896 2.161 2.542 3.157 4.396 0.000 18.83 100.549 0.1326 2.015 1.326 1.427 1.549 1.701 1.896 2.161 2.542 3.157 4.396 0.000 20.15 120.69
10 0.1242 2.140 1.242 1.326 1.427 1.549 1.701 1.896 2.161 2.542 3.157 4.396 21.40 142.0911 0.1170 2.257 1.170 1.242 1.326 1.427 1.549 1.701 1.896 2.161 2.542 3.157 18.17 160.2612 0.1107 2.367 1.107 1.170 1.242 1.326 1.427 1.549 1.701 1.896 2.161 2.542 16.12 176.3813 0.1052 2.473 1.052 1.107 1.170 1.242 1.326 1.427 1.549 1.701 1.896 2.161 14.63 191.0114 0.1004 2.573 1.004 1.052 1.107 1.170 1.242 1.326 1.427 1.549 1.701 1.896 13.47 204.4815 0.0961 2.669 0.961 1.004 1.052 1.107 1.170 1.242 1.326 1.427 1.549 1.701 12.54 217.0216 0.0922 2.761 0.922 0.961 1.004 1.052 1.107 1.170 1.242 1.326 1.427 1.549 11.76 228.7717 0.0886 2.850 0.886 0.922 0.961 1.004 1.052 1.107 1.170 1.242 1.326 1.427 11.10 239.8718 0.0855 2.935 0.855 0.886 0.922 0.961 1.004 1.052 1.107 1.170 1.242 1.326 10.52 250.3919 0.0825 3.018 0.825 0.855 0.886 0.922 0.961 1.004 1.052 1.107 1.170 1.242 10.02 260.4220 0.0798 3.098 0.798 0.825 0.855 0.886 0.922 0.961 1.004 1.052 1.107 1.170 9.58 270.0021 0.0774 3.175 0.774 0.798 0.825 0.855 0.886 0.922 0.961 1.004 1.052 1.107 9.18 279.1822 0.0751 3.250 0.751 0.774 0.798 0.825 0.855 0.886 0.922 0.961 1.004 1.052 8.83 288.0123 0.0729 3.323 0.729 0.751 0.774 0.798 0.825 0.855 0.886 0.922 0.961 1.004 8.50 296.5124 0.0709 3.394 0.709 0.729 0.751 0.774 0.798 0.825 0.855 0.886 0.922 0.961 8.21 304.7225 0.0691 3.463 0.691 0.709 0.729 0.751 0.774 0.798 0.825 0.855 0.886 0.922 7.94 312.66
OPEX
AssumptionsWell Flowrate Year 1Annual Productivity Declineb ConstantWell CAPEX
25 Y
EAR
PRO
DUCT
ION
PRO
GRAM
Corporate TaxDiscount Rate
PRODUCTION OF 100 WELL DRILLING PROGRAM OVER 10 YEARS @ 10 WELLED DRILLED PER YEAR

© 2014 Peadar O’Sullivan [email protected]
No. of YearsCumulative Production
bcf
Gas Prices€/Mcf
Revenue€
Cummulative Revenue
€
CAPEX€/Well
OPEX€/Mcf
Total Pre Tax Expenditure
€
PPT Profit€
Losses Carried Forward
€
PPT Income€
PPT R FactorPPT Rate
%PPT Tax
€Corporation Tax
€Total Tax
€
Total Expenditure
€
Net Cash Flow
€
Cumulative Cash Flow
€
Present Value of Cash Flow
€
CumulativePresent Value
Cash Flow€
0 0.00 € 0.00 € 0 € 0 € 0 € 0 € 0 € 0 € 0 € 0 0.00 0.0% € 0 € 0 € 0 € 0 € 0 € 0 € 0 € 01 4.40 € 11.69 € 51,379,095 € 51,379,095 € (74,277,460) € (8,792,865) € (83,070,325) € (31,691,230) € (31,691,230) € 0 0.62 0.0% € (2,568,955) € 0 € (2,568,955) € (85,639,280) € (34,260,184) € (34,260,184) € (31,145,622) € (31,145,622)2 11.95 € 12.00 € 90,666,441 € 142,045,536 € (74,277,460) € (15,106,175) € (89,383,635) € 1,282,806 € (30,408,423) € 0 0.81 0.0% € (4,533,322) € 0 € (4,533,322) € (93,916,957) € (3,250,516) € (37,510,700) € (2,686,377) € (33,831,999)3 22.04 € 12.32 € 124,390,561 € 266,436,098 € (74,277,460) € (20,190,958) € (94,468,417) € 29,922,144 € (486,279) € 0 0.97 0.0% € (6,219,528) € 0 € (6,219,528) € (100,687,945) € 23,702,616 € (13,808,084) € 17,808,126 € (16,023,873)4 34.30 € 12.64 € 154,907,687 € 421,343,784 € (74,277,460) € (24,512,433) € (98,789,893) € 56,117,794 € 0 € 55,631,515 1.12 0.0% € (7,745,384) € (11,971,533) € (19,716,917) € (118,506,810) € 36,400,877 € 22,592,793 € 24,862,289 € 8,838,4165 48.45 € 12.97 € 183,558,716 € 604,902,500 € (74,277,460) € (28,305,285) € (102,582,745) € 80,975,971 € 0 € 80,975,971 1.25 0.0% € (9,177,936) € (17,949,509) € (27,127,445) € (129,710,189) € 53,848,526 € 76,441,319 € 33,435,698 € 42,274,1146 64.31 € 13.31 € 211,067,740 € 815,970,240 € (74,277,460) € (31,706,472) € (105,983,932) € 105,083,809 € 0 € 105,083,809 1.37 0.0% € (10,553,387) € (23,632,605) € (34,185,992) € (140,169,924) € 70,897,816 € 147,339,136 € 40,019,969 € 82,294,0837 81.71 € 13.67 € 237,899,354 € 1,053,869,594 € (74,277,460) € (34,803,719) € (109,081,179) € 128,818,175 € 0 € 128,818,175 1.48 0.0% € (11,894,968) € (29,230,802) € (41,125,770) € (150,206,948) € 87,692,405 € 235,031,541 € 45,000,070 € 127,294,1538 100.54 € 13.96 € 262,911,753 € 1,316,781,347 € (74,277,460) € (37,656,995) € (111,934,455) € 150,977,298 € 0 € 150,977,298 1.59 10.9% € (16,448,353) € (33,632,236) € (50,080,589) € (162,015,044) € 100,896,709 € 335,928,250 € 47,069,059 € 174,363,2139 120.69 € 13.97 € 281,595,952 € 1,598,377,299 € (74,277,460) € (40,309,320) € (114,586,779) € 167,009,172 € 0 € 167,009,172 1.68 11.8% € (19,718,734) € (36,822,610) € (56,541,343) € (171,128,123) € 110,467,829 € 446,396,079 € 46,849,143 € 221,212,356
10 142.09 € 13.98 € 299,125,696 € 1,897,502,995 € (74,277,460) € (42,792,727) € (117,070,187) € 182,055,510 € 0 € 182,055,510 1.76 12.6% € (22,960,404) € (39,773,776) € (62,734,181) € (179,804,367) € 119,321,329 € 565,717,408 € 46,003,538 € 267,215,89311 160.26 € 13.99 € 254,170,407 € 2,151,673,402 € 0 € (36,338,921) € (36,338,921) € 217,831,486 € 0 € 217,831,486 1.92 14.2% € (30,897,955) € (46,733,383) € (77,631,338) € (113,970,259) € 140,200,148 € 705,917,556 € 49,139,297 € 316,355,19012 176.38 € 14.00 € 225,641,365 € 2,377,314,768 € 0 € (32,239,630) € (32,239,630) € 193,401,735 € 0 € 193,401,735 2.04 15.4% € (29,778,826) € (40,905,727) € (70,684,553) € (102,924,183) € 122,717,182 € 828,634,738 € 39,101,476 € 355,456,66613 191.01 € 14.01 € 204,915,627 € 2,582,230,395 € 0 € (29,259,305) € (29,259,305) € 175,656,322 € 0 € 175,656,322 2.14 16.4% € (28,849,542) € (36,701,695) € (65,551,237) € (94,810,542) € 110,105,085 € 938,739,823 € 31,893,521 € 387,350,18714 204.48 € 14.02 € 188,835,720 € 2,771,066,115 € 0 € (26,945,351) € (26,945,351) € 161,890,369 € 0 € 161,890,369 2.23 17.3% € (28,026,014) € (33,466,089) € (61,492,103) € (88,437,454) € 100,398,266 € 1,039,138,089 € 26,438,001 € 413,788,18815 217.02 € 14.03 € 175,837,704 € 2,946,903,819 € 0 € (25,073,530) € (25,073,530) € 150,764,174 € 0 € 150,764,174 2.31 18.1% € (27,276,829) € (30,871,836) € (58,148,665) € (83,222,195) € 92,615,509 € 1,131,753,598 € 22,171,417 € 435,959,60516 228.77 € 14.04 € 165,027,628 € 3,111,931,447 € 0 € (23,515,637) € (23,515,637) € 141,511,991 € 0 € 141,511,991 2.38 18.8% € (26,586,692) € (28,731,325) € (55,318,017) € (78,833,654) € 86,193,974 € 1,217,947,572 € 18,758,320 € 454,717,92517 239.87 € 14.05 € 155,845,629 € 3,267,777,076 € 0 € (22,191,365) € (22,191,365) € 133,654,264 € 0 € 133,654,264 2.44 19.4% € (25,946,452) € (26,926,953) € (52,873,405) € (75,064,770) € 80,780,859 € 1,298,728,431 € 15,982,062 € 470,699,98718 250.39 € 14.06 € 147,917,946 € 3,415,695,022 € 0 € (21,047,089) € (21,047,089) € 126,870,857 € 0 € 126,870,857 2.50 20.0% € (25,349,745) € (25,380,278) € (50,730,023) € (71,777,112) € 76,140,834 € 1,374,869,265 € 13,694,598 € 484,394,58619 260.42 € 14.07 € 140,982,936 € 3,556,677,958 € 0 € (20,045,267) € (20,045,267) € 120,937,669 € 0 € 120,937,669 2.55 20.5% € (24,791,700) € (24,036,492) € (48,828,192) € (68,873,459) € 72,109,477 € 1,446,978,742 € 11,790,476 € 496,185,06120 270.00 € 14.08 € 134,850,581 € 3,691,528,539 € 0 € (19,158,627) € (19,158,627) € 115,691,955 € 0 € 115,691,955 2.60 21.0% € (24,268,358) € (22,855,899) € (47,124,257) € (66,282,883) € 68,567,698 € 1,515,546,440 € 10,192,151 € 506,377,21321 279.18 € 14.09 € 129,378,768 € 3,820,907,307 € 0 € (18,366,770) € (18,366,770) € 111,011,998 € 0 € 111,011,998 2.64 21.4% € (23,776,387) € (21,808,903) € (45,585,290) € (63,952,060) € 65,426,708 € 1,580,973,148 € 8,841,148 € 515,218,36122 288.01 € 14.10 € 124,458,614 € 3,945,365,921 € 0 € (17,654,066) € (17,654,066) € 106,804,548 € 0 € 106,804,548 2.68 21.8% € (23,312,928) € (20,872,905) € (44,185,833) € (61,839,899) € 62,618,716 € 1,643,591,863 € 7,692,457 € 522,910,81823 296.51 € 14.11 € 120,005,000 € 4,065,370,922 € 0 € (17,008,292) € (17,008,292) € 102,996,708 € 0 € 102,996,708 2.72 22.2% € (22,875,486) € (20,030,305) € (42,905,791) € (59,914,084) € 60,090,916 € 1,703,682,780 € 6,710,843 € 529,621,66124 304.72 € 14.12 € 115,950,232 € 4,181,321,154 € 0 € (16,419,729) € (16,419,729) € 99,530,503 € 0 € 99,530,503 2.76 22.6% € (22,461,872) € (19,267,158) € (41,729,030) € (58,148,758) € 57,801,474 € 1,761,484,253 € 5,868,329 € 535,489,99025 312.66 € 14.14 € 112,239,674 € 4,293,560,828 € 0 € (15,880,527) € (15,880,527) € 96,359,147 € 0 € 96,359,147 2.79 22.9% € (22,070,148) € (18,572,250) € (40,642,398) € (56,522,925) € 55,716,749 € 1,817,201,002 € 5,142,433 € 540,632,423
DISCOUNTED CASH FLOW
TAXATION
REVENUE EXPLORATION & PRODUCTION COSTS
PETROLEUM PRODUCTION TAX (PPT)

© 2014 Peadar O’Sullivan [email protected]
DCF Model – P10 / P90 Variable Initial Gas Production Appendix H.
P90 Model
P90Units Value
bcf/year 0.2914% 5%- 1.5
$M/Well 7,427,746$ $/Mcf 2.00$
% 25%% 10%
No. of YearsSingle Well Production bcf / year
Single Well Cumulative
bcf / year
Year 1Wells x 10
bcf
Year 2Wells x 10
bcf
Year 3Wells x 10
bcf
Year 4Wells x 10
bcf
Year 5Wells x 10
bcf
Year 6Wells x 10
bcf
Year 7Wells x 10
bcf
Year 8Wells x 10
bcf
Year 9Wells x 10
bcf
Year 10Wells x 10
bcf
Field Production
Totalbcf
Cumulative Production
bcf
0 0.0000 0.000 0.000 0.00 0.001 0.2914 0.291 2.914 0.000 2.91 2.912 0.2092 0.501 2.092 2.914 0.000 5.01 7.923 0.1685 0.669 1.685 2.092 2.914 0.000 6.69 14.614 0.1432 0.812 1.432 1.685 2.092 2.914 0.000 8.12 22.735 0.1257 0.938 1.257 1.432 1.685 2.092 2.914 0.000 9.38 32.116 0.1127 1.051 1.127 1.257 1.432 1.685 2.092 2.914 0.000 10.51 42.627 0.1026 1.153 1.026 1.127 1.257 1.432 1.685 2.092 2.914 0.000 11.53 54.158 0.0945 1.248 0.945 1.026 1.127 1.257 1.432 1.685 2.092 2.914 0.000 12.48 66.639 0.0879 1.336 0.879 0.945 1.026 1.127 1.257 1.432 1.685 2.092 2.914 0.000 13.36 79.99
10 0.0823 1.418 0.823 0.879 0.945 1.026 1.127 1.257 1.432 1.685 2.092 2.914 14.18 94.1711 0.0775 1.495 0.775 0.823 0.879 0.945 1.026 1.127 1.257 1.432 1.685 2.092 12.04 106.2112 0.0734 1.569 0.734 0.775 0.823 0.879 0.945 1.026 1.127 1.257 1.432 1.685 10.68 116.8913 0.0697 1.639 0.697 0.734 0.775 0.823 0.879 0.945 1.026 1.127 1.257 1.432 9.70 126.5914 0.0665 1.705 0.665 0.697 0.734 0.775 0.823 0.879 0.945 1.026 1.127 1.257 8.93 135.5115 0.0637 1.769 0.637 0.665 0.697 0.734 0.775 0.823 0.879 0.945 1.026 1.127 8.31 143.8216 0.0611 1.830 0.611 0.637 0.665 0.697 0.734 0.775 0.823 0.879 0.945 1.026 7.79 151.6117 0.0587 1.889 0.587 0.611 0.637 0.665 0.697 0.734 0.775 0.823 0.879 0.945 7.35 158.9718 0.0566 1.945 0.566 0.587 0.611 0.637 0.665 0.697 0.734 0.775 0.823 0.879 6.97 165.9419 0.0547 2.000 0.547 0.566 0.587 0.611 0.637 0.665 0.697 0.734 0.775 0.823 6.64 172.5820 0.0529 2.053 0.529 0.547 0.566 0.587 0.611 0.637 0.665 0.697 0.734 0.775 6.35 178.9321 0.0513 2.104 0.513 0.529 0.547 0.566 0.587 0.611 0.637 0.665 0.697 0.734 6.09 185.0222 0.0497 2.154 0.497 0.513 0.529 0.547 0.566 0.587 0.611 0.637 0.665 0.697 5.85 190.8723 0.0483 2.202 0.483 0.497 0.513 0.529 0.547 0.566 0.587 0.611 0.637 0.665 5.64 196.5024 0.0470 2.249 0.470 0.483 0.497 0.513 0.529 0.547 0.566 0.587 0.611 0.637 5.44 201.9525 0.0458 2.295 0.458 0.470 0.483 0.497 0.513 0.529 0.547 0.566 0.587 0.611 5.26 207.21
OPEX
AssumptionsWell Flowrate Year 1Annual Productivity Declineb ConstantWell CAPEX
25 Y
EAR
PRO
DUCT
ION
PRO
GRAM
Corporate TaxDiscount Rate
PRODUCTION OF 100 WELL DRILLING PROGRAM OVER 10 YEARS @ 10 WELLED DRILLED PER YEAR

© 2014 Peadar O’Sullivan [email protected]
No. of YearsCumulative Production
bcf
Gas Prices€/Mcf
Revenue€
Cummulative Revenue
€
CAPEX€/Well
OPEX€/Mcf
Total Pre Tax Expenditure
€
PPT Profit€
Losses Carried Forward
€
PPT Income€
PPT R FactorPPT Rate
%PPT Tax
€Corporation Tax
€Total Tax
€
Total Expenditure
€
Net Cash Flow
€
Cumulative Cash Flow
€
Present Value of Cash Flow
€
CumulativePresent Value
Cash Flow€
0 0.00 € 0.00 € 0 € 0 € 0 € 0 € 0 € 0 € 0 € 0 0.00 0.0% € 0 € 0 € 0 € 0 € 0 € 0 € 0 € 01 2.91 € 8.91 € 25,948,377 € 25,948,377 € (74,277,460) € (5,827,251) € (80,104,711) € (54,156,333) € (54,156,333) € 0 0.32 0.0% € (1,297,419) € 0 € (1,297,419) € (81,402,129) € (55,453,752) € (55,453,752) € (50,412,502) € (50,412,502)2 7.92 € 9.30 € 46,556,373 € 72,504,750 € (74,277,460) € (10,011,239) € (84,288,699) € (37,732,325) € (91,888,659) € 0 0.43 0.0% € (2,327,819) € 0 € (2,327,819) € (86,616,517) € (40,060,144) € (95,513,896) € (33,107,557) € (83,520,059)3 14.61 € 9.42 € 63,053,807 € 135,558,557 € (74,277,460) € (13,381,051) € (87,658,511) € (24,604,704) € (116,493,363) € 0 0.52 0.0% € (3,152,690) € 0 € (3,152,690) € (90,811,201) € (27,757,394) € (123,271,291) € (20,854,541) € (104,374,600)4 22.73 € 9.64 € 78,289,327 € 213,847,884 € (74,277,460) € (16,245,001) € (90,522,460) € (12,233,133) € (128,726,496) € 0 0.60 0.0% € (3,914,466) € 0 € (3,914,466) € (94,436,926) € (16,147,599) € (139,418,890) € (11,029,028) € (115,403,628)5 32.11 € 9.85 € 92,414,225 € 306,262,109 € (74,277,460) € (18,758,618) € (93,036,078) € (621,853) € (129,348,349) € 0 0.68 0.0% € (4,620,711) € 0 € (4,620,711) € (97,656,789) € (5,242,564) € (144,661,454) € (3,255,220) € (118,658,848)6 42.62 € 9.86 € 103,599,339 € 409,861,448 € (74,277,460) € (21,012,670) € (95,290,129) € 8,309,210 € (121,039,139) € 0 0.74 0.0% € (5,179,967) € 0 € (5,179,967) € (100,470,096) € 3,129,243 € (141,532,211) € 1,766,376 € (116,892,472)7 54.15 € 9.87 € 113,810,052 € 523,671,500 € (74,277,460) € (23,065,293) € (97,342,752) € 16,467,299 € (104,571,840) € 0 0.80 0.0% € (5,690,503) € 0 € (5,690,503) € (103,033,255) € 10,776,797 € (130,755,415) € 5,530,201 € (111,362,271)8 66.63 € 9.88 € 123,240,895 € 646,912,395 € (74,277,460) € (24,956,230) € (99,233,689) € 24,007,206 € (80,564,633) € 0 0.85 0.0% € (6,162,045) € 0 € (6,162,045) € (105,395,734) € 17,845,161 € (112,910,253) € 8,324,899 € (103,037,372)9 79.99 € 9.88 € 132,031,448 € 778,943,843 € (74,277,460) € (26,713,991) € (100,991,451) € 31,039,997 € (49,524,636) € 0 0.90 0.0% € (6,601,572) € 0 € (6,601,572) € (107,593,023) € 24,438,425 € (88,471,829) € 10,364,278 € (92,673,094)
10 94.17 € 9.89 € 140,285,673 € 919,229,517 € (74,277,460) € (28,359,807) € (102,637,267) € 37,648,407 € (11,876,230) € 0 0.95 0.0% € (7,014,284) € 0 € (7,014,284) € (109,651,551) € 30,634,123 € (57,837,706) € 11,810,780 € (80,862,313)11 106.21 € 9.90 € 119,232,799 € 1,038,462,316 € 0 € (24,082,709) € (24,082,709) € 95,150,090 € 0 € 83,273,860 1.04 0.0% € (5,961,640) € (19,328,055) € (25,289,695) € (49,372,404) € 69,860,395 € 12,022,689 € 24,485,642 € (56,376,671)12 116.89 € 9.91 € 105,877,389 € 1,144,339,705 € 0 € (21,366,007) € (21,366,007) € 84,511,383 € 0 € 84,511,383 1.12 0.0% € (5,293,869) € (19,804,378) € (25,098,248) € (46,464,254) € 59,413,135 € 71,435,824 € 18,930,856 € (37,445,815)13 126.59 € 9.92 € 96,178,053 € 1,240,517,758 € 0 € (19,390,871) € (19,390,871) € 76,787,182 € 0 € 76,787,182 1.19 0.0% € (4,808,903) € (17,994,570) € (22,803,472) € (42,194,344) € 53,983,709 € 125,419,534 € 15,637,158 € (21,808,658)14 135.51 € 9.93 € 88,655,188 € 1,329,172,946 € 0 € (17,857,356) € (17,857,356) € 70,797,832 € 0 € 70,797,832 1.25 0.0% € (4,432,759) € (16,591,268) € (21,024,028) € (38,881,384) € 49,773,804 € 175,193,338 € 13,106,998 € (8,701,659)15 143.82 € 9.94 € 82,576,008 € 1,411,748,954 € 0 € (16,616,854) € (16,616,854) € 65,959,154 € 0 € 65,959,154 1.31 0.0% € (4,128,800) € (15,457,588) € (19,586,389) € (36,203,242) € 46,372,765 € 221,566,103 € 11,101,271 € 2,399,61216 151.61 € 9.95 € 77,521,689 € 1,489,270,643 € 0 € (15,584,399) € (15,584,399) € 61,937,290 € 0 € 61,937,290 1.36 0.0% € (3,876,084) € (14,515,301) € (18,391,386) € (33,975,785) € 43,545,904 € 265,112,007 € 9,476,857 € 11,876,46917 158.97 € 9.96 € 73,229,956 € 1,562,500,599 € 0 € (14,706,771) € (14,706,771) € 58,523,185 € 0 € 58,523,185 1.40 0.0% € (3,661,498) € (13,715,422) € (17,376,920) € (32,083,690) € 41,146,266 € 306,258,273 € 8,140,569 € 20,017,03918 165.94 € 9.97 € 69,525,727 € 1,632,026,326 € 0 € (13,948,431) € (13,948,431) € 55,577,296 € 0 € 55,577,296 1.45 0.0% € (3,476,286) € (13,025,252) € (16,501,539) € (30,449,970) € 39,075,757 € 345,334,030 € 7,028,118 € 27,045,15719 172.58 € 9.98 € 66,286,448 € 1,698,312,774 € 0 € (13,284,498) € (13,284,498) € 53,001,950 € 0 € 53,001,950 1.49 0.0% € (3,314,322) € (12,421,907) € (15,736,229) € (29,020,727) € 37,265,721 € 382,599,751 € 6,093,243 € 33,138,40020 178.93 € 9.99 € 63,423,123 € 1,761,735,898 € 0 € (12,696,900) € (12,696,900) € 50,726,224 € 0 € 50,726,224 1.52 10.2% € (5,191,803) € (11,383,605) € (16,575,408) € (29,272,308) € 34,150,815 € 416,750,567 € 5,076,301 € 38,214,70121 185.02 € 10.00 € 60,869,194 € 1,822,605,092 € 0 € (12,172,116) € (12,172,116) € 48,697,078 € 0 € 48,697,078 1.56 10.6% € (5,146,617) € (10,887,615) € (16,034,233) € (28,206,349) € 32,662,845 € 449,413,412 € 4,413,749 € 42,628,45022 190.87 € 10.01 € 58,573,671 € 1,881,178,763 € 0 € (11,699,790) € (11,699,790) € 46,873,881 € 0 € 46,873,881 1.59 10.9% € (5,100,708) € (10,443,293) € (15,544,001) € (27,243,791) € 31,329,880 € 480,743,292 € 3,848,750 € 46,477,20023 196.50 € 10.02 € 56,496,693 € 1,937,675,456 € 0 € (11,271,819) € (11,271,819) € 45,224,874 € 0 € 45,224,874 1.62 11.2% € (5,054,635) € (10,042,560) € (15,097,195) € (26,369,014) € 30,127,679 € 510,870,972 € 3,364,604 € 49,841,80424 201.95 € 10.04 € 54,606,565 € 1,992,282,021 € 0 € (10,881,764) € (10,881,764) € 43,724,801 € 0 € 43,724,801 1.65 11.5% € (5,008,804) € (9,678,999) € (14,687,804) € (25,569,567) € 29,036,998 € 539,907,969 € 2,947,999 € 52,789,80225 207.21 € 10.05 € 52,877,703 € 2,045,159,723 € 0 € (10,524,421) € (10,524,421) € 42,353,281 € 0 € 42,353,281 1.67 11.7% € (4,963,508) € (9,347,443) € (14,310,952) € (24,835,373) € 28,042,330 € 567,950,299 € 2,588,195 € 55,377,997
DISCOUNTED CASH FLOW
TAXATION
REVENUE EXPLORATION & PRODUCTION COSTS
PETROLEUM PRODUCTION TAX (PPT)

© 2014 Peadar O’Sullivan [email protected]
P10 Model
P10Units Value
bcf/year 0.5879% 5%- 1.5
$M/Well 7,427,746$ $/Mcf 2.00$
% 25%% 10%
No. of YearsSingle Well Production bcf / year
Single Well Cumulative
bcf / year
Year 1Wells x 10
bcf
Year 2Wells x 10
bcf
Year 3Wells x 10
bcf
Year 4Wells x 10
bcf
Year 5Wells x 10
bcf
Year 6Wells x 10
bcf
Year 7Wells x 10
bcf
Year 8Wells x 10
bcf
Year 9Wells x 10
bcf
Year 10Wells x 10
bcf
Field Production
Totalbcf
Cumulative Production
bcf
0 0.0000 0.000 0.000 0.00 0.001 0.5879 0.588 5.879 0.000 5.88 5.882 0.4221 1.010 4.221 5.879 0.000 10.10 15.983 0.3400 1.350 3.400 4.221 5.879 0.000 13.50 29.484 0.2890 1.639 2.890 3.400 4.221 5.879 0.000 16.39 45.875 0.2536 1.893 2.536 2.890 3.400 4.221 5.879 0.000 18.93 64.806 0.2274 2.120 2.274 2.536 2.890 3.400 4.221 5.879 0.000 21.20 86.007 0.2071 2.327 2.071 2.274 2.536 2.890 3.400 4.221 5.879 0.000 23.27 109.278 0.1908 2.518 1.908 2.071 2.274 2.536 2.890 3.400 4.221 5.879 0.000 25.18 134.459 0.1773 2.695 1.773 1.908 2.071 2.274 2.536 2.890 3.400 4.221 5.879 0.000 26.95 161.40
10 0.1660 2.861 1.660 1.773 1.908 2.071 2.274 2.536 2.890 3.400 4.221 5.879 28.61 190.0111 0.1564 3.018 1.564 1.660 1.773 1.908 2.071 2.274 2.536 2.890 3.400 4.221 24.30 214.3112 0.1480 3.166 1.480 1.564 1.660 1.773 1.908 2.071 2.274 2.536 2.890 3.400 21.56 235.8713 0.1407 3.306 1.407 1.480 1.564 1.660 1.773 1.908 2.071 2.274 2.536 2.890 19.56 255.4314 0.1342 3.441 1.342 1.407 1.480 1.564 1.660 1.773 1.908 2.071 2.274 2.536 18.02 273.4515 0.1284 3.569 1.284 1.342 1.407 1.480 1.564 1.660 1.773 1.908 2.071 2.274 16.77 290.2116 0.1232 3.692 1.232 1.284 1.342 1.407 1.480 1.564 1.660 1.773 1.908 2.071 15.72 305.9317 0.1185 3.811 1.185 1.232 1.284 1.342 1.407 1.480 1.564 1.660 1.773 1.908 14.84 320.7718 0.1143 3.925 1.143 1.185 1.232 1.284 1.342 1.407 1.480 1.564 1.660 1.773 14.07 334.8519 0.1104 4.036 1.104 1.143 1.185 1.232 1.284 1.342 1.407 1.480 1.564 1.660 13.40 348.2520 0.1068 4.142 1.068 1.104 1.143 1.185 1.232 1.284 1.342 1.407 1.480 1.564 12.81 361.0621 0.1035 4.246 1.035 1.068 1.104 1.143 1.185 1.232 1.284 1.342 1.407 1.480 12.28 373.3422 0.1004 4.346 1.004 1.035 1.068 1.104 1.143 1.185 1.232 1.284 1.342 1.407 11.80 385.1423 0.0975 4.444 0.975 1.004 1.035 1.068 1.104 1.143 1.185 1.232 1.284 1.342 11.37 396.5224 0.0949 4.539 0.949 0.975 1.004 1.035 1.068 1.104 1.143 1.185 1.232 1.284 10.98 407.4925 0.0924 4.631 0.924 0.949 0.975 1.004 1.035 1.068 1.104 1.143 1.185 1.232 10.62 418.11
OPEX
AssumptionsWell Flowrate Year 1Annual Productivity Declineb ConstantWell CAPEX
25 Y
EAR
PRO
DUCT
ION
PRO
GRAM
Corporate TaxDiscount Rate
PRODUCTION OF 100 WELL DRILLING PROGRAM OVER 10 YEARS @ 10 WELLED DRILLED PER YEAR

© 2014 Peadar O’Sullivan [email protected]
No. of YearsCumulative Production
bcf
Gas Prices€/Mcf
Revenue€
Cummulative Revenue
€
CAPEX€/Well
OPEX€/Mcf
Total Pre Tax Expenditure
€
PPT Profit€
Losses Carried Forward
€
PPT Income€
PPT R FactorPPT Rate
%PPT Tax
€Corporation Tax
€Total Tax
€
Total Expenditure
€
Net Cash Flow
€
Cumulative Cash Flow
€
Present Value of Cash Flow
€
CumulativePresent Value
Cash Flow€
0 0.00 € 0.00 € 0 € 0 € 0 € 0 € 0 € 0 € 0 € 0 0.00 0.0% € 0 € 0 € 0 € 0 € 0 € 0 € 0 € 01 5.88 € 8.91 € 52,359,759 € 52,359,759 € (74,277,460) € (11,758,479) € (86,035,939) € (33,676,180) € (33,676,180) € 0 0.61 0.0% € (2,617,988) € 0 € (2,617,988) € (88,653,927) € (36,294,168) € (36,294,168) € (32,994,698) € (32,994,698)2 15.98 € 9.30 € 93,943,465 € 146,303,224 € (74,277,460) € (20,201,112) € (94,478,571) € (535,106) € (34,211,286) € 0 0.80 0.0% € (4,697,173) € 0 € (4,697,173) € (99,175,744) € (5,232,279) € (41,526,447) € (4,324,198) € (37,318,896)3 29.48 € 9.42 € 127,232,701 € 273,535,925 € (74,277,460) € (27,000,864) € (101,278,324) € 25,954,377 € (8,256,909) € 0 0.94 0.0% € (6,361,635) € 0 € (6,361,635) € (107,639,959) € 19,592,742 € (21,933,705) € 14,720,317 € (22,598,579)4 45.87 € 9.64 € 157,975,593 € 431,511,518 € (74,277,460) € (32,779,865) € (107,057,325) € 50,918,268 € 0 € 42,661,359 1.07 0.0% € (7,898,780) € (8,690,645) € (16,589,425) € (123,646,750) € 34,328,844 € 12,395,138 € 23,447,062 € 848,4835 64.80 € 9.85 € 186,477,423 € 617,988,941 € (74,277,460) € (37,851,952) € (112,129,412) € 74,348,012 € 0 € 74,348,012 1.19 0.0% € (9,323,871) € (16,256,035) € (25,579,906) € (137,709,318) € 48,768,105 € 61,163,244 € 30,281,156 € 31,129,6406 86.00 € 9.86 € 209,047,231 € 827,036,173 € (74,277,460) € (42,400,275) € (116,677,734) € 92,369,497 € 0 € 92,369,497 1.29 0.0% € (10,452,362) € (20,479,284) € (30,931,645) € (147,609,380) € 61,437,852 € 122,601,095 € 34,680,066 € 65,809,7057 109.27 € 9.87 € 229,650,849 € 1,056,687,022 € (74,277,460) € (46,542,146) € (120,819,605) € 108,831,243 € 0 € 108,831,243 1.37 0.0% € (11,482,542) € (24,337,175) € (35,819,718) € (156,639,323) € 73,011,526 € 195,612,621 € 37,466,457 € 103,276,1628 134.45 € 9.88 € 248,680,813 € 1,305,367,835 € (74,277,460) € (50,357,760) € (124,635,220) € 124,045,593 € 0 € 124,045,593 1.45 0.0% € (12,434,041) € (27,902,888) € (40,336,929) € (164,972,149) € 83,708,665 € 279,321,286 € 39,050,710 € 142,326,8729 161.40 € 9.88 € 266,418,772 € 1,571,786,607 € (74,277,460) € (53,904,648) € (128,182,108) € 138,236,664 € 0 € 138,236,664 1.52 10.2% € (14,096,667) € (31,034,999) € (45,131,666) € (173,313,774) € 93,104,997 € 372,426,283 € 39,485,608 € 181,812,480
10 190.01 € 9.89 € 283,074,505 € 1,854,861,111 € (74,277,460) € (57,225,647) € (131,503,106) € 151,571,398 € 0 € 151,571,398 1.58 10.8% € (16,389,640) € (33,795,440) € (50,185,079) € (181,688,186) € 101,386,319 € 473,812,602 € 39,088,815 € 220,901,29511 214.31 € 9.90 € 240,593,104 € 2,095,454,215 € 0 € (48,595,133) € (48,595,133) € 191,997,970 € 0 € 191,997,970 1.71 12.1% € (23,176,328) € (42,205,411) € (65,381,738) € (113,976,872) € 126,616,232 € 600,428,834 € 44,378,217 € 265,279,51212 235.87 € 9.91 € 213,643,979 € 2,309,098,194 € 0 € (43,113,253) € (43,113,253) € 170,530,726 € 0 € 170,530,726 1.80 13.0% € (22,225,957) € (37,076,192) € (59,302,150) € (102,415,403) € 111,228,577 € 711,657,411 € 35,440,852 € 300,720,36413 255.43 € 9.92 € 194,072,239 € 2,503,170,433 € 0 € (39,127,739) € (39,127,739) € 154,944,500 € 0 € 154,944,500 1.88 13.8% € (21,446,395) € (33,374,526) € (54,820,921) € (93,948,661) € 100,123,579 € 811,780,989 € 29,002,234 € 329,722,59814 273.45 € 9.93 € 178,892,277 € 2,682,062,710 € 0 € (36,033,346) € (36,033,346) € 142,858,930 € 0 € 142,858,930 1.95 14.5% € (20,765,600) € (30,523,333) € (51,288,933) € (87,322,279) € 91,569,998 € 903,350,987 € 24,113,242 € 353,835,84115 290.21 € 9.94 € 166,625,443 € 2,848,688,153 € 0 € (33,530,207) € (33,530,207) € 133,095,236 € 0 € 133,095,236 2.01 15.1% € (20,154,646) € (28,235,148) € (48,389,793) € (81,920,000) € 84,705,443 € 988,056,429 € 20,277,810 € 374,113,65016 305.93 € 9.95 € 156,426,620 € 3,005,114,773 € 0 € (31,446,875) € (31,446,875) € 124,979,745 € 0 € 124,979,745 2.07 15.7% € (19,598,554) € (26,345,298) € (45,943,852) € (77,390,727) € 79,035,893 € 1,067,092,322 € 17,200,513 € 391,314,16317 320.77 € 9.96 € 147,766,575 € 3,152,881,348 € 0 € (29,675,958) € (29,675,958) € 118,090,617 € 0 € 118,090,617 2.12 16.2% € (19,088,036) € (24,750,645) € (43,838,681) € (73,514,640) € 74,251,936 € 1,141,344,258 € 14,690,350 € 406,004,51318 334.85 € 9.97 € 140,292,021 € 3,293,173,370 € 0 € (28,145,747) € (28,145,747) € 112,146,274 € 0 € 112,146,274 2.16 16.6% € (18,616,579) € (23,382,424) € (41,999,003) € (70,144,750) € 70,147,271 € 1,211,491,529 € 12,616,603 € 418,621,11619 348.25 € 9.98 € 133,755,665 € 3,426,929,035 € 0 € (26,806,035) € (26,806,035) € 106,949,630 € 0 € 106,949,630 2.20 17.0% € (18,179,242) € (22,192,597) € (40,371,839) € (67,177,874) € 66,577,791 € 1,278,069,320 € 10,886,001 € 429,507,11720 361.06 € 9.99 € 127,977,924 € 3,554,906,959 € 0 € (25,620,354) € (25,620,354) € 102,357,570 € 0 € 102,357,570 2.24 17.4% € (17,772,086) € (21,146,371) € (38,918,457) € (64,538,811) € 63,439,113 € 1,341,508,433 € 9,429,820 € 438,936,93721 373.34 € 10.00 € 122,824,495 € 3,677,731,454 € 0 € (24,561,424) € (24,561,424) € 98,263,071 € 0 € 98,263,071 2.27 17.7% € (17,391,865) € (20,217,802) € (37,609,666) € (62,171,090) € 60,653,405 € 1,402,161,838 € 8,196,129 € 447,133,06622 385.14 € 10.01 € 118,192,489 € 3,795,923,942 € 0 € (23,608,342) € (23,608,342) € 94,584,147 € 0 € 94,584,147 2.30 18.0% € (17,035,848) € (19,387,075) € (36,422,923) € (60,031,265) € 58,161,224 € 1,460,323,062 € 7,144,872 € 454,277,93823 396.52 € 10.02 € 114,001,474 € 3,909,925,416 € 0 € (22,744,765) € (22,744,765) € 91,256,709 € 0 € 91,256,709 2.33 18.3% € (16,701,703) € (18,638,751) € (35,340,454) € (58,085,220) € 55,916,254 € 1,516,239,316 € 6,244,624 € 460,522,56324 407.49 € 10.04 € 110,187,490 € 4,020,112,906 € 0 € (21,957,694) € (21,957,694) € 88,229,796 € 0 € 88,229,796 2.36 18.6% € (16,387,417) € (17,960,595) € (34,348,012) € (56,305,706) € 53,881,784 € 1,570,121,101 € 5,470,380 € 465,992,94325 418.11 € 10.05 € 106,698,918 € 4,126,811,824 € 0 € (21,236,633) € (21,236,633) € 85,462,284 € 0 € 85,462,284 2.38 18.8% € (16,091,237) € (17,342,762) € (33,433,999) € (54,670,632) € 52,028,285 € 1,622,149,386 € 4,802,003 € 470,794,945
DISCOUNTED CASH FLOW
TAXATION
REVENUE EXPLORATION & PRODUCTION COSTS
PETROLEUM PRODUCTION TAX (PPT)
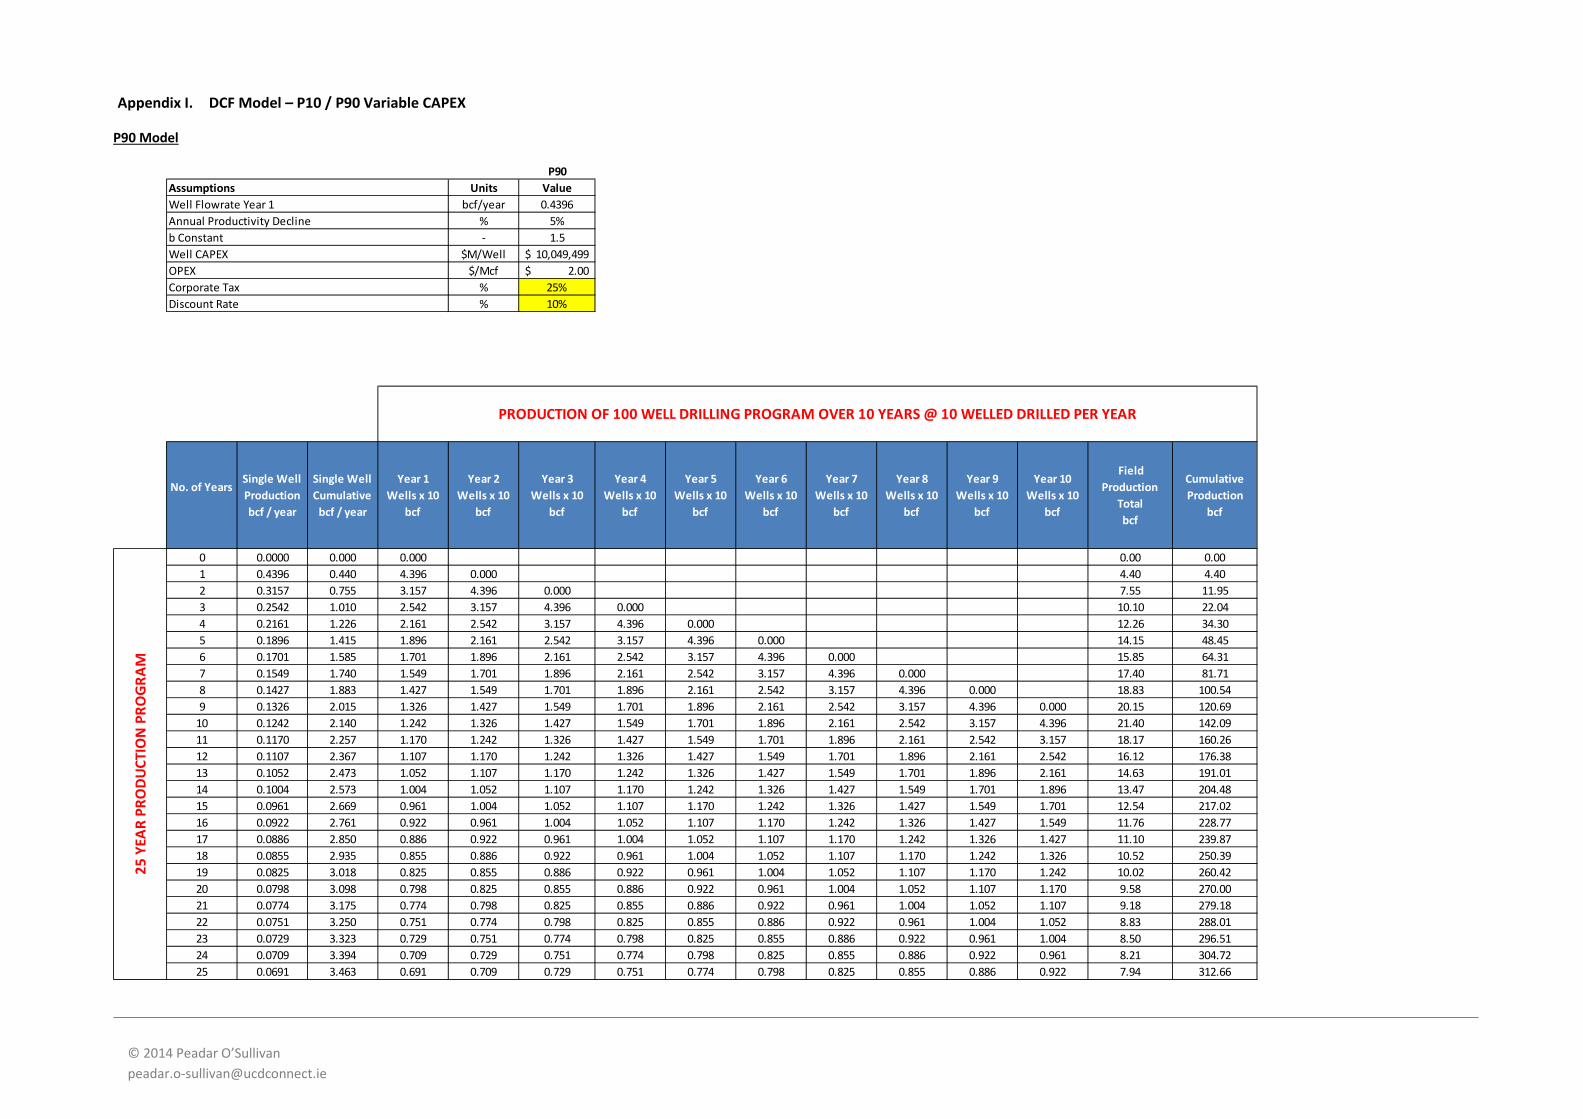
© 2014 Peadar O’Sullivan [email protected]
DCF Model – P10 / P90 Variable CAPEX Appendix I.
P90 Model
P90Units Value
bcf/year 0.4396% 5%- 1.5
$M/Well 10,049,499$ $/Mcf 2.00$
% 25%% 10%
No. of YearsSingle Well Production bcf / year
Single Well Cumulative
bcf / year
Year 1Wells x 10
bcf
Year 2Wells x 10
bcf
Year 3Wells x 10
bcf
Year 4Wells x 10
bcf
Year 5Wells x 10
bcf
Year 6Wells x 10
bcf
Year 7Wells x 10
bcf
Year 8Wells x 10
bcf
Year 9Wells x 10
bcf
Year 10Wells x 10
bcf
Field Production
Totalbcf
Cumulative Production
bcf
0 0.0000 0.000 0.000 0.00 0.001 0.4396 0.440 4.396 0.000 4.40 4.402 0.3157 0.755 3.157 4.396 0.000 7.55 11.953 0.2542 1.010 2.542 3.157 4.396 0.000 10.10 22.044 0.2161 1.226 2.161 2.542 3.157 4.396 0.000 12.26 34.305 0.1896 1.415 1.896 2.161 2.542 3.157 4.396 0.000 14.15 48.456 0.1701 1.585 1.701 1.896 2.161 2.542 3.157 4.396 0.000 15.85 64.317 0.1549 1.740 1.549 1.701 1.896 2.161 2.542 3.157 4.396 0.000 17.40 81.718 0.1427 1.883 1.427 1.549 1.701 1.896 2.161 2.542 3.157 4.396 0.000 18.83 100.549 0.1326 2.015 1.326 1.427 1.549 1.701 1.896 2.161 2.542 3.157 4.396 0.000 20.15 120.69
10 0.1242 2.140 1.242 1.326 1.427 1.549 1.701 1.896 2.161 2.542 3.157 4.396 21.40 142.0911 0.1170 2.257 1.170 1.242 1.326 1.427 1.549 1.701 1.896 2.161 2.542 3.157 18.17 160.2612 0.1107 2.367 1.107 1.170 1.242 1.326 1.427 1.549 1.701 1.896 2.161 2.542 16.12 176.3813 0.1052 2.473 1.052 1.107 1.170 1.242 1.326 1.427 1.549 1.701 1.896 2.161 14.63 191.0114 0.1004 2.573 1.004 1.052 1.107 1.170 1.242 1.326 1.427 1.549 1.701 1.896 13.47 204.4815 0.0961 2.669 0.961 1.004 1.052 1.107 1.170 1.242 1.326 1.427 1.549 1.701 12.54 217.0216 0.0922 2.761 0.922 0.961 1.004 1.052 1.107 1.170 1.242 1.326 1.427 1.549 11.76 228.7717 0.0886 2.850 0.886 0.922 0.961 1.004 1.052 1.107 1.170 1.242 1.326 1.427 11.10 239.8718 0.0855 2.935 0.855 0.886 0.922 0.961 1.004 1.052 1.107 1.170 1.242 1.326 10.52 250.3919 0.0825 3.018 0.825 0.855 0.886 0.922 0.961 1.004 1.052 1.107 1.170 1.242 10.02 260.4220 0.0798 3.098 0.798 0.825 0.855 0.886 0.922 0.961 1.004 1.052 1.107 1.170 9.58 270.0021 0.0774 3.175 0.774 0.798 0.825 0.855 0.886 0.922 0.961 1.004 1.052 1.107 9.18 279.1822 0.0751 3.250 0.751 0.774 0.798 0.825 0.855 0.886 0.922 0.961 1.004 1.052 8.83 288.0123 0.0729 3.323 0.729 0.751 0.774 0.798 0.825 0.855 0.886 0.922 0.961 1.004 8.50 296.5124 0.0709 3.394 0.709 0.729 0.751 0.774 0.798 0.825 0.855 0.886 0.922 0.961 8.21 304.7225 0.0691 3.463 0.691 0.709 0.729 0.751 0.774 0.798 0.825 0.855 0.886 0.922 7.94 312.66
OPEX
AssumptionsWell Flowrate Year 1Annual Productivity Declineb ConstantWell CAPEX
25 Y
EAR
PRO
DUCT
ION
PRO
GRAM
Corporate TaxDiscount Rate
PRODUCTION OF 100 WELL DRILLING PROGRAM OVER 10 YEARS @ 10 WELLED DRILLED PER YEAR

© 2014 Peadar O’Sullivan [email protected]
No. of YearsCumulative Production
bcf
Gas Prices€/Mcf
Revenue€
Cummulative Revenue
€
CAPEX€/Well
OPEX€/Mcf
Total Pre Tax Expenditure
€
PPT Profit€
Losses Carried Forward
€
PPT Income€
PPT R FactorPPT Rate
%PPT Tax
€Corporation Tax
€Total Tax
€
Total Expenditure
€
Net Cash Flow
€
Cumulative Cash Flow
€
Present Value of Cash Flow
€
CumulativePresent Value
Cash Flow€
0 0.00 € 0.00 € 0 € 0 € 0 € 0 € 0 € 0 € 0 € 0 0.00 0.0% € 0 € 0 € 0 € 0 € 0 € 0 € 0 € 01 4.40 € 8.91 € 39,154,068 € 39,154,068 € (100,494,993) € (8,792,865) € (109,287,858) € (70,133,790) € (70,133,790) € 0 0.36 0.0% € (1,957,703) € 0 € (1,957,703) € (111,245,561) € (72,091,493) € (72,091,493) € (65,537,721) € (65,537,721)2 11.95 € 9.30 € 70,249,919 € 109,403,987 € (100,494,993) € (15,106,175) € (115,601,168) € (45,351,249) € (115,485,039) € 0 0.48 0.0% € (3,512,496) € 0 € (3,512,496) € (119,113,664) € (48,863,745) € (120,955,238) € (40,383,260) € (105,920,982)3 22.04 € 9.42 € 95,143,254 € 204,547,241 € (100,494,993) € (20,190,958) € (120,685,951) € (25,542,697) € (141,027,736) € 0 0.58 0.0% € (4,757,163) € 0 € (4,757,163) € (125,443,113) € (30,299,859) € (151,255,098) € (22,764,733) € (128,685,714)4 34.30 € 9.64 € 118,132,460 € 322,679,701 € (100,494,993) € (24,512,433) € (125,007,426) € (6,874,966) € (147,902,701) € 0 0.66 0.0% € (5,906,623) € 0 € (5,906,623) € (130,914,049) € (12,781,589) € (164,036,686) € (8,729,997) € (137,415,711)5 48.45 € 9.85 € 139,445,824 € 462,125,525 € (100,494,993) € (28,305,285) € (128,800,278) € 10,645,546 € (137,257,155) € 0 0.74 0.0% € (6,972,291) € 0 € (6,972,291) € (135,772,569) € 3,673,255 € (160,363,432) € 2,280,802 € (135,134,909)6 64.31 € 9.86 € 156,323,285 € 618,448,811 € (100,494,993) € (31,706,472) € (132,201,465) € 24,121,820 € (113,135,335) € 0 0.81 0.0% € (7,816,164) € 0 € (7,816,164) € (140,017,629) € 16,305,656 € (144,057,776) € 9,204,118 € (125,930,791)7 81.71 € 9.87 € 171,730,450 € 790,179,261 € (100,494,993) € (34,803,719) € (135,298,712) € 36,431,738 € (76,703,597) € 0 0.88 0.0% € (8,586,523) € 0 € (8,586,523) € (143,885,235) € 27,845,216 € (116,212,560) € 14,288,998 € (111,641,793)8 100.54 € 9.88 € 185,960,854 € 976,140,115 € (100,494,993) € (37,656,995) € (138,151,988) € 47,808,866 € (28,894,730) € 0 0.93 0.0% € (9,298,043) € 0 € (9,298,043) € (147,450,031) € 38,510,824 € (77,701,736) € 17,965,583 € (93,676,210)9 120.69 € 9.88 € 199,225,110 € 1,175,365,225 € (100,494,993) € (40,309,320) € (140,804,313) € 58,420,797 € 0 € 29,526,067 0.98 0.0% € (9,961,255) € (4,891,203) € (14,852,458) € (155,656,771) € 43,568,339 € (34,133,397) € 18,477,229 € (75,198,981)
10 142.09 € 9.89 € 211,680,089 € 1,387,045,314 € (100,494,993) € (42,792,727) € (143,287,720) € 68,392,369 € 0 € 68,392,369 1.03 0.0% € (10,584,004) € (14,452,091) € (25,036,096) € (168,323,816) € 43,356,273 € 9,222,876 € 16,715,720 € (58,483,260)11 160.26 € 9.90 € 179,912,951 € 1,566,958,265 € 0 € (36,338,921) € (36,338,921) € 143,574,030 € 0 € 143,574,030 1.13 0.0% € (8,995,648) € (33,644,596) € (42,640,243) € (78,979,165) € 100,933,787 € 110,156,663 € 35,376,677 € (23,106,584)12 176.38 € 9.91 € 159,760,684 € 1,726,718,950 € 0 € (32,239,630) € (32,239,630) € 127,521,054 € 0 € 127,521,054 1.21 0.0% € (7,988,034) € (29,883,255) € (37,871,289) € (70,110,919) € 89,649,765 € 199,806,428 € 28,565,178 € 5,458,59413 191.01 € 9.92 € 145,125,146 € 1,871,844,096 € 0 € (29,259,305) € (29,259,305) € 115,865,841 € 0 € 115,865,841 1.29 0.0% € (7,256,257) € (27,152,396) € (34,408,653) € (63,667,959) € 81,457,188 € 281,263,616 € 23,595,246 € 29,053,84014 204.48 € 9.93 € 133,773,732 € 2,005,617,828 € 0 € (26,945,351) € (26,945,351) € 106,828,381 € 0 € 106,828,381 1.35 0.0% € (6,688,687) € (25,034,924) € (31,723,610) € (58,668,962) € 75,104,771 € 356,368,387 € 19,777,434 € 48,831,27315 217.02 € 9.94 € 124,600,725 € 2,130,218,553 € 0 € (25,073,530) € (25,073,530) € 99,527,195 € 0 € 99,527,195 1.41 0.0% € (6,230,036) € (23,324,290) € (29,554,326) € (54,627,856) € 69,972,869 € 426,341,256 € 16,750,949 € 65,582,22216 228.77 € 9.95 € 116,974,155 € 2,247,192,708 € 0 € (23,515,637) € (23,515,637) € 93,458,517 € 0 € 93,458,517 1.46 0.0% € (5,848,708) € (21,902,452) € (27,751,160) € (51,266,797) € 65,707,357 € 492,048,613 € 14,299,835 € 79,882,05717 239.87 € 9.96 € 110,498,266 € 2,357,690,974 € 0 € (22,191,365) € (22,191,365) € 88,306,901 € 0 € 88,306,901 1.51 10.1% € (8,939,508) € (19,841,848) € (28,781,356) € (50,972,721) € 59,525,545 € 551,574,158 € 11,776,812 € 91,658,86918 250.39 € 9.97 € 104,908,874 € 2,462,599,848 € 0 € (21,047,089) € (21,047,089) € 83,861,785 € 0 € 83,861,785 1.55 10.5% € (8,846,742) € (18,753,761) € (27,600,503) € (48,647,592) € 56,261,282 € 607,835,440 € 10,119,086 € 101,777,95519 260.42 € 9.98 € 100,021,057 € 2,562,620,905 € 0 € (20,045,267) € (20,045,267) € 79,975,790 € 0 € 79,975,790 1.59 10.9% € (8,751,327) € (17,806,116) € (26,557,443) € (46,602,710) € 53,418,347 € 661,253,787 € 8,734,327 € 110,512,28220 270.00 € 9.99 € 95,700,524 € 2,658,321,428 € 0 € (19,158,627) € (19,158,627) € 76,541,897 € 0 € 76,541,897 1.63 11.3% € (8,655,028) € (16,971,717) € (25,626,745) € (44,785,372) € 50,915,152 € 712,168,939 € 7,568,213 € 118,080,49521 279.18 € 10.00 € 91,846,845 € 2,750,168,273 € 0 € (18,366,770) € (18,366,770) € 73,480,075 € 0 € 73,480,075 1.66 11.6% € (8,559,054) € (16,230,255) € (24,789,309) € (43,156,079) € 48,690,765 € 760,859,704 € 6,579,611 € 124,660,10522 288.01 € 10.01 € 88,383,080 € 2,838,551,353 € 0 € (17,654,066) € (17,654,066) € 70,729,014 € 0 € 70,729,014 1.70 12.0% € (8,464,235) € (15,566,195) € (24,030,430) € (41,684,496) € 46,698,584 € 807,558,288 € 5,736,733 € 130,396,83823 296.51 € 10.02 € 85,249,084 € 2,923,800,436 € 0 € (17,008,292) € (17,008,292) € 68,240,791 € 0 € 68,240,791 1.73 12.3% € (8,371,136) € (14,967,414) € (23,338,550) € (40,346,842) € 44,902,242 € 852,460,530 € 5,014,600 € 135,411,43824 304.72 € 10.04 € 82,397,027 € 3,006,197,463 € 0 € (16,419,729) € (16,419,729) € 65,977,299 € 0 € 65,977,299 1.75 12.5% € (8,280,133) € (14,424,291) € (22,704,424) € (39,124,153) € 43,272,874 € 895,733,404 € 4,393,304 € 139,804,74325 312.66 € 10.05 € 79,788,310 € 3,085,985,774 € 0 € (15,880,527) € (15,880,527) € 63,907,783 € 0 € 63,907,783 1.78 12.8% € (8,191,473) € (13,929,078) € (22,120,550) € (38,001,078) € 41,787,233 € 937,520,637 € 3,856,794 € 143,661,537
DISCOUNTED CASH FLOW
TAXATION
REVENUE EXPLORATION & PRODUCTION COSTS
PETROLEUM PRODUCTION TAX (PPT)

© 2014 Peadar O’Sullivan [email protected]
P10 Model
P10Units Value
bcf/year 0.4396% 5%- 1.5
$M/Well 5,846,374$ $/Mcf 2.00$
% 25%% 10%
No. of YearsSingle Well Production bcf / year
Single Well Cumulative
bcf / year
Year 1Wells x 10
bcf
Year 2Wells x 10
bcf
Year 3Wells x 10
bcf
Year 4Wells x 10
bcf
Year 5Wells x 10
bcf
Year 6Wells x 10
bcf
Year 7Wells x 10
bcf
Year 8Wells x 10
bcf
Year 9Wells x 10
bcf
Year 10Wells x 10
bcf
Field Production
Totalbcf
Cumulative Production
bcf
0 0.0000 0.000 0.000 0.00 0.001 0.4396 0.440 4.396 0.000 4.40 4.402 0.3157 0.755 3.157 4.396 0.000 7.55 11.953 0.2542 1.010 2.542 3.157 4.396 0.000 10.10 22.044 0.2161 1.226 2.161 2.542 3.157 4.396 0.000 12.26 34.305 0.1896 1.415 1.896 2.161 2.542 3.157 4.396 0.000 14.15 48.456 0.1701 1.585 1.701 1.896 2.161 2.542 3.157 4.396 0.000 15.85 64.317 0.1549 1.740 1.549 1.701 1.896 2.161 2.542 3.157 4.396 0.000 17.40 81.718 0.1427 1.883 1.427 1.549 1.701 1.896 2.161 2.542 3.157 4.396 0.000 18.83 100.549 0.1326 2.015 1.326 1.427 1.549 1.701 1.896 2.161 2.542 3.157 4.396 0.000 20.15 120.69
10 0.1242 2.140 1.242 1.326 1.427 1.549 1.701 1.896 2.161 2.542 3.157 4.396 21.40 142.0911 0.1170 2.257 1.170 1.242 1.326 1.427 1.549 1.701 1.896 2.161 2.542 3.157 18.17 160.2612 0.1107 2.367 1.107 1.170 1.242 1.326 1.427 1.549 1.701 1.896 2.161 2.542 16.12 176.3813 0.1052 2.473 1.052 1.107 1.170 1.242 1.326 1.427 1.549 1.701 1.896 2.161 14.63 191.0114 0.1004 2.573 1.004 1.052 1.107 1.170 1.242 1.326 1.427 1.549 1.701 1.896 13.47 204.4815 0.0961 2.669 0.961 1.004 1.052 1.107 1.170 1.242 1.326 1.427 1.549 1.701 12.54 217.0216 0.0922 2.761 0.922 0.961 1.004 1.052 1.107 1.170 1.242 1.326 1.427 1.549 11.76 228.7717 0.0886 2.850 0.886 0.922 0.961 1.004 1.052 1.107 1.170 1.242 1.326 1.427 11.10 239.8718 0.0855 2.935 0.855 0.886 0.922 0.961 1.004 1.052 1.107 1.170 1.242 1.326 10.52 250.3919 0.0825 3.018 0.825 0.855 0.886 0.922 0.961 1.004 1.052 1.107 1.170 1.242 10.02 260.4220 0.0798 3.098 0.798 0.825 0.855 0.886 0.922 0.961 1.004 1.052 1.107 1.170 9.58 270.0021 0.0774 3.175 0.774 0.798 0.825 0.855 0.886 0.922 0.961 1.004 1.052 1.107 9.18 279.1822 0.0751 3.250 0.751 0.774 0.798 0.825 0.855 0.886 0.922 0.961 1.004 1.052 8.83 288.0123 0.0729 3.323 0.729 0.751 0.774 0.798 0.825 0.855 0.886 0.922 0.961 1.004 8.50 296.5124 0.0709 3.394 0.709 0.729 0.751 0.774 0.798 0.825 0.855 0.886 0.922 0.961 8.21 304.7225 0.0691 3.463 0.691 0.709 0.729 0.751 0.774 0.798 0.825 0.855 0.886 0.922 7.94 312.66
OPEX
AssumptionsWell Flowrate Year 1Annual Productivity Declineb ConstantWell CAPEX
25 Y
EAR
PRO
DUCT
ION
PRO
GRAM
Corporate TaxDiscount Rate
PRODUCTION OF 100 WELL DRILLING PROGRAM OVER 10 YEARS @ 10 WELLED DRILLED PER YEAR

© 2014 Peadar O’Sullivan [email protected]
No. of YearsCumulative Production
bcf
Gas Prices€/Mcf
Revenue€
Cummulative Revenue
€
CAPEX€/Well
OPEX€/Mcf
Total Pre Tax Expenditure
€
PPT Profit€
Losses Carried Forward
€
PPT Income€
PPT R FactorPPT Rate
%PPT Tax
€Corporation Tax
€Total Tax
€
Total Expenditure
€
Net Cash Flow
€
Cumulative Cash Flow
€
Present Value of Cash Flow
€
CumulativePresent Value
Cash Flow€
0 0.00 € 0.00 € 0 € 0 € 0 € 0 € 0 € 0 € 0 € 0 0.00 0.0% € 0 € 0 € 0 € 0 € 0 € 0 € 0 € 01 4.40 € 8.91 € 39,154,068 € 39,154,068 € (58,463,740) € (8,792,865) € (67,256,605) € (28,102,537) € (28,102,537) € 0 0.58 0.0% € (1,957,703) € 0 € (1,957,703) € (69,214,308) € (30,060,240) € (30,060,240) € (27,327,491) € (27,327,491)2 11.95 € 9.30 € 70,249,919 € 109,403,987 € (58,463,740) € (15,106,175) € (73,569,915) € (3,319,996) € (31,422,533) € 0 0.76 0.0% € (3,512,496) € 0 € (3,512,496) € (77,082,411) € (6,832,492) € (36,892,732) € (5,646,687) € (32,974,179)3 22.04 € 9.42 € 95,143,254 € 204,547,241 € (58,463,740) € (20,190,958) € (78,654,697) € 16,488,557 € (14,933,976) € 0 0.91 0.0% € (4,757,163) € 0 € (4,757,163) € (83,411,860) € 11,731,394 € (25,161,338) € 8,813,970 € (24,160,209)4 34.30 € 9.64 € 118,132,460 € 322,679,701 € (58,463,740) € (24,512,433) € (82,976,173) € 35,156,288 € 0 € 20,222,312 1.03 0.0% € (5,906,623) € (3,578,922) € (9,485,545) € (92,461,718) € 25,670,743 € 509,404 € 17,533,463 € (6,626,746)5 48.45 € 9.85 € 139,445,824 € 462,125,525 € (58,463,740) € (28,305,285) € (86,769,025) € 52,676,799 € 0 € 52,676,799 1.15 0.0% € (6,972,291) € (11,426,127) € (18,398,418) € (105,167,443) € 34,278,381 € 34,787,785 € 21,284,178 € 14,657,4326 64.31 € 9.86 € 156,323,285 € 618,448,811 € (58,463,740) € (31,706,472) € (90,170,212) € 66,153,074 € 0 € 66,153,074 1.24 0.0% € (7,816,164) € (14,584,227) € (22,400,392) € (112,570,603) € 43,752,682 € 78,540,467 € 24,697,248 € 39,354,6807 81.71 € 9.87 € 171,730,450 € 790,179,261 € (58,463,740) € (34,803,719) € (93,267,459) € 78,462,991 € 0 € 78,462,991 1.33 0.0% € (8,586,523) € (17,469,117) € (26,055,640) € (119,323,099) € 52,407,352 € 130,947,819 € 26,893,258 € 66,247,9388 100.54 € 9.88 € 185,960,854 € 976,140,115 € (58,463,740) € (37,656,995) € (96,120,735) € 89,840,120 € 0 € 89,840,120 1.40 0.0% € (9,298,043) € (20,135,519) € (29,433,562) € (125,554,297) € 60,406,558 € 191,354,377 € 28,180,105 € 94,428,0439 120.69 € 9.88 € 199,225,110 € 1,175,365,225 € (58,463,740) € (40,309,320) € (98,773,060) € 100,452,050 € 0 € 100,452,050 1.47 0.0% € (9,961,255) € (22,622,699) € (32,583,954) € (131,357,014) € 67,868,096 € 259,222,473 € 28,782,698 € 123,210,741
10 142.09 € 9.89 € 211,680,089 € 1,387,045,314 € (58,463,740) € (42,792,727) € (101,256,467) € 110,423,622 € 0 € 110,423,622 1.53 10.3% € (11,360,810) € (24,765,703) € (36,126,513) € (137,382,980) € 74,297,109 € 333,519,582 € 28,644,752 € 151,855,49211 160.26 € 9.90 € 179,912,951 € 1,566,958,265 € 0 € (36,338,921) € (36,338,921) € 143,574,030 € 0 € 143,574,030 1.65 11.5% € (16,563,775) € (31,752,564) € (48,316,339) € (84,655,260) € 95,257,692 € 428,777,273 € 33,387,240 € 185,242,73212 176.38 € 9.91 € 159,760,684 € 1,726,718,950 € 0 € (32,239,630) € (32,239,630) € 127,521,054 € 0 € 127,521,054 1.75 12.5% € (15,934,534) € (27,896,630) € (43,831,164) € (76,070,794) € 83,689,890 € 512,467,163 € 26,666,178 € 211,908,91013 191.01 € 9.92 € 145,125,146 € 1,871,844,096 € 0 € (29,259,305) € (29,259,305) € 115,865,841 € 0 € 115,865,841 1.83 13.3% € (15,413,072) € (25,113,192) € (40,526,264) € (69,785,569) € 75,339,577 € 587,806,740 € 21,823,192 € 233,732,10214 204.48 € 9.93 € 133,773,732 € 2,005,617,828 € 0 € (26,945,351) € (26,945,351) € 106,828,381 € 0 € 106,828,381 1.90 14.0% € (14,953,200) € (22,968,795) € (37,921,995) € (64,867,346) € 68,906,386 € 656,713,126 € 18,145,205 € 251,877,30715 217.02 € 9.94 € 124,600,725 € 2,130,218,553 € 0 € (25,073,530) € (25,073,530) € 99,527,195 € 0 € 99,527,195 1.96 14.6% € (14,537,122) € (21,247,518) € (35,784,640) € (60,858,170) € 63,742,555 € 720,455,681 € 15,259,461 € 267,136,76816 228.77 € 9.95 € 116,974,155 € 2,247,192,708 € 0 € (23,515,637) € (23,515,637) € 93,458,517 € 0 € 93,458,517 2.01 15.1% € (14,155,878) € (19,825,660) € (33,981,538) € (57,497,175) € 59,476,980 € 779,932,661 € 12,943,924 € 280,080,69217 239.87 € 9.96 € 110,498,266 € 2,357,690,974 € 0 € (22,191,365) € (22,191,365) € 88,306,901 € 0 € 88,306,901 2.06 15.6% € (13,803,964) € (18,625,734) € (32,429,699) € (54,621,063) € 55,877,203 € 835,809,864 € 11,055,007 € 291,135,69818 250.39 € 9.97 € 104,908,874 € 2,462,599,848 € 0 € (21,047,089) € (21,047,089) € 83,861,785 € 0 € 83,861,785 2.11 16.1% € (13,477,504) € (17,596,070) € (31,073,574) € (52,120,663) € 52,788,211 € 888,598,075 € 9,494,424 € 300,630,12219 260.42 € 9.98 € 100,021,057 € 2,562,620,905 € 0 € (20,045,267) € (20,045,267) € 79,975,790 € 0 € 79,975,790 2.15 16.5% € (13,173,516) € (16,700,569) € (29,874,084) € (49,919,351) € 50,101,706 € 938,699,781 € 8,192,029 € 308,822,15220 270.00 € 9.99 € 95,700,524 € 2,658,321,428 € 0 € (19,158,627) € (19,158,627) € 76,541,897 € 0 € 76,541,897 2.18 16.8% € (12,889,587) € (15,913,078) € (28,802,664) € (47,961,291) € 47,739,233 € 986,439,013 € 7,096,133 € 315,918,28421 279.18 € 10.00 € 91,846,845 € 2,750,168,273 € 0 € (18,366,770) € (18,366,770) € 73,480,075 € 0 € 73,480,075 2.22 17.2% € (12,623,699) € (15,214,094) € (27,837,793) € (46,204,563) € 45,642,282 € 1,032,081,295 € 6,167,668 € 322,085,95222 288.01 € 10.01 € 88,383,080 € 2,838,551,353 € 0 € (17,654,066) € (17,654,066) € 70,729,014 € 0 € 70,729,014 2.25 17.5% € (12,374,129) € (14,588,721) € (26,962,850) € (44,616,916) € 43,766,164 € 1,075,847,459 € 5,376,497 € 327,462,44923 296.51 € 10.02 € 85,249,084 € 2,923,800,436 € 0 € (17,008,292) € (17,008,292) € 68,240,791 € 0 € 68,240,791 2.28 17.8% € (12,139,390) € (14,025,350) € (26,164,740) € (43,173,033) € 42,076,051 € 1,117,923,510 € 4,698,976 € 332,161,42524 304.72 € 10.04 € 82,397,027 € 3,006,197,463 € 0 € (16,419,729) € (16,419,729) € 65,977,299 € 0 € 65,977,299 2.31 18.1% € (11,918,182) € (13,514,779) € (25,432,961) € (41,852,690) € 40,544,338 € 1,158,467,848 € 4,116,288 € 336,277,71325 312.66 € 10.05 € 79,788,310 € 3,085,985,774 € 0 € (15,880,527) € (15,880,527) € 63,907,783 € 0 € 63,907,783 2.33 18.3% € (11,709,364) € (13,049,605) € (24,758,969) € (40,639,496) € 39,148,814 € 1,197,616,662 € 3,613,279 € 339,890,992
DISCOUNTED CASH FLOW
TAXATION
REVENUE EXPLORATION & PRODUCTION COSTS
PETROLEUM PRODUCTION TAX (PPT)

© 2014 Peadar O’Sullivan [email protected]
DCF Model – P10 / P90 Variable OPEX Appendix J.
P90 Model
P90Units Value
bcf/year 0.4396% 5%- 1.5
$M/Well 7,427,746$ $/Mcf 2.60$
% 25%% 10%
No. of YearsSingle Well Production bcf / year
Single Well Cumulative
bcf / year
Year 1Wells x 10
bcf
Year 2Wells x 10
bcf
Year 3Wells x 10
bcf
Year 4Wells x 10
bcf
Year 5Wells x 10
bcf
Year 6Wells x 10
bcf
Year 7Wells x 10
bcf
Year 8Wells x 10
bcf
Year 9Wells x 10
bcf
Year 10Wells x 10
bcf
Field Production
Totalbcf
Cumulative Production
bcf
0 0.0000 0.000 0.000 0.00 0.001 0.4396 0.440 4.396 0.000 4.40 4.402 0.3157 0.755 3.157 4.396 0.000 7.55 11.953 0.2542 1.010 2.542 3.157 4.396 0.000 10.10 22.044 0.2161 1.226 2.161 2.542 3.157 4.396 0.000 12.26 34.305 0.1896 1.415 1.896 2.161 2.542 3.157 4.396 0.000 14.15 48.456 0.1701 1.585 1.701 1.896 2.161 2.542 3.157 4.396 0.000 15.85 64.317 0.1549 1.740 1.549 1.701 1.896 2.161 2.542 3.157 4.396 0.000 17.40 81.718 0.1427 1.883 1.427 1.549 1.701 1.896 2.161 2.542 3.157 4.396 0.000 18.83 100.549 0.1326 2.015 1.326 1.427 1.549 1.701 1.896 2.161 2.542 3.157 4.396 0.000 20.15 120.69
10 0.1242 2.140 1.242 1.326 1.427 1.549 1.701 1.896 2.161 2.542 3.157 4.396 21.40 142.0911 0.1170 2.257 1.170 1.242 1.326 1.427 1.549 1.701 1.896 2.161 2.542 3.157 18.17 160.2612 0.1107 2.367 1.107 1.170 1.242 1.326 1.427 1.549 1.701 1.896 2.161 2.542 16.12 176.3813 0.1052 2.473 1.052 1.107 1.170 1.242 1.326 1.427 1.549 1.701 1.896 2.161 14.63 191.0114 0.1004 2.573 1.004 1.052 1.107 1.170 1.242 1.326 1.427 1.549 1.701 1.896 13.47 204.4815 0.0961 2.669 0.961 1.004 1.052 1.107 1.170 1.242 1.326 1.427 1.549 1.701 12.54 217.0216 0.0922 2.761 0.922 0.961 1.004 1.052 1.107 1.170 1.242 1.326 1.427 1.549 11.76 228.7717 0.0886 2.850 0.886 0.922 0.961 1.004 1.052 1.107 1.170 1.242 1.326 1.427 11.10 239.8718 0.0855 2.935 0.855 0.886 0.922 0.961 1.004 1.052 1.107 1.170 1.242 1.326 10.52 250.3919 0.0825 3.018 0.825 0.855 0.886 0.922 0.961 1.004 1.052 1.107 1.170 1.242 10.02 260.4220 0.0798 3.098 0.798 0.825 0.855 0.886 0.922 0.961 1.004 1.052 1.107 1.170 9.58 270.0021 0.0774 3.175 0.774 0.798 0.825 0.855 0.886 0.922 0.961 1.004 1.052 1.107 9.18 279.1822 0.0751 3.250 0.751 0.774 0.798 0.825 0.855 0.886 0.922 0.961 1.004 1.052 8.83 288.0123 0.0729 3.323 0.729 0.751 0.774 0.798 0.825 0.855 0.886 0.922 0.961 1.004 8.50 296.5124 0.0709 3.394 0.709 0.729 0.751 0.774 0.798 0.825 0.855 0.886 0.922 0.961 8.21 304.7225 0.0691 3.463 0.691 0.709 0.729 0.751 0.774 0.798 0.825 0.855 0.886 0.922 7.94 312.66
OPEX
AssumptionsWell Flowrate Year 1Annual Productivity Declineb ConstantWell CAPEX
25 Y
EAR
PRO
DUCT
ION
PRO
GRAM
Corporate TaxDiscount Rate
PRODUCTION OF 100 WELL DRILLING PROGRAM OVER 10 YEARS @ 10 WELLED DRILLED PER YEAR
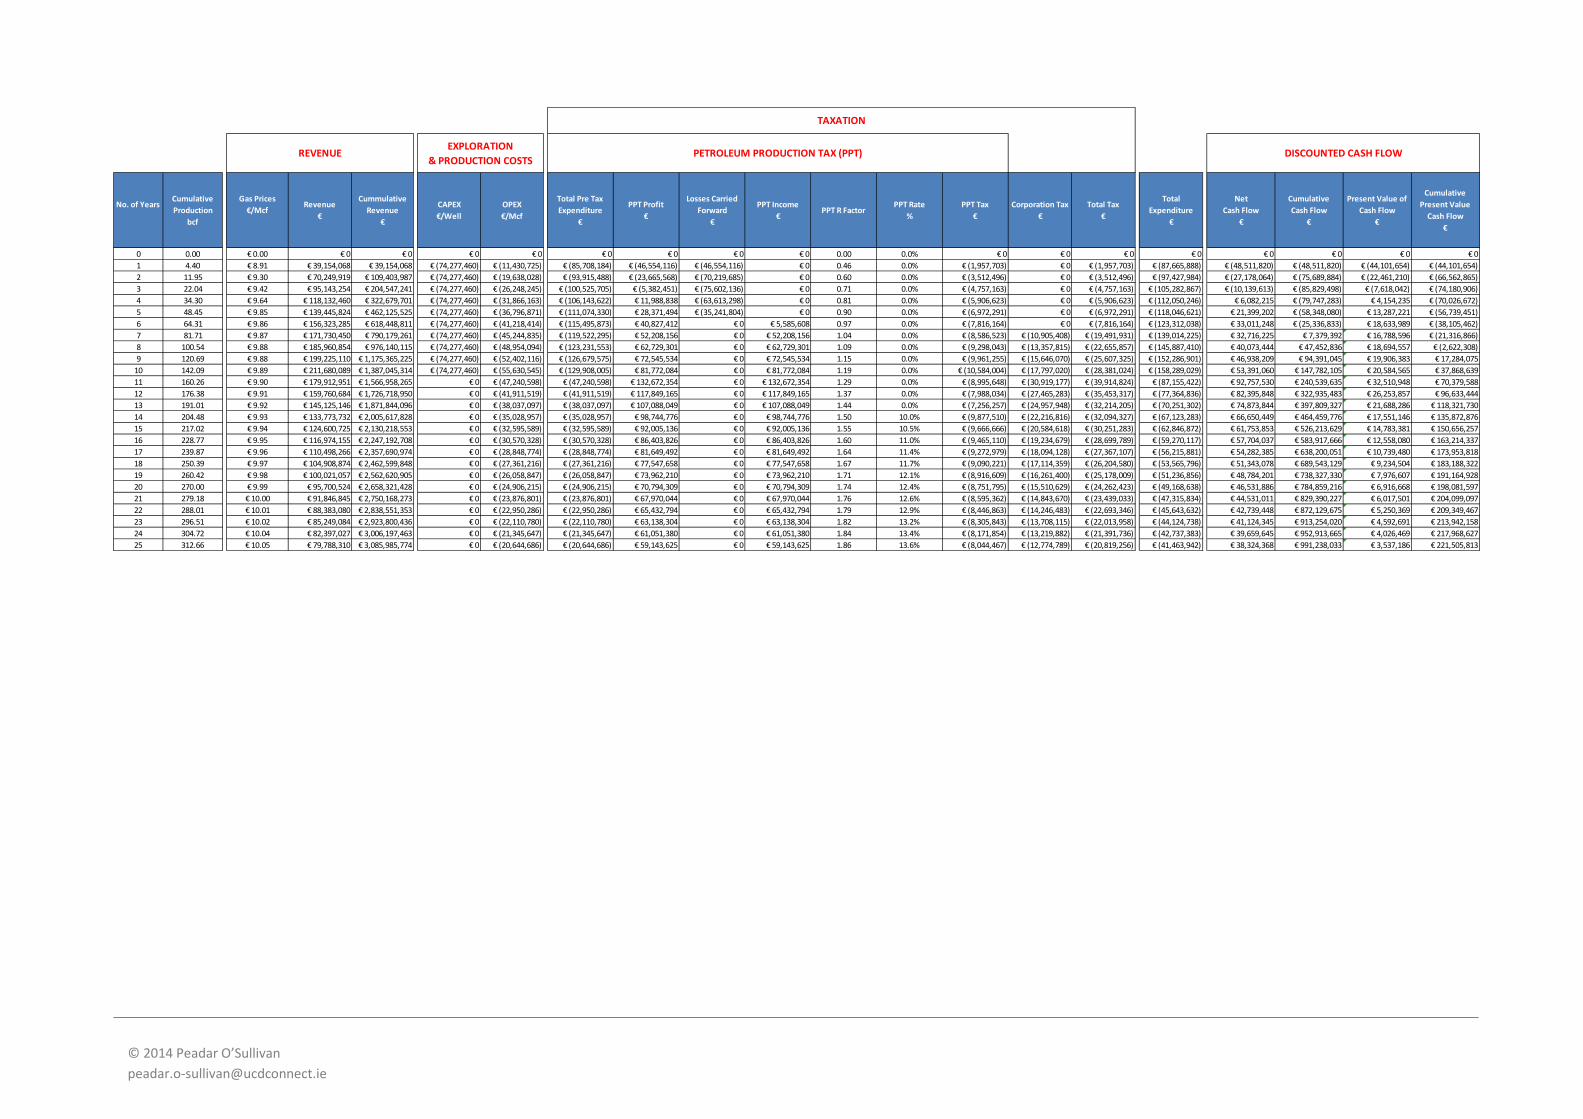
© 2014 Peadar O’Sullivan [email protected]
No. of YearsCumulative Production
bcf
Gas Prices€/Mcf
Revenue€
Cummulative Revenue
€
CAPEX€/Well
OPEX€/Mcf
Total Pre Tax Expenditure
€
PPT Profit€
Losses Carried Forward
€
PPT Income€
PPT R FactorPPT Rate
%PPT Tax
€Corporation Tax
€Total Tax
€
Total Expenditure
€
Net Cash Flow
€
Cumulative Cash Flow
€
Present Value of Cash Flow
€
CumulativePresent Value
Cash Flow€
0 0.00 € 0.00 € 0 € 0 € 0 € 0 € 0 € 0 € 0 € 0 0.00 0.0% € 0 € 0 € 0 € 0 € 0 € 0 € 0 € 01 4.40 € 8.91 € 39,154,068 € 39,154,068 € (74,277,460) € (11,430,725) € (85,708,184) € (46,554,116) € (46,554,116) € 0 0.46 0.0% € (1,957,703) € 0 € (1,957,703) € (87,665,888) € (48,511,820) € (48,511,820) € (44,101,654) € (44,101,654)2 11.95 € 9.30 € 70,249,919 € 109,403,987 € (74,277,460) € (19,638,028) € (93,915,488) € (23,665,568) € (70,219,685) € 0 0.60 0.0% € (3,512,496) € 0 € (3,512,496) € (97,427,984) € (27,178,064) € (75,689,884) € (22,461,210) € (66,562,865)3 22.04 € 9.42 € 95,143,254 € 204,547,241 € (74,277,460) € (26,248,245) € (100,525,705) € (5,382,451) € (75,602,136) € 0 0.71 0.0% € (4,757,163) € 0 € (4,757,163) € (105,282,867) € (10,139,613) € (85,829,498) € (7,618,042) € (74,180,906)4 34.30 € 9.64 € 118,132,460 € 322,679,701 € (74,277,460) € (31,866,163) € (106,143,622) € 11,988,838 € (63,613,298) € 0 0.81 0.0% € (5,906,623) € 0 € (5,906,623) € (112,050,246) € 6,082,215 € (79,747,283) € 4,154,235 € (70,026,672)5 48.45 € 9.85 € 139,445,824 € 462,125,525 € (74,277,460) € (36,796,871) € (111,074,330) € 28,371,494 € (35,241,804) € 0 0.90 0.0% € (6,972,291) € 0 € (6,972,291) € (118,046,621) € 21,399,202 € (58,348,080) € 13,287,221 € (56,739,451)6 64.31 € 9.86 € 156,323,285 € 618,448,811 € (74,277,460) € (41,218,414) € (115,495,873) € 40,827,412 € 0 € 5,585,608 0.97 0.0% € (7,816,164) € 0 € (7,816,164) € (123,312,038) € 33,011,248 € (25,336,833) € 18,633,989 € (38,105,462)7 81.71 € 9.87 € 171,730,450 € 790,179,261 € (74,277,460) € (45,244,835) € (119,522,295) € 52,208,156 € 0 € 52,208,156 1.04 0.0% € (8,586,523) € (10,905,408) € (19,491,931) € (139,014,225) € 32,716,225 € 7,379,392 € 16,788,596 € (21,316,866)8 100.54 € 9.88 € 185,960,854 € 976,140,115 € (74,277,460) € (48,954,094) € (123,231,553) € 62,729,301 € 0 € 62,729,301 1.09 0.0% € (9,298,043) € (13,357,815) € (22,655,857) € (145,887,410) € 40,073,444 € 47,452,836 € 18,694,557 € (2,622,308)9 120.69 € 9.88 € 199,225,110 € 1,175,365,225 € (74,277,460) € (52,402,116) € (126,679,575) € 72,545,534 € 0 € 72,545,534 1.15 0.0% € (9,961,255) € (15,646,070) € (25,607,325) € (152,286,901) € 46,938,209 € 94,391,045 € 19,906,383 € 17,284,075
10 142.09 € 9.89 € 211,680,089 € 1,387,045,314 € (74,277,460) € (55,630,545) € (129,908,005) € 81,772,084 € 0 € 81,772,084 1.19 0.0% € (10,584,004) € (17,797,020) € (28,381,024) € (158,289,029) € 53,391,060 € 147,782,105 € 20,584,565 € 37,868,63911 160.26 € 9.90 € 179,912,951 € 1,566,958,265 € 0 € (47,240,598) € (47,240,598) € 132,672,354 € 0 € 132,672,354 1.29 0.0% € (8,995,648) € (30,919,177) € (39,914,824) € (87,155,422) € 92,757,530 € 240,539,635 € 32,510,948 € 70,379,58812 176.38 € 9.91 € 159,760,684 € 1,726,718,950 € 0 € (41,911,519) € (41,911,519) € 117,849,165 € 0 € 117,849,165 1.37 0.0% € (7,988,034) € (27,465,283) € (35,453,317) € (77,364,836) € 82,395,848 € 322,935,483 € 26,253,857 € 96,633,44413 191.01 € 9.92 € 145,125,146 € 1,871,844,096 € 0 € (38,037,097) € (38,037,097) € 107,088,049 € 0 € 107,088,049 1.44 0.0% € (7,256,257) € (24,957,948) € (32,214,205) € (70,251,302) € 74,873,844 € 397,809,327 € 21,688,286 € 118,321,73014 204.48 € 9.93 € 133,773,732 € 2,005,617,828 € 0 € (35,028,957) € (35,028,957) € 98,744,776 € 0 € 98,744,776 1.50 10.0% € (9,877,510) € (22,216,816) € (32,094,327) € (67,123,283) € 66,650,449 € 464,459,776 € 17,551,146 € 135,872,87615 217.02 € 9.94 € 124,600,725 € 2,130,218,553 € 0 € (32,595,589) € (32,595,589) € 92,005,136 € 0 € 92,005,136 1.55 10.5% € (9,666,666) € (20,584,618) € (30,251,283) € (62,846,872) € 61,753,853 € 526,213,629 € 14,783,381 € 150,656,25716 228.77 € 9.95 € 116,974,155 € 2,247,192,708 € 0 € (30,570,328) € (30,570,328) € 86,403,826 € 0 € 86,403,826 1.60 11.0% € (9,465,110) € (19,234,679) € (28,699,789) € (59,270,117) € 57,704,037 € 583,917,666 € 12,558,080 € 163,214,33717 239.87 € 9.96 € 110,498,266 € 2,357,690,974 € 0 € (28,848,774) € (28,848,774) € 81,649,492 € 0 € 81,649,492 1.64 11.4% € (9,272,979) € (18,094,128) € (27,367,107) € (56,215,881) € 54,282,385 € 638,200,051 € 10,739,480 € 173,953,81818 250.39 € 9.97 € 104,908,874 € 2,462,599,848 € 0 € (27,361,216) € (27,361,216) € 77,547,658 € 0 € 77,547,658 1.67 11.7% € (9,090,221) € (17,114,359) € (26,204,580) € (53,565,796) € 51,343,078 € 689,543,129 € 9,234,504 € 183,188,32219 260.42 € 9.98 € 100,021,057 € 2,562,620,905 € 0 € (26,058,847) € (26,058,847) € 73,962,210 € 0 € 73,962,210 1.71 12.1% € (8,916,609) € (16,261,400) € (25,178,009) € (51,236,856) € 48,784,201 € 738,327,330 € 7,976,607 € 191,164,92820 270.00 € 9.99 € 95,700,524 € 2,658,321,428 € 0 € (24,906,215) € (24,906,215) € 70,794,309 € 0 € 70,794,309 1.74 12.4% € (8,751,795) € (15,510,629) € (24,262,423) € (49,168,638) € 46,531,886 € 784,859,216 € 6,916,668 € 198,081,59721 279.18 € 10.00 € 91,846,845 € 2,750,168,273 € 0 € (23,876,801) € (23,876,801) € 67,970,044 € 0 € 67,970,044 1.76 12.6% € (8,595,362) € (14,843,670) € (23,439,033) € (47,315,834) € 44,531,011 € 829,390,227 € 6,017,501 € 204,099,09722 288.01 € 10.01 € 88,383,080 € 2,838,551,353 € 0 € (22,950,286) € (22,950,286) € 65,432,794 € 0 € 65,432,794 1.79 12.9% € (8,446,863) € (14,246,483) € (22,693,346) € (45,643,632) € 42,739,448 € 872,129,675 € 5,250,369 € 209,349,46723 296.51 € 10.02 € 85,249,084 € 2,923,800,436 € 0 € (22,110,780) € (22,110,780) € 63,138,304 € 0 € 63,138,304 1.82 13.2% € (8,305,843) € (13,708,115) € (22,013,958) € (44,124,738) € 41,124,345 € 913,254,020 € 4,592,691 € 213,942,15824 304.72 € 10.04 € 82,397,027 € 3,006,197,463 € 0 € (21,345,647) € (21,345,647) € 61,051,380 € 0 € 61,051,380 1.84 13.4% € (8,171,854) € (13,219,882) € (21,391,736) € (42,737,383) € 39,659,645 € 952,913,665 € 4,026,469 € 217,968,62725 312.66 € 10.05 € 79,788,310 € 3,085,985,774 € 0 € (20,644,686) € (20,644,686) € 59,143,625 € 0 € 59,143,625 1.86 13.6% € (8,044,467) € (12,774,789) € (20,819,256) € (41,463,942) € 38,324,368 € 991,238,033 € 3,537,186 € 221,505,813
DISCOUNTED CASH FLOW
TAXATION
REVENUE EXPLORATION & PRODUCTION COSTS
PETROLEUM PRODUCTION TAX (PPT)
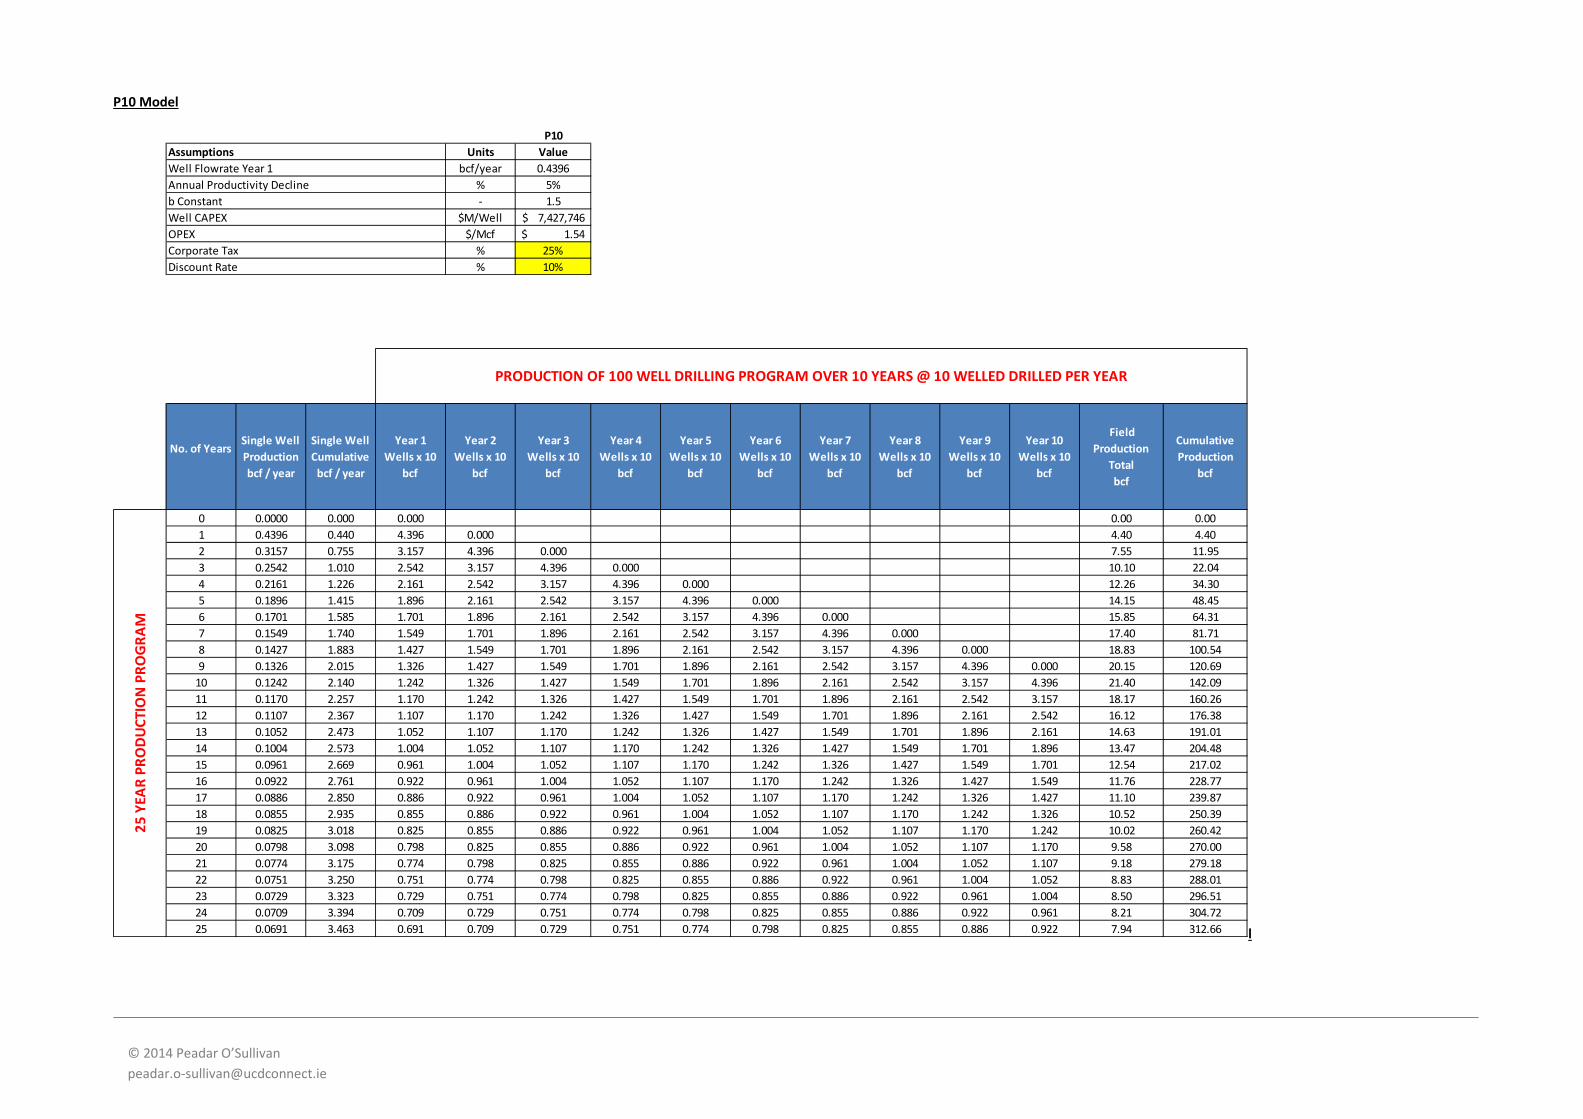
© 2014 Peadar O’Sullivan [email protected]
P10 Model
l
P10Units Value
bcf/year 0.4396% 5%- 1.5
$M/Well 7,427,746$ $/Mcf 1.54$
% 25%% 10%
No. of YearsSingle Well Production bcf / year
Single Well Cumulative
bcf / year
Year 1Wells x 10
bcf
Year 2Wells x 10
bcf
Year 3Wells x 10
bcf
Year 4Wells x 10
bcf
Year 5Wells x 10
bcf
Year 6Wells x 10
bcf
Year 7Wells x 10
bcf
Year 8Wells x 10
bcf
Year 9Wells x 10
bcf
Year 10Wells x 10
bcf
Field Production
Totalbcf
Cumulative Production
bcf
0 0.0000 0.000 0.000 0.00 0.001 0.4396 0.440 4.396 0.000 4.40 4.402 0.3157 0.755 3.157 4.396 0.000 7.55 11.953 0.2542 1.010 2.542 3.157 4.396 0.000 10.10 22.044 0.2161 1.226 2.161 2.542 3.157 4.396 0.000 12.26 34.305 0.1896 1.415 1.896 2.161 2.542 3.157 4.396 0.000 14.15 48.456 0.1701 1.585 1.701 1.896 2.161 2.542 3.157 4.396 0.000 15.85 64.317 0.1549 1.740 1.549 1.701 1.896 2.161 2.542 3.157 4.396 0.000 17.40 81.718 0.1427 1.883 1.427 1.549 1.701 1.896 2.161 2.542 3.157 4.396 0.000 18.83 100.549 0.1326 2.015 1.326 1.427 1.549 1.701 1.896 2.161 2.542 3.157 4.396 0.000 20.15 120.69
10 0.1242 2.140 1.242 1.326 1.427 1.549 1.701 1.896 2.161 2.542 3.157 4.396 21.40 142.0911 0.1170 2.257 1.170 1.242 1.326 1.427 1.549 1.701 1.896 2.161 2.542 3.157 18.17 160.2612 0.1107 2.367 1.107 1.170 1.242 1.326 1.427 1.549 1.701 1.896 2.161 2.542 16.12 176.3813 0.1052 2.473 1.052 1.107 1.170 1.242 1.326 1.427 1.549 1.701 1.896 2.161 14.63 191.0114 0.1004 2.573 1.004 1.052 1.107 1.170 1.242 1.326 1.427 1.549 1.701 1.896 13.47 204.4815 0.0961 2.669 0.961 1.004 1.052 1.107 1.170 1.242 1.326 1.427 1.549 1.701 12.54 217.0216 0.0922 2.761 0.922 0.961 1.004 1.052 1.107 1.170 1.242 1.326 1.427 1.549 11.76 228.7717 0.0886 2.850 0.886 0.922 0.961 1.004 1.052 1.107 1.170 1.242 1.326 1.427 11.10 239.8718 0.0855 2.935 0.855 0.886 0.922 0.961 1.004 1.052 1.107 1.170 1.242 1.326 10.52 250.3919 0.0825 3.018 0.825 0.855 0.886 0.922 0.961 1.004 1.052 1.107 1.170 1.242 10.02 260.4220 0.0798 3.098 0.798 0.825 0.855 0.886 0.922 0.961 1.004 1.052 1.107 1.170 9.58 270.0021 0.0774 3.175 0.774 0.798 0.825 0.855 0.886 0.922 0.961 1.004 1.052 1.107 9.18 279.1822 0.0751 3.250 0.751 0.774 0.798 0.825 0.855 0.886 0.922 0.961 1.004 1.052 8.83 288.0123 0.0729 3.323 0.729 0.751 0.774 0.798 0.825 0.855 0.886 0.922 0.961 1.004 8.50 296.5124 0.0709 3.394 0.709 0.729 0.751 0.774 0.798 0.825 0.855 0.886 0.922 0.961 8.21 304.7225 0.0691 3.463 0.691 0.709 0.729 0.751 0.774 0.798 0.825 0.855 0.886 0.922 7.94 312.66
OPEX
AssumptionsWell Flowrate Year 1Annual Productivity Declineb ConstantWell CAPEX
25 Y
EAR
PRO
DUCT
ION
PRO
GRAM
Corporate TaxDiscount Rate
PRODUCTION OF 100 WELL DRILLING PROGRAM OVER 10 YEARS @ 10 WELLED DRILLED PER YEAR

© 2014 Peadar O’Sullivan [email protected]
No. of YearsCumulative Production
bcf
Gas Prices€/Mcf
Revenue€
Cummulative Revenue
€
CAPEX€/Well
OPEX€/Mcf
Total Pre Tax Expenditure
€
PPT Profit€
Losses Carried Forward
€
PPT Income€
PPT R FactorPPT Rate
%PPT Tax
€Corporation Tax
€Total Tax
€
Total Expenditure
€
Net Cash Flow
€
Cumulative Cash Flow
€
Present Value of Cash Flow
€
CumulativePresent Value
Cash Flow€
0 0.00 € 0.00 € 0 € 0 € 0 € 0 € 0 € 0 € 0 € 0 0.00 0.0% € 0 € 0 € 0 € 0 € 0 € 0 € 0 € 01 4.40 € 8.91 € 39,154,068 € 39,154,068 € (74,277,460) € (6,770,506) € (81,047,966) € (41,893,898) € (41,893,898) € 0 0.48 0.0% € (1,957,703) € 0 € (1,957,703) € (83,005,669) € (43,851,601) € (43,851,601) € (39,865,092) € (39,865,092)2 11.95 € 9.30 € 70,249,919 € 109,403,987 € (74,277,460) € (11,631,755) € (85,909,215) € (15,659,295) € (57,553,193) € 0 0.64 0.0% € (3,512,496) € 0 € (3,512,496) € (89,421,711) € (19,171,791) € (63,023,393) € (15,844,456) € (55,709,548)3 22.04 € 9.42 € 95,143,254 € 204,547,241 € (74,277,460) € (15,547,038) € (89,824,497) € 5,318,757 € (52,234,436) € 0 0.78 0.0% € (4,757,163) € 0 € (4,757,163) € (94,581,660) € 561,594 € (62,461,798) € 421,934 € (55,287,614)4 34.30 € 9.64 € 118,132,460 € 322,679,701 € (74,277,460) € (18,874,573) € (93,152,033) € 24,980,427 € (27,254,009) € 0 0.89 0.0% € (5,906,623) € 0 € (5,906,623) € (99,058,656) € 19,073,804 € (43,387,994) € 13,027,665 € (42,259,949)5 48.45 € 9.85 € 139,445,824 € 462,125,525 € (74,277,460) € (21,795,070) € (96,072,529) € 43,373,295 € 0 € 16,119,286 1.00 0.0% € (6,972,291) € (2,286,749) € (9,259,040) € (105,331,569) € 34,114,255 € (9,273,739) € 21,182,268 € (21,077,680)6 64.31 € 9.86 € 156,323,285 € 618,448,811 € (74,277,460) € (24,413,984) € (98,691,443) € 57,631,842 € 0 € 57,631,842 1.09 0.0% € (7,816,164) € (12,453,919) € (20,270,084) € (118,961,527) € 37,361,758 € 28,088,019 € 21,089,739 € 12,0587 81.71 € 9.87 € 171,730,450 € 790,179,261 € (74,277,460) € (26,798,864) € (101,076,323) € 70,654,127 € 0 € 70,654,127 1.18 0.0% € (8,586,523) € (15,516,901) € (24,103,424) € (125,179,747) € 46,550,703 € 74,638,723 € 23,887,871 € 23,899,9308 100.54 € 9.88 € 185,960,854 € 976,140,115 € (74,277,460) € (28,995,886) € (103,273,346) € 82,687,509 € 0 € 82,687,509 1.25 0.0% € (9,298,043) € (18,347,366) € (27,645,409) € (130,918,755) € 55,042,099 € 129,680,822 € 25,677,546 € 49,577,4759 120.69 € 9.88 € 199,225,110 € 1,175,365,225 € (74,277,460) € (31,038,176) € (105,315,636) € 93,909,474 € 0 € 93,909,474 1.32 0.0% € (9,961,255) € (20,987,055) € (30,948,310) € (136,263,946) € 62,961,164 € 192,641,986 € 26,701,680 € 76,279,155
10 142.09 € 9.89 € 211,680,089 € 1,387,045,314 € (74,277,460) € (32,950,400) € (107,227,859) € 104,452,230 € 0 € 104,452,230 1.38 0.0% € (10,584,004) € (23,467,056) € (34,051,061) € (141,278,920) € 70,401,169 € 263,043,155 € 27,142,698 € 103,421,85311 160.26 € 9.90 € 179,912,951 € 1,566,958,265 € 0 € (27,980,969) € (27,980,969) € 151,931,982 € 0 € 151,931,982 1.51 10.1% € (15,396,603) € (34,133,845) € (49,530,448) € (77,511,417) € 102,401,534 € 365,444,689 € 35,891,113 € 139,312,96612 176.38 € 9.91 € 159,760,684 € 1,726,718,950 € 0 € (24,824,515) € (24,824,515) € 134,936,169 € 0 € 134,936,169 1.62 11.2% € (15,094,867) € (29,960,326) € (45,055,192) € (69,879,707) € 89,880,977 € 455,325,666 € 28,638,849 € 167,951,81513 191.01 € 9.92 € 145,125,146 € 1,871,844,096 € 0 € (22,529,665) € (22,529,665) € 122,595,481 € 0 € 122,595,481 1.71 12.1% € (14,820,538) € (26,943,736) € (41,764,274) € (64,293,939) € 80,831,207 € 536,156,873 € 23,413,921 € 191,365,73714 204.48 € 9.93 € 133,773,732 € 2,005,617,828 € 0 € (20,747,921) € (20,747,921) € 113,025,812 € 0 € 113,025,812 1.79 12.9% € (14,555,936) € (24,617,469) € (39,173,405) € (59,921,325) € 73,852,407 € 610,009,280 € 19,447,647 € 210,813,38415 217.02 € 9.94 € 124,600,725 € 2,130,218,553 € 0 € (19,306,618) € (19,306,618) € 105,294,107 € 0 € 105,294,107 1.86 13.6% € (14,298,632) € (22,748,869) € (37,047,501) € (56,354,119) € 68,246,606 € 678,255,886 € 16,337,695 € 227,151,07916 228.77 € 9.95 € 116,974,155 € 2,247,192,708 € 0 € (18,107,041) € (18,107,041) € 98,867,114 € 0 € 98,867,114 1.92 14.2% € (14,049,113) € (21,204,500) € (35,253,613) € (53,360,654) € 63,613,501 € 741,869,387 € 13,844,151 € 240,995,23017 239.87 € 9.96 € 110,498,266 € 2,357,690,974 € 0 € (17,087,351) € (17,087,351) € 93,410,915 € 0 € 93,410,915 1.98 14.8% € (13,808,157) € (19,900,689) € (33,708,847) € (50,796,198) € 59,702,068 € 801,571,455 € 11,811,736 € 252,806,96618 250.39 € 9.97 € 104,908,874 € 2,462,599,848 € 0 € (16,206,259) € (16,206,259) € 88,702,616 € 0 € 88,702,616 2.03 15.3% € (13,576,295) € (18,781,580) € (32,357,875) € (48,564,134) € 56,344,741 € 857,916,196 € 10,134,097 € 262,941,06319 260.42 € 9.98 € 100,021,057 € 2,562,620,905 € 0 € (15,434,855) € (15,434,855) € 84,586,201 € 0 € 84,586,201 2.08 15.8% € (13,353,757) € (17,808,111) € (31,161,868) € (46,596,724) € 53,424,333 € 911,340,529 € 8,735,305 € 271,676,36820 270.00 € 9.99 € 95,700,524 € 2,658,321,428 € 0 € (14,752,142) € (14,752,142) € 80,948,381 € 0 € 80,948,381 2.12 16.2% € (13,140,542) € (16,951,960) € (30,092,502) € (44,844,645) € 50,855,879 € 962,196,408 € 7,559,402 € 279,235,77021 279.18 € 10.00 € 91,846,845 € 2,750,168,273 € 0 € (14,142,413) € (14,142,413) € 77,704,432 € 0 € 77,704,432 2.16 16.6% € (12,936,483) € (16,191,987) € (29,128,470) € (43,270,883) € 48,575,961 € 1,010,772,369 € 6,564,097 € 285,799,86822 288.01 € 10.01 € 88,383,080 € 2,838,551,353 € 0 € (13,593,631) € (13,593,631) € 74,789,449 € 0 € 74,789,449 2.20 17.0% € (12,741,308) € (15,512,035) € (28,253,343) € (41,846,974) € 46,536,106 € 1,057,308,475 € 5,716,773 € 291,516,64123 296.51 € 10.02 € 85,249,084 € 2,923,800,436 € 0 € (13,096,385) € (13,096,385) € 72,152,698 € 0 € 72,152,698 2.24 17.4% € (12,554,681) € (14,899,504) € (27,454,186) € (40,550,571) € 44,698,513 € 1,102,006,988 € 4,991,848 € 296,508,48824 304.72 € 10.04 € 82,397,027 € 3,006,197,463 € 0 € (12,643,191) € (12,643,191) € 69,753,836 € 0 € 69,753,836 2.27 17.7% € (12,376,234) € (14,344,401) € (26,720,634) € (39,363,825) € 43,033,202 € 1,145,040,190 € 4,368,972 € 300,877,46025 312.66 € 10.05 € 79,788,310 € 3,085,985,774 € 0 € (12,228,006) € (12,228,006) € 67,560,304 € 0 € 67,560,304 2.31 18.1% € (12,205,583) € (13,838,680) € (26,044,263) € (38,272,269) € 41,516,041 € 1,186,556,231 € 3,831,764 € 304,709,224
DISCOUNTED CASH FLOW
TAXATION
REVENUE EXPLORATION & PRODUCTION COSTS
PETROLEUM PRODUCTION TAX (PPT)