economic trends and crime trends and crime: the effects of the declining economy on crime and the...
TRANSCRIPT
ECONOMIC TRENDS AND CRIME:
The Effects of the Declining Economy on Crime
and the Criminal Justice System in North Carolina
Gerald Koinis
University of North Carolina
Intern and Political Science/Economics Student
Douglas L. Yearwood
Director, North Carolina Criminal Justice Analysis Center
1201 Front Street, Suite 200
Raleigh, NC 27609


The Effects of the Declining Economy
on Crime and the Criminal Justice System
in North Carolina
Gerald Koinis
University of North Carolina Political Science/Economics Student
Douglas L. Yearwood
Director, North Carolina Criminal Justice Analysis Center
1201 Front Street, Suite 200
Raleigh, NC 27609
October 2009


TABLE OF CONTENTS Executive Summary ........................................................................................................................... 1
Methodology............................................................................................................................. 1
Notable Results ......................................................................................................................... 1
Introduction ........................................................................................................................................ 2
Economic Indicators and their Relationship to Crime........................................................................ 4
Effects of the Economy on Criminal Justice Agencies and Crime..................................................... 5
Relating Economic Indicators to Crime ............................................................................................. 6
The Effects of the Declining Economy on North Carolina’s Criminal Justice System...................... 9
Fiscal Impact on the State Budget ............................................................................................ 9
Adequate Funding................................................................................................................... 10
Personnel................................................................................................................................. 11
The Job Market for Law Enforcement.................................................................................... 11
Changes in Agency Size ......................................................................................................... 12
Overtime Spending Reduced .................................................................................................. 13
Jail Populations....................................................................................................................... 14
Courtroom Efficiency ............................................................................................................. 14
Perceived District Safety ........................................................................................................ 15
Non-violent Crime Rate.......................................................................................................... 15
Civilian Staff........................................................................................................................... 15
Economically Driven Crimes.................................................................................................. 16
Budgetary Allocations by Unit ............................................................................................... 17
Infrastructure Changes............................................................................................................ 18
Policing Strategies .................................................................................................................. 19
Impact on State Agencies ................................................................................................................. 19
Department of Juvenile Justice and Delinquency Prevention................................................. 19
Department of Correction ....................................................................................................... 19
Administrative Office of the Courts ....................................................................................... 20
Department of Crime Control and Public Safety.................................................................... 20
Department of Justice ............................................................................................................. 21
Summary .......................................................................................................................................... 21
References ........................................................................................................................................ 22
Appendix A: Agencies Participating in the Survey.......................................................................... 23
Appendix B: Total Responses to the Survey.................................................................................... 24

The Effects of the Declining Economy on Crime and the Criminal Justice System In North Carolina
1
Executive Summary
The purpose of this study is to assess how North Carolina’s criminal justice system and crime rates have been affected by the economic downturn taking place in the nation and the state. Study findings will enhance understanding of how and where our state’s crime and criminal justice agencies are most affected during these tough economic times. This study replicated a portion of a Police Executive Research Forum survey which provides comparative data to analyze how North Carolina’s criminal justice agencies are being impacted compared to the rest of the nation. Results should assist agencies to better assess their department’s status in comparison to agencies across the rest of the state and assist them in implementing recommendations and strategies adopted by other agencies.
Methodology
The method of data collection used in this study was based on a two-part survey administered by phone to 20 North Carolina police departments and 20 North Carolina sheriffs’ offices. For the first part of the survey respondents were asked to rank their answers in accordance with the following scale: 1: Strongly Disagree, 2: Somewhat Disagree, 3: Neutral, 4: Somewhat Agree, 5: Strongly Agree. This first part consisted of 14 questions for the police department and the same 14 questions for the sheriffs’ offices plus one additional question regarding the county jail. The second part of the survey consisted of 12 brief open-ended questions. A third component of the study consisted of a shorter survey administered to the larger state criminal justice agencies. This questionnaire consisted of five open-ended questions inquiring about the issues, problems and resulting impact the economy is having on these state agencies.
Notable Results
Only three out of 40 (8 percent) sheriff and police agencies cited they did not need any increase in officers to have an ideal workforce
18 percent of the sheriff and police agencies expect downsizing
23 percent of the agencies have made significant personnel cuts
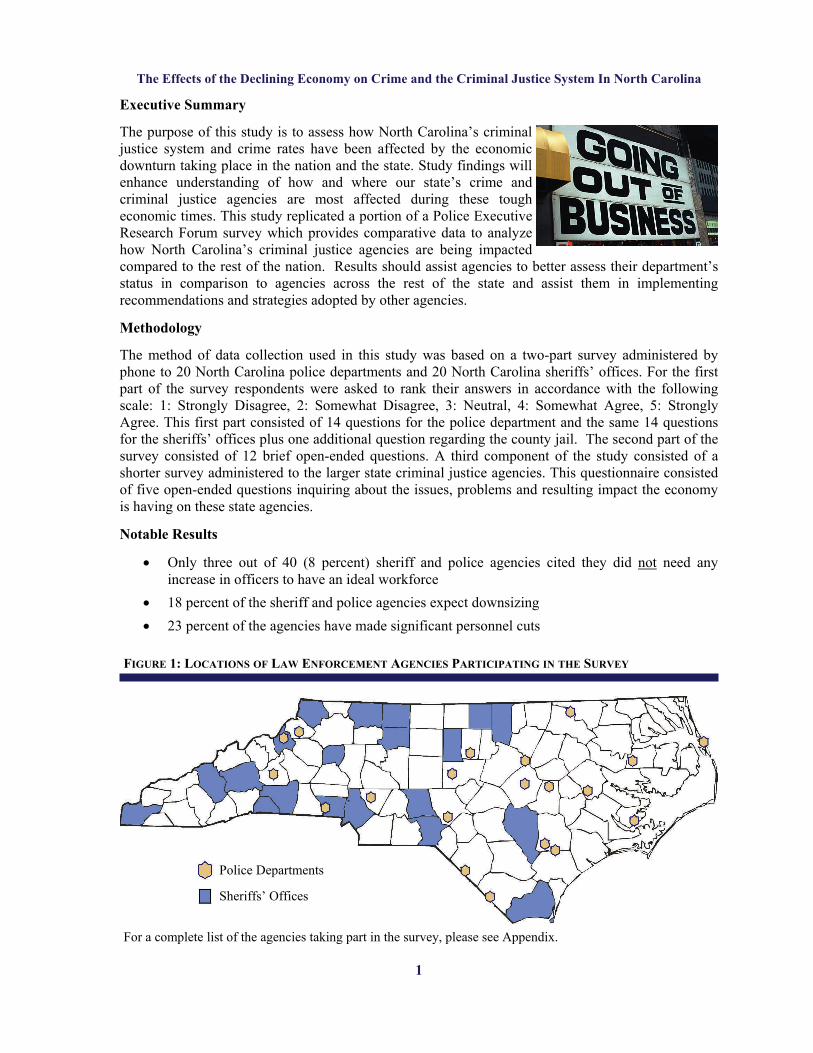
FIGURE 1: LOCATIONS OF LAW ENFORCEMENT AGENCIES PARTICIPATING IN THE SURVEY
Police Departments
Sheriffs’ Offices
For a complete list of the agencies taking part in the survey, please see Appendix.
The Effects of the Declining Economy on Crime and the Criminal Justice System In North Carolina
2
In response to whether budgets increased, decreased, or remained the same from their prior fiscal year budget, agencies reported:
North Carolina:
25 percent - increased budget
58 percent - decreased budget
18 percent - budget remained the same
Nationwide:
80 percent - increased budget
12 percent - decreased budget
9 percent - budget remained the same
73 percent of the agencies in North Carolina are reducing overtime
o Nationwide 61 percent of agencies are reducing overtime (PERF, 2009)
55 percent of the sheriffs’ offices reported substantial increases in their jail populations
68 percent cited their district as safer, or at least as safe, as last year
70 percent noted a change in the violent crime rate
50 percent of the sheriffs’ offices increased their use of civilian staff
Budget cuts are most likely to be directed towards investigative units
The results obtained from speaking with the larger governmental agencies all resonate that the economic effects on their respective departments have limited access to basic services and hindered their ability to achieve their core missions and goals. These agencies also expressed an inability to move forward and expand on their capabilities. This has caused tremendous concern regarding their vulnerability to future issues and problems resulting from postponements and delays involving day-to-day duties.
Introduction
The current state of the national economy has once again sparked intense interest among members of the media, the general public as well as criminal justice practitioners and policy makers surrounding the relationship between economic decline and crime. Anecdotal evidence and media accounts which depict rising crime rates have either directly or implicitly inferred a causal association between the current recession and increases in property crimes such as burglary, larceny and motor vehicle theft.
The economic crisis in the United States has had serious effects on both the federal and state budget. As the source of available funds continues to shrink, public goods and services have suffered in terms of their funding. Criminal justice and law enforcement departments are among those expected to experience substantial setbacks. According to a press release issued by the Police Executive Research Forum President Miami Police Chief John Timoney, “Police departments usually are among the last agencies to be cut when the economy turns bad, because elected officials see public safety as a top priority and try to find other places to cut. . . The fact that most police departments currently are being asked to make cuts is an indication of how badly this recession is affecting local tax bases” (PERF, 2009). According to PERF, 63 percent of local police departments are dealing with funding cuts (PERF, 2009). Even with the current and anticipated budget cuts, people still expect law enforcement agencies to maintain the same level of performance. However, these robust budget cuts have precipitated various problems that affect both the criminal justice departments and the public.
Columbus, Ohio received national acclaim when President Barack Obama attended the graduation of 25 police recruits, marking it as a sign of progress for the federal stimulus package and a sign of

The Effects of the Declining Economy on Crime and the Criminal Justice System In North Carolina
3
things to come. These 25 officers were nationally renowned benefactors of the federal stimulus budget and served as an example of an ensuing positive economic turnaround. However, these officers may still lose their jobs signifying there is still significant progress to be made. Columbus is facing the dilemma of increasing the income tax rate 0.5 percent or having to make deep cuts in law enforcement agencies. With the current economic recession, more and more citizens are struggling to make ends meet; therefore, an increase in taxes would seem unfeasible. In presidential elections Ohio is often considered to be the state most reflective of the entire United States so this economic and political struggle can be considered to be fairly representative of current problems troubling cities and towns across the nation.
Identifying economic variables that affect crime rates is difficult because although there may be a correlation, there may not be direct causation. For example, when unemployment rates go up, motor vehicle thefts may increase, but unemployment does not cause vehicle theft. There have been many studies conducted to see how certain economic variables, such as unemployment, inflation or periods of economic prosperity affect the crime rate. Devine, Sheley and Smith (1988) theorized that as inflation reduces the real income wage of unskilled laborers a concurrent rise in the demand for cheaper and often illegal goods occurs, which rewards and encourages property crime. A collaborative analysis of these studies suggests there is no clear role that the labor market plays in influencing criminal behavior.
Several studies conducted have indicated diverse conclusions. Neustrom, Jamieson, Manual and Gramlin (1988) studied a region in southern Louisiana which had experienced considerable economic fluctuation over 54 months and found a statistically significant correlation between unemployment rates and both larceny and assault. Conversely Young (1993) found no significant correlation between the percentage of unemployed men and women in 20 different nations and their respective national theft rates. Another example of two studies yielding conflicting results were Allen’s study (1996) reporting significant positive associations between the unemployment rate with
both robbery and burglary but found no statistical significance between unemployment and motor vehicle theft. However, Oster and Agell (2007) did find statistical significance between unemployment and auto theft. In summary, the findings of the extant literature on the relationship between unemployment rates and crime can best be described as mixed, inconclusive and varied depending upon the type of data used and the statistical methods for analyzing the data.
With the lack of opportunities during economic down turns the assumption is that more people turn to crime to compensate for income deficiencies. Cantor and Land (1985) for example, argue that a weaker economy will increase criminal motivation. This expectancy is further supported by Isaac Ehrlich’s (1973) suggestion that individuals will engage in theft and other property related crimes as a result of increasing relative deprivation. However, a study conducted by Clarke and Witt (2000) suggests that high unemployment rates have a negative effect on crime. Clarke and Witt’s reasoning is that unemployed workers deter others from crime because people then stay closer to their homes,
The Effects of the Declining Economy on Crime and the Criminal Justice System In North Carolina
4
thus decreasing their chance of being a crime victim. These conflicting reports attest to the previously mentioned viewpoints that higher wages do not necessarily translate into reduced criminal activity.
To achieve a comprehensive understanding of how the economy affects both crime rates and criminal justice departments, it is imperative that research explores the specific effects felt by governmental agencies. In a 2009 study undertaken by PERF, an extensive nationwide sampling study was conducted to determine how the economy impacts crime and the police budget. The study inquired about topics such as whether funding is keeping pace with what the agency needs to maintain existing operating and staffing levels or if overtime spending is being reduced.
Economic Indicators and Their Relationship to Crime
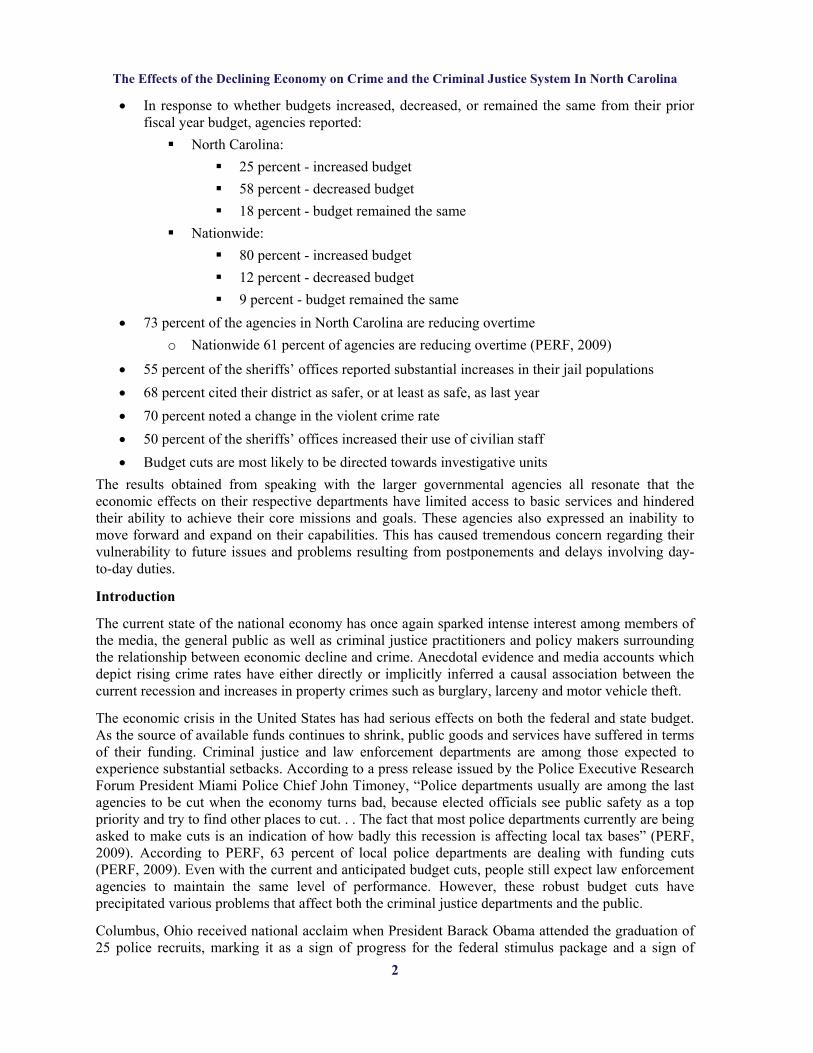
Thirty years of crime and economic data for North Carolina (1977-2007) were compiled and analyzed for this study. Both crime and the state’s economy experienced significant fluctuations both upward and downward during this 30-year period. Uniform Crime Report data were obtained from the Federal Bureau of Investigation’s annual Crime in the United States publication. The number of reported offenses per 100,000 were obtained for the Part I index property crimes of burglary, larceny-theft and motor vehicle theft. Robbery rates, classified as a Part I violent crime, were also included in the study since it is typically assumed to have economic undertones. Since fraud and embezzlement are not Part I or index offenses the number of reported incidents are not collected and compiled as they are for the other offenses listed above. As a result, arrest rates were used for these two variables.
The economic indicators or predictor variables of wage and salary disbursements, supplemental security income, per capita disposable income, the gross domestic state product, food stamp distribution, income maintenance benefits and the average earnings per job were obtained from the United States Department of Commerce, National Bureau of Economic Analysis. Unemployment and inflation rates as well as consumer price index data were obtained from the United States Department of Labor, Bureau of Labor Statistics. Retail sales data were collected from the N.C. Department of Revenue. Where applicable, variables were converted to per capita rates and inflation
FIGURE 2: PROPERTY CRIME TRENDS, 1977-2007
Recession
*The crime rate is calculated per 100,000 population.
0
1,000
2,000
3,000
4,000
5,000
6,000
1977
1979
1981
1983
1985
1987
1989
1991
1993
1995
1997
1999
2001
2003
2005
2007
Property Crime Rate Burglary Rate
Larceny Rate Motor Vehicle Theft Rate
Cri
me
Ra
te*
RecessionRecession
*The crime rate is calculated per 100,000 population.
0
1,000
2,000
3,000
4,000
5,000
6,000
1977
1979
1981
1983
1985
1987
1989
1991
1993
1995
1997
1999
2001
2003
2005
2007
Property Crime Rate Burglary Rate
Larceny Rate Motor Vehicle Theft Rate
Cri
me
Ra
te*

The Effects of the Declining Economy on Crime and the Criminal Justice System In North Carolina
5
adjusted to 2007 dollars. Regression analyses were run in an effort to identify the specific economic indicators that significantly predict or explain changes in the respective crime rates for each of the different crime types mentioned above.
Effects of the Economy on Criminal Justice Agencies and Crime
Overall, the main areas of interest targeted by the survey related to agency funding, personnel and crime in their jurisdiction. The questions in Part 1 regarding funding inquired about whether the department’s funding allotment allows them to achieve their intended missions and goals. Other questions target the presence and degree of personnel and budget cuts, as well as inquiring about certain reduction methods like hiring freezes or reducing overtime. The remainder of the questions in Part 1 asked about observed changes in crime rates, safety in the area, and changes in the jail populations.
The second part of the survey consisted of 12 open-ended questions, which inquired about a department’s budget, personnel and any noted or anticipated effects of the current economic downturn. Some of the budget questions delved into which units within a department they anticipate will receive the smallest and largest percent of requested funds, while others asked about changes in the budget over the years and about what agencies are anticipating with this year’s upcoming budget. Agencies were also asked about any innovative policing strategies they have or would implement to compensate for an anticipated reduction in funding. Respondents were also asked about any structural changes within the department that would be considered if funding is reduced. Other questions sought answers about what effects could be attributed to a struggling economy such as changes in the court room, certain types of crime and how their agency has most been impacted.
The third part of the study was administered to the larger state criminal justice agencies. These questions inquired about agency funding and how the current fiscal situation has impacted their mission and the citizens of North Carolina. Agencies were asked to disclose what they considered to be the most significant issues or problems facing their agency. Combining these interviews with the police and sheriffs’ offices provided a holistic overview of the criminal justice system and the economic issues and pressures that the system is facing.
Recession
1
10
100
1,000
10,000
1977
1978
1979
1980
1981
1982
1983
1984
1985
1986
1987
1988
1989
1990
1991
1992
1993
1994
1995
1996
1997
1998
1999
2000
2001
2002
2003
2004
2005
2006
2007
Year
Off
ense
Rat
e
Property Crime Rate Burglary Rate Larceny Rate
Motor Vehicle Theft Rate Robbery Rate Incarceration Rate
RecessionRecession
1
10
100
1,000
10,000
1977
1978
1979
1980
1981
1982
1983
1984
1985
1986
1987
1988
1989
1990
1991
1992
1993
1994
1995
1996
1997
1998
1999
2000
2001
2002
2003
2004
2005
2006
2007
Year
Off
ense
Rat
e
Property Crime Rate Burglary Rate Larceny Rate
Motor Vehicle Theft Rate Robbery Rate Incarceration Rate
FIGURE 3: OFFENSE TRENDS BY CRIME CATEGORY, 1977-2007

The Effects of the Declining Economy on Crime and the Criminal Justice System In North Carolina
6
A stratified sampling method derived from agency size was used to select both the sheriffs’ offices and the police departments to be surveyed. Campus, company and other special police forces were excluded from the survey. All remaining agencies were segmented into three groups: an upper quartile, a middle 50 percent and a lower quartile. The top 25 percent group was defined as large agencies, the middle 50 percent as medium sized, and the smallest 25 percent was categorized as small agencies.
There are 100 counties in North Carolina; therefore, the top quartile consisted of 25 sheriffs’ offices, the middle segment included 50 counties and the lower quartile contained 25 agencies to randomly choose from. The sheriffs’ offices’ large group was defined as agencies with 77 or more total sworn officers, the middle group has agencies ranging from 76 to 24 sworn officers and the lower quartile contained agencies with 23 or fewer officers. There are 90 total police departments in the top quartile, 180 in the middle 50 percent, and 90 agencies in the lowest quartile. The top quartile of agencies was defined as those with greater than 20 sworn officers, the middle 50 percent consisted of four to 20 sworn officers and the lowest quartile group contained mainly agencies with one to four sworn officers.
Five agencies from the top quartile, 10 from the middle 50 percent, and five agencies from the lower quartile were selected to be interviewed for both sheriff and police agencies. Thus the combined total number for both agency types was 10 small agencies, 20 medium, and 10 large agencies. This distribution allows for a proportionate representation based on agency size. The agencies selected for inclusion in the study were chosen randomly. (See the Appendix for a list of those agencies where staff were interviewed)
Relating Economic Indicators to Crime
Regression analyses of crime and economic data indicate significant relationships between supplemental security income payments on a per capita basis, average wage and salary disbursements and property crime. As supplemental security payments increase and average wage and salary disbursements decrease, property crime will indicate a tendency to rise in response. As economic conditions worsen, or trend downward, businesses and employers may be forced to implement
0
1,000
2,000
3,000
4,000
5,000
6,000
19
77
19
78
19
79
19
80
19
81
19
82
19
83
19
84
19
85
19
86
19
87
19
88
19
89
19
90
19
91
19
92
19
93
19
94
19
95
19
96
19
97
19
98
19
99
20
00
20
01
20
02
20
03
20
04
20
05
20
06
20
07
Year
Pro
per
ty C
rim
e R
ates
0
2,000
4,000
6,000
8,000
10,000
12,000
14,000
16,000
SS
I R
ecei
pts
Property Crime Rate SSI Receipts*
FIGURE 4: SOCIAL SECIRITY INCOME RECEIPTS AND PROPERTY CRIME RATES, 1977-2007
The Effects of the Declining Economy on Crime and the Criminal Justice System In North Carolina
7
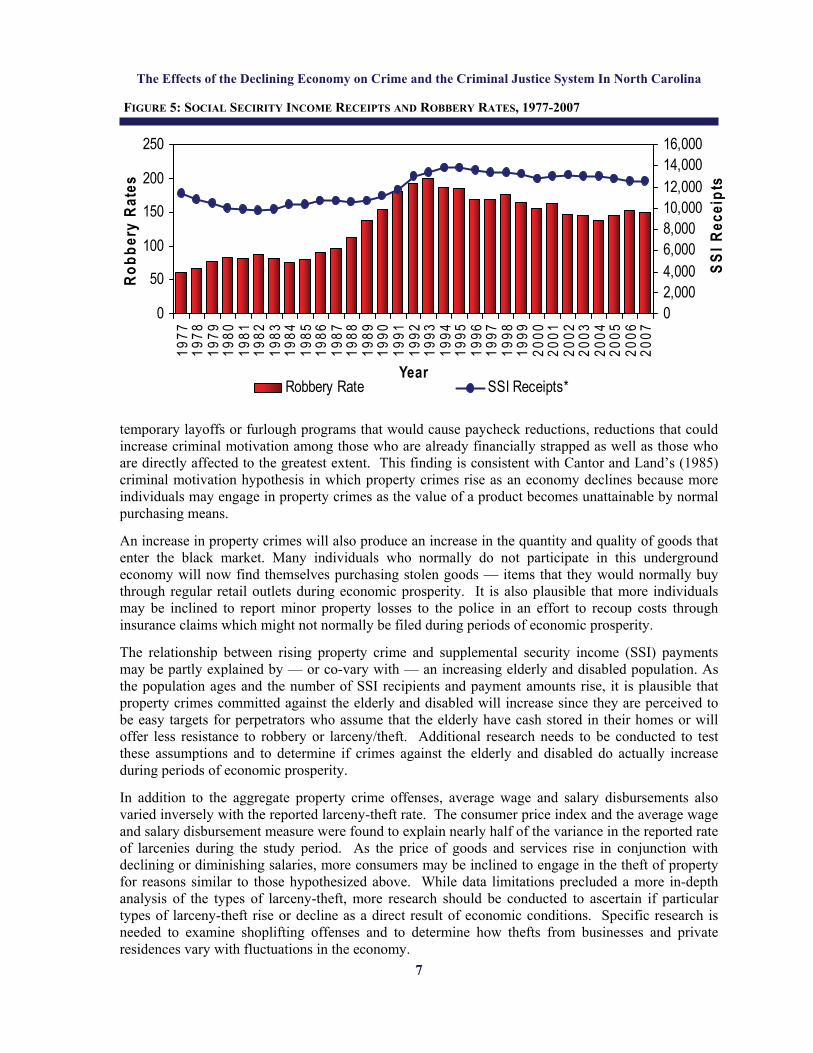
temporary layoffs or furlough programs that would cause paycheck reductions, reductions that could increase criminal motivation among those who are already financially strapped as well as those who are directly affected to the greatest extent. This finding is consistent with Cantor and Land’s (1985) criminal motivation hypothesis in which property crimes rise as an economy declines because more individuals may engage in property crimes as the value of a product becomes unattainable by normal purchasing means.
An increase in property crimes will also produce an increase in the quantity and quality of goods that enter the black market. Many individuals who normally do not participate in this underground economy will now find themselves purchasing stolen goods — items that they would normally buy through regular retail outlets during economic prosperity. It is also plausible that more individuals may be inclined to report minor property losses to the police in an effort to recoup costs through insurance claims which might not normally be filed during periods of economic prosperity.
The relationship between rising property crime and supplemental security income (SSI) payments may be partly explained by — or co-vary with — an increasing elderly and disabled population. As the population ages and the number of SSI recipients and payment amounts rise, it is plausible that property crimes committed against the elderly and disabled will increase since they are perceived to be easy targets for perpetrators who assume that the elderly have cash stored in their homes or will offer less resistance to robbery or larceny/theft. Additional research needs to be conducted to test these assumptions and to determine if crimes against the elderly and disabled do actually increase during periods of economic prosperity.
In addition to the aggregate property crime offenses, average wage and salary disbursements also varied inversely with the reported larceny-theft rate. The consumer price index and the average wage and salary disbursement measure were found to explain nearly half of the variance in the reported rate of larcenies during the study period. As the price of goods and services rise in conjunction with declining or diminishing salaries, more consumers may be inclined to engage in the theft of property for reasons similar to those hypothesized above. While data limitations precluded a more in-depth analysis of the types of larceny-theft, more research should be conducted to ascertain if particular types of larceny-theft rise or decline as a direct result of economic conditions. Specific research is needed to examine shoplifting offenses and to determine how thefts from businesses and private residences vary with fluctuations in the economy.
0
50
100
150
200
250
19
77
19
78
19
79
19
80
19
81
19
82
19
83
19
84
19
85
19
86
19
87
19
88
19
89
19
90
19
91
19
92
19
93
19
94
19
95
19
96
19
97
19
98
19
99
20
00
20
01
20
02
20
03
20
04
20
05
20
06
20
07
Year
Ro
bb
ery
Rat
es
02,0004,0006,0008,00010,00012,00014,00016,000
SS
I R
ecei
pts
Robbery Rate SSI Receipts*
FIGURE 5: SOCIAL SECIRITY INCOME RECEIPTS AND ROBBERY RATES, 1977-2007

The Effects of the Declining Economy on Crime and the Criminal Justice System In North Carolina
8
Motor vehicle theft was the only criminal offense to be significantly associated with the unemployment rate, supporting prior findings by Oster and Agell (2007). As unemployment rises and income maintenance benefit payments decline motor vehicle thefts also decline. This finding is contrary to a similar study by Bunge, Johnson and Balde (2005) who found a significant and direct linear relationship between the economic indicators used in their research and motor vehicle theft. Findings from this study indicate a non-direct and mixed relationship between economic measures and motor vehicle theft. It is possible that as unemployment increases and people lose their jobs, they are either spending more time at home or are using their vehicles more to search for employment. Either way this would remove or lessen the opportunity to steal vehicles as they are occupied and more closely monitored under these circumstances. In a similar vein, persons who receive a cut or a reduction in their supplemental financial assistance from the government and own a vehicle may drive less or forego unnecessary trips in order to compensate for the reduced assistance and to use funds normally used on fuel to makeup the difference. Consequently, their vehicles are more closely monitored as well.
Reported robbery rates were best predicted by the consumer price index and the supplemental security income receipts per capita. Together these two economic indicators accounted for 79 percent of the variance with both moving in a direct and significant manner with robbery. As prices rise, more money is needed to buy the same goods and services that were previously purchased at a lower value. If people — particularly the elderly who are less likely to use credit or debit cards — carry more cash, they increase their chances of being robbed. This is also true of many immigrants, who do not trust or utilize banks, and tend to carry and possess more cash both inside and outside of the home. Supplementary research is needed to determine how robberies and economic conditions vary by age and ethnicity and to determine to what extent these robberies are occurring as home invasions.
Fraud and embezzlement were found to be significantly associated with average wage and salary disbursements and per capita personal income respectively. As average wage and salary disbursements increase so do the number of fraud arrests. As personal income grows, so do arrests for embezzlement. It is hypothesized that as earning power and income rise so do the number of frivolous and trivial acquisitions. Increasing capital often signals more disposable income and many may be duped by ‘get rich quick’ schemes, the Internet and other investment scams. They may also
050
100150200250300350400
19
77
19
78
19
79
19
80
19
81
19
82
19
83
19
84
19
85
19
86
19
87
19
88
19
89
19
90
19
91
19
92
19
93
19
94
19
95
19
96
19
97
19
98
19
99
20
00
20
01
20
02
20
03
20
04
20
05
20
06
20
07
Years
Mo
tor
Veh
icle
Th
eft
Rat
e
0
2
4
6
8
10
Un
emp
loym
ent
Rat
e (P
erce
nt)
Motor Vehicle Theft Rate Unemployment Rate*
FIGURE 6: UNEMPLOYMENT RATES AND MOTOR VEHICLE THEFT, 1977-2007

The Effects of the Declining Economy on Crime and the Criminal Justice System In North Carolina
9
become greedy and be tempted to acquire even more wealth through the theft of company funds and pensions. With more wealth, many become less fiscally conservative and more willing to make risky purchases and investments than they would have normally done when their salaries were lower. It is also possible that many of these same individuals are living beyond their means and must commit fraud and embezzlement to support their lavish lifestyles.
One caveat should be noted here. Arrest rates are also a measure of police productivity and activity. Thus, fraud and embezzlement arrests may decline during austere economic periods, not as a result of the economy itself, but as a reflection of shifting police enforcement patterns. During tough economic times, law enforcement agencies may experience layoffs and an inability to provide compensation for overtime work. Consequently, fraud and embezzlement investigations are assigned a lower priority in deference to managing more serious offenses.
The Effects of the Declining Economy on North Carolina’s Criminal Justice System
The following section will analyze the data collected from the first two parts of the survey. The purpose behind this study is to better understand how North Carolina’s struggling economy has affected criminal justice agencies and the citizens of this state. The discussion will conclude by presenting an array of innovative police strategies that departments are using or anticipate using to compensate for times when funding is reduced. Many of the strategies presented here can be implemented by other departments looking for ways to help their agency through this difficult economic period.
Fiscal Impact on the State Budget
The severity of economic problems facing the United States and North Carolina can hardly be understated. The economy has left few, if any, areas unaffected. North Carolina’s criminal justice agencies and departments are among those feeling the effect of economic adversity.
Survey respondents provided a wide range of responses regarding how the state’s current fiscal situation has most impacted their agency’s mission. Of the 40 responses received, nine (23 percent)
.00
.05
.10
.15
.20
.25
.30
.35
.40
1977
1978
1979
1980
1981
1982
1983
1984
1985
1986
1987
1988
1989
1990
1991
1992
1993
1994
1995
1996
1997
1998
1999
2000
2001
2002
2003
2004
2005
2006
2007
Year
Em
bez
zlem
ent
Rat
e
0
5,000
10,000
15,000
20,000
25,000
30,000
35,000
40,000
Per
Cap
ita
Per
son
al
Inco
me
Embezzlement Rate Per Capita Personal Income*
FIGURE 7: PER CAPITA PERSONAL INCOME AND EMBEZZLEMENT, 1977-2007
The Effects of the Declining Economy on Crime and the Criminal Justice System In North Carolina
10
were categorized as noting a decrease in town revenue, nine cited trying to do more with less and six (15 percent) noted zero to little changes in their jurisdiction. Furthermore, five (13 percent) agencies reported difficulty in acquiring funding, five agencies cited personnel being affected and six reported other factors.
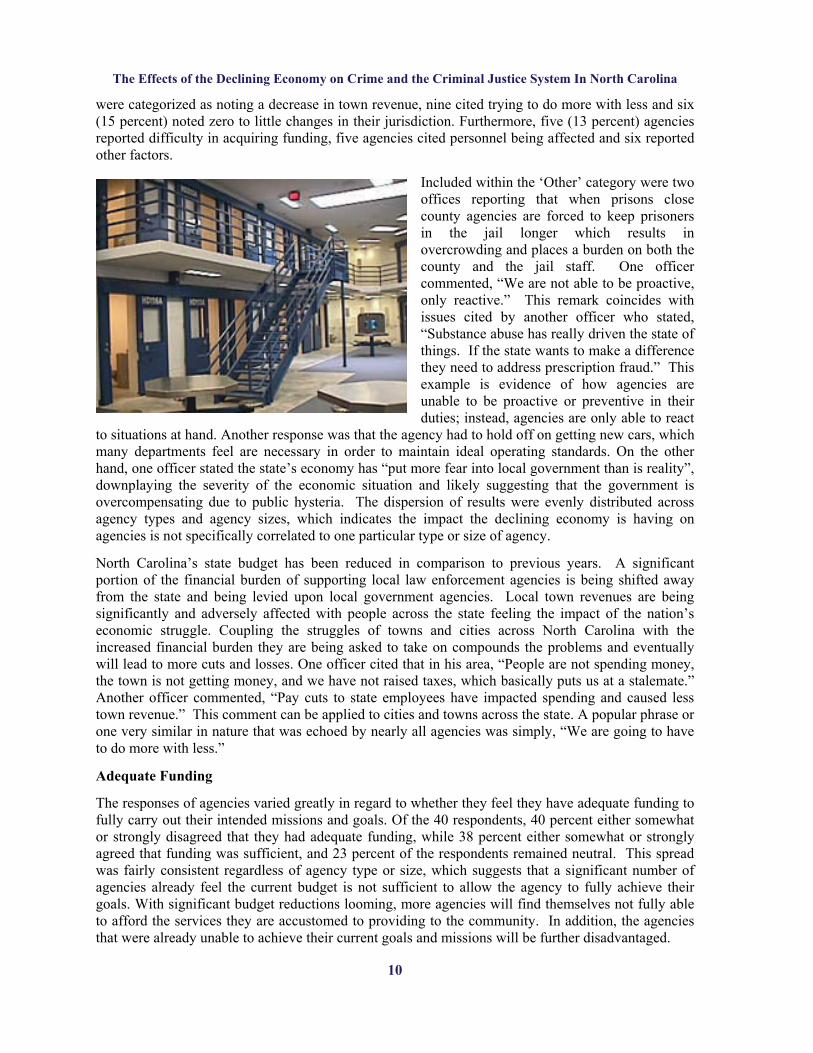
Included within the ‘Other’ category were two offices reporting that when prisons close county agencies are forced to keep prisoners in the jail longer which results in overcrowding and places a burden on both the county and the jail staff. One officer commented, “We are not able to be proactive, only reactive.” This remark coincides with issues cited by another officer who stated, “Substance abuse has really driven the state of things. If the state wants to make a difference they need to address prescription fraud.” This example is evidence of how agencies are unable to be proactive or preventive in their duties; instead, agencies are only able to react
to situations at hand. Another response was that the agency had to hold off on getting new cars, which many departments feel are necessary in order to maintain ideal operating standards. On the other hand, one officer stated the state’s economy has “put more fear into local government than is reality”, downplaying the severity of the economic situation and likely suggesting that the government is overcompensating due to public hysteria. The dispersion of results were evenly distributed across agency types and agency sizes, which indicates the impact the declining economy is having on agencies is not specifically correlated to one particular type or size of agency.
North Carolina’s state budget has been reduced in comparison to previous years. A significant portion of the financial burden of supporting local law enforcement agencies is being shifted away from the state and being levied upon local government agencies. Local town revenues are being significantly and adversely affected with people across the state feeling the impact of the nation’s economic struggle. Coupling the struggles of towns and cities across North Carolina with the increased financial burden they are being asked to take on compounds the problems and eventually will lead to more cuts and losses. One officer cited that in his area, “People are not spending money, the town is not getting money, and we have not raised taxes, which basically puts us at a stalemate.” Another officer commented, “Pay cuts to state employees have impacted spending and caused less town revenue.” This comment can be applied to cities and towns across the state. A popular phrase or one very similar in nature that was echoed by nearly all agencies was simply, “We are going to have to do more with less.”
Adequate Funding
The responses of agencies varied greatly in regard to whether they feel they have adequate funding to fully carry out their intended missions and goals. Of the 40 respondents, 40 percent either somewhat or strongly disagreed that they had adequate funding, while 38 percent either somewhat or strongly agreed that funding was sufficient, and 23 percent of the respondents remained neutral. This spread was fairly consistent regardless of agency type or size, which suggests that a significant number of agencies already feel the current budget is not sufficient to allow the agency to fully achieve their goals. With significant budget reductions looming, more agencies will find themselves not fully able to afford the services they are accustomed to providing to the community. In addition, the agencies that were already unable to achieve their current goals and missions will be further disadvantaged.
The Effects of the Declining Economy on Crime and the Criminal Justice System In North Carolina
11
Personnel
For many agencies, in addition to coping with a lack of funding, an overwhelming majority expressed the need for additional personnel. Out of the 40 sheriff and police officers interviewed, only three (8 percent) reported not needing an increase in officers to have an ideal workforce. This low response indicates that many agencies feel understaffed and are in need of more officers. Furthermore, 10 officers reported needing a 1-10 percent increase in officers, 14 cited an 11-20 percent needed increase, while seven officers cited a 21-30 percent increase and another six officers stated that they needed a greater than 30 percent increase in staffing. For the most part, no overly significant differences between an agency’s size or agency type appeared. Generally, larger agencies needed a smaller percent increase in staffing, while smaller agencies needed a larger increase.
The Job Market for Law Enforcement
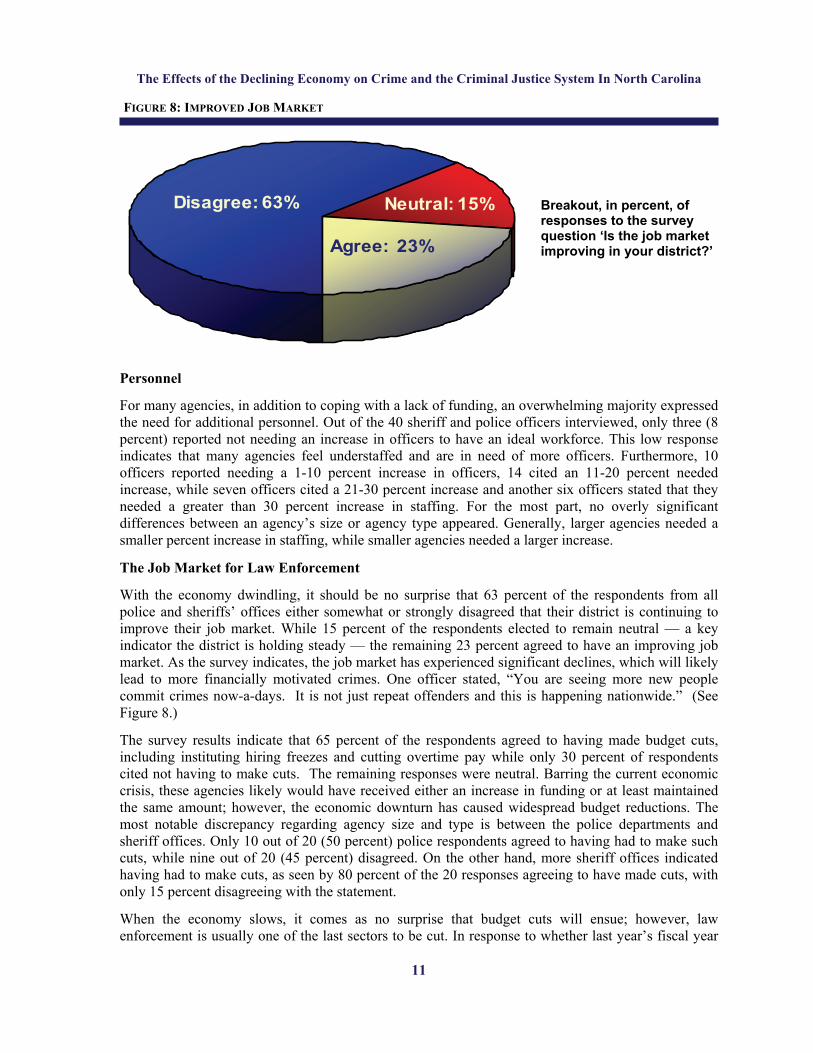
With the economy dwindling, it should be no surprise that 63 percent of the respondents from all police and sheriffs’ offices either somewhat or strongly disagreed that their district is continuing to improve their job market. While 15 percent of the respondents elected to remain neutral — a key indicator the district is holding steady — the remaining 23 percent agreed to have an improving job market. As the survey indicates, the job market has experienced significant declines, which will likely lead to more financially motivated crimes. One officer stated, “You are seeing more new people commit crimes now-a-days. It is not just repeat offenders and this is happening nationwide.” (See Figure 8.)
The survey results indicate that 65 percent of the respondents agreed to having made budget cuts, including instituting hiring freezes and cutting overtime pay while only 30 percent of respondents cited not having to make cuts. The remaining responses were neutral. Barring the current economic crisis, these agencies likely would have received either an increase in funding or at least maintained the same amount; however, the economic downturn has caused widespread budget reductions. The most notable discrepancy regarding agency size and type is between the police departments and sheriff offices. Only 10 out of 20 (50 percent) police respondents agreed to having had to make such cuts, while nine out of 20 (45 percent) disagreed. On the other hand, more sheriff offices indicated having had to make cuts, as seen by 80 percent of the 20 responses agreeing to have made cuts, with only 15 percent disagreeing with the statement.
When the economy slows, it comes as no surprise that budget cuts will ensue; however, law enforcement is usually one of the last sectors to be cut. In response to whether last year’s fiscal year
FIGURE 8: IMPROVED JOB MARKET
Disagree: 63%
Agree: 23%
Neutral: 15% Breakout, in percent, of responses to the survey question ‘Is the job market improving in your district?’
The Effects of the Declining Economy on Crime and the Criminal Justice System In North Carolina
12
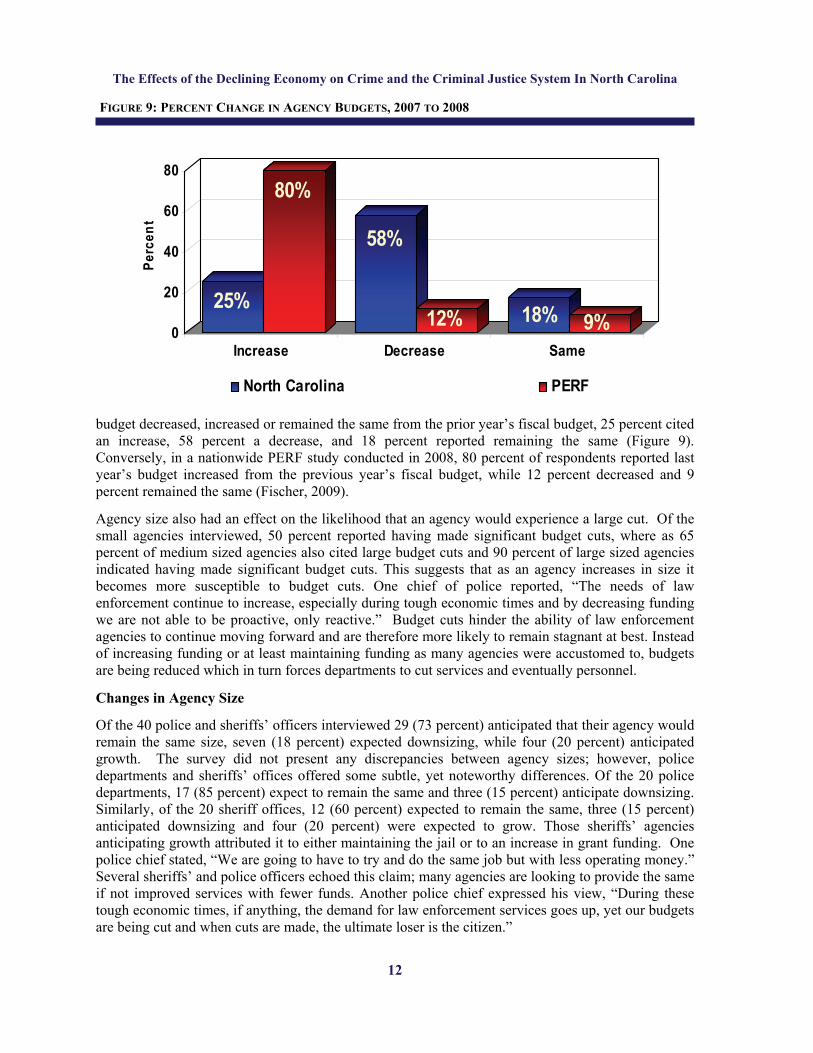
budget decreased, increased or remained the same from the prior year’s fiscal budget, 25 percent cited an increase, 58 percent a decrease, and 18 percent reported remaining the same (Figure 9). Conversely, in a nationwide PERF study conducted in 2008, 80 percent of respondents reported last year’s budget increased from the previous year’s fiscal budget, while 12 percent decreased and 9 percent remained the same (Fischer, 2009).
Agency size also had an effect on the likelihood that an agency would experience a large cut. Of the small agencies interviewed, 50 percent reported having made significant budget cuts, where as 65 percent of medium sized agencies also cited large budget cuts and 90 percent of large sized agencies indicated having made significant budget cuts. This suggests that as an agency increases in size it becomes more susceptible to budget cuts. One chief of police reported, “The needs of law enforcement continue to increase, especially during tough economic times and by decreasing funding we are not able to be proactive, only reactive.” Budget cuts hinder the ability of law enforcement agencies to continue moving forward and are therefore more likely to remain stagnant at best. Instead of increasing funding or at least maintaining funding as many agencies were accustomed to, budgets are being reduced which in turn forces departments to cut services and eventually personnel.
Changes in Agency Size
Of the 40 police and sheriffs’ officers interviewed 29 (73 percent) anticipated that their agency would remain the same size, seven (18 percent) expected downsizing, while four (20 percent) anticipated growth. The survey did not present any discrepancies between agency sizes; however, police departments and sheriffs’ offices offered some subtle, yet noteworthy differences. Of the 20 police departments, 17 (85 percent) expect to remain the same and three (15 percent) anticipate downsizing. Similarly, of the 20 sheriff offices, 12 (60 percent) expected to remain the same, three (15 percent) anticipated downsizing and four (20 percent) were expected to grow. Those sheriffs’ agencies anticipating growth attributed it to either maintaining the jail or to an increase in grant funding. One police chief stated, “We are going to have to try and do the same job but with less operating money.” Several sheriffs’ and police officers echoed this claim; many agencies are looking to provide the same if not improved services with fewer funds. Another police chief expressed his view, “During these tough economic times, if anything, the demand for law enforcement services goes up, yet our budgets are being cut and when cuts are made, the ultimate loser is the citizen.”
25%
80%
58%
12% 18% 9%0
20
40
60
80
Per
cen
t
Increase Decrease Same
North Carolina PERF
FIGURE 9: PERCENT CHANGE IN AGENCY BUDGETS, 2007 TO 2008
The Effects of the Declining Economy on Crime and the Criminal Justice System In North Carolina
13
Another area seriously impacted by the economy is personnel. Of the 40 police departments and sheriffs’ offices interviewed, three (8 percent) somewhat agreed and six strongly agreed to having made significant personnel cuts. This is a considerable portion of agencies claiming to have made staffing cuts since law enforcement personnel are rarely cut. These personnel cuts indicate the infiltration of the current economic downturn into North Carolina’s law enforcement units. A closer examination of survey results reveal that only one out of 10 (10 percent) respondents from small sized agencies either somewhat or strongly agreed to having made significant personnel cuts, while seven respondents had not made personnel cuts.
This data could be explained because a loss of one individual on a smaller sized staff would be considered much more significant than the loss of a few officers on a large sized staff. One police officer stated, “Unfortunately, we had to let one of our officers go this past year and that lone loss has really stretched our duties and has been very demanding for us here, because being such a small agency, he was a large portion of our manpower.” Generally, however, it appears that these smaller sized agencies are the least likely to cut personnel, but when they have to do so, it is a much more significant loss to absorb. Overall, it appears agencies are doing their best to hold all their current positions. Although, one officer stated, “If things keep getting worse with the economy, we will probably be forced to begin letting some personnel go.”
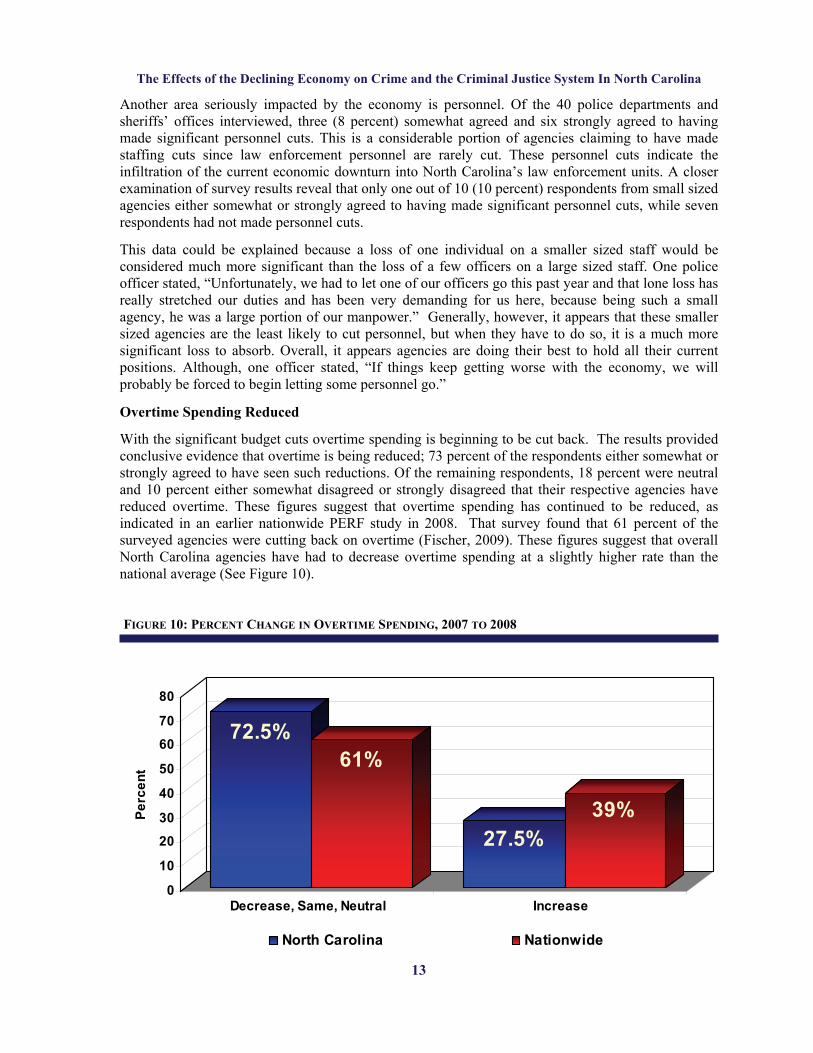
Overtime Spending Reduced
With the significant budget cuts overtime spending is beginning to be cut back. The results provided conclusive evidence that overtime is being reduced; 73 percent of the respondents either somewhat or strongly agreed to have seen such reductions. Of the remaining respondents, 18 percent were neutral and 10 percent either somewhat disagreed or strongly disagreed that their respective agencies have reduced overtime. These figures suggest that overtime spending has continued to be reduced, as indicated in an earlier nationwide PERF study in 2008. That survey found that 61 percent of the surveyed agencies were cutting back on overtime (Fischer, 2009). These figures suggest that overall North Carolina agencies have had to decrease overtime spending at a slightly higher rate than the national average (See Figure 10).
FIGURE 10: PERCENT CHANGE IN OVERTIME SPENDING, 2007 TO 2008
72.5%61%
27.5%39%
0
10
20
30
40
50
60
70
80
Pe
rce
nt
Decrease, Same, Neutral Increase
North Carolina Nationwide

The Effects of the Declining Economy on Crime and the Criminal Justice System In North Carolina
14
The survey results also indicate that sheriffs’ offices have reduced overtime slightly more than police departments. Eighty percent of the sheriffs’ offices responding agreed that a reduction is occurring, while only 5 percent disagreed. The rest of the sample was neutral on the issue. On the other hand, 65 percent of police respondents agreed that overtime was being reduced while 15 percent disagreed with the statement. These results suggest that a significant number of agencies, regardless of type, have had to reduce overtime spending.
Small sized police departments appear to be the least susceptible to overtime reductions. Of the five respondents within this group, three answered neutral and two respondents agreed to having reduced overtime which suggests that smaller police departments most likely do not take on that much overtime to begin with, since several of these respondents also indicated they try not to use overtime at all. In the sample of the large sized agencies, eight out of nine (89 percent) respondents strongly agreed to having to reduce overtime while one (11 percent) respondent somewhat disagreed.
Jail Populations
Jails have also been significantly impacted by the struggling economy. Of the 20 sheriffs’ offices interviewed, 11 (5 percent) either somewhat or strongly agreed to have seen what they consider a substantial increase in the jail population, while five (25 percent) remained neutral and four (20 percent) respondents somewhat disagreed that they had seen an increase in the jail population. Of the five small sized sheriffs’ offices four (80 percent) of them strongly agreed and one (20 percent) somewhat agreed to having seen a substantial increase in the jail population.
Courtroom Efficiency
Courts are another sector that has been impacted by the economy. Although the responses given were not entirely consistent, there were numerous officers citing various problems. The survey yielded mixed results about whether courtrooms have regressed in their efficiency due to the economic slowdown. Some agencies noted fairly significant inefficiencies, as indicated by 25 percent of the respondents strongly disagreeing that their courtroom had not seen any setbacks, while 15 percent somewhat disagreed. Some officers went as far as to question whether their courtrooms could get any worse. On the other hand, other respondents did not feel their courtrooms had become less efficient. In fact, 38 percent of respondents either somewhat or strongly agreed that their courtroom had not suffered in terms of its efficiency.
Responses varied greatly when asked about the main effects the economy has had in the courtroom. Of the 40 respondents, 12 (30 percent) of the officers cited that the economy had not impacted their court systems, 13 (33 percent) reported case overload, eight (20 percent) noticed increases in property crimes and three (8 percent) claimed judges were more lenient and less likely to charge or sentence offenders. (See Figure 11.)
Court Room Effects Sheriffs’ Offices
Percent of Times Cited Police Departments
Percent of Times Cited
Backlog 50 15
Increase Property Crime 20 20
Less likely to sentence 0 15
None 15 45
Other 15 5
FIGURE 11: EFFECTS OF THE ECONOMY ON THE COURT SYSTEM
The Effects of the Declining Economy on Crime and the Criminal Justice System In North Carolina
15
Perceived District Safety
Safety in most districts has remained consistent for the most part. Survey results indicate that 68 percent of the sheriff and police respondents either somewhat agreed or strongly agreed that their district is at least as safe as or safer than it was a year ago.
Violent Crime Rate
The results about whether an agency’s district had the same violent crime rate over the past year were evenly split. Forty percent either somewhat or strongly disagreed while 53 percent somewhat or strongly agreed that there had been no change in the violent crime rate. This data was consistently upheld regardless of agency size or type. The reason for this discrepancy may be that the violent crime rate does not follow a trend and is not indicative of a rise or fall in the economy. The findings here support the claims set forth by Levitt and Dubner in Freakonomics (2006). In their book they cited that during the 1990s unemployment fell by two percentage points, but violent crime plummeted about 40 percent. In comparison, in the 1960s, the economy boomed and so did violent crime. The survey results support the findings of Levitt and Dubner (2006) suggesting that the violent crime rate does not depend on or vary with changes in the economy.
Non-violent Crime Rate
The combined survey results for the police departments and sheriffs’ offices indicate a wide range of responses across all five possible answer choices; however, there were significant differences by agency type and agency size. Respondents from the sheriffs’ offices significantly disagreed that their non-violent crime rate had remained the same. Seventy percent of the respondents either somewhat or strongly disagreed and only 10 percent of respondents somewhat agreed and the rest remained neutral. The opposite is true for police departments. They agreed significantly in noting a change in the non-violent crime rate. Survey results indicate that 65 percent of police departments responding either somewhat or strongly agreed that non-violent crime rates had changed in their jurisdiction, while 30 percent disagreed and one (5 percent) respondent remained neutral about any change. In regards to agency size, the smaller agencies were the subgroup that most disagreed with not seeing a change in the non-violent crime rate. Seventy percent of their respondents disagreed while the rest somewhat agreed, indicating they had not seen a change in the non-violent crime rate. These figures are supported by a 100 percent disagreement by small sized sheriff offices. A majority of the officers that reported a change in the non-violent crime rate indicated that it had increased in their jurisdiction.
Civilian Staff
In order to help compensate for a reduction in funding, one method some agencies have implemented is increased reliance on less costly civilian staff. At initial glance, there does not appear to be an overall trend that would determine if agencies are making use of hiring less costly civilian staff to help their budget. Overall, 21 (53 percent) of the agencies stated they have not increased the use of civilian staff, while six (15 percent) respondents were neutral and 13 (33 percent) agencies claimed to have increased their civilian staff. However, 75 percent of the police department’s have not increased civilian staff, while 15 percent did increase and the remaining 10 percent were neutral. Fifty percent of the sheriffs’ offices responding stated they have increased the use of civilians, 30 percent did not and 20 percent were neutral. (See Figure 12 on the following page.)
In addition to examining how the economy has affected criminal justice departments and what effects have arisen due to those changes, the study also inquired about what to typically expect during these economic downturns and more specifically, what effects North Carolina’s citizens will experience.

The Effects of the Declining Economy on Crime and the Criminal Justice System In North Carolina
16
Economically Driven Crimes
Respondents were asked about the following offenses: burglary, theft, robbery, crimes involving scrap and/or precious metals, drug-related crimes, gasoline theft, crimes involving firearms, property crimes, thefts involving cars, larceny and all other crimes. The following results are demonstrative in explaining what types of crimes can be expected when economic conditions deteriorate. Respondents cited that burglary (88 percent), theft (93 percent) and larceny (90 percent) were driven by difficult economic conditions. Robbery was also indicated by 80 percent of respondents as associated with declining economic conditions. These results suggest that many people are driven into methods of theft to compensate for their economic shortfalls. This echoes Becker’s (1968) work which suggests that, as the economy spirals downward, individuals are more likely to commit income producing criminal violations as the benefits of perpetration outweigh or surpass the associated costs of apprehension.
Gasoline theft and property crimes in general were each cited by 30 out of 40 (75 percent) respondents as being driven by tough economic times. One officer commented on the issue of gasoline theft, “Gasoline theft usually flares up when people really start getting hit hard in their pockets and many people that normally would otherwise pay for their gas are finding ways to cut corners and save money wherever possible”.
Drug related crimes, car theft and crimes with firearms were the crimes sheriffs’ deputies and police officers least attributed to be driven by difficult economic times. Of the 40 responding agencies, 23 (58 percent) cited drug related crimes to be economically related, while 10 (25 percent) agencies disagreed and seven (18 percent) claimed a possible relation. The survey yielded 48 percent of respondents citing a relation for car theft, while 25 percent disagreed and 28 percent claimed there to be a possible relationship. Crimes with firearms were least attributed to being driven by tough economic conditions, as only 40 percent of the agencies agreed there to be a correlation, 28 percent disagreed, and 33 percent cited a possible relation.
15%
50%
85%
50%
0
10
20
30
40
50
60
70
80
90
Per
cen
t
Increase Decrease /Neutral/Same
Police Departments Sheriff's Officers
FIGURE 12: PERCENT CHANGE IN THE USE OF CIVILIAN STAFF BY AGENCIES, 2007 TO 2008
The Effects of the Declining Economy on Crime and the Criminal Justice System In North Carolina
17
11
9
7
54
3
10
2
4
6
8
10
12
Nu
mb
er o
f T
imes
Cit
ed
Investgations Equal
Disbursement
Reduction
Patrol Equipment/
Supplies
Personnel Other Jail
Agency Unit
Additionally, crimes involving scrap and/or precious metals were cited by 73 percent of the 40 respondents as being driven by tough economic conditions, while 20 percent disagreed with this claim and 8 percent of the respondents were neutral.
Respondents were asked if there were any other crimes they considered to be driven by difficult economic conditions that had been observed in their jurisdiction. The results were fairly split. Twenty-one (53 percent) respondents noted that some factors were influenced by the economy, while 19 (48 percent) respondents did not cite observing any such instances. The breakdown of the 21 respondents consisted of 10 (48 percent) instances of fraud, nine (43 percent) noting an increase in domestic violence, and two (10 percent) observed other factors, including an increase in shoplifting and an increase in murders.
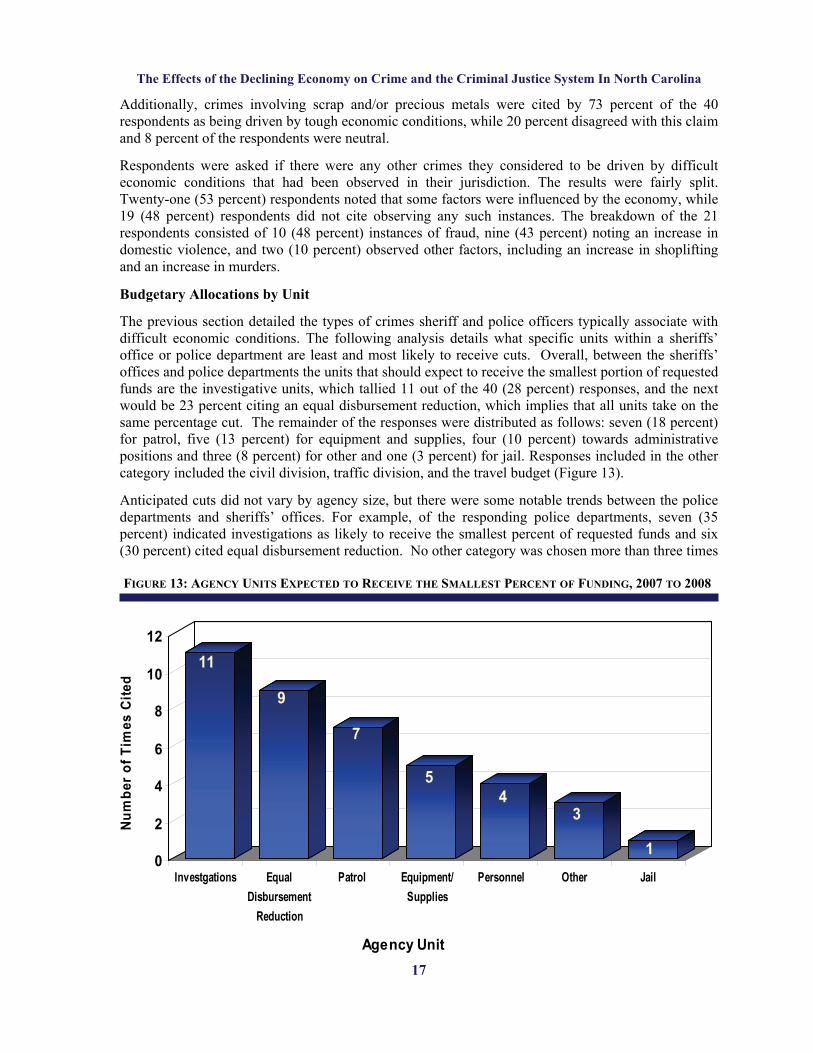
Budgetary Allocations by Unit
The previous section detailed the types of crimes sheriff and police officers typically associate with difficult economic conditions. The following analysis details what specific units within a sheriffs’ office or police department are least and most likely to receive cuts. Overall, between the sheriffs’ offices and police departments the units that should expect to receive the smallest portion of requested funds are the investigative units, which tallied 11 out of the 40 (28 percent) responses, and the next would be 23 percent citing an equal disbursement reduction, which implies that all units take on the same percentage cut. The remainder of the responses were distributed as follows: seven (18 percent) for patrol, five (13 percent) for equipment and supplies, four (10 percent) towards administrative positions and three (8 percent) for other and one (3 percent) for jail. Responses included in the other category included the civil division, traffic division, and the travel budget (Figure 13).
Anticipated cuts did not vary by agency size, but there were some notable trends between the police departments and sheriffs’ offices. For example, of the responding police departments, seven (35 percent) indicated investigations as likely to receive the smallest percent of requested funds and six (30 percent) cited equal disbursement reduction. No other category was chosen more than three times
FIGURE 13: AGENCY UNITS EXPECTED TO RECEIVE THE SMALLEST PERCENT OF FUNDING, 2007 TO 2008
The Effects of the Declining Economy on Crime and the Criminal Justice System In North Carolina
18
as being likely to receive the smallest percent of requested funds. On the other hand, the sheriffs’ offices results for which units would receive the smallest percent of requested funds were more dispersed, with patrol and investigation each chosen four times (20 percent for each). Personnel, equal disbursement reduction, and other were each chosen three times (15 percent for each), equipment and supplies were chosen twice (10 percent) and jail once (5 percent). From these responses it can be inferred that the investigative departments will likely absorb a significant impact of the expected budget cut.
The following sections will discuss structural changes and innovative policing strategies that are being used or agencies anticipate using to compensate for funding reductions.
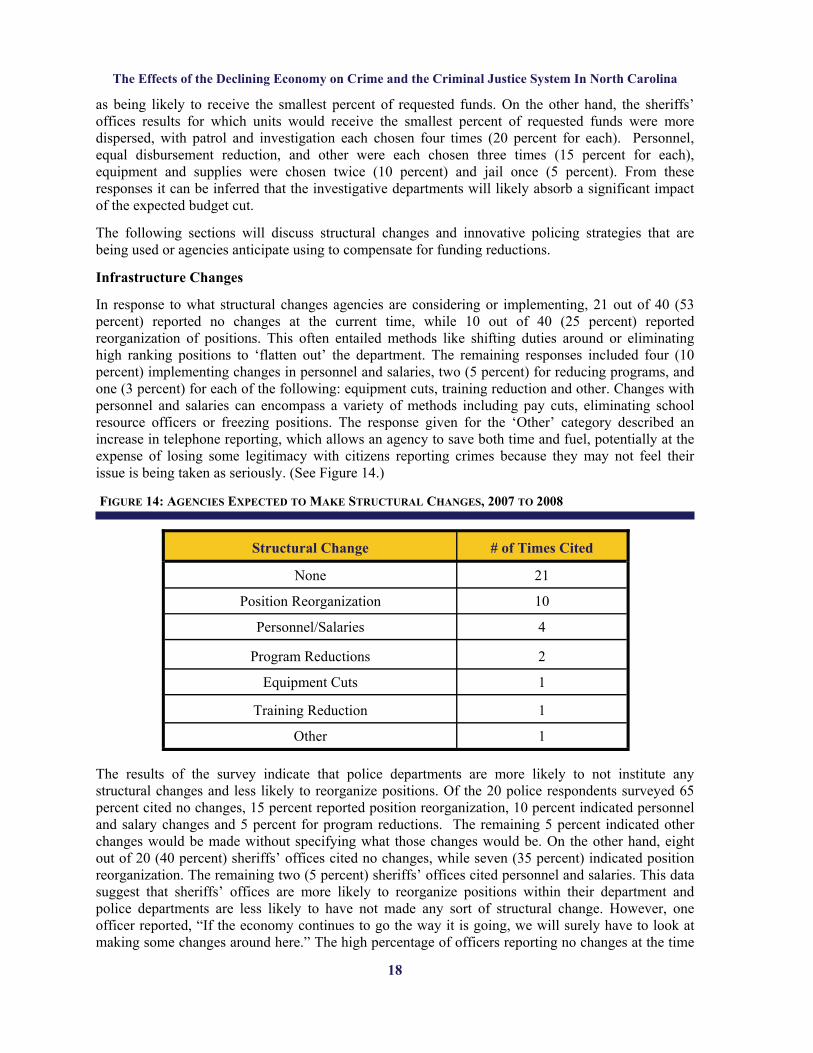
Infrastructure Changes
In response to what structural changes agencies are considering or implementing, 21 out of 40 (53 percent) reported no changes at the current time, while 10 out of 40 (25 percent) reported reorganization of positions. This often entailed methods like shifting duties around or eliminating high ranking positions to ‘flatten out’ the department. The remaining responses included four (10 percent) implementing changes in personnel and salaries, two (5 percent) for reducing programs, and one (3 percent) for each of the following: equipment cuts, training reduction and other. Changes with personnel and salaries can encompass a variety of methods including pay cuts, eliminating school resource officers or freezing positions. The response given for the ‘Other’ category described an increase in telephone reporting, which allows an agency to save both time and fuel, potentially at the expense of losing some legitimacy with citizens reporting crimes because they may not feel their issue is being taken as seriously. (See Figure 14.)
The results of the survey indicate that police departments are more likely to not institute any structural changes and less likely to reorganize positions. Of the 20 police respondents surveyed 65 percent cited no changes, 15 percent reported position reorganization, 10 percent indicated personnel and salary changes and 5 percent for program reductions. The remaining 5 percent indicated other changes would be made without specifying what those changes would be. On the other hand, eight out of 20 (40 percent) sheriffs’ offices cited no changes, while seven (35 percent) indicated position reorganization. The remaining two (5 percent) sheriffs’ offices cited personnel and salaries. This data suggest that sheriffs’ offices are more likely to reorganize positions within their department and police departments are less likely to have not made any sort of structural change. However, one officer reported, “If the economy continues to go the way it is going, we will surely have to look at making some changes around here.” The high percentage of officers reporting no changes at the time
Structural Change # of Times Cited
None 21
Position Reorganization 10
Personnel/Salaries 4
Program Reductions 2
Equipment Cuts 1
Training Reduction 1
Other 1
FIGURE 14: AGENCIES EXPECTED TO MAKE STRUCTURAL CHANGES, 2007 TO 2008

The Effects of the Declining Economy on Crime and the Criminal Justice System In North Carolina
19
of the survey suggests that departments have an established infrastructure and major changes in an agency’s operations would likely be unfeasible and possibly counterproductive. As a result, many agencies simply try to do more with less.
Policing Strategies
The survey results obtained regarding what, if any, innovative policing strategies agencies have taken on are very consistent in proportion regardless of agency size or type. Of the 40 respondents interviewed, 14 (35 percent) reported not currently using or not yet having anticipated using any innovative police strategies to cope with the probable reduction in funding. Of those 14, there were seven police and seven sheriff departments each citing no changes as of yet.
Other innovative policing strategies noted from the police and sheriff departments included five (13 percent) citing more efforts towards obtaining grants and funding, five reporting technology uses, and five claiming using atypical patrol methods. Furthermore, four (10 percent) respondents cited relying more heavily on community help and involvement, while seven (18 percent) officers cited other innovative strategies. These other strategies included more in service training, Values, Influence and Peers programs, eliminating work duplication, instituting civil citation programs and hiring part-time help. Other atypical patrol strategies included methods such as policing on foot or bicycle or by doubling the number of officers per car. An officer of an agency utilizing technology stated, “Since we are stretched so thin as a workforce, we have implanted cameras in high crime areas to better monitor those areas.” Overall, when the budget begins to tighten agencies look at different ways to save or generate money or seek alternative methods to help make their services more efficient by, essentially, doing more with less.
Impact on State Agencies
The following section will present status updates from the following four government agencies: Department of Juvenile Justice and Delinquency Prevention, Department of Correction, Administrative Office of the Courts and the Department of Crime Control and Public Safety.
Department of Juvenile Justice and Delinquency Prevention
The Department of Juvenile Justice and Delinquency Prevention (DJJDP) is an example of one of the many governmental agencies adversely affected by budget cuts. A top level administrator of the DJJDP stated that the current fiscal situation has “curtailed much of our training and travel and cut back on our ability to be out there, helping and supporting our core services.” Furthermore, he states, “The economy has limited our ability to move forward with strategic planning and has negatively impacted our ability to train, hire, and retain quality staff, in addition to adversely affecting our ability to purchase needed materials.” With the reduction in funding to the DJJDP, the administrator anticipates that the children and families involved with the department will have reduced opportunities for prevention programs and the public will be more at risk for juvenile delinquency.
Department of Correction
A top level administrator with the Department of Correction explained that the current fiscal situation of the state is having a large impact on his department, as he explained that it has “limited our ability
The Effects of the Declining Economy on Crime and the Criminal Justice System In North Carolina
20
to expand capabilities to improve our core mission of public safety.” The main areas that will be impacted are reduced services to offenders, victims, sheriffs, and courts. With the department’s ability to provide services now limited due to budget constraints, the administrator stated, “Ninety-six percent of offenders will return to their community, which is why we want to provide our services so that the vast majority of North Carolina citizens are unaware as these offenders assimilate back into their communities.” The administrator cited that as a state we are seeing an “exponentially increasing offender population as the state’s population increases.” He estimates that as many as eight prisons could possibly be closed in the near future. Doubling the number offenders or double bunking in cells is another method that may have to be implemented to accommodate the increasing prison population.
Administrative Office of the Courts
Responses from the North Carolina AOC echoed many of the aforementioned inefficiencies and problems with the courts. A top level director of the AOC explained that the department “understood and anticipated the budget decrease in the fall, so disruption has been minimal, but continuing operations without an adequate budget is going to have a tremendous impact in the near future.” When faced with a decrease in funding, the director cited that, “In the short term, cases move slower and access to basic services become limited. Then, in the long term justice delayed is justice denied, which becomes the long term impact of an inability to move civil and criminal cases through the system.” The top level director cited problems with making payroll and even proposed the possibly of implementing “furloughs two to three days a month to get enough operating money to pay for essential services.” In March 2009, the AOC cut the mileage rate from 50.5 cents to 20 cents, which cut travel reimbursements by more than half. The AOC has also made a proposal to the General Assembly allowing them to increase fees in lieu of budget cuts. They have proposed $72 million in fee increases to be adopted. For example changing the failure to appear fee from $100 to $200 would generate an estimated $5,714,267 in additional operating revenue.
Department of Crime Control and Public Safety
A top ranking administrator from the Department of Crime Control and Public Safety cited having his entire agency “operating with a budget cut of seven percent” and then further explaining that the agency “has instituted a hiring freeze for many jobs and a slowdown or freeze in ordinary expenditures.” This administrator explained that it is difficult to quantify the effects of a reduced police presence in the short term. However, he states that “in the long-term studies show that crime rates and crash rates do reliably correlate to police-population ratios. As a result these sworn positions are being protected from being cut, but new positions will not be added.” The administrator expressed concern that the overall long term effectiveness of agencies may suffer if various daily operations continue being postponed.

The Effects of the Declining Economy on Crime and the Criminal Justice System In North Carolina
21
Department of Justice
Department of Justice officials said that the department continues to carry out its core mission of public protection and legal representation uninterrupted by state budget constraints. The Attorney General has directed that efficiencies be made to accommodate budget restrictions. Budget reductions have affected the Department of Justice’s work in a number of ways. Travel restrictions have limited the ability of agents and analysts from the State Bureau of Investigation from attending specialized training for law enforcement. Local law enforcement agencies from across the state have limited attendance to continuing education at the Justice Academy training sessions and the numbers of public protection and education sessions on topics such as identity theft and internet safety have been reduced. Funds recouped from consumer protection settlements are being redirected from consumer education and restitution to fund consumer protection specialists. Vacant positions through all divisions — the SBI, Criminal Justice Training and Standards and Legal Services — have been eliminated, law enforcement vehicle replacement purchases have been halted and overtime for law enforcement has been significantly curtailed. The DOJ has continued to work to ensure and enhance public safety despite the budget shortfall.
Summary
The general assumption that when the economy experiences a downturn, crime rates start going up was not supported by the research. Data was obtained for a 30-year time period, 1977 through 2007. During this time, the United States experienced five recessionary periods:
January 1980 to July 1980 Increase in Interest Rates/Inflation
July 1981 to November 1982 Iranian Revolution and Increasing Oil Prices
July 1990 to March 1991 Savings and Loan Crisis
March 2001 to November 2001 Dot.com Bubble Burst/September 11 Terrorist Attacks
December 2007 to Present Collapse of the Housing Market/Credit Crisis/Oil Prices
While modest spikes in crime rates correlated with some economic indicators (for example, motor vehicle thefts and unemployment rates) during these recessions, the overall trends did not indicate a dramatic change in crime rates in response to negative changes in the economy. As more specific criminal statistical data becomes available and economic indicators can be refined, further research may be warranted.
The enduring effects of the economic downturn will impact law enforcement agencies statewide. The survey shows sheriffs’ offices and police departments are experiencing the effects of the recession through both crimes committed and budgetary restraints. The constant theme stated by the agencies surveyed remains how to do more with less as these agencies grapple with maintaining a level of service to the public with a concurrent decreased level of funding. As reported earlier by one police chief, “. . . the demand for law enforcement services goes up, yet our budgets are being cut and when cuts are made, the ultimate loser is the citizen.”
The Effects of the Declining Economy on Crime and the Criminal Justice System In North Carolina
22
References
Allen, R.C. (1996). Socioeconomic conditions and property crime: A comprehensive review and test of the professional literature. The American Journal of Economics and Sociology, 55 (3), p. 293-308.
Becker, G. (1968). Crime and punishment: An economic approach. Journal of Political Economy, 76 (2), p. 169-217.
Bunge, V.P., Johnson, H., & Balde, T.A. (2005). Exploring crime patterns in Canada. Retrieved on May 20, 2009, from http://www.statcan.gc.ca/pub/85-561-m/85-561-m2005005-eng.htm
Cantor, D. & Land, K.C. (1985). Unemployment and crime rates in the post-World War II United States: A theoretical and empirical analysis. American Sociological Review, 50, p. 317-332.
Clarke, A. & Witt, R. (2000). Crime and the Labor Market. In N. G. Fielding (Ed.), Economic Dimensions of Crime (pp. 158-159). New York, NY: Palgrave Macmillan
Devine, J.A., Sheley, J.F., & Smith, M.D. (1988). Macroeconomic and social-control policy influences on crime rate changes, 1948-1985. American Sociological Review, 53 (3), p. 407-420.
Fischer, I. (1973). Participation in illegitimate activities: A theoretical and empirical investigation. Journal of Political Economy, 81 (3), p. 521-565.
Fischer, C. (2009). [Survey on the impact of the economic recession on crime and on police budgets]. Unpublished raw data.
Levitt, S. D., & Dubner, S. J. (2006). Freakonomics. New York, NY: HarperCollins Publishers.
Neustrom, M., Jamieson, J., Manual. D., & Gramlin, B. (1988). Regional unemployment and crime trends: An empirical examination. Journal of Criminal Justice, 16 (5), p. 394-402.
Oster, A., & Agell, J. (2007). Crime and unemployment in turbulent times. Journal of the European Economic Association, 5 (4), p. 752-775.
Police Executive Research Forum. (2009). Retrieved July 10, 2009, from Police Executive Research Forum, Washington, DC. Web site: http://www.policeforum.org/.
Young, T. J. (1993). Unemployment and property crime: Not a simple relationship. The American Journal of Economics and Sociology, 52 (4), p. 413-415.

The Effects of the Declining Economy on Crime and the Criminal Justice System In North Carolina
23
Local Police Departments
County Sheriff’s Offices
Appendix A
Agencies Participating in the Survey
Sheriff’s Office Police Departments
Alamance County Ayden
Alexander County Boone
Ashe County Chapel Hill
Avery County Concord
Brunswick County Fremont
Buncombe County Kings Mountain
Cherokee County Marion
Forsyth County Nags Head
Gaston County Newland
Granville County Oriental
Haywood County Pine Level
Mecklenburg County Pinehurst
Montgomery County Plymouth
Person County Rose Hill
Polk County Rowland
Richmond County Siler City
Rutherford County Tabor City
Sampson County Wallace
Stokes County Weldon
Surry County Zebulon
The Effects of the Declining Economy on Crime and the Criminal Justice System In North Carolina
24
Appendix B
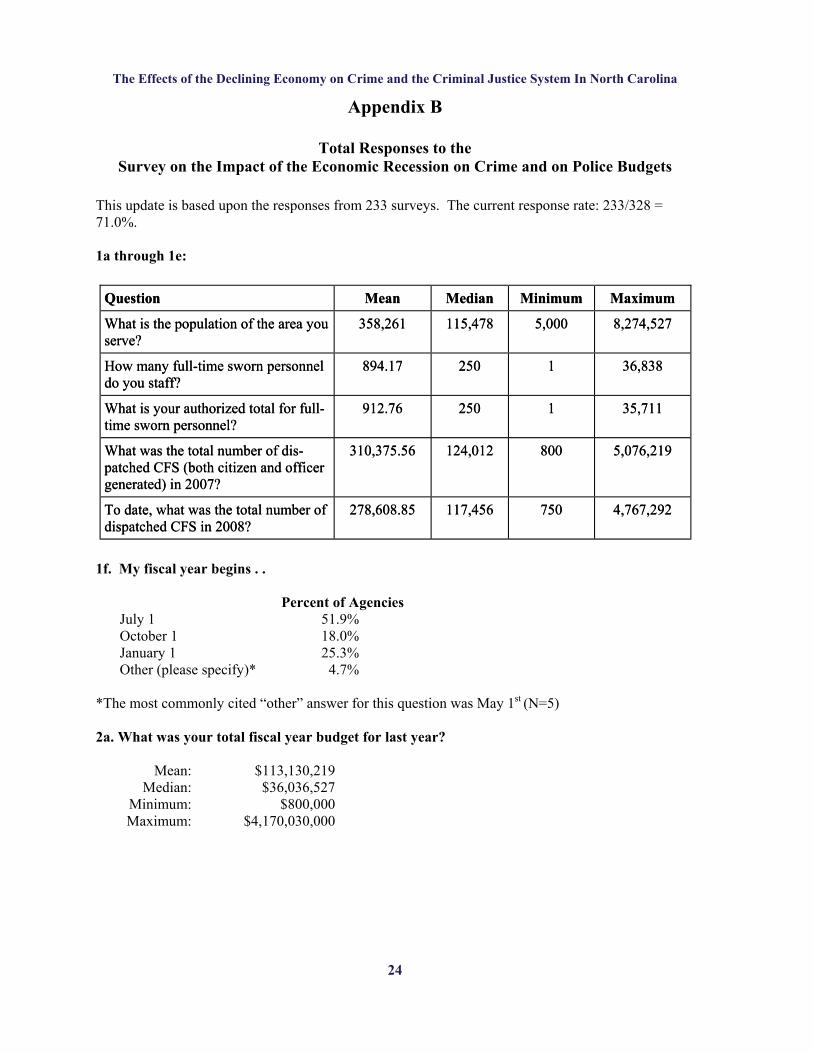
Total Responses to the Survey on the Impact of the Economic Recession on Crime and on Police Budgets
This update is based upon the responses from 233 surveys. The current response rate: 233/328 = 71.0%. 1a through 1e:
1f. My fiscal year begins . . Percent of Agencies July 1 51.9% October 1 18.0% January 1 25.3% Other (please specify)* 4.7% *The most commonly cited “other” answer for this question was May 1st (N=5) 2a. What was your total fiscal year budget for last year? Mean: $113,130,219 Median: $36,036,527 Minimum: $800,000 Maximum: $4,170,030,000
Question Mean Median Minimum Maximum
What is the population of the area you serve?
358,261 115,478 5,000 8,274,527
How many full-time sworn personnel do you staff?
894.17 250 1 36,838
What is your authorized total for full-time sworn personnel?
912.76 250 1 35,711
What was the total number of dis-patched CFS (both citizen and officer generated) in 2007?
310,375.56 124,012 800 5,076,219
To date, what was the total number of dispatched CFS in 2008?
278,608.85 117,456 750 4,767,292

The Effects of the Declining Economy on Crime and the Criminal Justice System In North Carolina
25
2b. Did last year’s fiscal year budget decrease, increase, or remain the same from your prior year’s fiscal budget?
2c. Did your funding keep pace with what your agency needed to maintain existing operations
and staffing levels? 32.3% of agencies responding to the survey said ‘No’ 67.7% of agencies responding to the survey said ‘Yes’ 3a. What is your current total fiscal year budget? Mean: $118,151,103.79 Median: $37,100,000 Minimum: $866,000 Maximum: $4,416,738,000 3b. Did your funding keep pace with what your agency needed to maintain existing operations
and staffing levels? 61.2% of agencies responding to the survey indicated it ‘Had kept pace’ 38.8% of agencies responding to the survey indicated it ‘Had not kept pace’ 3c. Were budgets for other departments in your jurisdiction reduced this year? 72.1% of agencies responding to the survey indicated ‘Yes’ 26.6% of agencies responding to the survey indicated ‘No’ 0.4% of agencies responding to the survey indicated the question was ‘Not Applicable’ 4. Are you currently preparing plans for an overall budget cut to your agency for the next fiscal
year? 62.9% of agencies indicated ‘Yes’ 37.1% of agencies indicated ‘No’ 4a. If “yes,” have you already been told to expect cuts by your governing authority? 87.6% of agencies indicated ‘Yes’ 4b. What percentage cut(s) are you planning overall for your agency? (can choose multiple
scenarios) The weighted mean for both scenarios came to 6.24%
Change Percent of Agencies
Mean
Decreased 11.6% 3.71
Increased 79.7% 6.25
Remained the same 8.6% ---
Change Percent of Agencies
Mean
Decreased 11.6% 3.71
Increased 79.7% 6.25
Remained the same 8.6% ---

The Effects of the Declining Economy on Crime and the Criminal Justice System In North Carolina
26
4c. What is the best estimate of how you will generally aim to divide the total dollar cuts among various functions and units?
* “Other” cuts include supplies, equipment, leaving projected staff vacancies unfilled, delay cadet
classes, ammunition, fuel, part-time employee reductions, revenue enhancements, investigative services, citizen patrols, jail incarceration fees, contract fees, special events, membership dues, DARE.
**Capital expenses included facility-related capital/building improvement, weapons, uniforms,
closing facilities, communication, and general equipment purchases and upkeep.
Type of Budget Cut Mean (in percentages)
Sworn Personnel 28.02%
Civilian Personnel 13.91%
Overtime 10.61%
Other* 7.43%
Training 6.82%
Capital Expenses** 6.08%
Administrative/Support 5.79%
Vehicle Fleet 5.10%
Maintenance 2.53%
Technology 2.46%
Recruitment 2.31%
Type of Budget Cut Mean (in percentages)
Sworn Personnel 28.02%
Civilian Personnel 13.91%
Overtime 10.61%
Other* 7.43%
Training 6.82%
Capital Expenses** 6.08%
Administrative/Support 5.79%
Vehicle Fleet 5.10%
Maintenance 2.53%
Technology 2.46%
Recruitment 2.31%
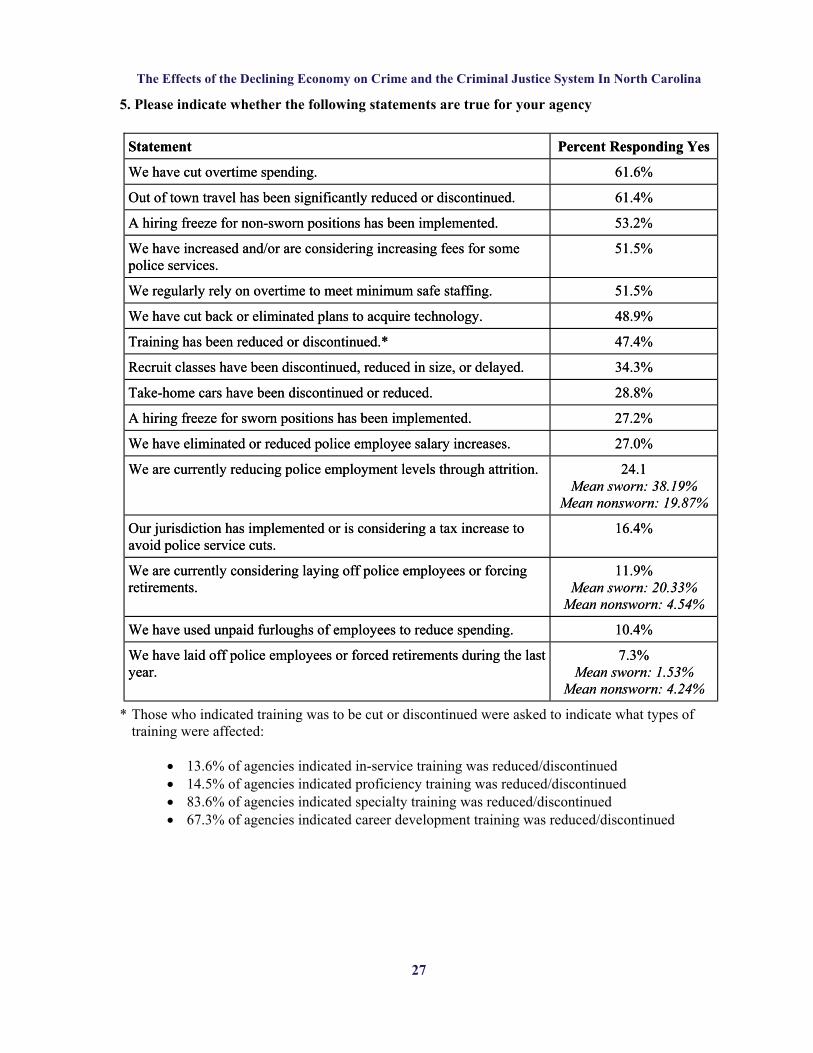
The Effects of the Declining Economy on Crime and the Criminal Justice System In North Carolina
27
5. Please indicate whether the following statements are true for your agency
* Those who indicated training was to be cut or discontinued were asked to indicate what types of
training were affected:
13.6% of agencies indicated in-service training was reduced/discontinued 14.5% of agencies indicated proficiency training was reduced/discontinued 83.6% of agencies indicated specialty training was reduced/discontinued 67.3% of agencies indicated career development training was reduced/discontinued
Statement Percent Responding Yes
We have cut overtime spending. 61.6%
Out of town travel has been significantly reduced or discontinued. 61.4%
A hiring freeze for non-sworn positions has been implemented. 53.2%
We have increased and/or are considering increasing fees for some police services.
51.5%
We regularly rely on overtime to meet minimum safe staffing. 51.5%
We have cut back or eliminated plans to acquire technology. 48.9%
Training has been reduced or discontinued.* 47.4%
Recruit classes have been discontinued, reduced in size, or delayed. 34.3%
Take-home cars have been discontinued or reduced. 28.8%
A hiring freeze for sworn positions has been implemented. 27.2%
We have eliminated or reduced police employee salary increases. 27.0%
We are currently reducing police employment levels through attrition. 24.1 Mean sworn: 38.19%
Mean nonsworn: 19.87%
Our jurisdiction has implemented or is considering a tax increase to avoid police service cuts.
16.4%
We are currently considering laying off police employees or forcing retirements.
11.9% Mean sworn: 20.33%
Mean nonsworn: 4.54%
We have used unpaid furloughs of employees to reduce spending. 10.4%
We have laid off police employees or forced retirements during the last year.
7.3% Mean sworn: 1.53%
Mean nonsworn: 4.24%

The Effects of the Declining Economy on Crime and the Criminal Justice System In North Carolina
28
6. Please indicate on a scale of 1 (strongly disagree) to 5 (strongly agree) your feelings about the following statements.
* Of those that indicated 3-5 to this question, they were asked to indicate which of the following
they would be damaged by budget cuts. Responses included facility maintenance, morale of the agency, reduction/elimination of specialized units, community policing, community programs, overtime, support functions, investigations, cuts to proactive programs/return to reactive patrol, diversity recruitment, recruitment/retention, loss of officers to other agencies, reduction in training opportunities, civilianization of sworn positions, reduction/elimination of capital projects.
** New types of crime patterns included robberies (general, armed, bank, etc.), metal (especially
copper) theft, fraud, robbery of non-citizens, gang violence, drug dealing, aggravated assaults, vehicle thefts, shoplifting, domestic violence, theft from vehicles, burglaries/breaking and entering, home invasions, theft from foreclosures/abandoned properties, trespassers/squatters at foreclosed homes, larceny, destruction of foreclosed homes, decline in narcotics violations, homicide, suicide, property crimes in general (undefined).
Statement Mean
Sworn officer positions should be the last thing cut in the budget. 4.39
Budget cuts will hurt the long-term quality of my agency.* 3.89
My jurisdiction is already experiencing significant signs of economic distress. 3.62
I would cut non-sworn support personnel before any sworn positions. 3.42
We are seeing new types of crime patterns, such as burglaries of vacant homes and busi-nesses (define).**
2.92
Maintaining contributions for police employee pensions is becoming a serious problem. 2.79
Police services in my community will decline with the implementation of already-implemented or planned budget cuts.
2.68
My agency obtains most of its funding for capital improvements through municipal bonds, so capital spending is better protected against any fluctuations in regular annual appropriations.
2.59
I expect to obtain concessions from labor unions in future negotiations because of the economic downturn and/or police agency budget cuts.
2.52
One year from now, I expect to have fewer officers on the street because of budget cuts. 2.41
One year from now, I expect our response time to emergency calls will have increased due to budget cuts.
2.33
I would cut some sworn positions to maintain critical elements of my training budget. 2.16
I would cut some sworn positions to maintain equipment budgets. 1.89
I would cut some sworn positions to allow for the acquisition of technology. 1.80

The Effects of the Declining Economy on Crime and the Criminal Justice System In North Carolina
29
7. Please check any type of reorganization that you are planning in your department in response to the deteriorating economy
* Examples of discontinuing special units include street crimes unit, narcotics task force/unit,
delaying the implementation of a community services unit, traffic enforcement, community policing unit, SROs, bicycle team, park security team (civilian), fugitive apprehension unit, directed policing unit, special events, vice, parole, intervention, gang unit, federal partnerships, DARE, GREAT, economic crime unit, cold case squad, crime prevention, mounted units.
** Examples of contracting out for services include making use of contractors to reduce sworn
staffing at special events, crime scene processing, fee collection, animal control, background investigations for nonsworn personnel, alarm billing, fleet maintenance, DNA testing, provide first point of contact services for the community, fingerprinting, parking ticket processing, building maintenance, jail infirmary, victim services, transcription, equipment installation for cars, helicopter inspections, security at city buildings, online accident and offense reports.
*** Other 1 includes expanding the use of civilian and part time personnel, decreased staffing in
special units (but not eliminating them or making cuts to existing staff), delaying the filling of open positions, online citizen reporting of crimes, reducing on-call pay and overtime, expanding the use of 311 to other calls, decentralization, increased use of phone reporting, reduction in command positions, reduction in overtime, reduced on-call pay, greater reliance on asset forfeiture, consolidating bureaus (thereby eliminating positions), delay in facility repairs.
****Other 2 includes expanding online reporting, making investigative cutbacks before patrol. 8a. Please provide your crime data for 2008
Reorganization Type
Percent Responding Yes
Greater reliance on less costly civilian staff 42.9%
Discontinuing or delaying response to certain types of CFS 36.1%
Discontinuing special units (specify)* 29.4%
Reducing public access hours at district stations 15.9%
Contracting out for services (specify)** 14.7%
Other 1*** 11.8%
Closing or consolidating district stations 9.9%
Other 2**** 1.8%
Mean
Total number of violent crime incidents 2,845.21
Total number of property crime incidents 13,050.85
Mean
Total number of violent crime incidents 2,845.21
Total number of property crime incidents 13,050.85
Reorganization Type
Percent Responding Yes
Greater reliance on less costly civilian staff 42.9%
Discontinuing or delaying response to certain types of CFS 36.1%
Discontinuing special units (specify)* 29.4%
Reducing public access hours at district stations 15.9%
Contracting out for services (specify)** 14.7%
Other 1*** 11.8%
Closing or consolidating district stations 9.9%
Other 2**** 1.8%
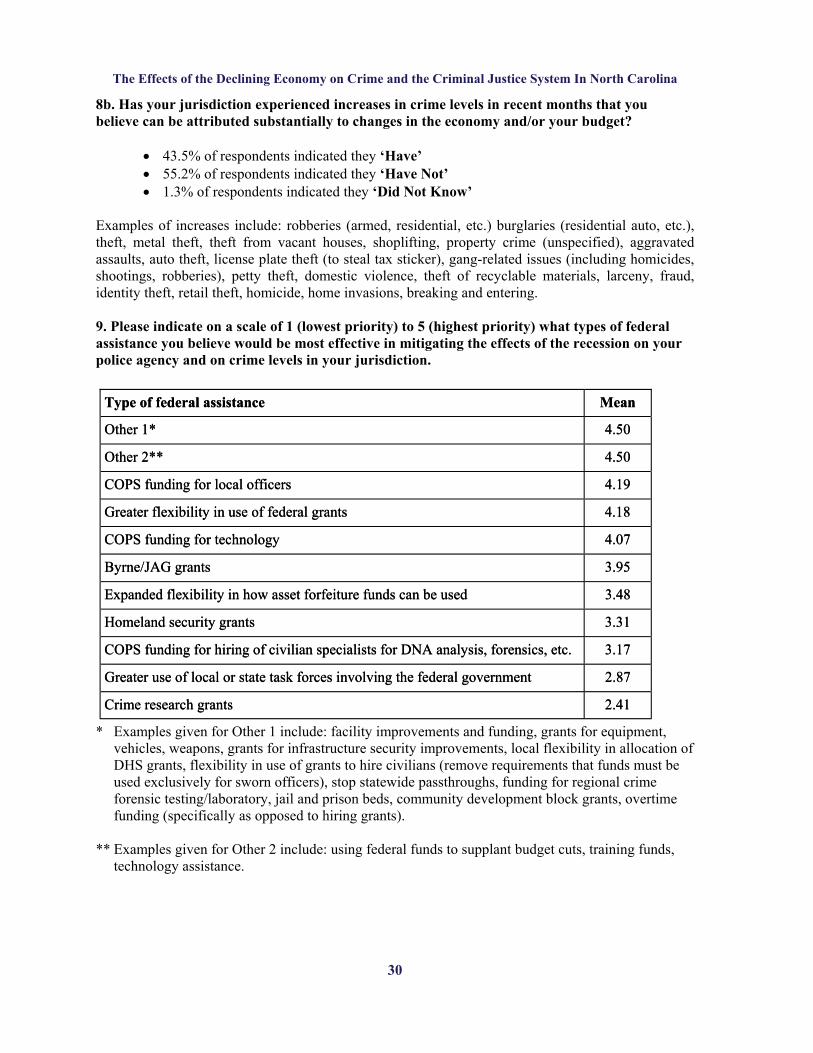
The Effects of the Declining Economy on Crime and the Criminal Justice System In North Carolina
30
8b. Has your jurisdiction experienced increases in crime levels in recent months that you believe can be attributed substantially to changes in the economy and/or your budget?
43.5% of respondents indicated they ‘Have’ 55.2% of respondents indicated they ‘Have Not’ 1.3% of respondents indicated they ‘Did Not Know’
Examples of increases include: robberies (armed, residential, etc.) burglaries (residential auto, etc.), theft, metal theft, theft from vacant houses, shoplifting, property crime (unspecified), aggravated assaults, auto theft, license plate theft (to steal tax sticker), gang-related issues (including homicides, shootings, robberies), petty theft, domestic violence, theft of recyclable materials, larceny, fraud, identity theft, retail theft, homicide, home invasions, breaking and entering. 9. Please indicate on a scale of 1 (lowest priority) to 5 (highest priority) what types of federal assistance you believe would be most effective in mitigating the effects of the recession on your police agency and on crime levels in your jurisdiction.
* Examples given for Other 1 include: facility improvements and funding, grants for equipment,
vehicles, weapons, grants for infrastructure security improvements, local flexibility in allocation of DHS grants, flexibility in use of grants to hire civilians (remove requirements that funds must be used exclusively for sworn officers), stop statewide passthroughs, funding for regional crime forensic testing/laboratory, jail and prison beds, community development block grants, overtime funding (specifically as opposed to hiring grants).
** Examples given for Other 2 include: using federal funds to supplant budget cuts, training funds,
technology assistance.
Type of federal assistance Mean
Other 1* 4.50
Other 2** 4.50
COPS funding for local officers 4.19
Greater flexibility in use of federal grants 4.18
COPS funding for technology 4.07
Byrne/JAG grants 3.95
Expanded flexibility in how asset forfeiture funds can be used 3.48
Homeland security grants 3.31
COPS funding for hiring of civilian specialists for DNA analysis, forensics, etc. 3.17
Greater use of local or state task forces involving the federal government 2.87
Crime research grants 2.41

The Effects of the Declining Economy on Crime and the Criminal Justice System In North Carolina
31