economic analysis of grid connected wind generation …
TRANSCRIPT

ECONOMIC ANALYSIS OF GRID CONNECTED WIND GENERATION PLANTS
IN SOUTH AFRICA
Tamai Hore
A research report submitted to the Faculty of Engineering and Built Environment,
University of the Witwatersrand, in partial fulfilment of the requirements for the degree
of Master of Science in Engineering
Johannesburg, 16 September 2014

i
Table of Contents
DECLARATION ................................................................................................................................iv
ABSTRACT ...................................................................................................................................... v
LIST OF FIGURES ............................................................................................................................vi
LIST OF TABLES ............................................................................................................................. vii
LIST OF ACRONYMS ..................................................................................................................... viii
ACKNOWLEDGEMENTS ................................................................................................................. ix
1 THE RESEARCH OVERVIEW ........................................................................................... 1
1.1 Introduction .................................................................................................................. 1
1.2 Research objectives ....................................................................................................... 3
1.3 Knowledge to be gained ................................................................................................ 4
1.4 Research hypothesis...................................................................................................... 5
1.5 The research methodology ........................................................................................... 5
1.6 Research report structure ............................................................................................. 6
2 THEORY OF WIND ENERGY ........................................................................................... 9
2.1 The Betz Limit .............................................................................................................. 11
2.2 Types of wind turbines ................................................................................................ 12
2.3 Advantages and disadvantages of the VAWT ............................................................. 13
2.4 Advantages and Disadvantages of the HAWT ............................................................. 14
2.5 Power curve of a wind turbine .................................................................................... 14
2.6 Annual wind speed distribution .................................................................................. 15
2.7 Annual energy distribution .......................................................................................... 16
2.8 Concluding remarks ..................................................................................................... 17
3 RENEWABLE ENERGY POLICIES AND SUPPORT SCHEMES USED IN EUROPE 18
3.1 Types of renewable energy support schemes ............................................................ 18
3.1.1 Feed in Tariffs ...................................................................................................... 19
3.1.2 Premium .............................................................................................................. 19
3.1.3 Quota obligation.................................................................................................. 19
3.1.4 Tax Incentives ...................................................................................................... 20
3.1.5 Fiscal incentives ................................................................................................... 20
3.1.6 Tendering or bidding or auctions scheme ........................................................... 21
3.2 Analysis of support schemes used for wind energy in European countries ............... 22
3.2.1 Development of renewable energy in Germany ................................................. 23

ii
3.2.2 Development of wind energy in Spain ................................................................ 25
3.2.3 Development of wind energy in Denmark .......................................................... 26
3.2.4 Development of wind energy in United Kingdom ............................................... 26
3.2.5 Development of wind energy in China ................................................................ 28
3.2.6 Development of wind energy in India ................................................................. 28
3.3 Concluding Remarks .................................................................................................... 29
4 DEVELOPMENT OF WIND ENERGY IN SOUTH AFRICA ......................................................... 30
4.1 Barriers to wind energy in South Africa ...................................................................... 31
4.1.1 Electricity market structure ................................................................................. 31
4.1.2 Grid access ........................................................................................................... 32
4.1.3 Tariffs ................................................................................................................... 33
4.1.4 Societal acceptance ............................................................................................. 34
4.1.5 Administrative barriers........................................................................................ 34
4.1.6 Financial............................................................................................................... 35
4.1.7 Skills ..................................................................................................................... 35
4.2 Support schemes considered by South Africa ............................................................. 35
4.2.1 Overview of the REFIT scheme designed by NERSA ............................................ 36
4.2.2 Why REFIT was abandoned ................................................................................. 37
4.2.3 Overview of the bidding scheme designed by the DoE....................................... 39
4.3 Concluding remarks ..................................................................................................... 40
5 FACTORS THAT DETERMINE THE ECONOMICS OF WIND GENERATION ............................. 42
5.1 Electricity production - Wind resources ...................................................................... 42
5.1.1 Evaluation of wind resources in South Africa. .................................................... 43
5.2 Capital cost/ Investment cost...................................................................................... 47
5.2.1 Prices of wind turbines ........................................................................................ 48
5.2.2 Grid connection cost ........................................................................................... 49
5.2.3 Cost of balance of plant ...................................................................................... 50
5.2.4 Project development costs .................................................................................. 50
5.3 Finance costs / Discount rate ...................................................................................... 51
5.4 Operation and Maintenance (O&M) Cost ................................................................... 52
5.5 Lifetime of turbines ..................................................................................................... 53
5.6 Concluding remarks ..................................................................................................... 53
6 EVALUATION OF REBID SCHEME ......................................................................................... 54

iii
6.1 Rule of Law, Renewable Energy Policy and Regulatory Environment ........................ 54
6.2 Social acceptance and participation of all role players from an early stage ............... 55
6.3 Technology .................................................................................................................. 56
6.4 Wind resources (Sites chosen by IPPs) ........................................................................ 57
6.5 Capacity allocation and Tariffs under REBID ............................................................... 58
6.6 Capital investment cost ............................................................................................... 59
6.7 Operation and maintenance costs .............................................................................. 60
6.8 Grid connection ........................................................................................................... 60
6.9 Concluding remarks ..................................................................................................... 61
7 LEVELISED COST OF ELECTRICITY (LCOE) FOR WIND ........................................................... 63
7.1.1 Capital cost .......................................................................................................... 64
7.1.2 Discount rate ....................................................................................................... 64
7.1.3 Capacity Factor .................................................................................................... 67
7.1.4 Life cycle of the project ....................................................................................... 67
7.1.5 Annual Operation cost ........................................................................................ 67
7.2 LCOE calculation methodologies ................................................................................. 67
7.2.1 The results ........................................................................................................... 70
7.2.2 Sensitivity analysis ............................................................................................... 71
7.3 Limitation of the model used to calculate the LCOE ................................................... 72
7.4 Concluding Remarks .................................................................................................... 73
8 CONCLUSION ....................................................................................................................... 74
9 REFERENCES ........................................................................................................................ 76

iv
DECLARATION
I declare that this research project is my own unaided work. It is being submitted for the
Degree of Master of Science in Engineering to the University of the Witwatersrand
Johannesburg. It has not been submitted before for any degree or examination to any other
University
Day of Year

v
ABSTRACT
South Africa’s Integrated Resource Plan (IRP2010) has an allocation of 1850MW for
wind generation out of the 3725MW that should be generated from renewable energy.
Procurement of this renewable energy was to be done through the Renewable Energy
Feed-In Tariffs (REFIT). The National Energy Regulator of South Africa (NERSA) was
given the mandate by the Department of Energy (DoE) to determine REFIT tariffs that
are enough to attract investors and that would enable sustainability of renewable energy
projects in South Africa. NERSA successfully completed the determination of sustainable
REFIT rates in 2009. However, the DoE announced in 2010 that it would no longer
procure the renewable energy through the REFIT programme, but instead, opted for the
bidding process. The DoE believed that a competitive bidding process would bring in
more economic value than the REFIT process. This research will explore different support
schemes used to introduce renewable energy. More emphasis will be given to the
evaluation of the economic benefits of procuring electricity from grid connected wind
generation through the REFIT programme versus the bidding process. It also aims to
evaluate the success rate of REFIT programmes versus the bidding programmes by
benchmarking with international countries that successfully rolled out renewable energy.
Finally, the economics of wind generation in South Africa will be evaluated by
calculating the Levelised Cost of Energy (LCOE) in South Africa using the parameters
from the Renewable Energy Bidding (REBID) programme and a conclusion on the
sustainability of wind energy in South Africa will be made.

vi
LIST OF FIGURES
Figure 1: HAWT and VAWT configurations ............................................................................. 13
Figure 2: Power curve of a wind turbine .................................................................................... 15
Figure 3: Weibull curve .............................................................................................................. 16
Figure 4: Estimated Annual Energy Distribution curve ............................................................. 17
Figure 5: Renewable Energy Support Schemes used in European Countries ............................ 22
Figure 6: Cumulative wind installation in Germany .................................................................. 24
Figure 7: Performance of UK’s auction scheme ......................................................................... 27
Figure 8: Electricity price path in South Africa .......................................................................... 33
Figure 9: Diab's wind atlas map ................................................................................................. 43
Figure 10: Hagemann's wind atlas map (bottom) ....................................................................... 44
Figure 11: Location of wind mast .............................................................................................. 45
Figure 12: Large scale high resolution wind resource map of South Africa .............................. 46
Figure 13: European wind Atlas ................................................................................................. 47
Figure 14: Capital cost of an onshore wind farm ....................................................................... 48
Figure 15: Wind turbine prices by date of delivery (Euro/MW) ................................................ 49
Figure 16: Pie Chart showing turbine market share in South Africa .......................................... 56
Figure 17: Top 10 wind turbines by commissioned capacity in 2012 ......................................... 57
Figure 18: Distribution of wind farms ......................................................................................... 58
Figure 19: REBID capacity allocation and tariff comparison with REFIT ................................. 59
Figure 20: Eskom's existing and planned generation capacity ................................................... 61
Figure 21: Comparison of REBID LCOE with international benchmarks ................................. 71
Figure 22: Variation of LCOE with capacity factor .................................................................... 71
Figure 23: Sensitivity analysis of parameters affecting the LCOE ............................................. 72

vii
LIST OF TABLES
Table 1: REFIT Tariffs - 2009 ................................................................................................... 36
Table 2 REFIT Tariffs Phase II .................................................................................................. 37
Table 3: Financial parameters used to calculate discount rate for LCOE ................................... 66
Table 4: Financial parameters used to calculate LCOE in European countries .......................... 66
Table 5: Parameters used to calculate the LCOE for the base case ............................................. 68
Table 6: Low Case, Base case and high case values used to calculate the LCOE ...................... 69

viii
LIST OF ACRONYMS
COD Commercial Operation Date
COP17 17th Session of Conference of the Parties Conference
CSP Concentrated Solar Power
DANIDA Danish International Development Assistance
DBSA Development Bank of Southern Africa
DCF Discounted Cash Flow
DEA Danish Energy Agency
DoE Department of Energy
ECCR Economic Carrying Charge Rate
EEG Renewable Energy Sources Act, 2000 (Germany)
EWEA European Wind Energy Association
FIT Feed-In Tariff
HAWT Horizontal Axis Wind Turbine
IPP Independent Power Producer
IRENA International Renewable Energy Agency
ISMO Independent System and Market Operator
LCOE Levelised Cost of Energy
MFMA Municipal Finance Management Act
MYPD Multi-Year Price Determination
NERSA National Energy Regulator of South Africa
NFFO Non-Fossil Fuel Obligation
PFMA Public Finance Management Act
PPA Power Purchase Agreement
REBID Renewable Energy Bidding programme
REC Renewable Energy Certificate
REFIT Renewable Feed In Tariff
REFSO Renewable energy Finance Subsidy Office
ROC Renewable Obligation Certificate
SANERI South African National Energy Research Institute
VAWT Vertical Axis Wind Turbine
WACC Weighted Average Cost Of Capital
WASA Wind Atlas for South Africa

ix
ACKNOWLEDGEMENTS
This report would not have been possible without the support, encouragement, crucial
advice and guidance from many people.
I would like to thank God for giving me strength and determination to complete this
research report.
I acknowledge, with gratitude, my debt of thanks to my project supervisor, Dr John van
Coller, for all the useful comments, remarks, support and inspiration during this project.
I am also very much grateful to my wife, parents and family for their support,
encouragement and love.

1
1 THE RESEARCH OVERVIEW
1.1 Introduction
South Africa has a vast abundance of coal resources and Eskom, South Africa’s power
utility, relies heavily on coal for power generation. About 94%1 of Eskom’s power
generation fleet consists of coal-fired power stations which provide low cost electricity.
However, there has been an increasing demand for South African coal from the
international markets, forcing Eskom to compete with international buyers [1]. There is
therefore some risk that coal prices will rise significantly in the near future, thereby
increasing the generation cost of coal-fired power stations in South Africa. Furthermore
the impact of the resultant gas emissions produced by conventional coal-fired power
plants on global climate change is of major concern worldwide. South Africa has already
made commitment to reduce its carbon emissions during the 17th session of the
Conference of the Parties (COP17) held in Durban from 28 November 2011 to 09
December 2011. Apart from the risks mentioned above, South Africa is facing generation
capacity constraints and experienced load shedding in 2008 and 2014, hence it urgently
needs to increase its generation capacity to meet the ever growing electricity demand.
Introducing renewable energy in South Africa is a solution to the above challenges as it
will reduce South Africa’s carbon footprint as well as increasing its security of supply.
Renewable energy technologies such as wind and solar photovoltaic can be deployed in
a much shorter time than coal-fired power stations. Once operational, there is no fuel cost
for wind power plants unlike coal-fired power stations, thereby eliminating the risk of
loss of coal supply caused by the increasing global coal demand. The more there is a
diversified generation mix, the greater the security of supply.
However the challenge associated with the development of renewable energy projects is
that they generally have huge initial capital costs. Furthermore, the Levelised Cost Of
Energy (LCOE) from renewable energy is currently higher than electricity from
conventional coal-fired power stations. The low cost of electricity from coal in South
1Eskom’s Visitors brochure, “Eskom Powering the nation”. Issued by Generation Stakeholder Management and Communication
Department, March 2011.

2
Africa has aggravated this situation and has been the major barrier to the development of
renewable energy in South Africa. Moreover, from an investor’s point of view, renewable
energy projects are considered more risky because of technology or resource uncertainty.
For investors to invest in risky projects, they would need a higher return on investment
than what they would demand for conventional coal-fired power stations. Governments
around the world have therefore developed renewable energy support schemes which
either provide more revenue certainty (reducing the risk due to resource uncertainty) or
reduce the initial capital cost required (reducing the technology related uncertainty). The
most used support schemes are Feed-In Tariff (FIT), Premiums, Tendering and
Renewable Energy Obligations.
To be effective, renewable energy support schemes need to be backed up by adequate
renewable energy policy frameworks which will attract investors [2, 3]. In South Africa,
a renewable energy policy was produced in November 2003 (White Paper on the
Renewable Energy Policy [4]). In this policy, the Government acknowledges that South
Africa has an abundance of renewable energy resources that can be used to generate
renewable energy. However, a balance has to be made between the need for energy
security, economic growth, environmental benefits and cost of electricity to the
consumers. Affordability of electricity is a key issue in South Africa whose large
population did not have access to electricity in the apartheid era. The most appropriate
support scheme will therefore be one that will ensure that the electricity remains
affordable and that will also complement rural electrification. In the White Paper, the
government acknowledged that it cannot fund the renewable energy programme. Support
would therefore have to come from international investors, mostly from European and
other developing countries that have successfully rolled out renewable energy
technologies. What is remaining is therefore designing an attractive renewable energy
support scheme for these investors.
Initially, the Department of Energy (DoE) chose the Renewable Feed-In Tariff (REFIT)
scheme based on its success rate in European countries, especially Germany, Spain and
Denmark. It subsequently appointed NERSA to develop the REFIT scheme that would
incentivise the development of renewable energy in South Africa. The chosen
technologies were wind, solar photovoltaic, landfill gas, small hydro, concentrated solar

3
photovoltaic (with and without storage), biomass and biogas. In 2009, NERSA completed
the development of the REFIT rates as well as the selection criteria which were met with
a lot of interest from the international players. However, in 2010, the DoE announced that
it was abandoning the REFIT scheme in favour of the bidding process. In 2011, the
Minister of Energy determined that 3725 MW will be procured from renewable energy
by the DoE through a competitive bidding process and Eskom would be the sole buyer.
Of the 3725 MW determined, 1450 MW was allocated to wind. This translates to 38.9%
of the total renewable energy to be developed
Since then, there has been a lot of debate into whether the Renewable Energy Bidding
(REBID) scheme is the best for introducing renewable energy technologies in South
Africa. This concern is partly due to the fact that few countries used this scheme as the
primary scheme for supporting renewable energy and the success rate was low.
Of the selected technologies, wind is seen as the most promising in South Africa partly
because of its success in European countries and partly because of the available wind
resources in South Africa. This research will therefore focus on wind generation since it
was allocated the largest chunk of renewable energy to be developed in South Africa.
Moreover, wind energy is the fastest growing technology amongst all other renewable
energy technologies. In 2012 alone, an estimated 44.95GW of wind power was installed
globally, bringing the total global installed capacity to 285.7 GW. For the past five years,
global wind power has grown by 17.8% per year [5].
1.2 Research objectives
The economics of wind energy is well known in European countries and a lot of literature
on this is available [6]. South Africa however has completely different political, climate,
social and macro-economic conditions; hence the need to research into the economics of
wind energy in South Africa. Whilst it is true that both the REFIT and the REBID schemes
were used in various European countries with some form of success, studies have not
been done to determine the most suitable scheme for the South African market.

4
This research aims to evaluate the economics of wind generation in South Africa. This
will be done by looking at various renewable energy support schemes, their merits and
demerits in general as well as the success rate in various countries where they were
employed. The investigation will also look into the reasons for failure or success of these
schemes in various European countries.
The research will also aim to answer the following questions.
What wind resources are there in South Africa? Are the wind resources
sufficient to encourage investment in wind generation in South Africa?
What is the status of wind development in South Africa and how are the
installed plants performing?
What are the barriers in the development of wind energy in South Africa?
Why did DoE change from REFIT to the bidding programme?
What is the economic effect of changing from a REFIT to a bidding
programme?
What effect does the South African bidding process, that is 70% based on price,
have on the type and quality of projects to be developed in South Africa?
What are the key cost drivers of wind generation that one should consider in
evaluation of the economics of wind generation?
How comparable is the price from the bidding process to the international
benchmarks?
Finally, the LCOE methodology will be used to determine the major key drivers of the
economics of wind energy in South Africa by running sensitivity analysis on the identified
cost drivers for wind energy. The data from the DoE’s REBID programme, which differs
from the one used by European organisations such as the European Wind Energy
Association (EWEA) and NERSA’s REFIT will be used to calculate the LCOE.
1.3 Knowledge to be gained
At the end of the research, the reader will understand the various factors that affect the
wind energy economics in South Africa. Since the wind resources dominate the wind
energy economics in any country, the research will evaluate whether the wind resources

5
in South Africa are sufficient to support grid connected generation. Although the study
will be focused on the economics of wind energy generation in South Africa, the
knowledge gained can be applied to most developing countries especially in Africa.
The reader will also gain an insight into the South African REBID programme, how it
was designed to break down barriers to wind energy and how it performed both on
capacity installed and prices achieved.
1.4 Research hypothesis
This study is designed to assess the hypothesis that wind generation is economical in
South Africa if the REBID programme is used to procure wind energy instead of REFIT.
This hypothesis will be tested by using the LCOE methodology to calculate the cost of
wind energy in South Africa for different economic parameters such as capacity factors
(wind conditions), discount rate, investment costs, operation and maintenance costs and
the project lifespan. The LCOE methodology was chosen because it provides a common
way of comparing the cost of energy across different technologies. It takes into account
total project cost (capital cost, taxes, operation and maintenance cost etc.) over the project
lifespan. These costs are then evaluated against the produced electricity over the lifespan
of the project to give the cost per unit of electricity. This method therefore provides a way
of comparing the cost of wind energy to the cost of conventional coal-fired generation. If
the cost of wind generation is higher than the price of electricity on the market, the LCOE
methodology may be used to determine the level of support needed for these projects to
be viable. It should however be highlighted that the LCOE methodology does not take
into consideration the many benefits of renewable energy, such as security of supply and
reduction of carbon emissions, which are not normally considered by energy markets
when setting the price of electricity.
1.5 The research methodology
This research will look at the theory of wind generation in order to appreciate the factors
that affect the economics of wind generation. Once this is done, the development of
renewable energy and the policies introduced will be investigated. A conclusion will be

6
made on the success rate of the schemes used based on the amount of wind energy
developed. Barriers to the development of wind energy in South Africa will be
investigated and an analysis will be done on the best support scheme that would overcome
these barriers. Experiences in European and Asian countries on the REFIT and the REBID
schemes will be used to evaluate their applicability in the South African market. The
success of the South African REBID scheme for wind will be evaluated by analysing the
results of the first, second and third bidding rounds that were concluded in 2013.
The LCOE methodology will then be used to calculate the applicable South African cost
of wind energy generation using the experiences from the South African renewable
energy procurement programme. This method will also be used to analyse how each
factor affects the economics of wind energy in South Africa.
1.6 Research report structure
The research report has eight chapters that deal with the different aspects of the
research. These different components are necessary to reach the conclusion.
Chapter 1 introduces the research work; defines the research problem, explains the
knowledge to be gained as well as the methodology to be used.
Chapter 2 gives the theory of wind energy generation. For one to fully appreciate and
evaluate the economics of wind energy generation, one needs to have the basic theory of
how electricity is generated from the wind. This chapter explores the different factors that
affect the amount of power in the wind and the theoretical amount of that power that can
be extracted. It also discusses different types of wind turbines being used, their advantages
and disadvantages.
Chapter 3 describes the policies adopted by European and Asian countries to stimulate
the development of renewable energy as well as the support schemes used, their success
rates, strengths and weaknesses.
Chapter 4 looks at the development of wind energy in South Africa before the REFIT
programme. Barriers to the development of renewable energy that existed in South Africa

7
will be identified. All the support schemes used by South Africa since the development
of South Africa’s Renewable Energy Policy in 2003 will be evaluated to see their impact
on the development of wind energy generation until 2009 when the REFIT scheme was
initiated. This will be done by looking at the projects developed, their sizes and their
performance. The REFIT scheme was abandoned even before it started in favour of the
REBID scheme in 2011. These two schemes will be discussed in relation to their
applicability in South Africa. The reasons for abandoning the REFIT scheme in favour of
the REBID scheme will be explained.
Chapter 5 will identify and evaluate various factors that will determine the economics of
wind energy generation in South Africa. Since the wind resources available determine the
amount of electricity produced, they dominate the economics of wind energy generation.
The distribution of wind resources in South Africa will therefore be given special
attention. Site location of a wind farm is normally dependent on wind resources available.
In addition to site locations with good wind resources, sites that are close to load centres
and the grid are desirable from an economic point of view. Research will be done into the
areas in South Africa where there are good wind resources and whether the resources are
well documented and available to developers. The location and the amount of the wind
resources will be evaluated in relation to the grid and the load centres to determine the
economics of wind energy generation.
Chapter 6 evaluates the success of the REBID programme using the results from the
first, second and third bidding rounds.
In Chapter 7, the LCOE methodology for calculating the cost of wind energy generation
will be introduced. This will be used to evaluate the competitiveness of the bid price for
the DoE’s procurement programme. Moreover, this method will be used to show how
each parameter that affects the wind energy economics in South Africa contributes to the
LCOE. By running sensitivity analysis using average data from the DoE’s bidding
programme, the contribution of each parameter to the LCOE and therefore the economics
of wind energy generation in South Africa, will be made.

8
Chapter 8 makes a conclusion on whether wind energy generation is really economic in
South Africa. Factors that are instrumental to the success or failure of the deployment of
renewable energy in South Africa will be summarised. A conclusion will be formed on
whether the REFIT designed by NERSA or the REBID designed by the DoE was the best
for South Africa. The method used to evaluate the economics of wind energy generation
in South Africa may be used for other developing countries where the barriers are similar.
Recommendations on what could also be implemented in South Africa to keep the
development of wind energy generation stimulated will be made.
9
2 THEORY OF WIND ENERGY
Wind turbines convert kinetic energy in the wind to electrical power. Power in a stream
of wind passing through a wind turbine is given by equation (1) below [7, 8].
P =1
2ρAv3 ( 1)
where P is the power (Watts);
𝜌 is the air density (kgm-3)
A is the area swept by the rotor blades (m2)
v is the wind speed (m/s)
Equation (1) shows that power in the wind is a function of air density, swept area by the
rotor blades and the wind speed. Of the three parameters, wind speed has the greatest
influence on the power that can be generated by the wind turbine. Doubling the wind
speed will result in eight times the generated power. This fact highlights the importance
of accurately determining the wind speed when selecting a site for a wind farm. Wind
speed closer to the ground is lower than wind speed at higher heights above the ground
due to friction with the earth’s surface, trees and buildings. Even if the difference in speed
is minimal, its effect on power is huge due to the cube relationship with power. Accurate
estimation of wind speed at turbine hub height is therefore crucial in determining the
power that can be produced by a turbine. Equation (2) below shows the relationship of
wind speed with height.
𝑣2 = 𝑣1 (ℎ2
ℎ1)
∝
(2)
where 𝑣2 is the wind speed at height ℎ2,
𝑣1 is the wind speed at height ℎ1, and
∝ is the ground surface friction coefficient, or wind shear exponent.
The ground surface friction coefficient, ∝, depends on the roughness of the ground
surface and varies from 0.1 for smooth surfaces such as lakes and oceans to 0.4 for City

10
areas with tall buildings. The increase in wind speed with height as in equation (2) occurs
up to a certain height, normally about 450m and then starts to decrease.
Another important fact that can be deduced from equation (1) is that the generated power
increases proportionally with the increase in swept area, A. This important fact, coupled
with greater wind speed higher above the ground as shown on equation (2), influenced
the design of taller wind turbines with larger blades. The largest wind turbine in 2011 has
a capacity of 6 MW with a hub height of 90 m and rotor diameter of 126 m [9].
From equation (1), it is also evident that the generated power is directly proportional to
the air density. The air density is a function of air composition, temperature and pressure.
The air density of dry air and humid air is different. For the purpose of calculating the
power that can be generated from the wind, an ideal gas is assumed. This leaves the air
density being dependent on temperature and pressure. Equation (3) below shows the
relationship between air density, 𝜌 in kg/m3, pressure, P in N/m2 or Pascals, R, gas
constant, 287.04J/kgK, and temperature, T in Kelvin.
𝜌 =𝑃
𝑅𝑇 (3)
The turbine at a particular site (constant pressure) can be subjected to different
temperatures, from cold conditions to hot conditions, affecting the air density. Now let us
consider temperatures of -150C (cold condition) and 300C (hot conditions). The ratio of
air densities in these temperatures is calculated using equation (3),
𝜌𝑐𝑜𝑙𝑑
𝜌ℎ𝑜𝑡=
303.15𝐾
258.15𝐾= 1.17 (4)
The density of hot cold air at -150C is 1.17 times that of hot air at 300C. Assuming that
all other conditions stays the same, and using equation (1), the turbine will produce 17%
more power in cold conditions than in hot conditions.
Estimating the air density is complicated by the fact that temperature and pressure both
depend on elevation above ground. At greater elevations, the air temperature is lower (the
higher you go, the cooler it becomes) and the air pressure is lower than at ground level.
Air density decreases almost linearly as temperature increases. As the altitude increases
11
above sea level, the temperature decreases and the air density increases. Equation (5)
below takes elevation into consideration in calculating the air density [8, 10].
𝜌(𝑧) =𝑃𝑜
𝑅𝑇𝑒𝑥𝑝 (
−𝑔𝑧
𝑅𝑇) =
353.049
𝑇𝑒𝑥𝑝 (−0.034
𝑧
𝑇) ( 5)
where ρ(z) is the air density as a function of altitude, z (kgm-3)
Po is the standard (sea level) atmospheric pressure (101325Nm-2)
R is the specific gas constant for air (287 Jkg-1K-1)
g is the gravitational constant (9.81ms-2)
T is the air temperature (K)
z is the elevation above sea level (m)
Equation (1) assumes that all the kinetic energy is used to generate electricity, but in practice, the
actual energy that can be generated by the turbine is less. Equation (1) may be rewritten to account
for efficiency by including an efficiency factor termed the power coefficient Cp. Equation 6 shows
the power that can be extracted from the wind taking the turbine efficiency into account [7].
P =1
2𝐶𝑝ρAv3 (6)
2.1 The Betz Limit
The turbine does not completely stop the wind. The wind still flows downstream, albeit
at a lower speed. The power that can therefore be generated from the wind is actually
lower than what is suggested by equation (1). A German scientist, Betz determined that
there is a theoretical maximum power that a wind turbine can extract from the wind. This
value is termed the Betz limit, CpBetz, and this maximum power, PBetz is given by equation
(7) below [10].
𝑃𝐵𝑒𝑡𝑧 =1
2𝜌𝐴𝑉3𝐶𝑝𝐵𝑒𝑡𝑧 =
1
2𝜌𝐴𝑉30.59 (7)
The theoretical maximum is 59% of the wind power.

12
2.2 Types of wind turbines
There are two types of wind turbines employed in the generation of electricity from wind.
These are the Vertical Axis Wind Turbine (VAWT) and the Horizontal Axis Wind
Turbine (HAWT). This classification is based on how the blades rotate along their axis.
The VAWT blades spin on a vertical axis perpendicular to the ground whilst the HAWT
has blades spinning on the horizontal axis parallel to the ground. Of the two types, the
HAWT is the most used type for power generation. The number of blades employed
varies from one to multi-bladed but three bladed HAWTs are the most common used for
power generation. Although single and two bladed HAWTs are cheaper than three bladed
HAWTs due to material savings, they have got balancing problems. On the other hand,
multi-bladed wind turbines are not normally used for power generation because additional
blades require additional cost of material without any additional power being realised
from the turbine. From equation (6), power that can be produced by a wind turbine at a
site is dependent on swept area and wind speed. Furthermore, the aerodynamic loss of the
turbine increases as the number of blades increases. Multi-bladed (with more than three
blades) wind turbines will therefore produce less net power than three bladed turbines.
Multi-bladed wind turbines are mostly employed for applications that require high
starting torque such as water pumping because the torque of a wind turbine increases with
the increase in the number of blades.
The HAWT can be further classified according to its orientation to wind direction when
operating. Upwind turbines operate facing the wind direction whereas downwind turbines
operate facing away from the wind direction. Upwind turbines need a yaw mechanism
which rotates the nacelle of the wind turbine in order to keep the blades facing the wind.
The downwind turbines do not need a yaw mechanism because the blades are blown away
by the wind itself. Upwind turbines are preferred for power generation since the wind
strikes the blades first, ensuring equal balancing of blades unlike downwind turbines
where some of the wind strikes the nacelle and tower before striking the blades. Figure 1
below shows these two types of turbines [11, 8].

13
Figure 1: HAWT and VAWT configurations [11]
2.3 Advantages and disadvantages of the VAWT
VAWTs are mounted closer to the ground. The gearbox and the generator, the two
components that need regular maintenance due to wear and tear, are therefore closer to
the ground. This makes repair work easier as compared to the HAWT whose generator
and gearbox are high up in the nacelle. Because of its configuration, the VAWT generates
power irrespective of wind direction and does not therefore need a yaw mechanism unlike
the upwind HAWT. The VAWT also operates at lower wind speed and produces lower
noise as compared to the HAWT. This makes it more suitable for installation in residential
areas. The downside of the VAWT is that it is less efficient as compared to the HAWT
for the same wind speed. Moreover, the fact that it is installed closer to the ground where
there is less wind makes it unsuitable for commercial purposes. The guy wire used to
support the turbine increases the wear and tear on the bearings because of the downward
force it exerts on these components. Another disadvantage is that the power output varies
in the same rotational cycle of the turbine due to the position of blades in relation to the
wind direction. The VAWT also needs to be started, unlike the HAWT which starts on
its own once the wind speed reaches the cut-in speed.
14
2.4 Advantages and disadvantages of the HAWT
As mentioned above, the HAWT is more efficient and can produce more power than the
VAWT. Variable blade pitch control can be used on HAWTs to increase the power
production even further. Its major disadvantage is that it requires higher wind speeds,
which are normally found at greater heights. The tall towers required increase the cost of
the wind turbines. Another disadvantage is that the upwind HAWT needs a yaw
mechanism to align the turbine so that it faces the wind direction all the time. The yaw
mechanism increases the cost of the turbine and the cost of maintenance. Although the
downwind HAWT does not require the yaw mechanism, the tower and nacelle interfere
with the wind before the wind reaches the blades, causing uneven loading of the blades.
2.5 Power curve of a wind turbine
A wind power curve is a curve that describes how much power a particular wind turbine
can extract from the wind over a range of available wind speeds. These curves are used
to choose the best wind turbine that gives maximum energy yield for a particular site
location. Below a certain wind speed (Region 1 on Figure 2), called the cut-in wind speed,
the power in the wind is too low to start generating power. The cut-in wind speed is the
wind speed at which the wind has enough torque to turn the blades of the turbine and start
to produce power. As the wind speed increases, the turbine will continue to produce
power according to equation (6). The power generated by the turbine is proportional to
the cube of wind speed until the wind speed reaches the turbine’s rated wind speed
(Region 2 of Figure 2). The rated wind speed is the wind speed at which the turbine is
designed to give its maximum power output and above that speed, the power output will
be regulated at that value until the cut-out wind speed (Region 3 of Figure 2). This rated
power depends on the limit of the wind turbine generator. The cut-out wind speed is the
wind speed at which the turbine shuts down in order to prevent damage to the turbine due
to excessive stress. This is done by employing the braking system of the turbine. Figure
2 below shows a typical power curve of a wind turbine (blue line) and the power in the
wind (yellow line) [12].

15
Figure 2: Power curve of a wind turbine [12]
2.6 Annual wind speed distribution
From Figure 2, there is an optimal operating wind speed for each wind turbine. If the wind
can blow at that speed all the time, then the turbine would operate at its rated power and
produce the maximum possible power. But wind speed changes all the time. The power
curve alone would therefore not help in choosing the best turbine for a specific site. An
analysis of wind pattern needs to be done over a year or longer period. This would enable
an estimation of the number of hours that wind will be blowing at a certain speed in a
year. This can then be plotted to produce a Weibull curve. From this curve, the mean
annual wind speed is obtained. When choosing a wind turbine for a specific site, a turbine
whose rated speed is as close to the mean wind speed is chosen in order to get the
maximum electrical output from the turbine per year. Figure 3 below shows an example
of a Weibull curve with a mean annual wind speed of 5.5m/s [13]

16
Figure 3: Weibull curve [13]
In choosing the suitable wind turbine, one would therefore have to choose a turbine whose
rated speed is 5.5m/s to ensure that the turbine operates at maximum power most of the
time. The extreme ends of the Weibull curve would help in choosing the turbine with the
appropriate cut-in speed and cut-out speed.
2.7 Annual energy distribution
The aim of covering the theory of wind generation in this project is to understand the
economics of wind generation in South Africa. The energy that can be produced by the
wind farm is therefore very important. The power curve and the annual energy
distribution curve can be used to calculate the annual energy distribution in MWh for each
wind speed. This is done by multiplying the power generated by the turbine at each wind
speed by the number of hours that the wind blows at that speed in a year and plotting the
result on a graph. The sum of this (area under the curve in Figure 4) is the estimated
annual energy generated. The estimated annual energy generated is always less than what
would have been generated had the turbine been running at rated speed for the whole year.
The estimated annual energy generated divided by the energy that would have been
generated had the wind been blowing at rated wind speed for the whole year gives the
capacity factor of a wind turbine. This capacity factor is normally in the range of 25-40%
[13].
0
100
200
300
400
500
600
700
0 2 4 6 8 10 12 14 16 18
Nu
mb
er
of
ho
urs
per
day
Wind speed (m/s)

17
Figure 4: Estimated Annual Energy Distribution curve [13]
2.8 Concluding remarks
The power that is available in the wind is proportional to the cube of the wind speed, the
swept area of the rotor blades and the height above the ground. The dependency of
available power on the cube of wind speed is a very important factor in deciding the site
of the wind farm. A small difference in wind speed between sites has a huge effect on the
economics of wind farms at these two sites. Besides wind speed, the swept area and air
density are the other factors that determine the amount of power that can be generated
from the wind. There are greater wind resources at higher heights above the ground. This
makes the HAWT preferred for commercial purposes because they can be designed to be
taller with larger rotor diameters to maximise their power production. Today, most
onshore wind turbines have a hub height of more than 80 m and rotor diameters of more
than 100 m.
0
100
200
300
400
0 2 4 6 8 10 12 14 16 18
An
nu
al
En
erg
y (
MW
h)
Wind speed (m/s)

18
3 RENEWABLE ENERGY POLICIES AND SUPPORT SCHEMES USED
IN EUROPE
The biggest advantage of wind energy is that, wind, the primary source of energy, is free
and will remain so for the project lifetime, unlike coal-fired generation plants where the
coal cost accounts for 40% of the production costs, and changes over the lifetime of the
project. Unfortunately, wind power plants are capital intensive and need high upfront
capital costs to buy the turbines and associated equipment. This in turn makes the LCOE
from wind energy high as compared to electricity from coal. Wind energy can therefore
develop only if there are clear renewable energy policies which attract investment to this
sector. Generally, investors are more willing to invest in wind energy if there is a long-
term political and societal commitment towards wind energy. A good renewable energy
policy is the one that reduces or eliminates regulatory risks for the permits, authorisations,
grid access and licences required to plan, construct, operate and decommission renewable
energy projects [9].
Once a good renewable energy policy is in place, it is imperative to design long-term
renewable energy support schemes with a sound legal basis. Any changes to the policy or
support scheme must be transparent in order to provide predictability and certainty to
investors. The recent developments in Spain, Bulgaria and Greece where there are
proposals to impose additional tax on renewable energy reduces investor confidence in
the renewable energy market, especially if these taxes are introduced after the projects
have been developed [14]. Spain and Bulgaria have since implemented the proposed taxes
on renewable energy.
3.1 Types of renewable energy support schemes
There are basically six support schemes for renewable energy that are being implemented
in the world. Each scheme has its own merits and demerits. It is up to a particular country
to choose the scheme that is most suitable to itself. The support schemes are Feed-in-
Tariffs (FIT), Premiums, Quota obligations, Tenders (auctions), Tax exemptions and
Fiscal incentives. Each scheme is discussed in detail below.

19
3.1.1 Feed in Tariffs
FIT is the most used support scheme and has been very successful. It is used by 21 out of
the 27 European countries [9]. In this scheme, the project developer is guaranteed a pre-
set tariff per unit of electricity produced for a specified number of years, normally equal
to the lifespan of the plant. This reduces market risks for bankers and funding for the
project may be obtained at a lower cost. This ultimately reduces the capital cost of the
project. The higher the tariff, the more attractive will be the scheme. The tariff should
therefore be carefully set to be attractive enough without letting developers make windfall
profits. This may be achieved by periodically adjusting tariffs in line with market changes.
However, the review should only be for new projects. The term of the contract may also
be made shorter than the lifetime of the plant, just enough to recover the capital cost and
to make a reasonable rate-of-return. Because this scheme is based on generated electricity,
it encourages concentration of plants in areas with good wind resources. This may be
detrimental for the grid operator. However, this may be prevented by setting different
tariffs for different areas, taking into consideration the available wind resources.
3.1.2 Premiums
In this scheme, the project developer receives a guaranteed fixed premium on each unit
of electricity sold in addition to the income received from electricity sales on the market.
This reduces the market risks, just like the FIT, but to a lesser extent. The cost of capital
is therefore more than in FIT schemes. Since this scheme depends on electricity market
prices, it is mostly used in countries with liberalised electricity market structures.
Denmark and the Netherlands are some of countries that use this scheme as the main
support scheme [9]. Unlike the FIT, this scheme encourages the developers to generate
during peak periods (during which prices are generally higher) in order to maximise
profits. By doing so, the developer will also be helping to meet peak demand. The
premiums must also be carefully set to avoid excessive profits being made by developers.
3.1.3 Quota obligation
Quota obligations are where the government makes it mandatory for consumers, normally
large industrial consumers, or utilities to buy a certain percentage of their electricity needs

20
from renewable energy sources. Penalties are imposed for failure to meet these
obligations. Renewable Obligation Certificates (ROCs) that can be traded on the market
normally accompany this scheme. This will give an opportunity to the consumers or
utilities to supplement their quota requirements from the ROC market should they fail to
buy the required renewable energy on the electricity markets. There is higher risk for
investors than in FIT and premiums since the developer will be fully exposed to both the
electricity and the ROC market risks. The cost of capital will therefore be more as
compared to the FIT and the premium. However, its main advantage is that the support
can be automatically phased out once the technology manages to compete.
3.1.4 Tax Exemption
Tax may be used as a support scheme for renewable energy projects in two ways, namely
investment tax exemption or production tax exemption. Investment tax exemption aims at
reducing the capital cost of renewable energy projects, which will ultimately result in
lower LCOE from that project. The reduction in capital cost benefits the developer as it
makes it easier to raise the required capital whilst the resulting lower LCOE benefits the
customers in the form of lower tariffs. In the production tax incentive, income tax is
exempted per unit of electricity produced at a predetermined rate. The developers are
therefore incentivised to produce more electricity to maximise profits, which is good for
energy security of the country. However, the disadvantage of this scheme is that the
benefits do not filter down to the consumers. Moreover, in both cases, the developers are
still exposed to higher cost of capital because of market risks.
3.1.5 Fiscal incentives
In this scheme, renewable energy projects are funded from the government’s annual
budget. This is prone to political interference since budgets are negotiated at the political
level annually. There is therefore no predictability, as required by developers to make
long-term decisions on investing in renewable energy. Because of this, it is usually used
as a secondary support scheme.

21
3.1.6 Tendering or bidding or auctions scheme
Tendering schemes, also known as auctions, are now increasingly popular especially in
developing countries. According to IRENA, 30 out of 44 countries that implemented this
scheme from 2009 to 2013 are developing countries [15]. In this scheme, the government
determines the required capacity. After that, it designs standard long-term contracts for
the procurement of renewable energy; thereby providing a guaranteed market for the
renewable energy produced. The government would then invite developers to submit bids
based on price. Because of competition, the developers normally offer the true bid prices
based on cost of generation. The provision of long-term contracts reduces the project risks
for the bankers; thereby reducing the cost of capital and ultimately the investment cost of
the plant.
The major disadvantage of the tendering system is that it is prone to underbidding.
Sometimes bidders bid at very low prices in order to secure the contract, only to realize
that they cannot now get funding because of the low return on investment. This may lead
to a project being delayed or abandoned. To mitigate this, penalties for late Commercial
Operation Dates (COD) and failure to reach anticipated production levels (with
reasonable allowances) are normally imposed in the contract.
The second disadvantage is that preparation of tender documents can be expensive and
time consuming especially for new and small-scale developers who have limited
resources. This scheme is therefore more suitable for large corporations which can finance
the initial project costs such as feasibility studies, environmental authorisations and land
use permits without any guarantee that the company will win the contract.
Another risk with this scheme is that developers may use sub-standard or cheap
technology, compromising the electricity production over the lifespan of the project. This
may be prevented at the tendering stage by qualifying bids based on technology to ensure
that only those bids which use the required technology are considered.
Prices may also change between bid award and financial close, making the project
unviable. This may be mitigated by making provision for adjustment of bid prices in line

22
with financial market indicators such as inflation and currency exchange rates at financial
close.
3.2 Analysis of support schemes used for wind energy in European countries
Development of wind energy in Europe started in the 1970s and several support schemes
were implemented over the years. The FIT, Feed-In Premiums, Renewable Obligations,
Tenders (auctions) and Tax Incentives are some of the schemes employed. Figure 5 below
shows the schemes used in Europe by each country [9].
Figure 5: Renewable Energy Support Schemes used in European Countries [9]
Denmark, Germany and Spain are the three pioneering countries for developing wind
energy in the European Union. The following section will look at the renewable energy
policies and incentive schemes that were used in these countries. China and India are the

23
two developing countries that also have stepped up wind installations in recent years and
are now the fastest growing wind markets. Their renewable energy policies and support
schemes will be analysed in the following section.
3.2.1 Development of renewable energy in Germany
Before 1973, Germany was heavily reliant on imported oil for its energy needs. In 1973
and 1979, the oil producing nations increased oil prices drastically and reduced exports
to some European countries including Germany. This caused shortage of oil in Germany
and it prompted Germany to look for other sources of energy which would make it self-
sufficient in energy. Germany started using more coal and nuclear for power generation.
Renewable energy such as wind was also identified as one of the solutions to the oil crises.
In 1979, Germany set up the first special tariff based on avoided cost of generation for
the procurement of renewable energy by local utilities. On 26 April 1986, there was a
nuclear accident at Chernobyl nuclear Power Plant in Ukraine. This changed Germany’s
policy on nuclear power stations as the preferred source of electricity and interest in
renewable energy was intensified. However, there was slow development of renewable
energy because of the low estimated avoided cost of generation. In 1993, Germany moved
away from the avoided cost mechanism for supporting renewable energy and introduced
the renewable energy feed-in law called Electricity Feed–In Act. This Act provided
guaranteed access to the grid and FITs for renewable energy projects. The FIT for wind
power was pegged at 90% of the average electricity price. This law was very successful
and there was a boom in the installation of renewable energy between 2000 and 2005
[16]. In 2011, another nuclear accident happened, this time at Fukushima nuclear power
plant in Japan. This strengthened Germany’s support for renewable energy and phasing
out of nuclear power stations by 2022. Germany had to increase its renewable energy
target to 35% of its energy requirements by 2020 [3, 16]. By 2011, Germany’s wind
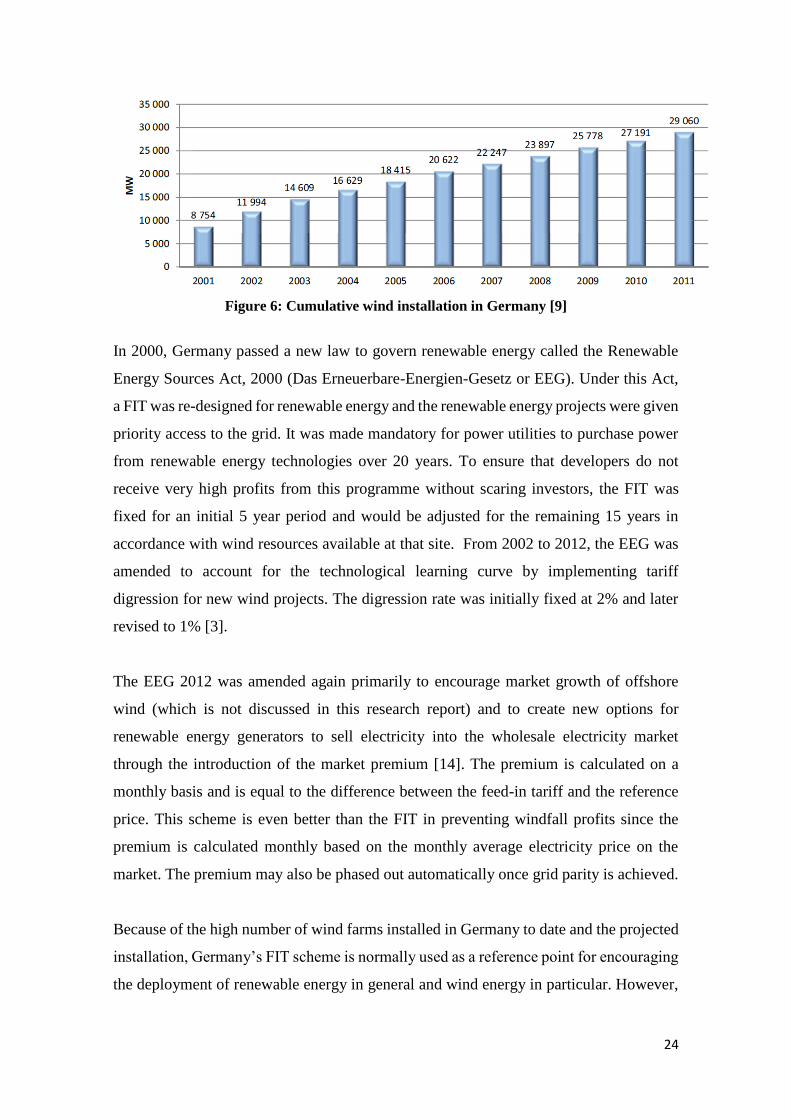
installed capacity was 29060 MW and it is on course to achieve its target. Figure 6 below
shows the development of wind energy up to 2011 [9].
24
Figure 6: Cumulative wind installation in Germany [9]
In 2000, Germany passed a new law to govern renewable energy called the Renewable
Energy Sources Act, 2000 (Das Erneuerbare-Energien-Gesetz or EEG). Under this Act,
a FIT was re-designed for renewable energy and the renewable energy projects were given
priority access to the grid. It was made mandatory for power utilities to purchase power
from renewable energy technologies over 20 years. To ensure that developers do not
receive very high profits from this programme without scaring investors, the FIT was
fixed for an initial 5 year period and would be adjusted for the remaining 15 years in
accordance with wind resources available at that site. From 2002 to 2012, the EEG was
amended to account for the technological learning curve by implementing tariff
digression for new wind projects. The digression rate was initially fixed at 2% and later
revised to 1% [3].
The EEG 2012 was amended again primarily to encourage market growth of offshore
wind (which is not discussed in this research report) and to create new options for
renewable energy generators to sell electricity into the wholesale electricity market
through the introduction of the market premium [14]. The premium is calculated on a
monthly basis and is equal to the difference between the feed-in tariff and the reference
price. This scheme is even better than the FIT in preventing windfall profits since the
premium is calculated monthly based on the monthly average electricity price on the
market. The premium may also be phased out automatically once grid parity is achieved.
Because of the high number of wind farms installed in Germany to date and the projected
installation, Germany’s FIT scheme is normally used as a reference point for encouraging
the deployment of renewable energy in general and wind energy in particular. However,

25
when considering this scheme in developing countries, it should be noted that Germany
has a strong financial market and skilled workforce that may not be present in developing
countries [3].
3.2.2 Development of wind energy in Spain
Spain has the second largest wind installations after Germany. Its cumulative wind
installation in 2011 was 21673 MW. Spain introduced its Renewable Energy Plan, 1986,
which was reviewed several times until 1994. The main focus of this plan was to show
that renewable energy can be employed on a large scale. In 1994, the FIT was introduced
through the Royal Decree 2366. In 1997, Spain passed its Electric Power Act 54 /1997,
which paved the way for the introduction of a premium scheme. This act also prioritised
grid access for renewable energy projects.
The FIT was introduced in 2007 as the main support scheme through Spain’s Royal
Decree 661/2007. This scheme was operating alongside feed-in premiums. Five projects
with a total capacity of 3200 MW were also implemented through concession bidding.
Concession bidding was chosen because the scope of work involved building
transmission lines. The FIT scheme, the research budget that had been introduced in 1999
and the local content requirement encouraged turbine manufactures to set up
manufacturing plants in Spain. Spain is now one of the major turbine suppliers [3].
In February 2013, Spain introduced 6% additional tax on revenue generated from
electricity. This tax will be used to fund Spain’s FIT budget which had a deficit of €24bn
in 2011 [14]. The introduction of additional taxes targeted at a specific industry reduced
the confidence of investors. Investors saw it as a way of the government trying to reduce
the windfall profits being received by renewable energy developers from FITs. Because
there is a strong rule of law in that country, the developers have turned to the courts for
recourse. Spain is now facing several lawsuits at the International Court for Arbitration.
Besides Spain, Bulgaria and Greece are two other European countries that have
announced the introduction of taxes on renewable energy as a way of reducing the profits
being realised by developers from the preapproved tariffs.

26
3.2.3 Development of wind energy in Denmark
After the oil crises of the 1970s, Denmark shifted to nuclear for its energy needs. Due to
safety concerns, nuclear was abandoned in 1976 in favour of wind energy. Denmark’s
first support scheme for wind energy was a tax imposed on electricity. This tax was used
to fund research and development of renewable energy technologies. This boosted wind
turbine manufacturing in Denmark. By 1980, Denmark was a major exporter of wind
turbines [3]. Grants were given to developers for the installation of wind farms, most of
which were owned by communities. As an additional incentive, the communities
operating wind farms were given tax rebates
The FIT was introduced in 1990. This was based on the market price of electricity and
was initially pegged at 85%. Along with the FIT, grid access was made mandatory for
renewable energy. As at 2011, Denmark’s wind installation was 3 871 MW and it plans
to satisfy 50% of its energy requirements from renewable energy by 2020 [3].
3.2.4 Development of wind energy in United Kingdom
Development of renewable energy in the UK started in 1990, soon after the privatisation
of the generation companies. The market for renewable energy was created by setting up
a Non-Fossil Fuel Obligation (NFFO) scheme, which required distribution companies to
buy a certain amount of their power from renewable sources and nuclear at a premium.
The Independent Power Producers (IPPs) who wanted to participate in this programme
were chosen through an auction system. A fuel levy that had been introduced to all
consumers was then used to compensate the distributors for buying non-fossil fuel power
at a premium. The government would announce the capacity available for auction and the
IPPs would bid. There were five (5) auctions done from 1990 to 1998. In the first two
auctions, the preferred bidders were offered the same pre-set price. In the third, fourth
and fifth auctions, the contract prices were as per the submitted bid. Although capacity
uptake was very good for all auctions, very few projects were realised. This is attributed
to unrealistically low bids, especially in the fourth and fifth auctions. The absence of
penalties for failure to deliver the project also encouraged non-serious bidders. The other
reason was that the preferred bidders were selected before the project is fully planned and

27
all approvals are obtained. Most preferred bidders either failed to get required permits or
the process took too long. Because of high population density in the UK, it is not easy to
get permits for onshore wind farms [3, 15].
Although the bid response was very good with all allocated capacity being taken, only
4.7% capacity was installed. Figure 7 shows the graphical presentation of the performance
of this programme from capacity uptake and price perspective.
Figure 7: Results of UK’s auction scheme2
From the year 2000, the UK introduced renewable obligation scheme where all
distribution companies were required to buy renewable energy from any technology and
get renewable energy points. The points were the same irrespective of technology. This
was however changed later and new technologies were allocated more points. UK then
introduced trading for Renewable Obligation Certificates (ROC) which could be traded
by the distribution companies to meet their required obligation. UK’s wind installations
grew tremendously from just under 500 MW in 2000 to 5248 MW in 2010 under this
scheme [3].
In 2010, UK introduced a FIT scheme for renewable energy technologies up to 5MW.
The FIT was different for different technologies. As at 2011, UK’s installed capacity was
6540 MW [3].
2 Drawn using information from [3] and [24]
0
0.02
0.04
0.06
0.08
0.1
0
200
400
600
800
1000
1200
1400
1600
1800
1 2 3 4 5 Ave
rage
au
ctio
n p
rice
(U
SD/k
W)
Cap
acit
y M
W
NNFO Auction number
Capacity on auction Capacity of wining bids
Capacity Installed Average auction price

28
3.2.5 Development of wind energy in China
China’s wind installation has been doubling every year from 2007 to 2010 and now has
the highest wind cumulative installation of 62733 MW as at 2011. China has good wind
resources that are better than in Germany, Spain and India. [3]. China’s initial support
scheme for renewable energy was from donor funds and government grants for renewable
energy demonstration plants. There were challenges with grid connection and a market
for the costly renewable energy produced until 1990 when the government directed the
power utilities to ensure grid access and that they had to buy the renewable energy
produced. In 2001, China introduced a tendering concession for renewable energy. The
tendering selection criteria required the developers to use wind turbines with 70% local
materials. This stimulated the local companies to manufacture wind turbines and China
has since became a power house in turbine manufacturing with four leading
manufacturers in the top five suppliers in 2012. These manufacturers are OEMs,
Goldwind, United Power and Snovel [5].
China used its experience in tendering concession to set tariffs for projects awarded out
of the tendering scheme in some areas. In 2009, China introduced its FIT programme.
The tariffs were designed according to the wind resources available. This encouraged the
development of renewable energy throughout the country [3, 15].
3.2.6 Development of wind energy in India
India is in the top five wind energy markets with a total installed capacity of 16 084 MW
as at 2011. Grants and donor funds from Danish International Development Assistance
(DANIDA) were the first support schemes for wind energy projects. These funds were
used mostly for demonstration plants. To facilitate this, India formed a dedicated
department called the Department of Non-Conventional Energy Sources. This was later
turned into a Ministry. To incentivise private companies into development of wind
energy, the state distribution companies were required to buy all renewable energy at
agreed rates. The developers would also get tax exemptions on energy sold for the first
five years whilst the project gets 100% accelerated depreciation on investment (another
type of tax incentive). It is under this scheme that India’s wind energy started to grow [3].

29
In 2003, the Electricity Act was passed into law. This law introduced quota obligations
which compelled the electrical distributors to source a certain percentage of electricity
from renewable energy sources. It also ensured mandatory grid access to renewable
energy. In 2009, India introduced its FIT which differed depending on wind resources.
3.3 Concluding Remarks
Renewable energy policies that show long-term political and societal commitment to
renewable energy are the cornerstone of the development of wind energy in any country.
They give investors’ confidence in the projects and this would reduce the capital cost of
installing wind projects. The policies should be periodically adjusted in response to
market changes. The most used primary support scheme in the countries studied were the
FIT followed by the tendering scheme. Obligations were used as a secondary scheme to
create a market for renewable energy. China and Spain imposed local content
requirements in their support schemes coupled with research and development to
encourage local manufacture of wind turbines. This worked very well, partly because
both countries have strong manufacturing industries.
Having discussed the schemes employed in other countries, their success rates and
failures, it is imperative to look at the schemes used in South Africa. The next chapter
will look at the wind energy development in South Africa before the initiation of REFIT
and subsequent change to REBID. Barriers for development of wind energy will be
identified and a conclusion made on whether the REBID was the best scheme to overcome
these barriers.

30
4 DEVELOPMENT OF WIND ENERGY IN SOUTH AFRICA
Before the initiation of REFIT and REBID, there were three grid connected wind farms
in South Africa, of relatively small sizes. These were the Darling Wind Farm, the
Klipheuwel Wind farm and the Coega Industrial Development Zone Wind Farm (Coega).
The Darling wind farm consists of 4 x 1.3 MW turbines and was commissioned in 2008.
It is South Africa’s first wind farm run by an IPP. It was funded by a grant from the
Danish International Development Assistance (Danida), loans from the Development
Bank of Southern Africa (DBSA) and the Central Energy Fund (SOC) Ltd as well as
equity from the Darling Independent Power Producer (Darlipp). The wind farm has a 20
year power purchase agreement with the City of Cape Town and a wheeling agreement
with Eskom. The design capacity factor of the wind farm is 28% but the plant has been
performing below that despite measured wind speed being around 6.5 m/s. From February
2009 to June 2009, the wind farm was completely shut down due to contractual
disagreements with the turbine manufacturer. This led to the removal of Darlipp as the
Operation and Maintenance (O&M) service provider. G7energies was then appointed as
the O&M contractor. The problem seems to be lying with the performance of the wind
turbines. The company is considering decommissioning the existing turbines and
replacing them with newer turbines that are more efficient. These turbines will also be
taller so as to exploit better wind resources found at more than 80 m above the ground.
The Klipheuwel Wind Farm has a total capacity of 3.16 MW. It consists of a 66 kW, a
1750 kW and a 750 kW turbine and was commissioned in 2002. This farm was built by
Eskom in the Western Cape Province as a demonstration plant and supplies power directly
into the Eskom grid. This plant is performing well as expected.
The Coega Industrial Development Zone Wind farm (also known as the Electrawinds
wind farm) has one 1.8 MW turbine that was commissioned in 2010. It had a three year
power purchase agreement with Nelson Bay Municipality. The owners have since secured
a long term contract with Amatola, (Pty) Ltd, a local green energy trader in February
2014.

31
4.1 Barriers to wind energy in South Africa
Although the support schemes discussed in Chapter 3 were successful in stimulating
renewable energy in the European markets, they might not necessarily be effective in the
South African market because of the differences in the electricity market structures,
political situations, technological advancement and climatic conditions. It is therefore
important to identify all barriers to renewable energy in South Africa before choosing the
best renewable energy support scheme that would eliminate these barriers.
4.1.1 Electricity market structure
The distribution of electricity in South Africa is dominated by Eskom and the
Municipalities. Eskom is responsible for distributing electricity in non-urban areas whilst
the Municipalities are mandated by the Constitution of South Africa and the Municipal
Finance Management Act (MFMA) to provide all services including electricity in
municipal areas (although Eskom still supplies in some municipal areas because of
historical arrangements). Whilst there is an opportunity for IPPs to connect directly to
municipal networks and sell electricity to these Municipalities, the MFMA imposes two
conditions that make investment into wind energy unviable. The first condition is that the
Municipality can only buy power from an IPP at a rate that is equal to or lower than the
rate at which it buys electricity from Eskom. Since the Municipalities buy electricity from
Eskom at bulk or wholesale price, it becomes even more difficult for IPPs to get a viable
tariff from the Municipalities. The Coega Industrial Development Zone Wind farm and
the Darling Wind farm are good examples of IPPs that are selling to Municipalities at
Eskom’s Megaflex rates that are not sustainable. The second condition is that the
Municipality cannot enter into a long term power purchase agreement with an IPP without
approval from National Treasury. The maximum term is three years. This condition is not
good for investors who need long-term Power Purchase Agreements (PPAs).
Another problem with the MFMA is that it does not allow a free electricity market and
encourages a captive market. Any customer who is in a Municipal area has to be supplied
with electricity by the Municipality and cannot be supplied by any other person without
the consent of the Municipality. Because Municipalities generate most of their revenue
from electricity sales, they do not readily allow IPPs to sell power directly to their

32
customers. In contrast, IPPs in Europe may have bilateral arrangements. Furthermore,
there is an opportunity to sell their power to regional wholesale electricity markets,
enabling cross boarder trading of electricity. Because there are no regional wholesale
electricity markets in South Africa and its neighbouring countries, IPPs in South Africa
cannot sell power to neighbouring countries despite that there is demand for power in
these neighbouring countries (Namibia, Botswana and Zimbabwe).
4.1.2 Grid access
Grid access is another major barrier to the development of renewable energy in South
Africa. Unlike the European electricity market which is liberalized, in South Africa,
Eskom still has a monopoly in the electricity supply industry. It provides more than 90%
of generation capacity in the country and is the sole grid operator. The IPPs therefore
have to rely on Eskom for grid access. If Eskom’s network needs to be upgraded to
accommodate the IPPs, both the deep and shallow costs are normally charged to the IPP’s
account. Furthermore, Eskom does not guarantee a reasonable (say above 95% per year)
availability of the grid to the IPP. If an IPP insists on this, Eskom charges connection
costs for n-13 reliability criteria, which makes most projects unviable. In most cases,
where Eskom would quote for the erection of just one transmission line, it would now
quote for two lines. To mitigate this, the South African Government drafted the
Independent System and Market Operator (ISMO) bill which will create an Independent
System and Market Operator that will be responsible for buying electricity from Eskom
and IPPs as well as operating the grid. Currently, this bill is still in parliament but once
approved, it will go a long way in reducing the risk associated with grid access and unfair
competition with Eskom.
In the absence of the ISMO, NERSA formulated the Regulatory Rules on Network
Charges for Third Party Transportation of Energy in March 2013 [17] to make grid
access easier. These rules aim to promote non-discriminatory access to the grid and
ensuring transparency and cost reflectivity in setting network charges.
3The most reliable design which provides for redundancy of equipment. If it is a transmission line, two lines
are built and each line will have the capability of carrying the full load whilst the other line is out of service.

33
4.1.3 Tariffs
The third barrier and maybe the most important one is the low electricity tariffs charged
in South Africa. Eskom has been charging low tariffs because it had over-capacity until
2008 when it started practising load shedding. Eskom’s electricity price as at 31 March
2013 was R0.63/kWh [18, 19], which is still low. Eskom has been trying to have cost
reflective tariffs since 2010 when it applied for an average tariff increment of 35% per
year for the three years of Multi-Year Price Determination 2 (MYPD2). However, the
Energy Regulator granted only 24.8% for 2010/11, 25.8% for 2011/12 and 25.9% for the
2012/13 financial year. In 2012, the 25.9% increase for the 2012/13 financial year was
revised downwards to 16%, partly because government reinvested its dividend into
Eskom to shield the industry from steep electricity increases and partly because the
REFIT programme that had been budgeted for did not materialize [20]. In 2013, Eskom
applied for an average tariff increase of 16% for the next five years (2013-2018). Eskom
argued that these increments will enable Eskom to move to a cost reflective tariff by 2018.
However, NERSA granted Eskom an average increase of 8% for the next 5 years. Figure
8 below shows the price path of electricity in South Africa from 2008 up to 2018 (figures
from 2013/14 are based on approved tariff increases).
Figure 8: Electricity price path in South Africa4
4 Calculated by author from information in Eskom’s 2012/13 annual report
0.00
20.00
40.00
60.00
80.00
100.00
20
08
/09
20
09
/10
20
10
/11
20
11
/12
20
12
/13
20
13
/14
20
14
/15
20
15
/16
20
16
/17
20
17
/18
Tari
ff (
c/kW
h)
Financial year
Eskom's tariff ZARc/kWh
Eskom's tariff c/kWh

34
Although the graph shows a constant increase, the electricity charged in South Africa is
far from being cost reflective. In Germany and Denmark, the domestic retail electricity
tariffs (inclusive of taxes and levies) are high at 27c€/kWh (R4.05/kWh) and 30€c/kWh
(R4.5/kWh)5 respectively [21]. This makes it easier for wind energy to compete. It should
be noted however, that wind energy is also cited as the reason for high tariffs in Germany
and Denmark since the subsidies for wind energy come from taxes imposed on electricity
consumers.
4.1.4 Societal acceptance
Environmentalists are opposed to the development of wind energy in some areas. This
was raised in Port Elizabeth during NERSA’s public hearings for generation licensing for
Round 1 preferred bidders. The local community in Klein Rietfontein farm was opposed
to the Metro Wind farm. Wind energy is also facing some resistance from the public
because it is more expensive than coal-based generation. In a developing country where
there is still poverty among the majority of the population, affordable electricity is a
priority over environmental pollution caused by coal-fired power plants.
The scheme that will stimulate the development of renewable energy in South Africa has
to be socially accepted. In Germany, social acceptance for wind projects was achieved by
offering equity shareholding to farmers where projects were developed as well as giving
them tax incentives [3]. In the UK, the solution might be offshore wind as there has been
an increase in protests from the anti-wind groups for onshore wind [22].
4.1.5 Administrative barriers
The process of obtaining approvals and licences has been cited as one of the barriers to
the introduction of renewable energy in South Africa [23]. There are too many parties
involved in the granting of approvals for a project before it can be built. The processes of
getting these approvals are unfortunately not streamlined. Parties involved in approvals
are NERSA (generation licences), the Department of Environmental Affairs
5 €/R = 15 as at 2013.

35
(Environmental Authorizations) and Department of Energy (approval of projects that are
not in the Integrated Resource Plan). Before an IPP can apply for a generation licence to
NERSA, it needs to get an Environmental Authorisation (EA) from the Department of
Environmental Affairs amongst other requirements. The EA is expensive and time
consuming. This will ultimately increase the project cost for the IPPs. This barrier may
be eliminated by having one office co-ordinating the processing of approvals. This was
successfully implemented in Denmark where the Danish Energy Agency (DEA)
coordinates with other authorities to ensure that relevant permits are obtained before the
project is implemented [24].
4.1.6 Financial
There are few financial companies that offer development grants in South Africa. This
has prevented research and development into wind energy by IPPs. Securing equity
partners and suitable commercial lenders has also been difficult because of the risks
involved in renewable technologies. One solution to this problem is bringing in
government participation into renewable energy. The government may provide
guarantees to the banks. Alternatively, the government may provide a significant amount
of capital in the form of equity, subordinate debt or mezzanine debt.
4.1.7 Skills
Shortage of technical skills for the manufacturing, installation and the operation of wind
turbines has also been cited by developers as one of the barriers.
4.2 Support schemes considered by South Africa
The first renewable energy support scheme in South Africa was the Renewable Energy
Subsidy that was being offered by the then Department of Minerals and Energy. When
the Renewable Energy Finance Subsidy Office (REFSO) was opened in 2005, the subsidy
was R250/kW and it rose to R1,000/kW in 2007 [25]. Tradable Renewable Energy
Certificates (REC) were to provide additional revenue for the renewable energy projects.
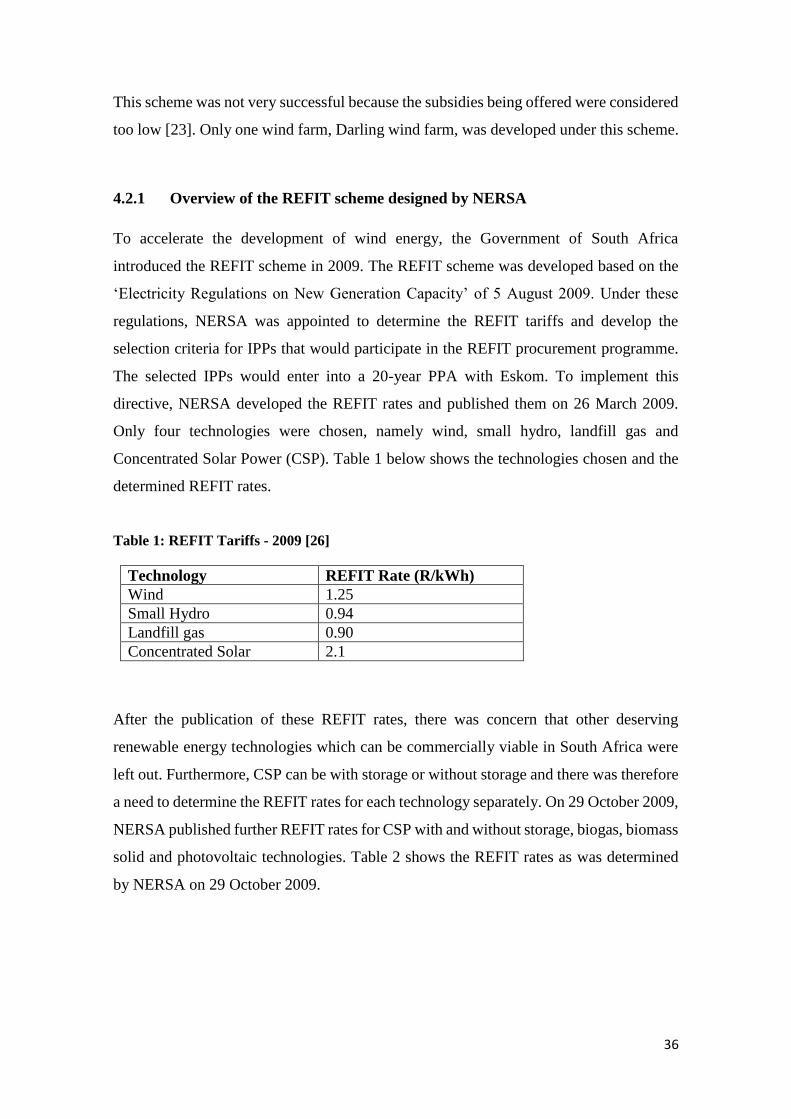
36
This scheme was not very successful because the subsidies being offered were considered
too low [23]. Only one wind farm, Darling wind farm, was developed under this scheme.
4.2.1 Overview of the REFIT scheme designed by NERSA
To accelerate the development of wind energy, the Government of South Africa
introduced the REFIT scheme in 2009. The REFIT scheme was developed based on the
‘Electricity Regulations on New Generation Capacity’ of 5 August 2009. Under these
regulations, NERSA was appointed to determine the REFIT tariffs and develop the
selection criteria for IPPs that would participate in the REFIT procurement programme.
The selected IPPs would enter into a 20-year PPA with Eskom. To implement this
directive, NERSA developed the REFIT rates and published them on 26 March 2009.
Only four technologies were chosen, namely wind, small hydro, landfill gas and
Concentrated Solar Power (CSP). Table 1 below shows the technologies chosen and the
determined REFIT rates.
Table 1: REFIT Tariffs - 2009 [26]
Technology REFIT Rate (R/kWh)
Wind 1.25
Small Hydro 0.94
Landfill gas 0.90
Concentrated Solar 2.1
After the publication of these REFIT rates, there was concern that other deserving
renewable energy technologies which can be commercially viable in South Africa were
left out. Furthermore, CSP can be with storage or without storage and there was therefore
a need to determine the REFIT rates for each technology separately. On 29 October 2009,
NERSA published further REFIT rates for CSP with and without storage, biogas, biomass
solid and photovoltaic technologies. Table 2 shows the REFIT rates as was determined
by NERSA on 29 October 2009.

37
Table 2 REFIT Tariffs Phase II [27]
Technology REFIT Rate (R/kWh)
CSP trough without storage 3.14
CSP trough with storage of 6 hrs per day 2.31
Large scale grid connected PV systems (≥1MW) 3.94
Biomass solid 1.18
Biogas 0.96
On 4 May 2011, the DoE published another set of ‘Regulations on New generation
Capacity’. These regulations effectively repealed those of 5 August 2009. The new
regulations aimed to procure renewable energy using the bidding programme as opposed
to REFIT. This was therefore an official end to the REFIT programme designed by
NERSA.
4.2.2 Why REFIT was abandoned
Although the REFIT programme had been overwhelmingly accepted by developers, its
legality was being questioned by the National Treasury. National Treasury argued that
this programme was unlawful for three reasons. The first reason was that NERSA does
not have the powers to pre-set tariffs before a generation licence is granted. The
Electricity Regulation Act, 2006 (Act No. 4 of 2006) only empowers NERSA to set and
approve prices, charges, rates and tariffs upon application by a licensee. In the REFIT
programme, NERSA would have to determine the REFIT rates before the generation
licence application was submitted. This would therefore be unlawful since it does not
comply with the requirements of the Electricity Regulation Act.
The second reason cited by the National Treasury was that the REFIT does not comply
with section 217(1) of the South African Constitution of 1996 which requires that organs
of state must contract for goods or services in a fair, equitable, transparent, competitive
and cost-effective manner. Since the price will be pre-determined in the REFIT
programme, National Treasury argued that there is therefore no competitive bidding
requirement on price as required by the constitution. It further argued that without
competitive bidding on price, the REFIT programme was therefore not cost effective.

38
The third reason was that the REFIT programme did not comply with the Preferential
Procurement Policy Framework Act 5, 2000.The Preferential Procurement Policy aims to
give preference to the previously disadvantaged people during apartheid in a price-based
bidding process. Once bids from the affected previously disadvantaged people achieve
the minimum scores on functionality of the product, they must then be further evaluated
based on the preference point system based on the price as prescribed by the Regulations.
Since the REFIT programme has the same price for all IPPs, this framework will not be
applicable.
After these issues were raised, NERSA sought legal opinion on the correctness of the
three issues raised above. The opinion given6 on the legality of pre-setting tariffs was that
it is indeed unlawful and does not fulfil the requirements of Section 7, 14 and 15 of the
Electricity Regulation Act.
On the compliance with the constitution on competitiveness and cost effectiveness of the
REFIT, it can be argued that the REFIT is still competitive because IPPs would bid on
the quality of the projects and not on price, thereby bringing in value for money.
Moreover, Treasury Regulation 16A provides for exemption from this requirement if it is
not practically possible to invite competitive bids. One reason that may be cited for
requesting exemption is that the Government’s White Paper on Renewable Energy is clear
that the government intends to attract international investors to invest in renewable energy
projects. The international investors would therefore be more comfortable with the REFIT
as it had been successfully implemented in Europe by Germany, Denmark and Spain
among other countries.
On the compliance of the REFIT programme with the Preferential Procurement Policy,
the given opinion was that it indeed does not comply. The REFIT’s Black Economic
Score Card designed by NERSA in its REFIT selection criteria gives some preferential
treatment to the previously disadvantaged but it is not based on a price point system as
required by the law. However, there is provision for the Minister of Finance to exempt
the procurer from this requirement if the likely tenders are international suppliers or if it
6 From personal communication with NERSA’s Legal Advisory Services Department.
39
is in the public interest. It can therefore be argued that the likely tenderers are the
international suppliers. In the White Paper on Renewable Energy, the Government of
South Africa has already decided that financial support for renewable energy has to come
from a combination of South African and international sources [4].
Having concluded that the REFIT is illegal because it does not comply with the Electricity
Regulation Act and the Preferential Procurement Policy Act, the question will be why
was this not identified at the beginning before wasting time and money? The only logical
answer is that the three government entities, namely the DoE, National Treasury and
NERSA were not coordinating with each other and there might have been consolidation
of power as well. Had National Treasury been consulted from the beginning, the
shortcomings of the REFIT programme would have been raised earlier and solutions
sought.
4.2.3 Overview of the bidding scheme designed by the DoE
The main players in South Africa’s bidding procurement programme are the DoE,
National Treasury, NERSA and Eskom. The DoE is responsible for undertaking the IPP
procurement programme, from preparation of the bid proposal documents, requesting
proposals, evaluation of proposals as well as selecting the preferred bidders. The DoE
also acts as a government guarantor in case the buyer fails to fulfil its commercial
obligation. Because money in government is controlled by the National Treasury, the
National Treasury is effectively the guarantor. The National Treasury will therefore
oversee the procurement process to ensure compliance with the Public Finance
Management Act (PFMA). NERSA is responsible for consideration of generation licence
applications from preferred bidders in accordance with the Electricity Regulation Act,
2006 (Act No. 4 of 2006). NERSA is also required to regulate tariffs and prices for the
IPPs at licensing stage.
The selection criteria for successful bids requires that the bid price be equal to or below
a certain cap as set by the DoE. For wind technology, this price cap is R1,150/MWh. The
evaluation of bids will be done in two stages. The first stage is the qualification stage
where the bids are evaluated for functionality and legal compliance. The second stage is
40
the evaluation stage for ranking the bids based on price. The evaluation is based on 70%
price and 30% economic development. The DBSA will be providing funding packages
targeted at previously disadvantaged people who are minority equity shareholders.
The DoE requires all bidders to provide Single Bid Guarantees of R100,000/MW of the
name plate capacity of each proposed facility to ensure that only serious bidders
participate in this programme. If selected as a preferred bidder, the bidder will be required
to submit Preferred Bidder guarantee of R200,000/MW of the nameplate rating.
To avoid grid congestion the DoE set the installed capacity of 140 MW for a single grid
connection point for wind technology.
One of the disadvantage of a bidding programme in general, let alone a programme that
gives 70% on price, is that bidders might opt for cheap technology so as to bring down
the project costs. This risk was mitigated by the DoE by requiring that all wind turbines
must be certified to IEC61400.
Bidders are also required to provide energy resource certainty by an independent reviewer
as well as generation yield assessment report by an independent energy yield assessor.
This condition will reduce risks of overstating wind resource. Risks of overstating wind
resources is high in a bidding process as IPPs just want to be selected as preferred bidders
but will under deliver during the project lifespan.
4.3 Concluding remarks
The development of grid-connected wind farms in South Africa has been slow despite the
government's formulation of the White Paper on the Renewable Energy Policy in 2003.
As at 2012, only three grid-connected wind farms were operating in South Africa with a
total capacity of 10.16 MW. The slow pace of development is largely attributed to the
electricity market structure which is captive, the low tariffs being charged by Eskom
which makes power from IPPs uncompetitive and problems with grid access.

41
The REFIT was a good instrument to stimulate renewable energy and would have
eliminated all the identified barriers. However, it was not legally sound as it did not
comply with the Electricity Regulation Act and the Preferential Procurement Policy
Framework Act. REFIT was therefore abandoned in favour of REBID. The REBID
designed by DoE seems to address all the short-comings of UK’s auction scheme that
failed. The inclusion of bid guarantee deposits, penalties for non-delivery of projects,
certification of technologies and possession of permits before bidding will ensure that
projects are delivered on time.
Before evaluating the economics of wind generation under REBID, we will identify the
parameters that determine wind economics in general and try to relate them to South
Africa in the REBID environment.
42
5 FACTORS THAT DETERMINE THE ECONOMICS OF WIND
GENERATION
The five main parameters that govern wind power economics are:
Electricity production / wind resources;
Investment cost / capital cost of the wind farm;
Finance cost / discount rate;
Lifetime of turbines/ wind farm; and
Operation and maintenance costs [28].
Each of these five parameters and how they affect the economics of wind energy in
general will be discussed in the following section. Each parameter will be quantified for
South African conditions and will be compared with those in European countries where
wind energy was successfully implemented. A conclusion will then be made of that
parameter’s contribution to economics of wind energy.
5.1 Electricity production - Wind resources
The commercial end-product of a wind turbine is the electricity produced. It has been
shown in equation (1) that the electricity produced depends on the wind resources
available. The economics of wind generation is therefore largely dependent on the amount
of wind resources available. Knowing the available wind resources in any country at each
site is therefore key for government authorities, utility planners, investors (owners and
bankers) and consultants. Government authorities need to know wind resources available
in the country to design energy policy as well as the best renewable energy support
schemes/incentives for investments in wind energy and to ensure sustainability of those
projects. The utility planners would use the information for long-term power system
planning and investments in the grid. The investors, owners and bankers would need this
information to identify locations that have the best wind resources so as to maximize the
returns and accurately calculate the project risks. The consultants would use the wind
resources data to choose the best suited wind turbine and design of a wind farm layout
that will maximize the utilization of wind resources available at that particular site. The

43
development of a wind database and wind atlas is therefore very crucial for any country
that is serious about wind energy generation
5.1.1 Evaluation of wind resources in South Africa.
The wind atlas is a means of representing wind resource data on national or regional
scales. In South Africa, the development of a wind atlas began in 1995 by Professor
Roseanne Diab. She established that South Africa has very good wind resources (wind
speeds of greater than 6 m/s) along the coastal areas. In 2001, Eskom and CSIR also did
some studies on wind resources in South Africa. Dr Kilian Hagemann did further research
on wind resources and he discovered that apart from good wind resources in the coastal
areas, South Africa also has some good wind resources in the Northern, Western and
Eastern Cape provinces. He concluded that South Africa has wind resources that are
comparable to some of the windiest areas in the world. Figure 9 and 10 shows the wind
atlas maps produced by Diab and Hagemann [29, 30].
Figure 9: Diab's wind atlas map [29]
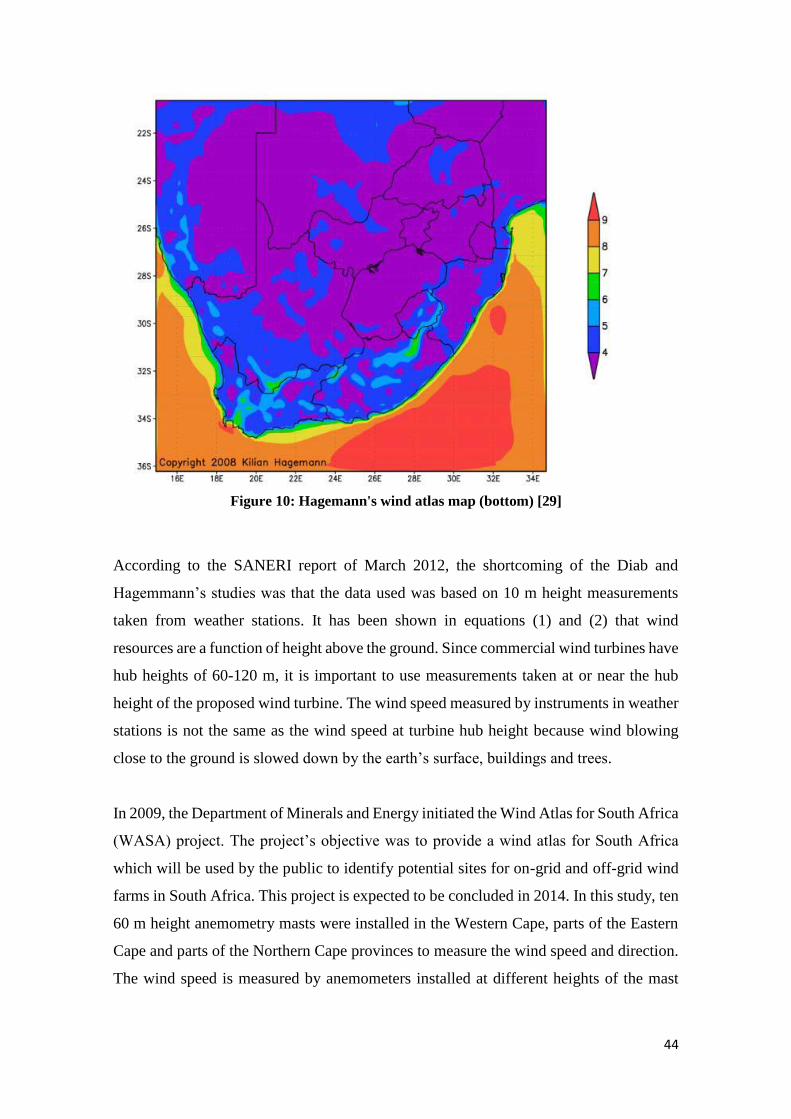
44
Figure 10: Hagemann's wind atlas map (bottom) [29]
According to the SANERI report of March 2012, the shortcoming of the Diab and
Hagemmann’s studies was that the data used was based on 10 m height measurements
taken from weather stations. It has been shown in equations (1) and (2) that wind
resources are a function of height above the ground. Since commercial wind turbines have
hub heights of 60-120 m, it is important to use measurements taken at or near the hub
height of the proposed wind turbine. The wind speed measured by instruments in weather
stations is not the same as the wind speed at turbine hub height because wind blowing
close to the ground is slowed down by the earth’s surface, buildings and trees.
In 2009, the Department of Minerals and Energy initiated the Wind Atlas for South Africa
(WASA) project. The project’s objective was to provide a wind atlas for South Africa
which will be used by the public to identify potential sites for on-grid and off-grid wind
farms in South Africa. This project is expected to be concluded in 2014. In this study, ten
60 m height anemometry masts were installed in the Western Cape, parts of the Eastern
Cape and parts of the Northern Cape provinces to measure the wind speed and direction.
The wind speed is measured by anemometers installed at different heights of the mast

45
whilst wind direction is measured by one or two wind vanes mounted on the mast. The
sites for the 10 masts were carefully selected to represent the different types of terrain and
climatology. Figure 11 shows the location of the wind masts used [31, 32].
Figure 11: Location of wind mast [31]
Using data collected from the masts on Figure 11, WASA produced South Africa’s first
large scale high resolution wind resource map available to the public, shown below as
Figure 12.

46
Figure 12: Large scale high resolution wind resource map of South Africa [33]
This map shows that there are even better wind speeds (greater than 6 m/s) in the coastal
areas as well as some inland areas in the Western, Eastern and Northern Cape provinces
than was discovered by Diab and Hagemann in their studies. These wind resources exceed
those in some European countries where grid-tied wind farms were successfully installed.
Figure 13 below shows the European wind atlas for comparison purposes.

47
Figure 13: European wind Atlas [38]
5.2 Capital cost/ Investment cost
Besides the wind resources, the second factor that determines the economics of wind
energy is the capital cost. The capital cost of a wind farm is made up of the wind turbine
cost, the distribution or the grid connection cost, the owner’s development cost, the cost
for constructing balance of plant and Engineering, Procurement and Construction (EPC)
services. Figure 14 below shows the cost share of each component in developed countries.

48
Figure 14: Capital cost of an onshore wind farm [35]
The turbine cost accounts for 68% of the total cost. This explains why several countries
targeted local manufacturing of turbines as a condition of getting the support for
developing wind farms. China required developers to use turbines made up of 70% locally
manufactured materials [16]. USA required developers to use locally manufactured wind
turbines in order to access the Production Tax Credit. This helped GE wind turbines to be
installed more than any other wind turbine in the world in 2012, snatching the number
one spot from Vestas [36]. Spain also required developers to use locally manufactured
turbines in order to be considered for the support schemes [3].
5.2.1 Prices of wind turbines
Prices of wind turbines in Europe increased sharply in 2009 from around €1.11m/MW in
2008 to €1.12m/MW in 2009. This increase is attributed to increases in the price of steel,
a major component in turbine manufacturing material. The turbine prices then decreased
steadily to €0.93m/MW in the first half of 2013. However, the wind turbine price is
expected to increase slightly to €1m/MW in 2014. This increase is attributed to upgrade
of older turbines as developers try to take advantage of technological advancement over
the last few years. Newer turbines are now taller, larger and more efficient, which would
maximise utilisation of the available wind resources [14]. In South Africa, the Darling
Wind Farm is considering upgrading the wind turbines to new models which are more

49
efficient. Figure 15 below shows the trend of wind turbine costs in the past six years and
projections for 2014.
Figure 15: Wind turbine prices by date of delivery (million Euro/MW) [14]
Since South Africa has no commercial turbine manufacturers, the preferred bidders are
most likely to source the turbines from European countries. The turbine prices are
expected to be slightly higher than shown on Figure 15 because of higher transport cost.
There is also higher probability of preferred bidders opting for Indian and Chinese
turbines which are cheaper [14] than European manufactured turbines.
5.2.2 Grid connection cost
The grid connection cost includes the cost of connecting to the local distribution or
transmission lines including the necessary substation upgrades to accommodate
additional capacity. It is normal practice to include only shallow costs (cost for connecting
the wind farm to the nearest grid connection point), and not deep cost (cost of
strengthening the transmission network). In Germany, the renewable energy IPPs are
guaranteed grid access and the connection cost does not include grid reinforcement [37].
It is desirable therefore, to site the wind farm closer to the grid to reduce the connection
cost. However, a trade-off has to be made between the site accessibility, wind resource
availability and grid accessibility. Of the three factors, wind resources far outweigh the
other factors in determining the economics of wind generation. Cost of grid connection
and site preparation is only once-off whilst the wind resources influences the viability of
the project for the rest of project lifespan. The grid connection cost accounts for 9-14%

50
of the total investment cost of a wind project [35]. Without project specific information,
10% is normally used in financial models.
In Europe, electrification is almost 100%. The wind farms therefore have better access
to the grid and grid connection costs are lower. This is different in South Africa where
some areas in the Western and Eastern Cape provinces, where wind resources are
abundant, are not electrified. The grid connection costs are therefore expected to be
higher as compared to costs in European countries.
5.2.3 Cost of balance of plant
Cost of balance of plant is related to cost of civil works, electrical and control systems of
the plant. Civil works include site preparation, road access to site (very important for the
transportation of the turbines by heavy vehicles) and turbine foundations. Electrical works
include transformer installations, line erections and control systems.
In Europe, this accounts for 13% of the total project cost as shown in Figure 14. In South
Africa, all materials needed for civil, electrical and control works are available locally at
competitive prices. The cost of electrical works is therefore expected to be comparable
with costs in Europe, if not lower due to cheap labour in South Africa than Europe.
5.2.4 Project development costs
This cost includes cost of feasibility studies to ascertain wind resources, permits such as
environmental authorisations and land use rights, as well as project consultancy fees. The
cost of feasibility studies can be reduced if there is a readily available wind resource data
to the public for use. This is the major reason for the development of the Wind Atlas of
South Africa (WASA) project discussed above.
The process of obtaining permits was cited above as one of the barriers into renewable
energy. Environmental Authorisation (EA) in South Africa may take more than a year
and the process involves environmental impact assessment which is costly. The
development costs in Europe are estimated to be 5% of the project cost as shown on
51
Figure 14. In South Africa, no data is available for the development cost of wind projects
so this European benchmark will be used for the South African environment.
5.3 Finance costs / Discount rate
The cost of debt and equity has a major effect of the total cost of the project and
subsequently on the economic feasibility of the project. The financial market of each
country influences the interest rates offered by the banks and the preferred return on
equity required by investors. Factors that influence the interest rates on debt and required
return on equity are availability of capital in a particular country, government policies on
cost of capital, risk perceptions by financial institutions on a particular class of projects
such as wind technology, inflation rates and demand for credit. In developing countries,
the finance industry is normally less competitive as compared to developed countries and
the interest rates are therefore normally high. Because of the perceived high risk of the
investments in developing countries, investors normally demand high returns on
investments. Apart from the macro-economic parameters, the technological risks increase
the cost of capital. Technologies with a proven track record and minimum operational
risk profile are preferred by financiers and would be charged less interest. According to
[38] onshore wind technology is considered to be the most proven technology amongst
the renewable energy technologies and has therefore a relatively low risk from a project
finance perspective. It is expected therefore that international financiers who have
experience of financing wind energy projects in European countries would be willing to
invest in South Africa without worrying about technological risks. This will force the
local financial banks, which have little experience in financing grid connected wind
farms, to compete as well, pushing down the financial cost.
South Africa, although it is a developing country, has a stable inflation rate (which has
been less than 6% for the past three years), sound financial institutions and a sound legal
system which investors may use to seek recourse in courts of law. These three factors are
likely to influence a low cost of capital for wind energy projects in South Africa.
Apart from the local commercial banks, the Development Bank of Southern Africa
(DBSA) and the Industrial Development Corporation (IDC) are strong enough to
participate in the renewable energy projects if there is a conducive environment. These

52
two development banks are expected to offer finance for wind projects at more favourable
rates than the commercial banks. The effect of a strong financial market on development
of renewable energy was shown in Germany by the German Bank for Reconstruction and
Development (KfW), a state owned bank. It stimulated renewable energy by offering
cheap loans for up to 75% of the project cost at below market interest rates with
favourable long loan terms. The loan would come with a redemption-free period of up to
3 years in some instances [44]. In 2013, KfW bank charged 4.39% interest rate for the
highest credit rating class for wind developers [54]. Without project specific information,
the discount rate used to evaluate the economics of wind energy in developed countries
ranges from 5% - 10% [6]. In South Africa, the swap rate alone is 8.5% as at 2011. The
discount rate is therefore expected to be more than 10%.
5.4 Operation and Maintenance (O&M) Cost
Another parameter that determines the economics of a wind farm is the operation and
maintenance cost. This is the cost incurred during the day to day running of the wind
farm. Most of the costs are fixed - they do not vary with the amount of electricity
produced. Fuel cost, which is the major contributor to variable costs in power plants, is
free. It is therefore standard practice to look at fixed costs when determining the O&M
costs of a wind farm. The O&M cost components are:
insurance cost;
regular or scheduled maintenance costs;
repair costs;
spare parts;
land lease costs; and
administration
One way of reducing these costs is to secure long term contracts for insurance, land lease
and maintenance. This will only leave the developer to deal with the cost of spares and
labour cost for major repairs not covered in the operation and maintenance contract. Like
any other machine, the repair cost and hence the O&M costs, increase as the turbine gets
older.

53
Even in Europe, it is difficult to accurately estimate the O&M costs for wind farms
because the wind industry is still young and few wind turbines have reached the end of
their life span [6]. Furthermore, the few wind turbines that are reaching the end of their
lifespan used old technology which requires more maintenance.
The O&M costs vary from country to country due to different labour costs among other
factors. However, the fact that operation and maintenance of wind farms can be done
through the internet will ensure that the O&M costs in South Africa are similar to those
in Europe.
5.5 Lifetime of turbines
The more the turbines remain in service, the more electricity they will produce over their
lifespan. The economics of wind energy is therefore also dependent on the turbine
lifespan. Turbine lifespan is determined by the manufacturer. Most of the commercial
turbines employed today have a 20 year lifespan [6].
5.6 Concluding remarks
Factors that determine the economics of wind turbines have been identified as the wind
resources, the capital cost, the finance cost, the operation and maintenance cost and the
lifetime of the turbine. Of these parameters, the wind resources have the greatest
influence. The recently produced South African Wind Atlas shows that South Africa has
very good wind resources (more than 6m/s) in the coastal and inland areas of the Eastern
Cape, Western Cape and Northern Cape provinces. These wind resources are comparable
to wind resources in Europe and can sustain wind generation in South Africa.
The only factor that will make wind energy in South Africa more expensive than in
Europe is the discount rate. The cost of capital in South Africa is higher due to weaker
financial markets than in Europe. However, South Africa has enough financial institutions
to support renewable energy, albeit at a higher cost.

54
6 EVALUATION OF REBID SCHEME
Having identified the barriers to the development of renewable energy in general and
wind energy in particular, it is crucial to evaluate the success or failure of the bidding
scheme launched by the DoE after the abandonment of the REFIT scheme. In order to do
this, an analysis has to be done on the environment in which the bidding scheme has to
operate. This analysis will focus on the political situation (rule of law), renewable energy
policy and regulations thereof as well as the regulatory environment. Once this analysis
is done and a conclusion made, an analysis of the results from the bidding scheme is done
using the first, second and third bidding rounds concluded by the DoE.
6.1 Rule of Law, Renewable Energy Policy and Regulatory Environment
Foreign investors are attracted to invest in countries where the rule of law is respected.
This will ensure enforceability of contracts signed before an investment is made. This is
particularly more important where such contracts are between private companies and an
organ of state or parastatal. Without a strong rule of law, it is difficult to enforce claims
or judgment against a parastatal. Eskom, the buyer of electricity in the renewable energy
procurement programme, is a state-owned electricity service provider in South Africa.
The rule of law will therefore be a critical factor for foreign investors. Fortunately, South
Africa has a strong rule of law and contracts are enforceable. Foreign investors are
therefore keen to invest in South Africa. This was evidenced by a large turnout of foreign
investors during the DoE’s bidding briefing notes held in Johannesburg.
Apart from the rule of law, investors want a clear government policy on renewable energy
in order to make long-term commitments. The White Paper on the Renewable Energy
Policy discussed in the introduction has been the major driving force of renewable energy
in South Africa. However, lack of legal framework for IPPs was one of the barriers in the
development of renewable energy. In South Africa, Eskom is a monopoly in the electricity
sector and is the sole owner of the national grid. Grid access for IPPs is therefore very
difficult without a proper legal framework. The DoE recognized this and designed the
‘Regulations on New Generation Capacity’ of 4 May 2011 [39]. These regulations clearly
spell out that the Minister can determine who will establish new generation capacity,
whether it will be Eskom, another organ of state or an IPP. If this capacity is going to be

55
established by an IPP, the Minister will also determine the procurer and the buyer. These
regulations give the Minister the powers to determine that the renewable energy will be
procured by the DoE and Eskom will be the single buyer. Apart from providing a sound
legal framework for the development of renewable energy in South Africa, these
regulations also ensure grid access for IPPs since Eskom, the grid owner, is the sole buyer
of all renewable energy. In a way, these regulations and Germany’s Renewable Energy
Sources Act (EEG) that was implemented in 2000 are addressing the same barriers to
renewable energy - that is guaranteed access to the grid and a pre-determined renewable
energy tariff. Under the EEG, renewable energy is given priority for grid connection, grid
access and power dispatch.
Another important policy that will support the development of renewable energy going
forward is the Carbon Tax policy planned to be introduced in 2015. The overall objective
of this policy is to reduce greenhouse gas emissions and facilitating the transition to a
green economy. The National Treasury has since released a Carbon Tax Policy Paper on
2 May 2013 for public comment. Although the electricity sector will initially qualify for
a tax free threshold of up to 70%, this policy will enable energy from renewable sources
to be more competitive with coal-based generation [40].
6.2 Social acceptance and participation of all role players from an early stage
Failure of the REFIT programme was partly because of the exclusion of the National
Treasury. In the REBID programme, all role players were involved from the beginning.
These are the DoE, NERSA, National Treasury and Eskom. Eskom, as the sole buyer,
was more involved in the drafting of the standard PPA. NERSA’s licensing requirements
were included in the bid documents. This helped all parties to accept the programme and
by including each party’s requirements in the bid documents, a situation whereby the
preferred bidder is denied a generation licence or where the buyer refuses to sign the PPA
was avoided.

56
6.3 Technology
One of the pitfalls of using a tendering process based on 70% price is that cheap
technology may be dumped in the South African market. To prevent this, the DoE’s
selection criteria required the selected turbine technology to be IEC certified. The pie
chart of Figure 16 shows that Vestas, a well-known and reliable Danish brand is
dominating the South African market. It is also interesting to note that there are two
turbine manufacturers from China, namely Snovel and United Power UP86. This shows
that China has become an integral player in the wind energy market both on technology
development and installed capacity. Both Snovel and United Power are in the top 10
rankings for installing the greatest wind capacity (MW) in 2012 [36, 41].
Figure 16: Pie Chart showing turbine market share in South Africa
This trend is consistent with global trends where Vestas has been the market leader on
commissioned wind capacity since 2001 [36]. Vestas was only displaced from the number
one spot in 2012 by General Electric of the United States of America by a slight margin.
But unlike Vestas, more than 96% [41] of the General Electric wind turbines
commissioned in 2012 were in the American market. This trend might not necessarily
continue as the surge in the GE turbines installed is attributed to the American incentive
schemes where all projects had to be grid connected prior to the 2012 year end in order
to qualify for the expiring tax credit [41, 5]. Vestas is therefore likely to regain its market
share. Figure17 below shows Bloomberg New Energy Finance’s ranking of the top 10
wind turbine manufacturers by commissioned capacity in 2012.
9
113
4
2
2
Vestas - Denmark
Acciona -Spain
Suzlon - India
Nordex -Germany
Siemens - Germany
Snovel - China
United Power - China

57
Figure 17: Top 10 wind turbines by commissioned capacity in 20127
Acciona is not in the top 10 ranking by commissioned capacity in 2012 but it is ranked
number 7 in the top 20 wind asset owners (cumulative capacity at year end 2012) in the
world [41]. This clearly shows that the price based bidding process did not result in
compromise on technology. Instead, well tried technologies with good track records
dominated the South African market.
6.4 Wind resources (Sites chosen by IPPs)
Figure 18 below shows the location of the wind farms for the DoE procurement
programme. Yellow icons represent eight IPPs from the first bidding round, red icons
represent seven IPPs from the second phase and the green icons represent the seven IPPs
from the third round. The chosen sites for these projects are mostly in the Eastern Cape
and Western Cape during the first and second round but more wind farms were chosen in
the Northern Cape for the third round, possibly as a result of more attractive sites being
taken in the first and second rounds.
7 Drawn by author from information in [41]
0
2
4
6
8
10
12
14
Co
mm
issi
on
ed c
apac
ity
(%)
Turbine Munufacturer and country
Top 10 wind turbines by commissioned Capacity (%) in 2012

58
Figure 18: Distribution of wind farms
This pattern shows that development of wind farms is on high wind sites as identified in
South Africa’s wind resource map shown on Figure 11.
6.5 Capacity allocation and Tariffs under REBID
Figure 19 shows the capacity allocation during the three bidding rounds. It should be
highlighted that in the first bidding round, there was no specific target allocation. The
1850 MW available was the total capacity available but to be procured over several
bidding rounds depending on the bid price. In the second and third rounds, the available
capacity was set at 650 MW and 654 MW respectively. The target capacity in the third
phase was exceeded slightly. Figure 18 also shows that the REBID tariffs have decreased
significantly from the first bidding round to the third bidding round. The decrease in the
average tariff shows that the competitive bidding is actually helping South Africa to get
value for money. This scenario was unlikely to be seen with the REFIT which shows
slight increase in tariffs for the same period (2011 to 2013).The lower tariffs may also be
attributed to investor confidence after the first procurement phase was held successfully.

59
All the policy uncertainties that had been brought by slow progress of REFIT and the
eventual change from REFIT to REBID seemed to have now been forgotten.
Figure 19: REBID capacity allocation and tariff comparison with REFIT
6.6 Capital investment cost
The average capital investment cost for the first phase projects is US$2,419/kW and for
the second phase projects is US$2,509/kW8. This is on a high end as compared to
investments costs in European countries (US$1,700-US$2,450/kW) for the same period
[43]. This might be attributed to the higher cost of finance and higher transport cost of
turbines from the manufacturers. From Figure 16 above, all wind turbine manufacturers
that will supply wind turbines in South Africa are based in Europe and Asian countries
and the turbines have to be shipped into the country. In the third bidding phase, the
investment capital cost of wind projects was US$2,064/kWh. The decrease as compared
8Calculated by author using information from [42], 2011 prices
1850
650 654634562
787
1.14
0.91
0.737
0.938 0.945 0.952
0
0.2
0.4
0.6
0.8
1
1.2
0
200
400
600
800
1000
1200
1400
1600
1800
2000
REBID Round 1 (2011) REBID Round 2 (2012) REBID Round 3 (2013)
Ave
rage
pri
ces
(R/k
Wh
)
Cap
acit
y (M
W)
Axis Title
REBID CAPACITY ALLOCATIONS AND PRICE
Capacity allocation (MW) Capacity of winning bids (MW)
Average Price (R/kWh) REBID Average prices (R/kWh) Projected REFIT

60
to second phase may be attributed to lower cost of capital as most of the third round
preferred bidders are large international corporate companies with strong balance sheet.
South Africa proved that it has a strong financial market capable of supporting renewable
energy. For the round three procurement programme, Absa provided finance to six
projects [44] whilst Nedbank provided finance to seven projects [45]. Standard Bank also
participated in this programme by providing finance for the first, second and third rounds.
The state owned DBSA provided loans mostly to local entrepreneurs who partnered with
the foreign investors. Apart from banks, some asset financial firms such as Futuregrowth
Asset Management Company provided financing to renewable energy projects.
Futuregrowth Asset Management Company provided funding to 23 of the 64 projects
selected in the three rounds of the renewable energy procurement programme [46].
6.7 Operation and maintenance costs
Most developers contracted the turbine suppliers to do the operation and maintenance
during the first few years of the projects with the condition of training the local
workforce and eventually transferring the knowledge and skills after 5 - 10 years.
6.8 Grid connection
In South Africa, the grid is operated by Eskom. Generally any transmission system
upgrade required to connect a wind farm is partly sponsored by the farm owner,
sometimes in full. To make matters worse, most of the wind farms in South Africa are
located in remote areas where there is ether no grid or weak grid that would require the
substation and the transmission lines to be upgraded. Some are connected to the
distribution networks owned by the Municipalities.
From the transmission loss point of view, the wind farms in South Africa will significantly
reduce the transmission losses. The wind farms are strategically located in the Western
and Eastern Cape areas, far away from the generation points in the Mpumalanga Province.
Figure 20 below shows the location of the generation stations in the country in relation to
the Western Cape Province. This Figure shows that most of the power stations are located

61
in the Mpumalanga province. The Western Cape and the Eastern Cape provinces are fed
from the Mpumalanga province through long 765 kV and 400 kV lines, which account
for a lot of technical losses.
Figure 20: Eskom's existing and planned generation capacity [47]
Eskom currently plans to strengthen the power lines going to the Cape so as to reduce
losses and improve the reliability. Any generation in the Cape would therefore reduce the
investment cost of transmission lines required.
6.9 Concluding remarks
South Africa has a political stability which is unquestionable. There is rule of law where
companies may seek recourse in the courts of law when they feel aggrieved by any party.
In addition to the renewable energy policy (White Paper on Renewable Energy policy),
that shows long term commitment to renewable energy, the South African government
produced the Integrated Resource Plan (IRP 2010-2030) which shows long-term
commitment to renewable energy in general and wind energy in particular. This will
encourage international developers and investors to set up offices and invest in the
development of renewable energy projects.

62
Although the bidding scheme was based on 70% price, the developers did not use cheap
technology as was feared by many analysts. This might be attributed to the well-designed
bidding documents which required turbine certification as a condition of technical
evaluation.
Although the developers started the projects before the wind atlas was released to the
public by the DoE, the sites chosen indicate that wind resources are good in the Western
Cape, Eastern Cape and Northern Cape provinces, just as was discovered by Diab and
Hagemann. This is also consistent with the wind atlas that was released by DoE for public
use in 2013.
Just like the UK's bidding scheme of the 1990s, the tariffs went down from an average of
R1.14/kWh in the first round to R0.656/kWh in the third round (using 2011 as base year),
thanks to the competitive nature of the bidding. This was never going to happen under the
REFIT scheme. At the time of conclusion of this report, the indications are that all projects
will reach the scheduled CODs. In fact some projects will reach COD earlier than
scheduled. All wind projects had reached financial close and construction had started on
all sites9. This success may be attributed to the fact that the projects with permits
(especially the environmental authorizations) were chosen. The imposition of penalties
for COD delays and non-performance ensured that South Africa avoided pitfalls faced by
the UK's bidding scheme. Bidders were therefore encouraged to honour the CODs and
ensured performance of wind turbines by contacting reputable turbine suppliers and EPC
contractors.
9 Eskom's presentation to Parliament Portfolio Committee on Energy of 5 November 2013.

63
7 LEVELISED COST OF ELECTRICITY (LCOE) FOR WIND
LCOE is the ratio of the total cost of running the plant over its lifetime and the electricity
produced over the life cycle of the plant, all brought to the present-day value. It is
measured in unit currency per kWh or MWh. It measures the unit cost of electricity
irrespective of technology or operating regime of the plant. This method can therefore be
used to compare cost of energy from different technologies with different dispatch rules.
The LCOE may also be interpreted as the ‘break even’ price of electricity required by
investors for a specified return. This break-even price may be used as the FIT tariff in FIT
schemes. Alternatively, it may be used to set the premium required by simply looking at
the difference between the market price and the LCOE.
The five basic parameters that determine the LCOE are the installed capital cost, the
operating cost, the discount rate, the lifespan of the project and the electricity produced.
It is interesting to note that these same parameters also determine the economics of wind
generation as discussed above. The LCOE may therefore be used to evaluate the
economics of wind generation. It should be noted however, that this method does not
account for other benefits such as job creation and reduction in greenhouse gas emissions.
Equation (8) shows how LCOE for wind can be calculated [49].
𝐿𝐶𝑂𝐸 =𝐼𝑜 + ∑
𝐴𝑡
(1+𝑖)𝑡𝑛𝑡=1
∑𝑀𝑒𝑙
(1+𝑖)𝑡𝑛𝑡=1
(8)
where,
Io is the project capital or investment cost in US$/kWh
At is the annual operation total costs in year t (fixed and variable)
Met is the annual electricity output in year t in kWh
i is the discount rate
n is the economic lifetime in years
t is the year of operation (1,2,….n)
Each of the parameters in equation (8) is associated with a set of assumptions. When
calculating the LCOE, it is therefore important to do a sensitivity analysis by changing
the assumptions and analysing the effect of that parameter on the LCOE. This will give a

64
more holistic picture than relying on only a single number or calculation. The following
sections will look at the assumptions made for calculation of LCOE for wind energy in
South Africa in order to assess the economics of wind energy.
7.1.1 Capital cost
From the REBID programme, the capital cost ranged from R15,535/kW to R24,537/kW.
An average will be used which is R20,899/kW (US$2,089.9/kW10) as the base case and
extremes will be used to test sensitivity of the LCOE for this parameter. The construction
period for a 100 MW wind farm is chosen to be two years, which is consistent with what
was allowed for by the licensed preferred bidders and what is used by international
benchmarks such as EIA [48]. NREL estimated that the cost of capital ranges from
US$1,400/kW to US$2,900/kW with an average of US$2,090/kW.
7.1.2 Discount rate
The Weighted Average Cost of Capital (WACC) methodology is used to calculate the
discount rate. The WACC depends on the volume of equity, cost of equity, volume of
debt and cost of debt. Changing the capital structure (debt-equity ratios) therefore has an
impact on WACC and ultimately on LCOE. Cost of debt is normally lower than cost of
equity because banks have first priority of recovering their money if the project fails
unlike investors. Equation (9) below gives the formula used to calculate the WACC in
this project:
𝑅𝑒𝑎𝑙 𝑊𝐴𝐶𝐶 𝑎𝑓𝑡𝑒𝑟 𝑡𝑎𝑥 = 𝑊𝑒𝑟𝑒 + 𝑊𝑑(1 − 𝑇)𝑟𝑑 (9)
where We is Weight of equity in percentage,
re is real return on equity after tax,
Wd is weight of debt in percentage,
rd is nominal return on debt pre-tax,
T is corporate tax rate, which is 28% in South Africa.
10 Assumed $/R =10 as at 2013.

65
It should be noted that since the cost of debt or interest is tax deductible, we therefore
deduct the current corporate tax rate of the cost of debt.
The real return on equity after tax, re, is determined by the shareholders’ requirements
depending on the macro-economic conditions in that country. In this project, we shall
assume 17%, as was used by NERSA during calculation of REFIT (this was based on
wide consultations done by NERSA). This is higher than what would be required in
European countries because of a strong financial market and low inflation rates there than
in South Africa.
The real return on debt after tax has to be calculated from the nominal return on debt after
tax. Nominal return on debt is influenced by three parameters for renewable energy. These
are the swap rate of the country where debt is sourced, the risk premium of the project
and the hedging costs. In South Africa, the swap rate is 8.5% (2011 base year), the
hedging cost is assumed to be 1% and the risk premium is 4%. This brings the nominal
cost of debt to 13.8%. Since nominal return on debt is affected by inflation, we have to
calculate the real return on debt, rdr, which takes rate of inflation, e, into consideration.
Six percent inflation will be used in this project since it is South Africa’s upper limit
inflation target. It should be highlighted that NERSA had assumed the inflation rate of
8% in the REFIT calculations in 2009. In developed countries such as Germany, this can
be as low as 2%. Real rate of return after tax is calculated using formula 10 below [50].
𝑟𝑑𝑟 = [(1 + 𝑟𝑑𝑛)/(1 + 𝑒)] − 1 (10)
Since tax is a pass-through cost for investors, investors are more interested in the real
WACC before tax. To calculate the real WACC before tax, the following formula is used
[55].
𝑅𝑒𝑎𝑙 𝑊𝐴𝐶𝐶 𝑏𝑒𝑓𝑜𝑟𝑒 𝑡𝑎𝑥 =𝑅𝑒𝑎𝑙 𝑊𝐴𝐶𝐶 𝑎𝑓𝑡𝑒𝑟 𝑡𝑎𝑥
(1 − 𝑇𝑎𝑥 𝑟𝑎𝑡𝑒) (11)
The calculated real WACC before tax is the discount rate used to calculate the LCOE.

66
Table 3 below summarises the financial parameters and formulas used to calculate the
real discount rate for our base case scenario.
Table 3: Financial parameters used to calculate discount rate for LCOE
Unit Symbol/Formulae Value
Equity % 30%
Debt % 70%
20 year swap rate (2013) % A 8.50%
Risk premium % B 4%
Hedging costs % C 1%
Nominal cost of debt after tax Rdn=A+B+C 13.50%
Real return on equity after tax Rera 17%
South Africa's inflation target % E 6%
Tax rate % T 28%
Real return on debt after tax % Rdra=(1+Rdn)/(1+e)-1 7.08%
WACC real after tax % DRreala=Rdr.D.(1-T)+Rera.E 8.67%
WACC real before tax % DRrealb=DRreala/(1-T) 12.04%
LCOE real discount rate before tax % 12.04%
By using real WACC, we get real LCOE which may be used as the PPA tariff in the first
year. In order to understand the differences in the financial parameters in South Africa as
compared to European countries, Table 4 below shows the financial parameters in Europe
versus those used by the author.
Table 4: Financial parameters used to calculate LCOE in European countries
Germany and Spain11 Used by Author12
Lifetime of project 20 20
Share of equity 30% 30%
Share of debt 70% 70%
Return on equity 9% 17%
Debt rate 4.5% 8.5%
Inflation 2% 6%
WACC real 3.8% 12.04%
11 Adopted from [49] and [54] 12 Calculated from table 7

67
7.1.3 Capacity Factor
The capacity factors from REBID will be used to calculate the LCOE. The average
capacity factors range from 25% to 40% with an average of 35%. The average will be
used as the base case whilst the extremes will be used to test the sensitivity of LCOE to
this parameter.
7.1.4 Life cycle of the project
We shall use 20 years as the lifetime of the project which is in line with turbine
manufacturer’s warranties and the REBID PPA.
7.1.5 Annual Operation cost
The maintenance cost depends on the quality of the turbines used and their age.
Maintenance costs increase as the turbine gets older. New models are also cheaper to
maintain than old models because of technological improvements employed on new
models. The value from international benchmarks is US$15/kW-US$35/kW with an
average of US$22/kW (base case). These are the values that will also be used for this
calculation since we do not have enough data for O&M costs for wind turbines in South
Africa.
7.2 LCOE calculation methodologies
There are several methodologies used to calculate LCOE. However, these methodologies
may be grouped into two main categories, the Discounted Cash Flow (DCF) analysis and
the Recovery Factor analysis. In the DCF analysis, the project’s annual net cash flows are
discounted to a single net present value and the internal rate of return. The LCOE will
then be revenue per kilowatt-hour that makes the net present value to be equal to zero
[51]. The CREST13 and System Advisor Model (SAM)14 models use this methodology to
calculate the LCOE and both models are available to the public.
The second method uses a single factor to convert capital investment costs to an annual
13Available at http://financere.nrel.gov/finance/content/CREST-model 14Available at https://sam.nrel.gov/content/downloads

68
figure that estimates tax benefits or obligations and repayments to all capital providers
over the lifespan of the project. Capital Recovery Factor, Fixed Charge Rate and
Economic Carrying Charge Rate (ECCR) all fall under this category. More description
and formulas for calculating LCOE using these methodologies can be found in [51].
Gifford et al [57] recommends the use of Discounted Cash Flow analysis method in
evaluating LCOE in the United States because of its ability to incorporate all available
federal and state tax incentives that are the major incentives for the development of
renewable energy in the United States. This method is not suitable in South Africa where
there is a single tax system and no state tax or renewable energy tax incentives. In this
project, ECCR methodology will therefore be used. This methodology calculates the cost
of electricity in the first year of operation. This cost would then be escalated with inflation
to get cost of electricity in subsequent years. This eliminates risk for investors who are
always worried about unsteady inflation rates in developing and undeveloped countries
in general since the price can then be linked to inflation. Equation (12) gives the formula
used to calculate the LCOE using the ECCR methodology [51].
𝐿𝐶𝑂𝐸 =((𝐸𝐶𝐶𝑅 × 𝑇𝑜𝑡𝑎𝑙 𝑖𝑛𝑠𝑡𝑎𝑙𝑙𝑒𝑑 𝑐𝑜𝑠𝑡) + 𝑇𝑜𝑡𝑎𝑙 𝑂&𝑀 𝐶𝑜𝑠𝑡𝑠)
𝐴𝑛𝑛𝑢𝑎𝑙 𝑝𝑟𝑜𝑑𝑢𝑐𝑡𝑖𝑜𝑛 𝑜𝑓 𝑒𝑙𝑒𝑐𝑡𝑟𝑖𝑐𝑖𝑡𝑦 (12)
The excel model based on ECCR used in this project was adapted from the model used
by NERSA to calculate the LCOE for REFIT. Table 5 shows the assumed project
details used in the calculation of the LCOE in the model.
Table 5: Parameters used to calculate the LCOE for the base case
Assumption Units Value Notes
Total Installed Capacity MW 100 Calculation
Total net Capacity MW 100
Capacity at metering point, taking
auxiliary and losses into consideration
Unit Turbine Capacity MW 2
Turbines used in DoE project ranged
from 1.8-3.075MW
Number of units # 50
Representative of REBID projects for
100MW wind farms
Plant construction lead time 1 Standard for onshore wind projects.

69
Table 6 below gives the low case, base case and high case values of the parameters that
determined the economics of wind energy as discussed in section 6.
Table 6: Low Case, Base case and high case values used to calculate the LCOE
Parameter Low Case Base Case High Case
Capital cost (USD/kW) 1,553.5 2,089.9 2,453.7
Discount rate (%) 10% 12% 14%
Capacity Factor (%) 24% 35% 40%
Project Lifespan (years) 15 20 25
Fixed Operation & Maintenance
(USD/kW)
15 22 35
Since the calculation of the LCOE is central to the financial and economic assessments
in this report, detailed calculation will be explained for the base case scenario using
parameters given on Table 6.
Using equation (8), the Economic Carry Charge Rate (ECCR) per dollar invested is
calculated using the PMT function as in equation (13).
𝐸𝐶𝐶𝑅
= 𝑃𝑀𝑇(𝐷𝑖𝑠𝑐𝑜𝑢𝑛𝑡 𝑅𝑎𝑡𝑒, 𝑁𝑜. 𝑜𝑓 𝑝𝑎𝑦𝑚𝑒𝑛𝑡𝑠 (𝑦𝑒𝑎𝑟𝑠), 𝑝𝑟𝑒𝑠𝑒𝑛𝑡 𝑣𝑎𝑙𝑢𝑒, 𝑓𝑢𝑡𝑢𝑟𝑒 𝑣𝑎𝑙𝑢𝑒, 𝑡𝑦𝑝𝑒)
= 𝑃𝑀𝑇(0.12, 20, −1, 0, 1)
= 0.119534625 (13)
Future value is zero because it has been assumed that project lifespan is 20 years and after
that, the value of scrap is equal to decommissioning costs. The type value is 1, meaning
the payments are done at the beginning of the period (year).
𝐿𝑒𝑣𝑒𝑙𝑖𝑠𝑒𝑑 𝑐𝑎𝑝𝑖𝑡𝑎𝑙 𝑐𝑜𝑠𝑡 (𝑈𝑆$ 𝑘𝑊⁄ ) = 𝐸𝐶𝐶𝑅 × 𝑐𝑎𝑝𝑖𝑡𝑎𝑙 𝑐𝑜𝑠𝑡 𝑘𝑊⁄
= 0.1195 × 2089.9
= 249.8154 (14)

70
Annual levelised capital cost per kWh is obtained by dividing the levelised cost per kW
by the number of hours in a year and the capacity factor. For the base case, the capacity
factor is 35%.
𝑇ℎ𝑒 𝑎𝑛𝑛𝑢𝑎𝑙 𝑙𝑒𝑣𝑒𝑙𝑖𝑠𝑒𝑑 𝑐𝑎𝑝𝑖𝑡𝑎𝑙 𝑐𝑜𝑠𝑡 𝑘𝑊ℎ⁄ =249.8154
8760 × 0.35= $0.0815/𝑘𝑊ℎ (15)
The levelised fixed operation and maintenance costs is $22/kW as per Table 6.
𝑇ℎ𝑒 𝑎𝑛𝑛𝑢𝑎𝑙 𝑙𝑒𝑣𝑒𝑙𝑖𝑠𝑒𝑑 𝑓𝑖𝑥𝑒𝑑 𝑜𝑝𝑒𝑟𝑎𝑡𝑖𝑜𝑛 𝑎𝑛𝑑 𝑚𝑎𝑖𝑛𝑡𝑒𝑛𝑎𝑛𝑐𝑒 =22
8760 × 0.35
= $0.0072 𝑘𝑊ℎ⁄ (12)
Total levelised cost is obtained by adding values from equations (11) and (12).
𝑇𝑜𝑡𝑎𝑙 𝑙𝑒𝑣𝑒𝑙𝑖𝑠𝑒𝑑 𝑐𝑜𝑠𝑡 = $(0.0815 + 0.0072) 𝑘𝑊ℎ⁄ = $0.08868 𝑘𝑊ℎ⁄
= 𝑅0.8868 𝑘𝑊ℎ⁄ (16)
7.2.1 The results
From the model, the base case LCOE for wind is R0.8865/kWh (2013 base prices). When
compared to Eskom’s average tariff of R0,63/kWh (2013 base price), the wind LCOE is
higher and would not compete.
When the base LCOE was benchmarked with LCOE in European countries, it was found
that the LCOE is lower than for Spain, Germany, Netherlands and Switzerland. Figure 21
shows the comparison with wind farms in European countries that successfully rolled out
wind energy [53]. REFIT was also included for comparison purposes.

71
Figure 21: Comparison of REBID LCOE with international benchmarks (2013 base prices)
7.2.2 Sensitivity analysis
Wind resources was identified as the parameter with the most influence on economics
and LCOE. To assess its impact, LCOE was calculated for different capacity factors and
a graph was plotted as shown on Figure 22. This graphs shows that the LCOE, and
therefore the economics of wind energy, is heavily dependent on the wind resources
available. The LCOE is low at R0.7757/kWh at 40% capacity factor but becomes very
high at R1.5515/kWh on low wind resources with capacity factor of 20%.
Figure 22: Variation of LCOE with capacity factor
020406080
100120140160180
LCO
E (U
S$/M
Wh
)
Country
LCOE Benchmarks
0.7
0.8
0.9
1
1.1
1.2
1.3
1.4
1.5
1.6
1.7
0.18 0.2 0.220.240.260.28 0.3 0.320.340.360.38 0.4 0.420.440.460.48 0.5
LC
OE
, R
/kW
h
Capacity Factor
Wind LCOE, R/kWh Vs Capacity Factor
Wind LCOE, R/kWh

72
Sensitivity analysis was also done on the rest of the parameters and results are shown on
Figure 23 below.
Figure 23: Sensitivity analysis of parameters affecting the LCOE
From Figure 22, it shows that LCOE is also very sensitive to the investment cost and the
capacity factors followed by the discount rate. As the investment cost increases, the
LCOE increases. The LCOE also increases as the discount rate increases.
7.3 Limitation of the model used to calculate the LCOE
The model did not take into account the revenue that the IPPs will get from selling
renewable energy certificates on the international market. There was simply not enough
information to include this benefit in the model.
0.5 0.6 0.7 0.8 0.9 1 1.1
LCOE (R/KW)
Sensitivity analysis of parameters on LCOE Reference LCOE =R0.8865/kWh
project lifespan (yrs)
Discount rate
Capacity Factor
O&M (US$/kW)
Investment cost (US$/kW)
224 1520
10% 12% 14%
40% 24%35%
352215
2,453.72,089.91,553.5

73
7.4 Concluding Remarks
The REBID LCOE is very competitive at R0.8865/kWh. This value is comparable to
some European countries that successfully implemented renewable energy such as Spain
and Germany.
It has also been shown that the wind resources have the greatest impact on the economics
of wind energy in South Africa.

74
8 CONCLUSION
The economics of wind generation depends on six parameters, namely, the wind
resources, capital cost, the discount rate, the project lifespan and the operation and
maintenance cost. Wind resources and the installation cost have the greatest influence on
the economics of wind generation. Of these five parameters, the wind resources have the
greatest influence. The wind atlas map developed by WASA and corroborated by capacity
factors declared in REBID projects shows that South Africa has good wind resources,
enough to support wind energy generation.
The research also shows that while the REFIT scheme was used successfully in European
countries, it was not going to work in South Africa because firstly, it was not legally
sound and might have faced legal challenges in the courts of law. Secondly, the REFIT
rates that had been developed were too high as compared to what the bidders submitted
in the REBID programme. This highlights the importance of properly setting the REFIT
rates that are enough to attract investors but that would also prevent developers from
getting windfall profits. South Africa's bidding scheme is the right instrument to deploy
renewable energy in South Africa compared with the REFIT. From the results of the
REBID, it shows that the country got good technology at competitive prices. Unlike in
the UK where the tendering scheme failed to deliver projects, all round one and two
projects were on schedule to reach scheduled COD as at November 201315.
The location of wind farms in South Africa will add other economic benefits such as job
creation in remote areas, electricity expansion in those areas as well as reduction in
technical losses. The only shortcomings of the South African bidding scheme are that it
does not encourage local manufacturing of components and is also not suitable to local
developers. High competition with international developers who have more financial
muscle will stifle local developers.
To increase the economic benefits from wind generation, it is recommended that the
subsequent bidding rounds incorporate local content for wind turbines manufactured.
15DoE's presentation to parliamentary Portfolio Committee on Energy, 5 November 2013.

75
This will attract wind turbine manufacturing in South Africa and the country might end
up exporting to other African countries.

76
9 REFERENCES
1. Eskom Holdings SOC Ltd, “Integrated 2012/13 Annual Report”, March 2013.
2. Wind Power Program;http://www.wind-power-
program.com/turbine_characteristics.htm (Accessed 12 July 2013).
3. International Renewable Energy Agency (IRENA) “30 years of policies for
wind energy, Lessons from 12 Wind Energy markets”, 2012.
4. Department of Minerals and Energy, “White paper on the Renewable Energy
Policy of the Republic of South Africa”, Government Gazette no. 26169,Nov
2003.
5. Navigant Consulting, Inc, “World Market Update 2012; International Wind
Energy Development. Forecast 2013-2017”, March 2013,
6. European Wind Energy Association “Wind Energy - The facts”, March 2009.
7. Mathew S, “Wind Energy, fundamentals, Resource Analysis and Economics”,
Springer, Netherlands, 2006.
8. Gipe P, “Wind Power”, James & James (Science Publishers) Ltd, London, 2004.
9. ECOFYS, “Financing Renewable Energy in the European Energy Market”,
January 2011.
10. Ackermann T, “Wind Power in power Systems”, John Wiley & Sons, Ltd,
Chichester, 2005
11. http://www.teachergeek.org/wind_turbine_types.pdf (accessed 02 August 2013).
12. National Renewable Energy Laboratory; US Department of Energy, “20% wind
energy by 2030”.
13. Boston University, Mechanical Engineering Department; Wind Turbines,
http://people.bu.edu/noahb/files/wind_turbine_main.pdf, (Accessed 7 September
2013).
14. Bloomberg New Energy Finance, Q3 Clean Energy Policy and market briefing,
October 2012. https://www.bnef.com/InsightDownload/7218/pdf/, Accessed 7 January 2013.
15. International Renewable Energy Agency (IREA), “Renewable energy auctions
in developing countries”, 2013.
16. Fulton M, Capalino R. “The German Feed-In Tariff: Recent Policy Changes”,
September 2012

77
17. NERSA, “Regulatory rules on network charges for third party transportation of
Energy”, March 2012.
18. Eskom Holdings SOC Ltd, “Annual Financial Statements”, 31 March 2013.
19. Eskom Holdings SOC Ltd, “Integrated 2012/13 Annual Report”, 31 March
2013.
20. NERSA, “The review of the Eskom Tariffs for the period 01 April 2012 to 31
March 2013”, March 2012.
21. European Commission, Quarterly report on European Electricity markets, Vol 6,
Issue 2, Second Quarter 2013
22. Global Wind Energy Council, “Global Wind Report, Annual Market Update”,
2012.
23. Edkins M. T, “Reviewing Wind Energy Policy Risk in South Africa”, World Wind
Energy Conference 2012, Bonn, Germany.
24. GreenStream,“Opportunities to utilise tendering as a part of a feed in tariff
system”, January 2010.
25. http://www.info.gov.za/speeches/2009/09062616151007.htm (accessed
03August 2013)
26. NERSA, “Renewable Energy Feed –In Tariff Guidelines”, 2009
27. NERSA, “Renewable Energy Feed –In Tariffs Phase II”, 2009
28. The European Wind Energy Association, “The economics of Wind Energy”,
March 2009
29. Szewczuk S, “Wind Atlas for South Africa: Wind measurements and micro-scale
modelling”, 2010
30. Szewczuk S, Prinsloo P, “Wind Atlas for South Africa (WASA): Project overview
and current status”, CSIR Science Real and Relevant Conference, 2010.
31. Mortensen N. G et al, “Observational Wind Atlas for 10Met. Masts in Northern,
Western and Eastern Cape Provinces”, Dec 2012.
32. Wind atlas for South Africa (WASA),
Summary.http://www.record.org.za/resources/documents-
files/doc_download/27-wasa-summary-and-status, Accessed 22 September
2013.

78
33. Wind Resource Maps for WASA domain, South Africa, May 2013http://stel-
apps.csir.co.za/wasa-
data/grids/WASA%20wind%20resource%20information%20sheet%20v%20Ma
y%202013%20w.pdf; last accessed 7 September 2013.
34. http://www.windatlas.dk/europe/landmap.html, last accessed 22 September
2013.
35. Black & Veatch, “Cost and performance data for power generation
technologies”, February 2012.
36. Renewable Energy World.Com “Energy World.com GE Snatches Wind
Installation Crown from Vestas”,
http://www.renewableenergyworld.com/rea/news/article/2013/02/ge-snatches-
wind-installation-crown-from-vestas; (Accessed 15 September 2013.
37. ECOFYS, “Policy instrument design to reduce financing cost in renewable energy
technology projects”, October 2008.
38. ECOFYS, Financing Renewable Energy in the European Energy Market, January
2011
39. Electricity Regulation Act, 2006: Electricity Regulations on New Generation
Capacity, R399 Government Gazette No 34262 of 4 May 2011.
39. Department of Energy media release on the Launch of First Wind Map;
http://www.energy.gov.za/files/media/pr/2013/MediaRelease-First-large-Scale-
High-Resolution-Wind-Resource-Map-Launched-31July2013.pdf, last accessed
7 September 2013.
40. National Treasury, Republic of South Africa, “Policy paper for Public
Comment: Carbon Tax”, May 2013
41. Bloomberg New Energy Finance, “Vestas and GE were neck-and-neck for lead
in wind’s record year”, 18 April 2013.
http://bnef.com/Downloads/pressreleases/298/pdffile/, Accessed 22 September
2013.
42. Department of Energy, “Window two prefered bidders' announcement”, May
2012.
http://www.energy.gov.za/IPP/Renewables_IPP_ProcurementProgram_Window
TwoAnnouncement_21May2012.pptx. Accessed 20 December 2013.
43. IRENA, “Renewable Energy Technologies: cost Analysis Series, Wind Power”.
Vol 1 Power Sector Series, issue 5/5, June 2012.

79
44. Engineering News, Absa commits R10.8bn to REIPPP renewable energy projects.
http://www.engineeringnews.co.za/article/absa-commits-r108bn-to-reipppp-
round-3-projects-2013-11-11/rep_id:3182, Accessed 18November 2013
45. Engineering News, Nedbank provides debt funding for seven REIPPPP 3 projects,
http://www.engineeringnews.co.za/article/nedbank-provides-debt-funding-for-
seven-reipppp-3-projects-2013-11-
08/rep_id:3182?utm_source=Creamer+Media+FDE+service&utm_medium=em
ail&utm_campaign=Sapvia+calls+for+more+renewables+capacity+%7C+SA%2
C+DRC+plan+regional+bilaterals+%7C+Investments+remain+protected%2C+a
ssures+Davies&utm_term=http%3A%2F%2Fwww.engineeringnews.co.za%2Fa
rticle%2Fnedbank-provides-debt-funding-for-seven-reipppp-3-projects-2013-11-
08%2Frep_id%3A3182, Accessed 18November 2013.
46. Engineering News, Futuregrowth provides R165million for five
projects,http://www.engineeringnews.co.za/article/futuregrowth-provides-r165-
million-for-five-reipppp-projects-2013-11-27/rep_id:3182.
47. Eskom Transmission Development Plan 2013 – 2022, October 2013
48. US Energy Information Administration, “Assumptions to the Annual Energy
Outlook”,http://www.eia.gov/forecasts/aeo/assumptions/pdf/electricity.pdf.Acce
ssed 20 December 2013.
49. Fraunhofer Institut for Solar Energy Systems ISE, “Levelized cost of electricity
renewable energies”, May 2012.
50. Short W, Packey D.J, Holt T, “A manual for economic evaluation of energy
efficiency and renewable energy technologies”, March 1995.
51. NREL, Renewable Energy Cost Modelling: A “Toolkit for establishing cost-
based incentives in the United States”, May 2011.
52. NERSA, Determination of the municipal tariff guidelines for the financial year
2013/14 and revision of the municipal tariff benchmarks, March 2013.
53. IEA Wind Task 26, Multi-national Case Study of the financial cost of wind, March
2011
54. Fraunhofer Institut for Solar Energy Systems ISE, “Levelized cost of electricity
renewable energy technologies”, November 2013