ecf co2 web
TRANSCRIPT

www.ecf.comwww.ecf.com
CyCle more often 2 Cool down the planet !Quantifying Co2 savings of CyclingeCf gratefully acknowledges
financial support from the european Commission rue franklin, 28 1000 Brussels, Belgium phone: +32 2 880 92 74 fax: +32 2 880 92 75 [email protected]
studiogoffin.be

www.ecf.com33
Quantifying Co2 savings of cycling
List of acronyms
Cdm Clean development mechanism
Co2 Carbon dioxide
Co2e Carbon dioxide equivalent
eU etS european Union emissions trading Scheme
GhG Greenhouse Gas
IpCC Intergovernmental panel on Climate Change
Itdp Institute for transportation and development policy
kt kilo-tonnes (or 103 metric tonnes)
nama nationally appropriate mitigation actions
pKt passenger kilometres travelled
SloCat Sustainable low Carbon transport partnership
SUtp Sustainable Urban transport project
tdm transportation demand management
t tonnes
ttw ‘tank to wheel’ emissions
UItp International Union for public transport
UnfCCC United nations framework Convention on Climate Change
VKt Vehicle kilometres travelled
wtt ‘well to tank’ emissions (or production phase: crude oil production, refining and distribution) account for about 17% of ‘well to wheel’ emissions
wtw ‘well to wheel’ emissions, represent the addition of wtt and ttw emissions
Cooling down the planet on 2 wheels
CyCle more often 2Cool down the planet !Quantifying Co2 savings of Cycling
Quantifying Co2 savings of cycling

Quantifying Co2 savings of cycling
Cycle more Often 2 cool down the planet ! www.ecf.com
responsible editor :european Cyclists’ federation aSBlrue franklin 28B-1000 Brussels authors:Benoît BlondelwithChloé mispelonJulian ferguson
november 2011 eCf would like to gratefully thank photo contributions by marc van woudenberg, amsterdamize.com.
Quantifying Co2 savings of cycling
Table of Contents Executive summary ................................................................................................................................. 5
Introduction ............................................................................................................................................ 7
1. C02 savings at current levels of cycling .....................................................................................................9
1. Lifecycle assessment of different mode of transport ..........................................................................9
1.2 How much C02e is cycling saving at current levels? ....................................................................... 16
1.3 How much CO2e is cycling saving if bicycles share was to increase? .............................................. 16
2. Approaches to reduce transport GHG emissions ...................................................................................... 17
2.1 Improving ................................................................................................................................... 18
2.2 Avoiding ..................................................................................................................................... 19
2.3 Shifting ....................................................................................................................................... 19
2.4 Shortening ................................................................................................................................. 20
Advantages of shifting compared to improving measures ........................................................................ 20
Factors influencing modal choice ........................................................................................................... 21
Multimodality, inter-modality and co-modality ........................................................................................ 21
Maximizing the potential of inter-modality ............................................................................................. 21
Cycling and public transport ................................................................................................................. 22
Bicycle share schemes ........................................................................................................................... 22
Pedelecs ............................................................................................................................................... 24
2.5 Cost effectiveness of transport GHG reduction policies ...................................................................25
2.6 Shifting and rebound effect ......................................................................................................... 26
3. Cycling and carbon finance ................................................................................................................... 27
Quantifying Co2 savings of cycling
Cycle more Often 2 cool down the planet ! www.ecf.com5
Quantifying Co2 savings of cycling
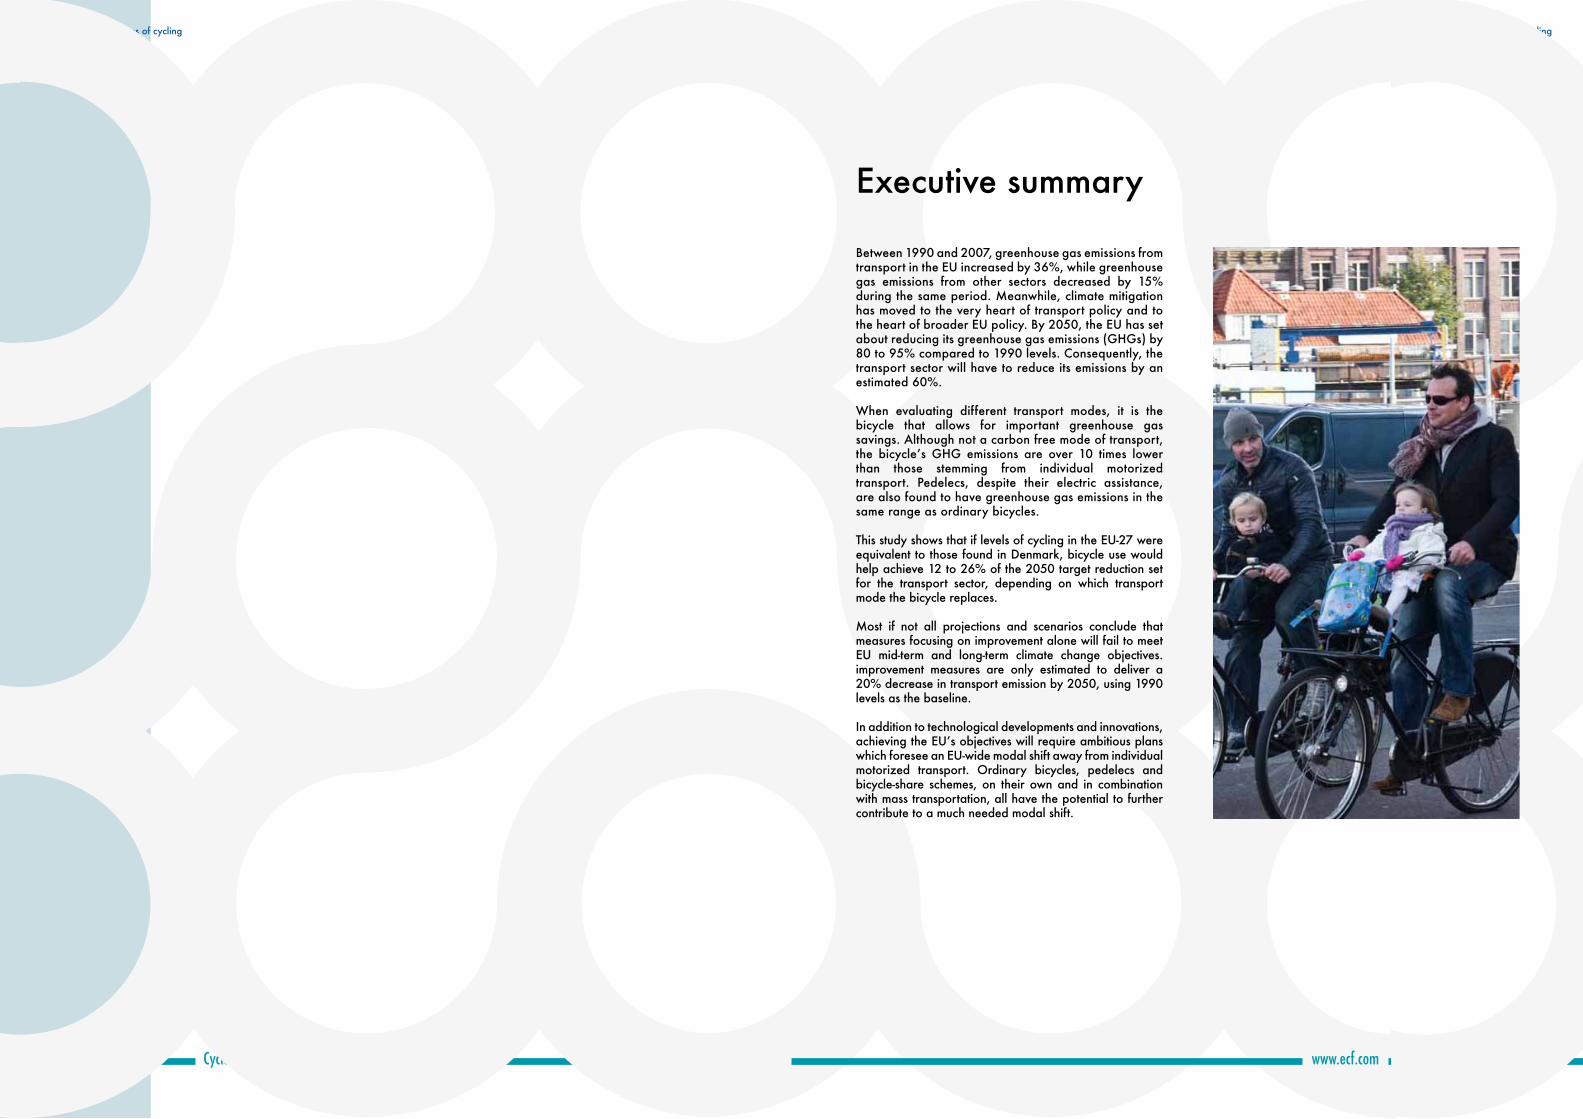
executive summary
Between 1990 and 2007, greenhouse gas emissions from transport in the eU increased by 36%, while greenhouse gas emissions from other sectors decreased by 15% during the same period. meanwhile, climate mitigation has moved to the very heart of transport policy and to the heart of broader eU policy. By 2050, the eU has set about reducing its greenhouse gas emissions (GhGs) by 80 to 95% compared to 1990 levels. Consequently, the transport sector will have to reduce its emissions by an estimated 60%.
when evaluating different transport modes, it is the bicycle that allows for important greenhouse gas savings. although not a carbon free mode of transport, the bicycle’s GhG emissions are over 10 times lower than those stemming from individual motorized transport. pedelecs, despite their electric assistance, are also found to have greenhouse gas emissions in the same range as ordinary bicycles.
this study shows that if levels of cycling in the eU-27 were equivalent to those found in denmark, bicycle use would help achieve 12 to 26% of the 2050 target reduction set for the transport sector, depending on which transport mode the bicycle replaces.
most if not all projections and scenarios conclude that measures focusing on improvement alone will fail to meet eU mid-term and long-term climate change objectives. improvement measures are only estimated to deliver a 20% decrease in transport emission by 2050, using 1990 levels as the baseline.
In addition to technological developments and innovations, achieving the eU’s objectives will require ambitious plans which foresee an eU-wide modal shift away from individual motorized transport. ordinary bicycles, pedelecs and bicycle-share schemes, on their own and in combination with mass transportation, all have the potential to further contribute to a much needed modal shift.

6
Quantifying Co2 savings of cycling
Cycle more Often 2 cool down the planet ! www.ecf.com7
Quantifying Co2 savings of cycling
Introduction
Source : EEA
----- - ----
----
-----------
- - - - - - ----
----
-----------
- - - - - - ---
--------
----
----
•28000 km with the bicycle•5822 km with the bus•2170 km with the car
transport is a source of substantial and rapidly increasing greenhouse gas emissions (GhG). Between 1990 and 2007, eU GhG emissions of all sectors bar transport fell by 15%, whereas transport emissions actually increased by 36% in the same period. In 2007, the sector accounted
for around one quarter of all eU emissions, with eU road transport GhG making up approximately one fifth of overall eU emissions.
8,0%
30,0%
12,0%
17,2%
0,4%
3,3%
2,6%
0,4%
0,2%
0,2%
8,0%3,1%
10,0% 4,7%
24,3%
manufacturing and construction
agricultural
energy
other
Industrial processes
residential
Int’l aviation
Commercial
road transport
domestic aviation
domestic navigation
Int’l maritime rail transport
other transport

Cycle more Often 2 cool down the planet !8
Quantifying Co2 savings of cycling
www.ecf.com9
Quantifying Co2 savings of cycling
Source : European Commission1
By 2020, the eU agreed to cut overall eU greenhouse gas emissions by 20% compared to 1990 levels. In sectors that are not covered by the european Union emissions trading System (eU etS) – such as transport – emissions are to be collectively reduced by 10% below 2005 levels.
the eU also has the objective of reducing greenhouse gas emissions by 80-95% by 2050 compared to 1990 levels.
C02 savings at current levels of cycling
Introductionwhat is the potential of cycling when it comes to lowering eU greenhouse gas emissions ? and how does cycling compare with other modes of transport ? It is often said that cycling is a zero-emission mode of transport. while this is true for air and noise pollution, the same cannot be said about cycling and greenhouse gas emissions. In order to accurately answer this question on cycling and GhG emissions, it is important to assess a bicycle’s ‘life cycle’, and then determine levels of cycling across the eU.
life cycle assessment of different modes of transport Generally speaking, great care should be taken when comparing data among different forms of transport. Inherent differences between the transportation modes such as the nature of services, routes available and many other additional factors make it difficult to obtain a truly comparable figure for energy intensity. nevertheless, it is possible to approximate these GhG emissions, integrating these differences wherever possible or making note of any limitations.
when comparing modes of transport and their impact on climate change, the life cycle should be taken into consideration as much as possible: each type of mode of transport requires a certain level of energy to produce, manufacture, operate and dispose. the same can be said for the construction and maintenance of the infrastructure required for their use.
the life cycle of transport mode can be divided into different phases:
• the production phase which includes the energy and material inputs required to manufacture the vehicle.
• the operation phase, which includes fuel production and utilisation.
• the maintenance phase, which includes all activity required to keep a vehicle as safe as possible on the road.
the following sections of a transport mode’s life cycle fell outside the scope of this study:
• Infrastructure is generally not included in a life Cycle assessment (lCa) and was not included in this study because there is a lack of recent evidence on GhG impact and lifespans of roads and bicycle paths.
• Disposal, including the impact of waste material, is also neglected because of standard practises in reuse and recycling of materials, and because of its marginal impact on overall GhG emissions in terms of transport.
this study therefore calculates the impact of the production, maintenance, operation and fuel production phases for 4 different modes of transport: the bicycle, the pedelec (electrically assisted pedal bicycling), the car and the bus.
the bicycle
In studies which look at the life cycle of different modes of transport, walking and cycling are rarely included. when they are included, they’re often portrayed as zero emission options, implying that these modes don’t emit any GhG. while there is some truth in this, i.e. cycling does not need fuel to operate, the production of a bicycle alone also entails GhG emissions. for cycling to be taken seriously amongst key decision makers, it is important to quantify its impact and ability to reduce GhG emissions.
production and maintenance
portraying the bicycle as the zero emission option is clearly misleading with respect to its production: GhGs are linked to the extraction and manufacturing of the raw material needed to produce a bicycle. tno calculated this using data from the eco-invent database 3. they did so on the assumption 4 that the average commuter bicycle weighs 19.9kg, that it is composed of 14.6 kg aluminium, 3.7 kg steel and 1.6 kg rubber and that the bicycle will last 8 years and cover a distance of 2400 km each year. Using these assumptions, it is estimated that bicycle production and maintenance accounts for approximately 5 grams CO2e 5/km.
3 tno, fietsen is groen, gezond en voordelig, 2010.
4 other assumptions include that the tires are to be replaced every 5000 km, for a total replacement of 5,6 tires over a period of 8 years, tno, fietsen is groen, gezond en voordelig, 2010
5 Co2e stands for equivalent carbon dioxide.
Such long-term emissions targets can only be met if transport emissions are also drastically reduced. the commission estimated the transport sector needs to reduce its emissions by 54% to 67% by 2050, compared to 1990 levels. It appears that climate mitigation has moved to the heart of transport policy and indeed to the heart of eU policy.2
Using current levels of cycling as a basis, this report aims to estimate the greenhouse gas emissions of the bicycle and its use. It aims to answer the question: how does cycling compare with other modes of transport ?
1 Commission communication ‘a roadmap for moving to a competitive low carbon economy in 2050’ - Com(2011) 112 final
2 «the next Commission needs to maintain the momentum towards a low emission economy, and in particular towards decarbonising our electricity supply and the transport sector”, european Commission president Barroso, political guidelines for the next Commission, 3 September 2009
this report will also look at the potential of the bicycle to reduce greenhouse emissions. while the bicycle cannot lower its own GhG emissions, there’s little doubt that bicycle use could certainly increase.
finally, this report will have a very brief look into cycling and carbon finance. how can the amount of carbon that cycling saves be valued ?
0
20
40
60
80
100
120
0
20
40
60
80
100
120
Power
Industry
Transport
Non CO2 Agriculture
1990 1997 2004 2011 2018 2025 2032 2039 2045
Current policy
EUTarget
Non CO2 other sectors
Residential & Tertiary

Cycle more Often 2 cool down the planet !10
Quantifying Co2 savings of cycling
www.ecf.com11
Quantifying Co2 savings of cycling
operation
Calculating GhG linked to the operation of a bicycle means looking at additional dietary intake of a cyclist compared with a motorised transport user. one could conclude -and many studies do- that most cyclists will not eat more when cycling. It is also often cited that the fuel –the fat in other words- is already there, waiting to be burned. yet such conclusions overlook the reality that cyclists must find their energy somewhere. research6 analysed precisely this problem and found that people do increase their food intake when they become more physically active. furthermore, GhG linked to food production, distribution and consumption is far from negligible. finally, it would short-sighted to dismiss the ‘fuel factor’ of a bicycle, especially when fuel burned by motorised transport has such a huge impact on GhG emission calculations.
6 Coley d.a, emission factors for human activity, energy policy 30 (1), 3-5, 2002
“fuel” calculations for cyclists are as follows:
at 16 km per hour, a cyclist is burning about 4 kilocalories per kilogram per hour7, while the relative metabolic rate of “driving to work” requires no more energy than somebody going about their daily activities: 1,5 kilocalories per kilogram per hour8.
an adult of 70 kg will therefore burn 175 kilocalories more9 per hour when cycling compared with driving. following this logic, for each kilometre cycled this adult will need an additional 11 kilocalories10.
the question therefore remains, how do we determine the GhG emission linked to these additional calories ? the carbon intensity of food varies greatly as can be seen in the graph11 below. these figures incorporate all aspects of food production, including farm machinery, irrigation, production, and the application of fertilizers and pesticides.
7 tno, fietsen is groen, gezond en voordelig, 2010
8 the relative metabolic rate of driving at work is lower than that of many other common activities such as childcare or putting away groceries, but a bit higher than resting. ainsworth B., the Compendium of physical activities, 2003
9 70 kg x (4kcal/h – 1,5kcal/h)= 175 kcal/h
10 175 kcal/h / 16km/h= 175 kcal/16km, or 11 kcal/km
11 figures come from estimates of pimentel and pimentel (2008). there are significant uncertainties in these estimates depending on both the method of growing the food and on the methodology of calculating the emissions.
Source : Pimentel and Pimentel (2008)
If the additional calories were to be found in beef only, this would add 157 grams12 Co2e to each km cycled. on the other hand, soybean calories would add only 0.8 grams13 onto each km cycled. the question therefore remains, which figures should be used ?
If we consider that in the eU the daily kilocalorie intake is 346614 and that food has an impact of 1.83 tons Co2e per year per person15, this puts the kilocalories at 1.44g Co2e. therefore the “fuel” of the cyclist can be estimated at 16 grams CO2e/km16.
to summarize the impacts of production, maintenance and operation phases, the life cycle inventories of a bicycle reveals that bicycles release about 21 grams of CO2e per passenger kilometre travelled.
how does this compare with the pedelec, the passenger car and the bus ?
the pedelec
according to eU regulations17, pedelecs (short for ‘pedal electric cycling’) are «cycles with pedal assistance which are equipped with an auxiliary electric motor having a maximum continuous rated power of 0.25 kw, of which the output is progressively reduced and finally cut off as the vehicle reaches a speed of 25 km/h, or sooner, if the cyclist stops pedalling.»
12 11Kcal/km x 14.3 g/kcal is 157 g/km.
13 11kcal/km x 0.07g/kcal is 0.8 g/km.
14 eurostat, figure for 2007
15 Small world Consulting
16 1,44g Co2e/kcal x 11kcal/km is 16 gCo2e/km
17 eU directive 2002/24/eC
pedelecs are sometimes referred to as e-bicycles, or electric bicycles. however, pedelecs only work if the driver is pedalling. e-bikes on the other hand differ in that the electric motor can still power the vehicle even if the driver does not pedal.
a study by tno18 estimates Co2e emissions of pedelecs at around 17 grams per kilometre. this includes 7 grams19 for production and maintenance and 10 grams linked to the production of the electricity20 that is needed to assist the cyclist. assumptions include a life cycle of 8 years and a yearly distance of 2400 km, the same distance used in calculations for a normal bicycle. the carbon intensity of electricity supplied in the eU-27 is 12% lower than in the netherlands where the study took place. therefore Co2e emissions linked to the electricity used by the pedelec are actually 9 grams per kilometre21.
assuming the cyclist on his pedelec is burning about 2.5 kilocalories per kilogram per hour22, an adult of 70 kg will therefore burn 70 kilocalories more per hour23 when cycling his or her pedelec than when driving, or 4.4kcal/km24; therefore this cyclist will emit an additional 6g CO2e/km25.
for each kilometre cycled, pedelecs therefore have Co2e emissions of about 22 grams, in the same range as those of a normal bicycle.
18 tno, 2010
19 Co2 emissions linked to production and maintenance of pedelecs are estimated to be between 5 to 9 grams depending on intensity of use, tno, 2010
20 hendriksen I, engbers l, Schrijver J, Gijlswijk r van, weltevreden J, wilting J., elektrisch fietsen – marktonderzoek en verkenning toekomstmogelijkheden, 2008
21 respectively 0.42949 kgCo2 per kwh electricity and heat consumed for the netherlands, and 0.38265 for the eU27 average, eea figures for 2006
22 this is as much as for childcare or putting away groceries, ainsworth 2003.
23 70 kg x (2.5kcal/h – 1.5kcal/h)= 70 kcal/h
24 70kcal/h / 16km/h is 4.4kcal/km
25 4.4kcal/km x 1.4g Co2/kcal
Co2e (grams per 100 calories)
0 200 400 600 800 1000 1200 1400 1600
Beef
Lamb
Salmon
Eggs
Pork
Milk
Chicken
Tomatoes
Potatoes
Corn
Soybeans
1431
970
483
394
308
247
52
46
23
11
7
Cycle more Often 2 cool down the planet !12
Quantifying Co2 savings of cycling
www.ecf.com13
Quantifying Co2 savings of cycling
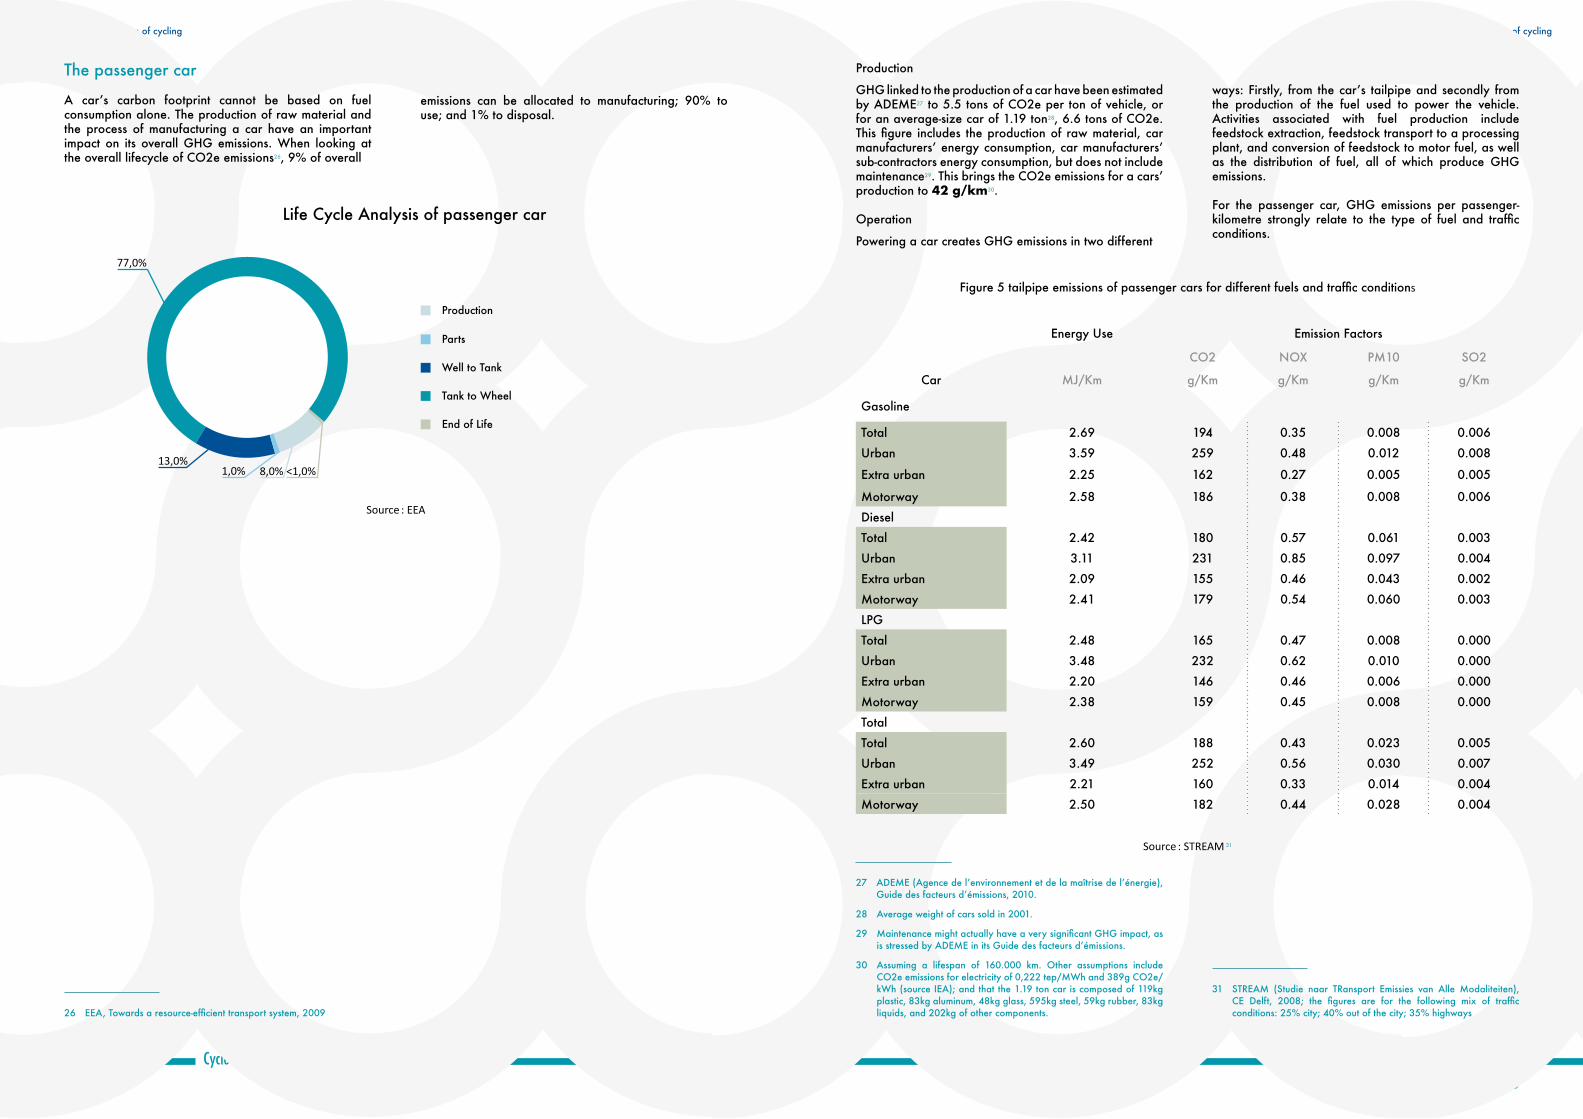
figure 5 tailpipe emissions of passenger cars for different fuels and traffic conditions
energy Use emission factors
Co2 noX pm10 So2
Car mJ/Km g/Km g/Km g/Km g/Km
Gasoline
total 2.69 194 0.35 0.008 0.006
Urban 3.59 259 0.48 0.012 0.008
extra urban 2.25 162 0.27 0.005 0.005
motorway 2.58 186 0.38 0.008 0.006
diesel
total 2.42 180 0.57 0.061 0.003
Urban 3.11 231 0.85 0.097 0.004
extra urban 2.09 155 0.46 0.043 0.002
motorway 2.41 179 0.54 0.060 0.003
lpG
total 2.48 165 0.47 0.008 0.000
Urban 3.48 232 0.62 0.010 0.000
extra urban 2.20 146 0.46 0.006 0.000
motorway 2.38 159 0.45 0.008 0.000
total
total 2.60 188 0.43 0.023 0.005
Urban 3.49 252 0.56 0.030 0.007
extra urban 2.21 160 0.33 0.014 0.004
motorway 2.50 182 0.44 0.028 0.004
the passenger car
a car’s carbon footprint cannot be based on fuel consumption alone. the production of raw material and the process of manufacturing a car have an important impact on its overall GhG emissions. when looking at the overall lifecycle of Co2e emissions26, 9% of overall
26 eea, towards a resource-efficient transport system, 2009
emissions can be allocated to manufacturing; 90% to use; and 1% to disposal.
Source : EEA
77,0%
13,0%1,0% 8,0% <1,0%
77,0%
13,0%1,0% 8,0% <1,0%
production
parts
well to tank
tank to wheel
end of life
production
GhG linked to the production of a car have been estimated by ademe27 to 5.5 tons of Co2e per ton of vehicle, or for an average-size car of 1.19 ton28, 6.6 tons of Co2e. this figure includes the production of raw material, car manufacturers’ energy consumption, car manufacturers’ sub-contractors energy consumption, but does not include maintenance29. this brings the Co2e emissions for a cars’ production to 42 g/km30.
operation
powering a car creates GhG emissions in two different
27 ademe (agence de l’environnement et de la maîtrise de l’énergie), Guide des facteurs d’émissions, 2010.
28 average weight of cars sold in 2001.
29 maintenance might actually have a very significant GhG impact, as is stressed by ademe in its Guide des facteurs d’émissions.
30 assuming a lifespan of 160.000 km. other assumptions include Co2e emissions for electricity of 0,222 tep/mwh and 389g Co2e/kwh (source Iea); and that the 1.19 ton car is composed of 119kg plastic, 83kg aluminum, 48kg glass, 595kg steel, 59kg rubber, 83kg liquids, and 202kg of other components.
ways: firstly, from the car’s tailpipe and secondly from the production of the fuel used to power the vehicle. activities associated with fuel production include feedstock extraction, feedstock transport to a processing plant, and conversion of feedstock to motor fuel, as well as the distribution of fuel, all of which produce GhG emissions.
for the passenger car, GhG emissions per passenger-kilometre strongly relate to the type of fuel and traffic conditions. 31
31 Stream (Studie naar transport emissies van alle modaliteiten), Ce delft, 2008; the figures are for the following mix of traffic conditions: 25% city; 40% out of the city; 35% highways
Source : STREAM 31
Cycle more Often 2 cool down the planet !14
Quantifying Co2 savings of cycling
www.ecf.com15
Quantifying Co2 savings of cycling
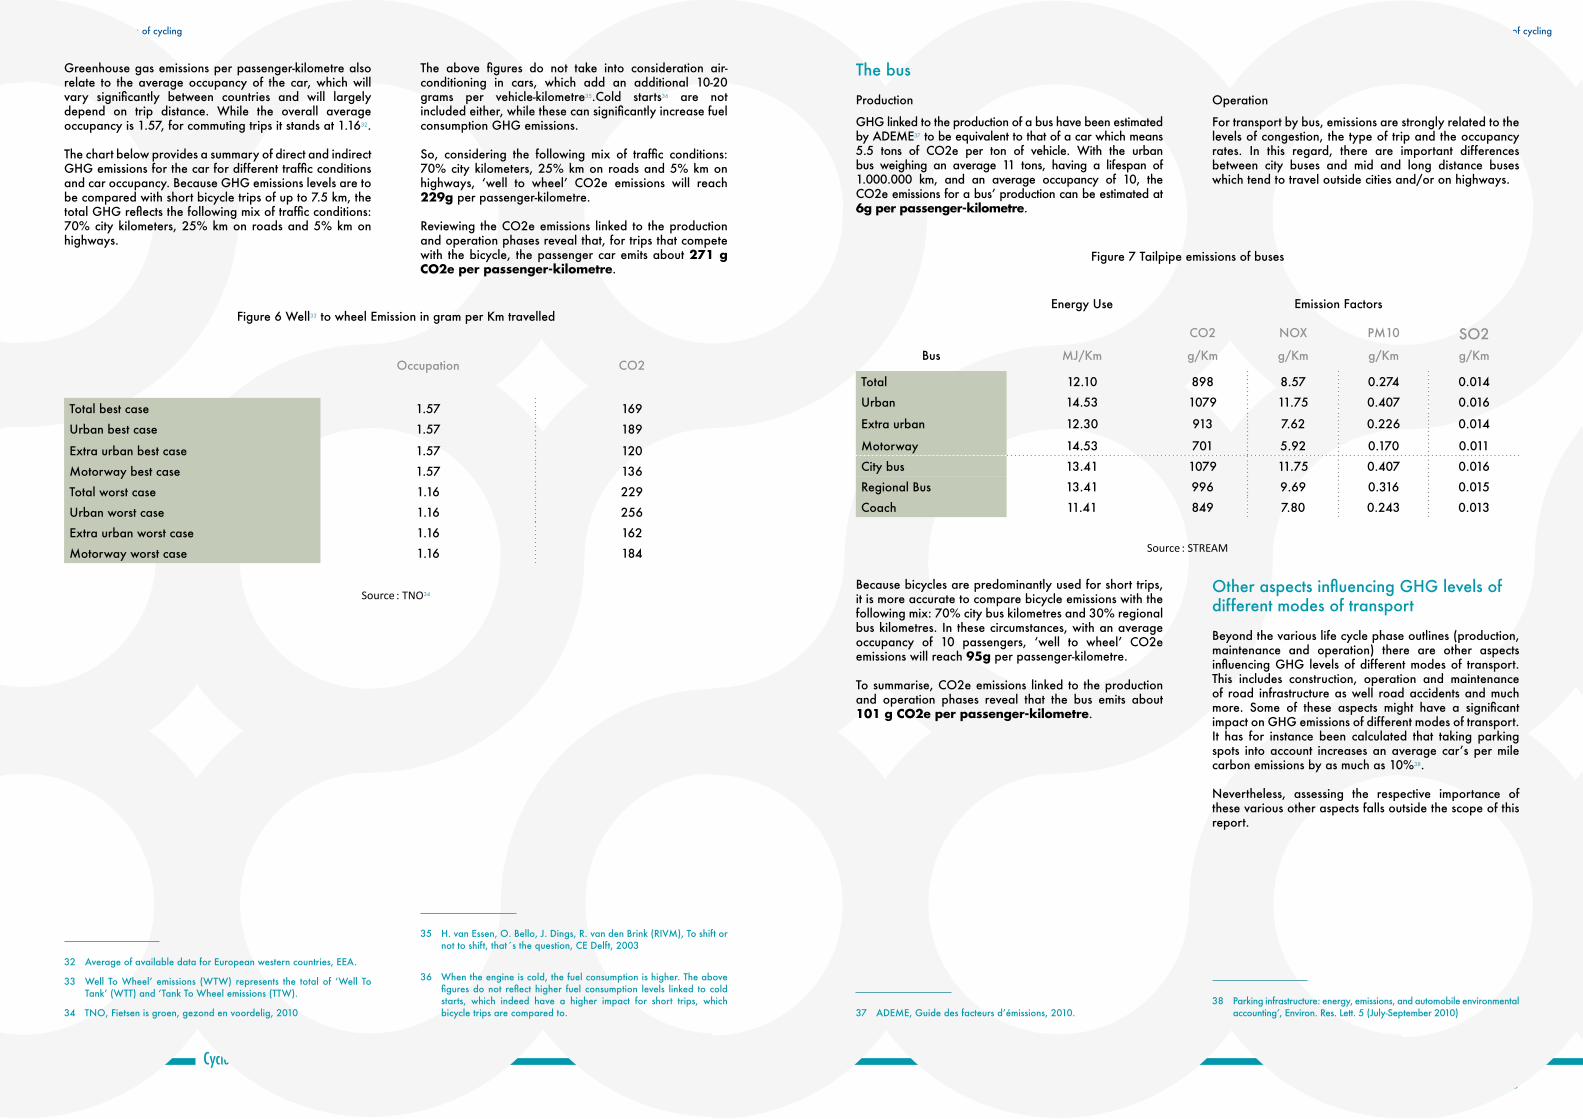
the bus
production
GhG linked to the production of a bus have been estimated by ademe37 to be equivalent to that of a car which means 5.5 tons of Co2e per ton of vehicle. with the urban bus weighing an average 11 tons, having a lifespan of 1.000.000 km, and an average occupancy of 10, the Co2e emissions for a bus’ production can be estimated at 6g per passenger-kilometre.
37 ademe, Guide des facteurs d’émissions, 2010.
operation
for transport by bus, emissions are strongly related to the levels of congestion, the type of trip and the occupancy rates. In this regard, there are important differences between city buses and mid and long distance buses which tend to travel outside cities and/or on highways.
Source : STREAM
Because bicycles are predominantly used for short trips, it is more accurate to compare bicycle emissions with the following mix: 70% city bus kilometres and 30% regional bus kilometres. In these circumstances, with an average occupancy of 10 passengers, ‘well to wheel’ Co2e emissions will reach 95g per passenger-kilometre.
to summarise, Co2e emissions linked to the production and operation phases reveal that the bus emits about 101 g CO2e per passenger-kilometre.
other aspects influencing GhG levels of different modes of transport
Beyond the various life cycle phase outlines (production, maintenance and operation) there are other aspects influencing GhG levels of different modes of transport. this includes construction, operation and maintenance of road infrastructure as well road accidents and much more. Some of these aspects might have a significant impact on GhG emissions of different modes of transport. It has for instance been calculated that taking parking spots into account increases an average car’s per mile carbon emissions by as much as 10%38.
nevertheless, assessing the respective importance of these various other aspects falls outside the scope of this report.
38 parking infrastructure: energy, emissions, and automobile environmental accounting’, environ. res. lett. 5 (July-September 2010)
figure 7 tailpipe emissions of buses
energy Use emission factors
Co2 noX pm10 So2Bus mJ/Km g/Km g/Km g/Km g/Km
total 12.10 898 8.57 0.274 0.014
Urban 14.53 1079 11.75 0.407 0.016
extra urban 12.30 913 7.62 0.226 0.014
motorway 14.53 701 5.92 0.170 0.011
City bus 13.41 1079 11.75 0.407 0.016
regional Bus 13.41 996 9.69 0.316 0.015
Coach 11.41 849 7.80 0.243 0.013
Source : TNO34
figure 6 well33 to wheel emission in gram per Km travelled
occupation Co2
total best case 1.57 169
Urban best case 1.57 189
extra urban best case 1.57 120
motorway best case 1.57 136
total worst case 1.16 229
Urban worst case 1.16 256
extra urban worst case 1.16 162
motorway worst case 1.16 184
Greenhouse gas emissions per passenger-kilometre also relate to the average occupancy of the car, which will vary significantly between countries and will largely depend on trip distance. while the overall average occupancy is 1.57, for commuting trips it stands at 1.1632.
the chart below provides a summary of direct and indirect GhG emissions for the car for different traffic conditions and car occupancy. Because GhG emissions levels are to be compared with short bicycle trips of up to 7.5 km, the total GhG reflects the following mix of traffic conditions: 70% city kilometers, 25% km on roads and 5% km on highways.33 34
32 average of available data for european western countries, eea.
33 well to wheel’ emissions (wtw) represents the total of ‘well to tank’ (wtt) and ‘tank to wheel emissions (ttw).
34 tno, fietsen is groen, gezond en voordelig, 2010
the above figures do not take into consideration air-conditioning in cars, which add an additional 10-20 grams per vehicle-kilometre35.Cold starts36 are not included either, while these can significantly increase fuel consumption GhG emissions.
So, considering the following mix of traffic conditions: 70% city kilometers, 25% km on roads and 5% km on highways, ‘well to wheel’ Co2e emissions will reach 229g per passenger-kilometre.
reviewing the Co2e emissions linked to the production and operation phases reveal that, for trips that compete with the bicycle, the passenger car emits about 271 g CO2e per passenger-kilometre.
35 h. van essen, o. Bello, J. dings, r. van den Brink (rIVm), to shift or not to shift, that´s the question, Ce delft, 2003
36 when the engine is cold, the fuel consumption is higher. the above figures do not reflect higher fuel consumption levels linked to cold starts, which indeed have a higher impact for short trips, which bicycle trips are compared to.
Quantifying Co2 savings of cycling
www.ecf.com17
Quantifying Co2 savings of cycling
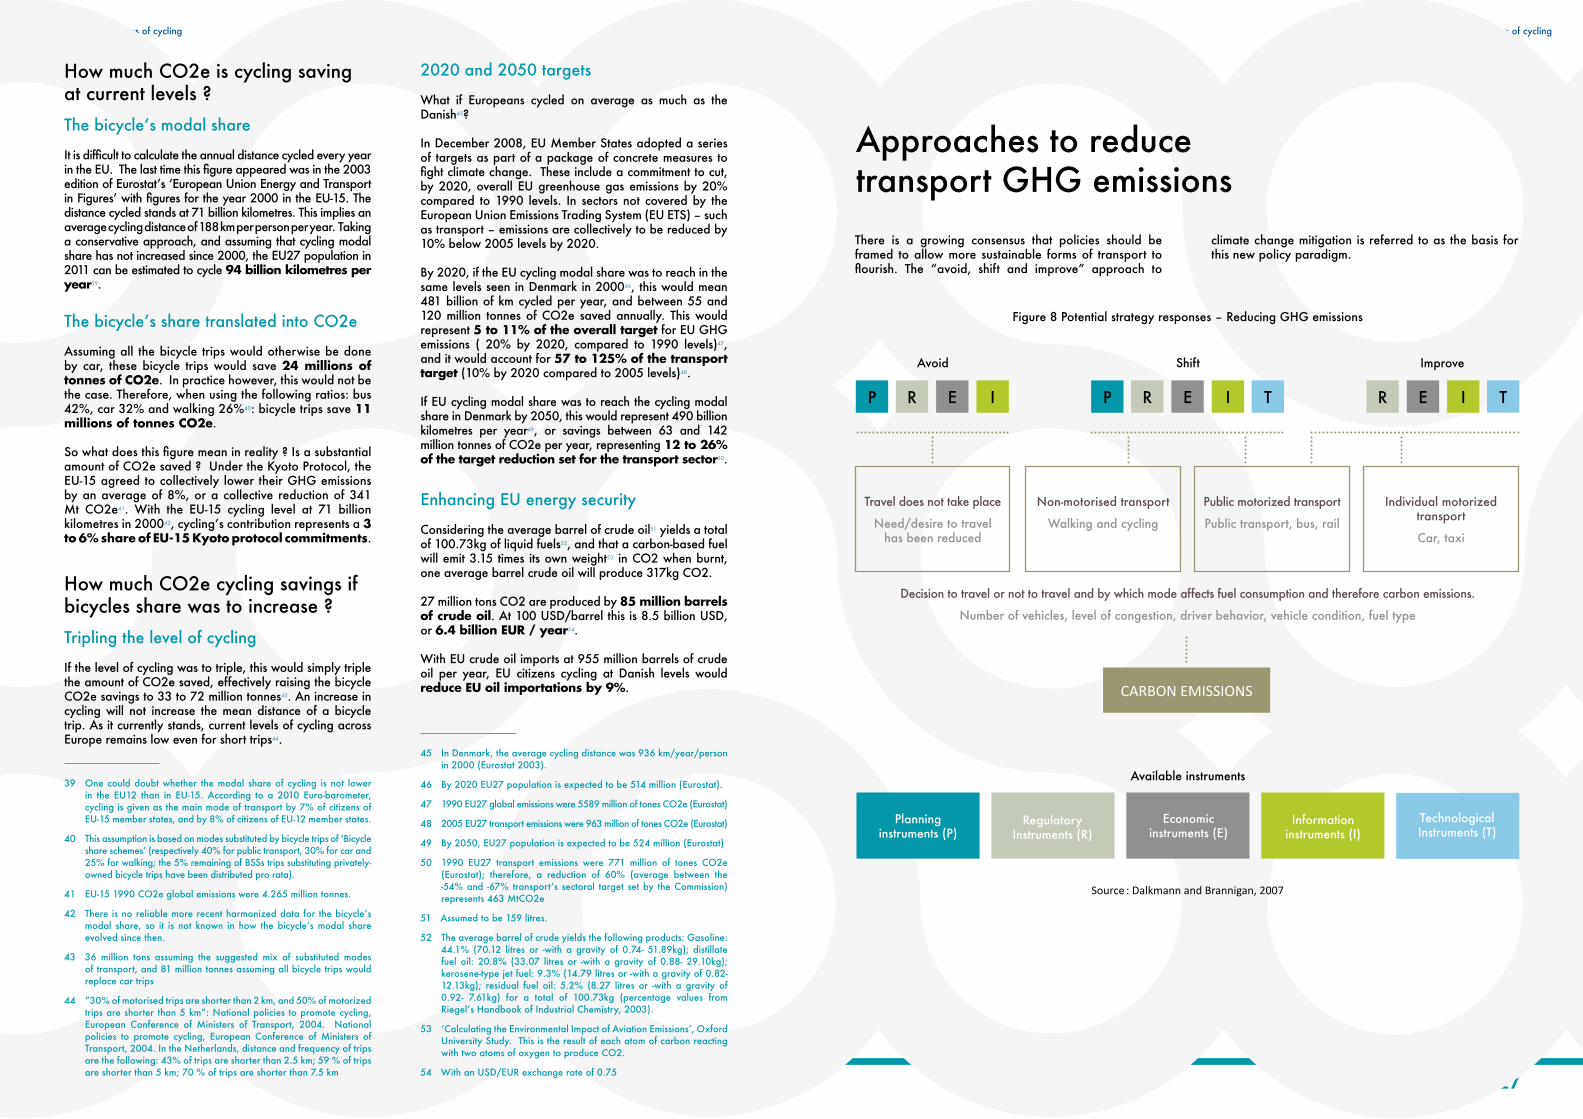
approaches to reduce transport GhG emissions
Source : Dalkmann and Brannigan, 2007
figure 8 potential strategy responses – reducing GhG emissions
avoid
travel does not take place
need/desire to travel has been reduced
ImproveShift
available instruments
non-motorised transport
walking and cycling
public motorized transport
public transport, bus, rail
Individual motorized transport
Car, taxi
decision to travel or not to travel and by which mode affects fuel consumption and therefore carbon emissions.
number of vehicles, level of congestion, driver behavior, vehicle condition, fuel type
CARBON EMiSSiONS
p pr re eI I t r e I t
planning instruments (p)
economic instruments (e)
regulatory Instruments (r)
Information instruments (I)
technological Instruments (t)
there is a growing consensus that policies should be framed to allow more sustainable forms of transport to flourish. the “avoid, shift and improve” approach to
climate change mitigation is referred to as the basis for this new policy paradigm.
how much Co2e is cycling saving at current levels ?the bicycle’s modal share
It is difficult to calculate the annual distance cycled every year in the eU. the last time this figure appeared was in the 2003 edition of eurostat’s ‘european Union energy and transport in figures’ with figures for the year 2000 in the eU-15. the distance cycled stands at 71 billion kilometres. this implies an average cycling distance of 188 km per person per year. taking a conservative approach, and assuming that cycling modal share has not increased since 2000, the eU27 population in 2011 can be estimated to cycle 94 billion kilometres peryear39.
the bicycle’s share translated into Co2e
assuming all the bicycle trips would otherwise be done by car, these bicycle trips would save 24 millions of tonnes of CO2e. In practice however, this would not be the case. therefore, when using the following ratios: bus 42%, car 32% and walking 26%40: bicycle trips save 11 millions of tonnes CO2e.
So what does this figure mean in reality ? Is a substantial amount of Co2e saved ? Under the Kyoto protocol, the eU-15 agreed to collectively lower their GhG emissions by an average of 8%, or a collective reduction of 341 mt Co2e41. with the eU-15 cycling level at 71 billion kilometres in 200042, cycling’s contribution represents a 3 to 6% share of EU-15 Kyoto protocol commitments.
how much Co2e cycling savings if bicycles share was to increase ?tripling the level of cycling
If the level of cycling was to triple, this would simply triple the amount of Co2e saved, effectively raising the bicycle Co2e savings to 33 to 72 million tonnes43. an increase in cycling will not increase the mean distance of a bicycle trip. as it currently stands, current levels of cycling across europe remains low even for short trips44.
39 one could doubt whether the modal share of cycling is not lower in the eU12 than in eU-15. according to a 2010 euro-barometer, cycling is given as the main mode of transport by 7% of citizens of eU-15 member states, and by 8% of citizens of eU-12 member states.
40 this assumption is based on modes substituted by bicycle trips of ‘Bicycle share schemes’ (respectively 40% for public transport, 30% for car and 25% for walking; the 5% remaining of BSSs trips substituting privately-owned bicycle trips have been distributed pro rata).
41 eU-15 1990 Co2e global emissions were 4.265 million tonnes.
42 there is no reliable more recent harmonized data for the bicycle’s modal share, so it is not known in how the bicycle’s modal share evolved since then.
43 36 million tons assuming the suggested mix of substituted modes of transport, and 81 million tonnes assuming all bicycle trips would replace car trips
44 “30% of motorised trips are shorter than 2 km, and 50% of motorized trips are shorter than 5 km”: national policies to promote cycling, european Conference of ministers of transport, 2004. national policies to promote cycling, european Conference of ministers of transport, 2004. In the netherlands, distance and frequency of trips are the following: 43% of trips are shorter than 2.5 km; 59 % of trips are shorter than 5 km; 70 % of trips are shorter than 7.5 km
2020 and 2050 targets
what if europeans cycled on average as much as the danish45?
In december 2008, eU member States adopted a series of targets as part of a package of concrete measures to fight climate change. these include a commitment to cut, by 2020, overall eU greenhouse gas emissions by 20% compared to 1990 levels. In sectors not covered by the european Union emissions trading System (eU etS) – such as transport – emissions are collectively to be reduced by 10% below 2005 levels by 2020.
By 2020, if the eU cycling modal share was to reach in the same levels seen in denmark in 200046, this would mean 481 billion of km cycled per year, and between 55 and 120 million tonnes of Co2e saved annually. this would represent 5 to 11% of the overall target for eU GhG emissions ( 20% by 2020, compared to 1990 levels)47, and it would account for 57 to 125% of the transport target (10% by 2020 compared to 2005 levels)48.
If eU cycling modal share was to reach the cycling modal share in denmark by 2050, this would represent 490 billion kilometres per year49, or savings between 63 and 142 million tonnes of Co2e per year, representing 12 to 26% of the target reduction set for the transport sector50.
enhancing eU energy security
Considering the average barrel of crude oil51 yields a total of 100.73kg of liquid fuels52, and that a carbon-based fuel will emit 3.15 times its own weight53 in Co2 when burnt, one average barrel crude oil will produce 317kg Co2.
27 million tons Co2 are produced by 85 million barrels of crude oil. at 100 USd/barrel this is 8.5 billion USd, or 6.4 billion EUR / year54.
with eU crude oil imports at 955 million barrels of crude oil per year, eU citizens cycling at danish levels would reduce EU oil importations by 9%.
45 In denmark, the average cycling distance was 936 km/year/person in 2000 (eurostat 2003).
46 By 2020 eU27 population is expected to be 514 million (eurostat).
47 1990 eU27 global emissions were 5589 million of tones Co2e (eurostat)
48 2005 eU27 transport emissions were 963 million of tones Co2e (eurostat)
49 By 2050, eU27 population is expected to be 524 million (eurostat)
50 1990 eU27 transport emissions were 771 million of tones Co2e (eurostat); therefore, a reduction of 60% (average between the -54% and -67% transport’s sectoral target set by the Commission) represents 463 mtCo2e
51 assumed to be 159 litres.
52 the average barrel of crude yields the following products: Gasoline: 44.1% (70.12 litres or -with a gravity of 0.74- 51.89kg); distillate fuel oil: 20.8% (33.07 litres or -with a gravity of 0.88- 29.10kg); kerosene-type jet fuel: 9.3% (14.79 litres or -with a gravity of 0.82- 12.13kg); residual fuel oil: 5.2% (8.27 litres or -with a gravity of 0.92- 7.61kg) for a total of 100.73kg (percentage values from riegel’s handbook of Industrial Chemistry, 2003).
53 ‘Calculating the environmental Impact of aviation emissions’, oxford University Study. this is the result of each atom of carbon reacting with two atoms of oxygen to produce Co2.
54 with an USd/eUr exchange rate of 0.75

Cycle more Often 2 cool down the planet !18
Quantifying Co2 savings of cycling
www.ecf.com19
Quantifying Co2 savings of cycling
even if we were to exclude the rebound effect, most if not all projections and scenarios conclude that improvements in vehicles and fuels will not be able to achieve EU-long term climate change objectives55. In other words, the eU can’t count on technology alone to meets its targets.
It has been estimated that a combination of ‘improve measures’ could allow for a 63% GhG reduction from ‘business as usual’ baseline, but compared to 1990 levels, this would only represent a 20% reduction.
there is a need for a “silver buckshot” strategy - as opposed to a “silver bullet” approach. this means that instead of relying on a number of key technologies (i.e. the silver bullet approach), transport policy should take a comprehensive and varied policy approach, pursuing both technical and non-technical options and include measures that curb demand57.this approach should be followed if the eU is serious about reaching its self-proclaimed GhG emission reduction targets. this ‘silver buckshot’ strategy includes producing incremental solutions, aggregating many small gains and securing
immediate greenhouse gas emission reductions.55 56 57
55 Iea, 2010; Skinner et al., 2010; netherlands environmental assessment agency, 2009, according to which the eU - to meet its climate change objectives – will have to reduce its overall GhG transport emissions by a factor of 12 by 2050, while for road passenger the factor would have to be somewhere between 20 and 25. parsons Brinckerhoff, Strategies for reducing the Impacts of Surface transportation on Global Climate Change: a Synthesis of policy research and State and local mitigation Strategies, 2009.
56 the different scenarios are as follows: scenario 1 : improved engine design (estimated to lead to a 9% reduction in Co2 emissions from cars in 2050); scenario 2: improved vehicle design (estimated to lead to an 8% reduction in Co2 emissions from all vehicles); scenario 3: electric cars (estimated to leads to a 35% reduction in transport Co2 emissions); scenario 4: low carbon fuels (estimated to lead to a 4% reduction in Co2 emissions from cars and 12% from hGVs and buses); scenario 5: technologies encouraging behavioural change (estimated to lead to a 9% reduction in Co2 emissions from cars and 4% from hGVs and buses)
57 It should be stressed that ‘curbing demand’ does not imply ‘curbing mobility’. what is at stake here is increasing accessibility.
avoidingavoiding or reducing trips can for instance be done through integration of land use and transport planning. avoiding or reducing trips only has a li-mited potential in the short and medium-term when it comes to reducing GhG emissions.
ShiftingShifting and maintaining trips can contribute to lower GhG in three different ways:• firstly, there might be a shift from motorised mobility
to less carbon-intensive means of transport or to non-motorised transport, like walking and cycling58;
• Secondly, the shift from private motorised mobility to a combination of public transport and bicycle, for distances deemed too long to be covered by bicycle only;
• By preventing a shift from non-motorised transport –like walking and cycling- to motorised transport59.
58 a shift from motorised transport to less carbon-intensive means of transport will obviously also result in decreased levels of GhG emissions.
59 obviously, a shift from motorised transport to more carbon-intensive means of transport would as well result in increased levels of GhG.
Source : EC
Source : EEA, ‘Towards a resource-efficient transport system ‘, 200956
Improving‘Improving’ as a strategy response for reducing GhG emissions, can be done in three different ways.
firstly, it is possible to improve the GhG intensity of the energy used. this can principally be achieved.
Secondly, the transport system as a whole can be improved upon. the focus should be on the speed of vehicles and reducing the number of vehicles driven. this can be done through improved spatial planning (ensuring that the origins and destinations of trips are as close together as possible) or by internalising the external costs of transport.
thirdly, it is possible to improve the efficiency of transport vehicles by employing both technical and operational means. this requires reducing the amount of energy used to travel given distances,
for instance by making vehicle more technically efficient. this approach also looks at reducing the amount of energy used to undertake given trips, for instance by improving the operational efficiency of vehicle use. Improving efficiency of vehicle use includes optimizing route choice, speeds, making sure the vehicle is suited for its intended use (e.g. 4wd are not suited to city) use and improving upon the utilization of the vehicle (efficient driving etc.).
the extent to which GhG efficiency can deliver savings is questionable, as there is the risk of a rebound effect. take for example the fact that new passenger cars are expected to produce 95g Co2/km by 2020 — an almost 50 per cent cut compared to 1990. yet traffic levels are growing at a faster rate than average emissions are declining. Indeed, any measures that make transport cheaper run the risk of generating additional travel.
0,8
0,9
1,0
1,1
1,2
1,3
1,4
1,5
1990 1991 1992 1993 1994 1995 1996 1997 1998 1999 2000 2001 2002 2003 2004
2005 2006 2007
0
20
40
60
80
100
120
140
160
2050 2040 2030 2020 2025 2010 2000 1999
Figure 10 Effect of a combination of ʻimproveʼ measures
Stock of cars total car Km travelled total fuel consumption of private car
Specific fuel consumption of average car (litres/Km)
Quantifying Co2 savings of cycling
www.ecf.com21
Quantifying Co2 savings of cycling
Source : EEA, Towards a resource-efficient transport system, 200963
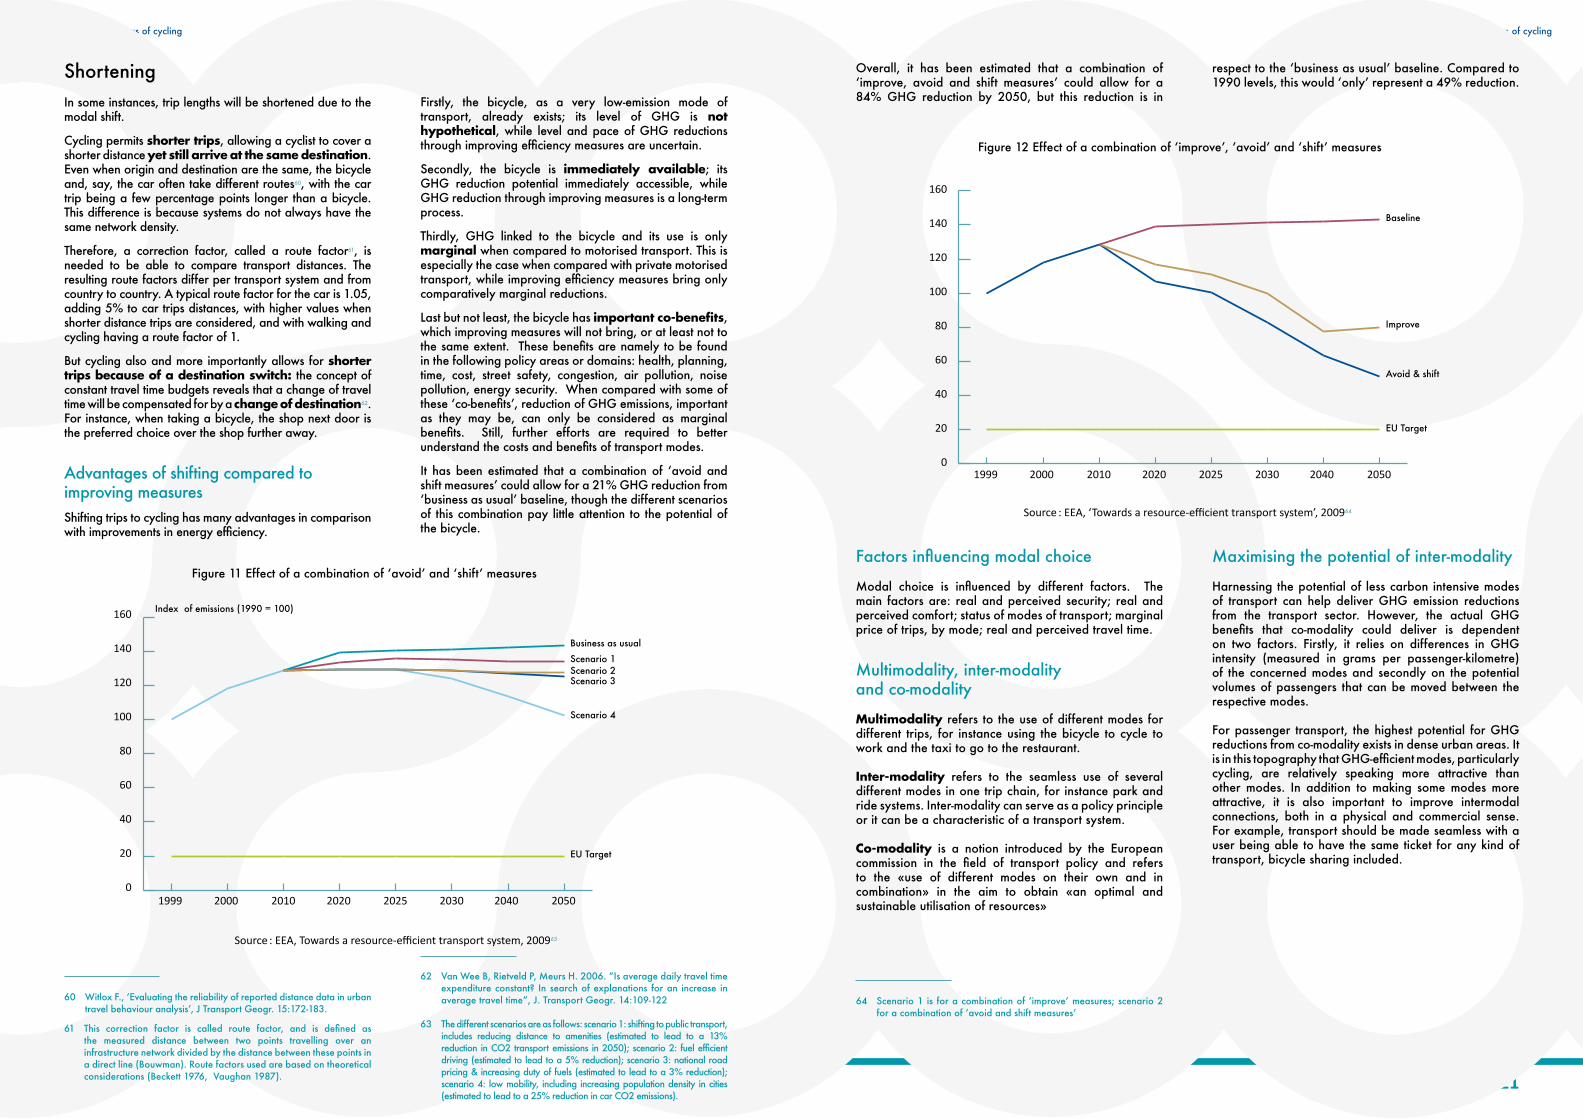
overall, it has been estimated that a combination of ‘improve, avoid and shift measures’ could allow for a 84% GhG reduction by 2050, but this reduction is in
respect to the ‘business as usual’ baseline. Compared to 1990 levels, this would ‘only’ represent a 49% reduction.
ShorteningIn some instances, trip lengths will be shortened due to the modal shift.
Cycling permits shorter trips, allowing a cyclist to cover a shorter distance yet still arrive at the same destination. even when origin and destination are the same, the bicycle and, say, the car often take different routes60, with the car trip being a few percentage points longer than a bicycle. this difference is because systems do not always have the same network density.
therefore, a correction factor, called a route factor61, is needed to be able to compare transport distances. the resulting route factors differ per transport system and from country to country. a typical route factor for the car is 1.05, adding 5% to car trips distances, with higher values when shorter distance trips are considered, and with walking and cycling having a route factor of 1.
But cycling also and more importantly allows for shorter trips because of a destination switch: the concept of constant travel time budgets reveals that a change of travel time will be compensated for by a change of destination62. for instance, when taking a bicycle, the shop next door is the preferred choice over the shop further away.
advantages of shifting compared to improving measuresShifting trips to cycling has many advantages in comparison with improvements in energy efficiency.
60 witlox f., ‘evaluating the reliability of reported distance data in urban travel behaviour analysis’, J transport Geogr. 15:172-183.
61 this correction factor is called route factor, and is defined as the measured distance between two points travelling over an infrastructure network divided by the distance between these points in a direct line (Bouwman). route factors used are based on theoretical considerations (Beckett 1976, Vaughan 1987).
firstly, the bicycle, as a very low-emission mode of transport, already exists; its level of GhG is not hypothetical, while level and pace of GhG reductions through improving efficiency measures are uncertain.
Secondly, the bicycle is immediately available; its GhG reduction potential immediately accessible, while GhG reduction through improving measures is a long-term process.
thirdly, GhG linked to the bicycle and its use is only marginal when compared to motorised transport. this is especially the case when compared with private motorised transport, while improving efficiency measures bring only comparatively marginal reductions.
last but not least, the bicycle has important co-benefits, which improving measures will not bring, or at least not to the same extent. these benefits are namely to be found in the following policy areas or domains: health, planning, time, cost, street safety, congestion, air pollution, noise pollution, energy security. when compared with some of these ‘co-benefits’, reduction of GhG emissions, important as they may be, can only be considered as marginal benefits. Still, further efforts are required to better understand the costs and benefits of transport modes.
It has been estimated that a combination of ‘avoid and shift measures’ could allow for a 21% GhG reduction from ‘business as usual’ baseline, though the different scenarios of this combination pay little attention to the potential of the bicycle.63
62 Van wee B, rietveld p, meurs h. 2006. “Is average daily travel time expenditure constant? In search of explanations for an increase in average travel time”, J. transport Geogr. 14:109-122
63 the different scenarios are as follows: scenario 1: shifting to public transport, includes reducing distance to amenities (estimated to lead to a 13% reduction in Co2 transport emissions in 2050); scenario 2: fuel efficient driving (estimated to lead to a 5% reduction); scenario 3: national road pricing & increasing duty of fuels (estimated to lead to a 3% reduction); scenario 4: low mobility, including increasing population density in cities (estimated to lead to a 25% reduction in car Co2 emissions).
Source : EEA, ‘Towards a resource-efficient transport system’, 200964
factors influencing modal choice64
modal choice is influenced by different factors. the main factors are: real and perceived security; real and perceived comfort; status of modes of transport; marginal price of trips, by mode; real and perceived travel time.
multimodality, inter-modality and co-modality
Multimodality refers to the use of different modes for different trips, for instance using the bicycle to cycle to work and the taxi to go to the restaurant.
Inter-modality refers to the seamless use of several different modes in one trip chain, for instance park and ride systems. Inter-modality can serve as a policy principle or it can be a characteristic of a transport system.
Co-modality is a notion introduced by the european commission in the field of transport policy and refers to the «use of different modes on their own and in combination» in the aim to obtain «an optimal and sustainable utilisation of resources»
64 Scenario 1 is for a combination of ‘improve’ measures; scenario 2 for a combination of ‘avoid and shift measures’
maximising the potential of inter-modality
harnessing the potential of less carbon intensive modes of transport can help deliver GhG emission reductions from the transport sector. however, the actual GhG benefits that co-modality could deliver is dependent on two factors. firstly, it relies on differences in GhG intensity (measured in grams per passenger-kilometre) of the concerned modes and secondly on the potential volumes of passengers that can be moved between the respective modes.
for passenger transport, the highest potential for GhG reductions from co-modality exists in dense urban areas. It is in this topography that GhG-efficient modes, particularly cycling, are relatively speaking more attractive than other modes. In addition to making some modes more attractive, it is also important to improve intermodal connections, both in a physical and commercial sense. for example, transport should be made seamless with a user being able to have the same ticket for any kind of transport, bicycle sharing included.
0
20
40
60
80
100
120
140
160
2050 2040 2030 2020 2025 2010 2000 1999
Figure 11 Effect of a combination of ʻavoidʼ and ʻshiftʼ measures
Index of emissions (1990 = 100)
Business as usual
0
20
40
60
80
100
120
140
160
2050 2040 2030 2020 2025 2010 2000 1999
Figure 12 Effect of a combination of ʻimproveʼ, ʻavoidʼ and ʻshiftʼ measures
Baseline
Improve
Avoid & shift

Cycle more Often 2 cool down the planet !22
Quantifying Co2 savings of cycling
www.ecf.com23
Quantifying Co2 savings of cycling
Cycling and public transport
Cycling helps increase the uptake of public transport, and vice versa. this increases the potential of cycling as a means of reducing GhG. Some car drivers travelling longer distances might leave their cars for multimodal transport (cycling plus public transport). the reduction of Co2e is then not only linked to more cycling, but also to a higher use of public transport. when combined with mass transport, the potential of the bicycle is no longer limited to short trips.
Cycling can contribute to a better performance of public transport. as cycling is 3 to 4 times faster than walking, the number of public transport ‘stops’ available within reach thus becomes 9 to 16 times larger. It is therefore sound policy to build an integrated “cycling and public transport” system. Such an integrated transport system would optimise both the public transport route network and the -more local- cycling route networks. the latter should be optimally connected to the important public transport stations -or public transport ‘stops’-, and should feature proper services, like bicycle parking facilities65.
Bicycle share schemeswhat is the potential of bicycle share schemes (BSSs) in
65 Godefrooij t., Kirkels m., frieling I., the potential of cycling for sustainable accessibility
reducing GhG emissions ? do BSSs only increase demand for travel or do they induce modal shift ? and if they induce modal shift, what kind modal shift do they bring about ? what are the key steps required to shift trips away from the most/more carbon intensive modes of transport ?
a study from the oBIS project66 outlined the extent to which BSSs were able to shift trips. It found that BSSs were a substitute for motorised private transport between 4% (Berlin) to 77% (Senigallia, Italy) of the time, and public transport 8% (Barcelona) to 58% (Stockholm) of cases. In total, BSSs were a substitute for motorised transport for 52% (in rimini) to 77% of users (in milano).
for privately-owned bicycles, the substitution rate is found to be between 2% (rennes, france) to 22% (Bari, Italy), with most cities falling into the 5-10% range. for walking, the substitution rate spans from 10% (in milano) to 42% (in parma). when substituting cycling and walking for these trips, which together account for a 21% (Senigallia, Italy) to 48% (rimini, Italy) shift, the contribution of BSSs in lowering GhG emissions is zero.
finally, BSSs trips account for new trips 0% to 44% of the time, with most cities noting figures from 5 to 20%. for this share of trips, the impact of BSSs on GhG emissions is actually negative as BSSs increase demand for travel.
66 oBIS, optimising Bike Sharing in european Cities, is an eU funded project that “will improve the role and the opportunities of bike sharing as a valuable instrument to foster clean and energy efficient sustainable modes of mobility in urban areas”. www.obisproject.com
Source : OBiS project
the main factors which explain such a disparity in data include the existence of a public transport network, the density of BSSs stations, the congestion level and the size of the city in question. with the given data, it is not possible to accurately uncover which measures would increase substitution rates away from more carbon intensive modes of transport.
In terms of GhG emissions, BSSs presents certain disadvantages when matched up to private bicycles. most BSSs use trucks to move their bicycles through the system and the bicycles also require docking stations. although the emissions linked to these systems are most
likely outweighed by the benefits (i.e. a reduction in use of motorised transport), they should still be factored into to any GhG emission impact assessment.
It should also be remembered that BSSs can replace car trips of greater distances, as people are likely to travel further when combining bike sharing with other forms of transport. also, shared bicycles seem to act as catalysts for more cycling in general. In lyon, the use of bicycles increased by 44 per cent within the first year of the Velo’v operations67 and in paris there was a 70 per cent increase after the launch of Vélib’68.
67 Bührmann, 2007
68 Shaheen, S., Guzman S. and Zhang h. (2010). Bike-sharing in europe, the americas, an asia: past, present, and future. washington d.C.: transportation research Board annual meeting
69 “methodology for determining GhG emission reductions trough Bicycle Sharing projects”, Voluntary carbon standard, VCS, 2010.
Source : Quay Communications inc. 2008.
finally, beyond its impact on GhG emissions, this individual public mode of transport has the same co-benefits of ordinary bicycles and namely helps increase physical activity, reduce air and noise pollution and traffic congestion.
within the ‘Voluntary carbon market’ a methodology is currently under development for “determining GhG
emission reductions through Bicycle Sharing projects”69. once adopted, this methodology will allow for valuation of GhG emissions saved by bicycle sharing projects and ultimately favour their expansion.
figure 13 transport modes substituted by BSSs
>500,000 >100,000 <100,000
City provided with BSS
Barcelona - e
lyon - f
milano- I
Stockholm - Se
rennes - fr
Bari - I
rimini - I
parma - I
Brescia - I
Cuneo - I
Bolzano - I
Senigallia- I
% of Users who substitute other transport modes with BSS
na 98.00 71.05 100.00 83.00 80.77 71.43 92.31 67.86 90.00 70.00 56.25
transport mode substituted by BSS (%)
motorized private transport
65.77 10.00 29.03 5.15 19.00 28.04 36.36 20.83 12.50 44.44 23.82 79.22
public transport 7.79 46.00 48.39 58.06 46.00 27.26 15.15 33.33 50.00 16.67 35.72 0.00
own Bike 5.12 6.00 12.90 9.71 2.00 21.98 15.15 4.17 20.83 11.11 4.73 4.13
walking 21.22 38.00 9.68 26.62 33.00 22.71 33.33 41.67 16.67 27.78 35.72 16.65
motorised transport 73.56 56.00 77.42 63.21 65.00 55.30 51.52 54.17 62.50 61.11 59.54 79.22
non motorised transport 26.34 44.00 22.58 36.33 35.00 44.70 48.48 45.83 37.50 38.89 40.46 20.78
short
middle
high
low middle high
Trip Length
Private Vehicle
Private Bike
Transit Taxi
Bike-Share
RedestrianTrip Cost

Cycle more Often 2 cool down the planet !24
Quantifying Co2 savings of cycling
www.ecf.com25
Quantifying Co2 savings of cycling
Source : TNO, 2008
Source : TNO, 2008
furthermore, the average pedelec commuting distance is 56% higher (9,6 km) than for commuters using a normal bicycle (6,3 km), suggesting that pedelecs allow for 56% longer daily commutes.
the use of a pedelec also influences the use of other modes of transport. pedelecs most often are a substitute for the bicycle (45%) or the car (39%).
for commuters, substituted modes of transport are almost on par, with 39% of pedelec trips replacing bicycle trips and 41% replacing car trips. It is obvious that in countries with lower cycling modal shares pedelecs would be more likely to replace motorized transport.
Cost effectiveness of transport GhG reduction policiesCost effectiveness is a key consideration in the design of policies for GhG reduction. resources are ideally focused on measures where the marginal costs of GhG reduction are lowest. In this context, marginal abatement cost curves (maCCs) are often used to rank various policy or technology
interventions in terms of their costs in abating one ton of Co2e. existing work on maCCs have labelled transport as an “expensive” sector for mitigation actions to take place71.
however there is a consensus amongst ‘transport and climate professionals’72 that this is a result of interventions in the transport sector being assumed to be limited to expensive, technological options, for example to electric vehicles, and that current maCCs are not reflective of the wide range of policy interventions that would allow significant GhG reductions in this sector to occur. In particular, there is consensus that current maCCs are not reflective of GhG reductions associated with inducing behavioural changes such as reduction in the number and distance of trips or shifts in modes of transport.
71 a cost curve for greenhouse gas reduction, mcKinsey, 2009
72 Bellagio declaration on transport and Climate Change, 2009
pedelecs
to what extent can the pedelec help reduce GhG emissions ? do pedelecs increase demand for travel or do they induce modal shift ? and if they do induce modal shift, what kind of modal shift ? what are the key steps required to induce modal shift from the most carbon intensive modes of transport ?
pedelecs can affect the way people move around cities, the distance they cover with their bicycle and their use of other modes of transport, like normal bicycles and private passenger cars. pedelecs are especially appealing to people who would otherwise not cycle without power assistance.
according to a dutch study70, on a weekly basis pedelecs cover, for all purposes, on average 22% more kilometres than normal bicycles. For commuters, this difference extends to 75%. the reason for that might be that a majority of commuters (51%) started to commute by bicycle more often since they bought a pedelec.
70 tno, elektrisch fietsen, marktonderzoek en verkenning toekomstmogelijkheden, 2008
0
10
20
30
40
50
65 and over commuters Other Total
0 20 40 60 80 100
City bike racing & mountain bike pedelec
foot Car Bike Scooter motorbike public transport taxi other

Cycle more Often 2 cool down the planet !26
Quantifying Co2 savings of cycling
www.ecf.com27
Quantifying Co2 savings of cycling
each bicycle trip is a potential motorised trip, and therefore has an intrinsic value in terms of avoided Co2 emissions. thus, increasing bicycle traffic not only has clear mobility and environmental arguments in its favour, but also a clear-cut economic case.
Globally speaking, how does the bicycle fare vis-à-vis the current trend of capitalizing Co2 emission reductions through carbon finance ?
on a global level, the transport sector accounts for around a quarter of carbon dioxide emissions76, and global transport energy-related Co2 emissions are projected to increase by 1.7% a year, up to 203077. the increase in Co2 emissions is primarily caused by the growth in the global urban population and increased motorization of the global urban population. this trend is more pronounced in emerging economies (with projected transport GhG growth of 2.8% a year73) meaning that the abatement of road transport emissions in these countries requires extra attention.
Under the Kyoto protocol to the UnfCCC78, the countries listed in its annex 179 committed to reducing their collective emissions of GhG by 5.2%80 by 2008-2012, compared to 1990 levels.
the Kyoto protocol defines flexible cost-effective mechanisms that allow annex 1 countries to meet their GhG commitments by purchasing emission reduction credits: the Clean development mechanism81 (Cdm) with Cdm compliant projects generating Certified emissions reductions (Cers), the Joint Implementation (JI) with JI compliant projects generating emissions reduction Units (erUs)82 and International emissions trading (Iet)83 76 International energy agency (Iea), ‘emissions from Combustion’, 2005
77 Iea, world energy outlook 2006
78 United nations framework Convention on Climate Change United nations framework Convention on Climate Change having as ultimate objective to achieve “stabilization of greenhouse gas concentrations in the atmosphere at a level that would prevent dangerous anthropogenic interference with the climate system.»
79 annex 1 countries are the industrialised countries that were members of the oeCd in 1992, plus countries with economies in transition.
80 the limitations differ by country and range between 0% and 8%.
81 Clean development mechanism
82 Joint Implementation (JI)
83 emissions trading
allowing those carbon credits to be sold on international markets84.
non annex 1 countries don’t have any binding commitments in terms of emission reduction but have a financial incentive to establish projects which reduce emissions in order to create carbon credits which can be sold on the international markets.
projects that consolidate or increase the size of the Co2 sink of bicycle traffic could namely be facilitated by the Cdm, nationally appropriate mitigation actions (namas) or the voluntary carbon market (VCm).
So far, the Cdm has not worked to catalyse mitigation actions in transport. as of may 2011 only 0.6% of Cdm project activities are transport projects, and of the projects registered only 0.2% take place in the transport sector. this limited application of transport projects under the current Cdm is in large part due to difficulties in methodology85 and finance86.
namas are voluntary emission reduction measures by developing countries that are directly reported to the UnfCCC. namas are not limited by sector and can include any local, regional and national policies and measures that will reduce GhG emissions from business as usual scenario. these are increasingly being seen as the framework under which non annex 1 countries are to mitigate their GhG and to receive international support for their efforts.
for the further development of cycling as a sustainable mode of transportation, the empowerment of bicycle stakeholders is necessary. this empowerment is stimulated when the economic benefits of bicycle projects can be monetised within a solid evaluation framework. monetising the Co2 sink of bicycle traffic strengthens the political argument towards implementation of bicycle projects because the benefits of bicycling become clearer.
84 a well-known emission trading scheme is the eU emissions trading Scheme (eU etS).
85 difficulties in methodology include setting baselines, lack of recognition of co-benefits and proving additionality of GhG emissions, compared to the business as usual scenario.
86 difficulties in finance include volatile carbon price, low cost effectiveness of mechanism, revenues representing a small proportion of total project costs.
Shifting and rebound effect maximising modal shift or inter-modality has the potential to reduce GhG emissions if the reductions are “locked in”. In other words, if more people opt for cycling, this would lead to reduced congestion. this may however lead to more motorized trips to be taken, as motorized transport becomes more attractive with fewer cars on the road. effectively, investment in modal shift could lead to increased capacity, more travel and therefore more GhG emissions. Stimulating inter-modality or modal shift is not on its own a sufficient condition for delivering GHG reductions.
rebound effects have actually the potential to undermine the GhG reduction potential of many policy instruments. any option that potentially makes transport cheaper could stimulate travel and thereby undermine potential reductions in GhG. for instance, improved fuel efficiency leads to reduced travel costs that in turn can encourage further growth in traffic unless countered by pricing mechanisms73.
73 Barker, t. dagoumas, a. & rubin. J (2009), ‘the macroeconomic rebound effect and the world economy energy efficiency’ (2009) 2:411–427.
In order to avoid such rebound effects, complementary policy instruments to constrain demand would have to be enacted. this would reduce and ideally eliminate any rebound effects, ensuring that the potential GhG reductions are delivered in practice.
Policy options to limit the rebound effect include road pricing74 which would ensure that road users pay for the negative externalities - including emissions and congestion impacts - of their behaviour encouraging them to use the road network more efficiently. non-price levers around network use - like dedicated bicycle lanes or parking policies - could also discourage increased car travel75.
74 prices varying by time of day and location
75 ‘Building a low-carbon economy - the UK’s innovation challenge’, Committee on Climate change, 2010
Cycling and carbon finance
28
Quantifying Co2 savings of cycling
Cycle more Often 2 cool down the planet !
members
austria arGUS ļ IG- fahrrad
Belgium fietsersbond vzw ļ GraCQ asbl ļ pro Vélo asbl ļtoerisme Vlaanderen ļ the european federation for transport and environment
Bosnia Green tour & herzegovina
Bulgaria Bulgarian Cyclists’ association
Canada Vélo Québec
Croatia Udruga BICIKl
Cyprus Cyprus tourism organisation ļ podilatokinisi Club
Czech republic Cyklo Klub Kučera Znoijmo ļ nadace partnerstvi
denmark dCf dansk Cyklist forbund ļ forenigingen frie fugle ļCopenhagenize consulting
estonia Vänta aga
finland helsingin polkupyöräilijät ļ network of finish Cycling municipalities
france fUB ļ af3V ļ départements & régions cyclables
Germany adfC eV
Greece filoi tou podèlatou
hungary magyar Kerékpáros- KlubCycling hungary alliance
Iceland lhm, landssamtök hjólreidamanna
Ireland dublin Cycling Campaign
Israel Israel Bicycle association
Italy fIaB federazione Italiana amici della Bicicletta
latvia latvijas velo informacijas centrs
lithuania lithuanian Cyclists' Community
luxembourg lVI, letzebuerger Velos-Initiativ
netherlands fietsersbond ļ I-Ce Interface for Cycling expertiseStichting landelijk fietsplatform ļ fIS, fietskaart ļ Informatie Stichting
norway Slf Syklistenes landsforening
poland polish environmental partnership foundation (epCe) ļpomeranian association Common europe (pSwe) ļVelopoland foundation
portugal fpCUB ļ mUBI - associação pela mobilidade Urbana em Bicicleta
romania federatia Biciclistilor din romania
russia russian Cycle touring Club ļ Bicycle transportation Union
Serbia yugo Cycling Campaign
Slovakia Slovenský Cykloklub ļ ekopolis foundation
Slovenia Slovenska Kolesarska mreza
Spain Coordinadora Catalana d’Usuaris de la Bicicleta ļaeVV – eGwa european Greenways association ļa Contramano
Sweden Cykelfrämjandet,
Switzerland pro Velo Schweiz ļ Verkehrs-Club der Schweiz VCS
turkey Bisikletliler dernegi
Ukraine Kyiv Cyclists’ association
UK CtC Cyclists’ touring Club ļ CCn Cycle Campaign networkSustrans national Cycle network Centre
USa one Street ļ alliance for Biking and walking
for further information about eCf projects and activities please [email protected] - www.ecf.com
Board
preSIdent manfred neun/adfC
Germany
treaSUrer Jens loft rasmussen/dCf
denmark
VICe-preSIdentS dr Kathi diethelm/pro Velo Switzerland
Switzerland
Kevin mayne/CtC UK
frans van Schoot/fietsersbond
the netherlands
doretta Vicini/fIaB Italy
morten Kerr/Syklistenes landsforening
norway
piotr Kuropatwinski/pSwe poland
Staff
dr Bernhard ensink Secretary General
mr fabian Küster policy officer
dr randy rzewnicki project manager
dr florinda Boschetti project manager
ms Chloé mispelon Communicationsofficer
ms winifred Van wonterghem
office manager & executive assistant
mr raimund Stabauer Velo-city series assistant
& event manager
mr adam Bodor (from 01/01 onward)
eurovelo manager
mr Julian ferguson (from 15/03 onward)
Communicationsofficer
mr martti tulenheimo (from 27/04 onward)
policy officer
mr Ceri woolsgrove (from 16/05 onward)
policy officer road Safety and technical
Issues
mr Benoît Blonder (from 02/05 onwards)
policy officer health and environment
mr ed lancaster (from 16/05 onwards)
policy officerCycling tourism
ms Isabelle Goovaerts (from 01/10 onward)
assistant officer
mission Statement
founded in 1983, the european Cyclists’ federation (eCf) is the umbrella federation of the national cyclists’ associations in europe, reinforced by similar organisations from other parts of the world. on behalf of our members, we are pledged to ensure that bicycle use achieves its fullest potential so as to bring about sustainable mobility and public well-being. to achieve these aims, the eCf seeks to change attitudes, policies and budget allocations at the european level. eCf stimulates and organises the exchange of information and expertise on bicycle related transport policies and strategies as well as the work of the cyclists’ movement.
www.ecf.com