ebo overview part 2 ingrid bongers mt(ascp) mba eclinicalworks certified trainer
TRANSCRIPT
eBO Overview Part 2
Ingrid Bongers MT(ASCP) MBAeClinicalWorks Certified Trainer

Canned Reports
• Day Sheet 11.01– Default date is current date but may use Custom
to change– Ctrl+click can be used to select multiples– % is the wild card (if you only enter % you get a list
of all)– If no users are selected the report pulls all users
Canned Reports
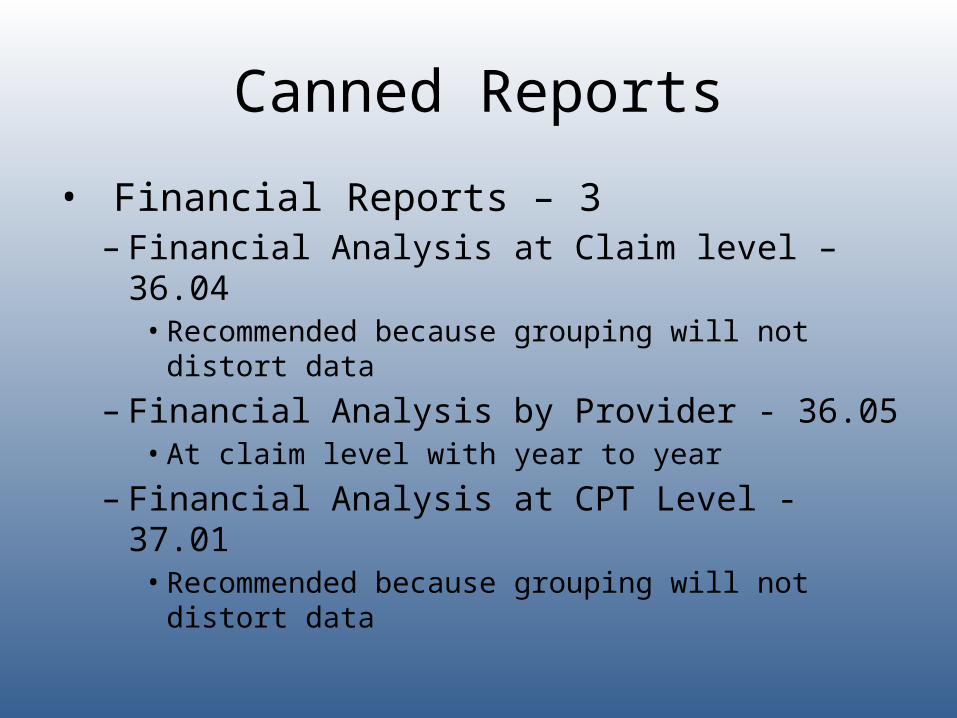
• Financial Reports – 3– Financial Analysis at Claim level – 36.04• Recommended because grouping will not distort data
– Financial Analysis by Provider - 36.05• At claim level with year to year
– Financial Analysis at CPT Level - 37.01• Recommended because grouping will not distort data

Canned Reports
Very Important
CPT and ICD-9 groups for Registry will affect eBO
• Select canned reports that disregard groups• Use ‘without group’ Metadata when creating new
reports

Canned Reports
• Financial Reports – 3 (cont’d)– Financial Analysis at CPT level (No group & No Resource
Provider)• Administrative Reports – 4 – Productivity – 40.06
• Has time tracking
– Population Reports – 41• Active Patient Info – 41.01
– Looks at encounter ID (appointments or Telephone Encounters)
• New Patient Report – 41.07– Looks at the New Patient check box in appointment window
– Zip Code Analysis by Appointment - 41.12

Improving Usability of Reports• Copy a canned report and paste in desired folder (we recommend using the
Custom Reports folder)• Click Properties icon
– General tab• Rename• Relocate to another folder
– Report View tab• Check the ‘Override the default values’ box
– Select alternate format (such as PDF)
• Click ‘Set’ under PDF options– Change paper size or orientation– Can add a password requirement to open the report
• Click ‘Set’ under Prompt values– Can set defaults– Can uncheck the ‘prompt for values’ box so the defaults can’t be changed when running the report
– Permissions • Add security
Exercise
• Set your personal settings and home page• Customize a canned report• Copy and save to ‘My Folders’• Rename the report and create a screen tip• Customize the report view
• Change the output format• Change the defaults
• Run your new report

Query Studio - Glossary
Name Space EMR ReportingFinancial ReportingData Dictionary
– Can’t combine elements from different name spaces in Query Studio
CategoryPatient NamePatient Account
– Subjects– Sometimes there are subcategories

Query Studio - Glossary
Data Item (subject)Subjects
Measure value almost always a number
Date / Time
– If you right click on an item and select ‘information’ it will tell you about the data type
Query Studio - Glossary
• Patient count – is unique patients• Visit count – is encounters (one patient may be in
more than one time)• Delete flag = 0 means show only those that have
not been deleted• IDs are assigned by the system in the background
and are used in Report Studio to join queries

Query Studio - Glossary
• Units count – within a CPT, like for injections• CPT count – the number of times a CPT code was
used• Data Dictionary – lists, no reporting value• Recommended Categories for Financial Reporting• Claim Transaction• CPT Level (without Group)• Always use Aging for all A/R reports

Query Studio
• Launch Query Studio • Select the package• Currently using v5
• The Insert Data window opens• Select a Name Space

Query Studio
• Click on the + to expand the tree fully
• Drag and drop the desired items intothe window and watch the report build

Query Studio Exercise
• Create a simple query • EMR Reporting Name Space
• Facility Group• Facility• Providers• Visit Count
• Click on Title and change the name to Visit Count Report
• Save to My Folders

Query Studio
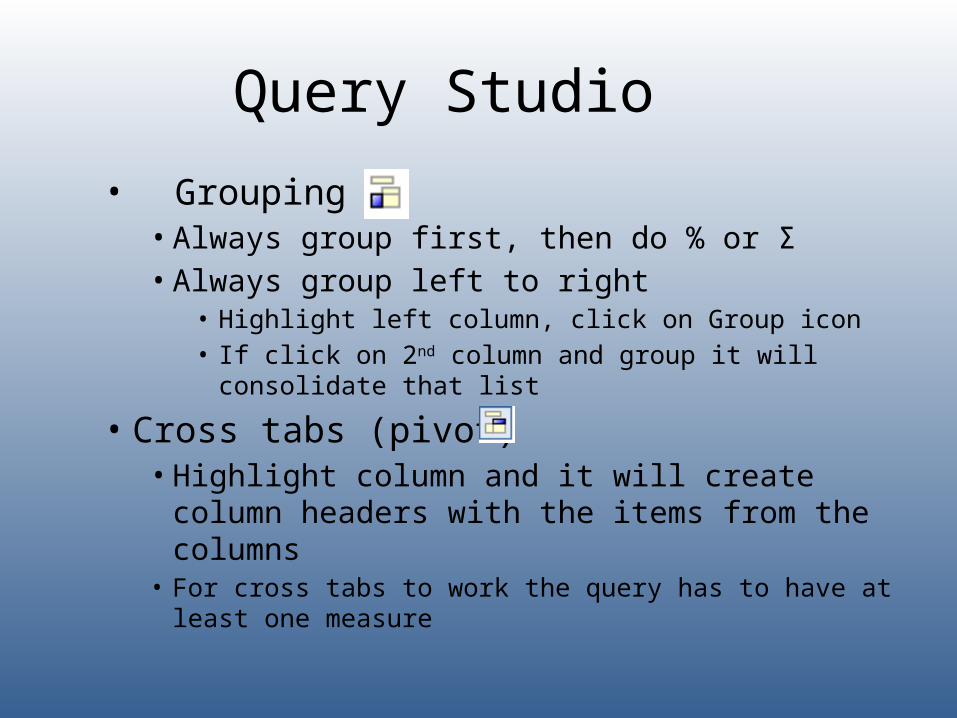
• Grouping• Always group first, then do % or Σ• Always group left to right
• Highlight left column, click on Group icon• If click on 2nd column and group it will consolidate that list
• Cross tabs (pivot)• Highlight column and it will create column headers with
the items from the columns• For cross tabs to work the query has to have at least one measure
Query Studio
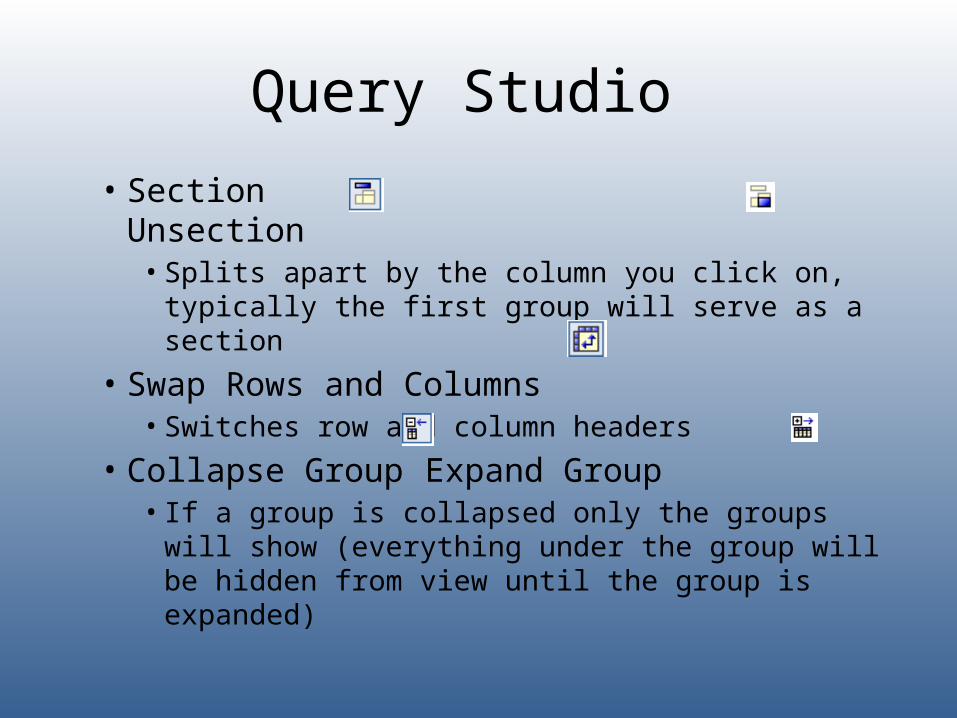
• Section Unsection• Splits apart by the column you click on, typically the
first group will serve as a section
• Swap Rows and Columns• Switches row and column headers
• Collapse Group Expand Group• If a group is collapsed only the groups will show
(everything under the group will be hidden from view until the group is expanded)

Query Studio Exercise
• Open the Visit Count query you created earlier• Create a Group• Create a Cross Tab• Add Sections

Query Studio Exercise
• Un-section the report• Swap the Rows and Columns • And collapse the Group• Edit Data

Rows and Columns Switched

Groups Collapsed

707 SW Washington Street Suite 1200 • Portland OR 97205 • Phone 503.943.2500 • Fax: 503.943.2501 Email: [email protected] • www.ochin.org
Contact Information
OCHIN Practice Services• 877.263.6780• [email protected]
Ingrid Bongers • 877.263.6781• [email protected]