early and delayed assessments of quantitative gait
TRANSCRIPT
Ishikawa et al. Fluids Barriers CNS (2016) 13:20 DOI 10.1186/s12987-016-0044-z
RESEARCH
Early and delayed assessments of quantitative gait measures to improve the tap test as a predictor of shunt effectiveness in idiopathic normal pressure hydrocephalusMasatsune Ishikawa1,2* , Shigeki Yamada2,3 and Kazuo Yamamoto3
Abstract
Background: To improve the diagnostic performance of the cerebrospinal fluid (CSF) tap test (TT), early and delayed assessments of gait were performed after the removal of 30 ml of CSF in patients with probable idiopathic normal pressure hydrocephalus. Assessments of gait included the 3-m timed up and go test (TUG), and the 10-m walk in time (10Ti) and in step (10St) tests.
Methods: Quantitative data for the TUG, the 10Ti, and the 10St were obtained before CSF removal and on days 1 and 4 after removal of 30 ml CSF. CSF shunt surgery was performed in 61 patients within one month after the TT. The gait outcome was assessed 3 months after surgery. The area under the curve (AUC), sensitivity, specificity, and cutoff values were computed for the TUG, the 10Ti, and the 10St on day 1 and day 4 using receiver operating characteristic (ROC) curve analysis.
Results: The positive response rate in three measures on day 4 was equal to or higher than the values on day 1. Times were reduced significantly in the TUG and the 10mTi tests between baseline and both days 1 and 4 after TT. No significant differences were noted in the number of steps for the 10St test. The percent change in TUG on day 1 had the highest AUC value among all other variables (0.808). Although this was not statistically different from other variables in the TUG and the 10Ti, it had a good balance of high sensitivity (78.3%) and high specificity (80.0%), with a cutoff value of 11.3%. The change in the measured value in the day 1 TUG had the second highest AUC value at 0.770. The variables on day 4 tended to have high specificities of around 90%, although their sensitivities were low.
Conclusions: The percent change of TUG on day 1 showed the highest diagnostic accuracy. Delayed assessments on day 4 were not superior to those on day 1. Thus, the TUG on day 1 is useful as a simple quantitative measure for predicting shunt effectiveness.
Keywords: Hydrocephalus, Aged population, Tap test, Gait disturbance
© The Author(s) 2016. This article is distributed under the terms of the Creative Commons Attribution 4.0 International License (http://creativecommons.org/licenses/by/4.0/), which permits unrestricted use, distribution, and reproduction in any medium, provided you give appropriate credit to the original author(s) and the source, provide a link to the Creative Commons license, and indicate if changes were made. The Creative Commons Public Domain Dedication waiver (http://creativecommons.org/publicdomain/zero/1.0/) applies to the data made available in this article, unless otherwise stated.
BackgroundIdiopathic normal pressure hydrocephalus (iNPH) is a disorder resulting in abnormal gait, cognition, and urina-tion in the aged population [1, 2]. CSF shunt surgery is effective in improving the symptoms of iNPH, especially
those concerning gait [2]. The cerebrospinal fluid (CSF) tap test (TT), which involves the removal of 30–50 ml of CSF, is useful for the diagnosis of iNPH [3]. However, its diagnostic accuracy has been reported to vary between low and high [4–8]. This may be due to inconsistencies in various factors, such as the volume of CSF removed, the timing of the assessment, qualitative vs. quantitative assessments, and the use of single vs. multiple examiners. Virhammar et al. [9] recommend early assessment within 24 h of CSF removal. However, delayed improvement of
Open Access
Fluids and Barriers of the CNS
*Correspondence: [email protected] 1 Rakuwa Villa Ilios, 186 Jyrakumawari-nishimachi, Nakagyouku, Kyoto 604-8402, JapanFull list of author information is available at the end of the article
Page 2 of 7Ishikawa et al. Fluids Barriers CNS (2016) 13:20
symptoms is often observed. Recently, Schniepp et al. [10] reported a maximal increase in gait velocity 24–48 h after the TT using quantitative measures of gait. Assess-ment of gait is performed using clinical grading scales in most studies. However, categorical scales lack reliability. Since quantitative measures for gait are more reliable and have good objectivity, we investigated the clinical useful-ness of quantitative measures of gait. We used the timed up and go test (TUG), the 10-m walk in time (10Ti), and the 10-m walk in step (10St) tests. In order to improve the diagnostic performance of the CSF TT, we focused on the following clinical questions: (1) When is a bet-ter time for the assessment: day 1 or day 4? (2) Which is the best measure of gait among the above three popular measures? (3) Which is the best variable to use for the measured values: the change in the measured value, or its percent change? Diagnostic performances of the three measures were investigated using multiple receiver oper-ating characteristic (ROC) curve analyses.
MethodsStudy populationThis study was approved by the institutional board in Rakuwakai Otowa Hospital, Kyoto, Japan (Rakuoto1023). To study the usefulness of the TT, it was performed in 101 patients with possible iNPH as defined by the Japa-nese guidelines for iNPH [11] from January 2012 to December 2015 in Rakuwakai Otowa hospital. Brain and spine magnetic resonance imaging (MRI) was performed in all patients. There was a positive response to TT in 75 of the patients. A positive response was defined as an improvement of one point or more on the Japanese iNPH grading scale (GS) [12] or an improvement of 10% or more above baseline in quantitative measures of the TT made according to a proposal of the Japanese guidelines for iNPH [11]. Among the 75 patients with a positive response, 61 patients with subsequent shunt surgery were included in this analysis. Patients who did not receive surgery due to patient’s unwillingness and 5 patients who had severe gait disturbance requiring support at assess-ment, were excluded. Among the 61 patients, 51 had both early and delayed assessments of the TT. The remaining ten patients did not undergo the delayed assessment of the TT, due to the patient’s unwillingness or difficulty with the examiners’ time schedules. However, to exclude the possibility of selection bias, statistical analyses were performed on all 61 patients who had undergone sur-gery and in whom quantitative measures of gait could be obtained without any support.
MRIThe brain MRI studies included T2-weighted images, T2-star weighted images, fluid attenuation inversion
recovery images, constructive interference in steady state (CISS) images, and magnetic resonance angiography. MRIs with T2-weighted images were carried out for both the lumbar and the cervical spine. Characteristic findings of iNPH on MRI are known to include disproportionately enlarged subarachnoid space hydrocephalus (DESH) [2]. DESH consists of ventriculomegaly, tight high convexity, and enlarged subarachnoid space. Each of these compo-nents was categorized into marked, fair, or none. Patients classified as DESH were marked for all three compo-nents. Patients classified as incomplete DESH had one fair and two marked categories among the three com-ponents. Patients with other classifications were consid-ered non-DESH [13]. CISS findings from this study are reported elsewhere [14].
Tap testFor the TT, 30 ml of CSF were removed via a lumbar tap. Quantitative assessments of gait and cognition were per-formed before the lumbar tap, on day 1 (within 24 h of the tap), and on day 4. Fifty-seven patients were assessed within 24 h (18–24 h) to fit with the time schedules of rehabilitation staff and 4 patients were assessed within 3 h after the CSF removal.
Physiotherapists examined patients quantitatively using the TUG (s), the 10Ti (s), and the 10St (steps). On the TUG, the examination was performed in the rehabili-tation room and physiotherapists measured time while a patient rises from an arm chair, walks 3 m, turns, walks back and sits down again, with maximum speed [15]. Assessments were done twice for each measure and the faster time or fewer steps were adopted. For the 10Ti and 10St, the patient was also requested to walk with maxi-mal speed. The Mini-Mental State Examination and the Frontal Assessment Battery were carried out by speech therapists. Measured values, changes in measured val-ues from baseline, and percent changes were compared between day 1 and day 4 groups for statistical signifi-cance (Table 1).
Shunt surgeryShunt surgery, consisting of either a ventriculoperito-neal (VP) shunt (n = 44) [2] or a lumboperitoneal (LP) shunt (n = 17) [16], was performed in all patients within one month after the TT. Selection of the type of shunt was based on the presence or absence of severe lumbar or cervical canal stenosis, the patient’s preference, and the surgeon’s preference. The Codman Hakim program-mable valve with Siphonguard or Medtronic Strata NSC system, were used. The outcome was assessed 3 months after the shunt surgery using the gait domain of the Japanese iNPH GS by the senior author (MI) at the out-patient clinic. The outcome at 3 months was chosen to
Page 3 of 7Ishikawa et al. Fluids Barriers CNS (2016) 13:20
largely reflect the results of surgery, whereas if delayed for 6 months or 1 year the outcome could have been confounded by further modifications of comorbidity and nursing care. Improvement of gait at three months was defined as a one-point-or-larger improvement on the GS [11].
Statistical analysesFor the analysis of the means of continuous data, we used the Wilcoxon signed-rank test to perform nonparamet-ric statistics. Comparisons of percentages of categorical data were performed using the Chi square test. Compari-sons among the three groups (Baseline, Day1 and Day4) were performed using repeat measures analysis of vari-ance (ANOVA) with Bonferroni post hoc comparison. Diagnostic accuracy of each variable was calculated using area under the curve (AUC), sensitivity, specificity, and cutoff levels obtained using receiver operating character-istic (ROC) curves. The significance level was set at 0.05. All statistical analyses were performed using the open-source software R (version 3.0.1; R Foundation for Statis-tical Computing, Vienna, Austria; http://www.R-project.org). ROC analyses were performed using the package program pROC (version 1.8) [17].
ResultsClinical background data are summarized in Table 1. Early assessment on day 1 after TT was performed in 61 patients with a mean age of 76.9 years. Delayed assess-ment on day 4 was performed in 51 patients with a mean age was 76.6 years. Gender, symptoms, MRI findings, and positive response on the TT were comparable between the groups with or without delayed assessment and no statistical differences were noted.
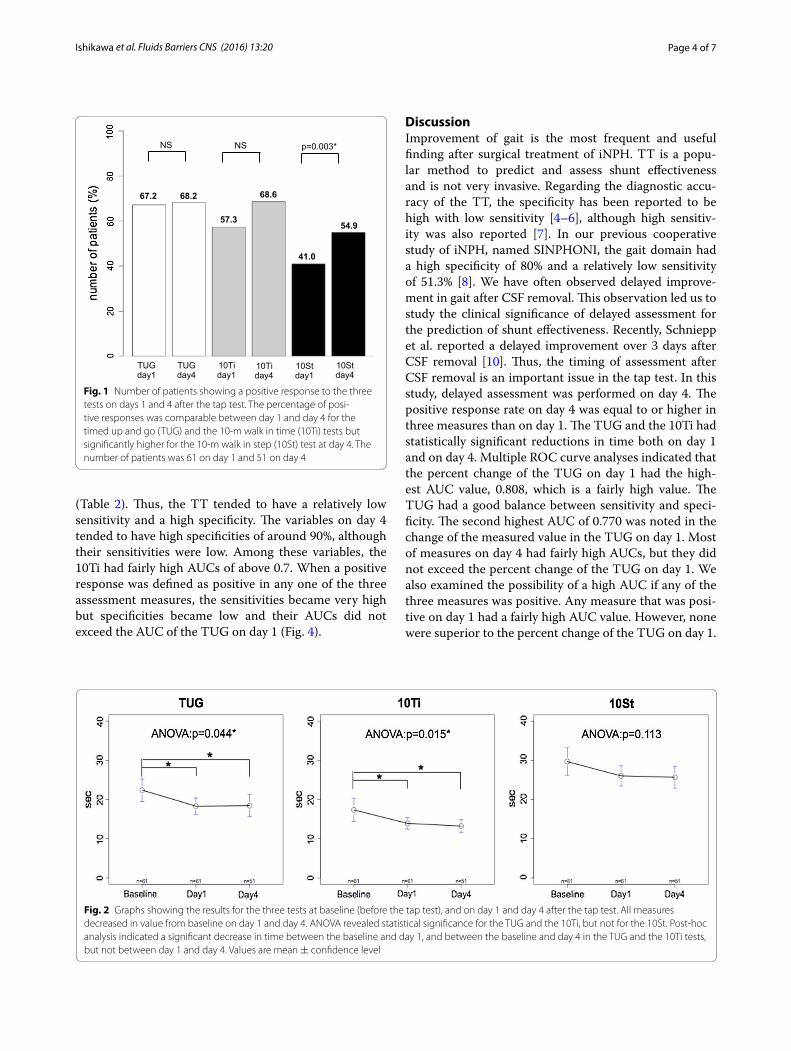
Positive response rates in gait which was defined as improvements of 10% or more over baseline in the TUG, the 10Ti, and the 10St on day 1 and day 4 are depicted in Fig. 1. Positive response rates on day 4 were equal to or higher in the three measures compared to day 1, with statistical significance in the 10St test. In the TUG and the 10Ti tests, repeat measures ANOVA analysis of the measured values at baseline and on days 1 and 4 revealed a statistically significant difference (Fig. 2). Post hoc analysis revealed significantly reduced times between baseline and day 1 and between baseline and day 4 in the TUG and 10Ti tests (Fig. 2). No statistical differences were noted in the 10St test.
The ROC curves of the three measures on days 1 and 4 are depicted for changes in the measured values (Fig. 3, left) and their percent changes (Fig. 3, right). AUC val-ues were computed using the ROC analyses. The meas-ured change and the percent change of TUG on day 1 both had higher AUCs. The AUC, sensitivity, specificity, and cutoff values are tabulated in Table 2. Each measure has a different sensitivity and specificity and a different AUC.
Among these measures, the percent change in the TUG on day 1 had the highest AUC value (0.808) and a sen-sitivity of 78.8% and a specificity of 80.0%. The cut-off value for the TUG was 11.3%. Although this AUC value was significantly different from most variables of 10St, no statistical differences were noted between the vari-ables of the TUG and the 10Ti. The second highest AUC (0.770) was noted for the change in the measured value of the TUG on day 1. The TUG on day 1 had a sensitiv-ity of 76.6%, a specificity of 75.0%, and a cutoff value of 2.0 s. Overall, the sensitivity of the TT ranged from 34.1 to 78.3%, while its specificity ranged from 50.0 to 93.8%
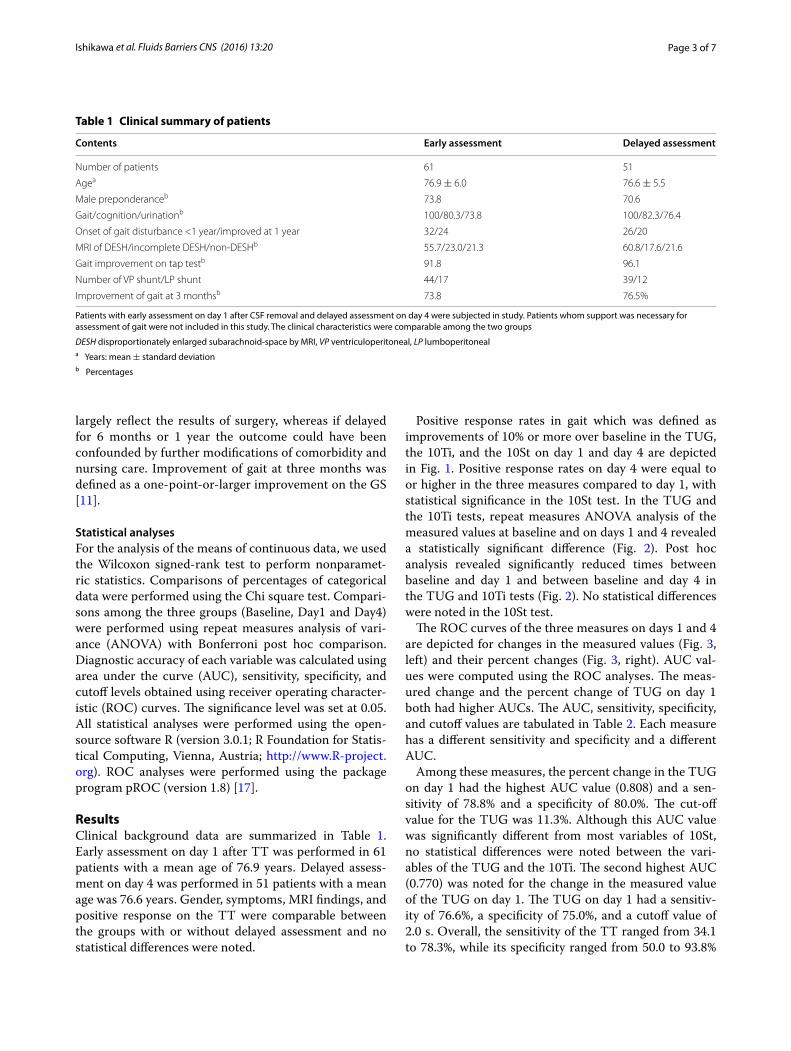
Table 1 Clinical summary of patients
Patients with early assessment on day 1 after CSF removal and delayed assessment on day 4 were subjected in study. Patients whom support was necessary for assessment of gait were not included in this study. The clinical characteristics were comparable among the two groups
DESH disproportionately enlarged subarachnoid-space by MRI, VP ventriculoperitoneal, LP lumboperitoneala Years: mean ± standard deviationb Percentages
Contents Early assessment Delayed assessment
Number of patients 61 51
Agea 76.9 ± 6.0 76.6 ± 5.5
Male preponderanceb 73.8 70.6
Gait/cognition/urinationb 100/80.3/73.8 100/82.3/76.4
Onset of gait disturbance <1 year/improved at 1 year 32/24 26/20
MRI of DESH/incomplete DESH/non-DESHb 55.7/23.0/21.3 60.8/17.6/21.6
Gait improvement on tap testb 91.8 96.1
Number of VP shunt/LP shunt 44/17 39/12
Improvement of gait at 3 monthsb 73.8 76.5%
Page 4 of 7Ishikawa et al. Fluids Barriers CNS (2016) 13:20
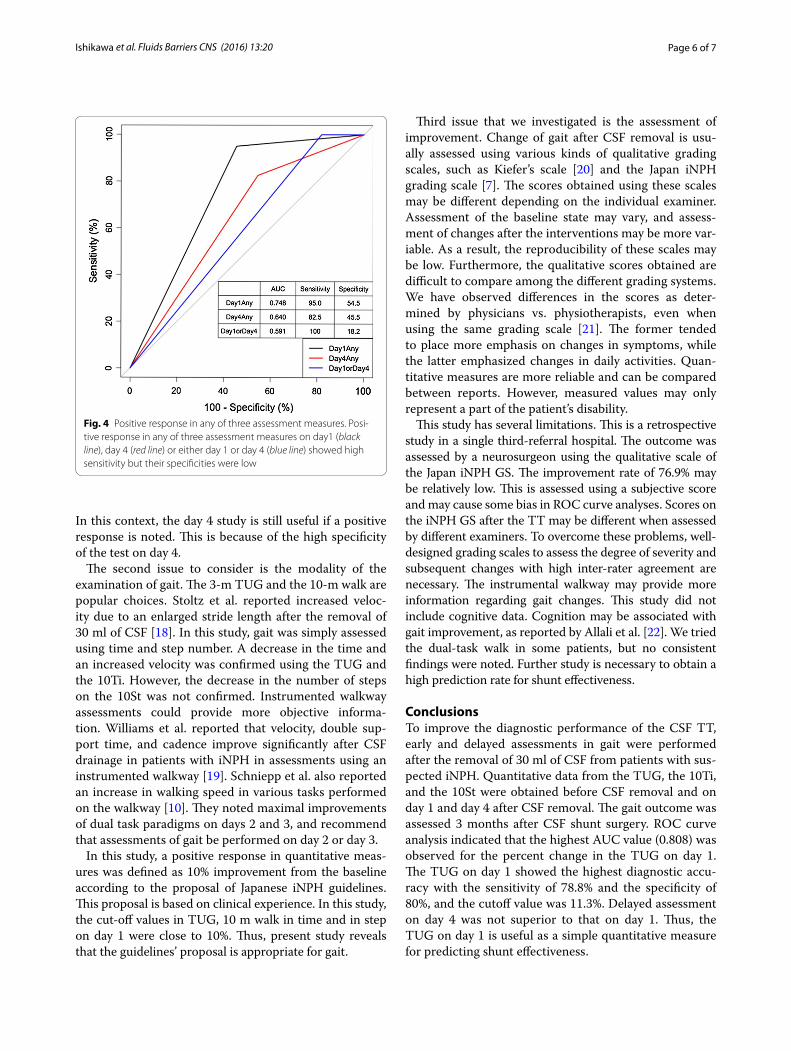
(Table 2). Thus, the TT tended to have a relatively low sensitivity and a high specificity. The variables on day 4 tended to have high specificities of around 90%, although their sensitivities were low. Among these variables, the 10Ti had fairly high AUCs of above 0.7. When a positive response was defined as positive in any one of the three assessment measures, the sensitivities became very high but specificities became low and their AUCs did not exceed the AUC of the TUG on day 1 (Fig. 4).
DiscussionImprovement of gait is the most frequent and useful finding after surgical treatment of iNPH. TT is a popu-lar method to predict and assess shunt effectiveness and is not very invasive. Regarding the diagnostic accu-racy of the TT, the specificity has been reported to be high with low sensitivity [4–6], although high sensitiv-ity was also reported [7]. In our previous cooperative study of iNPH, named SINPHONI, the gait domain had a high specificity of 80% and a relatively low sensitivity of 51.3% [8]. We have often observed delayed improve-ment in gait after CSF removal. This observation led us to study the clinical significance of delayed assessment for the prediction of shunt effectiveness. Recently, Schniepp et al. reported a delayed improvement over 3 days after CSF removal [10]. Thus, the timing of assessment after CSF removal is an important issue in the tap test. In this study, delayed assessment was performed on day 4. The positive response rate on day 4 was equal to or higher in three measures than on day 1. The TUG and the 10Ti had statistically significant reductions in time both on day 1 and on day 4. Multiple ROC curve analyses indicated that the percent change of the TUG on day 1 had the high-est AUC value, 0.808, which is a fairly high value. The TUG had a good balance between sensitivity and speci-ficity. The second highest AUC of 0.770 was noted in the change of the measured value in the TUG on day 1. Most of measures on day 4 had fairly high AUCs, but they did not exceed the percent change of the TUG on day 1. We also examined the possibility of a high AUC if any of the three measures was positive. Any measure that was posi-tive on day 1 had a fairly high AUC value. However, none were superior to the percent change of the TUG on day 1.
68.6 67.2 68.2
57.3
41.0
54.9
TUG day1
TUG day4
10Ti day1
10Ti day4
10St day1
10St day4
NS NS p=0.003*
Fig. 1 Number of patients showing a positive response to the three tests on days 1 and 4 after the tap test. The percentage of posi-tive responses was comparable between day 1 and day 4 for the timed up and go (TUG) and the 10-m walk in time (10Ti) tests but significantly higher for the 10-m walk in step (10St) test at day 4. The number of patients was 61 on day 1 and 51 on day 4
Fig. 2 Graphs showing the results for the three tests at baseline (before the tap test), and on day 1 and day 4 after the tap test. All measures decreased in value from baseline on day 1 and day 4. ANOVA revealed statistical significance for the TUG and the 10Ti, but not for the 10St. Post-hoc analysis indicated a significant decrease in time between the baseline and day 1, and between the baseline and day 4 in the TUG and the 10Ti tests, but not between day 1 and day 4. Values are mean ± confidence level

Page 5 of 7Ishikawa et al. Fluids Barriers CNS (2016) 13:20
Thus, the TUG on day 1, either as a percent change or as a change in the measured value, was shown to be useful for predicting shunt effectiveness.
In this study, most of the assessments on day 4 had high specificities around 90%. High specificity indicates
that the number of false positive cases is small, which is favorable from the standpoint of recommendation for surgery. Similarly, high sensitivity indicates that the number of false negative cases is small, which is favora-ble for selecting candidates from the general population.
Fig. 3 Receiver operating characteristic (ROC) curves and area under the curve (AUC) values on day 1 (solid lines) and day 4 (dotted lines). ROC curves for changes of measured values from baseline are left and ROC curves for percent changes are on the right. The AUC for TUG on day 1 was highest for both ROC curves
Table 2 Receiver operating curve analysis
ROC curve analysis showed the AUCs, sensitivities, specificities and cutoff values. The percent change from baseline of AUC on day 1 was regarded as a control and compared with other variables. Note the TUG on day 1, both for change in time and change in percentage, showed the highest AUC
Statistical differences were noted in most of 10Sts (*), but not in other variables of the TUG and the 10Ti
Examination day Measures (change in time or step number from baseline)
AUC p Sensitivity (%) Specificity (%) Cutoff
Day 1 (N = 63) TUG (s) 0.770 0.249 76.6 75.0 2.0
10Ti (s) 0.645 0.102 63.8 68.8 0.8
10St (step) 0.602 0.027* 36.1 93.8 4.5
Day 4 (N = 52) TUG (s) 0.677 0.283 43.9 90.9 5.0
10Ti (s) 0.711 0.383 63.4 81.2 2.3
10St (step) 0.579 0.053 34.1 90.0 5.5
Examination day Measures (change in percentage from baseline)
AUC p Sensitivity (%) Specificity (%) Cutoff (%)
Day 1 (N = 63) TUG (%) 0.808 – 78.3 80.0 11.3
10Ti (%) 0.641 0.193 63.0 66.6 9.4
10St (%) 0.577 0.016* 41.3 86.7 13.6
Day 4 (N = 52) TUG (%) 0.599 0.109 73.2 50.0 10.0
10Ti (%) 0.738 0.483 63.4 90.0 15.8
10St (%) 0.560 0.036* 41.5 80.0 17.0
Page 6 of 7Ishikawa et al. Fluids Barriers CNS (2016) 13:20
In this context, the day 4 study is still useful if a positive response is noted. This is because of the high specificity of the test on day 4.
The second issue to consider is the modality of the examination of gait. The 3-m TUG and the 10-m walk are popular choices. Stoltz et al. reported increased veloc-ity due to an enlarged stride length after the removal of 30 ml of CSF [18]. In this study, gait was simply assessed using time and step number. A decrease in the time and an increased velocity was confirmed using the TUG and the 10Ti. However, the decrease in the number of steps on the 10St was not confirmed. Instrumented walkway assessments could provide more objective informa-tion. Williams et al. reported that velocity, double sup-port time, and cadence improve significantly after CSF drainage in patients with iNPH in assessments using an instrumented walkway [19]. Schniepp et al. also reported an increase in walking speed in various tasks performed on the walkway [10]. They noted maximal improvements of dual task paradigms on days 2 and 3, and recommend that assessments of gait be performed on day 2 or day 3.
In this study, a positive response in quantitative meas-ures was defined as 10% improvement from the baseline according to the proposal of Japanese iNPH guidelines. This proposal is based on clinical experience. In this study, the cut-off values in TUG, 10 m walk in time and in step on day 1 were close to 10%. Thus, present study reveals that the guidelines’ proposal is appropriate for gait.
Third issue that we investigated is the assessment of improvement. Change of gait after CSF removal is usu-ally assessed using various kinds of qualitative grading scales, such as Kiefer’s scale [20] and the Japan iNPH grading scale [7]. The scores obtained using these scales may be different depending on the individual examiner. Assessment of the baseline state may vary, and assess-ment of changes after the interventions may be more var-iable. As a result, the reproducibility of these scales may be low. Furthermore, the qualitative scores obtained are difficult to compare among the different grading systems. We have observed differences in the scores as deter-mined by physicians vs. physiotherapists, even when using the same grading scale [21]. The former tended to place more emphasis on changes in symptoms, while the latter emphasized changes in daily activities. Quan-titative measures are more reliable and can be compared between reports. However, measured values may only represent a part of the patient’s disability.
This study has several limitations. This is a retrospective study in a single third-referral hospital. The outcome was assessed by a neurosurgeon using the qualitative scale of the Japan iNPH GS. The improvement rate of 76.9% may be relatively low. This is assessed using a subjective score and may cause some bias in ROC curve analyses. Scores on the iNPH GS after the TT may be different when assessed by different examiners. To overcome these problems, well-designed grading scales to assess the degree of severity and subsequent changes with high inter-rater agreement are necessary. The instrumental walkway may provide more information regarding gait changes. This study did not include cognitive data. Cognition may be associated with gait improvement, as reported by Allali et al. [22]. We tried the dual-task walk in some patients, but no consistent findings were noted. Further study is necessary to obtain a high prediction rate for shunt effectiveness.
ConclusionsTo improve the diagnostic performance of the CSF TT, early and delayed assessments in gait were performed after the removal of 30 ml of CSF from patients with sus-pected iNPH. Quantitative data from the TUG, the 10Ti, and the 10St were obtained before CSF removal and on day 1 and day 4 after CSF removal. The gait outcome was assessed 3 months after CSF shunt surgery. ROC curve analysis indicated that the highest AUC value (0.808) was observed for the percent change in the TUG on day 1. The TUG on day 1 showed the highest diagnostic accu-racy with the sensitivity of 78.8% and the specificity of 80%, and the cutoff value was 11.3%. Delayed assessment on day 4 was not superior to that on day 1. Thus, the TUG on day 1 is useful as a simple quantitative measure for predicting shunt effectiveness.
Fig. 4 Positive response in any of three assessment measures. Posi-tive response in any of three assessment measures on day1 (black line), day 4 (red line) or either day 1 or day 4 (blue line) showed high sensitivity but their specificities were low
Page 7 of 7Ishikawa et al. Fluids Barriers CNS (2016) 13:20
AbbreviationsANOVA: analysis of variance; AUC: area under the curve; CISS: constructive interference in steady state; CSF: cerebrospinal fluid; DESH: disproportion-ately enlarged subarachnoid-space hydrocephalus; GS: grading scale; iNPH: idiopathic normal pressure hydrocephalus; LP: lumboperitoneal shunt; MRI: magnetic resonance imaging; ROC: receiver operating characteristic; TT: tap test; TUG: timed up and go test; VP: ventriculoperitoneal shunt; 10Ti: 10-m walk in time; 10St: 10-m walk in step.
Authors’ contributionsMI carried out patient data collection, statistical analysis, and drafted the manuscript. YS carried out patient data collection and statistical analysis. KY participated in the coordination of the study. All authors read and approved the final manuscript.
Author details1 Rakuwa Villa Ilios, 186 Jyrakumawari-nishimachi, Nakagyouku, Kyoto 604-8402, Japan. 2 Normal Pressure Hydrocephalus Center, Rakuwakai Otowa Hospital, 2 Chinjicho, Yamashinaku, Otowa, Kyoto 607-8062, Japan. 3 Department of Neurosurgery, Rakuwakai Otowa Hospital, 2 Chinjicho, Yamashinaku, Otowa, Kyoto 607-8062, Japan.
AcknowledgementsThe authors would like to thank the patients and the staffs at the Rehabilita-tion Center at Rakuwakai Otowa Hospital.
Competing interestsMI receives honoraria for lecturing by Codman, Johnson and Johnson, and Medtronic Japan. SY receives honoraria for lecturing by Codman and Johnson and Johnson. KY has no competing interests.
Availability of data and materialsData will not be shared, as all data are already presented in the main paper.
Consent for publicationAll of authors agree with publication of this manuscript.
Ethics approval and consent to participateThis study was approved by the institutional board of Rakuwakai Otowa Hospital, Kyoto, Japan.
Written informed consents concerning diagnostic procedures and treat-ments in patients with possible idiopathic normal pressure hydrocephalus were obtained in all patients.
FundingThis study was supported by a Health and Labor Sciences Research Grant for Research on Intractable Diseases, Ministry of Health, Labor and Welfare. The sponsors were not involved in the study design, in the collection, analysis, or interpretation data; in the writing of the report; or in the decision to submit the paper for publication.
Received: 29 August 2016 Accepted: 9 November 2016
References 1. Hakim S, Adams RD. The special clinical problems of symptomatic
hydrocephalus with normal cerebrospinal fluid pressure: observations on cerebrospinal fluid dynamics. J Neurol Sci. 1965;2:302–27.
2. Hashimoto M, Ishikawa M, Mori E, Kuwana N. For the study of idiopathic normal pressure hydrocephalus on neurological improvement (SIN-PHONI) group. Diagnosis of idiopathic normal pressure hydrocephalus is supported by MRI-based scheme: a prospective study. Cerebrospinal Fluid Res. 2010;7:18. doi:10.1186/1743-8454-7-S1-S18.
3. Wikkelsø C, Andersson H, Blomstrand C, Lindqvist G. The clinical effect of lumbar puncture in normal pressure hydrocephalus. J Neurol Neurosurg Psychiatry. 1982;45:64–9. doi:10.1136/jnnp.45.1.64.
4. Haan J, Thomeer RT. Predictive value of temporary external lumbar drain-age in normal pressure hydrocephalus. Neurosurgery. 1988;22:388–91.
5. Walchenbach R, Geiger E, Thomeer RT, Vanneste JA. The value of tempo-rary external lumbar CSF drainage in predicting the outcome of shunting on normal pressure hydrocephalus. J Neurol Neurosurg Psychiatry. 2002;72:503–6.
6. Damasceno BP, Carelli EF, Honorato DC, Facure JJ. The predictive value of cerebrospinal fluid tap-test in normal pressure hydrocephalus. Arq Neuropsiquiatr. 1997;55:179–85.
7. Wikkelsø C, Hellström P, Klinge PM, Tans JT. European iNPH Multicentre Study Group. The European iNPH Multicenter Study on the predictive values of resistance to CSF outflow and the CSF Tap Test in patients with idiopathic normal pressure hydrocephalus. J Neurol Neurosurg Psychiat. 2013;84:562–8.
8. Ishikawa M, Hashimoto M, Mori E, Kuwana M, Hiroaki Kazui H. The value of the cerebrospinal fluid tap test for predicting shunt effectiveness in idi-opathic normal pressure hydrocephalus. Fluids Barriers CNS. 2012;9(1):1. doi:10.1186/2045-8118-9-1.
9. Virhammar J, Cesarini KG, Laurell K. The CSF tap test in normal pressure hydrocephalus: evaluation time, reliability and the influence of pain. Eur J Neurol. 2011. doi:10.1111/j.1468-1331,2011.03486.x.
10. Schniepp R, Trabold R, Romagna A, Akrami F, Hesselbarth K, Wuehr M, Peraud P, Brandt T, Dieterich M, Jahn K. Walking assessment after lumbar puncture in normal-pressure hydrocephalus: a delayed improvement over 3 days. J Neurosurg. 2016. doi:10.3171/2015.12.jns151663.
11. Mori E, Ishikawa M, Kato T, Kazui H, Miyake H, Miyajima M, Nakajima M, Hashimoto M, Kuriyama N, Tokuda T, Ishii K, Kaijima M, Hirata Y, Saito M, Arai H. Japanese Society of normal pressure hydrocephalus: guidelines for management of idiopathic normal pressure hydrocephalus: second edition. Neurol Med Chir (Tokyo). 2012;52(11):775–809.
12. Kubo Y, Kazui H, Yoshida T, Kito Y, Kimura N, Tokunaga H, Ogino A, Miyake H, Ishikawa M, Takeda M. Validation of grading scale for evaluating symp-toms of idiopathic normal-pressure hydrocephalus. Dement Geriatr Cogn Disord. 2008;25:37–45.
13. Ishikawa M, Oowaki H, Takezawa M, Takenaka T, Yamada S, Yamamoto K, Okamoto S. Disproportionately enlarged subarachnoid space hydroceph-alus in idiopathic normal-pressure hydrocephalus and its implication in pathogenesis. Intracranial pressure and brain monitoring XV. Berlin: Springer; 2016. p. 287–90.
14. Ishikawa M, Yamada S, Yamamoto K. Three-dimensional observation of Virchow-Robin spaces in the basal ganglia and white matter and their relevance to idiopathic normal pressure hydrocephalus. Fluids Barriers CNS. 2015;26(12):15. doi:10.1186/s12987-015-0010-1.
15. Podsiadlo D, Richardson S. The timed ‘Up & Go’: a test of basic functional mobility for frail elderly persons. J Am Geriatr Soc. 1991;39(2):142–8.
16. Kazui H, Miyajima M, Mori E, Ishikawa M. on behalf of the SINPHONI-2 Investigators* Lumboperitoneal shunt surgery for idiopathic normal pres-sure hydrocephalus (SINPHONI-2): an open-label randomised trial. Lancet Neurol. 2015;14:585–94.
17. Robin X, Turck N, Hainard A, Tiberti N, Lisacek F, Sanchez J and Müller M. pROC: an open-source package for R and S+ to analyze and compare ROC curves. BMC Bioinform. 2011. doi: 10.1186/1471-2105-12-77. http://www.biomedcentral.com/1471-2105/12/77/.
18. Stolze H, Kuhtz-Buschbeck J, Drucke H, Johnk K, Diercks C, Mehdom HM, Illert M, Deuschl G. Gait analysis in idiopathic normal pressure hydroceph-alus–which parameters respond to the CSF tap test? Clin Neurophysol. 2000;111:1678–86.
19. Williams MA, Thomas G, de Lateur B, Imteyaz H, Rose JG, Shore WS, Kharkar S, Rigamonti D. Objective assessment of gait in normal-pressure hydrocephalus. Am J Phys Med Rehabil. 2008;87(1):39–45.
20. Kiefer M, Eymann R, Komenda Y, Steudel WI. A grading system for chronic hydrocephalus. Zentralbl Neurochir. 2003;64:109–15 (Ger).
21. Ishikawa M. Comparison of various assessment measures on shunt effec-tiveness in idiopathic normal pressure hydrocephalus. Presented at the first meeting of the European Academy of Neurology in Copenhagen; 2014.
22. Allali G, Leidet M, Beauchet O, Herrmann FR, Assal F, Armand S. Dual-task related gait changes after CSF taping: a new way to identify idiopathic normal pressure hydrocephalus. J Neuroeng Rehabil. 2013;10:117. doi:10.1186/1743-0003-10-117.