e2m: a deep learning framework for associating ...e2m: a deep learning framework for associating...
TRANSCRIPT

E2M: A Deep Learning Framework for AssociatingCombinatorial Methylation Patterns with GeneExpression
Jianhao Peng, Idoia Ochoa ∗ and Olgica Milenkovic ∗
1 Abstract
Motivation: We focus on the new problem of determining which methylation patterns in gene pro-moters strongly associate with gene expression in cancer cells of different types. Although a numberof results regarding the influence of methylation on expression data have been reported in the litera-ture, our approach is unique in so far that it retrospectively predicts the combinations of methylatedsites in promoter regions of genes that are reflected in the expression data. Reversing the traditionalprediction order in many cases makes estimation of the model parameters easier, as real-valued dataare used to predict categorical data, rather than vice-versa; in addition, our approach allows one tobetter assess the overall influence of methylation in modulating expression via state-of-the-art learningmethods. For this purpose, we developed a novel neural network learning framework termed E2M(Expression-to-Methylation) to predict the status of different methylation sites in promoter regions ofseveral bio-marker genes based on a sufficient statistics of the whole gene expression captured throughLandmark genes. We ran our experiments on unquantized and quantized expression sets and neuralnetwork weights to illustrate the robustness of the method and reduce the storage footprint of theprocessing pipeline.Results: We implemented a number of machine learning algorithms to address the new problem ofmethylation pattern inference, including multiclass regression, canonical correlation analysis (CCA),naive fully connected neural network and inception neural networks. Inception neural networks suchas E2M learners outperform all other techniques and offer an average prediction accuracy of 82%when tested on 3, 671 pan-cancer samples including low grade glioma, glioblastoma, lung adenocar-cinoma, lung squamus cell carcinoma, and stomach adenocarcinoma. As an illustrative example, onecan increase the prediction accuracy for the methylation pattern in the promoter of gene GATA6 inglioblastoma samples by 20% when using inception rather than simple fully connected neural net-works. These performance guarantees remain largely unchanged even when both expression valuesand network weights are quantized. Our work also provides new insight about the importance ofspecific methylation site patterns on expression variations for different genes. In this context, weidentified genes for which the overwhelming majority of patients exhibit one methylation pattern, andother genes with three or more significant classes of methylation patterns. Inception networks identifysuch patterns with high accuracy and suggest possible stratification of cancers based on methylationpattern profiles.Availability: The E2M code and datasets are freely available at https://github.com/jianhao2016/E2M
Contact: [email protected], [email protected]
1
certified by peer review) is the author/funder. All rights reserved. No reuse allowed without permission. The copyright holder for this preprint (which was notthis version posted January 22, 2019. . https://doi.org/10.1101/527044doi: bioRxiv preprint

2 Introduction 2
2 Introduction
Recent studies in computational biology have focused on analyzing multiomics datasets in order togain a better understanding of the relationships between different dataset components and their uniqueinformation content, and to elucidate the relationships between their underlying biological phenomena.This is of particular importance for the case of gene expression data, as there are many genomic andepigenomic factors that influence gene expression (e.g., transcriptional regulation, methylation andhistone modification, copy number variation, etc) and as gene expression itself affects almost all aspectsof cellular function [7, 30, 1, 22, 5]. One approach to determine to which extent gene expression isdetermined by or determines other molecular and biochemical modularities is to predict expressionvalues based on associated datasets, such as methylation data [14, 6, 25]. For this task, many learningmethods are available, such as logistic regression and deep learning [9, 2]. If the prediction accuracyof the expression values is high, it is reasonable to assume that corresponding data are statisticallycorrelated and that the processes under consideration are biologically interlinked.
Several lines of work in this areas have focused on applying machine learning methods on geneexpression data in order to predict clinical outcomes or the dynamics of diseases. In [4], the authorsidentified a subset of genes whose expression values have strong diagnostic value in cancer stagingand survival rate evaluation. The work described in [29] focused on predicting gene expression valuesbased on histone modification data, while taking into account the inherent redundancy present incombined gene expression profiles.
Of particular interest are analyses involving expression and methylation datasets, as methylationis known to be one of the key regulators of expression [15] (see Figure 1). Methylation is a commonepigenetic modification [24] that plays an important role in tumorigenesis and cancer progression. Themethylation process alters the chemical structure of Cytosine or Guanine at CpG sites, which oftencluster within CpG islands in promoter regions of genes. Although a CpG island may contain tensof CpG sites, it has been a standard practice to only report the thresholded cumulative methylationeffect of the sites and declare a binary methylation state of a gene (methylated or unmethylated).In order to associate DNA methylation with gene expression changes, the authors of [25] proposeda supervised learning method termed ME-Class (Methylation-based Expression Classification) forpredicting expression changes based on soft methylation features. The goal of the aforementionedstudy was to assess the raw predictive power of methylation data, rather than to determine whichcombinations of methylation sites truly contribute to the observed expression profiles. On the otherhand, authors of [18] proposed an attention model which utilized both the expression data and CpGsites distance information to predict methylation states of one CpG site. Our work hence centers ona higher-order and in-depth analysis of the mutual relationship between expression and methylationsite patterns in the context of pan cancer data analysis. The natural approach to pursue within thisframework is retrospective analysis, which amounts to inferring methylation patterns (i.e., discretestates) from expression values (i.e., continuous observations).
Our technical contributions are three-fold. First, we introduce the problem of correlating binarymethylation patterns with the expressions of Landmark genes [8]. This significantly reduces thecomplexity of the problem and simultaneously performs denoising of expression values, as the set ofLandmark genes is rather small (≈ 1000) and selected for its predictive power for whole-genome expres-sions. Second, we propose a new inception network [31] architecture for deep learning, termed E2M,which performs retrospective classification. The prediction accuracy of the E2M network is up to 20%better than that offered by traditional multi-class logistics regression and three-layer fully connectednetworks. Third, we demonstrate that our learning framework can operate with quantized parametersets and significantly compressed datasets. Large-depth neural networks are known to be more robustto noise [3, 11] than shallow networks, but their practical application is limited by their large storagefootprint. To show that this problem may be easily mitigated via quantization, we demonstrate that8-bit uniformly quantized expression values and 16-bit quantized network weights cause negligibledegradations in recovering underlying methylation patterns for almost all tested examples.
Our analysis also reveals that methylation patterns are gene-dependent and that they influence the
certified by peer review) is the author/funder. All rights reserved. No reuse allowed without permission. The copyright holder for this preprint (which was notthis version posted January 22, 2019. . https://doi.org/10.1101/527044doi: bioRxiv preprint

3 Methods 3
expression dynamics differently for different types of cancers. In some cases, such as lung cancer, themethylation patterns in genes such as MGMT, ATM, GATA6 and KRAS differ significantly, while themethylation patterns in the MLH1 and CASP8 genes show little variation. For some other cases, suchas brain cancer, most genes show very similar methylation patterns, except for GATA6. Furthermore,some genes, such as TP53, have a unique methylation pattern for a specific cancer type, and thepatterns vary little across cancer types.
Fig. 1: Associations between gene expression and DNA methylation and their corresponding datasets.
3 Methods
We start our exposition by describing the datasets used in our analysis, and then proceed with adiscussion of existing and new methods suitable for addressing the prediction problem at hand.
3.1 Data Description
The problem of associating different types of multiomics data has received significant attention inthe computational biology community [17, 10]. To assess the performance of the proposed frameworkE2M, we restrict our attention to human cancer cell expression and methylation data. Our goal is topredict methylation patterns from gene expression values.
There are over 20, 000 genes in the human genome, and using their gene expression values di-rectly in any machine learning task would lead to undetermined problems and overfitting issues dueto redundancy and small sample set sizes. Hence, the first step in our approach is to perform di-mensionality reduction. To this end, we focus on expression levels of so-called L1000 Landmarkgenes, comprising 978 genes. This subset of genes has been carefully selected by the NIH LINCSproject (http://lincsportal.ccs.miami.edu/dcic-portal/) for its good predictive capabilities forthe whole genome expression profile. It has also been demonstrated in [8] that deep networks canaccurately recover the whole genome expression profile using only L1000 expression information. An
certified by peer review) is the author/funder. All rights reserved. No reuse allowed without permission. The copyright holder for this preprint (which was notthis version posted January 22, 2019. . https://doi.org/10.1101/527044doi: bioRxiv preprint

3 Methods 4
additional advantage of using L1000 genes is that LINCS provides efficient and low-cost assays formeasuring the expression of these genes.
Gene expression data is available in multiple formats. High throughput (HT) sequence counts (i.e.,raw counts of gene transcripts) are the most frequently used measurements for describing expression,and all other data representations are derived from these counts. However, since DNA transcripts havedifferent lengths and concentrations, the raw counts may not accurately reflect the relative expressionlevel. To mitigate this problem, raw counts are transformed into Fragments Per Kilobase of Transcriptper Million (FPKM) mapped reads values, computed as:
FPKM(g) =RC(g) ∗ 109
RCpc ∗ L(g).
Here, RC(g) and L(g) represent the raw counts of reads covered by gene g and the length of gene g,respectively, while RCpc denotes the total raw count of reads mapped to all protein coding genes.
In all our experiments, we use FPKM readings of the 978 Landmark genes as inputs. The actualFPKM data was retrieved from The Cancer Genome Atlas (TCGA) project (https://cancergenome.nih.gov/). We selected five different cancer (sub)types: lower grade glioma (LGG), glioblastoma(GBM), lung adenocarcinoma (LUAD), lung squamous cell carcinoma (LUSC) and stomach adeno-carcinoma (STAD), and extracted all available Landmark gene expression datasets (https://portal.gdc.cancer.gov/, downloaded March 2018).
Since most CpG sites are naturally methylated inside a gene, we focus on methylation measure-ments of individual CpG sites within promoter regions. Genes of interest include well-known cancerbiomarkers, MGMT, MLH1, ATM, GATA6, CASP8, KRAS and TP53 (see the Supplementary Ma-terial, Section 1). Information available at TCGA includes methylation microarray values for 7, 6, 4,2, 3, 6 and 3 CpG sites in the promoter region of these genes, respectively. Since genes in differentcancer types have nonuniform methylation levels as measured in terms of coverage of the methylatedsites, the recorded readings only capture the percentage of methylated CpG sites (bottom, right-handformat in Figure 1). We convert these percentages into binary values by thresholding at 10%, assuggested in multiple prior works [19]. The output of this preprocessing step is an m-dimensionalbinary vector, where m is the number of CpG sites in the promoter region of the underlying gene.
As one needs to ensure that both methylation and expression data are available for the samesample, the test data included 511 samples from LGG, 126 from GBM, 511 from LUAD, 500 fromLUSC, and 375 from STAD. This amounts to a total of 637 samples for brain cancer (LGG and GBM),and 1011 samples for lung cancer (LUAD and LUSC). In all subsequent analyses, these datasets weresplit into training and test sets in a 80%-20% proportion.
In summary, we used 978-length positive real-valued vectors containing the FPKM counts of Land-mark genes as inputs of a learner tasked with predicting binary methylation patterns with m entries,corresponding to our preselected biomarker genes.
3.2 Mathematical Approaches
There exists many methods that may be used for associating different types of multiomics data.Among these, the most frequently used approaches include canonical correlation analysis (CCA) [13],multiclass regression (MR) and fully connected neural networks (FCNN) [20]. However, these tech-niques have limitations that make them unsuitable for the problem at hand, as described in whatfollows. Note that to demonstrate the drawbacks of CCA, MR, and FCNN, we actually applied thesemethods on the curated datasets and reported their performance.
3.2.1 Canonical Correlation Analysis
Canonical correlation analysis (CCA) is widely used to infer linear relationships between two correlatedrandom measurements (e.g, random vectors) X ∈ Rn and Y ∈ Rm. In our setting, n = 978, and eachX corresponds to the gene expression profile of a cancer patient, while m ≤ 7 and each Y corresponds
certified by peer review) is the author/funder. All rights reserved. No reuse allowed without permission. The copyright holder for this preprint (which was notthis version posted January 22, 2019. . https://doi.org/10.1101/527044doi: bioRxiv preprint

3 Methods 5
to a binary DNA methylation pattern of the same cancer patient. The CCA objective formally readsas:
(W ′x,W′y) = arg max
(Wx,Wy)
WTx CXYWy√
WTx CXXWT
x
√WT
y CY YWy
,
where CXY is the empirical covariance matrix of X and Y computed using all s ≤ 1011 availablesamples for each individual cancer type. Then, Wx ∈ Rs, Wy ∈ Rs. Intuitively, CCA aims to finda subspace such that the projections Wx and Wy of the random vectors X and Y , respectively, havethe largest possible correlation. This optimization process can be repeated sequentially to obtaina sequence of pairs of random vectors (Wx,Wy) that are mutually uncorrelated, akin to what isstandardly done in eigendecomposition problems.
CCA may be directly applied to our data, but it does not provide a constructive means for infer-ring methylation patterns based on expression; furthermore, it can only identify linear dependenciesbetween two data sample matrices. In addition, given that we have more features (978 genes) thansamples (less than 600 for each cancer subtype), highly-correlated projections arise naturally and areeasy to identify through the described optimization process. Table 1 illustrates this point for the caseof CCA analysis on the MGMT gene, and all cancer subtypes. As expected, canonical correlationvalues in this case exceed 0.94.
Tab. 1: The first three canonical correlation values for the MGMT gene according to cancer subtype.
LGG GBM BRAIN LUAD LUSC LUNG STAD1st 0.99 1.00 0.99 0.99 0.99 0.96 0.992nd 0.99 1.00 0.98 0.99 0.99 0.96 0.993rd 0.99 1.00 0.98 0.99 0.99 0.94 0.99
3.2.2 Multiclass Logistic Regression
A methylation pattern is represented by a binary vector of length m, where we recall that m denotesthe number of CpG sites in the promoter region of a gene of interest. Hence, a methylation patterncorresponds to one of 2m possible binary vectors (classes). Since in our case m ≤ 7, multiclass logisticregression is a natural candidate for prediction.
Let ωy be the weight of the class label y ∈ [0 : 2m− 1]. The posterior probability of the class labelgiven a particular expression profile X = x may be written as
p(y = k|x) =exp (ωT
y x)∑2m−1j=0 exp (ωT
j x).
Under the assumption that all samples are drawn independently from each other, the goal is tomaximize the product of p(y|x) over all pairs (x, y).
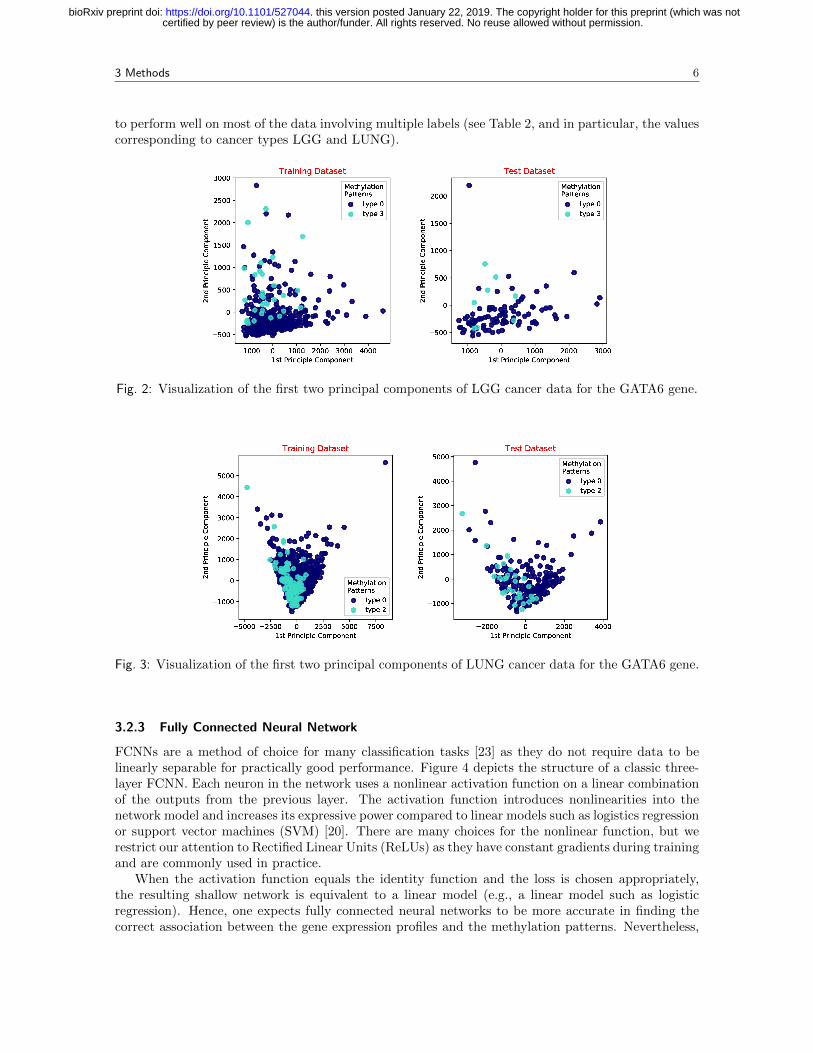
Multiclass logistic regression is only guaranteed to perform well for linearly separable data [20].Due to the large dimension of gene expression vectors, it is computationally difficult to determine ifthe datasets of interest are linearly separable or not. To address this problem, we first performeddimensionality reduction via principal component analysis (PCA) and then visually inspected thedata. Figures 2 and 3 depict the obtained results for two principle components of training and testsamples, for the LGG and LUNG (e.g., the combination of LUAD and LUSC) cancer subtype(s),respectively. Only results for the GATA6 gene are shown; the results for other cancer types andgenes are available in section 2 of the Supplementary Material. It can be observed that the chosenmethylation patterns are not linearly separable. For LGG, we observed two classes of methylationpatterns (light and dark blue points) that exhibit a small degree of separability, whereas for LUNG, thetwo patterns are superimposed onto each other. Hence, multiclass logistic regression is not expected
certified by peer review) is the author/funder. All rights reserved. No reuse allowed without permission. The copyright holder for this preprint (which was notthis version posted January 22, 2019. . https://doi.org/10.1101/527044doi: bioRxiv preprint
3 Methods 6
to perform well on most of the data involving multiple labels (see Table 2, and in particular, the valuescorresponding to cancer types LGG and LUNG).
Fig. 2: Visualization of the first two principal components of LGG cancer data for the GATA6 gene.
Fig. 3: Visualization of the first two principal components of LUNG cancer data for the GATA6 gene.
3.2.3 Fully Connected Neural Network
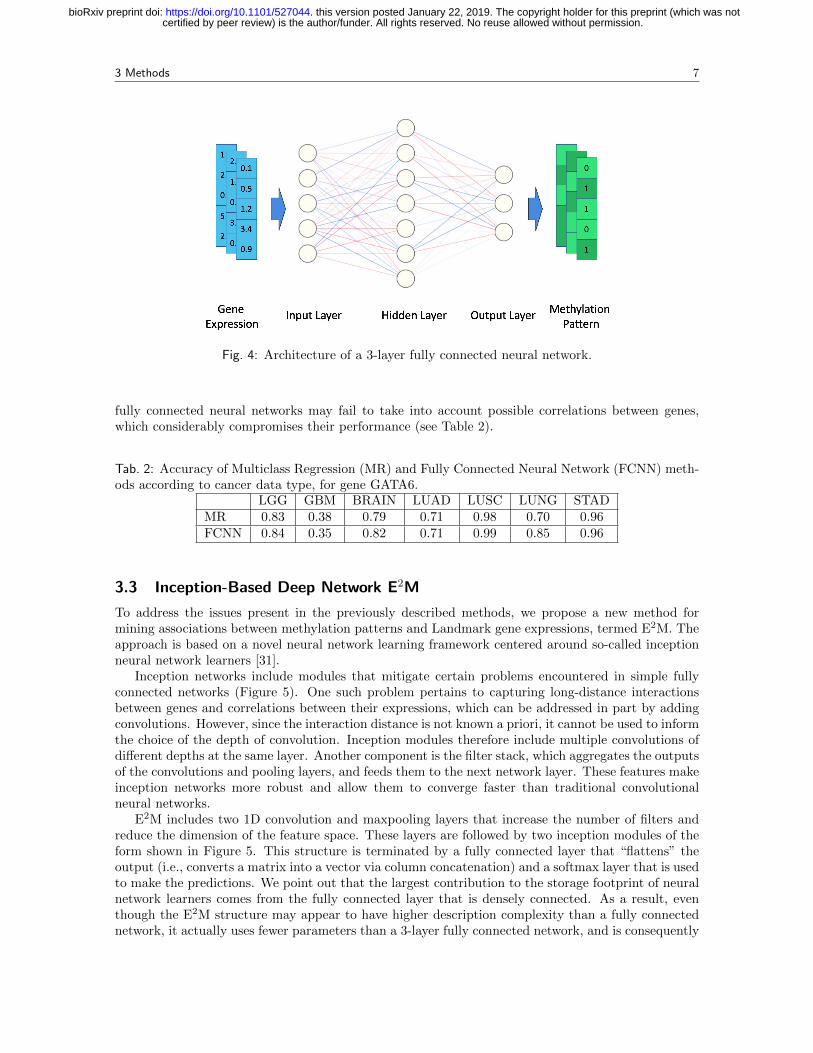
FCNNs are a method of choice for many classification tasks [23] as they do not require data to belinearly separable for practically good performance. Figure 4 depicts the structure of a classic three-layer FCNN. Each neuron in the network uses a nonlinear activation function on a linear combinationof the outputs from the previous layer. The activation function introduces nonlinearities into thenetwork model and increases its expressive power compared to linear models such as logistics regressionor support vector machines (SVM) [20]. There are many choices for the nonlinear function, but werestrict our attention to Rectified Linear Units (ReLUs) as they have constant gradients during trainingand are commonly used in practice.
When the activation function equals the identity function and the loss is chosen appropriately,the resulting shallow network is equivalent to a linear model (e.g., a linear model such as logisticregression). Hence, one expects fully connected neural networks to be more accurate in finding thecorrect association between the gene expression profiles and the methylation patterns. Nevertheless,
certified by peer review) is the author/funder. All rights reserved. No reuse allowed without permission. The copyright holder for this preprint (which was notthis version posted January 22, 2019. . https://doi.org/10.1101/527044doi: bioRxiv preprint
3 Methods 7
Fig. 4: Architecture of a 3-layer fully connected neural network.
fully connected neural networks may fail to take into account possible correlations between genes,which considerably compromises their performance (see Table 2).
Tab. 2: Accuracy of Multiclass Regression (MR) and Fully Connected Neural Network (FCNN) meth-ods according to cancer data type, for gene GATA6.
LGG GBM BRAIN LUAD LUSC LUNG STADMR 0.83 0.38 0.79 0.71 0.98 0.70 0.96FCNN 0.84 0.35 0.82 0.71 0.99 0.85 0.96
3.3 Inception-Based Deep Network E2M
To address the issues present in the previously described methods, we propose a new method formining associations between methylation patterns and Landmark gene expressions, termed E2M. Theapproach is based on a novel neural network learning framework centered around so-called inceptionneural network learners [31].
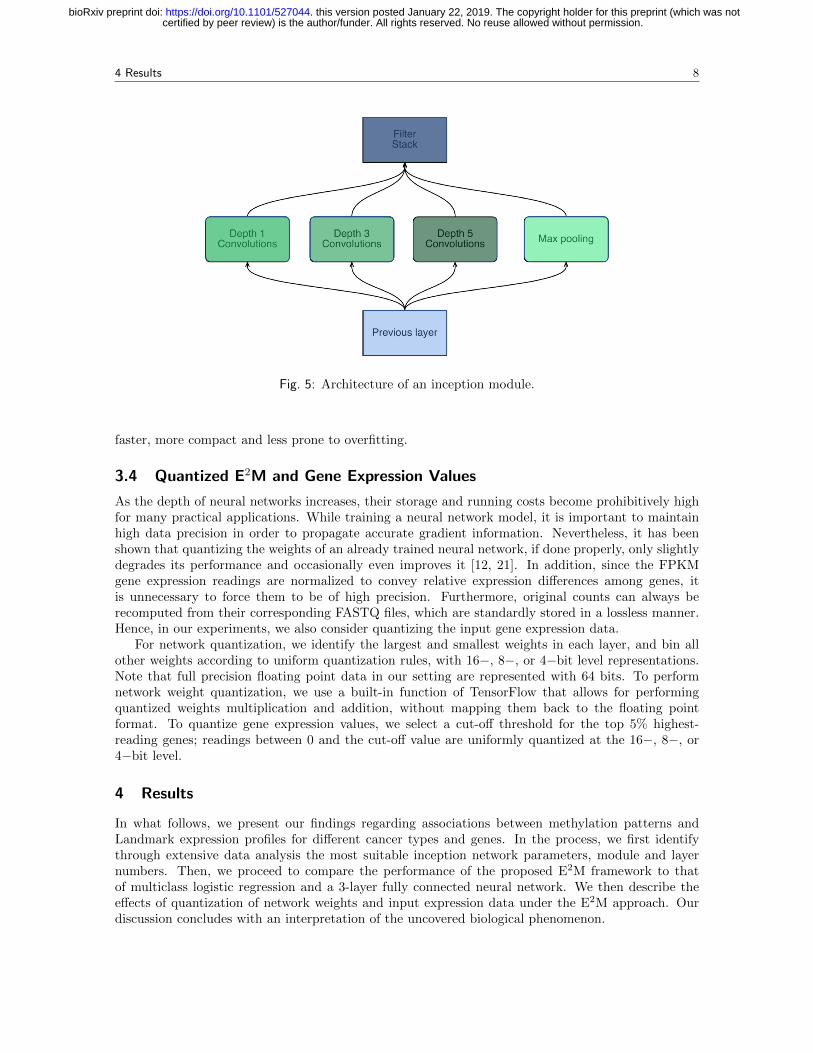
Inception networks include modules that mitigate certain problems encountered in simple fullyconnected networks (Figure 5). One such problem pertains to capturing long-distance interactionsbetween genes and correlations between their expressions, which can be addressed in part by addingconvolutions. However, since the interaction distance is not known a priori, it cannot be used to informthe choice of the depth of convolution. Inception modules therefore include multiple convolutions ofdifferent depths at the same layer. Another component is the filter stack, which aggregates the outputsof the convolutions and pooling layers, and feeds them to the next network layer. These features makeinception networks more robust and allow them to converge faster than traditional convolutionalneural networks.
E2M includes two 1D convolution and maxpooling layers that increase the number of filters andreduce the dimension of the feature space. These layers are followed by two inception modules of theform shown in Figure 5. This structure is terminated by a fully connected layer that “flattens” theoutput (i.e., converts a matrix into a vector via column concatenation) and a softmax layer that is usedto make the predictions. We point out that the largest contribution to the storage footprint of neuralnetwork learners comes from the fully connected layer that is densely connected. As a result, eventhough the E2M structure may appear to have higher description complexity than a fully connectednetwork, it actually uses fewer parameters than a 3-layer fully connected network, and is consequently
certified by peer review) is the author/funder. All rights reserved. No reuse allowed without permission. The copyright holder for this preprint (which was notthis version posted January 22, 2019. . https://doi.org/10.1101/527044doi: bioRxiv preprint
4 Results 8
Fig. 5: Architecture of an inception module.
faster, more compact and less prone to overfitting.
3.4 Quantized E2M and Gene Expression Values
As the depth of neural networks increases, their storage and running costs become prohibitively highfor many practical applications. While training a neural network model, it is important to maintainhigh data precision in order to propagate accurate gradient information. Nevertheless, it has beenshown that quantizing the weights of an already trained neural network, if done properly, only slightlydegrades its performance and occasionally even improves it [12, 21]. In addition, since the FPKMgene expression readings are normalized to convey relative expression differences among genes, itis unnecessary to force them to be of high precision. Furthermore, original counts can always berecomputed from their corresponding FASTQ files, which are standardly stored in a lossless manner.Hence, in our experiments, we also consider quantizing the input gene expression data.
For network quantization, we identify the largest and smallest weights in each layer, and bin allother weights according to uniform quantization rules, with 16−, 8−, or 4−bit level representations.Note that full precision floating point data in our setting are represented with 64 bits. To performnetwork weight quantization, we use a built-in function of TensorFlow that allows for performingquantized weights multiplication and addition, without mapping them back to the floating pointformat. To quantize gene expression values, we select a cut-off threshold for the top 5% highest-reading genes; readings between 0 and the cut-off value are uniformly quantized at the 16−, 8−, or4−bit level.
4 Results
In what follows, we present our findings regarding associations between methylation patterns andLandmark expression profiles for different cancer types and genes. In the process, we first identifythrough extensive data analysis the most suitable inception network parameters, module and layernumbers. Then, we proceed to compare the performance of the proposed E2M framework to thatof multiclass logistic regression and a 3-layer fully connected neural network. We then describe theeffects of quantization of network weights and input expression data under the E2M approach. Ourdiscussion concludes with an interpretation of the uncovered biological phenomenon.
certified by peer review) is the author/funder. All rights reserved. No reuse allowed without permission. The copyright holder for this preprint (which was notthis version posted January 22, 2019. . https://doi.org/10.1101/527044doi: bioRxiv preprint
4 Results 9
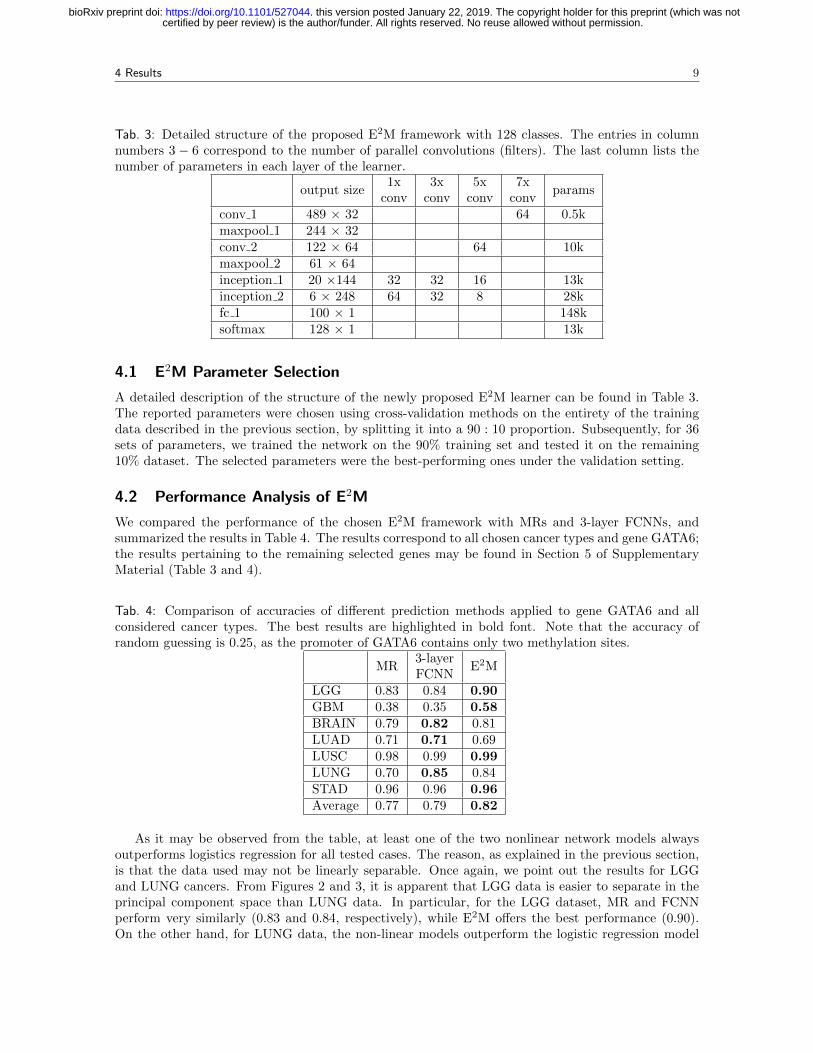
Tab. 3: Detailed structure of the proposed E2M framework with 128 classes. The entries in columnnumbers 3 − 6 correspond to the number of parallel convolutions (filters). The last column lists thenumber of parameters in each layer of the learner.
output size1x
conv3x
conv5x
conv7x
convparams
conv 1 489 × 32 64 0.5kmaxpool 1 244 × 32conv 2 122 × 64 64 10kmaxpool 2 61 × 64inception 1 20 ×144 32 32 16 13kinception 2 6 × 248 64 32 8 28kfc 1 100 × 1 148ksoftmax 128 × 1 13k
4.1 E2M Parameter Selection
A detailed description of the structure of the newly proposed E2M learner can be found in Table 3.The reported parameters were chosen using cross-validation methods on the entirety of the trainingdata described in the previous section, by splitting it into a 90 : 10 proportion. Subsequently, for 36sets of parameters, we trained the network on the 90% training set and tested it on the remaining10% dataset. The selected parameters were the best-performing ones under the validation setting.
4.2 Performance Analysis of E2M
We compared the performance of the chosen E2M framework with MRs and 3-layer FCNNs, andsummarized the results in Table 4. The results correspond to all chosen cancer types and gene GATA6;the results pertaining to the remaining selected genes may be found in Section 5 of SupplementaryMaterial (Table 3 and 4).
Tab. 4: Comparison of accuracies of different prediction methods applied to gene GATA6 and allconsidered cancer types. The best results are highlighted in bold font. Note that the accuracy ofrandom guessing is 0.25, as the promoter of GATA6 contains only two methylation sites.
MR3-layerFCNN
E2M
LGG 0.83 0.84 0.90GBM 0.38 0.35 0.58BRAIN 0.79 0.82 0.81LUAD 0.71 0.71 0.69LUSC 0.98 0.99 0.99LUNG 0.70 0.85 0.84STAD 0.96 0.96 0.96Average 0.77 0.79 0.82
As it may be observed from the table, at least one of the two nonlinear network models alwaysoutperforms logistics regression for all tested cases. The reason, as explained in the previous section,is that the data used may not be linearly separable. Once again, we point out the results for LGGand LUNG cancers. From Figures 2 and 3, it is apparent that LGG data is easier to separate in theprincipal component space than LUNG data. In particular, for the LGG dataset, MR and FCNNperform very similarly (0.83 and 0.84, respectively), while E2M offers the best performance (0.90).On the other hand, for LUNG data, the non-linear models outperform the logistic regression model
certified by peer review) is the author/funder. All rights reserved. No reuse allowed without permission. The copyright holder for this preprint (which was notthis version posted January 22, 2019. . https://doi.org/10.1101/527044doi: bioRxiv preprint

5 Discussion 10
by 15%. From the table, we also observe that in most cases our proposed inception network E2Mhas higher prediction accuracy than FCNN. For example, for LGG and GBM, E2M exhibits a 6%and 23% improvement over FCNN, respectively. Whenever FCNN outperforms E2M, the differencein performance is only about 1− 2%. Hence, E2M offers the best average performance among all themethods under consideration (additional results along the same line may be found in section 5 of theSupplementary Material).
Given that E2M offers the best average performance of all tested methods, we henceforth restrictour attention to this method only. Table 5 provides the performance results of E2M for all cancertypes and all selected genes (the biological relevance of the bold font and italic values will be describedin the Discussion section).
Tab. 5: Prediction accuracy of E2M for all considered cancer types and genes. The row RG lists theaccuracy of random guessing.
Gene MGMT MLH1 ATM GATA6 CASP8 KRAS TP53RG (0.008) (0.016) (0.0625) (0.25) (0.125) (0.016) (0.125)LGG 0.56 0.75 0.99 0.90 0.99 0.84 0.96GBM 0.31 0.61 0.92 0.58 0.88 0.80 1.00BRAIN 0.53 0.69 0.98 0.81 0.98 0.84 0.98LUAD 0.83 0.42 0.73 0.69 0.62 0.38 0.84LUSC 0.64 0.65 0.94 0.99 0.63 0.92 0.99LUNG 0.71 0.53 0.85 0.84 0.58 0.68 0.90STAD 0.65 0.44 0.84 0.96 0.63 0.79 0.95
4.3 Performance of the Quantized E2M Method
Table 6 shows an example of how quantization of network parameters and input data influences theprediction accuracy of E2M for all considered cancer types and genes. We only report on the resultsobtained using 16-bit uniform quantization of all network weights and 8-bit uniform quantization onthe expression input data (see section 6 in Supplementary Material for results with other quantizationlevels). For ease of data interpretation, the numbers in parenthesis correspond to the predictionaccuracy values without quantization. As it may be observed, there is almost no degradation inthe performance of the quantized E2M method, and in some cases, quantization even improves theprediction results. The only degradations observed are for GBM – gene GATA6, LUAD – gene ATM,and LUNG – gene CASP8. An explanation for this finding is described in the Discussion section.
We also remark that for the three cases with compromised performance under quantization, thepredicted patterns are at small Hamming distance from the correct one. In other cases, like GBMand gene GATA6, the Hamming distance between predicted patterns is at least two, and hence E2Mmay be quantized with even fewer bits while preserving prediction accuracy.
In conclusion, aggressive quantization in most cases leads to small prediction performance degra-dation, while providing significant storage savings: in the example provided, input data is reduced to1/8 of its size and the quantized E2M network can be stored using only 1/4 of the space needed forits unquantized counterpart.
5 Discussion
We start with a discussion that highlights the reason behind the variations in the performance ofvarious prediction methods for different genes and cancer types. We then proceed to interpret thesources of variation in a biological context.
The results previously presented in Table 5 reveal that the prediction accuracy of E2M varies widelyfor fixed genes and different cancer types. For example, the prediction accuracy for the methylation
certified by peer review) is the author/funder. All rights reserved. No reuse allowed without permission. The copyright holder for this preprint (which was notthis version posted January 22, 2019. . https://doi.org/10.1101/527044doi: bioRxiv preprint

5 Discussion 11
Tab. 6: Prediction accuracy of E2M with network weights quantized to 16 bits, and expression inputsquantized to 8 bits.
MGMT MLH1 ATM GATA6 CASP8 KRAS TP53
LGG0.55
(0.56)0.71
(0.75)0.99
(0.99)0.90
(0.90)0.99
(0.99)0.80
(0.84)0.97
(0.96)
GBM0.24
(0.31)0.52
(0.61)0.96
(0.92)0.36
(0.58)0.92
(0.88)0.86
(0.80)1.00
(1.00)
BRAIN0.47
(0.53)0.69
(0.69)0.98
(0.98)0.76
(0.81)0.98
(0.98)0.85
(0.84)0.97
(0.98)
LUAD0.82
(0.83)0.43
(0.42)0.64
(0.73)0.69
(0.69)0.55
(0.62)0.41
(0.38)0.81
(0.81)
LUSC0.61
(0.64)0.61
(0.65)0.96
(0.94)0.99
(0.99)0.61
(0.63)0.92
(0.92)0.99
(0.99)
LUNG0.73
(0.71)0.54
(0.53)0.84
(0.85)0.81
(0.84)0.44
(0.58)0.67
(0.68)0.91
(0.90)
STAD0.61
(0.65)0.37
(0.44)0.85
(0.84)0.95
(0.96)0.59
(0.63)0.76
(0.79)0.96
(0.95)
pattern of gene GATA6 in LUSC and STAD cancers is 0.99 and 0.96, respectively. On the other hand,for the same gene, the prediction accuracy for cancer types such as GBM and LUAD is significantlylower, around 0.6. To gain more insight as of why these variations in accuracy prediction arise, weplot the histograms for different methylation patterns of gene GATA6 in Figure 5. For the GATA6we observe only one dominant methylation pattern in LUSC and STAD. As a consequence, it isunsurprising that the prediction accuracy of the methylation pattern for cancer types LUSC andSTAD is close to one for all methods tested and presented in Table 4.
Interestingly, for the same gene GATA6 we observe 3 and 2 different methylation patterns in GBMand LUAD, respectively. The most likely methylation pattern for GBM has a frequency of about 40%,and this matches the performance of the logistic regression and the fully connected network methods.Indeed, a quick check of the results reveals that the two aforementioned methods almost always predictthe dominant methylation pattern. On the other hand, E2M is able to capture and predict some ofthe additional, non-dominant patterns, which is one of the reasons behind its significant performanceimprovement.
Similar results may be observed in Table 5 for other genes and methylation patterns. The blueand italic entries correspond to cases for which there is a unique dominant methylation pattern in thedata, and hence the prediction accuracy of E2M is high. The significantly more interesting results arelisted in red and bold font as they correspond to settings in which there is more than one dominantmethylation pattern, and E2M is able to capture at least one more pattern than the other investigatedmethods. The histograms for all other cancer types and genes considered in the study may be foundin Section 3 of the Supplementary Material.
The previous discussion reveals that for different combinations of genes and cancer types one ei-ther observes a single dominant or multiple methylation patterns (as many as 12, for the case of geneMGMT and all cancers considered). Let us turn our attention back to Table 5. For example, the pro-moter regions of gene TP53 and ATM exhibit one dominant methylation pattern (0, unmethylated)across all considered cancer types, while the observed Landmark gene expression profiles differ signifi-cantly. This suggests that methylation in TP53 and ATM is most often not the cause of characteristicchanges in expression values, and that other regulatory phenomena and point and copy-number mu-tations may be at work. On the other hand, the promoter regions of genes MLH1, MGMT, CASP8and KRAS exhibits multiple methylation patterns across all cancer types, with no clear dominantpattern; and, the methylation patterns in MLH1, GATA6 and MGMT associate strongly with thecorresponding Landmark gene expressions.
certified by peer review) is the author/funder. All rights reserved. No reuse allowed without permission. The copyright holder for this preprint (which was notthis version posted January 22, 2019. . https://doi.org/10.1101/527044doi: bioRxiv preprint

5 Discussion 12
(a) LUSC and gene GATA6 (b) STAD and gene GATA6
(c) GBM and gene GATA6 (d) LUAD and gene GATA6
Fig. 6: Histograms of methylation patterns present in the promoter of gene GATA6 for cancer typesa) LUSC, b) STAD, c) GBM, and d) LUAD.
For a more in-depth explanation of these events, we consider BRAIN cancer and gene GATA6 asan illustrative example. Figure 7 shows the heatmap of the expression data of the Landmark genes(left column), as well as the top 15 varying genes (right column), across four types of methylationpatterns found in the promoter region of gene GATA6. The horizontal lines in each plot separatesthe different methylation patterns, sorted by their decimal representation, and the color of each gridrepresents the magnitude of FPKM readings of the corresponding gene. The right column revealsthat the expression level of genes ALDOC, GAPDH, SPP1, APOE, and HLA-DRA change jointly inresponse to different methylation patterns.
To test if the interactions amongst these genes are due to chance, we performed an enrich-ment analysis for the selected genes using the pathway datasets KEGG, Biocarta, GeneSigDB, andReactome. For each pathway, we performed a Fisher exact test with a Null hypothesis assum-ing mutual independence of the gene variables in the query set. We computed the p-values af-ter multiple testing correction, and only selected those with a False Discovery Rate (FDR) lessthan 0.05. The pathways related to BRAIN cancer (identified through rejection of Null) are theKEGG ALZHEIMERS DISEASE (from KEGG), the REACTOME GLUCOSE METABOLISM, theMETABOLISM OF CARBOHYDRATES (from Reactome) and the Mouse Brain Johansson and genesUpRegulatedbyHypoxia (from GeneSigDB). It is known from previously reported studies that thesepathways are indeed involved in the progression of brain cancer [28, 16, 26, 27].
In summary, our most important biological finding is that patterns of methylation sites, rather thanthe global methylation status of a gene (methylated or unmethylated) alone, govern Landmark andglobal gene expressions. This observation is strongly supported by the good predictive performance
certified by peer review) is the author/funder. All rights reserved. No reuse allowed without permission. The copyright holder for this preprint (which was notthis version posted January 22, 2019. . https://doi.org/10.1101/527044doi: bioRxiv preprint

6 Conclusion 13
Fig. 7: Heatmap of cancer type BRAIN and gene GATA6.
of E2M on the CASP8 gene for LUAD and STAD, and the MLH1 gene for STAD. In both cases, atleast two patterns which are both deemed globally methylated can be accurately distinguished fromeach other thought their expression profile.
6 Conclusion
We proposed an inception based deep learning framework, termed E2M, capable of associating specificmethylation patterns in gene promoter regions with Landmark and consequently global gene expres-sion. We tested the proposed framework on TCGA data including five cancer types, and the promoterregions of seven genes. Our findings were two-fold. First, we showed that the proposed E2M frame-work outperforms multiclass logistics regression and 3-layer fully connected network in predictionaccuracy. Furthermore, the performance of E2M was shown not to be affected by quantization of boththe input data and the weights of the inception network. Second, we found that methylation of sometumor suppressor genes does not bear a detectable influence on the expression profiles; at the sametime, different methylation patterns in the promoter regions of the same gene can lead to observablechanges in the gene expressions, even when the patterns result in the same binary methylation status.
As a final remark, we point out that E2M is a general learning framework that may be successfullyapplied to other multiomics data association studies and single cell researches [2].
Acknowledgements
The authors are grateful to Mikel Hernaez from the University of Illinois for many useful discussionsand for providing the gene enrichment analysis results.
Funding
This work was supported by the grants SVCF CZI 2018-182799 and 2018-182797 from the ChanZuckerberg Initiative DAF, SRI grant from the University of Illinois at Urbana-Champaign, the BD2K
certified by peer review) is the author/funder. All rights reserved. No reuse allowed without permission. The copyright holder for this preprint (which was notthis version posted January 22, 2019. . https://doi.org/10.1101/527044doi: bioRxiv preprint
6 Conclusion 14
NIH 3U01CA198943-02S1 grant for Targeted Software Development and the grant 1624790 from NSFI/UCRC CCBGM Center at the University of Illinois.
References
[1] Ash A Alizadeh, Michael B Eisen, R Eric Davis, Chi Ma, Izidore S Lossos, Andreas Rosenwald,Jennifer C Boldrick, Hajeer Sabet, Truc Tran, Xin Yu, et al. Distinct types of diffuse large b-celllymphoma identified by gene expression profiling. Nature, 403(6769):503, 2000.
[2] Christof Angermueller, Heather J Lee, Wolf Reik, and Oliver Stegle. Deepcpg: accurate predictionof single-cell dna methylation states using deep learning. Genome biology, 18(1):67, 2017.
[3] Kartik Audhkhasi, Osonde Osoba, and Bart Kosko. Noise benefits in backpropagation and deepbidirectional pre-training. In Neural Networks (IJCNN), The 2013 International Joint Conferenceon, pages 1–8. IEEE, 2013.
[4] David G Beer, Sharon LR Kardia, Chiang-Ching Huang, Thomas J Giordano, Albert M Levin,David E Misek, Lin Lin, Guoan Chen, Tarek G Gharib, Dafydd G Thomas, et al. Gene-expressionprofiles predict survival of patients with lung adenocarcinoma. Nature medicine, 8(8):816, 2002.
[5] Ittai Ben-Porath, Matthew W Thomson, Vincent J Carey, Ruping Ge, George W Bell, AvivRegev, and Robert A Weinberg. An embryonic stem cell–like gene expression signature in poorlydifferentiated aggressive human tumors. Nature genetics, 40(5):499, 2008.
[6] Adrian P Bird. Cpg-rich islands and the function of dna methylation. Nature, 321(6067):209–213,1986.
[7] Andrea H Brand and Norbert Perrimon. Targeted gene expression as a means of altering cellfates and generating dominant phenotypes. development, 118(2):401–415, 1993.
[8] Yifei Chen, Yi Li, Rajiv Narayan, Aravind Subramanian, and Xiaohui Xie. Gene expressioninference with deep learning. Bioinformatics, 32(12):1832–1839, 2016.
[9] David R Cox. The regression analysis of binary sequences. Journal of the Royal Statistical Society.Series B (Methodological), pages 215–242, 1958.
[10] Kathleen M Fisch, Tobias Meißner, Louis Gioia, Jean-Christophe Ducom, Tristan M Carland,Salvatore Loguercio, and Andrew I Su. Omics pipe: a community-based framework for repro-ducible multi-omics data analysis. Bioinformatics, 31(11):1724–1728, 2015.
[11] Suyog Gupta, Ankur Agrawal, Kailash Gopalakrishnan, and Pritish Narayanan. Deep learningwith limited numerical precision. In International Conference on Machine Learning, pages 1737–1746, 2015.
[12] Song Han, Huizi Mao, and William J Dally. Deep compression: Compressing deep neural networkswith pruning, trained quantization and huffman coding. arXiv preprint arXiv:1510.00149, 2015.
[13] David R Hardoon, Sandor Szedmak, and John Shawe-Taylor. Canonical correlation analysis: Anoverview with application to learning methods. Neural computation, 16(12):2639–2664, 2004.
[14] James G Herman, Jeremy R Graff, SBDN Myohanen, Barry D Nelkin, and Stephen B Baylin.Methylation-specific pcr: a novel pcr assay for methylation status of cpg islands. Proceedings ofthe national academy of sciences, 93(18):9821–9826, 1996.
[15] Rudolf Jaenisch and Adrian Bird. Epigenetic regulation of gene expression: how the genomeintegrates intrinsic and environmental signals. Nature genetics, 33:245, 2003.
certified by peer review) is the author/funder. All rights reserved. No reuse allowed without permission. The copyright holder for this preprint (which was notthis version posted January 22, 2019. . https://doi.org/10.1101/527044doi: bioRxiv preprint

6 Conclusion 15
[16] Fredrik K Johansson, Josefin Brodd, Charlotta Eklof, Maria Ferletta, Goran Hesselager, Carl-Fredrik Tiger, Lene Uhrbom, and Bengt Westermark. Identification of candidate cancer-causinggenes in mouse brain tumors by retroviral tagging. Proceedings of the National Academy ofSciences, 101(31):11334–11337, 2004.
[17] Aurelie Kamoun, Ahmed Idbaih, Caroline Dehais, Nabila Elarouci, Catherine Carpentier, EricLetouze, Carole Colin, Karima Mokhtari, Anne Jouvet, Emmanuelle Uro-Coste, et al. Integratedmulti-omics analysis of oligodendroglial tumours identifies three subgroups of 1p/19q co-deletedgliomas. Nature communications, 7:11263, 2016.
[18] Alona Levy-Jurgenson, Xavier Tekpli, Vessela N Kristensen, and Zohar Yakhini. Predictingmethylation from sequence and gene expression using deep learning with attention. bioRxiv, page491357, 2018.
[19] Yihua Liu, Yuan Ji, and Peng Qiu. Identification of thresholds for dichotomizing dna methylationdata. EURASIP Journal on Bioinformatics and Systems Biology, 2013(1):8, 2013.
[20] Nasser M Nasrabadi. Pattern recognition and machine learning. Journal of electronic imaging,16(4):049901, 2007.
[21] Mohammad Rastegari, Vicente Ordonez, Joseph Redmon, and Ali Farhadi. Xnor-net: Imagenetclassification using binary convolutional neural networks. In European Conference on ComputerVision, pages 525–542. Springer, 2016.
[22] Douglas T Ross, Uwe Scherf, Michael B Eisen, Charles M Perou, Christian Rees, Paul Spellman,Vishwanath Iyer, Stefanie S Jeffrey, Matt Van de Rijn, Mark Waltham, et al. Systematic variationin gene expression patterns in human cancer cell lines. Nature genetics, 24(3):227, 2000.
[23] Henry A Rowley, Shumeet Baluja, and Takeo Kanade. Neural network-based face detection.IEEE Transactions on pattern analysis and machine intelligence, 20(1):23–38, 1998.
[24] Serge Saxonov, Paul Berg, and Douglas L Brutlag. A genome-wide analysis of cpg dinucleotidesin the human genome distinguishes two distinct classes of promoters. Proceedings of the NationalAcademy of Sciences, 103(5):1412–1417, 2006.
[25] Christopher E Schlosberg, Nathan D VanderKraats, and John R Edwards. Modeling complexpatterns of differential dna methylation that associate with gene expression changes. Nucleicacids research, 45(9):5100–5111, 2017.
[26] Sascha Seidel, Boyan K Garvalov, Valtteri Wirta, Louise von Stechow, Anne Schanzer, Kon-stantinos Meletis, Marietta Wolter, Daniel Sommerlad, Anne-Theres Henze, Monica Nister, et al.A hypoxic niche regulates glioblastoma stem cells through hypoxia inducible factor 2α. Brain,133(4):983–995, 2010.
[27] Thomas N Seyfried and Purna Mukherjee. Targeting energy metabolism in brain cancer: reviewand hypothesis. Nutrition & metabolism, 2(1):30, 2005.
[28] TN Seyfried, TM Sanderson, MM El-Abbadi, R McGowan, and P Mukherjee. Role of glucose andketone bodies in the metabolic control of experimental brain cancer. British journal of cancer,89(7):1375, 2003.
[29] Ritambhara Singh, Jack Lanchantin, Gabriel Robins, and Yanjun Qi. Deepchrome: deep-learningfor predicting gene expression from histone modifications. Bioinformatics, 32(17):i639–i648, 2016.
[30] Therese Sørlie, Charles M Perou, Robert Tibshirani, Turid Aas, Stephanie Geisler, Hilde Johnsen,Trevor Hastie, Michael B Eisen, Matt Van De Rijn, Stefanie S Jeffrey, et al. Gene expressionpatterns of breast carcinomas distinguish tumor subclasses with clinical implications. Proceedingsof the National Academy of Sciences, 98(19):10869–10874, 2001.
certified by peer review) is the author/funder. All rights reserved. No reuse allowed without permission. The copyright holder for this preprint (which was notthis version posted January 22, 2019. . https://doi.org/10.1101/527044doi: bioRxiv preprint

6 Conclusion 16
[31] Christian Szegedy, Wei Liu, Yangqing Jia, Pierre Sermanet, Scott Reed, Dragomir Anguelov,Dumitru Erhan, Vincent Vanhoucke, and Andrew Rabinovich. Going deeper with convolutions.In Proceedings of the IEEE conference on computer vision and pattern recognition, pages 1–9,2015.
certified by peer review) is the author/funder. All rights reserved. No reuse allowed without permission. The copyright holder for this preprint (which was notthis version posted January 22, 2019. . https://doi.org/10.1101/527044doi: bioRxiv preprint