dynamics of water consumption changes in a tourist … of water.pdf · 46 dynamics of water...
TRANSCRIPT
46
DYNAMICS OF WATER CONSUMPTION CHANGES IN A TOURIST RESORT
Izabela Bartkowska1
1 Chair of Environment Engineering Systems, Faculty of Civil and Environmental Engineering, Bialystok University of Technology, Wiejska 45 A, 15-351 Białystok, Poland, e-mail: [email protected]
INTRODUCTION
Water as a cultural symbol is one of the four elements. Nowadays as a useful substance it has many uses. It is used daily for household pur-poses, in industry and agriculture. One can hardly imagine life without it. Although our planet is up to 70% covered with water, it does not mean it is generally abundant. Water resources in individual regions are differentiated and the water deficit is pretty often. Our country with its water resource coefficient of 1460 m3/inhabitant per year is per-ceived as one, where water deficit occurs and can be compared e.g. to Egypt [Hotloś et al 2012]. For this reason in the near future a more efficient and economic use of water will be preferred. A per-
Journal of Ecological EngineeringVolume 15, No. 4, Oct. 2014, pages 46–54DOI: 10.12911/22998993.1125457 Research Article
ABSTRACTThis work presents problems related to the water consumption in the city of Olecko situated in the north-east part of Poland in the Warmińsko-Mazurskie Province of the country, at the eastern border of the Mazurian Lake District along the trail connecting the land of the Large Mazurian Lakes with the Suwalsko-Augustowskie Lake District.Over 2011–2012 water extraction to the municipal water supply network was studied. The volume of water extracted every day was analyzed and the gathered volumes were analyzed statistically. The varying water extraction was also studied. The ob-tained results were presented in a graphic form. Basing on the descriptive stats and prepared diagrams certain general conclusions were drawn and the collected study figures and facts were summed up. This allowed to determine days of the highest and lowest water consumption. Also months of extreme water extraction and consumption were determined. The water extraction ranged from 1641 m3/24h to 2607 m3/24h, at an average value of 2077.4 m3/24h. Over the period under study the day of the larg-est water extraction and consumption was in July and the day of the lowest water extraction and consumption in December. During a week inhabitants used the highest water amount on Saturdays and the lowest on Sundays and other feast-days. Basing on the conducted measurements also the coefficient of water consumption per capita was determined. The fluctuation of this coefficient was identical as that for the water consumption. Within the period of study it ranged from 73.3 l/M 24h to 116.5 l/M 24h. The average value of the specific water consumption was 92.8 l/M 24h. For the sake of discussion the obtained results were compared with observations across the country.
Keywords: indicators, tap water, variation trends, water consumption, water require-ment index, water supply system.
Received: 2014.07.20Accepted: 2014.08.12Published: 2014.10.07
manent monitoring both of water resources and its distribution contributes to a better efficiency of its use and distribution.
Ever-accelerating progress of the technol-ogy, ever-higher standard of living and people’s awareness are reasons that we witness changes to the water supply systems. Water consumption is a very important issue both from a cognitive and practical point of view. These issues are essential particularly for engineering nowadays when the deficit of water resources is growing.
Many scientists point to a new economic situ-ation in Poland since 1989; we witness a drop in water consumption by all groups of water users. Therefore, one can assess that with ubiquitous water resources deficit implementing of the mar-
47
Journal of Ecological Engineering vol. 15(3), 2014
ket economy contributed seemingly to savings in this sector. Water consumption coefficients for the economy and population decreased signifi-cantly [Biedugnis et al. 2007, Budziło et al. 2005, Hotloś 2010, Kuczyński, Żuchowicki 2010, Podwójci et al. 2011, Żuchowicki, Gawin 2010, Żuchowicki, Kuczyński 2009, Żuchowicki, Tel-ega 2010]. A more rational water management by users caused market-dependent water prices, a general metering of water consumption or the use of more-and-more modern and saving draw-off valves and taps. Important is also a better awareness of a consumer of advantages brought about by a rational water use or using showers, automatic washing machines and dishwashers. A falling trend of water consumption did not al-ways comport with revamping and reconstruction of water supply systems. Water systems, which were designed much earlier, turned out to be sig-nificantly over-designed, with this overdesigning causing the flow speed to decrease. This decreased flow speed leads in turn to extensive scale, which causes secondary water contamination, increases the pipeline roughness and decreases the pipline throughput. This, in turn, very often causes an in-crease in the unit energe-consumption. In addi-tion, water dwells in the system longer, therefore, the risk of its secondary contamination grows.
The analysis of this situation points to the need of a re-verification of earlier forecasts of the demand for water. A proper determination of the variation of the water consumption depending on time and place is essential for determination and calculation of a water supply system. Determi-nation of real hydraulic parameters of the water supply system operation is important both for op-erational and economic reasons. It is noticed after years of observations that the trend of water con-sumption drop has weakened [Szopińska, Pasela 2009, Żuchowicki, Gawin 2013, Żuchowicki, Te-lega 2010]. Therefore, we have to take into account the need to verify the indicators adopted for de-termination of hydraulic parameters of previously designed and already existing and operated water systems. The determination of these factors shall be based on the volume of water distribution and consumption which after years of a falling trend remain at the same level. The purpose of this pa-per is to present the water draw-off amount on the example of the town of Olecko, and basing on the analysis of collected data determination of the wa-ter draw-off season dependency and observation of changes within the period of the conducted study.
AUTHOR’S STUDY
The study was carried out in Olecko, a town in the north-east part of Poland in the Warmian and Masurian province. The town is situated on the east end of the Masurian Lake District (Po-jezierze Mazurskie) on the trail joining the Ma-surian Great Lake Land (Kraina Wielkich Jezior Mazurskich) with the Suwalsko-Augustowskie Lake District (Pojezierze Suwalsko-Augus-towskie). It is a significant recreation and vaca-tion region. The town is both the seat and the capital of the district.
CHARACTERISTIC OF THE STUDY SUBJECT AND THE METHODOLOGY
Between 2007 and 2011 a project including a rational reorganisation of the water & waste water management was realised. Under the proj-ect the waste water treatment plant and the water supply network were extended, the waste water treatment plant was modernized and the sewage system was repaired.
The water treatment plant is suplied from 6 deep wells tapping quaternary water form a depth of 45–74 m under the ground level. After extension works the capacity of the water treat-ment plant is 3200 m3/24 h. The water treatment process bases on aeration and filtration. The total length of the water supply network is 211.6 km.
The research was carried out in 2011–2012. The 24h water take-up was analyzed. The results were recorded with a MAGFLO – Danfos elec-tromagnetic flowmeter. For the analysis a 24h water supply to the network was assumed. Water is used mainly for household needs of the popu-lation. Tapping water from the network by few industrial facilities is low.
RESULTS AND DISCUSSION
Collected study results were subjected to a statistical anlysis. The author was using the pro-gram STATISTICA and the calcualtion sheet Excel. Values of selected desription stats are pre-sented in Table 1.
Within the research study the average water supply to the municipal water supply network in Olecko was 20774 m3/24h. The recorded mini-mum water supply was down to 26070 m3/24h on Sunday, December 11. The maximum water
Journal of Ecological Engineering vol. 15(3), 2014
48
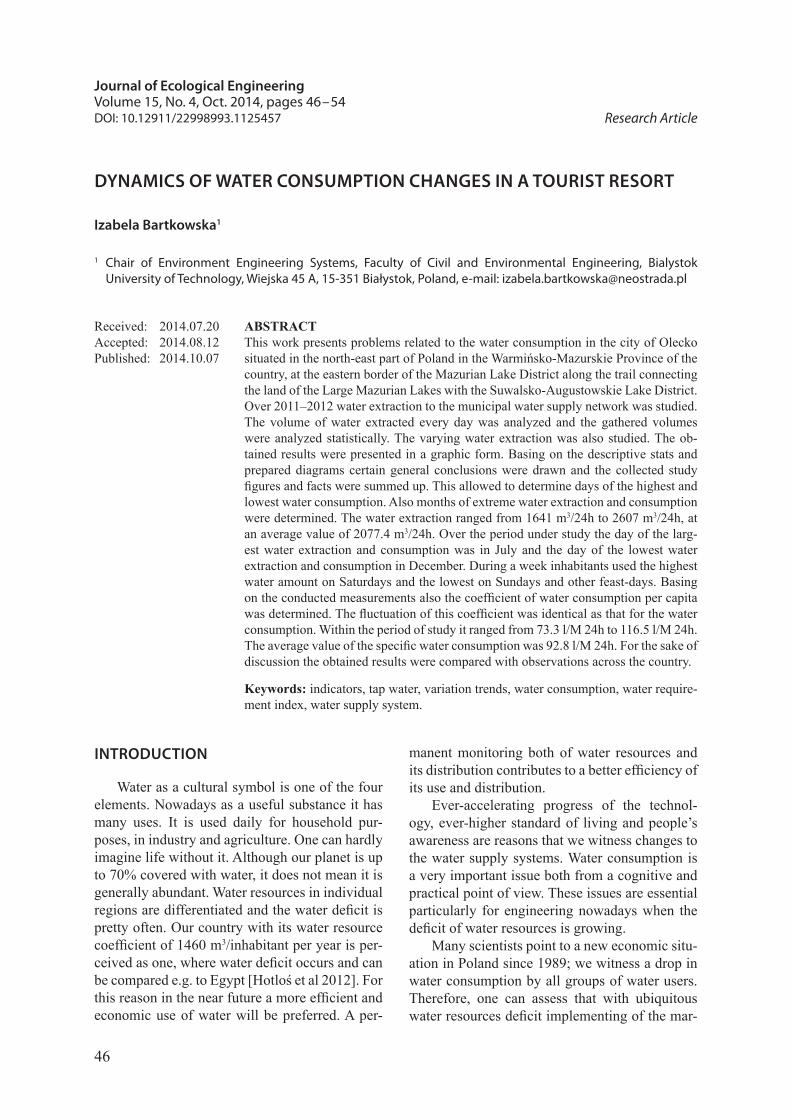
supply was up to 2607.0 m3/24h on Saturday, July 21. The median from the test as a consistent and asymptotically unloaded estimator of an ex-pected value amounts to 20685 m3/24h and it is as well a value below and above which exactly the half of observations is situated. A value of the water supply occuring most often is 1967.0 m3/24h. The analysis of the 24h water supplies is characterized by a small right-hand asymmetry being confirmed by the skewness factor of 0.246. The distribution is approximately a normal one and this is confirmed by the Shapiro-Wilk test, for which W = 0.9935, and p = 0.0643. The 24h distrubution of the water supply is presented in a histogram in Figure 1.
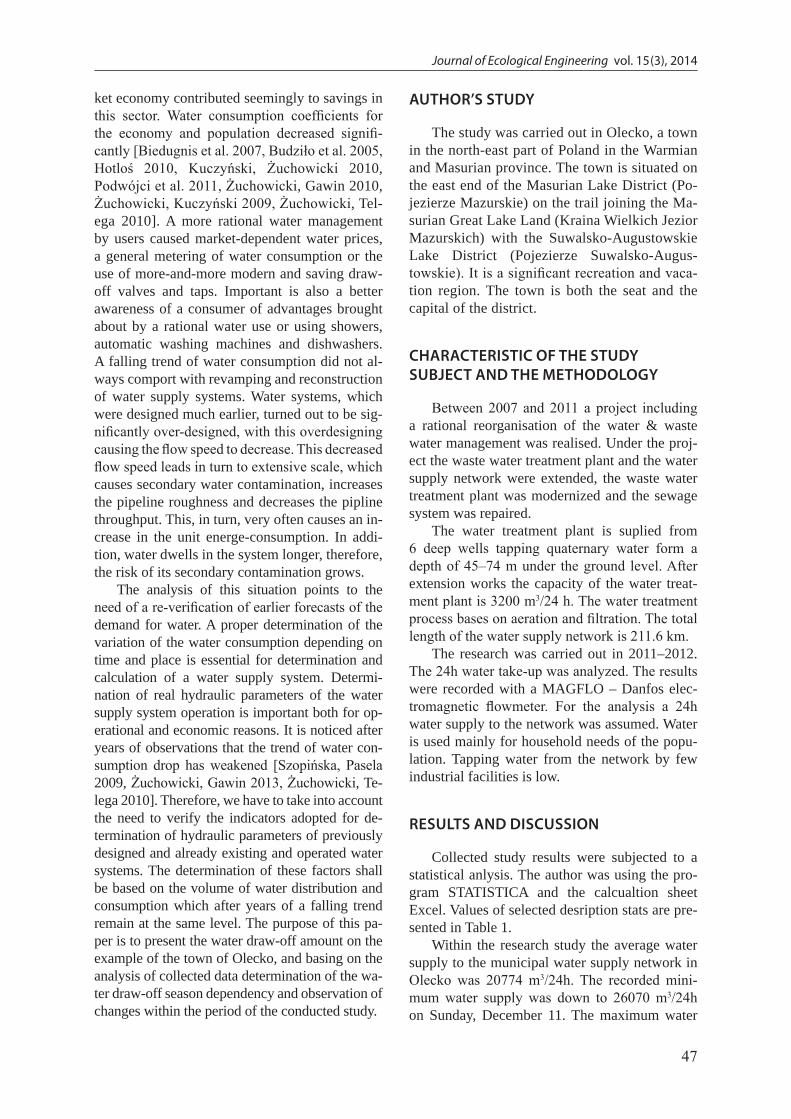
Basing on the diagram one can see that most of the recorded values fall within 1800.0 m3/24h and 2300.0 m3/24h. Also the average value, the median and the mode occurs inside this range. In order to determine the diversity of the analyzed values the variance and the standard deviation were computed (Table 1). Obtained results al-lowed to recognize the studied set of values as uniform. The calculated percentiles allow stating that the probability of the occurrence of a water supply lower than 850.0 m3/24h and higher than 2310.0 m3/24h is 10%. The character of the water supply variation during the period under study is shown in Figure 2.
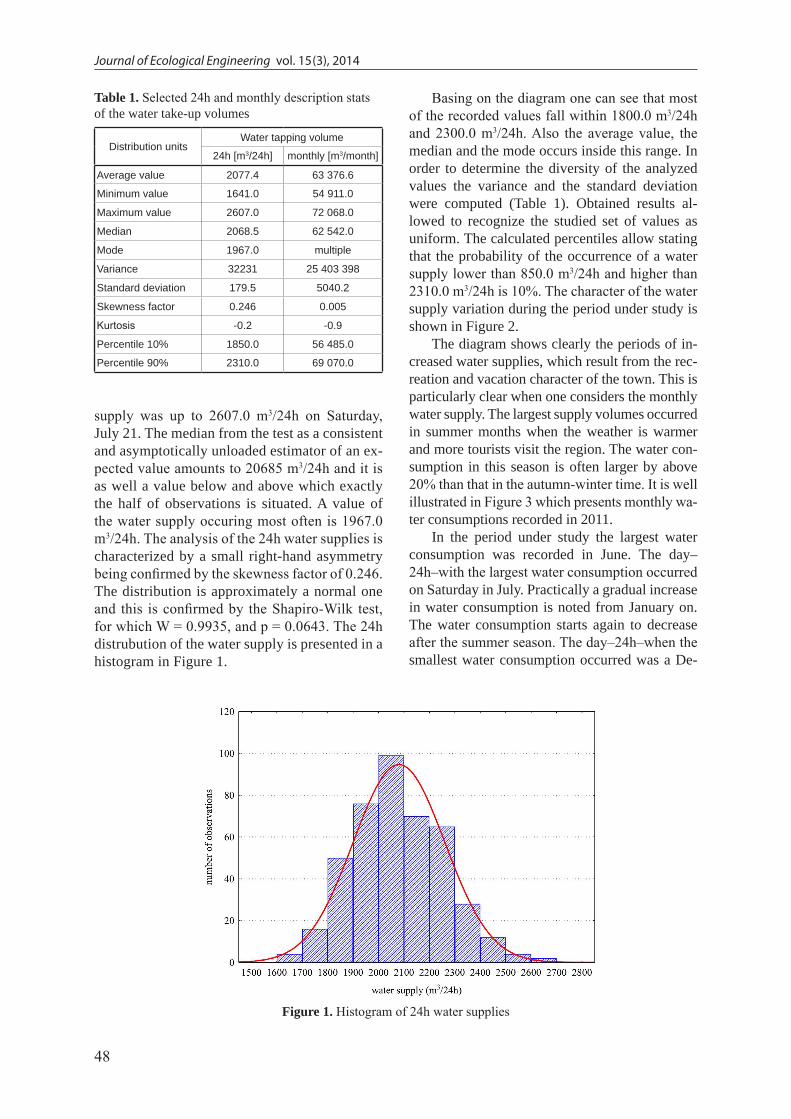
The diagram shows clearly the periods of in-creased water supplies, which result from the rec-reation and vacation character of the town. This is particularly clear when one considers the monthly water supply. The largest supply volumes occurred in summer months when the weather is warmer and more tourists visit the region. The water con-sumption in this season is often larger by above 20% than that in the autumn-winter time. It is well illustrated in Figure 3 which presents monthly wa-ter consumptions recorded in 2011.
In the period under study the largest water consumption was recorded in June. The day–24h–with the largest water consumption occurred on Saturday in July. Practically a gradual increase in water consumption is noted from January on. The water consumption starts again to decrease after the summer season. The day–24h–when the smallest water consumption occurred was a De-
Table 1. Selected 24h and monthly description stats of the water take-up volumes
Distribution unitsWater tapping volume
24h [m3/24h] monthly [m3/month]
Average value 2077.4 63 376.6
Minimum value 1641.0 54 911.0
Maximum value 2607.0 72 068.0
Median 2068.5 62 542.0
Mode 1967.0 multiple
Variance 32231 25 403 398
Standard deviation 179.5 5040.2
Skewness factor 0.246 0.005
Kurtosis -0.2 -0.9
Percentile 10% 1850.0 56 485.0
Percentile 90% 2310.0 69 070.0
Figure 1. Histogram of 24h water supplies
49
Journal of Ecological Engineering vol. 15(3), 2014
cember Sunday. The occurrence of this phenom-enon was observed also in other tourist and health resorts, such as Krynica [Budziło et al. 2005], Kołobrzeg [Usidus, Filon 2011] or Ustka [Usidus, Litewka 2013]. The season dependence of water consumption are reported as well by other authors and concern not only resorts attractive for tour-ists [Hotloś et al. 2012, Kuczyński, Żuchowicki 2010, Sawicka-Siarkiewicz, Gmitrzuk 2010, Tchórzewska-Cieślak 2005, Usidus, Drozdowicz 2010, Żuchowicki, Kuczyński 2009]. Apart from the said season of the year dependence there are
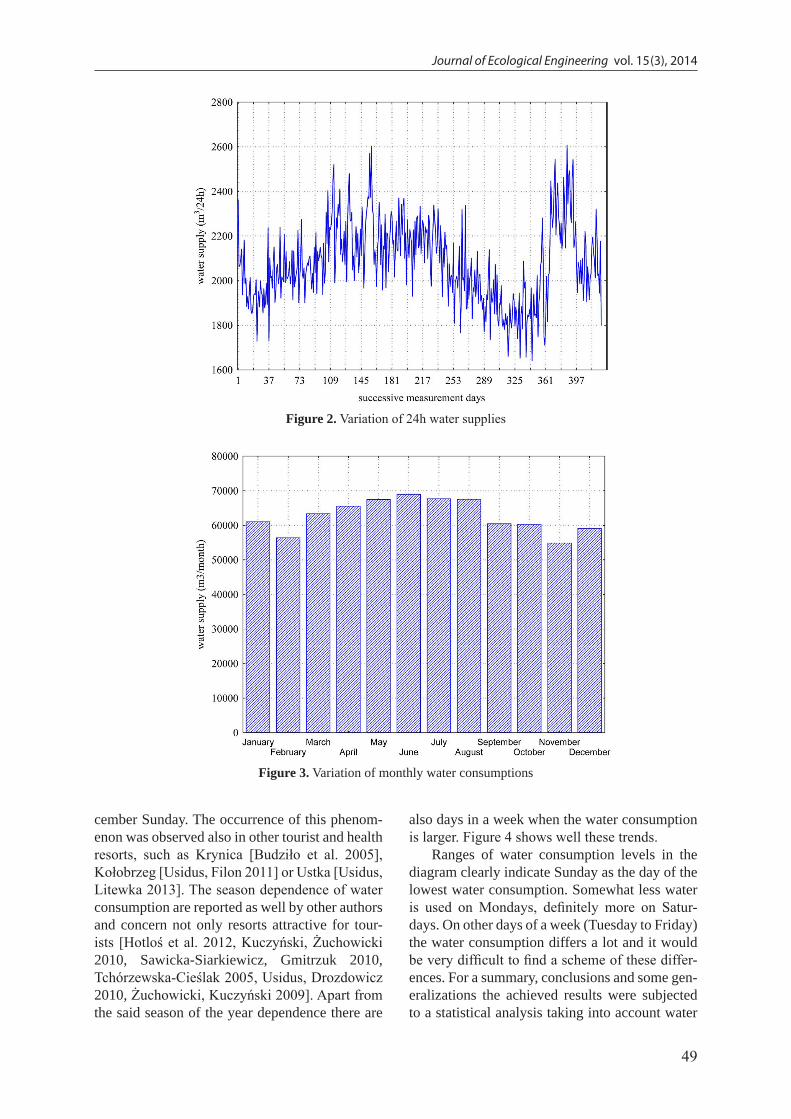
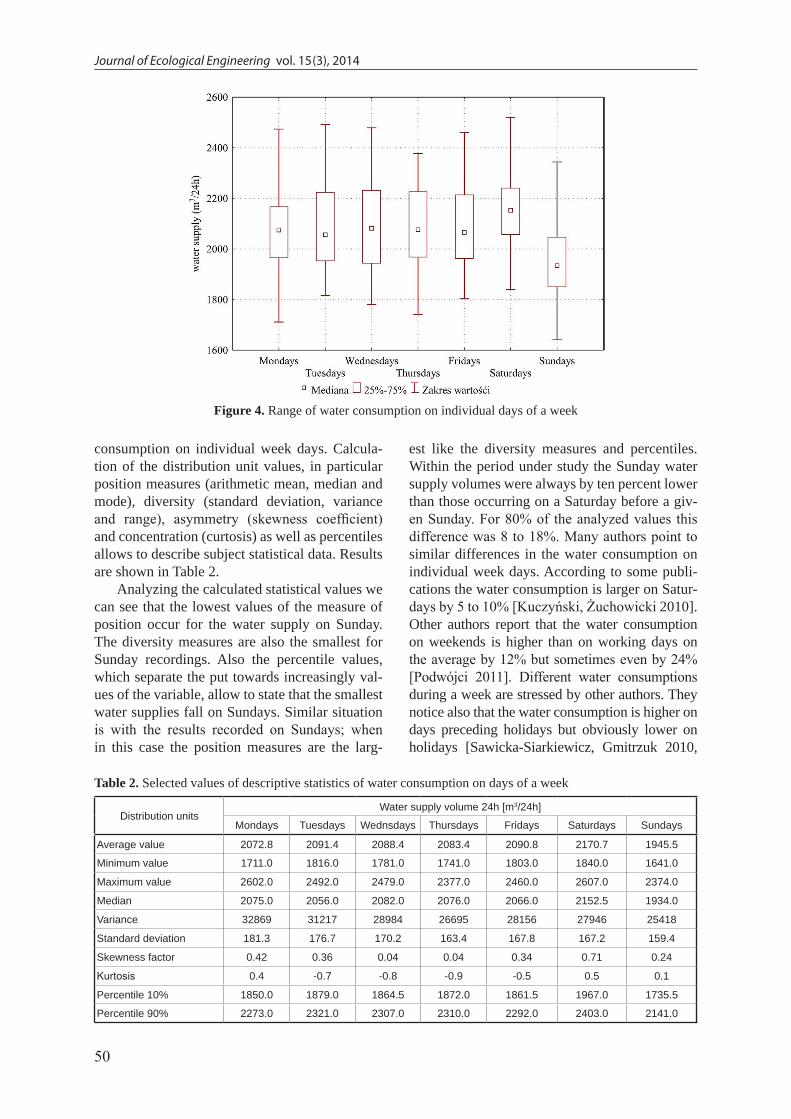
also days in a week when the water consumption is larger. Figure 4 shows well these trends.
Ranges of water consumption levels in the diagram clearly indicate Sunday as the day of the lowest water consumption. Somewhat less water is used on Mondays, definitely more on Satur-days. On other days of a week (Tuesday to Friday) the water consumption differs a lot and it would be very difficult to find a scheme of these differ-ences. For a summary, conclusions and some gen-eralizations the achieved results were subjected to a statistical analysis taking into account water
Figure 2. Variation of 24h water supplies
Figure 3. Variation of monthly water consumptions
Journal of Ecological Engineering vol. 15(3), 2014
50
consumption on individual week days. Calcula-tion of the distribution unit values, in particular position measures (arithmetic mean, median and mode), diversity (standard deviation, variance and range), asymmetry (skewness coefficient) and concentration (curtosis) as well as percentiles allows to describe subject statistical data. Results are shown in Table 2.
Analyzing the calculated statistical values we can see that the lowest values of the measure of position occur for the water supply on Sunday. The diversity measures are also the smallest for Sunday recordings. Also the percentile values, which separate the put towards increasingly val-ues of the variable, allow to state that the smallest water supplies fall on Sundays. Similar situation is with the results recorded on Sundays; when in this case the position measures are the larg-
est like the diversity measures and percentiles. Within the period under study the Sunday water supply volumes were always by ten percent lower than those occurring on a Saturday before a giv-en Sunday. For 80% of the analyzed values this difference was 8 to 18%. Many authors point to similar differences in the water consumption on individual week days. According to some publi-cations the water consumption is larger on Satur-days by 5 to 10% [Kuczyński, Żuchowicki 2010]. Other authors report that the water consumption on weekends is higher than on working days on the average by 12% but sometimes even by 24% [Podwójci 2011]. Different water consumptions during a week are stressed by other authors. They notice also that the water consumption is higher on days preceding holidays but obviously lower on holidays [Sawicka-Siarkiewicz, Gmitrzuk 2010,
Figure 4. Range of water consumption on individual days of a week
Table 2. Selected values of descriptive statistics of water consumption on days of a week
Distribution unitsWater supply volume 24h [m3/24h]
Mondays Tuesdays Wednsdays Thursdays Fridays Saturdays Sundays
Average value 2072.8 2091.4 2088.4 2083.4 2090.8 2170.7 1945.5
Minimum value 1711.0 1816.0 1781.0 1741.0 1803.0 1840.0 1641.0
Maximum value 2602.0 2492.0 2479.0 2377.0 2460.0 2607.0 2374.0
Median 2075.0 2056.0 2082.0 2076.0 2066.0 2152.5 1934.0
Variance 32869 31217 28984 26695 28156 27946 25418
Standard deviation 181.3 176.7 170.2 163.4 167.8 167.2 159.4
Skewness factor 0.42 0.36 0.04 0.04 0.34 0.71 0.24
Kurtosis 0.4 -0.7 -0.8 -0.9 -0.5 0.5 0.1
Percentile 10% 1850.0 1879.0 1864.5 1872.0 1861.5 1967.0 1735.5
Percentile 90% 2273.0 2321.0 2307.0 2310.0 2292.0 2403.0 2141.0
51
Journal of Ecological Engineering vol. 15(3), 2014
Tchórzewska-Cieślak 2005, Usidus, Filon 2011, Usidus, Litewka 2013]. Schemes we watch do not depend on the size of a city or its character; they are first of all the result of the behaviour and manners of their inhabitants.
The 24h water supply volumes under study are characterized by a non-accidental order; suc-cessive values in the set of analyzed values rep-resent successive measurements made at equal time intervals. In order to examine the phenom-enon represented by the observation sequence we can use the analysis of time series [Ciężak et al 2011]. Thanks to this analysis the dynamics of the water supply within the study period will be better recognized.
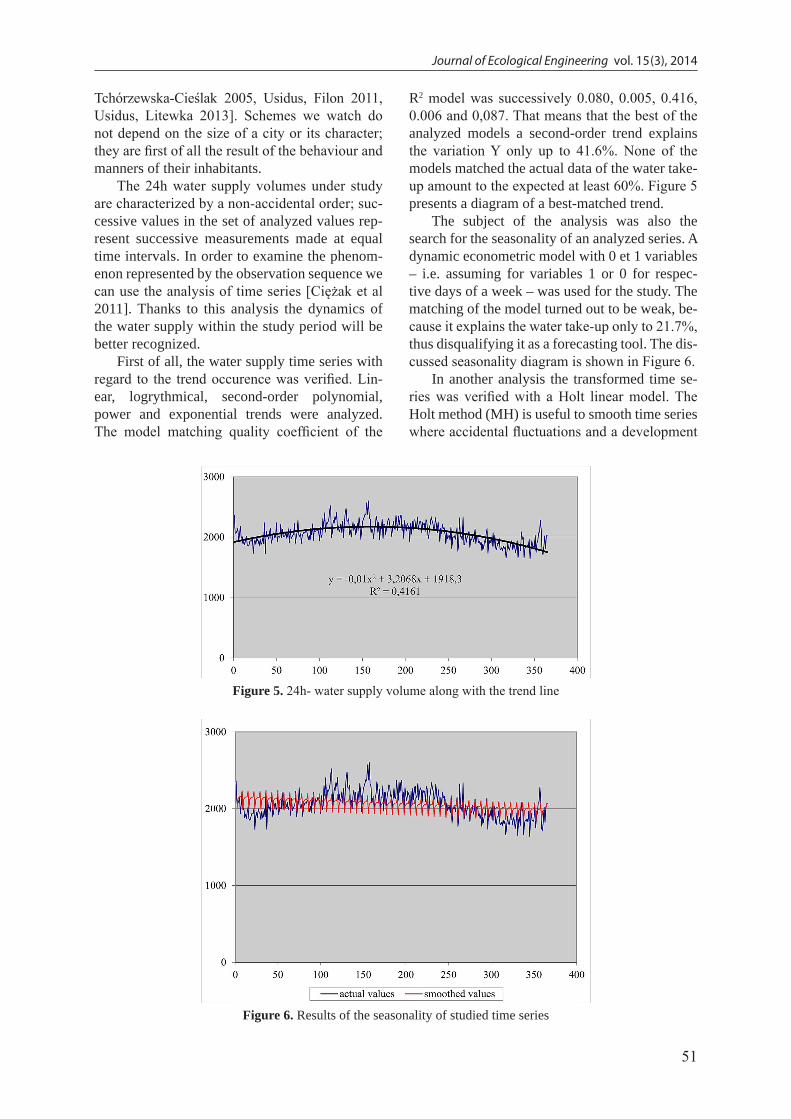
First of all, the water supply time series with regard to the trend occurence was verified. Lin-ear, logrythmical, second-order polynomial, power and exponential trends were analyzed. The model matching quality coefficient of the
R2 model was successively 0.080, 0.005, 0.416, 0.006 and 0,087. That means that the best of the analyzed models a second-order trend explains the variation Y only up to 41.6%. None of the models matched the actual data of the water take-up amount to the expected at least 60%. Figure 5 presents a diagram of a best-matched trend.
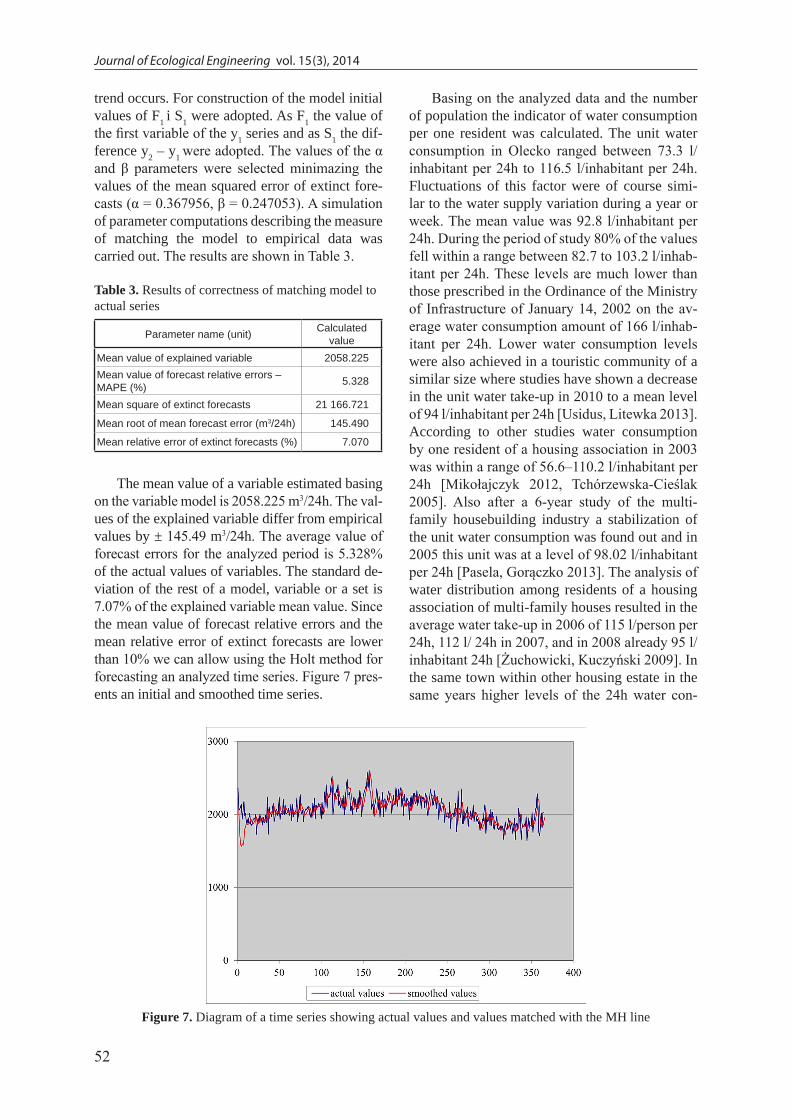
The subject of the analysis was also the search for the seasonality of an analyzed series. A dynamic econometric model with 0 et 1 variables – i.e. assuming for variables 1 or 0 for respec-tive days of a week – was used for the study. The matching of the model turned out to be weak, be-cause it explains the water take-up only to 21.7%, thus disqualifying it as a forecasting tool. The dis-cussed seasonality diagram is shown in Figure 6.
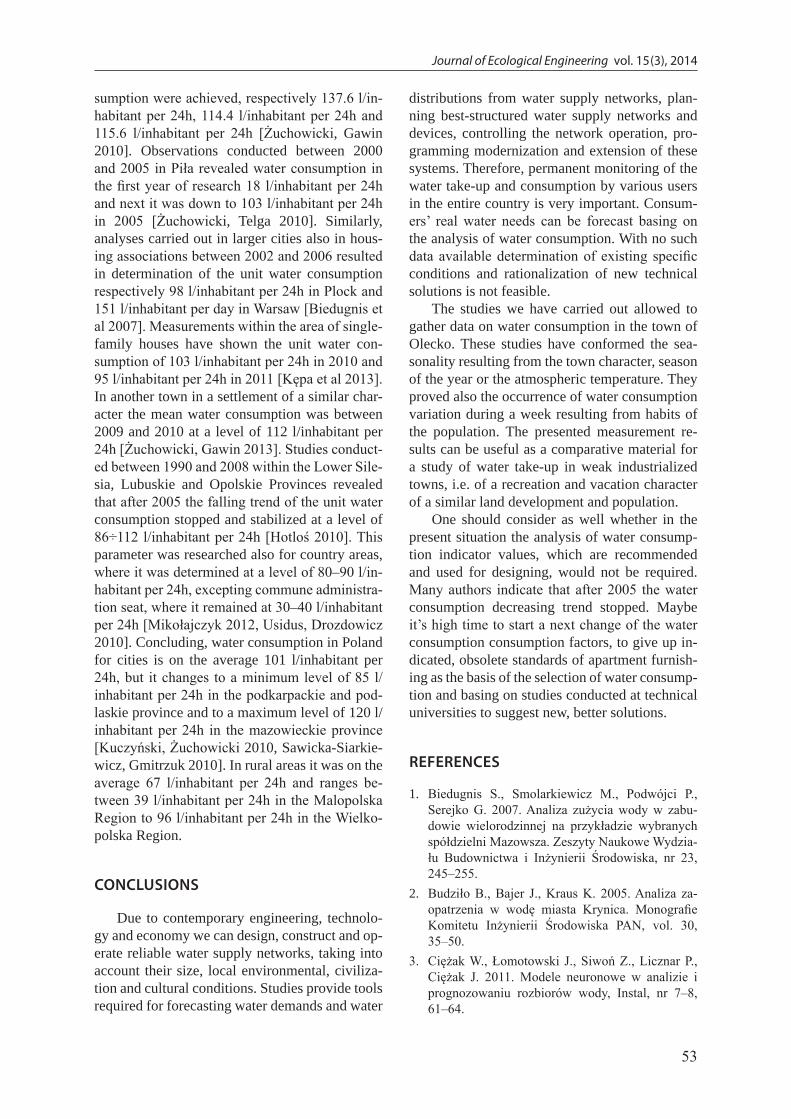
In another analysis the transformed time se-ries was verified with a Holt linear model. The Holt method (MH) is useful to smooth time series where accidental fluctuations and a development
Figure 5. 24h- water supply volume along with the trend line
Figure 6. Results of the seasonality of studied time series
Journal of Ecological Engineering vol. 15(3), 2014
52
trend occurs. For construction of the model initial values of F1 i S1 were adopted. As F1 the value of the first variable of the y1 series and as S1 the dif-ference y2 – y1 were adopted. The values of the α and β parameters were selected minimazing the values of the mean squared error of extinct fore-casts (α = 0.367956, β = 0.247053). A simulation of parameter computations describing the measure of matching the model to empirical data was carried out. The results are shown in Table 3.
Table 3. Results of correctness of matching model to actual series
Parameter name (unit) Calculated value
Mean value of explained variable 2058.225Mean value of forecast relative errors – MAPE (%) 5.328
Mean square of extinct forecasts 21 166.721
Mean root of mean forecast error (m3/24h) 145.490
Mean relative error of extinct forecasts (%) 7.070
The mean value of a variable estimated basing on the variable model is 2058.225 m3/24h. The val-ues of the explained variable differ from empirical values by ± 145.49 m3/24h. The average value of forecast errors for the analyzed period is 5.328% of the actual values of variables. The standard de-viation of the rest of a model, variable or a set is 7.07% of the explained variable mean value. Since the mean value of forecast relative errors and the mean relative error of extinct forecasts are lower than 10% we can allow using the Holt method for forecasting an analyzed time series. Figure 7 pres-ents an initial and smoothed time series.
Basing on the analyzed data and the number of population the indicator of water consumption per one resident was calculated. The unit water consumption in Olecko ranged between 73.3 l/inhabitant per 24h to 116.5 l/inhabitant per 24h. Fluctuations of this factor were of course simi-lar to the water supply variation during a year or week. The mean value was 92.8 l/inhabitant per 24h. During the period of study 80% of the values fell within a range between 82.7 to 103.2 l/inhab-itant per 24h. These levels are much lower than those prescribed in the Ordinance of the Ministry of Infrastructure of January 14, 2002 on the av-erage water consumption amount of 166 l/inhab-itant per 24h. Lower water consumption levels were also achieved in a touristic community of a similar size where studies have shown a decrease in the unit water take-up in 2010 to a mean level of 94 l/inhabitant per 24h [Usidus, Litewka 2013]. According to other studies water consumption by one resident of a housing association in 2003 was within a range of 56.6–110.2 l/inhabitant per 24h [Mikołajczyk 2012, Tchórzewska-Cieślak 2005]. Also after a 6-year study of the multi-family housebuilding industry a stabilization of the unit water consumption was found out and in 2005 this unit was at a level of 98.02 l/inhabitant per 24h [Pasela, Gorączko 2013]. The analysis of water distribution among residents of a housing association of multi-family houses resulted in the average water take-up in 2006 of 115 l/person per 24h, 112 l/ 24h in 2007, and in 2008 already 95 l/inhabitant 24h [Żuchowicki, Kuczyński 2009]. In the same town within other housing estate in the same years higher levels of the 24h water con-
Figure 7. Diagram of a time series showing actual values and values matched with the MH line
53
Journal of Ecological Engineering vol. 15(3), 2014
sumption were achieved, respectively 137.6 l/in-habitant per 24h, 114.4 l/inhabitant per 24h and 115.6 l/inhabitant per 24h [Żuchowicki, Gawin 2010]. Observations conducted between 2000 and 2005 in Piła revealed water consumption in the first year of research 18 l/inhabitant per 24h and next it was down to 103 l/inhabitant per 24h in 2005 [Żuchowicki, Telga 2010]. Similarly, analyses carried out in larger cities also in hous-ing associations between 2002 and 2006 resulted in determination of the unit water consumption respectively 98 l/inhabitant per 24h in Plock and 151 l/inhabitant per day in Warsaw [Biedugnis et al 2007]. Measurements within the area of single-family houses have shown the unit water con-sumption of 103 l/inhabitant per 24h in 2010 and 95 l/inhabitant per 24h in 2011 [Kępa et al 2013]. In another town in a settlement of a similar char-acter the mean water consumption was between 2009 and 2010 at a level of 112 l/inhabitant per 24h [Żuchowicki, Gawin 2013]. Studies conduct-ed between 1990 and 2008 within the Lower Sile-sia, Lubuskie and Opolskie Provinces revealed that after 2005 the falling trend of the unit water consumption stopped and stabilized at a level of 86÷112 l/inhabitant per 24h [Hotloś 2010]. This parameter was researched also for country areas, where it was determined at a level of 80–90 l/in-habitant per 24h, excepting commune administra-tion seat, where it remained at 30–40 l/inhabitant per 24h [Mikołajczyk 2012, Usidus, Drozdowicz 2010]. Concluding, water consumption in Poland for cities is on the average 101 l/inhabitant per 24h, but it changes to a minimum level of 85 l/inhabitant per 24h in the podkarpackie and pod-laskie province and to a maximum level of 120 l/inhabitant per 24h in the mazowieckie province [Kuczyński, Żuchowicki 2010, Sawicka-Siarkie-wicz, Gmitrzuk 2010]. In rural areas it was on the average 67 l/inhabitant per 24h and ranges be-tween 39 l/inhabitant per 24h in the Malopolska Region to 96 l/inhabitant per 24h in the Wielko-polska Region.
CONCLUSIONS
Due to contemporary engineering, technolo-gy and economy we can design, construct and op-erate reliable water supply networks, taking into account their size, local environmental, civiliza-tion and cultural conditions. Studies provide tools required for forecasting water demands and water
distributions from water supply networks, plan-ning best-structured water supply networks and devices, controlling the network operation, pro-gramming modernization and extension of these systems. Therefore, permanent monitoring of the water take-up and consumption by various users in the entire country is very important. Consum-ers’ real water needs can be forecast basing on the analysis of water consumption. With no such data available determination of existing specific conditions and rationalization of new technical solutions is not feasible.
The studies we have carried out allowed to gather data on water consumption in the town of Olecko. These studies have conformed the sea-sonality resulting from the town character, season of the year or the atmospheric temperature. They proved also the occurrence of water consumption variation during a week resulting from habits of the population. The presented measurement re-sults can be useful as a comparative material for a study of water take-up in weak industrialized towns, i.e. of a recreation and vacation character of a similar land development and population.
One should consider as well whether in the present situation the analysis of water consump-tion indicator values, which are recommended and used for designing, would not be required. Many authors indicate that after 2005 the water consumption decreasing trend stopped. Maybe it’s high time to start a next change of the water consumption consumption factors, to give up in-dicated, obsolete standards of apartment furnish-ing as the basis of the selection of water consump-tion and basing on studies conducted at technical universities to suggest new, better solutions.
REFERENCES
1. Biedugnis S., Smolarkiewicz M., Podwójci P., Serejko G. 2007. Analiza zużycia wody w zabu-dowie wielorodzinnej na przykładzie wybranych spółdzielni Mazowsza. Zeszyty Naukowe Wydzia-łu Budownictwa i Inżynierii Środowiska, nr 23, 245–255.
2. Budziło B., Bajer J., Kraus K. 2005. Analiza za-opatrzenia w wodę miasta Krynica. Monografie Komitetu Inżynierii Środowiska PAN, vol. 30, 35–50.
3. Ciężak W., Łomotowski J., Siwoń Z., Licznar P., Ciężak J. 2011. Modele neuronowe w analizie i prognozowaniu rozbiorów wody, Instal, nr 7–8, 61–64.
Journal of Ecological Engineering vol. 15(3), 2014
54
4. Hotloś H. 2010. Badania zmian poboru wody w wybranych miastach Polski w latach 1990–2008. Ochrona Środowiska, vol. 32, 3, 39–42.
5. Hotloś H., Głowacka J., Kołodziej A. 2012. Zmienność poboru wody w systemie wodociągowym Wrocławia, Ochrona Środowiska, 34(4), 23–28.
6. Kępa U., Stępniak L., Stańczyk-Mazanek E. 2013. Analiza zużycia wody i zmienność rozbiorów dla obszaru zasilania Kawie Góry na terenie miasta Częstochowy. Rocznik Ochrona Środowiska. Tom 15, 2546–2562.
7. Kuczyński W., Żuchowicki W. 2010. Ocena aktual-nej sytuacji w zaopatrzeniu w wodę w Polsce na tle sytuacji w świecie. Rocznik Ochrona Środowiska. Tom 12, 419–465.
8. Mikołajczyk M. 2012. Analiza jednostkowych wskaźników zużycia wody w gospodarstwach domowych w warunkach wiejskich i miejskich, Instal, nr 2, 47–50.
9. Pasela R., Gorączko M. 2013. Analiza wybranych czynników kształtujących zużycie wody w bu-dynkach wielorodzinnych. Rocznik Ochrona Środowiska. Tom 15, 1658–1672.
10. Podwójci P. 2011. Nierównomierność zużycia oraz rozbioru wody w budownictwie wielorodzinnym. Inżynieria Ekologiczna, Nr 26, 281–289.
11. Podwójci P., Kozłowski M., Krysiuk M. 2011. Zużycie wody w budownictwie wielorodzin-nym – wybrane zagadnienia. Rocznik Ochrona Środowiska. Tom 13, 1653–1666.
12. Sawicka-Siarkiewicz H., Gmitrzuk N. 2010. Kształtowanie się jednostkowych wskaźników zużycia wody na terenach osiedli w grupach mi-ast o liczbie mieszkańców od 50001 do 500000,
Ochrona Środowiska i Zasobów Naturalnych, Nr 45, 63–82.
13. Szopińska K., Pasela R. 2009. Struktura zużycia wody w budownictwie wielorodzinnym, Instal, nr 4, 51–55.
14. Tchórzewska-Cieślak B. 2005. Analiza zużycia wody do spożycia przez mieszkańców miasta Jasła. Monografie Komitetu Inżynierii Środowiska PAN, vol. 30, 65–74.
15. Usidus D., Drozdowicz A. 2010. Analiza rozbiorów wody na wybranym terenie Pomorza Środkowego – w gminie Sianów. Rocznik Ochrona Środowiska. Tom 12, 543–558.
16. Usidus D., Filon A. 2011. Analiza zmienności roz-bioru wody w miejscowości wypoczynkowej pasa nadmorskiego. Rocznik Ochrona Środowiska. Tom 13, 903–920.
17. Usidus D., Litewka A. 2013. Rozbiory wody w miejscowości Ustka. Rocznik Ochrona Środo-wiska. Tom 15, 1070–1085.
18. Żuchowicki A., Gawin R. 2010. Pobory wody przez mieszkańców budynku wielorodzinnego. Rocznik Ochrona Środowiska. Tom 12, 479–488.
19. Żuchowicki A., Gawin R. 2013. Struktura zużycia wody w budynkach jednorodzinnych. Rocznik Ochrona Środowiska. Tom 15, 924–929.
20. Żuchowicki A., Kuczyński W. 2009. Anali-za porównawcza zmian w rozbiorach wody z uwzględnieniem sposobu jej dostarczania do od-biorców. Rocznik Ochrona Środowiska. Tom 11, 781–786.
21. Żuchowicki A., Telega M. 2010. Analiza produk-cji i zużycia wody w Pile. Rocznik Ochrona Środowiska. Tom 12, 313–324.