dynamics and modeling of ac arc on surface of ice and modeling of ac arc on surface of ice ......
TRANSCRIPT

HAL Id: hal-00135219https://hal.archives-ouvertes.fr/hal-00135219
Submitted on 7 Mar 2007
HAL is a multi-disciplinary open accessarchive for the deposit and dissemination of sci-entific research documents, whether they are pub-lished or not. The documents may come fromteaching and research institutions in France orabroad, or from public or private research centers.
L’archive ouverte pluridisciplinaire HAL, estdestinée au dépôt et à la diffusion de documentsscientifiques de niveau recherche, publiés ou non,émanant des établissements d’enseignement et derecherche français ou étrangers, des laboratoirespublics ou privés.
Dynamics and Modeling of AC Arc on Surface of IceChangiz Tavakoli, Masoud Farzaneh, Issouf Fofana, Abderrahmane Beroual
To cite this version:Changiz Tavakoli, Masoud Farzaneh, Issouf Fofana, Abderrahmane Beroual. Dynamics and Modelingof AC Arc on Surface of Ice. IEEE Transactions on Dielectrics and Electrical Insulation, Institute ofElectrical and Electronics Engineers, 2006, 13 (6), pp.1278-1285. <hal-00135219>
C. Tavakoli et al.: Dynamics and Modeling of AC Arc on Surface of Ice
1070-9878/06/$20.00 © 2006 IEEE
1278
Dynamics and Modeling of AC Arcon Surface of Ice
C. Tavakoli, M. Farzaneh, I. Fofana NSERC / Hydro-Quebec / UQAC Industrial Chair on Atmospheric Icing of Power Network Equipment (CIGELE) and Canada
Research Chair, tier 1, on Engineering of Power Network Atmospheric Icing (INGIVRE) at Université du Québec à Chicoutimi, Québec, G7H 2B1, Canada
and A. Béroual Centre de Génie Électrique de Lyon,
École Centrale de Lyon, Ecully, France
ABSTRACT A self-consistent dynamic model allowing the prediction of ac discharge activities leading to flashover on ice-covered insulator surface is presented. This model takes into account the effects of a number of parameters including insulator geometry and applied water conductivity. The instantaneous variations of major parameters are discussed in order to develop a sequential time-dependent simulation of the flashover. The temporal evolution of arc current and axial arc velocity are determined in a consistent manner. The critical flashover voltage characteristics, as a function of surface conductivity, insulator length, and insulator diameter, calculated by the model are quite satisfactory when compared to the experimental results from empirical models reported in the literature.
Index Terms — Ice surface, mathematical modeling, arc modeling, outdoor insulation, atmospheric icing.
1 INTRODUCTION OVERHEAD power lines generally pass over a variety of
regions encompassing different kinds of physical terrain, climatic conditions and characteristic environments. High-voltage outdoor equipment is thus subjected to various forms and degrees of constraints. The most salient among these are recognized to be contamination and atmospheric icing deposited on insulators. The study and understanding of arc initiation and propagation in the presence of ice is a fundamental aspect of insulator studies [1]. Predicting the incidence of flashover on ice-covered insulators may be considered as an essential factor in insulator design. This type of research is also helpful in modeling and manufacturing the right kind of insulators for use in cold climate regions [1]. Valuable work accomplished by many researchers has already contributed in the modeling and understanding of polluted and/or iced insulators [2-9]. Despite numerous similarities between the mechanisms of the flashover phenomenon on polluted and iced insulators, these two circumstances are not identical. An ice layer forms in a non-uniform manner on an insulator and is made uneven by the formation air gaps due to partial arcs during the icing period [1]. These air gaps are usually created in close
proximity to the electrodes, where the electric field is relatively high [1]. Although ice bulk is considered to be non-conductive [1, 6 and 7], an increase in ambient temperature will produce water film on the surface of accumulated ice, which tends to be conductive [1, 6 and 7]. The presence of a highly conductive water film on the ice surface then causes a voltage drop along the air gaps. A number of studies, to date, have revealed that in the presence of even a low conductive water film layer, almost the totality of the applied stress on the insulator appears along the air gaps [1, 6 and 7]. If the level of stress is higher than the air breakdown threshold, the air gaps will break down and small luminous partial arcs will appear along them. The initiation of corona discharges leading to the development of partial arcs in these zones will then cause a substantial increase in leakage current [10]. Under sufficient electrical stress, arcs propagate along the ice surface, forming a white arc. When the white arc reaches a certain length, the whole insulator suddenly undergoes complete flashover [1, 6, 7 and 10]. In this contribution, the fundamental processes of the subsequent phases of ac arc on an ice surface are analyzed. For this purpose, the present study investigates basic mechanisms on laboratory studies using a simplified physical model. This type of physical model is particularly suited to study the basic processes of arc propagation over an ice surface [11]. For the whole process, a mathematical model is proposed that has been essentially derived Manuscript received on 29 August 2005, in final form 4 May 2006.

IEEE Transactions on Dielectrics and Electrical Insulation Vol. 13, No. 6; December 2006 1279
and simplified by the authors, in order to develop sequential time-dependent simulation of the laboratory ice-surface breakdown. The aim of this mathematical model is to provide numerical tools to simulate the development of an electric arc on an ice-covered insulator surface. Such modeling is necessary to predict the physical thresholds for the occurrence of electric arcs on an ice-covered insulator. The input data of this self-consistent mathematical model, which includes the successive propagation of the arc, are the insulator geometry, the ice layer characteristics and/or properties, the applied voltage, and some initial values.
The computed results are compared to the minimum flashover voltage measured experimentally on a glass-tubing cylindrical, post and line insulators. The results indicate the feasibility of assessing flashover prediction under AC voltage, using the proposed model.
2 TEST FACILITIES AND PROCEDURE Experiments were performed on a glass-tubing cylinder made
up of three separate parts, two identical electrodes and a glass tube as schematically presented in Figure 1. This made it possible to carry out experiments on different lengths of tube using the same electrodes. The type of glass tube used was chosen so as to be sufficiently resistant to overheating from the burning arc.
Figure 1. Cylindrical model used for experiments.
Voltage was supplied by a single-phase 120 kV, 240 kVA, 50 Hz transformer. The overall short-circuit current of the HV system was about 28 A at the maximum operating voltage of 120 kV rms. A LabVIEW graphical software program was used to acquire high quality data. The voltage signal was attenuated by using a capacitive voltage divider. The current signal was transferred to a voltage signal using a low resistance shunt of 10 . The test signals were connected to a measuring set through a conditioning box providing protection and insulation. A NI-DAQ device, model PCI-6035E, was used for this purpose.
At an ambient temperature of -12 oC, super-cooled droplets having a mean diameter of 80 μm were produced by five pneumatic nozzles at a wind velocity of 3.3 m/s. Ice deposited under the above conditions was glaze, which is known to be the most severe type from the electrical point of view [1, 12]. Immediately after ice-accumulation, an artificial air gap of 7-8% of the total length of the insulator was created at the top of the
sample. This air gap simulates those formed by partial arcs on actual ice-covered post insulator during the icing period [1, 12]. The voltage was then applied and the whole test was carried out in the cold room at a constant temperature of -12oC. During each test, the current and voltage signals were captured by the DAQ system and arc behavior was filmed by a high-speed.
3 EXPERIMENTAL RESULTS
3.1 FLASHOVER RESULTS The flashover test results were obtained from 6 series of experiments on 2 different cylinder lengths, 40 and 80 cm each. Three different applied water conductivities of 30, 65 and 100 μS/cm were used. The method used for evaluating the maximum withstand voltage, VWS, is similar to that initially proposed in [1] and later in [13]. The VWS, is defined as the maximum level of applied voltage at which flashover did not occur for a minimum of 3 tests out of 4, under similar icing conditions. Based on this method, the minimum flashover voltage, VMF,corresponds to a voltage level which is 3 kV (less than 5% of the estimated value of the flashover voltage, VF) higher than VWS, and at which 2 flashovers out of a maximum of 3 tests are produced. The results are summarized in Table 1. In general, flashover occurs faster for higher conductivities than for lower ones. Indeed, an increased ice surface conductivity leads to a much faster streamer development [14].
Table 1. VMF (kV) for ice-covered glass tubing cylinder. L (cm) (μS/cm) VMF (kV)
30 48 65 43
40
100 40 30 86 65 78
80
100 74
3.2 EFFECTS OF INITIAL AIR GAP LENGTH Three additional series of tests were done on a cylindrical
insulator to study the effects of the initial air gap on minimum flashover voltage. These series were carried out on a 40 cm length insulator and three different freezing water conductivities of 30, 65 and 100 μS/cm. The air gap was created so as to encompass 15% of the total insulator length. The results are shown in Table 2. A comparison of these results with those of previous tests was made in Figure 2.
Table 2. Flashover results for a 40 cm cylindrical insulator and longer initial air. gap in kV.
(μS/cm) VMF (kV) 30 47 65 43
L = 40 cm Air Gap 6cm
100 44 Flashover on an ice surface is an extremely complex
phenomenon resulting from the interaction between the following factors: electric field, wet and polluted ice surface, presence of air gaps at ice surface, environmental conditions, and complex geometry of an ice-covered insulator [1]. It is
φ 75
φ 89
φ 123Glass tube
Ice
Electrode
Air gap
HV Electrode
φ 153
400
– 8
00
10
10
10

C. Tavakoli et al.: Dynamics and Modeling of AC Arc on Surface of Ice 1280
generally agreed that the presence of a water film on thesurface of the ice is necessary for flashover to occur. The conductivity of the ice surface can reach values as high as ten times those of freezing water conductivity, σ [15].
Figure 2. Comparison of flashover results for 2 initial air gap lengths of 7% and 15% and different applied water conductivities.
This increase in surface conductivity caused by the rejection of impurities from the solid part into the liquid portion of drops or droplets during the solidification/freezing process, and by pollution of the water and ice surface [14, 15], means that voltage drops occur essentially across the air gaps [16]. If the electric field across air gaps is high enough, corona discharges are initiated. This can lead to the development of local arcs across the air gaps causing a substantial increase in leakage current and a concomitant melting of ice. Under sufficient electrical stress, arcs propagate along the ice surface, forming a white arc. When the white arc reaches a certain length, the whole insulator suddenly undergoes complete flashover. For an air gap length of 7% (that is 2.8 cm) the VMF
decreases with increasing freezing water conductivity, σ. This behavior is due to the fact that, for a given voltage and air gap length, the higher the freezing water conductivity, the higher the voltage dropped across the air gap is. In other words, for a given voltage and air gap length, the electric field will increase with increasing σ. As a consequence, corona discharge will be initiated at lower applied voltage when σ is increased. When the air gap length, d, is increased to 15% (that is 6 cm), the VMF decreases from 47 to 43 kV when σ increases from 30 to 65 μS/cm and remains almost constant. This difference in behavior may be attributed to the discharge process. Indeed, it has been acknowledged that breakdown in air is effected by avalanche multiplication if d<5 cm and by the streamer (or leader) mechanism if d>5 cm [17].
Another important remark to be pointed out is that, for conductivities of 30 and 65 μS/cm, the VMF is almost the same for both air gap lengths (that is 7 and 15% of the total insulator length). For σ = 100 μS/cm, when the applied voltage was less than the flashover voltage (44 kV), no discharge was observed. However, when it was higher or equal to this value, a sudden flashover occurred. This confirms that the flashover voltage obtained is, in fact, related to the level of threshold voltage for longer artificial air gaps. This means that the only effect of the initial air gap length is to increase the threshold voltage for
breaking down the air gap. Then, after establishing the arc along the air gap, and when melting water is present on the insulator surface, this length has no more effect on discharge phenomena.
3.3 CURRENT AND VOLTAGE CURVES When flashover occurs, current increases and goes toward short
circuit current. The study of current and voltage curves shows that the current curve contains strong harmonics and is not purely sinuous, but also that after the appearance of the white arc, the peak moments of voltage and current occur simultaneously. The distortion of the current curve may be due to the non-linearity of both arc and surface-water resistances as a function of current (Figure 3). In all experiments, flashover occurred when the voltage signal was nearly at its maximum value. When a complete flashover occurs, the current increases and the voltage drops to zero.
Figure 3. Typical current and voltage signals for a flashover test (L = 80 cm and w = 30 μS/cm).
3.4 ARC LENGTH OBSERVATIONS The arc behavior during the last stage of its propagation was
observed using a high speed camera. The filming speed was 1000 images per second, which makes it possible to take approximately four images every quarter cycle. Since this maximum filming rate was not sufficient to measure the velocity of arc propagation, the arc velocity was not measured during the experiments.
As observed during the tests in a previous research [10], before a complete flashover, arc length remains almost constant. Indeed, even if the electrical current circulating through the partial arc is interrupted (ac arcs), the plasma does not disappear instantly because the time constants for plasma decay are, in general, not negligible at the scale of the other durations involved in the phenomenon [18]. The relevant plasma is termed “afterglow”. As a rule, exact knowledge of the behavior of afterglow plasma is important in order to determine the possible conditions of either direct or inverse re-ignition. The arc was observed to be stationary for several seconds over a length of 45-60% of the total insulator length before flashover occurred [7, 10]. The latter variable is independent of initial air gap length [10].
4 BASIC MODEL Obenaus was the first to apply circuit analogue method of
modeling to simulate arc behavior on polluted surfaces [8]. The
35
37
39
41
43
45
47
49
30 65 100 135
7%*L15%*L
Air gap:
(μS/cm)
V MF (
kV)
0 20 40 60 80 100 120 140 160 180 200-1500
-1000
-500
0
500
1000
1500
time (ms)
Cur
rent
(mA
)
Voltage
Current

IEEE Transactions on Dielectrics and Electrical Insulation Vol. 13, No. 6; December 2006 1281
same basic idea is used for modeling arc propagation on iced insulators [19]. The arc is considered to be constituted of a resistance in series with an inductance. The ice bulk and the water film on its surface are considered to behave as a single resistance, as was described in [6 and 7].
In order to describe the production of electrical charges, a capacitance is inserted in the model, as shown in Figure 4.
Figure 4. Principal model of arc propagation on an ice-covered insulator surface.
When the arc propagates, the potential wave and current initiated are described by:
( ) ( ) ( )dt
tdILtIRtV arc
arcarcarcap += (1)
and
( ) ( ))t(V
RdttdVCtI c
ice
carc
1−= (2)
where the main output of the circuit, Iarc, is the arc current, Vap is the voltage applied to the whole test set, Rarc and Larc are the total arc resistance and inductance, respectively, C represents the capacitance, and Rice is the total resistance of the unbridged iced layer.
4.1 SIMULATION METHOD In order to calculate the flashover voltage, the same hypothesis
assumed in static models is applied, where the whole process occurring within a cycle around the maximum value of the applied voltage is taken into account [9].
If the initial arc temperature is taken as a relatively high value of 4550 K maximum [11] ( air = 0.0006 1/Ω.cm [16]), it will ensure attaining a minimum value for critical flashover voltage, since it results in a minimum initial arc per unit resistance. The initial arc length is assumed to be equal to 45% of total insulator length, L,since it results in a minimum value for critical flashover voltage [10]. The initial value of the voltage applied may be determined using the Claverie model, proposed in order to calculate the minimum peak voltage, V0, able to re-ignite an arc which carries the peak current, I0, along the initial arc length, x0 [3]. Using the constants proposed for ice-covered insulators, the relationship reads as follows [7]:
5277.00
oo
Ix1118
V = (3)
After obtaining the peak value for the critical flashover voltage level, the time modeling of the last stage may be repeated quasi-indefinitely. In each time step, dt, the voltage is applied to the
circuit, and then the current through the electric network is calculated by making use of the initial values of all components. If propagation is to occur, the arc must be extended to a new length. In order to evaluate whether the arc is capable of prolonging itself or not, an appropriate criterion must be met. This new length should be calculated as a function of several other parameters. With the new length, the entire process will be repeated, and in all iterations the criterion should consistently be met. If the arc is not able to extend further, it will be extinguished and the applied voltage should be increased, and all the steps repeated once more. Meanwhile, after each increment in length, the arc length is compared with the total arcing distance. If this length is greater, flashover takes place and the simulation comes to halt.
4.2 CIRCUIT COMPONENTS If an axially symmetrical insulator is covered with a thin
uniform conductive film of a constant thickness, h, and constant specific conductivity, v, then the surface conductivity at any point of the film is defined by: γe = σv h (4) where e is obtained in 1/ . In order to take into account the effect of current concentration at the arc root, Wilkins’ investigations for narrow strips (w < L) lead to following equation [9]:
∑+∞=
−∞=⎥⎥⎥⎥⎥
⎦
⎤
⎢⎢⎢⎢⎢
⎣
⎡
+ππ+⎟⎠⎞⎜
⎝⎛ +π−
+ππ+⎟⎠⎞⎜
⎝⎛ +π+
πγ=
j
j 222
222
eice
L2)rjw(sinh
L2xtan
L2)rjw(sinh1
L2)rjw(sinh
L2xtan
L2)rjw(cosh1
log21
21R
(5)where w, (L-x), and e are the width, arcing distance and conductivity of the conductive layer, respectively, and r is the arc root radius.
The arc channel root radius, r, is also calculated at each time-step according to Wilkins’ empirical model [9]:
( ) ( )π
=k
tItr arc (6)
in which k is a constant [9]. For an AC arc propagating on an iced surface, k was already determined experimentally and is equal to 0.875 [7].
Compared to the much higher speed of the flashover process and the heat transfer phenomenon on the ice surface, the change in surface conductivity during the arc propagation stage is negligible. Based on previous investigations, a linear relationship was established between the applied water conductivity used and the surface conductivity at the time of flashover [7]. This equation for ac applied voltages reads as [7]:
45.20675.0 we +σ=γ (7)
where surface conductivity, e, is obtained in μS and the applied water conductivity, , is in μS/cm at 20 oC.
In order to derive an expression which would connect the electrical conductivity of the channel with the electrical characteristics of the circuit, it may be assumed that the discharge occurs in such a short time that radiation and heat loss by conduction are negligible. Mayr assumed that the heat conduction
Vap (t)
A
B
Rarc (x, t) Larc (x, t)
Arc channel Ice layer
Rice (x, t)
C (x, t)
A B
Iarc
Arc Residual ice layer
C. Tavakoli et al.: Dynamics and Modeling of AC Arc on Surface of Ice 1282
rate, P0, is constant and derived a new equation to describe the arc behavior, such as [20]:
)PIr
1(1dt
drr1
o
2arcarcarc
arc−
τ= (8)
where rarc is the arc resistance per unit and = W0 / P0 is the arc de-ionization factor, which may be considered constant at 100 μs for the arcs in air [4, 11 and 21]. The value of P0 may be considered as the arc constant [4, 11 and 21] which, in this case, is 204.7 [10]. This equation is used in order to simulate the arc dynamics during its propagation. The initial value of the arc resistance is achieved using initial values of arc temperature and arc length.
In order to determine the inductance of the discharge channel, we use a simplification similar to that proposed in [22] for discharge in air gaps, i.e. the end effects are ignored and the inductance per unit length of the channel Larc, is [22]:
⎥⎦
⎤⎢⎣
⎡⎟⎠⎞⎜
⎝⎛+
πμ
=r
Dfln25.02
L oarc (9)
If Df is large enough for transient fields, the fractional error will be low [17]. For these investigations, Df is set at 100 m, a typical value already proposed in reference [22].
The capacitance C(x,t) is calculated using a spherical approximation [17]. This approximation yields:
( ) ⎟⎟⎠
⎞⎜⎜⎝
⎛−
+εΓ=xL
rrt,xCf
1 (10)
where represents the solid angle between the arc head and the opposite electrode.
4.3 ARC VELOCITY AND PROPAGATION Under some assumptions it has been shown [18] that there
exists a relationship between discharge velocity and its current:
L
arc
q)t(I
)t(v = (11)
where ( )∫= tarc tI
xq 0
1 is the average charge per unit length and
can be considered constant for all practical purposes [18]. In order to achieve a minimum value for critical flashover
voltage, Hesketh’s criterion [23] during the period of propagation, is used as follows: dParc/dx > 0 (12) where Parc is the power supplied to the arc by the power source.
5 RESULTS AND DISCUSSIONS
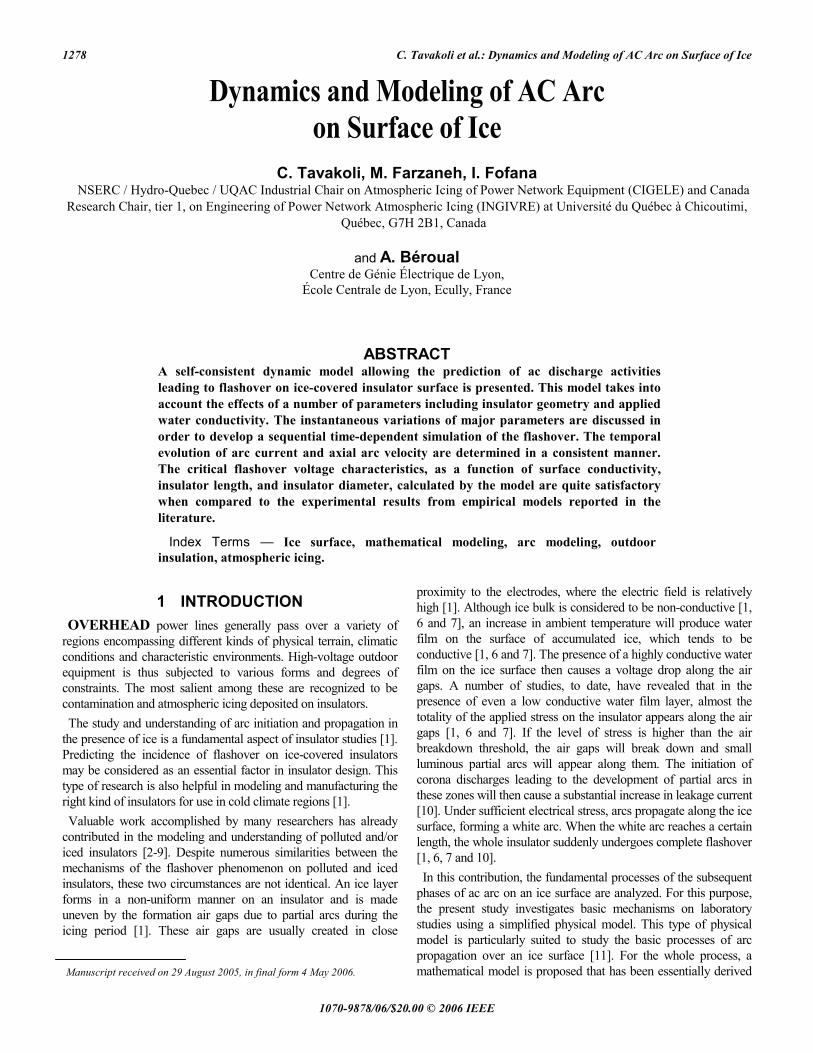
5.1 CYLINDER AND POST INSULATOR Figure 5 represents an illustration of the model performance in
predicting a typical current cycle as it occurs a few cycles before flashover on the glass-tubing cylinder insulator covered with ice.
The simulated current is also compared to the one obtained from experiments. The non-linearity of arc resistance and inductance causes a deformation in the arc current wave when the current passes through zero. The phase difference between simulated and experimental results involves the necessity for
correcting the inductance relationship. In fact, using equation (9) produces very small values for arc inductance so that this factor becomes negligible compared to the resistance of the arc.
Figure 5. Comparison of the simulation and experimental leakage current (L= 40 cm, = 30 μS/cm, Veff = 48 kV).
This phase difference confirms that the real inductance of the arc should be higher than the one obtained using equation (9), at least with regard to insulator lengths of less than 1 m. The disparity between the results of the simulated and experimental current, when the arc current approaches zero, may be due to the use of the arc root radius equation. This equation was derived from peak values of the current [7] and may possibly not be applicable to all instants of a cycle.
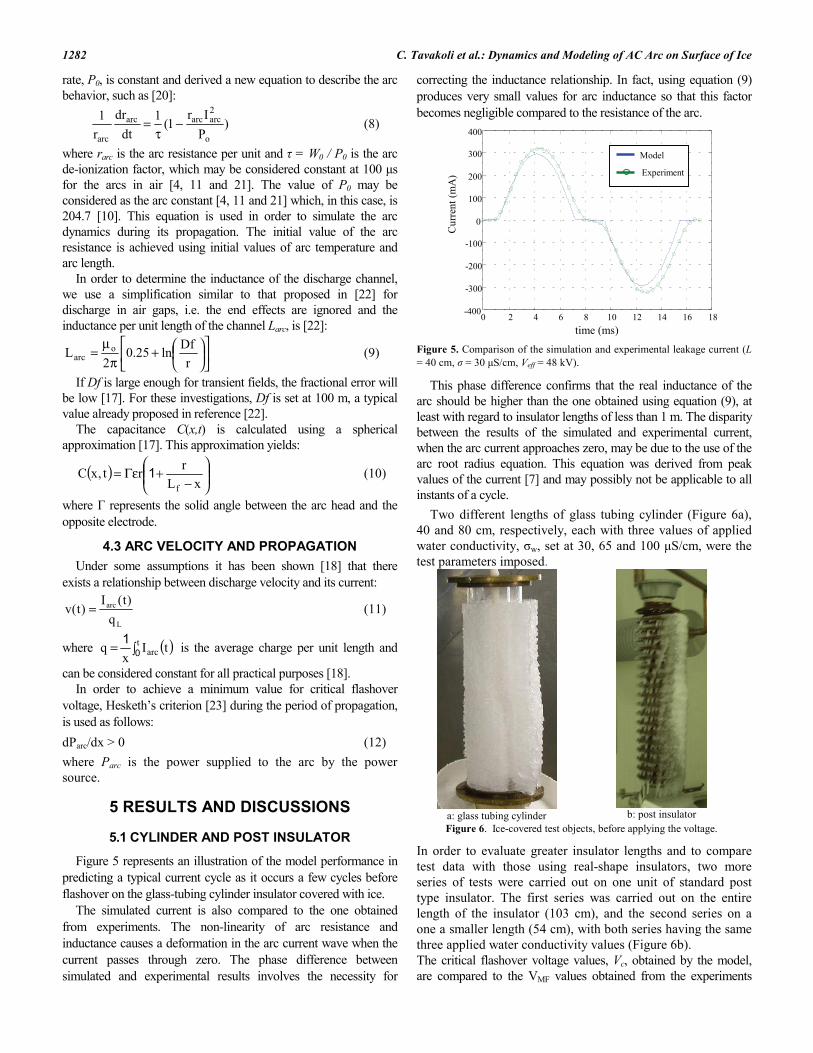
Two different lengths of glass tubing cylinder (Figure 6a), 40 and 80 cm, respectively, each with three values of applied water conductivity, w, set at 30, 65 and 100 μS/cm, were the test parameters imposed.
a: glass tubing cylinder b: post insulator Figure 6. Ice-covered test objects, before applying the voltage.
In order to evaluate greater insulator lengths and to compare test data with those using real-shape insulators, two more series of tests were carried out on one unit of standard post type insulator. The first series was carried out on the entire length of the insulator (103 cm), and the second series on a one a smaller length (54 cm), with both series having the same three applied water conductivity values (Figure 6b).The critical flashover voltage values, Vc, obtained by the model, are compared to the VMF values obtained from the experiments
0 2 4 6 8 10 12 14 16 18-400
-300
-200
-100
0
100
200
300
400
time (ms)
Model
Experiment
Cur
rent
(mA
)

IEEE Transactions on Dielectrics and Electrical Insulation Vol. 13, No. 6; December 2006 1283
depicted in Figures 7 and 8 for the glass tubing insulator and, in Figures 9 and 10, for the standard post insulator.
Figure 7. Flashover results for a 40 cm iced cylinder and different applied water conductivities with 13.6% accuracy.
Figure 8. Flashover results for an 80 cm iced cylinder and different applied water conductivities with 8.9% accuracy.
Figure 9. Flashover results for a 54 cm post insulator and different applied water conductivities with 8.1% accuracy.
Figure 10. Flashover results for a 103 cm post insulator and different applied water conductivities with 10.3% accuracy. The error bars indicate the percentage of error between the experimental points and the corresponding model results. These results are in satisfactory concordance, although the percentage of
error tends to increase for smaller lengths and lower conductivities, or greater length and higher conductivities. The error in the VMF prediction may be the result of assuming a constant value for P0 (equation 3), since this parameter showed a considerable variation as a reason of variation in insulator lengths, and in applied water conductivities [10]. This appears to be related to the non-linear plasma processes that drive the channel conductivity [18]. Also, a part of the variation in calculation may be due to the use of equation (7) for calculating surface conductivity, since the equation was based on the experimental results from a relatively short test object [7]. This relation (equation 7) was obtained by assuming equality between the surface resistance measured and its analytical relation, displaying a relatively high degree of error, up to 50% [7]. This deviation confirms that the surface conductivity at the moment of flashover is not only a function of applied water conductivity, but also of several other parameters such as insulator length. It is well known that the shape of insulator shed diameter and spacing, as well as material play an important role on the performance of the insulator under ice and snow conditions [1]. The cylindrical model and post insulators present an air gap located at the upper flange, while the insulator string’s air gap is located at the bottom flange. Fundamentally for cylindrical/post insulators, the initiation of electrical discharge along the air will result in a local overheating of the ice surface, especially in the vicinity of the arc root point. As a result, the dripping water will flow along the residual ice surface, and thus contribute to the increase in water film thickness. On the other hand, as the air gap for line insulators is located at the bottom flange there is no such water dripping. Even though the model is developed for cylindrical and post type insulators, the validity of the model to predict the critical flashover voltage of line insulators under icing conditions is investigated in the following section.
5.2 IEEE STANDARD SUSPENSION INSULATOR STRING
The experimental results were taken from [12], where 1 to 6 units of IEEE insulator strings were tested under uniform wet-grown ice. The results of variation in critical flashover voltages due to the varying of insulator length, L, applied water conductivity, , and ice width w, are shown in Figures 11 to 13. The model results are also compared with the results of experiments and models reported in previous studies [6, 7, 12, 19 and 24]. In these previous static models, the arc constant in the re-ignition condition, K, was experimentally established earlier at 1118 [7]. Other arc constants, A, n and b, were set at 204.7, 0.5607 and 0.5277, respectively [6]. Figure 11 shows the simulation results of critical flashover voltages for different dry arcing distances for an ice width of w = 46.2 cm (cf. [6]), and = 80 μS/cm.
The model was also applied to a string of 5 units of IEEE standard insulators, where different applied water conductivities were tested. The wet-grown ice layer was considered to be 46.2 cm wide and the arcing distance, L, was considered to be 80.9 cm [7]. The experimental results as well as the values calculated by the static model are presented in Figure 12. A noticeable decrease in the flashover voltage resulting from an increase in the applied
30
40
50
60
70
30 65 100
w (μS/cm)
Vc(k
V)
Experiment Model
40
60
80
100
120
30 65 100
w (μS/cm)
Vc(k
V)
Experiment Model
40
50
60
70
80
90
100
30 65 100 w (μS/cm)
Vc(k
V)
Experiment Model
Vc(k
V)
0
10
20
30
40
50
60
30 65 100 w (μS/cm)
Experiment
Model
C. Tavakoli et al.: Dynamics and Modeling of AC Arc on Surface of Ice 1284
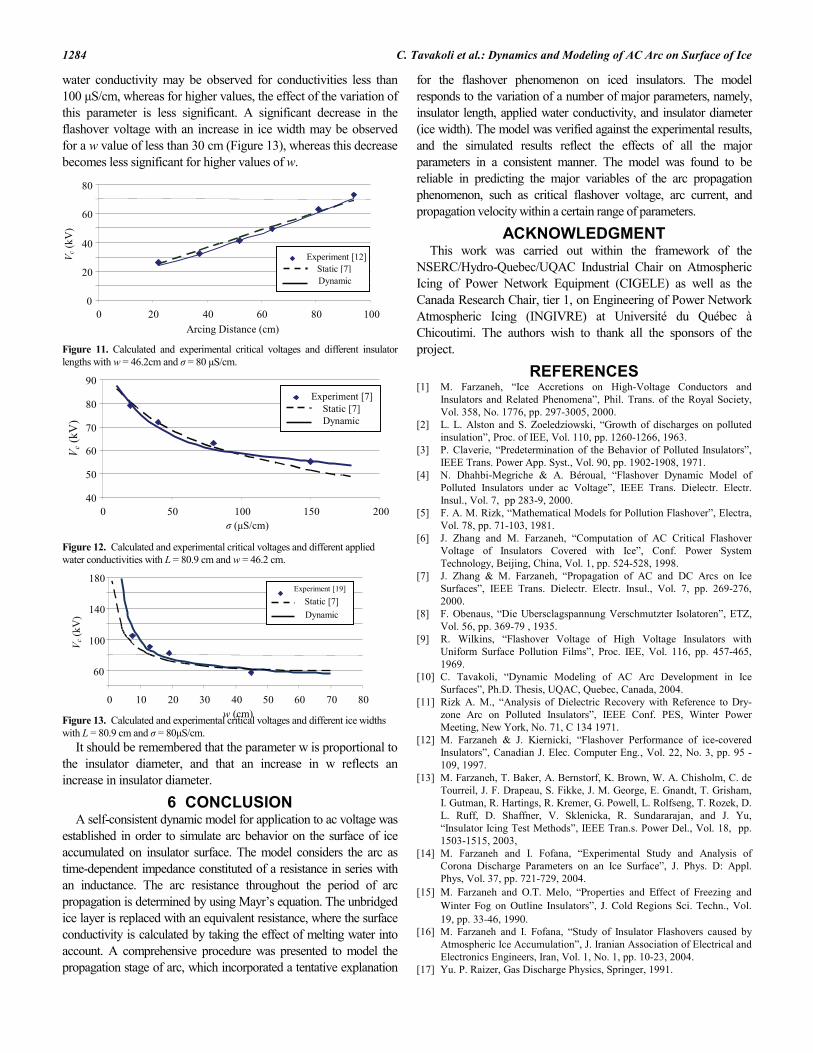
water conductivity may be observed for conductivities less than 100 μS/cm, whereas for higher values, the effect of the variation of this parameter is less significant. A significant decrease in the flashover voltage with an increase in ice width may be observed for a w value of less than 30 cm (Figure 13), whereas this decrease becomes less significant for higher values of w.
Figure 11. Calculated and experimental critical voltages and different insulator lengths with w = 46.2cm and = 80 μS/cm.
Figure 12. Calculated and experimental critical voltages and different applied water conductivities with L = 80.9 cm and w = 46.2 cm.
Figure 13. Calculated and experimental critical voltages and different ice widths with L = 80.9 cm and = 80μS/cm.
It should be remembered that the parameter w is proportional to the insulator diameter, and that an increase in w reflects an increase in insulator diameter.
6 CONCLUSION A self-consistent dynamic model for application to ac voltage was
established in order to simulate arc behavior on the surface of ice accumulated on insulator surface. The model considers the arc as time-dependent impedance constituted of a resistance in series with an inductance. The arc resistance throughout the period of arc propagation is determined by using Mayr’s equation. The unbridged ice layer is replaced with an equivalent resistance, where the surface conductivity is calculated by taking the effect of melting water into account. A comprehensive procedure was presented to model the propagation stage of arc, which incorporated a tentative explanation
for the flashover phenomenon on iced insulators. The model responds to the variation of a number of major parameters, namely, insulator length, applied water conductivity, and insulator diameter (ice width). The model was verified against the experimental results, and the simulated results reflect the effects of all the major parameters in a consistent manner. The model was found to be reliable in predicting the major variables of the arc propagation phenomenon, such as critical flashover voltage, arc current, and propagation velocity within a certain range of parameters.
ACKNOWLEDGMENT This work was carried out within the framework of the
NSERC/Hydro-Quebec/UQAC Industrial Chair on Atmospheric Icing of Power Network Equipment (CIGELE) as well as the Canada Research Chair, tier 1, on Engineering of Power Network Atmospheric Icing (INGIVRE) at Université du Québec à Chicoutimi. The authors wish to thank all the sponsors of the project.
REFERENCES [1] M. Farzaneh, “Ice Accretions on High-Voltage Conductors and
Insulators and Related Phenomena”, Phil. Trans. of the Royal Society, Vol. 358, No. 1776, pp. 297-3005, 2000.
[2] L. L. Alston and S. Zoeledziowski, “Growth of discharges on polluted insulation”, Proc. of IEE, Vol. 110, pp. 1260-1266, 1963.
[3] P. Claverie, “Predetermination of the Behavior of Polluted Insulators”, IEEE Trans. Power App. Syst., Vol. 90, pp. 1902-1908, 1971.
[4] N. Dhahbi-Megriche & A. Béroual, “Flashover Dynamic Model of Polluted Insulators under ac Voltage”, IEEE Trans. Dielectr. Electr. Insul., Vol. 7, pp 283-9, 2000.
[5] F. A. M. Rizk, “Mathematical Models for Pollution Flashover”, Electra, Vol. 78, pp. 71-103, 1981.
[6] J. Zhang and M. Farzaneh, “Computation of AC Critical Flashover Voltage of Insulators Covered with Ice”, Conf. Power System Technology, Beijing, China, Vol. 1, pp. 524-528, 1998.
[7] J. Zhang & M. Farzaneh, “Propagation of AC and DC Arcs on Ice Surfaces”, IEEE Trans. Dielectr. Electr. Insul., Vol. 7, pp. 269-276, 2000.
[8] F. Obenaus, “Die Ubersclagspannung Verschmutzter Isolatoren”, ETZ, Vol. 56, pp. 369-79 , 1935.
[9] R. Wilkins, “Flashover Voltage of High Voltage Insulators with Uniform Surface Pollution Films”, Proc. IEE, Vol. 116, pp. 457-465, 1969.
[10] C. Tavakoli, “Dynamic Modeling of AC Arc Development in Ice Surfaces”, Ph.D. Thesis, UQAC, Quebec, Canada, 2004.
[11] Rizk A. M., “Analysis of Dielectric Recovery with Reference to Dry-zone Arc on Polluted Insulators”, IEEE Conf. PES, Winter Power Meeting, New York, No. 71, C 134 1971.
[12] M. Farzaneh & J. Kiernicki, “Flashover Performance of ice-covered Insulators”, Canadian J. Elec. Computer Eng., Vol. 22, No. 3, pp. 95 - 109, 1997.
[13] M. Farzaneh, T. Baker, A. Bernstorf, K. Brown, W. A. Chisholm, C. de Tourreil, J. F. Drapeau, S. Fikke, J. M. George, E. Gnandt, T. Grisham, I. Gutman, R. Hartings, R. Kremer, G. Powell, L. Rolfseng, T. Rozek, D. L. Ruff, D. Shaffner, V. Sklenicka, R. Sundararajan, and J. Yu, “Insulator Icing Test Methods”, IEEE Tran.s. Power Del., Vol. 18, pp. 1503-1515, 2003,
[14] M. Farzaneh and I. Fofana, “Experimental Study and Analysis of Corona Discharge Parameters on an Ice Surface”, J. Phys. D: Appl. Phys, Vol. 37, pp. 721-729, 2004.
[15] M. Farzaneh and O.T. Melo, “Properties and Effect of Freezing and Winter Fog on Outline Insulators”, J. Cold Regions Sci. Techn., Vol. 19, pp. 33-46, 1990.
[16] M. Farzaneh and I. Fofana, “Study of Insulator Flashovers caused by Atmospheric Ice Accumulation”, J. Iranian Association of Electrical and Electronics Engineers, Iran, Vol. 1, No. 1, pp. 10-23, 2004.
[17] Yu. P. Raizer, Gas Discharge Physics, Springer, 1991.
0
20
40
60
80
0 20 40 60 80 100 Arcing Distance (cm)
Experiment [12] Static [7]Dynamic
V c (k
V)
40
50
60
70
80
90
0 50 100 150 200 (μS/cm)
V c (k
V)
Experiment [7] Static [7] Dynamic
60
100
140
180
0 10 20 30 40 50 60 70 80 w (cm)
Static [7] Dynamic
Experiment [19]
V c (k
V)
IEEE Transactions on Dielectrics and Electrical Insulation Vol. 13, No. 6; December 2006 1285
[18] Renardières Group, “Positive Discharge in Long Air Gaps at les Renardières”, Electra, No. 53, pp. 31-153, 1977.
[19] M. Farzaneh, J. Zhang & X. Chen, “Modeling of the AC Arc Discharge on Ice Surfaces”, IEEE Trans. Power Del., Vol. 12, , pp.325-338, 1997.
[20] O. Mayr, “Beitrag zur Theorie der Statischen und der Dynamischen Lichtbogens”, Archiv für Elektrotechnik, Vol. 37, pp. 588-608, 1943.
[21] R. Sundararajan and R. S. Gorur, “Dynamic Arc Modeling of Pollution Flashover of Insulators under DC Voltage”, IEEE Trans. Elec. Insul.,Vol. 28, pp. 209-218, 1993.
[22] I. Fofana and A. Béroual, “A Predictive Model of the Positive Discharge in Long Air Gaps under Pure and Oscillating Impulse Shapes”, J. Phys. D: Appl. Phys., Vol. 30, pp. 1653-67, 1997.
[23] S. Hesketh, “General Criterion for the Prediction of Pollution Flashover”, Proc. of IEE, Vol. 114, pp. 531-532, 1967.
[24] R. Chaarani, “Étude de l’Influence des Caractéristiques des Isolateurs sur leurs Performances Électriques dans des Conditions de Givrage”, Ph.D. Thesis, UQAC, Quebec, Canada, 2003.
Changiz Tavakoli was born in Iran, Shahrekord, in 1973. He received the Bachelor degree in electrical engineering from the Isfahan University of Technology in 1996. After one year of working in a construction company he joined the University of Tabriz, where he obtained the Master degree in control and instrumentation engineering in 1999. Following one year working in a consulting company, he joined the Université du Quebec à Chicoutimi (UQAC) where he completed his Ph.D. studies as well as his research in the CIGELE’s group in 2004. His main research interests include
high voltage phenomena, electrical insulation, modeling and computer simulation, and control engineering. He authored/co-authored more than ten scientific publications.
Masoud Farzaneh (M' 83-SM' 91) received the electrical engineering degree from the École Polytechnique of Iran in 1973. He received successively a doctoral degree in engineering from Institut nationale polytechnique and Université Paul Sabatier, in France, and a Doctorat d'État from the latter university. In 1980, Dr. Farzaneh spent two years as Associate Professor at Université des Sciences et de la Technologie d'Oran, Algeria. He came to Canada in 1982, where he joined Université du Québec à Chicoutimi (UQAC) as a research professor.
Following this, he became a full professor, Director of the Master's Degree program in engineering. He is Chair holder of the NSERC/Hydro-Quebec Industrial Chair on Atmospheric Icing (CIGELE) and the Canada Research Chair on Atmospheric Icing Engineering of Power Networks (INGIVRE). He is founder of the International Research Centre on Atmospheric Icing and Engineering of Power Networks (CENGIVRE) of which he is currently a Director. Dr. Farzaneh is author and co-author of more than 400 scientific publications in the area of high voltage, outdoor insulation and atmospheric icing. He is a Fellow of the Institution of Electrical Engineers (IEE), Fellow of the Engineering Institute of Canada (EIC), as well as a member of the New York Academy of Sciences, the American Association for the Advancement of Sciences, the Canadian Institute for Neutron Scattering, the International Association of Science and Technology for Development (IASTED), and a charter member of ISOPE, the International Society of Offshore and Polar Engineering. He is also Associate Editor of IEEE Transactions on Dielectrics and Electrical Insulation as well as Chairman or member of several working groups and task forces of IEEE and CIGRÉ dealing with atmospheric icing of HV equipment.
Issouf Fofana (M´05) received the Electro-mechanical Engineering degree in 1991 from the University of Abidjan (Côte d’Ivoire), the Master and Ph,D. degrees, respectively in 1993 and 1996, from the Ecole Centrale de Lyon – France, where he has been a postdoctoral researcher in 1997. From 1998 to 2000, he was researcher (fellow of the Alexander von Humboldt Stiftung from November 97 to August 1999) at the Schering Institute of High Voltage Engineering Techniques (University of Hanover, Germany). He joined the Université
du Québec à Chicoutimi (UQAC) as an Associate Researcher in 2000. He is currently Assistant Professor at the UQAC, Quebec, Canada. Since September 2005, Dr Fofana is Chair holder of the Canada Research Chair, tier 2, on Insulating Liquids and mixed dielectrics for Electrotechnology. He is currently appointed to the Technical Committee on Energy and Power Systems of theInternational Association of Science and Technology for Development (IASTED), and a member of the IEEE Task Force on Atmospheric Icing performance of line insulators. He authored/co-authored more than 70 scientific publications and has 3 patents.
Abderrahmane Beroual (M’92) was born on 30 October 1951. He received the Dipl. Ing. and Ph.D. degree in electrical engineering, respectively in 1976 from the Ecole Nationale Polytechnique of Algiers, Algeria and in 1979 from the Technical University of Wroclaw, Poland. In 1987, he obtained the Doctorat d’Etat ès Sciences Physiques degree from the Institut National Polytechnique of Grenoble, France. In 1980, he joined the Department of Electrical Engineering at the Ecole Nationale Polytechnique of Algiers. From 1983 to 1987, he was a researcher at the Laboratoire
d’Electrostatique et de Matériaux Diélectriques (LEMD) – CNRS of Grenoble, France and associate professor at the Joseph Fourier University of Grenoble. He received the title of professor at the Ecole Nationale Polytechnique of Algiers in 1987. In 1989, he joined the Ecole Centrale de Lyon, France where he is presently professor and the head of the Dielectric Materials and High Voltage team at the Centre de Génie Electrique de Lyon (CEGELY) - CNRS as well as responsible for the Master research program in electrical engineering. He is responsible for numerous research projects. His main research interests include high voltage insulation, dielectric materials, long air discharge and lightning, modeling of discharges and composites. He is author/co-author of more than 220 papers and has four patents. He supervised about 30 Ph.D. theses. He was the leader of the International Study Group on Streamer Propagation in Liquids of the IEEE – DEIS (1994 – 1998). He is on the International Advisory Committees of the International Conference on Dielectric Liquids and the International Conference on Advances in Processing, Testing and Application of Dielectric Materials.