dsm program progress report power...dsm program progress report note: the demand and energy savings...
TRANSCRIPT


DSM PROGRAM PROGRESS REPORT
Utility: Gulf Power Company
Program Name: Residential Energy Audit and Education
Measure Name: Residential Energy Audit
Program Start Date: June, 2011
Reporting Period: Annual 2013
A B C D E F G H I
Projected Projected Actual Actual Actual Actual
Total Cumulative Cumulative Annual Cumulative Cumulative Participation
Total Number of Number of Penetration Number of Number of Penetration Over (Under)
Number of Eligible Program Level Program Program Level Projected
Year Customers Customers Participants % Participants Participants % Participants
(From Cons. Plan) (From Cons. Plan) (From Cons. Plan) (D/C X 100) (Actual Participants) (Actual Participants (G/C X 100) (Column G - Column D)
Plan-To-Date)
2010 374,936 373,219 7,860 2.11% … … … …
2011 377,336 375,619 16,080 4.28% 10,029 10,029 2.67% (6,051)
2012 381,544 379,827 24,842 6.54% 8,863 18,892 4.97% (5,950)
2013 388,378 386,661 34,392 8.89% 7,952 26,844 6.94% (7,548)
2014 396,913 395,196 44,453 11.25%
2015 405,062 403,345 54,398 13.49%
2016 413,491 411,774 64,427 15.65%
2017 421,774 420,057 74,412 17.71%
2018 430,056 428,339 84,397 19.70%
2019 438,190 436,473 94,337 21.61%
Annual Demand and Energy Savings Per Installation Program Total
@ Meter @ Generator @ Meter @ Generator
Winter kW Reduction ------ ------ ------ ------
Summer kW Reduction ------ ------ ------ ------
Annual kWh Reduction ------ ------ ------ ------
Annual
Utility Cost per Installation: $247
Total Program Cost of the Utility ($000): $1,968
Net Benefits of Measures Installed During Reporting Period: N/A
Note: The demand and energy savings of this program are not applied toward the established DSM goals.
(2010 DSM PLAN)
Page 1

DSM PROGRAM PROGRESS REPORT
Utility: Gulf Power Company
Program Name: Residential Energy Audit and Education
Measure Name: Home Energy Reporting
Program Start Date: June, 2011
Reporting Period: Annual 2013
A B C D E F G H I
Projected Projected Actual Actual Actual Actual
Total Cumulative Cumulative Annual Cumulative Cumulative Participation
Total Number of Number of Penetration Number of Number of Penetration Over (Under)
Number of Eligible Program Level Program Program Level Projected
Year Customers Customers Participants % Participants Participants % Participants
(From Cons. Plan) (From Cons. Plan) (From Cons. Plan) (D/C X 100) (Actual Participants) (Actual Participants (G/C X 100) (Column G - Column D)
Plan-To-Date)
2010 374,936 373,219 35,000 9.38% … … … …
2011 377,336 375,619 35,000 9.32% 39,797 39,797 10.60% 4,797
2012 381,544 379,827 35,000 9.21% 39,213 39,213 10.32% 4,213
2013 388,378 386,661 35,000 9.05% 39,171 39,171 10.13% 4,171
2014 396,913 395,196 0 0.00%
2015 405,062 403,345 0 0.00%
2016 413,491 411,774 0 0.00%
2017 421,774 420,057 20,000 4.76%
2018 430,056 428,339 20,000 4.67%
2019 438,190 436,473 20,000 4.58%
Annual Demand and Energy Savings Per Installation Program Total
@ Meter @ Generator @ Meter @ Generator
Winter kW Reduction 0.06 0.08 2,350 3,134
Summer kW Reduction 0.06 0.08 2,350 3,134
Annual kWh Reduction 300 327 11,751,300 12,808,917
Annual
Utility Cost per Installation: $15
Total Program Cost of the Utility ($000): $591
Net Benefits of Measures Installed During Reporting Period: ($182,983)
(2010 DSM PLAN)
Page 2
DSM PROGRAM PROGRESS REPORT
Utility: Gulf Power Company
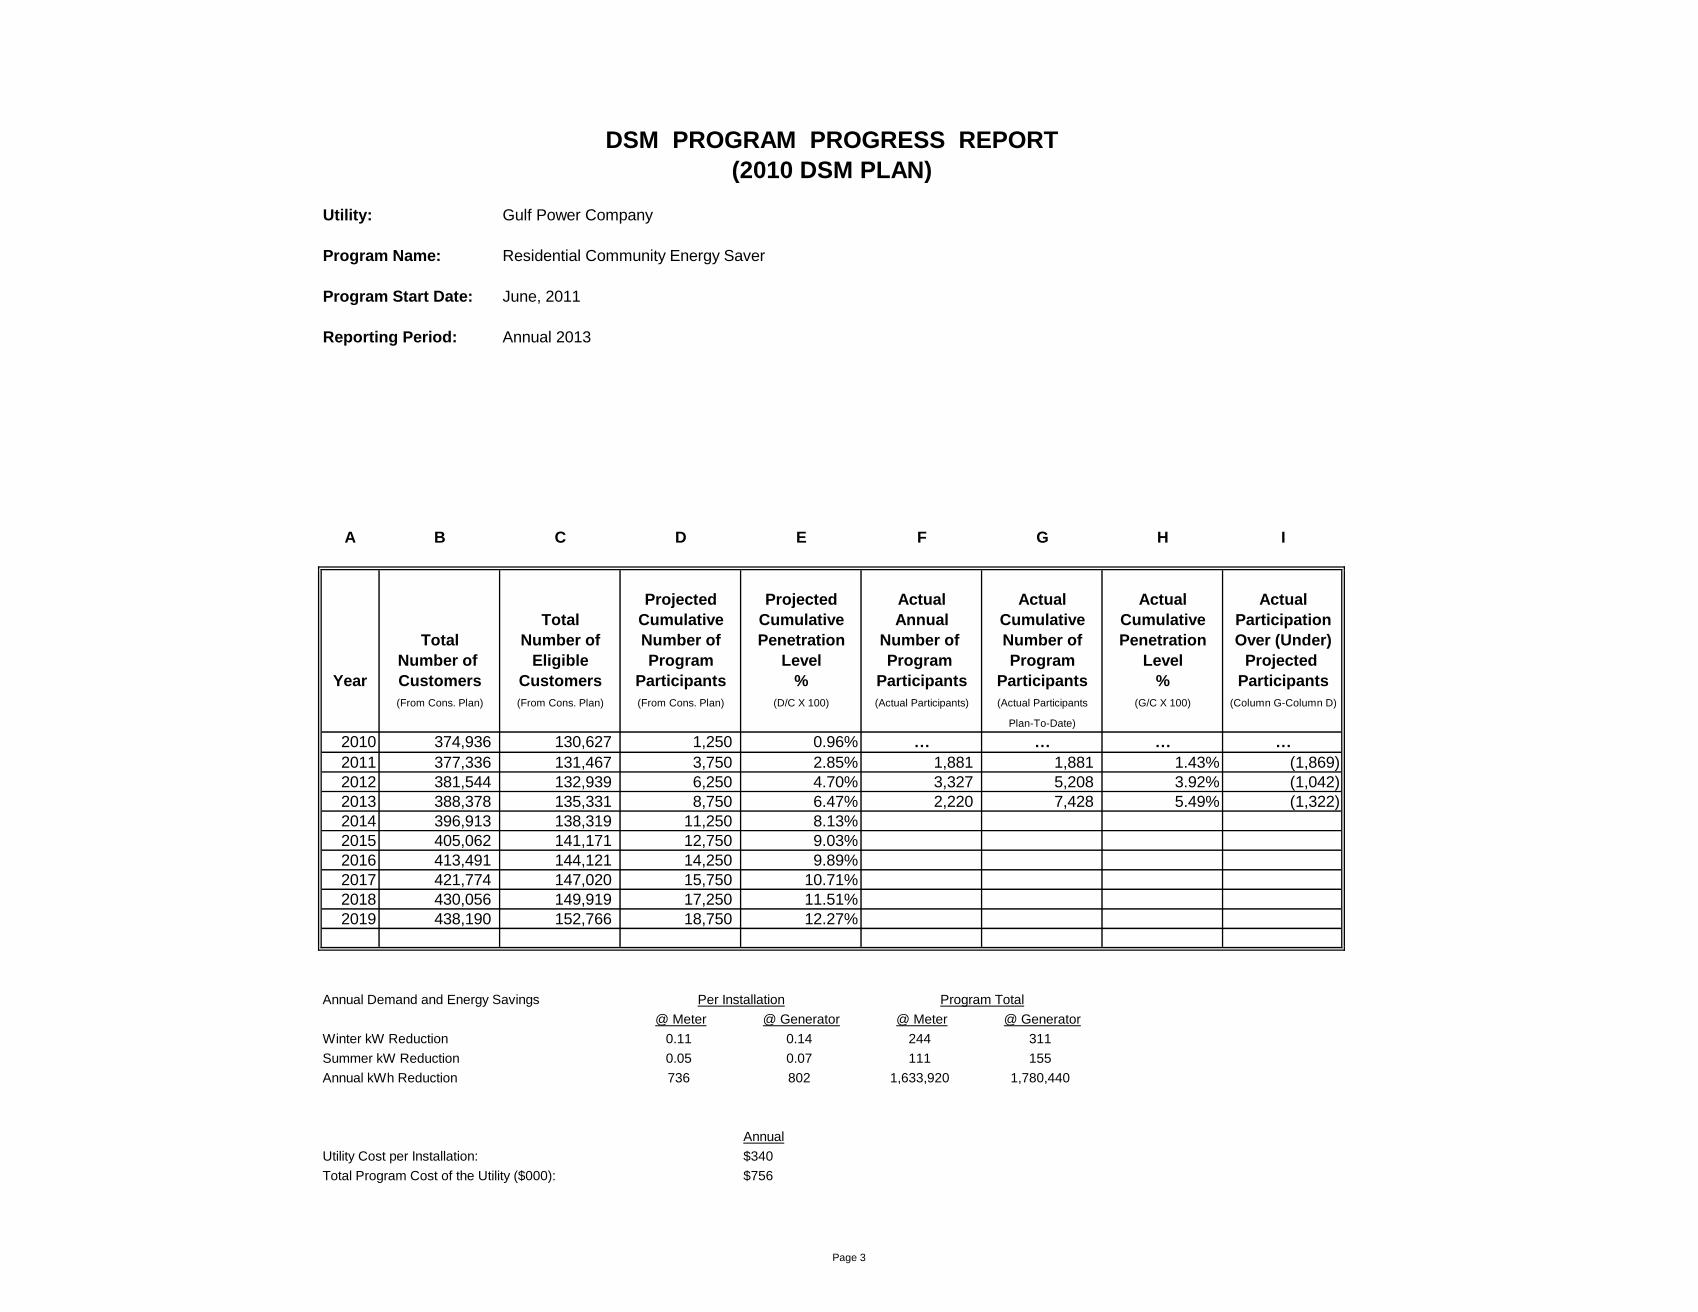
Program Name: Residential Community Energy Saver
Program Start Date: June, 2011
Reporting Period: Annual 2013
A B C D E F G H I
Projected Projected Actual Actual Actual Actual
Total Cumulative Cumulative Annual Cumulative Cumulative Participation
Total Number of Number of Penetration Number of Number of Penetration Over (Under)
Number of Eligible Program Level Program Program Level Projected
Year Customers Customers Participants % Participants Participants % Participants
(From Cons. Plan) (From Cons. Plan) (From Cons. Plan) (D/C X 100) (Actual Participants) (Actual Participants (G/C X 100) (Column G-Column D)
Plan-To-Date)
2010 374,936 130,627 1,250 0.96% … … … …
2011 377,336 131,467 3,750 2.85% 1,881 1,881 1.43% (1,869)
2012 381,544 132,939 6,250 4.70% 3,327 5,208 3.92% (1,042)
2013 388,378 135,331 8,750 6.47% 2,220 7,428 5.49% (1,322)
2014 396,913 138,319 11,250 8.13%
2015 405,062 141,171 12,750 9.03%
2016 413,491 144,121 14,250 9.89%
2017 421,774 147,020 15,750 10.71%
2018 430,056 149,919 17,250 11.51%
2019 438,190 152,766 18,750 12.27%
Annual Demand and Energy Savings Per Installation Program Total
@ Meter @ Generator @ Meter @ Generator
Winter kW Reduction 0.11 0.14 244 311
Summer kW Reduction 0.05 0.07 111 155
Annual kWh Reduction 736 802 1,633,920 1,780,440
Annual
Utility Cost per Installation: $340
Total Program Cost of the Utility ($000): $756
(2010 DSM PLAN)
Page 3
DSM PROGRAM PROGRESS REPORT
Utility: Gulf Power Company
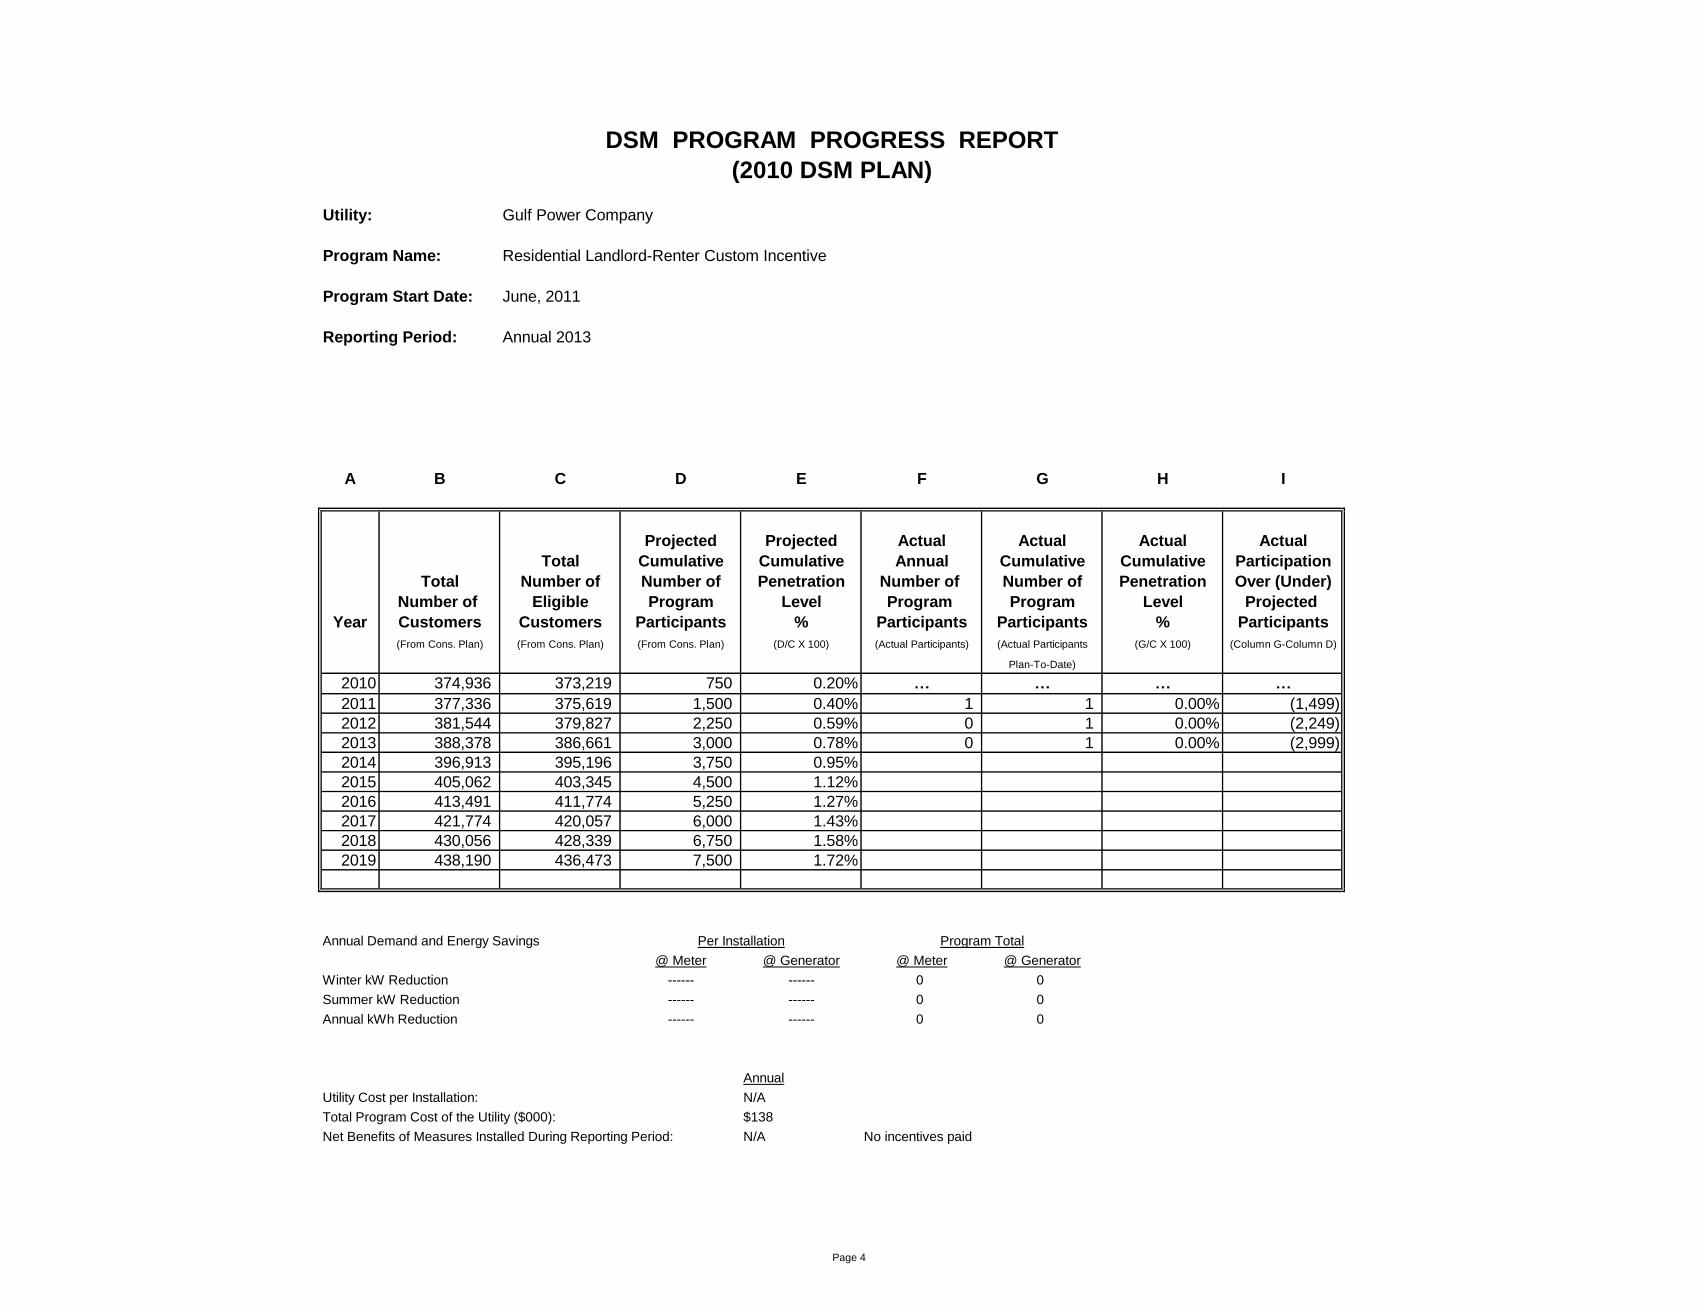
Program Name: Residential Landlord-Renter Custom Incentive
Program Start Date: June, 2011
Reporting Period: Annual 2013
A B C D E F G H I
Projected Projected Actual Actual Actual Actual
Total Cumulative Cumulative Annual Cumulative Cumulative Participation
Total Number of Number of Penetration Number of Number of Penetration Over (Under)
Number of Eligible Program Level Program Program Level Projected
Year Customers Customers Participants % Participants Participants % Participants
(From Cons. Plan) (From Cons. Plan) (From Cons. Plan) (D/C X 100) (Actual Participants) (Actual Participants (G/C X 100) (Column G-Column D)
Plan-To-Date)
2010 374,936 373,219 750 0.20% … … … …
2011 377,336 375,619 1,500 0.40% 1 1 0.00% (1,499)
2012 381,544 379,827 2,250 0.59% 0 1 0.00% (2,249)
2013 388,378 386,661 3,000 0.78% 0 1 0.00% (2,999)
2014 396,913 395,196 3,750 0.95%
2015 405,062 403,345 4,500 1.12%
2016 413,491 411,774 5,250 1.27%
2017 421,774 420,057 6,000 1.43%
2018 430,056 428,339 6,750 1.58%
2019 438,190 436,473 7,500 1.72%
Annual Demand and Energy Savings Per Installation Program Total
@ Meter @ Generator @ Meter @ Generator
Winter kW Reduction ------ ------ 0 0
Summer kW Reduction ------ ------ 0 0
Annual kWh Reduction ------ ------ 0 0
Annual
Utility Cost per Installation: N/A
Total Program Cost of the Utility ($000): $138
Net Benefits of Measures Installed During Reporting Period: N/A No incentives paid
(2010 DSM PLAN)
Page 4

DSM PROGRAM PROGRESS REPORT
Utility: Gulf Power Company
Program Name: Landlord/Renter Custom Incentive Program
Program Start Date: June, 2011
Reporting Period: Annual 2013
Meter Generator
Summer kW Winter kW Energy kWh Summer kW Winter kW Energy kWh
2010 … … … … … …
2011 121 0 286,242 159 0 375,922
2012 0 0 0 0 0 0
2013 0 0 0 0 0 0
2014
Cumulative 121 0 286,242 159 0 375,922
Projects - 2013 Meter Generator
Summer kW Winter kW Energy kWh Summer kW Winter kW Energy kWh
Total 0.00 0.00 0 0.00 0.00 0
(2010 DSM PLAN)
Page 5
DSM PROGRAM PROGRESS REPORT
Utility: Gulf Power Company
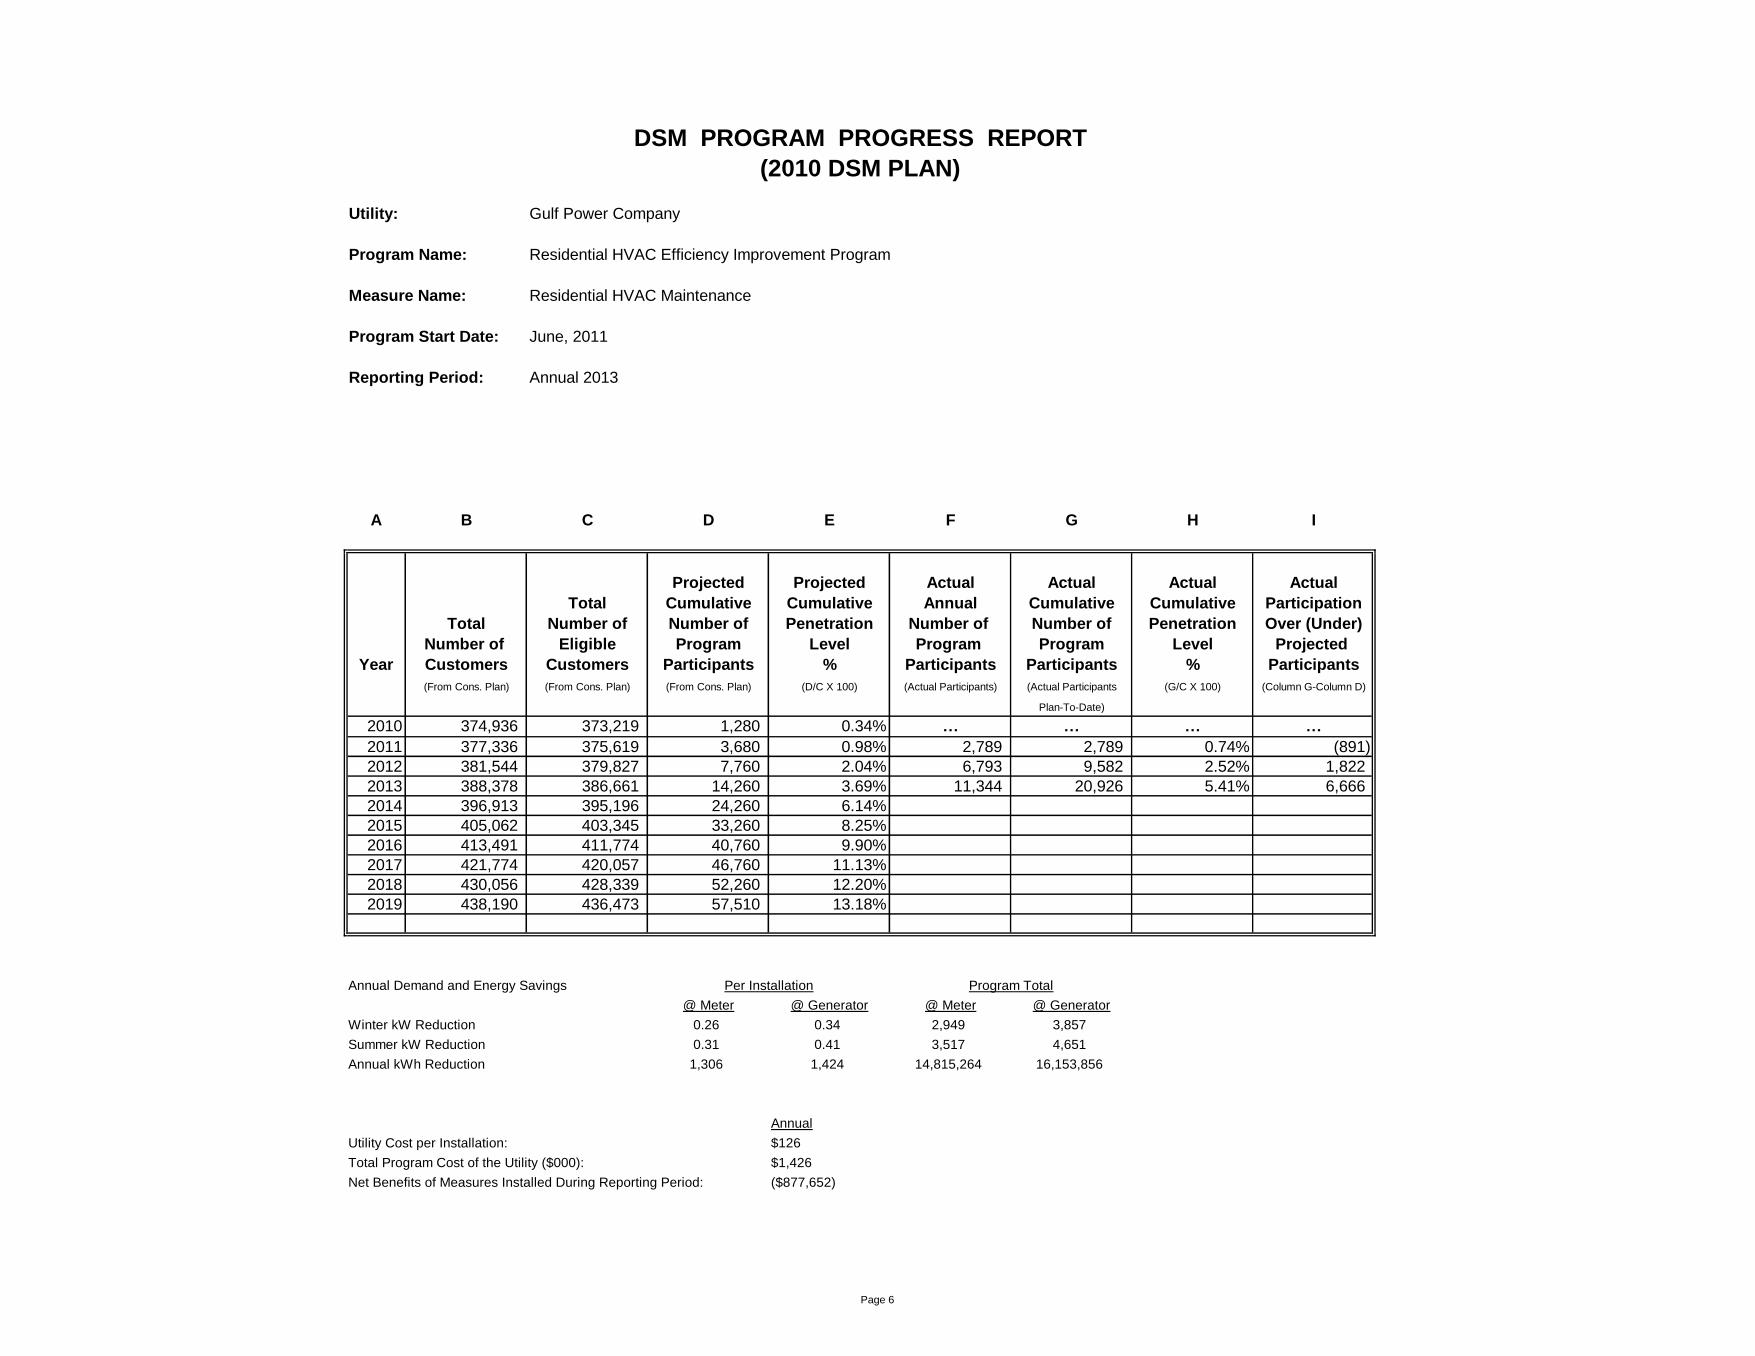
Program Name: Residential HVAC Efficiency Improvement Program
Measure Name: Residential HVAC Maintenance
Program Start Date: June, 2011
Reporting Period: Annual 2013
A B C D E F G H I
Projected Projected Actual Actual Actual Actual
Total Cumulative Cumulative Annual Cumulative Cumulative Participation
Total Number of Number of Penetration Number of Number of Penetration Over (Under)
Number of Eligible Program Level Program Program Level Projected
Year Customers Customers Participants % Participants Participants % Participants
(From Cons. Plan) (From Cons. Plan) (From Cons. Plan) (D/C X 100) (Actual Participants) (Actual Participants (G/C X 100) (Column G-Column D)
Plan-To-Date)
2010 374,936 373,219 1,280 0.34% … … … …
2011 377,336 375,619 3,680 0.98% 2,789 2,789 0.74% (891)
2012 381,544 379,827 7,760 2.04% 6,793 9,582 2.52% 1,822
2013 388,378 386,661 14,260 3.69% 11,344 20,926 5.41% 6,666
2014 396,913 395,196 24,260 6.14%
2015 405,062 403,345 33,260 8.25%
2016 413,491 411,774 40,760 9.90%
2017 421,774 420,057 46,760 11.13%
2018 430,056 428,339 52,260 12.20%
2019 438,190 436,473 57,510 13.18%
Annual Demand and Energy Savings Per Installation Program Total
@ Meter @ Generator @ Meter @ Generator
Winter kW Reduction 0.26 0.34 2,949 3,857
Summer kW Reduction 0.31 0.41 3,517 4,651
Annual kWh Reduction 1,306 1,424 14,815,264 16,153,856
Annual
Utility Cost per Installation: $126
Total Program Cost of the Utility ($000): $1,426
Net Benefits of Measures Installed During Reporting Period: ($877,652)
(2010 DSM PLAN)
Page 6

DSM PROGRAM PROGRESS REPORT
Utility: Gulf Power Company
Program Name: Residential HVAC Efficiency Improvement Program
Measure Name: Residential HVAC Early Retirement Tier 1
Program Start Date: June, 2011
Reporting Period: Annual 2013
A B C D E F G H I
Projected Projected Actual Actual Actual Actual
Total Cumulative Cumulative Annual Cumulative Cumulative Participation
Total Number of Number of Penetration Number of Number of Penetration Over (Under)
Number of Eligible Program Level Program Program Level Projected
Year Customers Customers Participants % Participants Participants % Participants
(From Cons. Plan) (From Cons. Plan) (From Cons. Plan) (D/C X 100) (Actual Participants) (Actual Participants (G/C X 100) (Column G-Column D)
Plan-To-Date)
2010 374,936 373,219 340 0.09% … … … …
2011 377,336 375,619 978 0.26% 176 176 0.05% (802)
2012 381,544 379,827 2,062 0.54% 803 979 0.26% (1,083)
2013 388,378 386,661 3,796 0.98% 1,251 2,230 0.58% (1,566)
2014 396,913 395,196 6,461 1.63%
2015 405,062 403,345 9,086 2.25%
2016 413,491 411,774 11,711 2.84%
2017 421,774 420,057 14,211 3.38%
2018 430,056 428,339 16,461 3.84%
2019 438,190 436,473 18,461 4.23%
Annual Demand and Energy Savings Per Installation Program Total
@ Meter @ Generator @ Meter @ Generator
Winter kW Reduction 1.16 1.52 1,451 1,902
Summer kW Reduction 1.24 1.63 1,551 2,039
Annual kWh Reduction 5,854 6,381 7,323,354 7,982,631
Annual
Utility Cost per Installation: $47
Total Program Cost of the Utility ($000): $59
Net Benefits of Measures Installed During Reporting Period: ($312,784)
(2010 DSM PLAN)
Page 7

DSM PROGRAM PROGRESS REPORT
Utility: Gulf Power Company
Program Name: Residential HVAC Efficiency Improvement Program
Measure Name: Residential HVAC Early Retirement Tier 2
Program Start Date: June, 2011
Reporting Period: Annual 2013
A B C D E F G H I
Projected Projected Actual Actual Actual Actual
Total Cumulative Cumulative Annual Cumulative Cumulative Participation
Total Number of Number of Penetration Number of Number of Penetration Over (Under)
Number of Eligible Program Level Program Program Level Projected
Year Customers Customers Participants % Participants Participants % Participants
(From Cons. Plan) (From Cons. Plan) (From Cons. Plan) (D/C X 100) (Actual Participants) (Actual Participants (G/C X 100) (Column G-Column D)
Plan-To-Date)
2010 374,936 373,219 50 0.01% … … … …
2011 377,336 375,619 140 0.04% 225 225 0.06% 85
2012 381,544 379,827 293 0.08% 547 772 0.20% 479
2013 388,378 386,661 538 0.14% 674 1,446 0.37% 908
2014 396,913 395,196 913 0.23%
2015 405,062 403,345 1,288 0.32%
2016 413,491 411,774 1,663 0.40%
2017 421,774 420,057 2,038 0.49%
2018 430,056 428,339 2,413 0.56%
2019 438,190 436,473 2,763 0.63%
Annual Demand and Energy Savings Per Installation Program Total
@ Meter @ Generator @ Meter @ Generator
Winter kW Reduction 1.25 1.64 843 1,105
Summer kW Reduction 1.33 1.75 896 1,180
Annual kWh Reduction 6,243 6,805 4,207,782 4,586,570
Annual
Utility Cost per Installation: $40
Total Program Cost of the Utility ($000): $27
Net Benefits of Measures Installed During Reporting Period: ($196,746)
(2010 DSM PLAN)
Page 8

DSM PROGRAM PROGRESS REPORT
Utility: Gulf Power Company
Program Name: Residential HVAC Efficiency Improvement Program
Measure Name: Residential HVAC Early Retirement Tier 3
Program Start Date: June, 2011
Reporting Period: Annual 2013
A B C D E F G H I
Projected Projected Actual Actual Actual Actual
Total Cumulative Cumulative Annual Cumulative Cumulative Participation
Total Number of Number of Penetration Number of Number of Penetration Over (Under)
Number of Eligible Program Level Program Program Level Projected
Year Customers Customers Participants % Participants Participants % Participants
(From Cons. Plan) (From Cons. Plan) (From Cons. Plan) (D/C X 100) (Actual Participants) (Actual Participants (G/C X 100) (Column G-Column D)
Plan-To-Date)
2010 374,936 373,219 10 0.00% … … … …
2011 377,336 375,619 30 0.01% 0 0 0.00% (30)
2012 381,544 379,827 60 0.02% 41 41 0.01% (19)
2013 388,378 386,661 110 0.03% 41 82 0.02% (28)
2014 396,913 395,196 185 0.05%
2015 405,062 403,345 260 0.06%
2016 413,491 411,774 335 0.08%
2017 421,774 420,057 410 0.10%
2018 430,056 428,339 465 0.11%
2019 438,190 436,473 505 0.12%
Annual Demand and Energy Savings Per Installation Program Total
@ Meter @ Generator @ Meter @ Generator
Winter kW Reduction 1.67 2.19 68 90
Summer kW Reduction 1.57 2.06 64 84
Annual kWh Reduction 7,132 7,774 292,412 318,734
Annual
Utility Cost per Installation: $456
Total Program Cost of the Utility ($000): $19
Net Benefits of Measures Installed During Reporting Period: ($14,504)
(2010 DSM PLAN)
Page 9

DSM PROGRAM PROGRESS REPORT
Utility: Gulf Power Company
Program Name: Residential HVAC Efficiency Improvement Program
Measure Name: Residential HVAC Efficiency Upgrade Tier 1
Program Start Date: June, 2011
Reporting Period: Annual 2013
A B C D E F G H I
Projected Projected Actual Actual Actual Actual
Total Cumulative Cumulative Annual Cumulative Cumulative Participation
Total Number of Number of Penetration Number of Number of Penetration Over (Under)
Number of Eligible Program Level Program Program Level Projected
Year Customers Customers Participants % Participants Participants % Participants
(From Cons. Plan) (From Cons. Plan) (From Cons. Plan) (D/C X 100) (Actual Participants) (Actual Participants (G/C X 100) (Column G-Column D)
Plan-To-Date)
2010 374,936 373,219 272 0.07% … … … …
2011 377,336 375,619 782 0.21% 30 30 0.01% (752)
2012 381,544 379,827 1,649 0.43% 187 217 0.06% (1,432)
2013 388,378 386,661 3,037 0.79% 331 548 0.14% (2,489)
2014 396,913 395,196 5,169 1.31%
2015 405,062 403,345 7,044 1.75%
2016 413,491 411,774 8,919 2.17%
2017 421,774 420,057 10,794 2.57%
2018 430,056 428,339 12,482 2.91%
2019 438,190 436,473 13,982 3.20%
Annual Demand and Energy Savings Per Installation Program Total
@ Meter @ Generator @ Meter @ Generator
Winter kW Reduction 0.43 0.56 142 185
Summer kW Reduction 0.32 0.42 106 139
Annual kWh Reduction 1,567 1,708 518,677 565,348
Annual
Utility Cost per Installation: $993
Total Program Cost of the Utility ($000): $329
Net Benefits of Measures Installed During Reporting Period: ($52,334)
(2010 DSM PLAN)
Page 10

DSM PROGRAM PROGRESS REPORT
Utility: Gulf Power Company
Program Name: Residential HVAC Efficiency Improvement Program
Measure Name: Residential HVAC Efficiency Upgrade Tier 2
Program Start Date: June, 2011
Reporting Period: Annual 2013
A B C D E F G H I
Projected Projected Actual Actual Actual Actual
Total Cumulative Cumulative Annual Cumulative Cumulative Participation
Total Number of Number of Penetration Number of Number of Penetration Over (Under)
Number of Eligible Program Level Program Program Level Projected
Year Customers Customers Participants % Participants Participants % Participants
(From Cons. Plan) (From Cons. Plan) (From Cons. Plan) (D/C X 100) (Actual Participants) (Actual Participants (G/C X 100) (Column G-Column D)
Plan-To-Date)
2010 374,936 373,219 38 0.01% … … … …
2011 377,336 375,619 110 0.03% 50 50 0.01% (60)
2012 381,544 379,827 232 0.06% 127 177 0.05% (55)
2013 388,378 386,661 428 0.11% 137 314 0.08% (114)
2014 396,913 395,196 728 0.18%
2015 405,062 403,345 1,028 0.25%
2016 413,491 411,774 1,328 0.32%
2017 421,774 420,057 1,628 0.39%
2018 430,056 428,339 1,903 0.44%
2019 438,190 436,473 2,153 0.49%
Annual Demand and Energy Savings Per Installation Program Total
@ Meter @ Generator @ Meter @ Generator
Winter kW Reduction 0.47 0.62 64 85
Summer kW Reduction 0.40 0.53 55 73
Annual kWh Reduction 1,891 2,061 259,067 282,357
Annual
Utility Cost per Installation: $1,454
Total Program Cost of the Utility ($000): $199
Net Benefits of Measures Installed During Reporting Period: ($37,376)
(2010 DSM PLAN)
Page 11

DSM PROGRAM PROGRESS REPORT
Utility: Gulf Power Company
Program Name: Residential HVAC Efficiency Improvement Program
Measure Name: Residential HVAC Efficiency Upgrade Tier 3
Program Start Date: June, 2011
Reporting Period: Annual 2013
A B C D E F G H I
Projected Projected Actual Actual Actual Actual
Total Cumulative Cumulative Annual Cumulative Cumulative Participation
Total Number of Number of Penetration Number of Number of Penetration Over (Under)
Number of Eligible Program Level Program Program Level Projected
Year Customers Customers Participants % Participants Participants % Participants
(From Cons. Plan) (From Cons. Plan) (From Cons. Plan) (D/C X 100) (Actual Participants) (Actual Participants (G/C X 100) (Column G-Column D)
Plan-To-Date)
2010 374,936 373,219 10 0.00% … … … …
2011 377,336 375,619 28 0.01% 45 45 0.01% 17
2012 381,544 379,827 59 0.02% 88 133 0.04% 74
2013 388,378 386,661 108 0.03% 85 218 0.06% 110
2014 396,913 395,196 183 0.05%
2015 405,062 403,345 258 0.06%
2016 413,491 411,774 333 0.08%
2017 421,774 420,057 408 0.10%
2018 430,056 428,339 468 0.11%
2019 438,190 436,473 518 0.12%
Annual Demand and Energy Savings Per Installation Program Total
@ Meter @ Generator @ Meter @ Generator
Winter kW Reduction 1.08 1.42 92 121
Summer kW Reduction 0.64 0.84 54 71
Annual kWh Reduction 3,456 3,767 293,760 320,195
Annual
Utility Cost per Installation: $161
Total Program Cost of the Utility ($000): $14
Net Benefits of Measures Installed During Reporting Period: ($21,457)
(2010 DSM PLAN)
Page 12

DSM PROGRAM PROGRESS REPORT
Utility: Gulf Power Company
Program Name: Residential HVAC Efficiency Improvement Program
Measure Name: Residential Duct Repair
Program Start Date: June, 2011
Reporting Period: Annual 2013
A B C D E F G H I
Projected Projected Actual Actual Actual Actual
Total Cumulative Cumulative Annual Cumulative Cumulative Participation
Total Number of Number of Penetration Number of Number of Penetration Over (Under)
Number of Eligible Program Level Program Program Level Projected
Year Customers Customers Participants % Participants Participants % Participants
(From Cons. Plan) (From Cons. Plan) (From Cons. Plan) (D/C X 100) (Actual Participants) (Actual Participants (G/C X 100) (Column G-Column D)
Plan-To-Date)
2010 374,936 373,219 0 0.00% … … … …
2011 377,336 375,619 1,000 0.27% 170 170 0.05% (830)
2012 381,544 379,827 3,000 0.79% 5,320 5,490 1.45% 2,490
2013 388,378 386,661 7,200 1.86% 8,021 13,511 3.49% 6,311
2014 396,913 395,196 13,700 3.47%
2015 405,062 403,345 19,700 4.88%
2016 413,491 411,774 25,100 6.10%
2017 421,774 420,057 30,100 7.17%
2018 430,056 428,339 34,900 8.15%
2019 438,190 436,473 39,400 9.03%
Annual Demand and Energy Savings Per Installation Program Total
@ Meter @ Generator @ Meter @ Generator
Winter kW Reduction 0.21 0.28 1,684 2,246
Summer kW Reduction 0.32 0.42 2,567 3,369
Annual kWh Reduction 1,382 1,506 11,085,022 12,079,626
Annual
Utility Cost per Installation: $126
Total Program Cost of the Utility ($000): $1,008
Net Benefits of Measures Installed During Reporting Period: ($556,828)
(2010 DSM PLAN)
Page 13

DSM PROGRAM PROGRESS REPORT
Utility: Gulf Power Company
Program Name: Residential HVAC Efficiency Improvement Program
Measure Name: Residential ECM Fan
Program Start Date: June, 2011
Reporting Period: Annual 2013
A B C D E F G H I
Projected Projected Actual Actual Actual Actual
Total Cumulative Cumulative Annual Cumulative Cumulative Participation
Total Number of Number of Penetration Number of Number of Penetration Over (Under)
Number of Eligible Program Level Program Program Level Projected
Year Customers Customers Participants % Participants Participants % Participants
(From Cons. Plan) (From Cons. Plan) (From Cons. Plan) (D/C X 100) (Actual Participants) (Actual Participants (G/C X 100) (Column G-Column D)
Plan-To-Date)
2010 374,936 373,219 0 0.00% … … … …
2011 377,336 375,619 400 0.11% 0 0 0.00% (400)
2012 381,544 379,827 1,150 0.30% 3 3 0.00% (1,147)
2013 388,378 386,661 2,425 0.63% 3 6 0.00% (2,419)
2014 396,913 395,196 4,425 1.12%
2015 405,062 403,345 7,425 1.84%
2016 413,491 411,774 9,675 2.35%
2017 421,774 420,057 11,475 2.73%
2018 430,056 428,339 12,975 3.03%
2019 438,190 436,473 14,175 3.25%
Annual Demand and Energy Savings Per Installation Program Total
@ Meter @ Generator @ Meter @ Generator
Winter kW Reduction 0.14 0.18 0.42 0.54
Summer kW Reduction 0.27 0.35 0.81 1.05
Annual kWh Reduction 1,109 1,209 3,327 3,627
Annual
Utility Cost per Installation: $113
Total Program Cost of the Utility ($000): $0
Net Benefits of Measures Installed During Reporting Period: ($165)
(2010 DSM PLAN)
Page 14

DSM PROGRAM PROGRESS REPORT
Utility: Gulf Power Company
Program Name: Residential Heat Pump Water Heater
Program Start Date: June, 2011
Reporting Period: Annual 2013
A B C D E F G H I
Projected Projected Actual Actual Actual Actual
Total Cumulative Cumulative Annual Cumulative Cumulative Participation
Total Number of Number of Penetration Number of Number of Penetration Over (Under)
Number of Eligible Program Level Program Program Level Projected
Year Customers Customers Participants % Participants Participants % Participants
(From Cons. Plan) (From Cons. Plan) (From Cons. Plan) (D/C X 100) (Actual Participants) (Actual Participants (G/C X 100) (Column G-Column D)
Plan-To-Date)
2010 374,936 373,219 100 0.03% … … … …
2011 377,336 375,619 400 0.11% 304 304 0.08% (96)
2012 381,544 379,827 1,000 0.26% 873 1,177 0.31% 177
2013 388,378 386,661 1,800 0.47% 2,006 3,183 0.82% 1,383
2014 396,913 395,196 2,800 0.71%
2015 405,062 403,345 4,000 0.99%
2016 413,491 411,774 5,200 1.26%
2017 421,774 420,057 6,600 1.57%
2018 430,056 428,339 8,200 1.91%
2019 438,190 436,473 10,000 2.29%
Annual Demand and Energy Savings Per Installation Program Total
@ Meter @ Generator @ Meter @ Generator
Winter kW Reduction 0.37 0.49 742 983
Summer kW Reduction 0.10 0.13 201 261
Annual kWh Reduction 1,348 1,469 2,704,088 2,946,814
Annual
Utility Cost per Installation: $117
Total Program Cost of the Utility ($000): $234
Net Benefits of Measures Installed During Reporting Period: ($322,417)
(2010 DSM PLAN)
Page 15

DSM PROGRAM PROGRESS REPORT
Utility: Gulf Power Company
Program Name: Residential Ceiling Insulation Program
Program Start Date: June, 2011
Reporting Period: Annual 2013
A B C D E F G H I
Projected Projected Actual Actual Actual Actual
Total Cumulative Cumulative Annual Cumulative Cumulative Participation
Total Number of Number of Penetration Number of Number of Penetration Over (Under)
Number of Eligible Program Level Program Program Level Projected
Year Customers Customers Participants % Participants Participants % Participants
(From Cons. Plan) (From Cons. Plan) (From Cons. Plan) (D/C X 100) (Actual Participants) (Actual Participants (G/C X 100) (Column G-Column D)
Plan-To-Date)
2010 374,936 373,219 100 0.03% … … … …
2011 377,336 375,619 300 0.08% 394 394 0.10% 94
2012 381,544 379,827 650 0.17% 780 1,174 0.31% 524
2013 388,378 386,661 1,150 0.30% 509 1,683 0.44% 533
2014 396,913 395,196 1,650 0.42%
2015 405,062 403,345 2,150 0.53%
2016 413,491 411,774 2,650 0.64%
2017 421,774 420,057 3,150 0.75%
2018 430,056 428,339 3,650 0.85%
2019 438,190 436,473 4,150 0.95%
Annual Demand and Energy Savings Per Installation Program Total
@ Meter @ Generator @ Meter @ Generator
Winter kW Reduction 0.80 1.05 407 534
Summer kW Reduction 0.10 0.13 51 66
Annual kWh Reduction 575 627 292,675 319,143
Annual
Utility Cost per Installation: $294
Total Program Cost of the Utility ($000): $150
Net Benefits of Measures Installed During Reporting Period: ($35,900)
(2010 DSM PLAN)
Page 16
DSM PROGRAM PROGRESS REPORT
Utility: Gulf Power Company
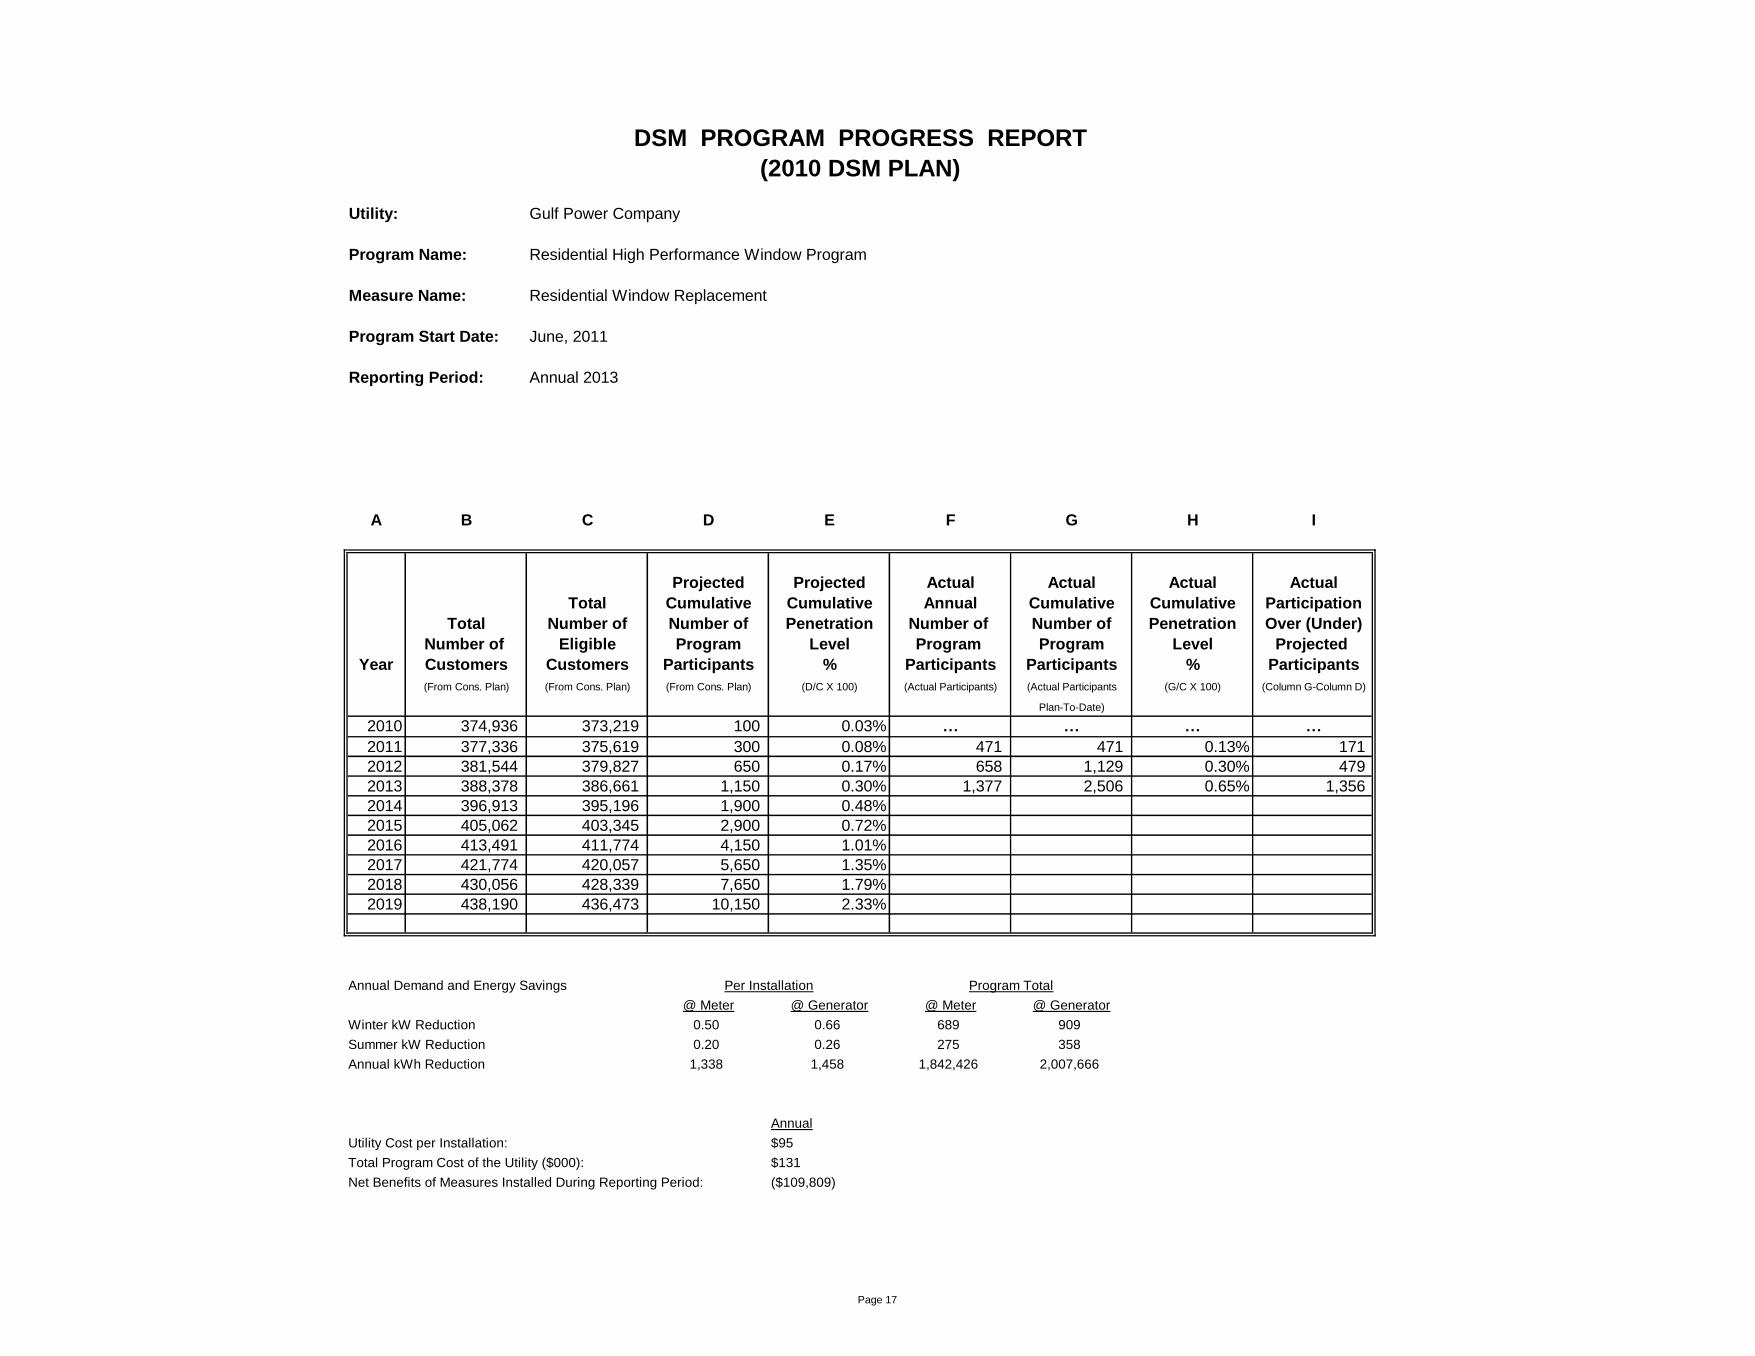
Program Name: Residential High Performance Window Program
Measure Name: Residential Window Replacement
Program Start Date: June, 2011
Reporting Period: Annual 2013
A B C D E F G H I
Projected Projected Actual Actual Actual Actual
Total Cumulative Cumulative Annual Cumulative Cumulative Participation
Total Number of Number of Penetration Number of Number of Penetration Over (Under)
Number of Eligible Program Level Program Program Level Projected
Year Customers Customers Participants % Participants Participants % Participants
(From Cons. Plan) (From Cons. Plan) (From Cons. Plan) (D/C X 100) (Actual Participants) (Actual Participants (G/C X 100) (Column G-Column D)
Plan-To-Date)
2010 374,936 373,219 100 0.03% … … … …
2011 377,336 375,619 300 0.08% 471 471 0.13% 171
2012 381,544 379,827 650 0.17% 658 1,129 0.30% 479
2013 388,378 386,661 1,150 0.30% 1,377 2,506 0.65% 1,356
2014 396,913 395,196 1,900 0.48%
2015 405,062 403,345 2,900 0.72%
2016 413,491 411,774 4,150 1.01%
2017 421,774 420,057 5,650 1.35%
2018 430,056 428,339 7,650 1.79%
2019 438,190 436,473 10,150 2.33%
Annual Demand and Energy Savings Per Installation Program Total
@ Meter @ Generator @ Meter @ Generator
Winter kW Reduction 0.50 0.66 689 909
Summer kW Reduction 0.20 0.26 275 358
Annual kWh Reduction 1,338 1,458 1,842,426 2,007,666
Annual
Utility Cost per Installation: $95
Total Program Cost of the Utility ($000): $131
Net Benefits of Measures Installed During Reporting Period: ($109,809)
(2010 DSM PLAN)
Page 17

DSM PROGRAM PROGRESS REPORT
Utility: Gulf Power Company
Program Name: Residential High Performance Window Program
Measure Name: Residential Window Film
Program Start Date: June, 2011
Reporting Period: Annual 2013
A B C D E F G H I
Projected Projected Actual Actual Actual Actual
Total Cumulative Cumulative Annual Cumulative Cumulative Participation
Total Number of Number of Penetration Number of Number of Penetration Over (Under)
Number of Eligible Program Level Program Program Level Projected
Year Customers Customers Participants % Participants Participants % Participants
(From Cons. Plan) (From Cons. Plan) (From Cons. Plan) (D/C X 100) (Actual Participants) (Actual Participants (G/C X 100) (Column G-Column D)
Plan-To-Date)
2010 374,936 373,219 50 0.01% … … … …
2011 377,336 375,619 150 0.04% 64 64 0.02% (86)
2012 381,544 379,827 350 0.09% 178 242 0.06% (108)
2013 388,378 386,661 550 0.14% 160 402 0.10% (148)
2014 396,913 395,196 750 0.19%
2015 405,062 403,345 950 0.24%
2016 413,491 411,774 1,150 0.28%
2017 421,774 420,057 1,350 0.32%
2018 430,056 428,339 1,550 0.36%
2019 438,190 436,473 1,750 0.40%
Annual Demand and Energy Savings Per Installation Program Total
@ Meter @ Generator @ Meter @ Generator
Winter kW Reduction 0.00 0.00 0 0
Summer kW Reduction 0.20 0.26 32 42
Annual kWh Reduction 788 859 126,080 137,440
Annual
Utility Cost per Installation: $186
Total Program Cost of the Utility ($000): $30
Net Benefits of Measures Installed During Reporting Period: ($10,664)
(2010 DSM PLAN)
Page 18

DSM PROGRAM PROGRESS REPORT
Utility: Gulf Power Company
Program Name: Residential Reflective Roof
Program Start Date: June, 2011
Reporting Period: Annual 2013
A B C D E F G H I
Projected Projected Actual Actual Actual Actual
Total Cumulative Cumulative Annual Cumulative Cumulative Participation
Total Number of Number of Penetration Number of Number of Penetration Over (Under)
Number of Eligible Program Level Program Program Level Projected
Year Customers Customers Participants % Participants Participants % Participants
(From Cons. Plan) (From Cons. Plan) (From Cons. Plan) (D/C X 100) (Actual Participants) (Actual Participants (G/C X 100) (Column G-Column D)
Plan-To-Date)
2010 374,936 373,219 100 0.03% … … … …
2011 377,336 375,619 300 0.08% 30 30 0.01% (270)
2012 381,544 379,827 600 0.16% 229 259 0.07% (341)
2013 388,378 386,661 1,000 0.26% 517 776 0.20% (224)
2014 396,913 395,196 1,500 0.38%
2015 405,062 403,345 2,100 0.52%
2016 413,491 411,774 2,800 0.68%
2017 421,774 420,057 3,500 0.83%
2018 430,056 428,339 4,200 0.98%
2019 438,190 436,473 4,900 1.12%
Annual Demand and Energy Savings Per Installation Program Total
@ Meter @ Generator @ Meter @ Generator
Winter kW Reduction 0.00 0.00 0 0
Summer kW Reduction 0.41 0.54 212 279
Annual kWh Reduction 1,029 1,122 531,993 580,074
Annual
Utility Cost per Installation: $270
Total Program Cost of the Utility ($000): $140
Net Benefits of Measures Installed During Reporting Period: ($31,013)
(2010 DSM PLAN)
Page 19

DSM PROGRAM PROGRESS REPORT
Utility: Gulf Power Company
Program Name: Residential Variable Speed/Flow Pool Pump
Program Start Date: June, 2011
Reporting Period: Annual 2013
A B C D E F G H I
Projected Projected Actual Actual Actual Actual
Total Cumulative Cumulative Annual Cumulative Cumulative Participation
Total Number of Number of Penetration Number of Number of Penetration Over (Under)
Number of Eligible Program Level Program Program Level Projected
Year Customers Customers Participants % Participants Participants % Participants
(From Cons. Plan) (From Cons. Plan) (From Cons. Plan) (D/C X 100) (Actual Participants) (Actual Participants (G/C X 100) (Column G-Column D)
Plan-To-Date)
2010 374,936 373,219 100 0.03% … … … …
2011 377,336 375,619 250 0.07% 1,363 1,363 0.36% 1,113
2012 381,544 379,827 500 0.13% 3,491 4,854 1.28% 4,354
2013 388,378 386,661 850 0.22% 998 5,852 1.51% 5,002
2014 396,913 395,196 1,250 0.32%
2015 405,062 403,345 1,650 0.41%
2016 413,491 411,774 2,050 0.50%
2017 421,774 420,057 2,450 0.58%
2018 430,056 428,339 2,850 0.67%
2019 438,190 436,473 3,250 0.74%
Annual Demand and Energy Savings Per Installation Program Total
@ Meter @ Generator @ Meter @ Generator
Winter kW Reduction 1.15 1.51 1,148 1,507
Summer kW Reduction 1.15 1.51 1,148 1,507
Annual kWh Reduction 2,494 2,718 2,489,012 2,712,564
Annual
Utility Cost per Installation: $169
Total Program Cost of the Utility ($000): $169
Net Benefits of Measures Installed During Reporting Period: ($67,586)
(2010 DSM PLAN)
Page 20

DSM PROGRAM PROGRESS REPORT
Utility: Gulf Power Company
Program Name: Energy Select (formerly GoodCents Select)
Program Start Date: June, 2011
Reporting Period: Annual 2013
A B C D E F G H I
Projected Projected Actual Actual Actual Actual
Total Cumulative Cumulative Annual Cumulative Cumulative Participation
Total Number of Number of Penetration Number of Number of Penetration Over (Under)
Number of Eligible Program Level Program Program Level Projected
Year Customers Customers Participants % Participants Participants % Participants
(From Cons. Plan) (From Cons. Plan) (From Cons. Plan) (D/C X 100) (Actual Participants) (Actual Participants (G/C X 100) (Column G-Column D)
Plan-To-Date)
2010 374,936 373,219 1,000 0.27% … … … …
2011 377,336 375,619 2,000 0.53% (667) (667) -0.18% (2,667)
2012 381,544 379,827 3,000 0.79% (416) (1,083) -0.29% (4,083)
2013 388,378 386,661 4,000 1.03% 2,149 1,066 0.28% (2,934)
2014 396,913 395,196 5,000 1.27%
2015 405,062 403,345 6,000 1.49%
2016 413,491 411,774 7,000 1.70%
2017 421,774 420,057 8,000 1.90%
2018 430,056 428,339 9,000 2.10%
2019 438,190 436,473 10,000 2.29%
Annual Demand and Energy Savings Per Installation Program Total
@ Meter @ Generator @ Meter @ Generator
Winter kW Reduction 2.20 2.89 4,728 6,209
Summer kW Reduction 1.73 2.27 3,718 4,883
Annual kWh Reduction 762 831 1,637,538 1,784,916
Annual
Utility Cost per Installation: $1,656
Total Program Cost of the Utility ($000): $3,559
Net Benefits of Measures Installed During Reporting Period: ($1,630,988)
(2010 DSM PLAN)
Page 21

DSM PROGRAM PROGRESS REPORT
Utility: Gulf Power Company
Program Name: Energy Select Lite
Program Start Date: June, 2011
Reporting Period: Annual 2013
A B C D E F G H I
Projected Projected Actual Actual Actual Actual
Total Cumulative Cumulative Annual Cumulative Cumulative Participation
Total Number of Number of Penetration Number of Number of Penetration Over (Under)
Number of Eligible Program Level Program Program Level Projected
Year Customers Customers Participants % Participants Participants % Participants
(From Cons. Plan) (From Cons. Plan) (From Cons. Plan) (D/C X 100) (Actual Participants) (Actual Participants (G/C X 100) (Column G-Column D)
Plan-To-Date)
2010 374,936 373,219 300 0.08% … … … …
2011 377,336 375,619 900 0.24% 992 992 0.26% 92
2012 381,544 379,827 1,500 0.39% 2,215 3,207 0.84% 1,707
2013 388,378 386,661 2,100 0.54% 0 3,207 0.83% 1,107
2014 396,913 395,196 2,700 0.68%
2015 405,062 403,345 3,300 0.82%
2016 413,491 411,774 3,300 0.80%
2017 421,774 420,057 3,300 0.79%
2018 430,056 428,339 3,300 0.77%
2019 438,190 436,473 3,300 0.76%
Annual Demand and Energy Savings Per Installation Program Total
@ Meter @ Generator @ Meter @ Generator
Winter kW Reduction 1.10 1.44 0 0
Summer kW Reduction 0.98 1.29 0 0
Annual kWh Reduction 556 606 0 0
Annual
Utility Cost per Installation: N/A
Total Program Cost of the Utility ($000): $0
Net Benefits of Measures Installed During Reporting Period: N/A Combined with Energy Select for 2013 reporting
(2010 DSM PLAN)
Page 22
DSM PROGRAM PROGRESS REPORT
Utility: Gulf Power Company
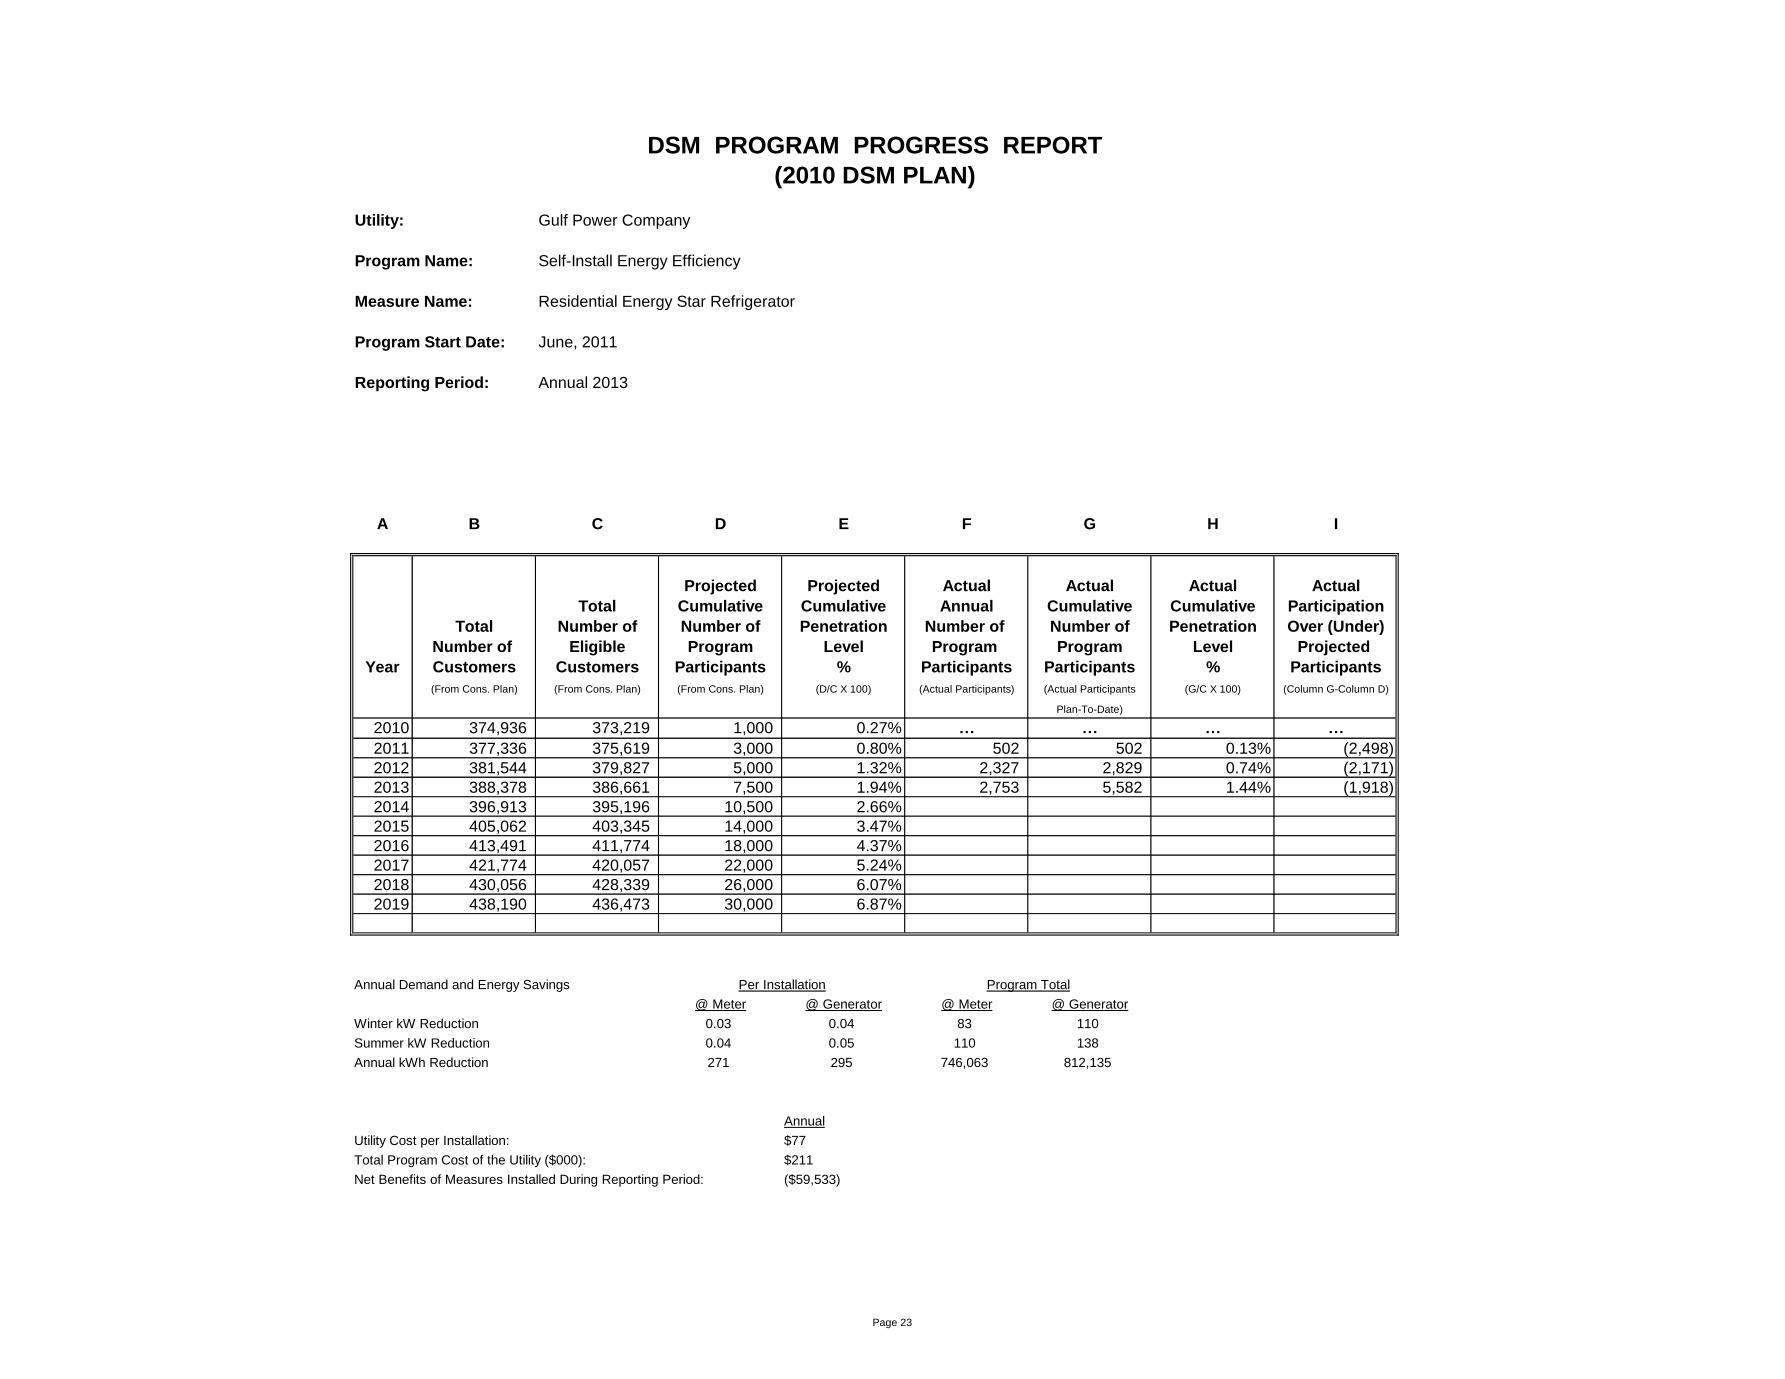
Program Name: Self-Install Energy Efficiency
Measure Name: Residential Energy Star Refrigerator
Program Start Date: June, 2011
Reporting Period: Annual 2013
A B C D E F G H I
Projected Projected Actual Actual Actual Actual
Total Cumulative Cumulative Annual Cumulative Cumulative Participation
Total Number of Number of Penetration Number of Number of Penetration Over (Under)
Number of Eligible Program Level Program Program Level Projected
Year Customers Customers Participants % Participants Participants % Participants
(From Cons. Plan) (From Cons. Plan) (From Cons. Plan) (D/C X 100) (Actual Participants) (Actual Participants (G/C X 100) (Column G-Column D)
Plan-To-Date)
2010 374,936 373,219 1,000 0.27% … … … …
2011 377,336 375,619 3,000 0.80% 502 502 0.13% (2,498)
2012 381,544 379,827 5,000 1.32% 2,327 2,829 0.74% (2,171)
2013 388,378 386,661 7,500 1.94% 2,753 5,582 1.44% (1,918)
2014 396,913 395,196 10,500 2.66%
2015 405,062 403,345 14,000 3.47%
2016 413,491 411,774 18,000 4.37%
2017 421,774 420,057 22,000 5.24%
2018 430,056 428,339 26,000 6.07%
2019 438,190 436,473 30,000 6.87%
Annual Demand and Energy Savings Per Installation Program Total
@ Meter @ Generator @ Meter @ Generator
Winter kW Reduction 0.03 0.04 83 110
Summer kW Reduction 0.04 0.05 110 138
Annual kWh Reduction 271 295 746,063 812,135
Annual
Utility Cost per Installation: $77
Total Program Cost of the Utility ($000): $211
Net Benefits of Measures Installed During Reporting Period: ($59,533)
(2010 DSM PLAN)
Page 23

DSM PROGRAM PROGRESS REPORT
Utility: Gulf Power Company
Program Name: Self-Install Energy Efficiency
Measure Name: Residential Energy Star Freezer
Program Start Date: June, 2011
Reporting Period: Annual 2013
A B C D E F G H I
Projected Projected Actual Actual Actual Actual
Total Cumulative Cumulative Annual Cumulative Cumulative Participation
Total Number of Number of Penetration Number of Number of Penetration Over (Under)
Number of Eligible Program Level Program Program Level Projected
Year Customers Customers Participants % Participants Participants % Participants
(From Cons. Plan) (From Cons. Plan) (From Cons. Plan) (D/C X 100) (Actual Participants) (Actual Participants (G/C X 100) (Column G-Column D)
Plan-To-Date)
2010 374,936 373,219 200 0.05% … … … …
2011 377,336 375,619 600 0.16% 36 36 0.01% (564)
2012 381,544 379,827 1,100 0.29% 199 235 0.06% (865)
2013 388,378 386,661 1,800 0.47% 174 409 0.11% (1,391)
2014 396,913 395,196 2,500 0.63%
2015 405,062 403,345 3,200 0.79%
2016 413,491 411,774 3,900 0.95%
2017 421,774 420,057 4,600 1.10%
2018 430,056 428,339 5,300 1.24%
2019 438,190 436,473 6,000 1.37%
Annual Demand and Energy Savings Per Installation Program Total
@ Meter @ Generator @ Meter @ Generator
Winter kW Reduction 0.010 0.013 2 2
Summer kW Reduction 0.011 0.014 2 2
Annual kWh Reduction 82 89 14,268 15,486
Annual
Utility Cost per Installation: $77
Total Program Cost of the Utility ($000): $13
Net Benefits of Measures Installed During Reporting Period: ($2,177)
(2010 DSM PLAN)
Page 24
DSM PROGRAM PROGRESS REPORT
Utility: Gulf Power Company
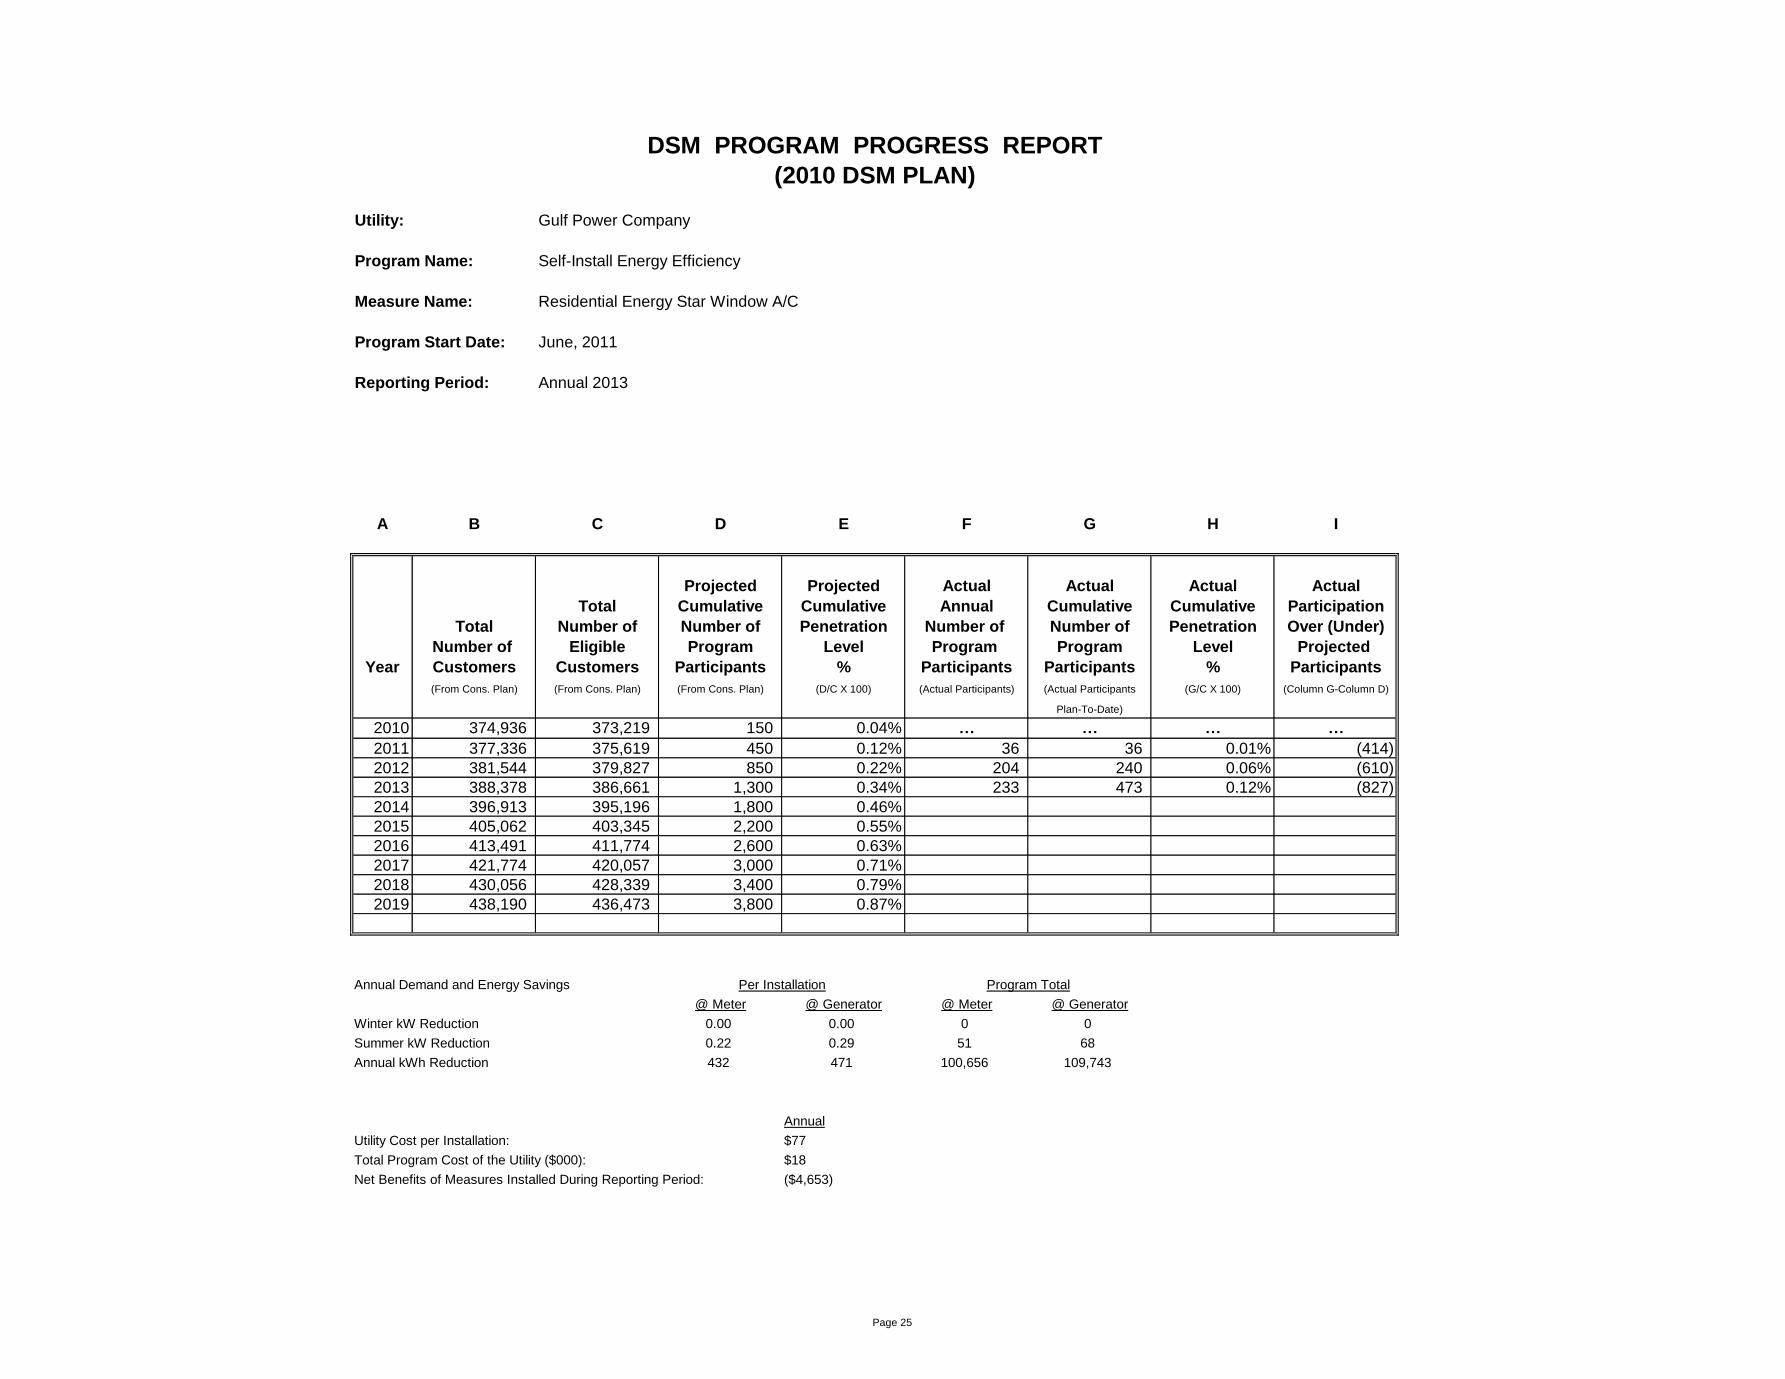
Program Name: Self-Install Energy Efficiency
Measure Name: Residential Energy Star Window A/C
Program Start Date: June, 2011
Reporting Period: Annual 2013
A B C D E F G H I
Projected Projected Actual Actual Actual Actual
Total Cumulative Cumulative Annual Cumulative Cumulative Participation
Total Number of Number of Penetration Number of Number of Penetration Over (Under)
Number of Eligible Program Level Program Program Level Projected
Year Customers Customers Participants % Participants Participants % Participants
(From Cons. Plan) (From Cons. Plan) (From Cons. Plan) (D/C X 100) (Actual Participants) (Actual Participants (G/C X 100) (Column G-Column D)
Plan-To-Date)
2010 374,936 373,219 150 0.04% … … … …
2011 377,336 375,619 450 0.12% 36 36 0.01% (414)
2012 381,544 379,827 850 0.22% 204 240 0.06% (610)
2013 388,378 386,661 1,300 0.34% 233 473 0.12% (827)
2014 396,913 395,196 1,800 0.46%
2015 405,062 403,345 2,200 0.55%
2016 413,491 411,774 2,600 0.63%
2017 421,774 420,057 3,000 0.71%
2018 430,056 428,339 3,400 0.79%
2019 438,190 436,473 3,800 0.87%
Annual Demand and Energy Savings Per Installation Program Total
@ Meter @ Generator @ Meter @ Generator
Winter kW Reduction 0.00 0.00 0 0
Summer kW Reduction 0.22 0.29 51 68
Annual kWh Reduction 432 471 100,656 109,743
Annual
Utility Cost per Installation: $77
Total Program Cost of the Utility ($000): $18
Net Benefits of Measures Installed During Reporting Period: ($4,653)
(2010 DSM PLAN)
Page 25

DSM PROGRAM PROGRESS REPORT
Utility: Gulf Power Company
Program Name: Self-Install Energy Efficiency
Measure Name: Residential Energy Star Clothes Washer
Program Start Date: June, 2011
Reporting Period: Annual 2013
A B C D E F G H I
Projected Projected Actual Actual Actual Actual
Total Cumulative Cumulative Annual Cumulative Cumulative Participation
Total Number of Number of Penetration Number of Number of Penetration Over (Under)
Number of Eligible Program Level Program Program Level Projected
Year Customers Customers Participants % Participants Participants % Participants
(From Cons. Plan) (From Cons. Plan) (From Cons. Plan) (D/C X 100) (Actual Participants) (Actual Participants (G/C X 100) (Column G-Column D)
Plan-To-Date)
2010 374,936 373,219 500 0.13% … … … …
2011 377,336 375,619 2,000 0.53% 417 417 0.11% (1,583)
2012 381,544 379,827 4,500 1.18% 2,198 2,615 0.69% (1,885)
2013 388,378 386,661 8,000 2.07% 2,750 5,365 1.39% (2,635)
2014 396,913 395,196 12,500 3.16%
2015 405,062 403,345 18,000 4.46%
2016 413,491 411,774 24,500 5.95%
2017 421,774 420,057 31,500 7.50%
2018 430,056 428,339 38,500 8.99%
2019 438,190 436,473 45,500 10.42%
Annual Demand and Energy Savings Per Installation Program Total
@ Meter @ Generator @ Meter @ Generator
Winter kW Reduction 0.028 0.037 77 102
Summer kW Reduction 0.028 0.037 77 102
Annual kWh Reduction 197 215 541,750 591,250
Annual
Utility Cost per Installation: $77
Total Program Cost of the Utility ($000): $211
Net Benefits of Measures Installed During Reporting Period: ($63,274)
(2010 DSM PLAN)
Page 26

DSM PROGRAM PROGRESS REPORT
Utility: Gulf Power Company
Program Name: Self-Install Energy Efficiency
Measure Name: Residential CFL
Program Start Date: June, 2011
Reporting Period: Annual 2013
A B C D E F G H I
Projected Projected Actual Actual Actual Actual
Total Cumulative Cumulative Annual Cumulative Cumulative Participation
Total Number of Number of Penetration Number of Number of Penetration Over (Under)
Number of Eligible Program Level Program Program Level Projected
Year Customers Customers Participants % Participants Participants % Participants
(From Cons. Plan) (From Cons. Plan) (From Cons. Plan) (D/C X 100) (Actual Participants) (Actual Participants (G/C X 100) (Column G-Column D)
Plan-To-Date)
2010 374,936 373,219 250,000 66.98% … … … …
2011 377,336 375,619 400,000 106.49% 3,200 3,200 0.85% (396,800)
2012 381,544 379,827 600,000 157.97% 77,646 80,846 21.28% (519,154)
2013 388,378 386,661 600,000 155.17% 0 80,846 20.91% (519,154)
2014 396,913 395,196 600,000 151.82%
2015 405,062 403,345 600,000 148.76%
2016 413,491 411,774 600,000 145.71%
2017 421,774 420,057 600,000 142.84%
2018 430,056 428,339 600,000 140.08%
2019 438,190 436,473 600,000 137.47%
Annual Demand and Energy Savings Per Installation Program Total
@ Meter @ Generator @ Meter @ Generator
Winter kW Reduction 0.00333 0.00437 0 0
Summer kW Reduction 0.00237 0.00311 0 0
Annual kWh Reduction 55 60 0 0
Annual
Utility Cost per Installation: N/A
Total Program Cost of the Utility ($000): $0
Net Benefits of Measures Installed During Reporting Period: N/A
(2010 DSM PLAN)
Page 27

DSM PROGRAM PROGRESS REPORT
Utility: Gulf Power Company
Program Name: Refrigerator Recycling
Program Start Date: June, 2011
Reporting Period: Annual 2013
A B C D E F G H I
Projected Projected Actual Actual Actual Actual
Total Cumulative Cumulative Annual Cumulative Cumulative Participation
Total Number of Number of Penetration Number of Number of Penetration Over (Under)
Number of Eligible Program Level Program Program Level Projected
Year Customers Customers Participants % Participants Participants % Participants
(From Cons. Plan) (From Cons. Plan) (From Cons. Plan) (D/C X 100) (Actual Participants) (Actual Participants (G/C X 100) (Column G-Column D)
Plan-To-Date)
2010 374,936 373,219 0 0.00% … … … …
2011 377,336 375,619 1,750 0.47% 815 815 0.22% (935)
2012 381,544 379,827 5,250 1.38% 1,064 1,879 0.49% (3,371)
2013 388,378 386,661 8,750 2.26% 982 2,861 0.74% (5,889)
2014 396,913 395,196 12,250 3.10%
2015 405,062 403,345 15,750 3.90%
2016 413,491 411,774 17,750 4.31%
2017 421,774 420,057 19,750 4.70%
2018 430,056 428,339 21,750 5.08%
2019 438,190 436,473 23,750 5.44%
Annual Demand and Energy Savings Per Installation Program Total
@ Meter @ Generator @ Meter @ Generator
Winter kW Reduction 0.08 0.11 79 103
Summer kW Reduction 0.08 0.11 79 103
Annual kWh Reduction 738 804 724,716 789,940
Annual
Utility Cost per Installation: $196
Total Program Cost of the Utility ($000): $193
Net Benefits of Measures Installed During Reporting Period: ($60,545)
(2010 DSM PLAN)
Page 28

DSM PROGRAM PROGRESS REPORT
Utility: Gulf Power Company
Program Name: Commercial/Industrial Audit
Program Start Date: June, 2011
Reporting Period: Annual 2013
A B C D E F G H I
Projected Projected Actual Actual Actual Actual
Total Cumulative Cumulative Annual Cumulative Cumulative Participation
Total Number of Number of Penetration Number of Number of Penetration Over (Under)
Number of Eligible Program Level Program Program Level Projected
Year Customers Customers Participants % Participants Participants % Participants
(From Cons. Plan) (From Cons. Plan) (From Cons. Plan) (D/C X 100) (Actual Participants) (Actual Participants (G/C X 100) (Column G-Column D)
Plan-To-Date)
2010 54,648 46,618 600 1.29% … … … …
2011 55,016 46,872 1,200 2.56% 476 476 1.02% (724)
2012 55,584 47,317 1,800 3.80% 420 896 1.89% (904)
2013 56,431 48,039 2,400 5.00% 567 1,463 3.05% (937)
2014 57,460 48,940 3,000 6.13%
2015 58,450 49,802 3,600 7.23%
2016 59,469 50,692 4,200 8.29%
2017 60,476 51,568 4,800 9.31%
2018 61,486 52,443 5,400 10.30%
2019 62,491 53,302 6,000 11.26%
Annual Demand and Energy Savings Per Installation Program Total
@ Meter @ Generator @ Meter @ Generator
Winter kW Reduction ------ ------ ------ ------
Summer kW Reduction ------ ------ ------ ------
Annual kWh Reduction ------ ------ ------ ------
Annual
Utility Cost per Installation: $1,329
Total Program Cost of the Utility ($000): $753
Net Benefits of Measures Installed During Reporting Period: N/A
Note: The demand and energy savings of this program are not applied toward the established DSM goals.
(2010 DSM PLAN)
Page 29
DSM PROGRAM PROGRESS REPORT
Utility: Gulf Power Company
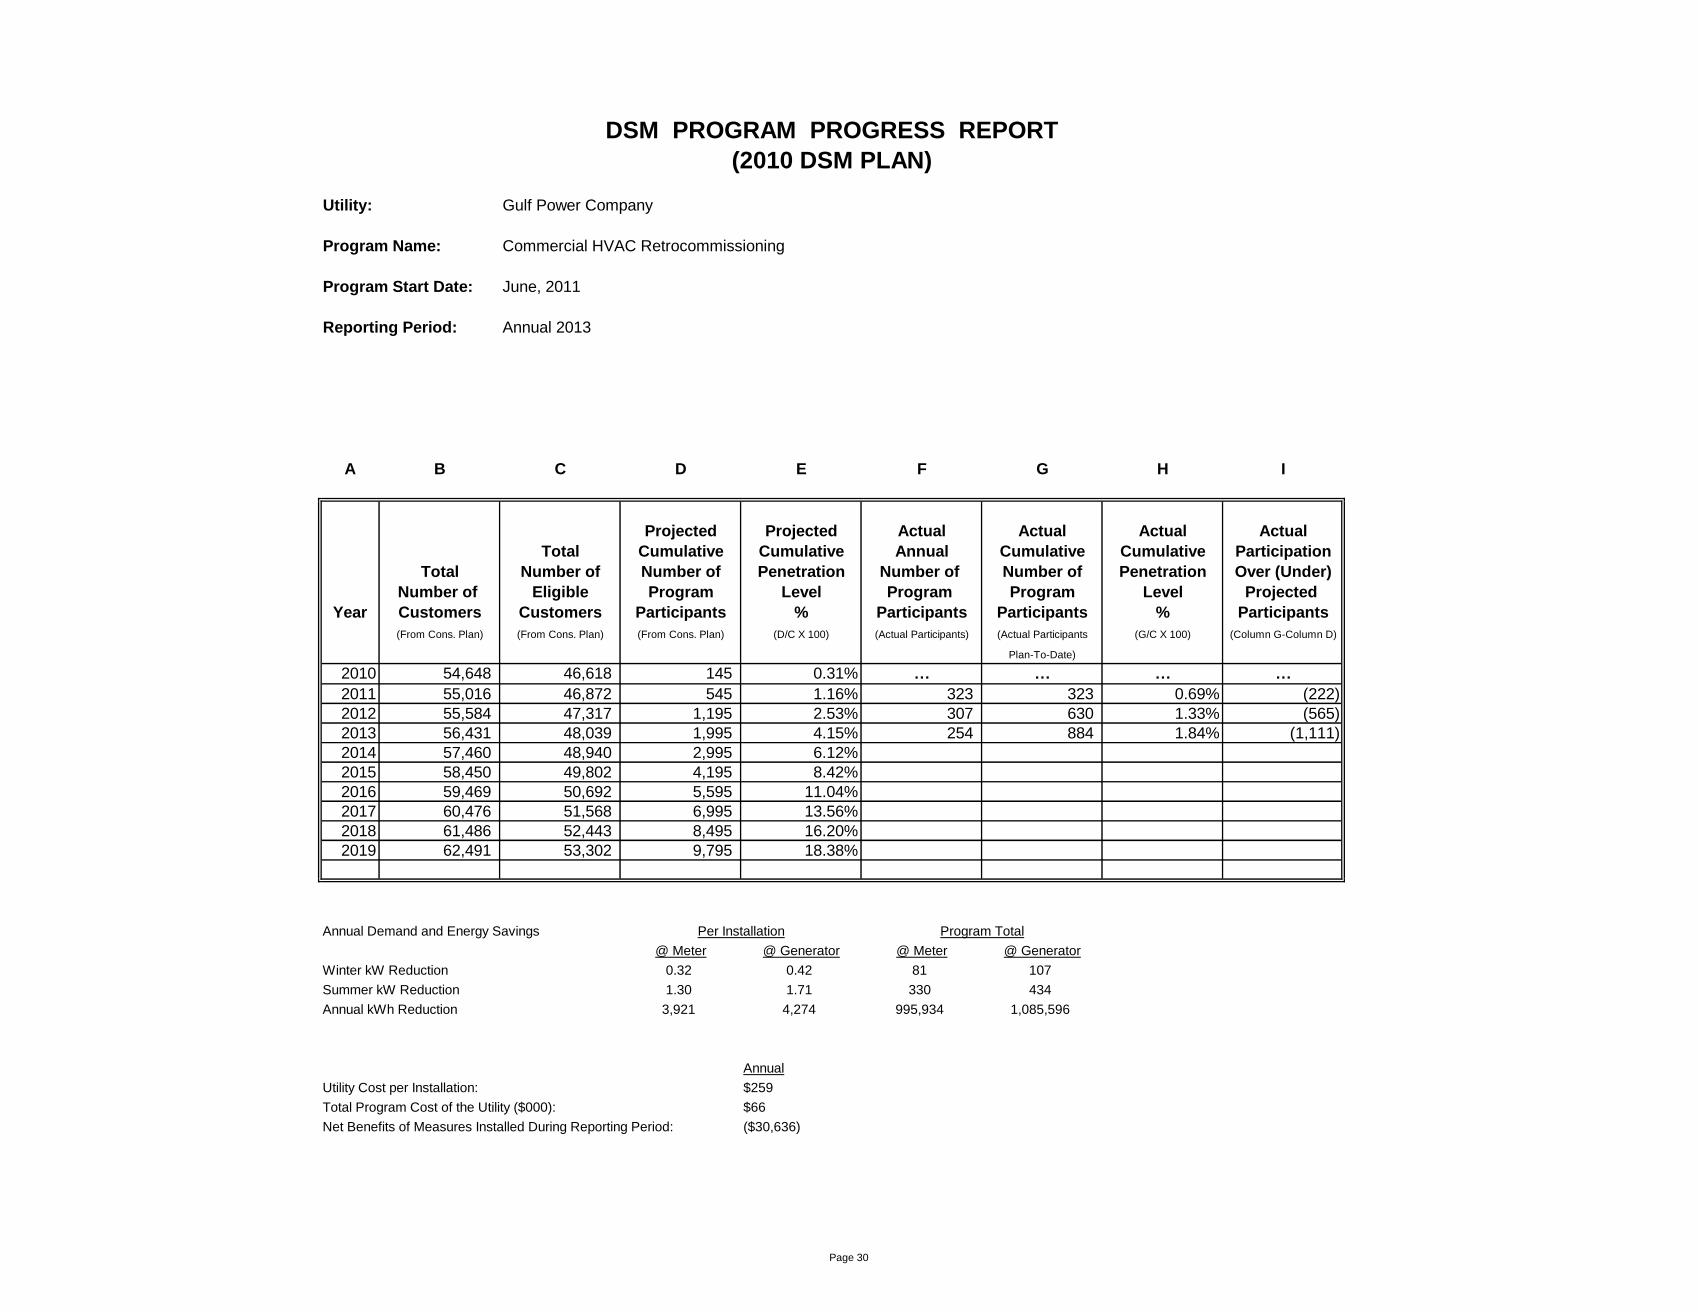
Program Name: Commercial HVAC Retrocommissioning
Program Start Date: June, 2011
Reporting Period: Annual 2013
A B C D E F G H I
Projected Projected Actual Actual Actual Actual
Total Cumulative Cumulative Annual Cumulative Cumulative Participation
Total Number of Number of Penetration Number of Number of Penetration Over (Under)
Number of Eligible Program Level Program Program Level Projected
Year Customers Customers Participants % Participants Participants % Participants
(From Cons. Plan) (From Cons. Plan) (From Cons. Plan) (D/C X 100) (Actual Participants) (Actual Participants (G/C X 100) (Column G-Column D)
Plan-To-Date)
2010 54,648 46,618 145 0.31% … … … …
2011 55,016 46,872 545 1.16% 323 323 0.69% (222)
2012 55,584 47,317 1,195 2.53% 307 630 1.33% (565)
2013 56,431 48,039 1,995 4.15% 254 884 1.84% (1,111)
2014 57,460 48,940 2,995 6.12%
2015 58,450 49,802 4,195 8.42%
2016 59,469 50,692 5,595 11.04%
2017 60,476 51,568 6,995 13.56%
2018 61,486 52,443 8,495 16.20%
2019 62,491 53,302 9,795 18.38%
Annual Demand and Energy Savings Per Installation Program Total
@ Meter @ Generator @ Meter @ Generator
Winter kW Reduction 0.32 0.42 81 107
Summer kW Reduction 1.30 1.71 330 434
Annual kWh Reduction 3,921 4,274 995,934 1,085,596
Annual
Utility Cost per Installation: $259
Total Program Cost of the Utility ($000): $66
Net Benefits of Measures Installed During Reporting Period: ($30,636)
(2010 DSM PLAN)
Page 30

DSM PROGRAM PROGRESS REPORT
Utility: Gulf Power Company
Program Name: Commercial Building Efficiency Program
Measure Name: Commercial HVAC Program
Program Start Date: June, 2011
Reporting Period: Annual 2013
A B C D E F G H I
Projected Projected Actual Actual Actual Actual
Total Cumulative Cumulative Annual Cumulative Cumulative Participation
Total Number of Number of Penetration Number of Number of Penetration Over (Under)
Number of Eligible Program Level Program Program Level Projected
Year Customers Customers Participants* % Participants* Participants* % Participants*
(From Cons. Plan) (From Cons. Plan) (From Cons. Plan) (D/C X 100) (Actual Participants) (Actual Participants (G/C X 100) (Column G-Column D)
Plan-To-Date)
2010 54,648 46,618 150 N/A … … N/A …
2011 55,016 46,872 450 N/A 85 85 N/A (365)
2012 55,584 47,317 800 N/A 1,608 1,693 N/A 893
2013 56,431 48,039 1,200 N/A 2,731 4,424 N/A 3,224
2014 57,460 48,940 1,700 N/A
2015 58,450 49,802 2,300 N/A
2016 59,469 50,692 2,900 N/A
2017 60,476 51,568 3,600 N/A
2018 61,486 52,443 4,300 N/A
2019 62,491 53,302 5,000 N/A
*Tons of HVAC installed
Annual Demand and Energy Savings Per Installation Program Total
@ Meter @ Generator @ Meter @ Generator
Winter kW Reduction 0.00 0.00 0 0
Summer kW Reduction 0.15 0.20 410 546
Annual kWh Reduction 652 711 1,780,612 1,941,741
Annual
Utility Cost per Installation: $142
Total Program Cost of the Utility ($000): $387
Net Benefits of Measures Installed During Reporting Period: ($101,034)
(2010 DSM PLAN)
Page 31

DSM PROGRAM PROGRESS REPORT
Utility: Gulf Power Company
Program Name: Commercial Building Efficiency Program
Measure Name: Commercial Geothermal Heat Pump Program
Program Start Date: June, 2011
Reporting Period: Annual 2013
A B C D E F G H I
Projected Projected Actual Actual Actual Actual
Total Cumulative Cumulative Annual Cumulative Cumulative Participation
Total Number of Number of Penetration Number of Number of Penetration Over (Under)
Number of Eligible Program Level Program Program Level Projected
Year Customers Customers Participants* % Participants* Participants* % Participants*
(From Cons. Plan) (From Cons. Plan) (From Cons. Plan) (D/C X 100) (Actual Participants) (Actual Participants (G/C X 100) (Column G-Column D)
Plan-To-Date)
2010 54,648 46,618 150 N/A … … N/A …
2011 55,016 46,872 325 N/A 0 0 N/A (325)
2012 55,584 47,317 525 N/A 290 290 N/A (235)
2013 56,431 48,039 775 N/A 128 418 N/A (357)
2014 57,460 48,940 1,025 N/A
2015 58,450 49,802 1,275 N/A
2016 59,469 50,692 1,525 N/A
2017 60,476 51,568 1,775 N/A
2018 61,486 52,443 1,995 N/A
2019 62,491 53,302 2,215 N/A
*Tons of Geothermal HVAC installed
Annual Demand and Energy Savings Per Installation Program Total
@ Meter @ Generator @ Meter @ Generator
Winter kW Reduction 0.27 0.35 35 45
Summer kW Reduction 0.29 0.38 37 49
Annual kWh Reduction 685 747 87,680 95,616
Annual
Utility Cost per Installation: $1
Total Program Cost of the Utility ($000): $0
Net Benefits of Measures Installed During Reporting Period: ($5,464)
(2010 DSM PLAN)
Page 32

DSM PROGRAM PROGRESS REPORT
Utility: Gulf Power Company
Program Name: Commercial Building Efficiency Program
Measure Name: Commercial HPWH Program
Program Start Date: June, 2011
Reporting Period: Annual 2013
A B C D E F G H I
Projected Projected Actual Actual Actual Actual
Total Cumulative Cumulative Annual Cumulative Cumulative Participation
Total Number of Number of Penetration Number of Number of Penetration Over (Under)
Number of Eligible Program Level Program Program Level Projected
Year Customers Customers Participants* % Participants* Participants* % Participants*
(From Cons. Plan) (From Cons. Plan) (From Cons. Plan) (D/C X 100) (Actual Participants) (Actual Participants (G/C X 100) (Column G-Column D)
Plan-To-Date)
2010 54,648 46,618 1 N/A … … N/A …
2011 55,016 46,872 2 N/A 0 0 N/A (2)
2012 55,584 47,317 3 N/A 1 1 N/A (2)
2013 56,431 48,039 4 N/A 1 2 N/A (2)
2014 57,460 48,940 5 N/A
2015 58,450 49,802 7 N/A
2016 59,469 50,692 9 N/A
2017 60,476 51,568 12 N/A
2018 61,486 52,443 15 N/A
2019 62,491 53,302 18 N/A
*Installations (5 tons)
Annual Demand and Energy Savings Per Installation Program Total
@ Meter @ Generator @ Meter @ Generator
Winter kW Reduction 11.80 15.5 12 16
Summer kW Reduction 10.00 13.1 10 13
Annual kWh Reduction 41,241 44,953 41,241 44,953
Annual
Utility Cost per Installation: $74
Total Program Cost of the Utility ($000): $0
Net Benefits of Measures Installed During Reporting Period: ($1,026)
(2010 DSM PLAN)
Page 33

DSM PROGRAM PROGRESS REPORT
Utility: Gulf Power Company
Program Name: Commercial Building Efficiency Program
Measure Name: Commercial Ceiling/Roof Insulation Program
Program Start Date: June, 2011
Reporting Period: Annual 2013
A B C D E F G H I
Projected Projected Actual Actual Actual Actual
Total Cumulative Cumulative Annual Cumulative Cumulative Participation
Total Number of Number of Penetration Number of Number of Penetration Over (Under)
Number of Eligible Program Level Program Program Level Projected
Year Customers Customers Participants* % Participants* Participants* % Participants*
(From Cons. Plan) (From Cons. Plan) (From Cons. Plan) (D/C X 100) (Actual Participants) (Actual Participants (G/C X 100) (Column G-Column D)
Plan-To-Date)
2010 54,648 46,618 29,965 N/A … … N/A …
2011 55,016 46,872 85,095 N/A 22,180 22,180 N/A (62,915)
2012 55,584 47,317 165,596 N/A 80,704 102,884 N/A (62,712)
2013 56,431 48,039 267,555 N/A 190,760 293,644 N/A 26,089
2014 57,460 48,940 387,349 N/A
2015 58,450 49,802 521,669 N/A
2016 59,469 50,692 667,532 N/A
2017 60,476 51,568 822,284 N/A
2018 61,486 52,443 983,588 N/A
2019 62,491 53,302 1,149,409 N/A
*Square feet of insulation installed
Annual Demand and Energy Savings Per Installation Program Total
@ Meter @ Generator @ Meter @ Generator
Winter kW Reduction 0.00011 0.00014 21 27
Summer kW Reduction 0.00052 0.00068 99 130
Annual kWh Reduction 0.863 0.90 164,626 171,684
Annual
Utility Cost per Installation: $0
Total Program Cost of the Utility ($000): $1
Net Benefits of Measures Installed During Reporting Period: ($534)
(2010 DSM PLAN)
Page 34

DSM PROGRAM PROGRESS REPORT
Utility: Gulf Power Company
Program Name: Commercial Building Efficiency Program
Measure Name: Commercial Window Film
Program Start Date: June, 2011
Reporting Period: Annual 2013
A B C D E F G H I
Projected Projected Actual Actual Actual Actual
Total Cumulative Cumulative Annual Cumulative Cumulative Participation
Total Number of Number of Penetration Number of Number of Penetration Over (Under)
Number of Eligible Program Level Program Program Level Projected
Year Customers Customers Participants* % Participants* Participants* % Participants*
(From Cons. Plan) (From Cons. Plan) (From Cons. Plan) (D/C X 100) (Actual Participants) (Actual Participants (G/C X 100) (Column G-Column D)
Plan-To-Date)
2010 54,648 46,618 8,620 N/A … … N/A …
2011 55,016 46,872 24,973 N/A 0 0 N/A (24,973)
2012 55,584 47,317 49,250 N/A 21,863 21,863 N/A (27,387)
2013 56,431 48,039 80,015 N/A 9,805 31,668 N/A (48,347)
2014 57,460 48,940 115,900 N/A
2015 58,450 49,802 155,652 N/A
2016 59,469 50,692 198,155 N/A
2017 60,476 51,568 242,444 N/A
2018 61,486 52,443 287,703 N/A
2019 62,491 53,302 333,258 N/A
*Square feet of window film installed
Annual Demand and Energy Savings Per Installation Program Total
@ Meter @ Generator @ Meter @ Generator
Winter kW Reduction 0.00 0.00 0 0
Summer kW Reduction 0.0033 0.0043 32 42
Annual kWh Reduction 11 12 107,855 117,660
Annual
Utility Cost per Installation: $0
Total Program Cost of the Utility ($000): $2
Net Benefits of Measures Installed During Reporting Period: ($3,276)
(2010 DSM PLAN)
Page 35

DSM PROGRAM PROGRESS REPORT
Utility: Gulf Power Company
Program Name: Commercial Building Efficiency Program
Measure Name: Commercial Interior Lighting
Program Start Date: June, 2011
Reporting Period: Annual 2013
A B C D E F G H I
Projected Projected Actual Actual Actual Actual
Total Cumulative Cumulative Annual Cumulative Cumulative Participation
Total Number of Number of Penetration Number of Number of Penetration Over (Under)
Number of Eligible Program Level Program Program Level Projected
Year Customers Customers Participants* % Participants* Participants* % Participants*
(From Cons. Plan) (From Cons. Plan) (From Cons. Plan) (D/C X 100) (Actual Participants) (Actual Participants (G/C X 100) (Column G-Column D)
Plan-To-Date)
2010 54,648 46,618 50 N/A … … N/A …
2011 55,016 46,872 125 N/A 282 282 N/A 157
2012 55,584 47,317 225 N/A 876 1,158 N/A 933
2013 56,431 48,039 375 N/A 849 2,007 N/A 1,632
2014 57,460 48,940 525 N/A
2015 58,450 49,802 650 N/A
2016 59,469 50,692 750 N/A
2017 60,476 51,568 850 N/A
2018 61,486 52,443 950 N/A
2019 62,491 53,302 1,050 N/A
*kW of lighting reduction
Annual Demand and Energy Savings Per Installation Program Total
@ Meter @ Generator @ Meter @ Generator
Winter kW Reduction 1.00 1.31 849 1,112
Summer kW Reduction 1.00 1.31 849 1,112
Annual kWh Reduction 4,380 4,774 3,718,620 4,053,126
Annual
Utility Cost per Installation: $87
Total Program Cost of the Utility ($000): $74
Net Benefits of Measures Installed During Reporting Period: ($67,893)
(2010 DSM PLAN)
Page 36

DSM PROGRAM PROGRESS REPORT
Utility: Gulf Power Company
Program Name: Commercial Building Efficiency Program
Measure Name: Commercial Interior Lighting - LED
Program Start Date: June, 2011
Reporting Period: Annual 2013
A B C D E F G H I
Projected Projected Actual Actual Actual Actual
Total Cumulative Cumulative Annual Cumulative Cumulative Participation
Total Number of Number of Penetration Number of Number of Penetration Over (Under)
Number of Eligible Program Level Program Program Level Projected
Year Customers Customers Participants* % Participants* Participants* % Participants*
(From Cons. Plan) (From Cons. Plan) (From Cons. Plan) (D/C X 100) (Actual Participants) (Actual Participants (G/C X 100) (Column G-Column D)
Plan-To-Date)
2010 54,648 46,618 20 N/A … … N/A …
2011 55,016 46,872 50 N/A 61 61 N/A 11
2012 55,584 47,317 90 N/A 342 403 N/A 313
2013 56,431 48,039 140 N/A 966 1,369 N/A 1,229
2014 57,460 48,940 200 N/A
2015 58,450 49,802 260 N/A
2016 59,469 50,692 320 N/A
2017 60,476 51,568 380 N/A
2018 61,486 52,443 440 N/A
2019 62,491 53,302 500 N/A
*kW of lighting reduction
Annual Demand and Energy Savings Per Installation Program Total
@ Meter @ Generator @ Meter @ Generator
Winter kW Reduction 1.00 1.31 966 1,265
Summer kW Reduction 1.00 1.31 966 1,265
Annual kWh Reduction 4,380 4,774 4,231,080 4,611,684
Annual
Utility Cost per Installation: $87
Total Program Cost of the Utility ($000): $84
Net Benefits of Measures Installed During Reporting Period: ($91,628)
(2010 DSM PLAN)
Page 37

DSM PROGRAM PROGRESS REPORT
Utility: Gulf Power Company
Program Name: Commercial Building Efficiency Program
Measure Name: Commercial Occupancy Sensor - Interior Lighting
Program Start Date: June, 2011
Reporting Period: Annual 2013
A B C D E F G H I
Projected Projected Actual Actual Actual Actual
Total Cumulative Cumulative Annual Cumulative Cumulative Participation
Total Number of Number of Penetration Number of Number of Penetration Over (Under)
Number of Eligible Program Level Program Program Level Projected
Year Customers Customers Participants* % Participants* Participants* % Participants*
(From Cons. Plan) (From Cons. Plan) (From Cons. Plan) (D/C X 100) (Actual Participants) (Actual Participants (G/C X 100) (Column G-Column D)
Plan-To-Date)
2010 54,648 46,618 300 N/A … … N/A …
2011 55,016 46,872 800 N/A 680 680 N/A (120)
2012 55,584 47,317 1,400 N/A 1,171 1,851 N/A 451
2013 56,431 48,039 2,100 N/A 4,277 6,128 N/A 4,028
2014 57,460 48,940 2,850 N/A
2015 58,450 49,802 3,600 N/A
2016 59,469 50,692 4,350 N/A
2017 60,476 51,568 5,100 N/A
2018 61,486 52,443 5,800 N/A
2019 62,491 53,302 6,400 N/A
*Number of sensors installed
Annual Demand and Energy Savings Per Installation Program Total
@ Meter @ Generator @ Meter @ Generator
Winter kW Reduction 0.20 0.26 855 1,112
Summer kW Reduction 0.20 0.26 855 1,112
Annual kWh Reduction 800 872 3,421,600 3,729,544
Annual
Utility Cost per Installation: $8
Total Program Cost of the Utility ($000): $36
Net Benefits of Measures Installed During Reporting Period: ($55,800)
(2010 DSM PLAN)
Page 38

DSM PROGRAM PROGRESS REPORT
Utility: Gulf Power Company
Program Name: Commercial Building Efficiency Program
Measure Name: Commercial Reflective Roof
Program Start Date: June, 2011
Reporting Period: Annual 2013
A B C D E F G H I
Projected Projected Actual Actual Actual Actual
Total Cumulative Cumulative Annual Cumulative Cumulative Participation
Total Number of Number of Penetration Number of Number of Penetration Over (Under)
Number of Eligible Program Level Program Program Level Projected
Year Customers Customers Participants* % Participants* Participants* % Participants*
(From Cons. Plan) (From Cons. Plan) (From Cons. Plan) (D/C X 100) (Actual Participants) (Actual Participants (G/C X 100) (Column G-Column D)
Plan-To-Date)
2010 54,648 46,618 100,000 N/A … … N/A …
2011 55,016 46,872 300,000 N/A 85,813 85,813 N/A (214,187)
2012 55,584 47,317 600,000 N/A 424,855 510,668 N/A (89,332)
2013 56,431 48,039 1,000,000 N/A 1,730,233 2,240,901 N/A 1,240,901
2014 57,460 48,940 1,400,000 N/A
2015 58,450 49,802 1,900,000 N/A
2016 59,469 50,692 2,400,000 N/A
2017 60,476 51,568 2,800,000 N/A
2018 61,486 52,443 3,200,000 N/A
2019 62,491 53,302 3,600,000 N/A
*Square feet of reflective roof installed
Annual Demand and Energy Savings Per Installation Program Total
@ Meter @ Generator @ Meter @ Generator
Winter kW Reduction 0.00 0.00 0 0
Summer kW Reduction 0.00091 0.0012 1,575 2,076
Annual kWh Reduction 2.45 2.67 4,239,071 4,619,722
Annual
Utility Cost per Installation: $0
Total Program Cost of the Utility ($000): $3
Net Benefits of Measures Installed During Reporting Period: ($118,824)
(2010 DSM PLAN)
Page 39

DSM PROGRAM PROGRESS REPORT
Utility: Gulf Power Company
Program Name: Commercial Occupancy Sensor HVAC Control
Program Start Date: June, 2011
Reporting Period: Annual 2013
A B C D E F G H I
Projected Projected Actual Actual Actual Actual
Total Cumulative Cumulative Annual Cumulative Cumulative Participation
Total Number of Number of Penetration Number of Number of Penetration Over (Under)
Number of Eligible Program Level Program Program Level Projected
Year Customers Customers Participants* % Participants* Participants* % Participants*
(From Cons. Plan) (From Cons. Plan) (From Cons. Plan) (D/C X 100) (Actual Participants) (Actual Participants (G/C X 100) (Column G-Column D)
Plan-To-Date)
2010 54,648 46,618 75 N/A … … N/A …
2011 55,016 46,872 225 N/A 181 181 N/A (44)
2012 55,584 47,317 425 N/A 330 511 N/A 86
2013 56,431 48,039 675 N/A 4,825 5,336 N/A 4,661
2014 57,460 48,940 925 N/A
2015 58,450 49,802 1,175 N/A
2016 59,469 50,692 1,375 N/A
2017 60,476 51,568 1,575 N/A
2018 61,486 52,443 1,775 N/A
2019 62,491 53,302 1,975 N/A
*Number of sensors installed
Annual Demand and Energy Savings Per Installation Program Total
@ Meter @ Generator @ Meter @ Generator
Winter kW Reduction 0.00012 0.00016 1 1
Summer kW Reduction 0.026 0.034 125 164
Annual kWh Reduction 512 558 2,470,400 2,692,350
Annual
Utility Cost per Installation: $9
Total Program Cost of the Utility ($000): $42
Net Benefits of Measures Installed During Reporting Period: ($86,429)
(2010 DSM PLAN)
Page 40
DSM PROGRAM PROGRESS REPORT
Utility: Gulf Power Company
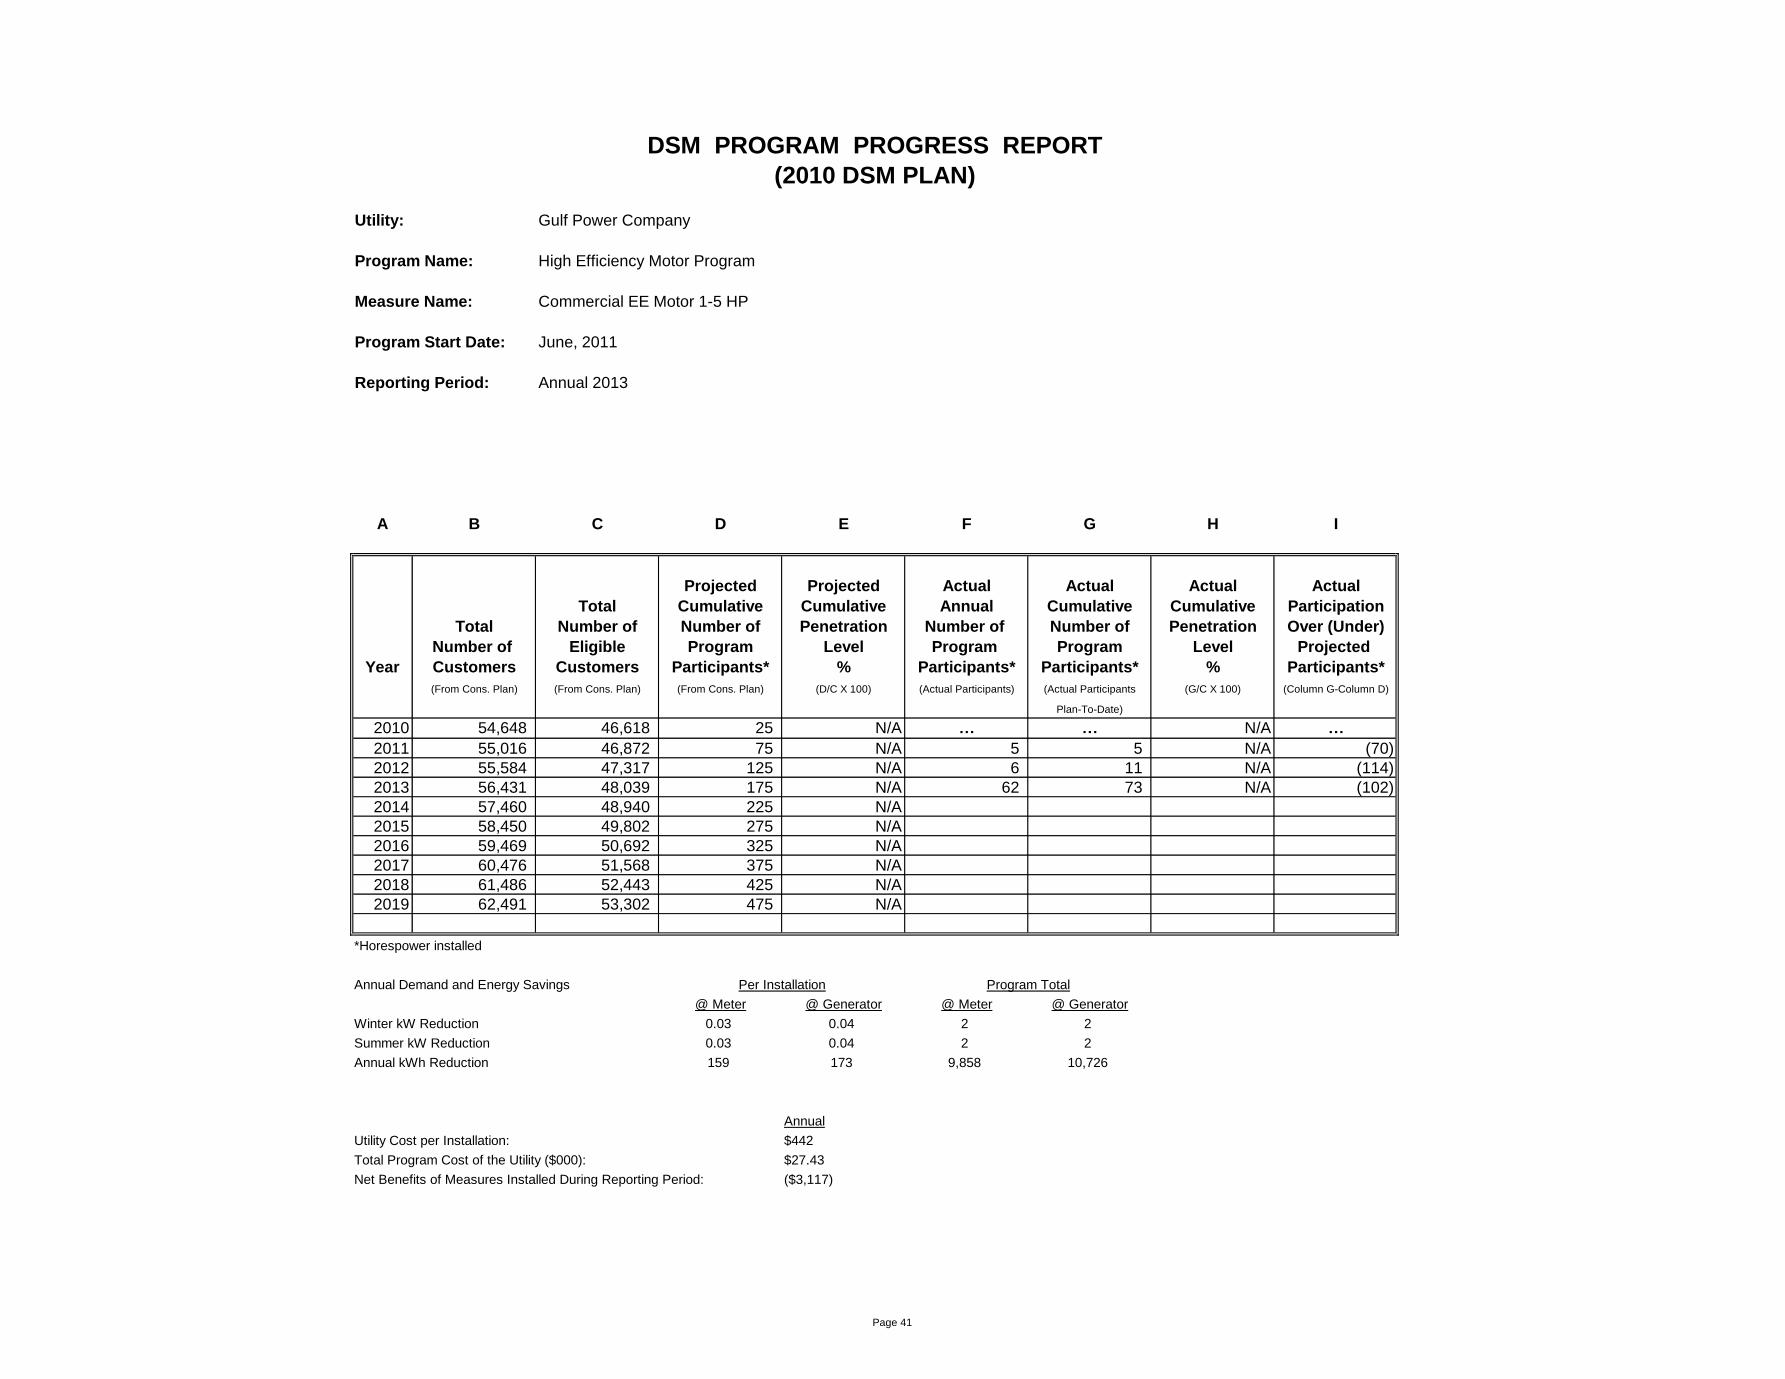
Program Name: High Efficiency Motor Program
Measure Name: Commercial EE Motor 1-5 HP
Program Start Date: June, 2011
Reporting Period: Annual 2013
A B C D E F G H I
Projected Projected Actual Actual Actual Actual
Total Cumulative Cumulative Annual Cumulative Cumulative Participation
Total Number of Number of Penetration Number of Number of Penetration Over (Under)
Number of Eligible Program Level Program Program Level Projected
Year Customers Customers Participants* % Participants* Participants* % Participants*
(From Cons. Plan) (From Cons. Plan) (From Cons. Plan) (D/C X 100) (Actual Participants) (Actual Participants (G/C X 100) (Column G-Column D)
Plan-To-Date)
2010 54,648 46,618 25 N/A … … N/A …
2011 55,016 46,872 75 N/A 5 5 N/A (70)
2012 55,584 47,317 125 N/A 6 11 N/A (114)
2013 56,431 48,039 175 N/A 62 73 N/A (102)
2014 57,460 48,940 225 N/A
2015 58,450 49,802 275 N/A
2016 59,469 50,692 325 N/A
2017 60,476 51,568 375 N/A
2018 61,486 52,443 425 N/A
2019 62,491 53,302 475 N/A
*Horespower installed
Annual Demand and Energy Savings Per Installation Program Total
@ Meter @ Generator @ Meter @ Generator
Winter kW Reduction 0.03 0.04 2 2
Summer kW Reduction 0.03 0.04 2 2
Annual kWh Reduction 159 173 9,858 10,726
Annual
Utility Cost per Installation: $442
Total Program Cost of the Utility ($000): $27.43
Net Benefits of Measures Installed During Reporting Period: ($3,117)
(2010 DSM PLAN)
Page 41

DSM PROGRAM PROGRESS REPORT
Utility: Gulf Power Company
Program Name: High Efficiency Motor Program
Measure Name: Commercial EE Motor 6-50 HP
Program Start Date: June, 2011
Reporting Period: Annual 2013
A B C D E F G H I
Projected Projected Actual Actual Actual Actual
Total Cumulative Cumulative Annual Cumulative Cumulative Participation
Total Number of Number of Penetration Number of Number of Penetration Over (Under)
Number of Eligible Program Level Program Program Level Projected
Year Customers Customers Participants* % Participants* Participants* % Participants*
(From Cons. Plan) (From Cons. Plan) (From Cons. Plan) (D/C X 100) (Actual Participants) (Actual Participants (G/C X 100) (Column G-Column D)
Plan-To-Date)
2010 54,648 46,618 1,000 N/A … … N/A …
2011 55,016 46,872 2,875 N/A 15 15 N/A (2,860)
2012 55,584 47,317 4,750 N/A 412 427 N/A (4,323)
2013 56,431 48,039 6,625 N/A 371 798 N/A (5,827)
2014 57,460 48,940 8,500 N/A
2015 58,450 49,802 10,375 N/A
2016 59,469 50,692 12,250 N/A
2017 60,476 51,568 14,125 N/A
2018 61,486 52,443 16,000 N/A
2019 62,491 53,302 17,875 N/A
*Horespower installed
Annual Demand and Energy Savings Per Installation Program Total
@ Meter @ Generator @ Meter @ Generator
Winter kW Reduction 0.016 0.021 6 8
Summer kW Reduction 0.016 0.021 6 8
Annual kWh Reduction 94 102 34,874 37,842
Annual
Utility Cost per Installation: $86
Total Program Cost of the Utility ($000): $32
Net Benefits of Measures Installed During Reporting Period: ($4,155)
(2010 DSM PLAN)
Page 42

DSM PROGRAM PROGRESS REPORT
Utility: Gulf Power Company
Program Name: High Efficiency Motor Program
Measure Name: Commercial EE Motor 51 + HP
Program Start Date: June, 2011
Reporting Period: Annual 2013
A B C D E F G H I
Projected Projected Actual Actual Actual Actual
Total Cumulative Cumulative Annual Cumulative Cumulative Participation
Total Number of Number of Penetration Number of Number of Penetration Over (Under)
Number of Eligible Program Level Program Program Level Projected
Year Customers Customers Participants* % Participants* Participants* % Participants*
(From Cons. Plan) (From Cons. Plan) (From Cons. Plan) (D/C X 100) (Actual Participants) (Actual Participants (G/C X 100) (Column G-Column D)
Plan-To-Date)
2010 54,648 46,618 1,200 N/A … … N/A …
2011 55,016 46,872 3,600 N/A 300 300 N/A (3,300)
2012 55,584 47,317 6,000 N/A 1,825 2,125 N/A (3,875)
2013 56,431 48,039 8,400 N/A 0 2,125 N/A (6,275)
2014 57,460 48,940 10,800 N/A
2015 58,450 49,802 13,200 N/A
2016 59,469 50,692 15,600 N/A
2017 60,476 51,568 18,000 N/A
2018 61,486 52,443 20,400 N/A
2019 62,491 53,302 22,800 N/A
*Horespower installed
Annual Demand and Energy Savings Per Installation Program Total
@ Meter @ Generator @ Meter @ Generator
Winter kW Reduction 0.006 0.008 0 0
Summer kW Reduction 0.006 0.008 0 0
Annual kWh Reduction 36 39 0 0
Annual
Utility Cost per Installation: N/A
Total Program Cost of the Utility ($000): $0
Net Benefits of Measures Installed During Reporting Period: N/A No program participants
(2010 DSM PLAN)
Page 43

DSM PROGRAM PROGRESS REPORT
Utility: Gulf Power Company
Program Name: Food Service Efficiency Program
Measure Name: Convection Oven
Program Start Date: June, 2011
Reporting Period: Annual 2013
A B C D E F G H I
Projected Projected Actual Actual Actual Actual
Total Cumulative Cumulative Annual Cumulative Cumulative Participation
Total Number of Number of Penetration Number of Number of Penetration Over (Under)
Number of Eligible Program Level Program Program Level Projected
Year Customers Customers Participants % Participants Participants % Participants
(From Cons. Plan) (From Cons. Plan) (From Cons. Plan) (D/C X 100) (Actual Participants) (Actual Participants (G/C X 100) (Column G-Column D)
Plan-To-Date)
2010 54,648 46,618 1 0.00% … … … …
2011 55,016 46,872 4 0.01% 0 0 0.00% (4)
2012 55,584 47,317 7 0.01% 8 8 0.02% 1
2013 56,431 48,039 10 0.02% 1 9 0.02% (1)
2014 57,460 48,940 14 0.03%
2015 58,450 49,802 18 0.04%
2016 59,469 50,692 23 0.05%
2017 60,476 51,568 28 0.05%
2018 61,486 52,443 34 0.06%
2019 62,491 53,302 40 0.08%
Annual Demand and Energy Savings Per Installation Program Total
@ Meter @ Generator @ Meter @ Generator
Winter kW Reduction 0.40 0.53 0 1
Summer kW Reduction 0.40 0.53 0 1
Annual kWh Reduction 1,869 2,037 1,869 2,037
Annual
Utility Cost per Installation: $1,419
Total Program Cost of the Utility ($000): $1
Net Benefits of Measures Installed During Reporting Period: ($215)
(2010 DSM PLAN)
Page 44

DSM PROGRAM PROGRESS REPORT
Utility: Gulf Power Company
Program Name: Food Service Efficiency Program
Measure Name: Fryer
Program Start Date: June, 2011
Reporting Period: Annual 2013
A B C D E F G H I
Projected Projected Actual Actual Actual Actual
Total Cumulative Cumulative Annual Cumulative Cumulative Participation
Total Number of Number of Penetration Number of Number of Penetration Over (Under)
Number of Eligible Program Level Program Program Level Projected
Year Customers Customers Participants % Participants Participants % Participants
(From Cons. Plan) (From Cons. Plan) (From Cons. Plan) (D/C X 100) (Actual Participants) (Actual Participants (G/C X 100) (Column G-Column D)
Plan-To-Date)
2010 54,648 46,618 2 0.00% … … … …
2011 55,016 46,872 5 0.01% 0 0 0.00% (5)
2012 55,584 47,317 9 0.02% 17 17 0.04% 8
2013 56,431 48,039 14 0.03% 9 26 0.05% 12
2014 57,460 48,940 20 0.04%
2015 58,450 49,802 26 0.05%
2016 59,469 50,692 32 0.06%
2017 60,476 51,568 38 0.07%
2018 61,486 52,443 44 0.08%
2019 62,491 53,302 50 0.09%
Annual Demand and Energy Savings Per Installation Program Total
@ Meter @ Generator @ Meter @ Generator
Winter kW Reduction 0.20 0.26 2 2
Summer kW Reduction 0.20 0.26 2 2
Annual kWh Reduction 1,160 1,264 10,440 11,376
Annual
Utility Cost per Installation: $7,176
Total Program Cost of the Utility ($000): $65
Net Benefits of Measures Installed During Reporting Period: ($6,919)
(2010 DSM PLAN)
Page 45

DSM PROGRAM PROGRESS REPORT
Utility: Gulf Power Company
Program Name: Food Service Efficiency Program
Measure Name: Griddle
Program Start Date: June, 2011
Reporting Period: Annual 2013
A B C D E F G H I
Projected Projected Actual Actual Actual Actual
Total Cumulative Cumulative Annual Cumulative Cumulative Participation
Total Number of Number of Penetration Number of Number of Penetration Over (Under)
Number of Eligible Program Level Program Program Level Projected
Year Customers Customers Participants % Participants Participants % Participants
(From Cons. Plan) (From Cons. Plan) (From Cons. Plan) (D/C X 100) (Actual Participants) (Actual Participants (G/C X 100) (Column G-Column D)
Plan-To-Date)
2010 54,648 46,618 1 0.00% … … … …
2011 55,016 46,872 2 0.00% 0 0 0.00% (2)
2012 55,584 47,317 3 0.01% 1 1 0.00% (2)
2013 56,431 48,039 4 0.01% 0 1 0.00% (3)
2014 57,460 48,940 5 0.01%
2015 58,450 49,802 7 0.01%
2016 59,469 50,692 9 0.02%
2017 60,476 51,568 11 0.02%
2018 61,486 52,443 13 0.02%
2019 62,491 53,302 15 0.03%
Annual Demand and Energy Savings Per Installation Program Total
@ Meter @ Generator @ Meter @ Generator
Winter kW Reduction 0.50 0.66 0 0
Summer kW Reduction 0.50 0.66 0 0
Annual kWh Reduction 2,523 2,750 0 0
Annual
Utility Cost per Installation: N/A
Total Program Cost of the Utility ($000): $0
Net Benefits of Measures Installed During Reporting Period: N/A No program participants
(2010 DSM PLAN)
Page 46

DSM PROGRAM PROGRESS REPORT
Utility: Gulf Power Company
Program Name: Food Service Efficiency Program
Measure Name: Steamer
Program Start Date: June, 2011
Reporting Period: Annual 2013
A B C D E F G H I
Projected Projected Actual Actual Actual Actual
Total Cumulative Cumulative Annual Cumulative Cumulative Participation
Total Number of Number of Penetration Number of Number of Penetration Over (Under)
Number of Eligible Program Level Program Program Level Projected
Year Customers Customers Participants % Participants Participants % Participants
(From Cons. Plan) (From Cons. Plan) (From Cons. Plan) (D/C X 100) (Actual Participants) (Actual Participants (G/C X 100) (Column G-Column D)
Plan-To-Date)
2010 54,648 46,618 0 0.00% … … … …
2011 55,016 46,872 0 0.00% 0 0 0.00% 0
2012 55,584 47,317 0 0.00% 0 0 0.00% 0
2013 56,431 48,039 1 0.00% 4 4 0.01% 3
2014 57,460 48,940 2 0.00%
2015 58,450 49,802 3 0.01%
2016 59,469 50,692 3 0.01%
2017 60,476 51,568 4 0.01%
2018 61,486 52,443 4 0.01%
2019 62,491 53,302 5 0.01%
Annual Demand and Energy Savings Per Installation Program Total
@ Meter @ Generator @ Meter @ Generator
Winter kW Reduction 13.79 18.11 55 72
Summer kW Reduction 13.79 18.11 55 72
Annual kWh Reduction 60,081 65,488 240,324 261,952
Annual
Utility Cost per Installation: $682
Total Program Cost of the Utility ($000): $2,729
Net Benefits of Measures Installed During Reporting Period: ($3,793)
(2010 DSM PLAN)
Page 47
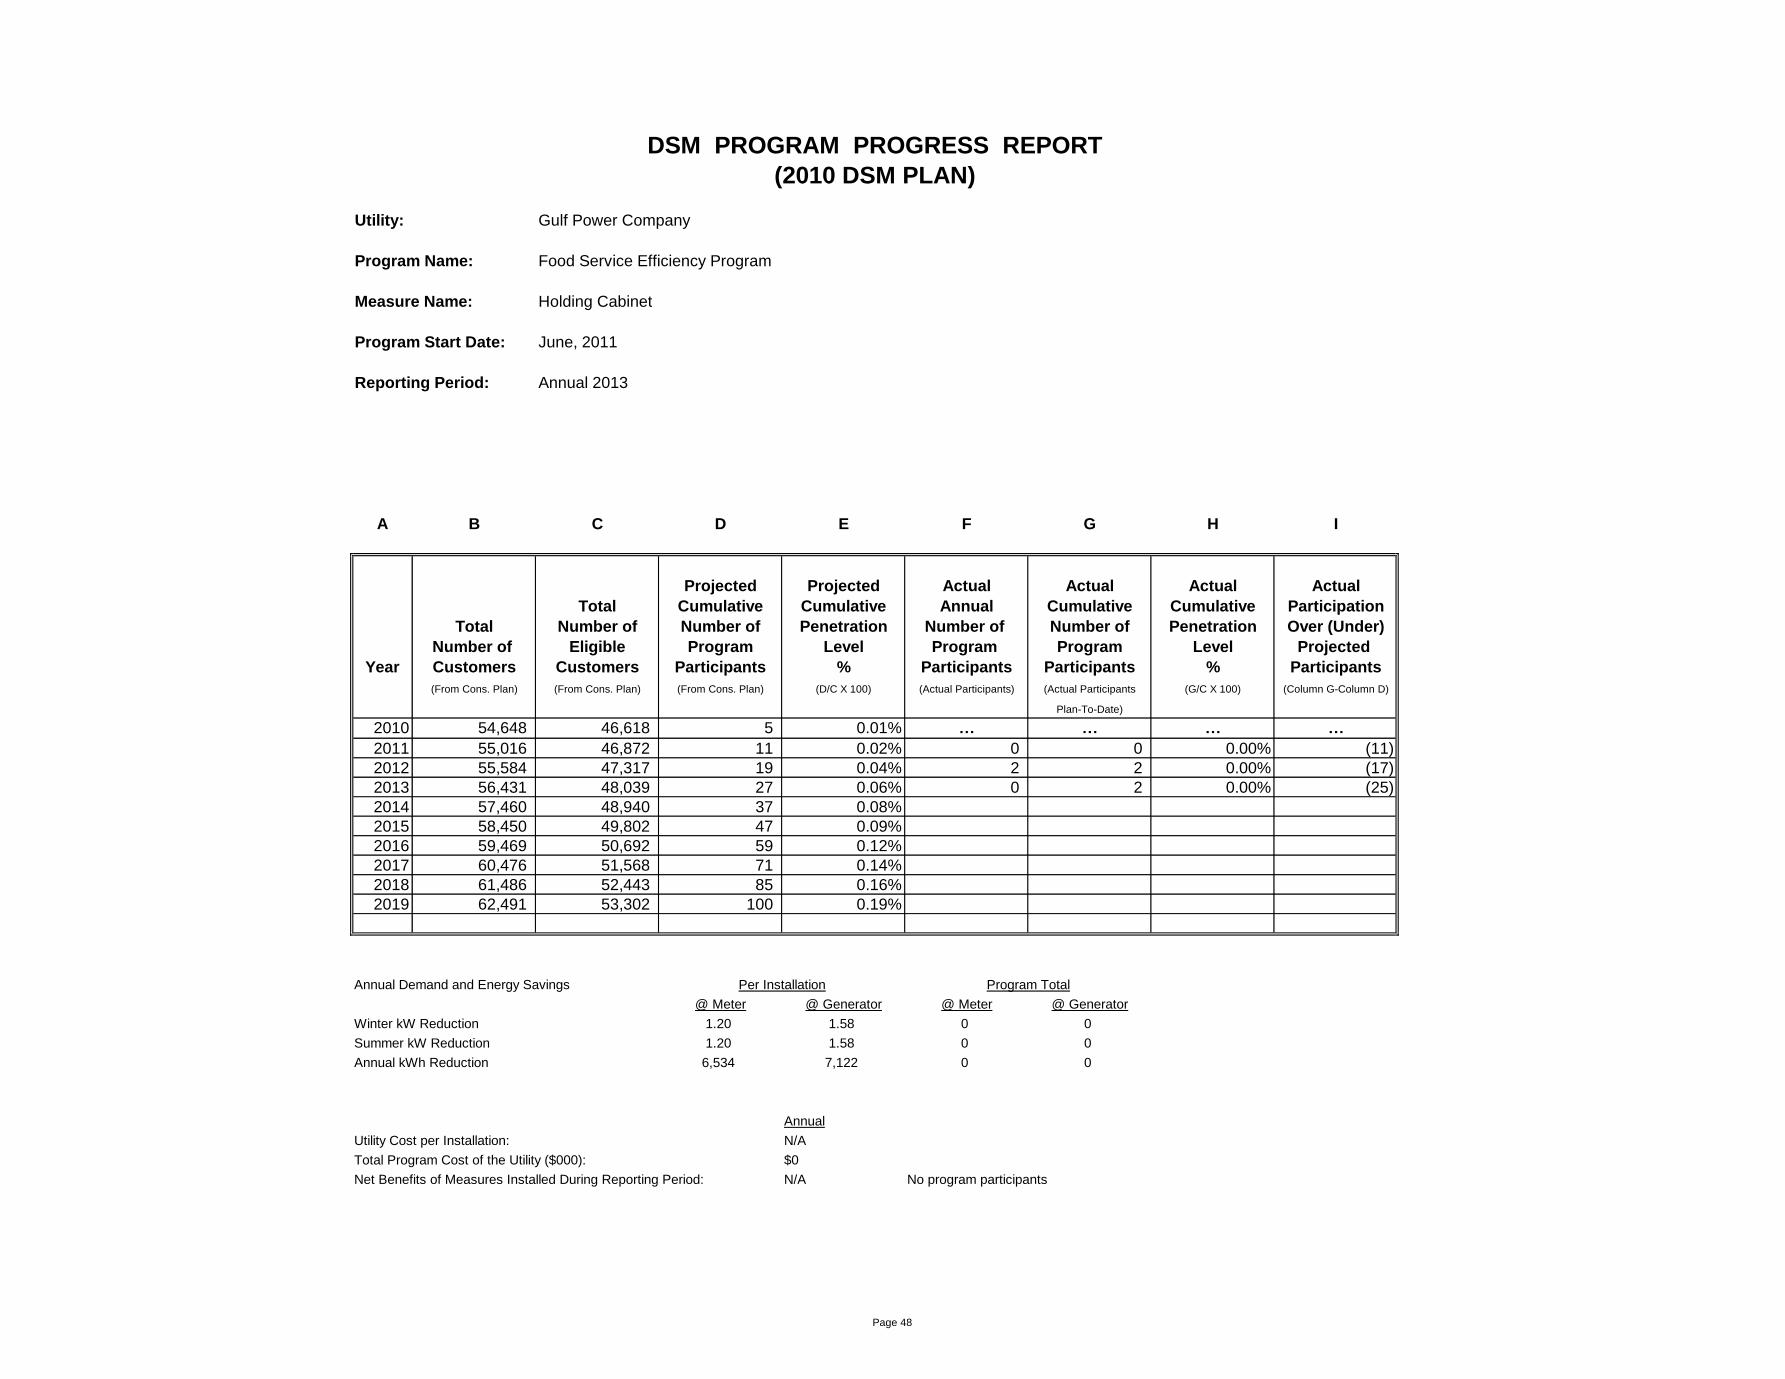
DSM PROGRAM PROGRESS REPORT
Utility: Gulf Power Company
Program Name: Food Service Efficiency Program
Measure Name: Holding Cabinet
Program Start Date: June, 2011
Reporting Period: Annual 2013
A B C D E F G H I
Projected Projected Actual Actual Actual Actual
Total Cumulative Cumulative Annual Cumulative Cumulative Participation
Total Number of Number of Penetration Number of Number of Penetration Over (Under)
Number of Eligible Program Level Program Program Level Projected
Year Customers Customers Participants % Participants Participants % Participants
(From Cons. Plan) (From Cons. Plan) (From Cons. Plan) (D/C X 100) (Actual Participants) (Actual Participants (G/C X 100) (Column G-Column D)
Plan-To-Date)
2010 54,648 46,618 5 0.01% … … … …
2011 55,016 46,872 11 0.02% 0 0 0.00% (11)
2012 55,584 47,317 19 0.04% 2 2 0.00% (17)
2013 56,431 48,039 27 0.06% 0 2 0.00% (25)
2014 57,460 48,940 37 0.08%
2015 58,450 49,802 47 0.09%
2016 59,469 50,692 59 0.12%
2017 60,476 51,568 71 0.14%
2018 61,486 52,443 85 0.16%
2019 62,491 53,302 100 0.19%
Annual Demand and Energy Savings Per Installation Program Total
@ Meter @ Generator @ Meter @ Generator
Winter kW Reduction 1.20 1.58 0 0
Summer kW Reduction 1.20 1.58 0 0
Annual kWh Reduction 6,534 7,122 0 0
Annual
Utility Cost per Installation: N/A
Total Program Cost of the Utility ($000): $0
Net Benefits of Measures Installed During Reporting Period: N/A No program participants
(2010 DSM PLAN)
Page 48

DSM PROGRAM PROGRESS REPORT
Utility: Gulf Power Company
Program Name: Food Service Efficiency Program
Measure Name: Ice Machine
Program Start Date: June, 2011
Reporting Period: Annual 2013
A B C D E F G H I
Projected Projected Actual Actual Actual Actual
Total Cumulative Cumulative Annual Cumulative Cumulative Participation
Total Number of Number of Penetration Number of Number of Penetration Over (Under)
Number of Eligible Program Level Program Program Level Projected
Year Customers Customers Participants % Participants Participants % Participants
(From Cons. Plan) (From Cons. Plan) (From Cons. Plan) (D/C X 100) (Actual Participants) (Actual Participants (G/C X 100) (Column G-Column D)
Plan-To-Date)
2010 54,648 46,618 6 0.01% … … … …
2011 55,016 46,872 18 0.04% 0 0 0.00% (18)
2012 55,584 47,317 30 0.06% 16 16 0.03% (14)
2013 56,431 48,039 42 0.09% 6 22 0.05% (20)
2014 57,460 48,940 54 0.11%
2015 58,450 49,802 66 0.13%
2016 59,469 50,692 78 0.15%
2017 60,476 51,568 90 0.17%
2018 61,486 52,443 102 0.19%
2019 62,491 53,302 114 0.21%
Annual Demand and Energy Savings Per Installation Program Total
@ Meter @ Generator @ Meter @ Generator
Winter kW Reduction 0.20 0.26 1 2
Summer kW Reduction 0.20 0.26 1 2
Annual kWh Reduction 1,797 1,959 10,782 11,754
Annual
Utility Cost per Installation: $3,902
Total Program Cost of the Utility ($000): $23
Net Benefits of Measures Installed During Reporting Period: ($2,564)
(2010 DSM PLAN)
Page 49
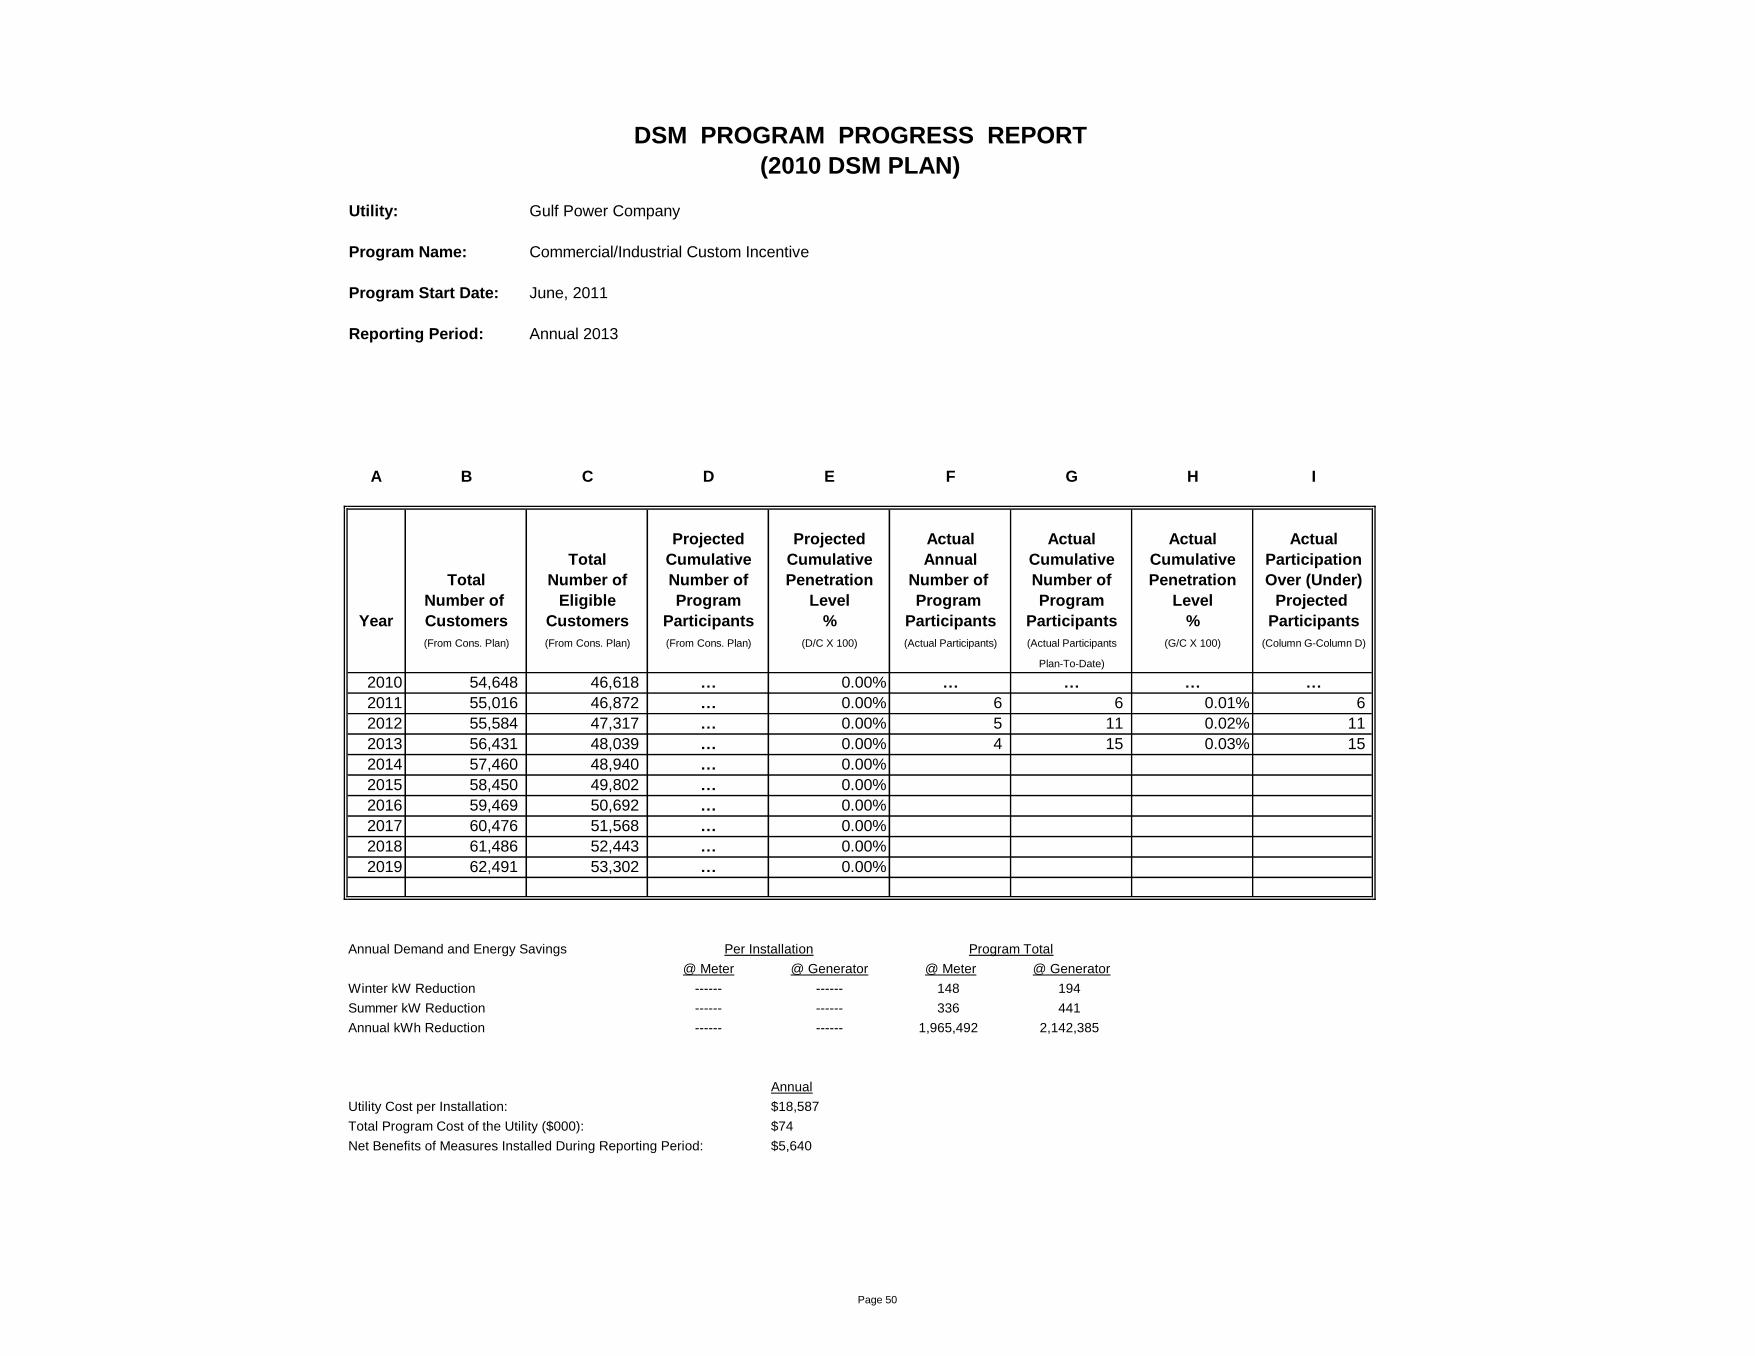
DSM PROGRAM PROGRESS REPORT
Utility: Gulf Power Company
Program Name: Commercial/Industrial Custom Incentive
Program Start Date: June, 2011
Reporting Period: Annual 2013
A B C D E F G H I
Projected Projected Actual Actual Actual Actual
Total Cumulative Cumulative Annual Cumulative Cumulative Participation
Total Number of Number of Penetration Number of Number of Penetration Over (Under)
Number of Eligible Program Level Program Program Level Projected
Year Customers Customers Participants % Participants Participants % Participants
(From Cons. Plan) (From Cons. Plan) (From Cons. Plan) (D/C X 100) (Actual Participants) (Actual Participants (G/C X 100) (Column G-Column D)
Plan-To-Date)
2010 54,648 46,618 … 0.00% … … … …
2011 55,016 46,872 … 0.00% 6 6 0.01% 6
2012 55,584 47,317 … 0.00% 5 11 0.02% 11
2013 56,431 48,039 … 0.00% 4 15 0.03% 15
2014 57,460 48,940 … 0.00%
2015 58,450 49,802 … 0.00%
2016 59,469 50,692 … 0.00%
2017 60,476 51,568 … 0.00%
2018 61,486 52,443 … 0.00%
2019 62,491 53,302 … 0.00%
Annual Demand and Energy Savings Per Installation Program Total
@ Meter @ Generator @ Meter @ Generator
Winter kW Reduction ------ ------ 148 194
Summer kW Reduction ------ ------ 336 441
Annual kWh Reduction ------ ------ 1,965,492 2,142,385
Annual
Utility Cost per Installation: $18,587
Total Program Cost of the Utility ($000): $74
Net Benefits of Measures Installed During Reporting Period: $5,640
(2010 DSM PLAN)
Page 50

DSM PROGRAM PROGRESS REPORT
Utility: Gulf Power Company
Program Name: Commercial/Industrial Custom Incentive
Program Start Date: June, 2011
Reporting Period: Annual 2013
Meter Generator
Summer kW Winter kW Energy kWh Summer kW Winter kW Energy kWh
2010 … … … … … …
2011 440 443 3,985,873 577 582 5,234,646
2012 375 150 1,118,968 493 197 1,219,676
2013 336 148 1,965,492 441 194 2,142,385
2014
Cumulative 1,151 741 7,070,333 1,511 973 8,596,707
Projects - 2013 Meter Generator
Summer kW Winter kW Energy kWh Summer kW Winter kW Energy kWh
General Electric 35.00 26.00 89,283 45.97 34.15 97,318
Baptist Hospital/Andrews Institute 238.00 95.00 1,449,959 312.57 124.76 1,580,455
Whiting Field 28.00 12.00 258,456 36.77 15.76 281,717
Whiting Field 35.00 15.00 167,794 45.97 19.70 182,895
Total 336.00 148.00 1,965,492 441.28 194.37 2,142,385
(2010 DSM PLAN)
Page 51

DSM PROGRAM PROGRESS REPORT
Utility: Gulf Power Company
Program Name: Real Time Pricing
Program Start Date: June, 2011
Reporting Period: Annual 2013
A B C D E F G H I
Projected Projected Actual Actual Actual Actual
Total Cumulative Cumulative Annual Cumulative Cumulative Participation
Total Number of Number of Penetration Number of Number of Penetration Over(Under)
Number of Eligible Program Level Program Program Level Projected
Year Customers Customers Participants % Participants Participants % Participation
(From Cons. Plan) (From Cons. Plan) (From Cons. Plan) (D/C X 100) (Actual Participants) (Actual Participants (G/C x 100) (Column G-Column D)
Plan-To-Date)
2010 54,648 18 2 11.11% … … … …
2011 55,016 18 2 11.11% 0 0 0.00% (2)
2012 55,584 18 2 11.11% 4 4 22.22% 2
2013 56,431 18 2 11.11% 0 4 22.22% 2
2014 57,460 18 2 11.11%
2015 58,450 18 2 11.11%
2016 59,469 18 2 11.11%
2017 60,476 18 2 11.11%
2018 61,486 18 2 11.11%
2019 62,491 18 2 11.11%
Annual Demand and Energy Savings Per Installation Program Total
@ Meter @ Generator @ Meter @ Generator
Winter kW Reduction 1,000 1,313 0 0
Summer kW Reduction 2,000 2,627 0 0
Annual kWh Reduction ------ ------ ------ ------
Annual
Utility Cost per Installation: N/A
Total Program Cost of the Utility ($000): N/A
Net Benefits of Measures Installed During Reporting Period: N/A No program participants
(2010 DSM PLAN)
Page 52
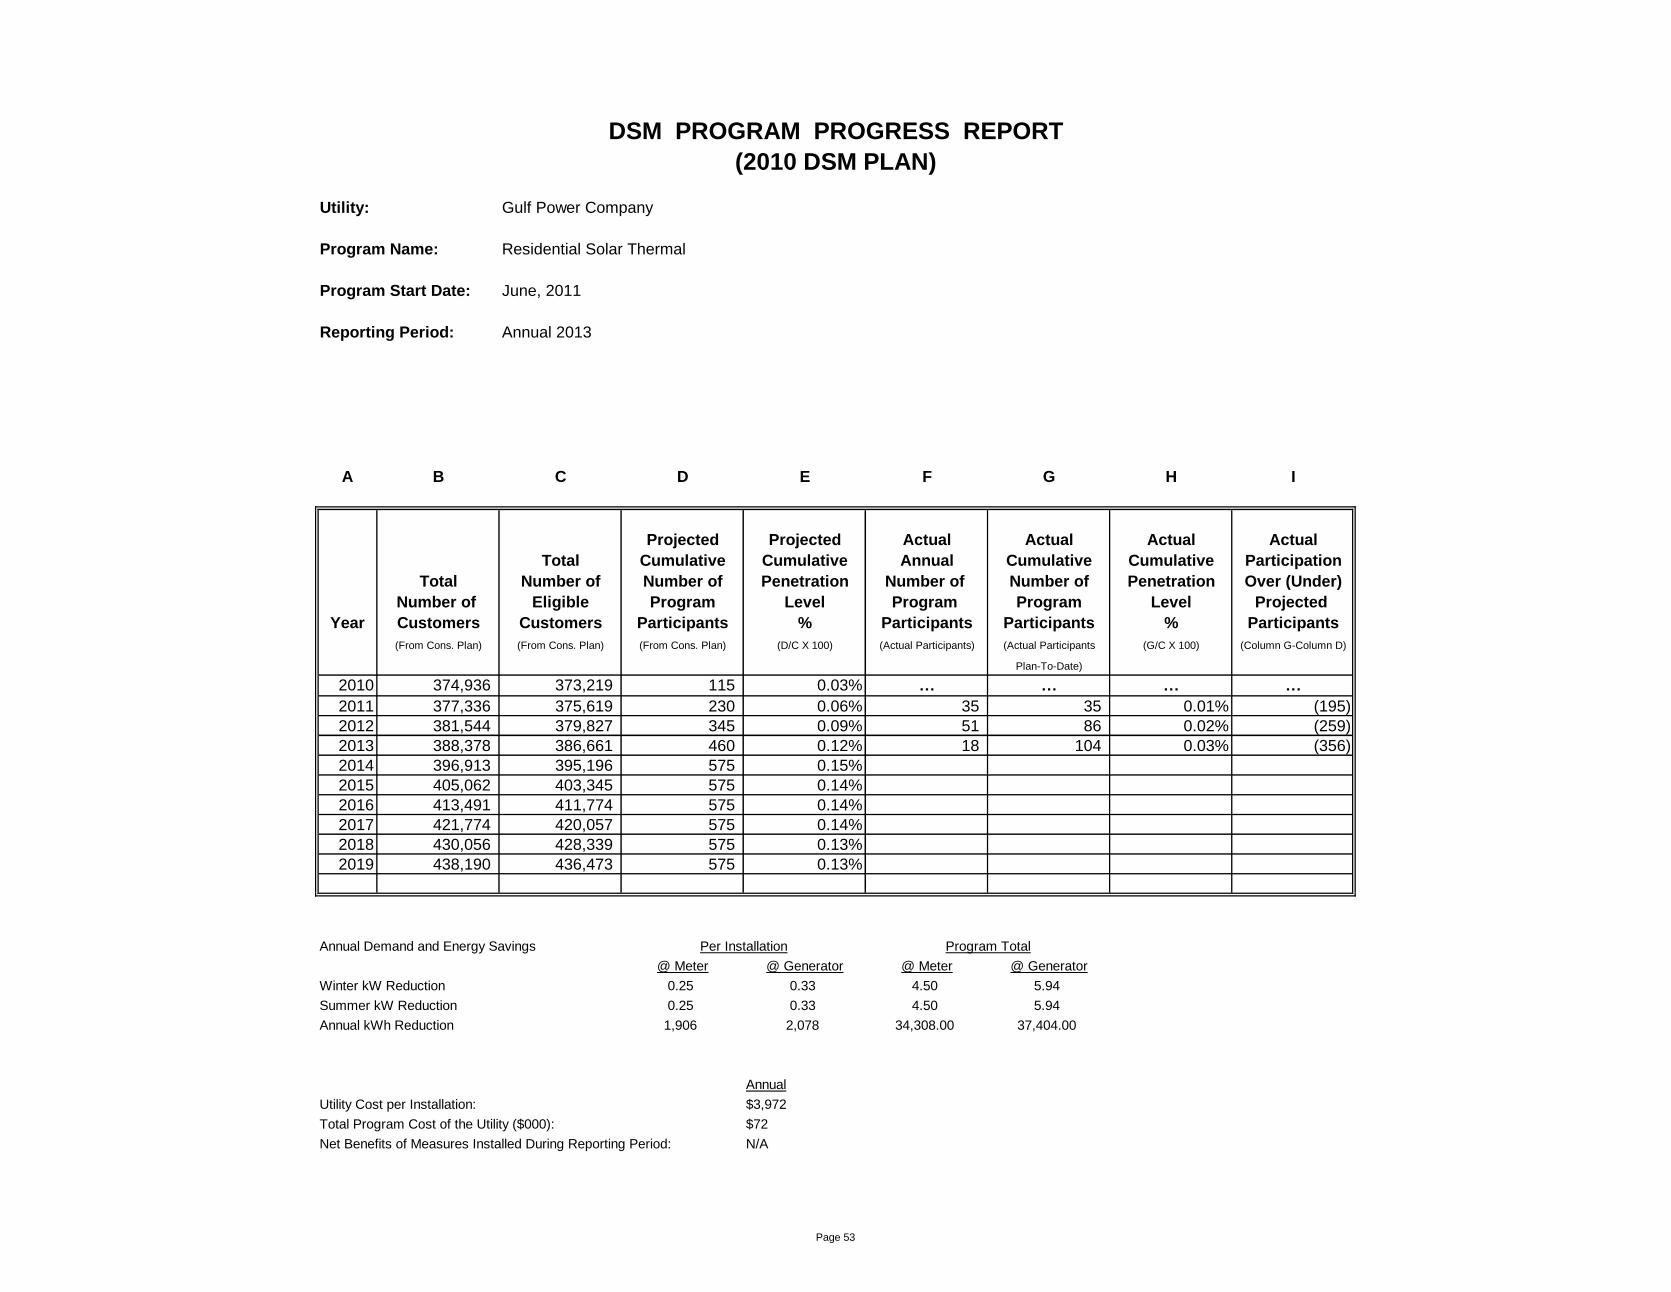
DSM PROGRAM PROGRESS REPORT
Utility: Gulf Power Company
Program Name: Residential Solar Thermal
Program Start Date: June, 2011
Reporting Period: Annual 2013
A B C D E F G H I
Projected Projected Actual Actual Actual Actual
Total Cumulative Cumulative Annual Cumulative Cumulative Participation
Total Number of Number of Penetration Number of Number of Penetration Over (Under)
Number of Eligible Program Level Program Program Level Projected
Year Customers Customers Participants % Participants Participants % Participants
(From Cons. Plan) (From Cons. Plan) (From Cons. Plan) (D/C X 100) (Actual Participants) (Actual Participants (G/C X 100) (Column G-Column D)
Plan-To-Date)
2010 374,936 373,219 115 0.03% … … … …
2011 377,336 375,619 230 0.06% 35 35 0.01% (195)
2012 381,544 379,827 345 0.09% 51 86 0.02% (259)
2013 388,378 386,661 460 0.12% 18 104 0.03% (356)
2014 396,913 395,196 575 0.15%
2015 405,062 403,345 575 0.14%
2016 413,491 411,774 575 0.14%
2017 421,774 420,057 575 0.14%
2018 430,056 428,339 575 0.13%
2019 438,190 436,473 575 0.13%
Annual Demand and Energy Savings Per Installation Program Total
@ Meter @ Generator @ Meter @ Generator
Winter kW Reduction 0.25 0.33 4.50 5.94
Summer kW Reduction 0.25 0.33 4.50 5.94
Annual kWh Reduction 1,906 2,078 34,308.00 37,404.00
Annual
Utility Cost per Installation: $3,972
Total Program Cost of the Utility ($000): $72
Net Benefits of Measures Installed During Reporting Period: N/A
(2010 DSM PLAN)
Page 53
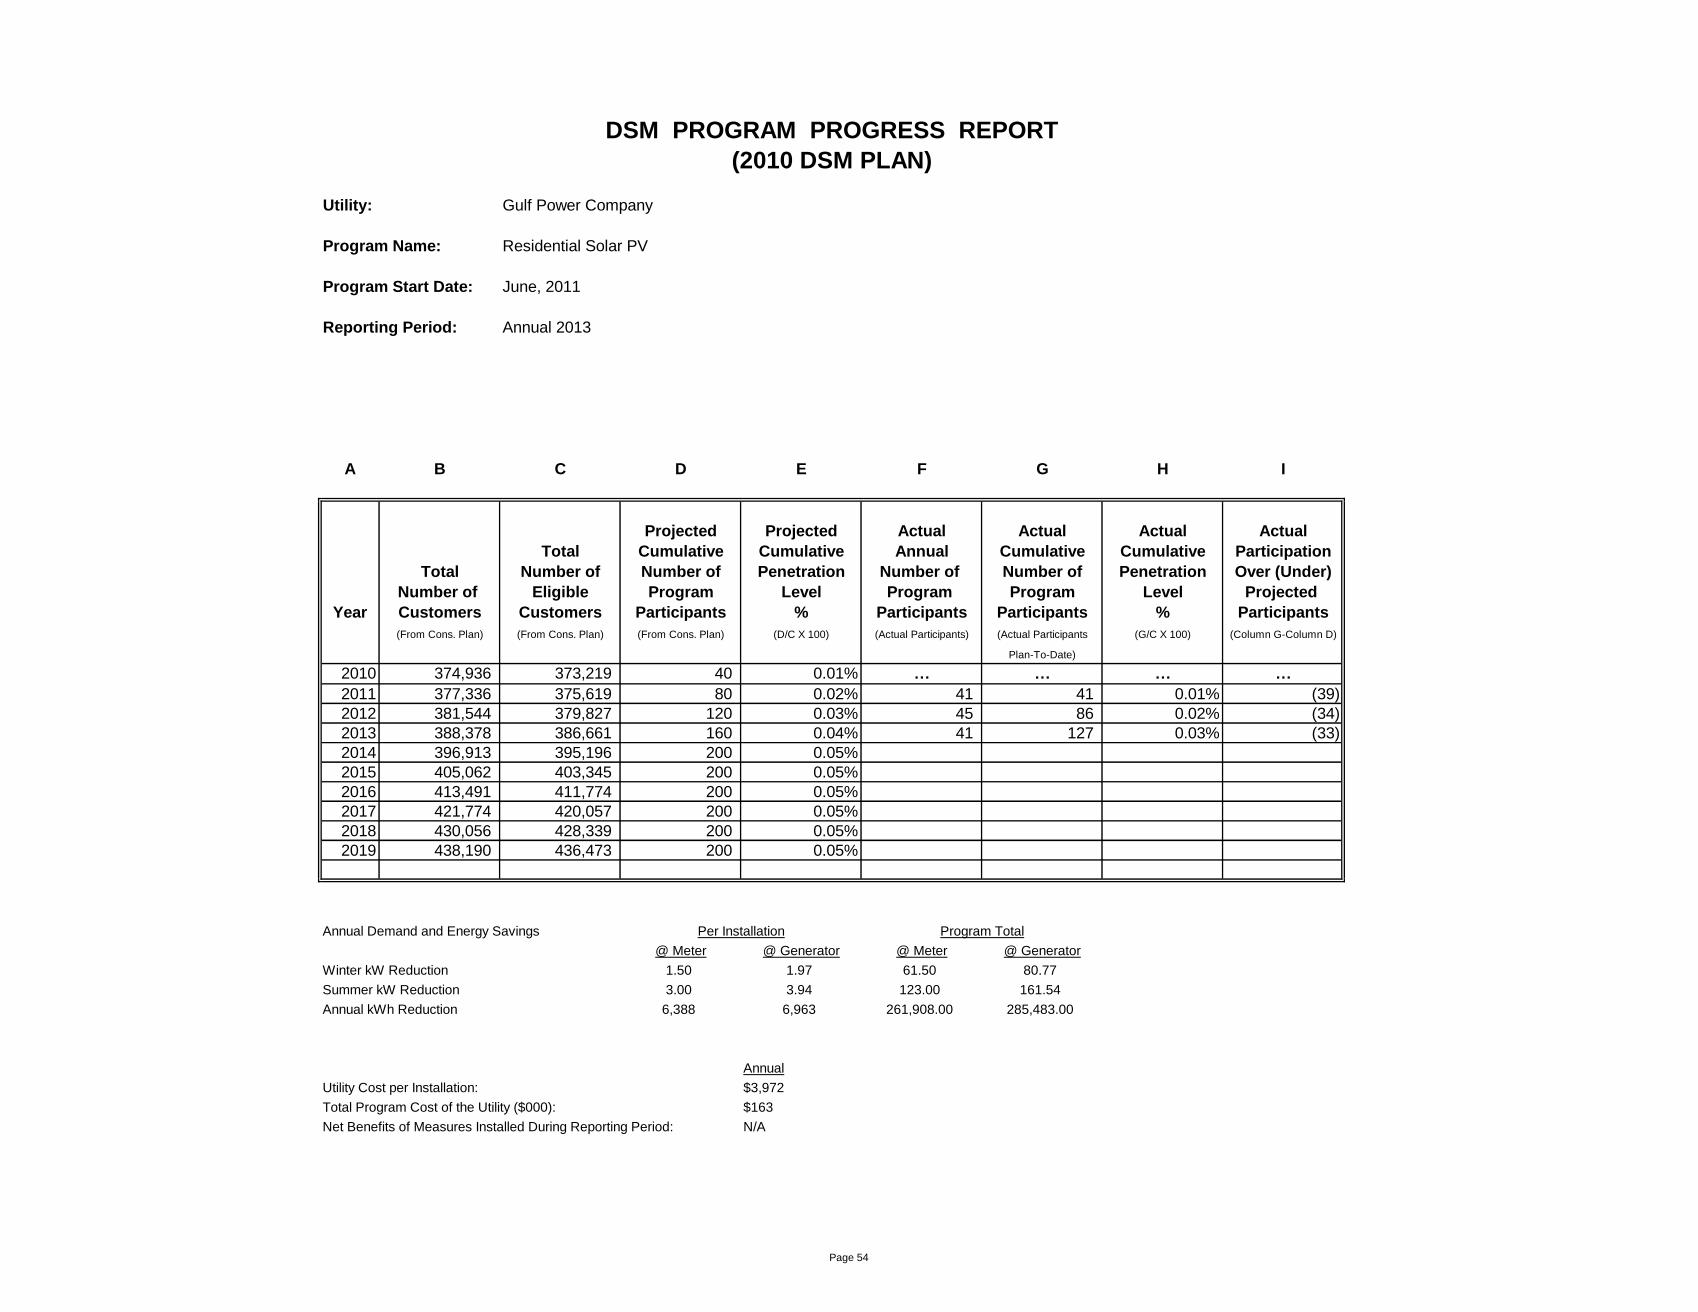
DSM PROGRAM PROGRESS REPORT
Utility: Gulf Power Company
Program Name: Residential Solar PV
Program Start Date: June, 2011
Reporting Period: Annual 2013
A B C D E F G H I
Projected Projected Actual Actual Actual Actual
Total Cumulative Cumulative Annual Cumulative Cumulative Participation
Total Number of Number of Penetration Number of Number of Penetration Over (Under)
Number of Eligible Program Level Program Program Level Projected
Year Customers Customers Participants % Participants Participants % Participants
(From Cons. Plan) (From Cons. Plan) (From Cons. Plan) (D/C X 100) (Actual Participants) (Actual Participants (G/C X 100) (Column G-Column D)
Plan-To-Date)
2010 374,936 373,219 40 0.01% … … … …
2011 377,336 375,619 80 0.02% 41 41 0.01% (39)
2012 381,544 379,827 120 0.03% 45 86 0.02% (34)
2013 388,378 386,661 160 0.04% 41 127 0.03% (33)
2014 396,913 395,196 200 0.05%
2015 405,062 403,345 200 0.05%
2016 413,491 411,774 200 0.05%
2017 421,774 420,057 200 0.05%
2018 430,056 428,339 200 0.05%
2019 438,190 436,473 200 0.05%
Annual Demand and Energy Savings Per Installation Program Total
@ Meter @ Generator @ Meter @ Generator
Winter kW Reduction 1.50 1.97 61.50 80.77
Summer kW Reduction 3.00 3.94 123.00 161.54
Annual kWh Reduction 6,388 6,963 261,908.00 285,483.00
Annual
Utility Cost per Installation: $3,972
Total Program Cost of the Utility ($000): $163
Net Benefits of Measures Installed During Reporting Period: N/A
(2010 DSM PLAN)
Page 54

DSM PROGRAM PROGRESS REPORT
Utility: Gulf Power Company
Program Name: Commercial Solar PV
Program Start Date: June, 2011
Reporting Period: Annual 2013
A B C D E F G H I
Projected Projected Actual Actual Actual Actual
Total Cumulative Cumulative Annual Cumulative Cumulative Participation
Total Number of Number of Penetration Number of Number of Penetration Over (Under)
Number of Eligible Program Level Program Program Level Projected
Year Customers Customers Participants % Participants Participants % Participants
(From Cons. Plan) (From Cons. Plan) (From Cons. Plan) (D/C X 100) (Actual Participants) (Actual Participants (G/C X 100) (Column G-Column D)
Plan-To-Date)
2010 54,648 46,618 6 0.01% … … … …
2011 55,016 46,872 12 0.03% 1 1 0.00% (11)
2012 55,584 47,317 18 0.04% 1 2 0.00% (16)
2013 56,431 48,039 24 0.05% 0 2 0.00% (22)
2014 57,460 48,940 30 0.06%
2015 58,450 49,802 30 0.06%
2016 59,469 50,692 30 0.06%
2017 60,476 51,568 30 0.06%
2018 61,486 52,443 30 0.06%
2019 62,491 53,302 30 0.06%
Annual Demand and Energy Savings Per Installation Program Total
@ Meter @ Generator @ Meter @ Generator
Winter kW Reduction 1.50 1.97 0.00 0.00
Summer kW Reduction 3.00 3.94 0.00 0.00
Annual kWh Reduction 6,388 6,963 0.00 0.00
Annual
Utility Cost per Installation: N/A
Total Program Cost of the Utility ($000): $0
Net Benefits of Measures Installed During Reporting Period: N/A No program participants
(2010 DSM PLAN)
Page 55
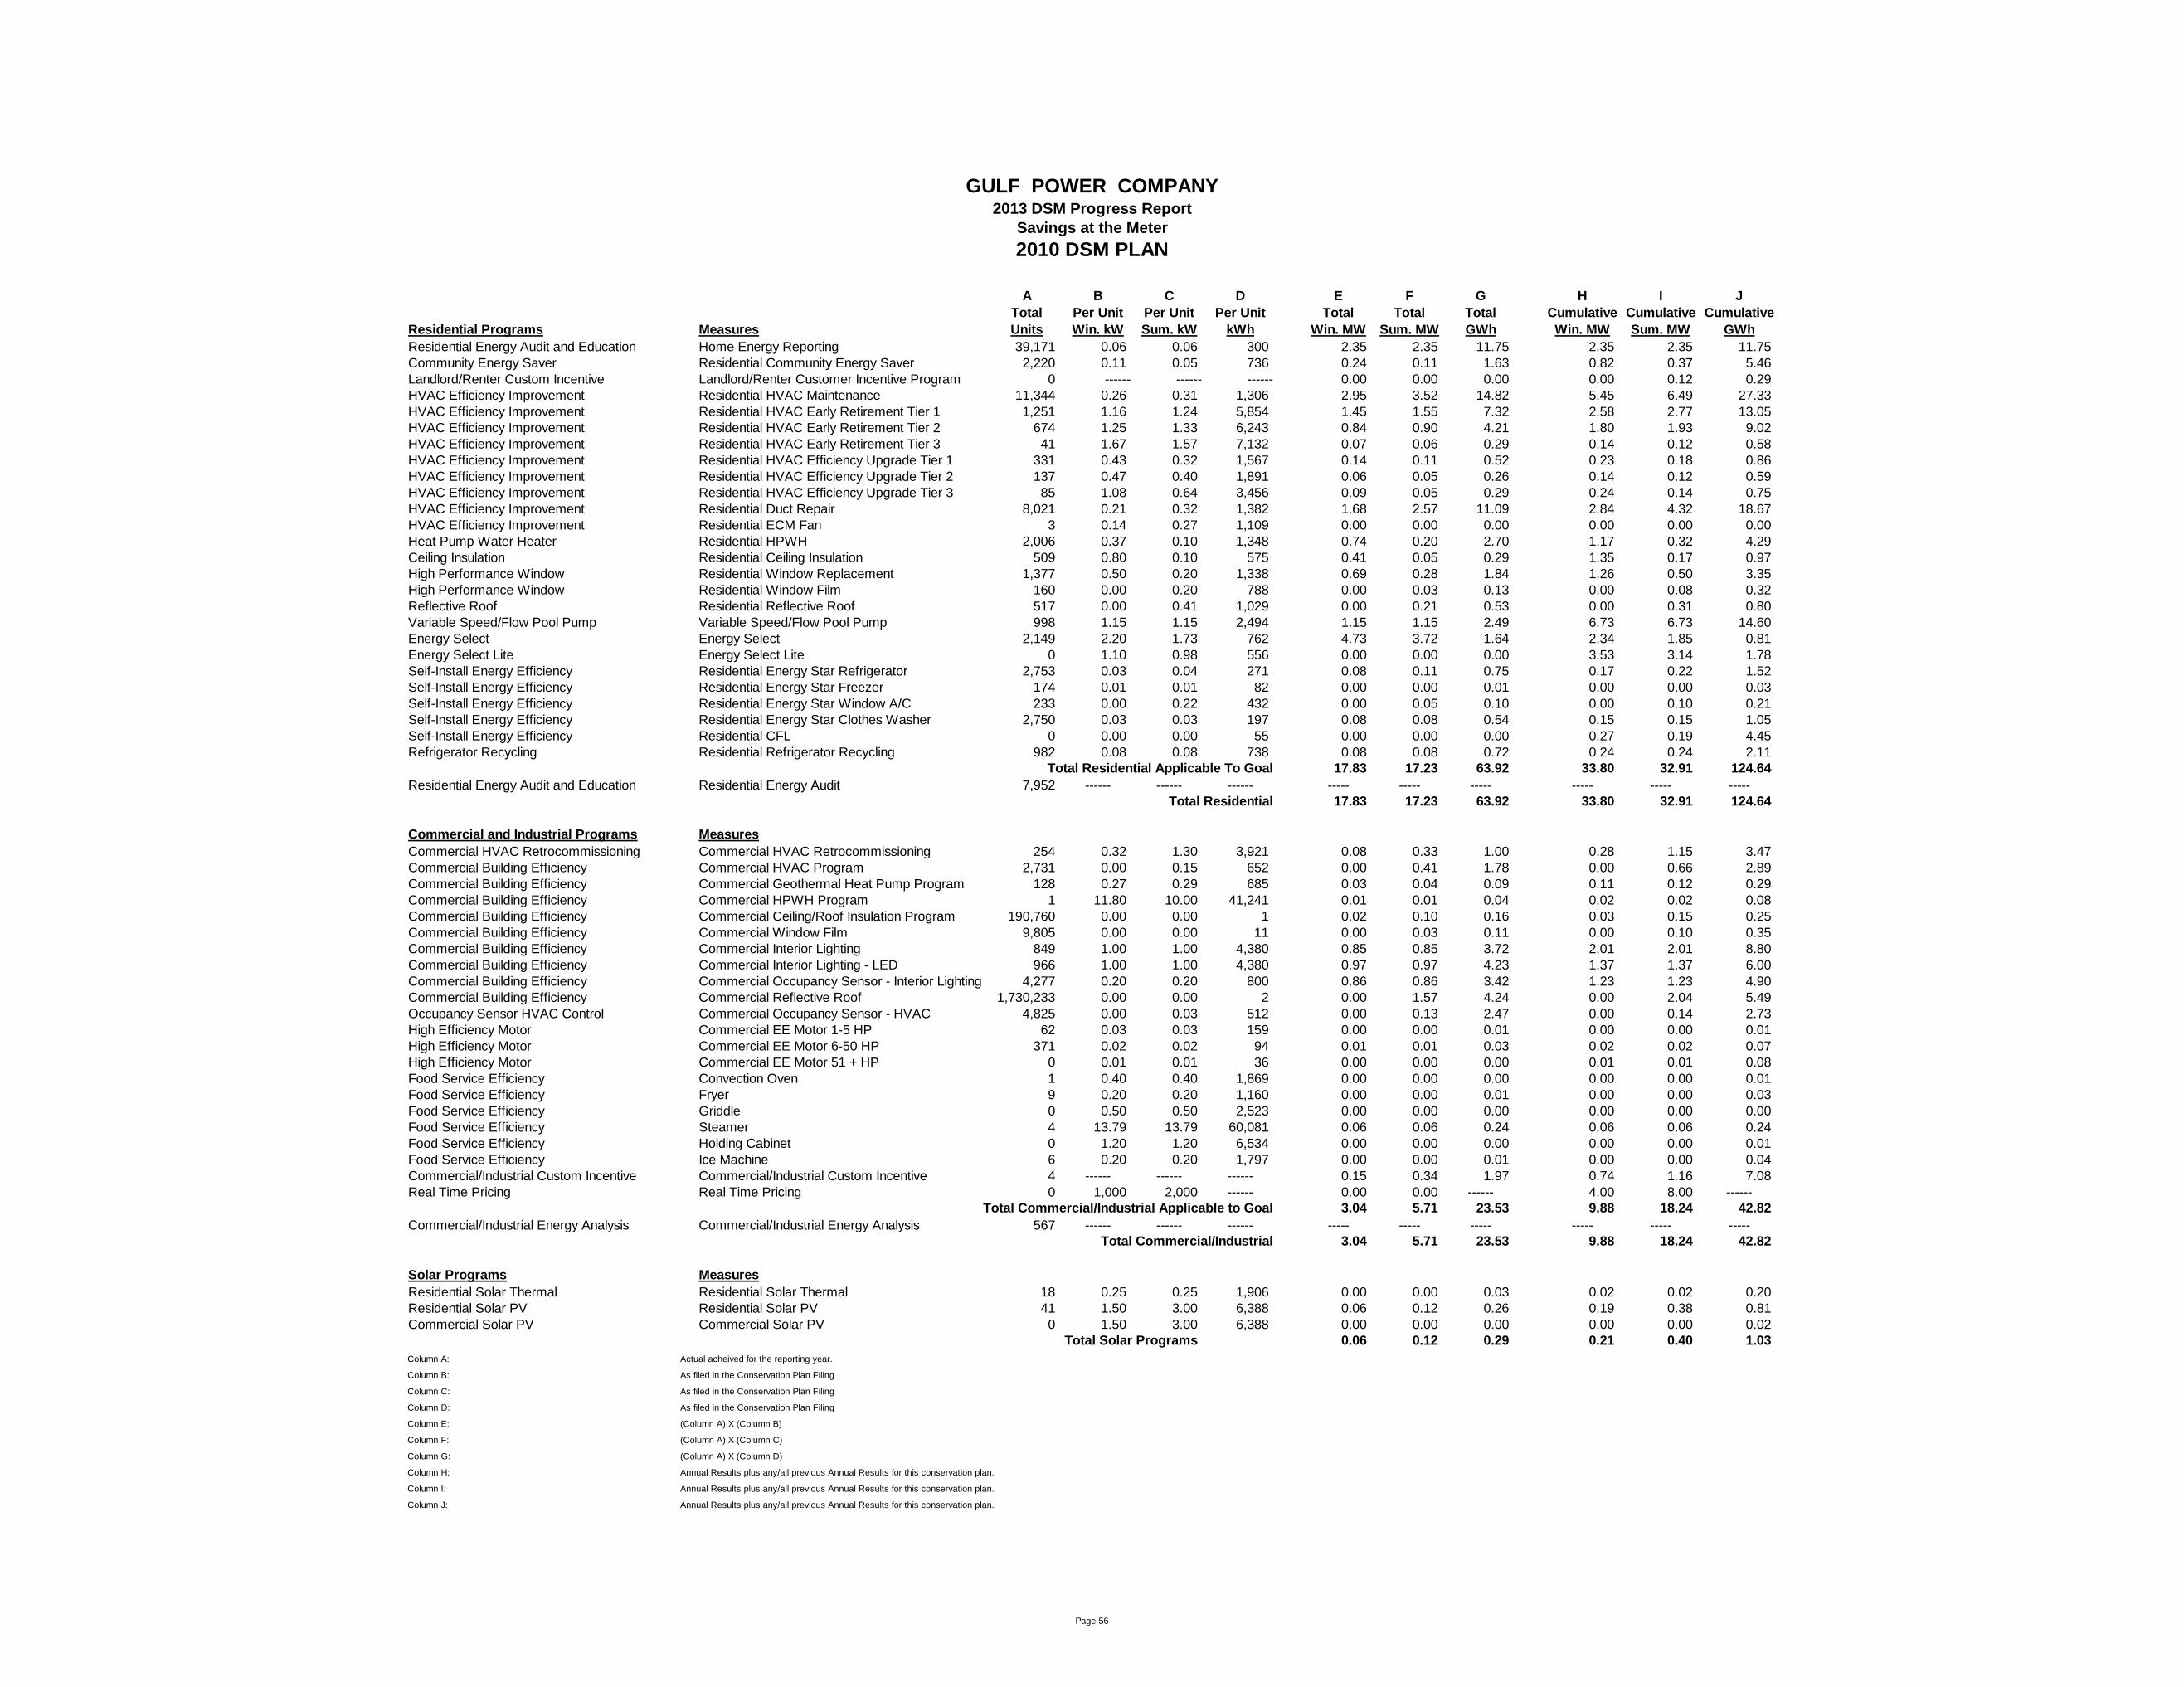
A B C D E F G H I J
Total Per Unit Per Unit Per Unit Total Total Total Cumulative Cumulative Cumulative
Residential Programs Measures Units Win. kW Sum. kW kWh Win. MW Sum. MW GWh Win. MW Sum. MW GWh
Residential Energy Audit and Education Home Energy Reporting 39,171 0.06 0.06 300 2.35 2.35 11.75 2.35 2.35 11.75
Community Energy Saver Residential Community Energy Saver 2,220 0.11 0.05 736 0.24 0.11 1.63 0.82 0.37 5.46
Landlord/Renter Custom Incentive Landlord/Renter Customer Incentive Program 0 ------ ------ ------ 0.00 0.00 0.00 0.00 0.12 0.29
HVAC Efficiency Improvement Residential HVAC Maintenance 11,344 0.26 0.31 1,306 2.95 3.52 14.82 5.45 6.49 27.33
HVAC Efficiency Improvement Residential HVAC Early Retirement Tier 1 1,251 1.16 1.24 5,854 1.45 1.55 7.32 2.58 2.77 13.05
HVAC Efficiency Improvement Residential HVAC Early Retirement Tier 2 674 1.25 1.33 6,243 0.84 0.90 4.21 1.80 1.93 9.02
HVAC Efficiency Improvement Residential HVAC Early Retirement Tier 3 41 1.67 1.57 7,132 0.07 0.06 0.29 0.14 0.12 0.58
HVAC Efficiency Improvement Residential HVAC Efficiency Upgrade Tier 1 331 0.43 0.32 1,567 0.14 0.11 0.52 0.23 0.18 0.86
HVAC Efficiency Improvement Residential HVAC Efficiency Upgrade Tier 2 137 0.47 0.40 1,891 0.06 0.05 0.26 0.14 0.12 0.59
HVAC Efficiency Improvement Residential HVAC Efficiency Upgrade Tier 3 85 1.08 0.64 3,456 0.09 0.05 0.29 0.24 0.14 0.75
HVAC Efficiency Improvement Residential Duct Repair 8,021 0.21 0.32 1,382 1.68 2.57 11.09 2.84 4.32 18.67
HVAC Efficiency Improvement Residential ECM Fan 3 0.14 0.27 1,109 0.00 0.00 0.00 0.00 0.00 0.00
Heat Pump Water Heater Residential HPWH 2,006 0.37 0.10 1,348 0.74 0.20 2.70 1.17 0.32 4.29
Ceiling Insulation Residential Ceiling Insulation 509 0.80 0.10 575 0.41 0.05 0.29 1.35 0.17 0.97
High Performance Window Residential Window Replacement 1,377 0.50 0.20 1,338 0.69 0.28 1.84 1.26 0.50 3.35
High Performance Window Residential Window Film 160 0.00 0.20 788 0.00 0.03 0.13 0.00 0.08 0.32
Reflective Roof Residential Reflective Roof 517 0.00 0.41 1,029 0.00 0.21 0.53 0.00 0.31 0.80
Variable Speed/Flow Pool Pump Variable Speed/Flow Pool Pump 998 1.15 1.15 2,494 1.15 1.15 2.49 6.73 6.73 14.60
Energy Select Energy Select 2,149 2.20 1.73 762 4.73 3.72 1.64 2.34 1.85 0.81
Energy Select Lite Energy Select Lite 0 1.10 0.98 556 0.00 0.00 0.00 3.53 3.14 1.78
Self-Install Energy Efficiency Residential Energy Star Refrigerator 2,753 0.03 0.04 271 0.08 0.11 0.75 0.17 0.22 1.52
Self-Install Energy Efficiency Residential Energy Star Freezer 174 0.01 0.01 82 0.00 0.00 0.01 0.00 0.00 0.03
Self-Install Energy Efficiency Residential Energy Star Window A/C 233 0.00 0.22 432 0.00 0.05 0.10 0.00 0.10 0.21
Self-Install Energy Efficiency Residential Energy Star Clothes Washer 2,750 0.03 0.03 197 0.08 0.08 0.54 0.15 0.15 1.05
Self-Install Energy Efficiency Residential CFL 0 0.00 0.00 55 0.00 0.00 0.00 0.27 0.19 4.45
Refrigerator Recycling Residential Refrigerator Recycling 982 0.08 0.08 738 0.08 0.08 0.72 0.24 0.24 2.11
Total Residential Applicable To Goal 17.83 17.23 63.92 33.80 32.91 124.64
Residential Energy Audit and Education Residential Energy Audit 7,952 ------ ------ ------ ----- ----- ----- ----- ----- -----
Total Residential 17.83 17.23 63.92 33.80 32.91 124.64
Commercial and Industrial Programs Measures
Commercial HVAC Retrocommissioning Commercial HVAC Retrocommissioning 254 0.32 1.30 3,921 0.08 0.33 1.00 0.28 1.15 3.47
Commercial Building Efficiency Commercial HVAC Program 2,731 0.00 0.15 652 0.00 0.41 1.78 0.00 0.66 2.89
Commercial Building Efficiency Commercial Geothermal Heat Pump Program 128 0.27 0.29 685 0.03 0.04 0.09 0.11 0.12 0.29
Commercial Building Efficiency Commercial HPWH Program 1 11.80 10.00 41,241 0.01 0.01 0.04 0.02 0.02 0.08
Commercial Building Efficiency Commercial Ceiling/Roof Insulation Program 190,760 0.00 0.00 1 0.02 0.10 0.16 0.03 0.15 0.25
Commercial Building Efficiency Commercial Window Film 9,805 0.00 0.00 11 0.00 0.03 0.11 0.00 0.10 0.35
Commercial Building Efficiency Commercial Interior Lighting 849 1.00 1.00 4,380 0.85 0.85 3.72 2.01 2.01 8.80
Commercial Building Efficiency Commercial Interior Lighting - LED 966 1.00 1.00 4,380 0.97 0.97 4.23 1.37 1.37 6.00
Commercial Building Efficiency Commercial Occupancy Sensor - Interior Lighting 4,277 0.20 0.20 800 0.86 0.86 3.42 1.23 1.23 4.90
Commercial Building Efficiency Commercial Reflective Roof 1,730,233 0.00 0.00 2 0.00 1.57 4.24 0.00 2.04 5.49
Occupancy Sensor HVAC Control Commercial Occupancy Sensor - HVAC 4,825 0.00 0.03 512 0.00 0.13 2.47 0.00 0.14 2.73
High Efficiency Motor Commercial EE Motor 1-5 HP 62 0.03 0.03 159 0.00 0.00 0.01 0.00 0.00 0.01
High Efficiency Motor Commercial EE Motor 6-50 HP 371 0.02 0.02 94 0.01 0.01 0.03 0.02 0.02 0.07
High Efficiency Motor Commercial EE Motor 51 + HP 0 0.01 0.01 36 0.00 0.00 0.00 0.01 0.01 0.08
Food Service Efficiency Convection Oven 1 0.40 0.40 1,869 0.00 0.00 0.00 0.00 0.00 0.01
Food Service Efficiency Fryer 9 0.20 0.20 1,160 0.00 0.00 0.01 0.00 0.00 0.03
Food Service Efficiency Griddle 0 0.50 0.50 2,523 0.00 0.00 0.00 0.00 0.00 0.00
Food Service Efficiency Steamer 4 13.79 13.79 60,081 0.06 0.06 0.24 0.06 0.06 0.24
Food Service Efficiency Holding Cabinet 0 1.20 1.20 6,534 0.00 0.00 0.00 0.00 0.00 0.01
Food Service Efficiency Ice Machine 6 0.20 0.20 1,797 0.00 0.00 0.01 0.00 0.00 0.04
Commercial/Industrial Custom Incentive Commercial/Industrial Custom Incentive 4 ------ ------ ------ 0.15 0.34 1.97 0.74 1.16 7.08
Real Time Pricing Real Time Pricing 0 1,000 2,000 ------ 0.00 0.00 ------ 4.00 8.00 ------
Total Commercial/Industrial Applicable to Goal 3.04 5.71 23.53 9.88 18.24 42.82
Commercial/Industrial Energy Analysis Commercial/Industrial Energy Analysis 567 ------ ------ ------ ----- ----- ----- ----- ----- -----
Total Commercial/Industrial 3.04 5.71 23.53 9.88 18.24 42.82
Solar Programs Measures
Residential Solar Thermal Residential Solar Thermal 18 0.25 0.25 1,906 0.00 0.00 0.03 0.02 0.02 0.20
Residential Solar PV Residential Solar PV 41 1.50 3.00 6,388 0.06 0.12 0.26 0.19 0.38 0.81
Commercial Solar PV Commercial Solar PV 0 1.50 3.00 6,388 0.00 0.00 0.00 0.00 0.00 0.02
Total Solar Programs 0.06 0.12 0.29 0.21 0.40 1.03
Column A: Actual acheived for the reporting year.
Column B: As filed in the Conservation Plan Filing
Column C: As filed in the Conservation Plan Filing
Column D: As filed in the Conservation Plan Filing
Column E: (Column A) X (Column B)
Column F: (Column A) X (Column C)
Column G: (Column A) X (Column D)
Column H: Annual Results plus any/all previous Annual Results for this conservation plan.
Column I: Annual Results plus any/all previous Annual Results for this conservation plan.
Column J: Annual Results plus any/all previous Annual Results for this conservation plan.
GULF POWER COMPANY2013 DSM Progress Report
Savings at the Meter
2010 DSM PLAN
Page 56

A B C D E F G H I J
Total Per Unit Per Unit Per Unit Total Total Total Cumulative Cumulative Cumulative
Residential Programs Measures Units Win. kW Sum. kW kWh Win. MW Sum. MW GWh Win. MW Sum. MW GWh
Residential Energy Audit and Education Home Energy Reporting 39,171 0.08 0.08 327 3.13 3.13 12.81 3.13 3.13 12.81
Community Energy Saver Residential Community Energy Saver 2,220 0.14 0.07 802 0.31 0.16 1.78 1.04 0.52 5.96
Landlord/Renter Custom Incentive Landlord/Renter Customer Incentive Program 0 ------ ------ ------ 0.00 0.00 0.00 0.00 0.16 0.38
HVAC Efficiency Improvement Residential HVAC Maintenance 11,344 0.34 0.41 1,424 3.86 4.65 16.15 7.12 8.58 29.79
HVAC Efficiency Improvement Residential HVAC Early Retirement Tier 1 1,251 1.52 1.63 6,381 1.90 2.04 7.98 3.39 3.64 14.22
HVAC Efficiency Improvement Residential HVAC Early Retirement Tier 2 674 1.64 1.75 6,805 1.11 1.18 4.59 2.38 2.53 9.84
HVAC Efficiency Improvement Residential HVAC Early Retirement Tier 3 41 2.19 2.06 7,774 0.09 0.08 0.32 0.18 0.16 0.64
HVAC Efficiency Improvement Residential HVAC Efficiency Upgrade Tier 1 331 0.56 0.42 1,708 0.19 0.14 0.57 0.31 0.23 0.94
HVAC Efficiency Improvement Residential HVAC Efficiency Upgrade Tier 2 137 0.62 0.53 2,061 0.08 0.07 0.28 0.19 0.17 0.64
HVAC Efficiency Improvement Residential HVAC Efficiency Upgrade Tier 3 85 1.42 0.84 3,767 0.12 0.07 0.32 0.30 0.18 0.82
HVAC Efficiency Improvement Residential Duct Repair 8,021 0.28 0.42 1,506 2.25 3.37 12.08 3.79 5.67 20.35
HVAC Efficiency Improvement Residential ECM Fan 3 0.18 0.35 1,209 0.00 0.00 0.00 0.00 0.00 0.00
Heat Pump Water Heater Residential HPWH 2,006 0.49 0.13 1,469 0.98 0.26 2.95 1.56 0.41 4.68
Ceiling Insulation Residential Ceiling Insulation 509 1.05 0.13 627 0.53 0.07 0.32 1.76 0.22 1.06
High Performance Window Residential Window Replacement 1,377 0.66 0.26 1,458 0.91 0.36 2.01 1.65 0.65 3.66
High Performance Window Residential Window Film 160 0.00 0.26 859 0.00 0.04 0.14 0.00 0.11 0.34
Reflective Roof Residential Reflective Roof 517 0.00 0.54 1,122 0.00 0.28 0.58 0.00 0.42 0.87
Variable Speed/Flow Pool Pump Variable Speed/Flow Pool Pump 998 1.51 1.51 2,718 1.51 1.51 2.71 8.84 8.84 15.90
Energy Select Energy Select 2,149 2.89 2.27 831 6.21 4.88 1.78 3.08 2.41 0.88
Energy Select Lite Energy Select Lite 0 1.44 1.29 606 0.00 0.00 0.00 4.63 4.13 1.94
Self-Install Energy Efficiency Residential Energy Star Refrigerator 2,753 0.04 0.05 295 0.11 0.14 0.81 0.22 0.29 1.65
Self-Install Energy Efficiency Residential Energy Star Freezer 174 0.01 0.01 89 0.00 0.00 0.02 0.00 0.00 0.04
Self-Install Energy Efficiency Residential Energy Star Window A/C 233 0.00 0.29 471 0.00 0.07 0.11 0.00 0.14 0.23
Self-Install Energy Efficiency Residential Energy Star Clothes Washer 2,750 0.04 0.04 215 0.10 0.10 0.59 0.20 0.20 1.15
Self-Install Energy Efficiency Residential CFL 0 0.00 0.00 60 0.00 0.00 0.00 0.35 0.25 4.85
Refrigerator Recycling Residential Refrigerator Recycling 982 0.11 0.11 804 0.10 0.10 0.79 0.30 0.30 2.31
Total Residential Applicable To Goal 23.49 22.70 69.69 44.42 43.34 135.95
Residential Energy Audit and Education Residential Energy Audit 7,952 ------ ------ ------ ----- ----- ----- ----- ----- -----
Total Residential 23.49 22.70 69.69 44.42 43.34 135.95
Commercial and Industrial Programs Measures
Commercial HVAC Retrocommissioning Commercial HVAC Retrocommissioning 254 0.42 1.71 4,274 0.11 0.43 1.09 0.38 1.50 3.78
Commercial Building Efficiency Commercial HVAC Program 2,731 0.00 0.20 711 0.00 0.55 1.94 0.00 0.89 3.14
Commercial Building Efficiency Commercial Geothermal Heat Pump Program 128 0.35 0.38 747 0.04 0.05 0.10 0.14 0.16 0.32
Commercial Building Efficiency Commercial HPWH Program 1 15.50 13.10 44,953 0.02 0.01 0.04 0.04 0.02 0.08
Commercial Building Efficiency Commercial Ceiling/Roof Insulation Program 190,760 0.00 0.00 1 0.03 0.13 0.17 0.04 0.20 0.26
Commercial Building Efficiency Commercial Window Film 9,805 0.00 0.00 12 0.00 0.04 0.12 0.00 0.13 0.38
Commercial Building Efficiency Commercial Interior Lighting 849 1.31 1.31 4,774 1.11 1.11 4.05 2.63 2.63 9.58
Commercial Building Efficiency Commercial Interior Lighting - LED 966 1.31 1.31 4,774 1.27 1.27 4.61 1.80 1.80 6.53
Commercial Building Efficiency Commercial Occupancy Sensor - Interior Lighting 4,277 0.26 0.26 872 1.11 1.11 3.73 1.59 1.59 5.34
Commercial Building Efficiency Commercial Reflective Roof 1,730,233 0.00 0.00 3 0.00 2.08 4.62 0.00 2.69 5.98
Occupancy Sensor HVAC Control Commercial Occupancy Sensor - HVAC 4,825 0.00 0.03 558 0.00 0.16 2.69 0.00 0.18 2.97
High Efficiency Motor Commercial EE Motor 1-5 HP 62 0.04 0.04 173 0.00 0.00 0.01 0.00 0.00 0.01
High Efficiency Motor Commercial EE Motor 6-50 HP 371 0.02 0.02 102 0.01 0.01 0.04 0.02 0.02 0.08
High Efficiency Motor Commercial EE Motor 51 + HP 0 0.01 0.01 39 0.00 0.00 0.00 0.01 0.01 0.08
Food Service Efficiency Convection Oven 1 0.53 0.53 2,037 0.00 0.00 0.00 0.00 0.00 0.02
Food Service Efficiency Fryer 9 0.26 0.26 1,264 0.00 0.00 0.01 0.00 0.00 0.03
Food Service Efficiency Griddle 0 0.66 0.66 2,750 0.00 0.00 0.00 0.00 0.00 0.00
Food Service Efficiency Steamer 4 18.11 18.11 65,488 0.07 0.07 0.26 0.07 0.07 0.26
Food Service Efficiency Holding Cabinet 0 1.58 1.58 7,122 0.00 0.00 0.00 0.00 0.00 0.01
Food Service Efficiency Ice Machine 6 0.26 0.26 1,959 0.00 0.00 0.01 0.00 0.00 0.04
Commercial/Industrial Custom Incentive Commercial/Industrial Custom Incentive 4 ------ ------ ------ 0.19 0.44 2.14 0.97 1.51 8.59
Real Time Pricing Real Time Pricing 0 1,313 2,627 ------ 0.00 0.00 ------ 5.25 10.51 ------
Total Commercial/Industrial Applicable to Goal 3.96 7.46 25.63 12.94 23.91 47.48
Commercial/Industrial Energy Analysis Commercial/Industrial Energy Analysis 567 ------ ------ ------ ----- ----- ----- ----- ----- -----
Total Commercial/Industrial 3.96 7.46 25.63 12.94 23.91 47.48
Solar Programs Measures
Residential Solar Thermal Residential Solar Thermal 18 0.33 0.33 2,078 0.01 0.01 0.04 0.04 0.04 0.22
Residential Solar PV Residential Solar PV 41 1.97 3.94 6,963 0.08 0.16 0.29 0.25 0.50 0.89
Commercial Solar PV Commercial Solar PV 0 1.97 3.94 6,963 0.00 0.00 0.00 0.00 0.00 0.02
Total Solar Programs 0.09 0.17 0.33 0.29 0.54 1.13
Column A: Actual acheived for the reporting year.
Column B: As filed in the Conservation Plan Filing
Column C: As filed in the Conservation Plan Filing
Column D: As filed in the Conservation Plan Filing
Column E: (Column A) X (Column B)
Column F: (Column A) X (Column C)
Column G: (Column A) X (Column D)
Column H: Annual Results plus any/all previous Annual Results for this conservation plan.
Column I: Annual Results plus any/all previous Annual Results for this conservation plan.
Column J: Annual Results plus any/all previous Annual Results for this conservation plan.
GULF POWER COMPANY2013 DSM Progress Report
Savings at the Generator
2010 DSM PLAN
Page 57

Comparison of Achieved kW and kWh Reductions With Public Service Commission Established Goals
at the Generator
Utility: GULF POWER COMPANY
Residential
Winter Peak MW Reduction Summer Peak MW Reduction
Total Com. Appr. % Total Com. Appr. % Total Com. Appr. %
Achieved Goal Variance Achieved Goal Variance Achieved Goal Variance
2010 … 5.9 -100% … 7.5 -100% … 35.0 -100%
2011 7.04 6.5 8% 7.24 8.3 -13% 28.30 37.6 -25%
2012 19.49 7.4 163% 19.29 9.4 105% 63.66 40.6 57%
2013 23.49 8.5 176% 22.70 10.5 116% 69.69 43.8 59%
2014 9.5 11.7 46.8
2015 10.9 12.8 50.2
2016 12.1 14.0 53.6
2017 12.7 14.7 55.4
2018 13.3 14.9 56.2
2019 13.7 15.1 56.7
Commercial/Industrial
Winter Peak MW Reduction Summer Peak MW Reduction
Total Com. Appr. % Total Com. Appr. % Total Com. Appr. %
Achieved Goal Variance Achieved Goal Variance Achieved Goal Variance
2010 … 0.5 -100% … 1.2 -100% … 3.2 -100%
2011 2.89 0.6 382% 5.13 1.6 221% 11.67 5.6 108%
2012 7.63 0.8 854% 14.54 2.1 592% 12.59 7.7 64%
2013 3.96 0.9 340% 7.46 2.4 211% 25.63 9.5 170%
2014 1.0 2.7 10.8
2015 1.0 2.9 11.7
2016 1.2 3.0 12.3
2017 1.1 3.2 12.7
2018 1.1 3.1 12.5
2019 1.1 3.1 11.9
Total Company (including Solar)
Winter Peak MW Reduction Summer Peak MW Reduction
Total Com. Appr. % Total Com. Appr. % Total Com. Appr. %
Achieved Goal Variance Achieved Goal Variance Achieved Goal Variance
2010 … 6.4 -100% … 8.7 -100% … 38.2 -100%
2011 10.02 7.1 41% 12.54 9.9 27% 40.34 43.2 -7%
2012 27.23 8.2 232% 27.23 11.5 137% 76.68 48.3 59%
2013 27.54 9.4 193% 30.33 12.9 135% 95.65 53.3 79%
2014 10.5 14.4 57.6
2015 11.9 15.7 61.9
2016 13.3 17.0 65.9
2017 13.8 17.9 68.1
2018 14.4 18.0 68.7
2019 14.8 18.2 68.6
2010 DSM PLAN
GWh Energy Reduction
GWh Energy Reduction
GWh Energy Reduction
Page 58