usa activities on dsm (demand response & energy efficiency)
TRANSCRIPT

USA Activities on DSM(Demand Response & Energy
Efficiency)
Larry MansuetiOffice of Electricity Delivery and Energy Reliability
U.S. Department of Energywww.oe.energy.gov
April 18, 2007Seoul, Korea
Workshop on Demand Side ManagementIEA DSM Programme

Main Point of this Presentation
Main Point: Strong, renewed recent interest in demand response and energy efficiency after a decade of reduced interest in many parts of U.S.
Note: “DSM” term in U.S. is no longer usedInstead, “DSM” in U.S. refers to either “demand response” or “energy efficiency as delivered by electric utilities”

DESCRIPTION OF U.S. ELECTRICITY SYSTEM

Source: Energy Information Administration, Form EIA-906, “Power Plant Report”
Electric Power Generation by Fuel Type (2005)

Investor-Owned Utilities -- 232Account for a majority of net generation (52%), transmission (80%), and distribution (50%)
Publicly-Owned Utilities and Cooperatives -- 2,900Account for 15% of net generation, 12% of transmission, and nearly 50% of the nation's electric distribution lines
Independent Power Producers -- 2,800Account for 26% of net generation
Federal GovernmentOwns 9 power agencies (including 4 Power Marketing Administrations and TVA) with 7% of net generation and 8% of transmission
Electric Power Marketers -- 128Account for 2.5% of sales to consumers; 67.8% of sales for resale Sources: [1] EIA, Electric Power Annual 2001, March 2003 (p.2)
[2] EIA, Annual Energy Review 2001, November 2002,Chapter 8 (Electricity)
U.S. Electric Industry –3,200 utilities plus others

Status of Wholesale Regional Power Markets
California’s high-profile 2000-2001 market meltdown helped overshadow other, more successful, market restructurings elsewhere that saved customers billions of dollars while enhancing power-grid reliability. But still problems with centralized mkts.
Centralized power markets with independent power grid operators are in California, Texas, New York, MidAtlantic, Northeast and Midwest, serving areas representing two-thirds of U.S. $10 trillion economy.
New England (ISO-NE), New York, (NYISO), Mid-Atlantic (NYISO and PJM), Midwest (MISO), California (CAISO), and Southwest (SPP)
No regional markets: Northwest, West (outside of California), and Southeast.

April 07: Virginia partially repealed
restructuring. Similar interest in other states.
Source: DOE Energy Information Administration
Electricity Retail Restructuring -- Stalled

Secretary of Energy is part of the President’s Cabinet and reports to himDOE does not regulate electricity (except transmission lines/exports with Canada & Mexico)Federal Energy Regulatory Commission (FERC) regulates all wholesale transactions and transmission.
regulates transmission and wholesale electricity sales in U.S. for “jurisdictional entities” (excludes state, federal, municipal, and most rural electric cooperative wholesale sales)Independent of the President, but he appoints all five commissioners
U.S. Electricity Regulation Summary

U.S. Electricity Regulation Summary (continued)
States regulate retail electricity sales for investor-ownedLocal governments regulate sales of municipal and publicly-owned utilitiesSales by rural cooperatives regulated by member boardsU.S. Congress enacts laws affecting reliability, wholesale sales, fuel diversity, and environmental impact of electricity

State of the U.S. Electric IndustryContinued regulatory uncertainty: structure (who will own
what?); reliability; environmental
Regional transmission operators & wholesale markets in some regions; Other regions resist. Wholesale markets are not working right yet – not enough new transmission being built.
A lot of congestion on transmission system; few new built
Generation: concern on rapid growth in natural gas use. Climate policy uncertainty.
Demand side not sufficiently engaged – needed for markets to work well and be a “fifth fuel”
Uncertainty: causes lack of investment
New Energy Policy Act of 2005: will it reduce uncertainty?

DESCRIPTION OF NATIONAL POLICY

Grid Modernization –A National Priority
“…We have modern interstate grids for our phone lines and our highways. It's time for America to build a modern electricity grid.”
President George W. BushApril 27, 2005
…. And now also a priority of Congress due to the Energy Policy Act of 2005

Energy Efficiency – U.S. Federal Government Perspective
Federal government wants to see more energy efficiency in electric and gas markets…..BUT
While there are federal efficiency standards on various consumer products…THERE ARE
No federal efficiency mandates on electric and gas utilities -- up to states and the boards of non-state regulated utilities to decide
Both the Administration and Congress leave it to States (and the boards of non-state regulated utilities) to chose how much
energy efficiency is appropriate
….While there are no federal demand response standards on consumer products, everything else on this slide is same for
demand response

U.S. Congress Demand Response Policy Statement
Federal Encouragement of Demand Response “It is the policy of the United States that time-
based pricing and other forms of demand response….shall be encouraged, the deployment of such technology and devices….shall be facilitated, and unnecessary barriers to demand response participation in energy, capacity and ancillary service markets shall be eliminated.”
– Energy Policy Act of 2005, Sec. 1252(f)
- But EPAct only requires States to considerrequiring demand response.

DEMAND RESPONSE STATUS

A Definition of Demand Response
“Changes in electric usage by end-use customers from their normal consumption patterns in response to changes in the price of electricity over time, or to incentive payments designed to induce lower electricity use at times of high wholesale market prices or when system reliability is jeopardized.”
- Benefits of Demand Response in Electricity Markets Report to Congress, U.S. Department of Energy
- Demand Response and Advanced Metering Report toCongress, Federal Energy Regulatory Commission

DOE’s and FERC’sDemand Response Resources Classification
Incentive-based Programs
Direct Load Control (DLC)Interruptible/curtailable rated (I/C)Demand bidding/Buy-back programs (DB)Emergency Demand Response Programs (EDRP)Capacity Programs (CAP)Ancillary Services markets program (A/S)
Time-based ratesTime-of-use (TOU)Critical peak pricing (CPP)Real-time pricing (RTP)

DOE Feb 2006 Report to Congress onNat’l Benefits of Demand Response
Identified DR Benefits:Participant financial benefits, market-wide benefits, reliability and market performance benefitsDOE reviewed 10 recent studies and concluded:
Lack of standardized and accepted analytic methodsPreferable to quantify DR benefits at state/regional level (rather than nat’l) because tied directly to local system conditions and market structure
Made Policy Recommendations in Six Areas:Fostering Price-based Demand ResponseImproving Incentive-based DR ProgramsStrengthening DR Analysis and ValuationIntegrating DR into Resource PlanningIncreased Adoption of Enabling TechnologiesEnhancing Federal Demand Response Actions

Federal Energy Regulatory CommissionStaff Report on Demand Response and
Advanced Metering
http://www.ferc.gov/legal/staff-reports/demand-response.pdf
Energy Policy Act of 2005 (Section 1252e) requires FERC to identify and review:- Advanced metering penetration
- Demand response programs and resource contribution
- Role of DR in regional and transmission planning
- Regulatory barriers

Federal Energy Regulatory CommissionStaff Report on Demand Response and
Advanced Metering
http://www.ferc.gov/legal/staff-reports/demand-response.pdf
Main Conclusions:
• Demand response is important for both wholesale and retail markets
• Current DR capability represents
--between 3% to 7% of peak demand in most regions
• Low penetration of enabling technologies

FERC Demand Response ReportGives Status
37,500 MW of demand response potential available in the U.S.
~5% of summer 2006 peak demand~9,000 MW available from wholesale programs operated primarily by “Independent System Operators” (ISOs)Major portion is contributed by incentive-based programs

FERC Demand Response Report Types of DR Programs Offered in U.S.:
2005
Type of DR Program
Number of Entities(1,063 entities responded to
the survey)Time-varying tariffs
Time-of-use Pricing 187Real-time Pricing 47
Critical Peak Pricing 25Incentive-based DR programs
Direct Load Control 234Interruptible/Curtailable 218
Emergency Demand Response Program 27
Capacity Market Program 16Demand Bidding 18
Ancillary Services 1

FERC Demand Response Report Existing DR Resource Potential
by Type of Program
0
2000
4000
6000
8000
I/C DLC ED RP C AP A /S D B M ultiple O ther RTP C PP TO U
Pote
ntia
l Pea
k R
educ
tions
(MW
) ISO/RTOOther (Agriculture)IndustrialCom m ercialResidential
Incentive-based DR Program s Tim e-based Tariffs

North American Electric Reliability Council (NERC) Regions
NERC regions are used in FERC report to organize data

FERC Demand Response Report Existing Demand Response
Resource Potential - by NERC Region
0
2000
4000
6000
8000
10000
ERCOT FRCC MRO NPCC RF SERC SPP WECC Other
Pote
ntia
l Pea
k R
educ
tions
(MW
) Wholesale Other (Agriculture)IndustrialCommercialResidential
As Percent of Summer 2006 Demand
3% 4%5%4%6%20%7% 4% N/A

FERC Demand Response Report Direct Load Control (DLC) Programs
234 entities offer 565 DLC programsResidential: 211 entities offer 348 programsCommercial: 78 entities offer 123 programs
6,627 MW of DR resource84% residential, 12% commercial
4.8 million customers enrolled (not all active)98% residential, 2% commercial
Actual peak reduction reported in 2005: 826 MW
88% residential, 8% commercial~13% of potential peak reduction of these customers’ loads

FERC Demand Response Report Advanced Metering Penetration
Source: FERC Report to Congress“, www.ferc.gov, under Energy Policy Act

FERC Demand Response Report Use of Advanced Metering
Penetration of advanced metering lower than expected (~ 6%)– Other estimates had been closer to 10%– Some utilities with fixed network automated meter reading did not report their meters as “advanced meters”
High penetration exists in both rural and more urbanized states
Rural electric cooperatives have the highest penetration-- Likely driven by meter reading savings
Except for a few states, penetration in Northeastern U.S. is less than the national average
--- Source: 2006 FERC Report to Congress
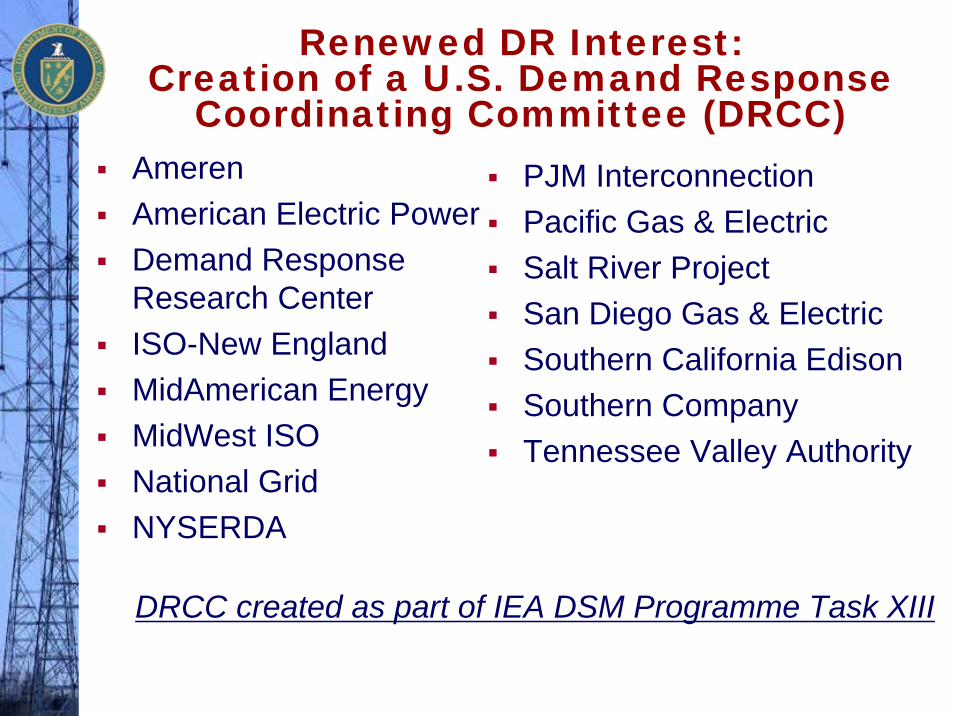
Renewed DR Interest: Creation of a U.S. Demand Response
Coordinating Committee (DRCC)AmerenAmerican Electric PowerDemand Response Research CenterISO-New EnglandMidAmerican EnergyMidWest ISONational GridNYSERDA
PJM InterconnectionPacific Gas & ElectricSalt River ProjectSan Diego Gas & ElectricSouthern California EdisonSouthern CompanyTennessee Valley Authority
DRCC created as part of IEA DSM Programme Task XIII

ENERGY EFFICIENCY STATUS

But Utility-Delivered Energy Efficiency Has More Than a Decade of Experience
Established energy efficiency as reliable, low-cost resource in parts of countryReal programs with real resultsDelivering efficiency typically at $0.02 to $0.03 per lifetime kWh saved and $1.30 to $2.00 per lifetime MMBtu saved
Established large potential to meet new demand, address growthRegionally, nationallyCan help control load growth by 50% or more if desired
Established various measurement and verification proceduresSavings are real, persistent if programs designed and implemented wellCan be integrated into resource planning
Established model energy efficiency delivery programs for key customer classes
Residential -- commercial – industrialLow incomeGas / electricNew / mature portfolios
Energy efficiency programs can help customersMake sound energy use decisionsIncrease control over their energy billsSave 10, 20 and 30 percent on energy bills
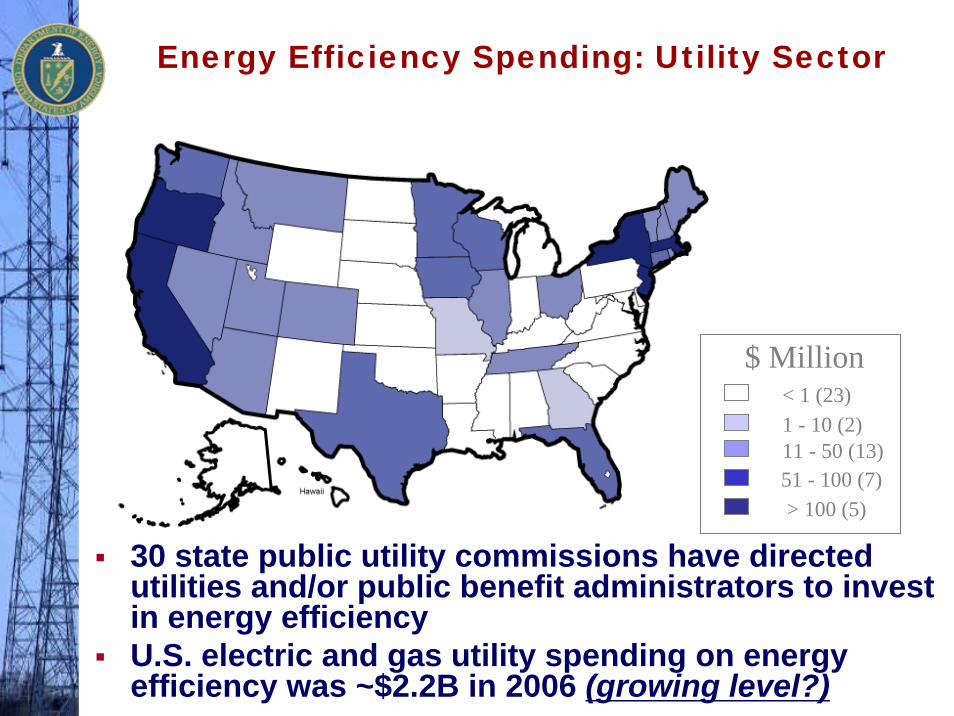
Energy Efficiency Spending: Utility Sector
$ Million< 1 (23)1 - 10 (2)11 - 50 (13)51 - 100 (7)> 100 (5)
30 state public utility commissions have directed utilities and/or public benefit administrators to invest in energy efficiencyU.S. electric and gas utility spending on energy efficiency was ~$2.2B in 2006 (growing level?)

Impact of Energy Efficiency programs in reducing utility load growth in the West
(2004-2013)
Avista
BC H
ydro
Idah
o Po
wer
NW
E
PacifiC
orp
PGE
PSCO PS
E
PG&E
SCE
SDG&E
0%
1%
2%
3%
4%An
nual
Ene
rgy
Load
Gro
wth
(%
)
Total Energy Requirements
Adjusted Forecast (net of plan program effects)
Five utilities (Avista, PSE, PG&E, SCE and SDG&E) proposed EE programs that reduce forecasted load growth by 50-75% (1.6–2.6% per year to under ~0.5%)

Released on July 31, 2006 at the National Association of Regulatory Utility Commissioners meetingGoal: To create a sustainable, aggressive national commitment to energy efficiency through gas and electric utilities, utility regulators, and partner organizationsOver 50 member public-private Leadership Group developed five recommendations and commits to take actionDOE and EPA only facilitate!!! Additional commitments to energy efficiency – exceeds 90 organizationswww.epa.gov/eeactionplan
National Action Plan for Energy Efficiency
Recommendations
1. Recognize energy efficiency as a high-priority energy resource.
2. Make a strong, long-term commitment to implement cost-effective energy efficiency as a resource.
3. Broadly communicate the benefits of and opportunities for energy efficiency.
4. Provide sufficient, timely and stable program funding to deliver energy efficiency where cost-effective.
5. Modify policies to align utility incentives with the delivery of cost-effective energy efficiency and modify ratemaking practices to promote energy efficiency investments.
“National Action Plan for Energy Efficiency” Captures New Interest

Sets tone and overall direction of the Action PlanReleased Action Plan Report and Recommendations (July 06)Co-Chaired by:
Commissioner Marsha Smith, National Association of Regulatory Utility Commissioners First Vice President & Member of Idaho Public Utility CommissionJim Rogers, Chairman of Edison Electric Institute & President and CEO of Duke Energy
Includes 50 leading electric and gas utilities, state utility commissioners, state air and energy agencies, energy services providers, energy consumers, and energy efficiency and consumer advocates ---US DOE and US EPA facilitated & did not determine recommendations!
National Action Plan for Energy Efficiency
Leadership Group

The Leadership Group
Exelon Food Lion Great River Energy Idaho Public Utilities CommissionISO New England Inc. Johnson Controls MidAmerican Energy Company Minnesota Public Utilities Commission National GridNatural Resources Defense Council New Jersey Board of Public Utilities New Jersey Natural Gas New York Power Authority New York State Public Service CommissionNorth Carolina Air Office North Carolina Energy Office Ohio Consumers' Counsel Pacific Gas and Electric Pepco Holdings, Inc.PJM InterconnectionPNM Resources
Alliance to Save Energy American Council for an Energy-Efficient Economy AmerenAmerican Electric Power Arkansas Public Service CommissionAustin Energy Baltimore Gas and Electric Bonneville Power Administration California Energy CommissionCalifornia Public Utilities Commission Servidyne SystemsConnecticut Consumer Counsel Connecticut Department of Environmental Protection Connecticut Department of Public Utility Control District of Columbia Public Service Commission Duke EnergyEntergy Corporation Environmental Defense
Public Advocate State of Maine Puget SoundSacramento Municipal Utility District Santee Cooper Seattle City Light Servidyne SystemsSouthern California Edison Southern Company Tennessee Valley Authority Texas State Energy Conservation Office The Dow Chemical Company Tristate Generation and Transmission Association, Inc. USAA Realty Company Vectren Corporation Vermont Energy Investment Corporation Wal-Mart Stores, Inc. Washington Utilities and Transportation Commission Waverly Light and Power Xcel Energy
The Leadership Group includes 28 electric and gas utilities, 18 state agencies, and 12 other organizations:

Pending Work ProductsNational Action Plan for Energy
Efficiency
Guide on Potential StudiesGuide on Evaluation, Measurement & Verification ProceduresGuide on Integrating Efficiency into Resource Planning and ProcurementRegional Implementation MeetingsCommunication KitBuilding codes fact sheetPaper on Mechanisms for Aligning Utility Incentives

BARRIERS TO MORE EFFICIENCY AND DEMAND
RESPONSE
LOOKING AHEAD

Customer Market Barriers to Energy Efficiency and Demand Response
Energy Efficiency Demand Response
Lack of a price signal (e.g. averaged rates)
X
Metering/Communication system upgrade costs
X
Lack of awareness/information X X
Lack of product availability X
Split incentives/responsibility X O
Access to capital/financing or high investment hurdle rates
X O
Organizational practices X X
x is most important, x medium important, o less important

Institutional/Structural BarriersEnergy Efficiency Demand
Response
Environmental costs not fully internalized in prices X O
Rate designs promote throughputX
Reliability market rules exclude/limit demand-side resources X
Utility financial incentives and ratemaking practices discourage demand-side investments
X O
x is most important, x medium important, o less important

Looking Ahead: Future of Energy Efficiency and Demand Response
Jim Rogers, Edison Electric Institute current chair and CEO of Duke Energy: “Energy Efficiency should be considered a fuel choice – the fifth fuel”
National Action Plan for Energy Efficiency catches renewed interestPublic commitments by ~90 organizations to advance EE activities
Policies to promote Energy Efficiency in Utility SectorPublic Benefit surcharges (16 states) or ratepayer-funding (with EE treated as resource; 14 states)Electric Efficiency Resource Standards (TX, NV, HA, CT) or Goals (CA, RI, VT)Including EE as part of Default Service for residential & small commercial customers (ME)Included as resource option in Forward Capacity Market (ISO-NE)
Integration of Energy Efficiency and Demand Response beginning
Returned and stronger interest in energy efficiency and demand response
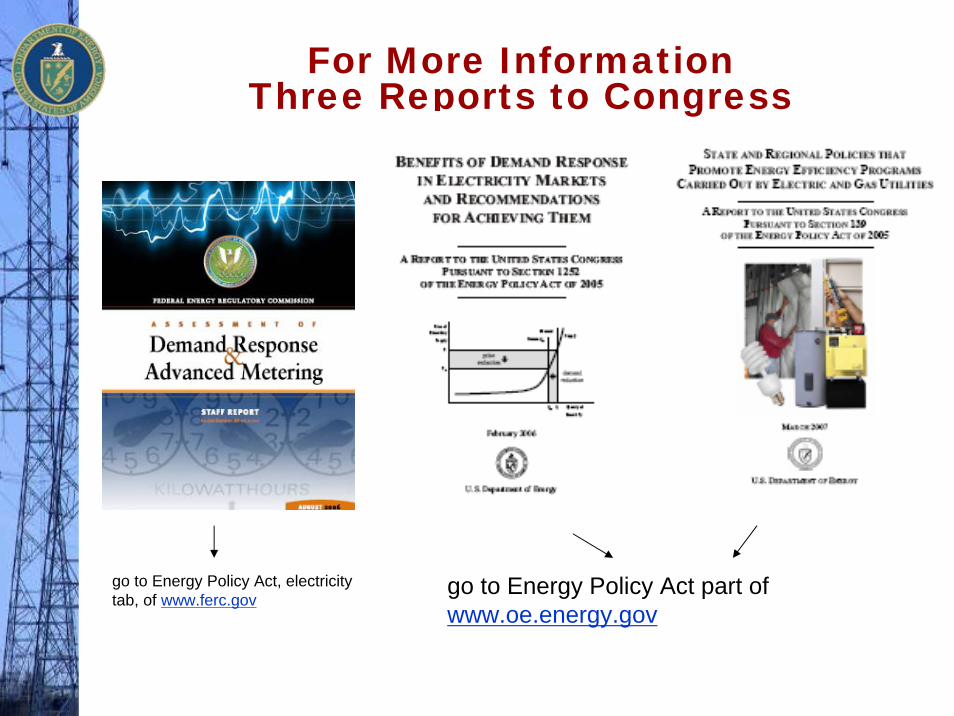
For More InformationThree Reports to Congress
go to Energy Policy Act, electricity tab, of www.ferc.gov
go to Energy Policy Act part of www.oe.energy.gov

For More Information
National Action Plan for Energy Efficiency -www.epa.gov/eeactionplanDemand Response Coordinating Committee -www.demandresponseinfo.orgAmerican Council for and Energy Efficient Economy – www.aceee.orgDOE funded work:
Regulatory Assistance Project – www.raponline.orgLawrence Berkeley National Laboratory –http://eetd.lbl.gov/ea/EMS/emp.html