draft - university of toronto t-space · tillotson, michael; ... draft 1 title: measuring the net...
TRANSCRIPT

Draft
Measuring the net biological impact of fisheries
enhancement: Pink salmon hatcheries can increase yield, but with apparent costs to wild populations
Journal: Canadian Journal of Fisheries and Aquatic Sciences
Manuscript ID cjfas-2016-0334.R1
Manuscript Type: Article
Date Submitted by the Author: 04-Nov-2016
Complete List of Authors: Amoroso, Ricardo; University of Washington, School of Aquatic and Fishery
Sciences Tillotson, Michael; University of Washington, School of Aquatic and Fishery Sciences Hilborn, Ray; University of Washington, School of Aquatic and Fishery Sciences
Keyword: fisheries enhancement, salmon hatcheries, pink salmon, fisheries management, ecosystem-based management
https://mc06.manuscriptcentral.com/cjfas-pubs
Canadian Journal of Fisheries and Aquatic Sciences

Draft
Title: Measuring the net biological impact of fisheries enhancement: Pink salmon hatcheries can 1
increase yield, but with apparent costs to wild populations. 2
Authors: Ricardo O. Amoroso, Michael D. Tillotson, Ray Hilborn 3
Affiliations: School of Aquatic and Fishery Sciences, University of Washington, Seattle, WA 4
98195 5
Corresponding author: Michael D Tillotson, University of Washington, School of Aquatic & 6
Fishery Sciences, Box 355020, Seattle, WA 98195-5020, 206-605-8416, [email protected] 7
Keywords: Fisheries enhancement, salmon hatcheries, pink salmon, fisheries management, 8
ecosystem-based management 9
10
Page 1 of 37
https://mc06.manuscriptcentral.com/cjfas-pubs
Canadian Journal of Fisheries and Aquatic Sciences
Draft
11
Abstract: 12
Hatchery production of juvenile fish for release into the wild has been practiced for well 13
over a century in an effort to increase the number of salmon available to harvest. In this study 14
we evaluate the net impact of the largest such program in North America, the hatchery program 15
for pink salmon in Prince William Sound (PWS) Alaska. At the same time the hatchery program 16
was increasing in output, there was a major change in productivity in the North Pacific so that 17
throughout Alaska pink salmon increased dramatically in abundance between the 1970s and the 18
2000s. Using other regions of Alaska as reference sites, we estimate that the PWS hatchery 19
program has increased the total catch by an average of 17 million fish, of which 8 million have 20
been allocated to pay hatchery operating expenses. We estimate that the maximum sustainable 21
yield (MSY) of wild spawning fish in PWS has increased slightly (28%), while in regions of 22
Alaska without pink salmon hatchery programs the MSY has tripled. Our results support the use 23
of a precautionary approach to future large-scale stock enhancement efforts. 24
25
Introduction 26
Despite increasing global demand for seafood, the production of marine capture fisheries 27
has remained essentially stable over the past three decades (FAO 2014). Although there remains 28
the potential for some increase by improved management (Worm and Branch 2012; Watson et al. 29
2013), the plateau in capture fisheries is generally believed to reflect a fundamental limitation in 30
the capacity of the world’s oceans to generate food (Worm et al. 2009; Chassot et al. 2010; 31
Worm and Branch 2012). Intensive aquaculture appears to offer an opportunity to circumvent 32
this limitation and indeed, the rapid expansion of the industry has allowed continued growth in 33
Page 2 of 37
https://mc06.manuscriptcentral.com/cjfas-pubs
Canadian Journal of Fisheries and Aquatic Sciences

Draft
fish production in recent decades (FAO 2014). However, in many cases intensive culture of 34
marine species is infeasible for technical, economic, or political reasons (Bostock et al. 2010). 35
The enhancement of wild populations through release of hatchery-reared juveniles is an 36
intermediate approach that has been practiced in a variety of marine fish and invertebrate species 37
for over a century (Hilborn 1998; Bell et al. 2006; Lorenzen et al. 2013). Also known as stock 38
enhancement or ocean ranching, this type of aquaculture generally involves the rearing of 39
juveniles in a hatchery past some critical stage before release in to the wild; thereby 40
circumventing high levels of mortality or habitat limitations associated with early life-history 41
stages (Leber et al. 2004). Surviving individuals are then expected to be available for capture 42
after several years of ocean growth. These methods may also be suitable for hastening the 43
recovery from historic overfishing (Molony et al. 2003). As such, there is a great deal of interest 44
in the use of fisheries enhancement to rebuild depleted fisheries and to bolster the productivity of 45
healthy stocks. However, despite a long history of experimentation, successful enhancement of 46
marine species is rare and most efforts remain in a research and development phase (Lorenzen et 47
al. 2013; Trushenski et al. 2014). 48
In contrast to the limited success of marine stock enhancement, large-scale hatchery 49
programs for anadromous salmonids – especially Pacific salmon (Oncorhynchus spp.) – have 50
been operating for decades and today it is estimated that nearly 1 in 4 salmon in the Pacific 51
Ocean are of hatchery origin (Larkin 1974; Ruggerone et al. 2010) overall abundance of Pacific 52
salmon in the ocean has increased greatly (Wertheimer et al. 2005; Ruggerone et al. 2010; 53
Peterman et al. 2012). Despite the long history and massive scale of hatchery salmon production, 54
the efficacy of salmon enhancement programs as a tool for increasing fisheries productivity has 55
rarely been rigorously demonstrated (Larkin 1974; Lorenzen 2005; Naish et al. 2007; McGarvey 56
Page 3 of 37
https://mc06.manuscriptcentral.com/cjfas-pubs
Canadian Journal of Fisheries and Aquatic Sciences

Draft
and Johnston 2011). It has been repeatedly suggested over the past 30 years that in order to 57
improve enhancement efforts it is necessary to specify clear, measureable goals and monitor 58
outcomes relative to these goals (Peterman 1991; Hilborn 1998; Naish et al. 2007; McGarvey 59
and Johnston 2011). Nevertheless, monitoring and evaluation of salmon hatchery programs 60
remains largely insufficient (Naish et al. 2007). To ensure that expected enhancement effects are 61
being achieved, evaluation of hatchery programs must consider all relevant risks and benefits 62
(Hilborn 1998). 63
Much of the difficulty in evaluating salmon hatchery programs results from a lack of 64
suitable controls that would allow for isolation of any enhancement effect. Manipulation of 65
stocking rates provides one avenue for distinguishing environmental and hatchery influences on 66
fisheries production (Buhle et al. 2009), but experimental reductions in hatchery production are 67
typically precluded by legal, political or economic considerations (Naish et al. 2007). 68
Retrospective analyses that attempt to explain trends in abundance using time-series of 69
environmental variables and stocking rates have become more common as data on enhanced 70
populations is increasingly available (Wertheimer et al. 2004; Morita et al. 2006; Scheuerell et 71
al. 2015). Alaska’s pink salmon (Oncorhynchus gorbuscha) enhancement programs provide a 72
unique opportunity to examine the net biological impact of large-scale stock enhancement both 73
because of its scale and the quality of available data. Compared to other salmon producing 74
regions in the Pacific, Alaska’s hatchery programs are relatively young and as a result reliable 75
catch and abundance data exist for both pre- and post-hatchery periods (Olsen 1993). 76
Additionally, since 1995 most hatchery pink salmon have been thermally marked which allows 77
for reliable attribution in the catch (Hilborn and Eggers 2000). Hatchery releases began during 78
the mid-1970s (Olsen 1993) and combined releases from the two largest programs have been 79
Page 4 of 37
https://mc06.manuscriptcentral.com/cjfas-pubs
Canadian Journal of Fisheries and Aquatic Sciences
Draft
stable around 750 million since about 1990 (Brenner et al. 2012). These programs constitute 80
around 10% of the total number of salmon juveniles released to the North Pacific and more than 81
half the total pink salmon (NPAFC 2016, Figure 1, Table 1). 82
Four regions account for the majority of the pink salmon catch in Alaska. Prior to 83
hatchery supplementation pink salmon were most abundant in Southeast Alaska (SEAK;~20 84
million annual run) followed by Kodiak (KOD; ~10 million), Prince William Sound (PWS; ~7 85
million) and the south Alaska Peninsula (SPEN; ~ 3 million). Enhancement occurs in three of the 86
regions, though the scale of operations varies by orders of magnitude. PWS pink salmon is 87
currently the largest hatchery program in the world by annual number of releases (NPAFC 88
2016). Since 1990 on average 77 (SD = 48) hatchery fry have been released for each returning 89
wild adult fish in PWS, while in KOD this ratio is about 8:1 (SD = 3.6) and in SEAK close to 1:1 90
(SD = 0.5). Unlike many other regions where hatcheries are intended to mitigate declines in 91
salmon populations resulting from habitat degradation, Alaska’s hatcheries are designed to 92
produce harvestable fish to supplement relatively healthy wild populations (Naish et al. 93
2007).Since the inception of the hatchery programs pink salmon catches have increased 94
dramatically; especially in PWS where hatchery returns now average over 35 million fish and 95
peaked at 76 million in 2013. The majority of these fish are harvested in common-property 96
commercial fisheries, though hatchery operators also harvest on average 30% of returning fish to 97
cover production costs (Botz et al. 2013). Despite the ostensible success of enhancement, 98
uncertainties regarding impacts of hatchery-origin fish on wild salmon and other species 99
continue to cause concern among many stakeholders (Pearson et al. 2012; Brenner et al. 2012; 100
Jasper et al. 2013). Since 2012 these concerns have contributed to delays in the recertification of 101
Alaska Salmon by the Marine Stewardship Council, resulted in a “Category C” grade for PWS 102
Page 5 of 37
https://mc06.manuscriptcentral.com/cjfas-pubs
Canadian Journal of Fisheries and Aquatic Sciences
Draft
salmon from the Fisheries Sustainability Partnership and motivated an intensive research 103
program by the Alaska Department of Fish and Game. 104
Recent analysis of hatchery programs from around the Pacific have found limited 105
evidence of a large enhancement effect and in many cases identified concerns about negative 106
impacts on wild populations. For example, Morita, Morita and Fukuwaka (Morita et al. 2006) 107
modeled pink salmon catch in relation to hatchery output and climate factors and found that 108
intensive stocking contributed little to a dramatic increase in abundance after 1990. Ohnuki et al. 109
(Ohnuki et al. 2015) used tagging data to confirm the minor contribution hatchery origin fish to 110
commercial pink salmon catches in Japan, and suggest that the costs of hatchery production 111
likely outweigh the benefits. Kaev (2012) examined the population dynamics of chum and pink 112
salmon in the Sakhalin – Kuril region of Russia and found evidence of an enhancement effect in 113
hatchery supplemented chum populations, but not pink. Sahashi et al. (Sahashi et al. 2015) found 114
that hatchery stocking of Masu salmon in the Shari River tended to displace rather than 115
supplement natural production. Similarly, Scheuerell et al. (2015) compared supplemented and 116
natural populations of Snake River chinook salmon and identified only minor increases (~3% on 117
average) in adult density attributable to enhancement efforts. Buhle et al. (Buhle et al. 2009) 118
identified negative impacts of hatchery coho on wild Oregon coast populations and documented 119
increased wild productivity following large reductions in hatchery supplementation. Finally, 120
Zhivotovsky et al. (2012) used genetic and demographic analyses to show that rapid expansion 121
of a chum hatchery program on Iturup Island let to the extirpation of a distinct beach-spawning 122
ecotype by abundant hatchery strays. 123
Given the limited success demonstrated by these recent hatchery studies, it is not 124
surprising that the net biological impact of the Alaska’s pink salmon hatchery programs have 125
Page 6 of 37
https://mc06.manuscriptcentral.com/cjfas-pubs
Canadian Journal of Fisheries and Aquatic Sciences
Draft
been a matter of considerable debate. Consistent with reports of limited benefits of hatchery 126
programs, several previous studies have concluded that improved ocean survival associated with 127
a large-scale shift in marine environmental conditions would have led to increased pink salmon 128
catch even in the absence of hatchery production (Eggers et al. 1991; Tarbox and Bendock 1996; 129
Hilborn and Eggers 2000, 2001). Others have argued that hatchery production is primarily 130
responsible for increasing catches and conclude that the enhancement program is highly 131
successful (Smoker and Linley 1997; Wertheimer and Smoker 2001; Heard 2003; Wertheimer et 132
al. 2004). Hilborn and Eggers (2001) describe these two hypotheses as augmentation and 133
replacement. Under the augmentation hypothesis, hatchery production adds additional 134
productivity to the fishery without impacting existing wild stocks. Alternatively, the replacement 135
hypothesis asserts that hatchery production reduces wild stock productivity, and thus hatchery 136
fish effectively replace wild fish in the catch. In practice these hypotheses define the ends of a 137
gradient; under complete replacement the net value of one hatchery fish approaches zero, while 138
under complete augmentation each hatchery fish could be considered equal to one additional 139
wild fish. 140
To make predictions about the trajectory of the PWS pink salmon fishery in the absence 141
of the hatchery program we rely on two key patterns of productivity in salmon populations. First, 142
oscillation between North Pacific climate regimes has been shown to predictably influence 143
salmon abundance (Hare et al. 1999; Beamish et al. 1999, 2004). Second, covariation in the 144
productivity of salmon stocks has been shown to be highest in geographically proximate 145
populations (Pyper et al. 2001; Wertheimer and Smoker 2001), and indeed Alaskan salmon 146
populations have shown strong spatial coherence in decadal-scale patterns of productivity (Hare 147
et al. 1999). Thus, in order to establish an empirical estimate of net biological benefit we 148
Page 7 of 37
https://mc06.manuscriptcentral.com/cjfas-pubs
Canadian Journal of Fisheries and Aquatic Sciences

Draft
examine over 50 years of catch and abundance data from four pink salmon producing regions in 149
Alaska (Figure 2) to predict catch and wild stock productivity in the absence of enhancement 150
efforts. The present study builds on previous reviews of Alaska’s pink salmon hatcheries 151
including Eggers et al. (1991), Hilborn and Eggers (2000) and Wertheimer et al. (2001), and 152
benefits from over 15 recent years of data; a period of consistently intense hatchery stocking 153
(Figure 1). With this extended data-set we are also able to compare spawner-recruit relationships 154
for wild pink salmon populations before and after the implementation of hatchery programs. In 155
addition, we consider the impact of hatchery production on interannual variability in pink salmon 156
abundance. 157
Methods 158
The data set 159
Data on wild escapement, total catch and hatchery fry releases, wild catch and cost 160
recovery catch were obtained from Annual Management and Fisheries Enhancement reports 161
published by ADF&G (e.g. Botz et al. 2013). We followed the conventions described in Hilborn 162
and Eggers (2000) for classifying hatchery and wild fish in the catch and escapement In short, 163
for stock identification purposes hatchery salmon in PWS have been monitored with tagging 164
programs since 1987 and with 100% thermal otolith marking since 1996. In the Kodiak (KOD) 165
region hatchery pink salmon return to and are harvested in several bays with little natural 166
production, and are therefore distinguished from wild fish based on reported harvest location. In 167
Southeast Alaska (SEAK) the vast majority of hatchery pink salmon are harvested for cost 168
recovery in terminal areas and are therefore distinguished by harvest location. No hatchery 169
production occurs in the South Peninsula (SPEN) region. Thermal otolith marking and intensive 170
catch sampling provide reliable estimates of hatchery contribution to harvest, but despite 171
Page 8 of 37
https://mc06.manuscriptcentral.com/cjfas-pubs
Canadian Journal of Fisheries and Aquatic Sciences
Draft
widespread marking of hatchery pink salmon there is no systematic effort to evaluate the 172
proportion of wild stock escapement made up by hatchery strays (Brenner et al. 2012). As such, 173
we assume all naturally spawning fish to be wild, though straying is likely common. In total we 174
analyzed data on catch and escapement beginning with calendar year 1960, and ending with the 175
wild return in 2013 and, given the two year life-cycle of pink salmon, were thus able to construct 176
spawner-recruit data for brood years 1960 to 2011. 177
For the purposes of our analyses we identified three distinct periods in the abundance and 178
catch data, and compared four adjacent areas of Alaska with significant pink salmon production. 179
Brood years 1960-1976 represent pre-regime shift natural productivity1977-1987 is a period of 180
transition when the productivity of wild stocks throughout Alaska had increased, but hatchery 181
production was not yet at its current capacity, and 1988-2011 when catch was generally higher 182
in all areas and total hatchery releases were relatively stable at around 750 million (Figure 3). 183
Rapid change in the climate, ecology and fisheries productivity of the North Pacific occurred in 184
1977 (Mantua et al. 1997; Hare et al. 1999), and we used this well documented phenomenon to 185
define the first period assuming that the 1977 brood year would be the first pink salmon to be 186
fully impacted by changes in marine conditions. These fish returned two years later and for the 187
catch analysis the break between periods therefore occurs between 1978 and 1979. 188
Magnitude and drivers of increased catch 189
Because releases of hatchery pink salmon began in PWS at the same time as a significant 190
shift in natural salmon productivity in Alaska it is difficult to separate the influence of these two 191
factors on the observed increase in catch that has occurred since the late 1970s. Although there is 192
no perfect control for the influence of hatcheries, the spatial coherence of Alaskan salmon 193
productivity trends on a decadal scale allows nearby pink salmon producing regions to serve as 194
Page 9 of 37
https://mc06.manuscriptcentral.com/cjfas-pubs
Canadian Journal of Fisheries and Aquatic Sciences

Draft
pseudo-controls (Hilborn and Eggers 2000). Thus, to assess the relative contribution of the 195
environment and fry release on the temporal changes observed in catches we fit two models to 196
catch data for the four harvest areas; one that included hatchery releases as a predictor variable 197
and one that did not: 198
log�����ℎ,� = �� + ��� + ��� + � Model (1) 199
log�����ℎ,� = �� + ��� + ��� + ���,� + � Model (2) 200
201
where S is a fixed area effect, P a fixed period effect (before and after the regime shift), H is the 202
number of fry released in area S in the year t, pi are estimated coefficients, and epsilon is a 203
normally distributed random error term. The Akaike information criterion (AIC) was computed 204
for each model and used to compare their relative support. The difference between observed 205
average catch and average catch predicted by Model 1 in the post-regime shift period can be 206
interpreted as the contribution of hatchery production to catch after accounting for the shift in 207
natural productivity. Subtracting average cost-recovery catch from this value gives the net 208
contribution of hatchery production to the common-property fisheries. 209
Hatchery impacts on wild stock productivity 210
In order to evaluate the impact of hatchery production to wild-stock productivity for the 211
four management areas during two periods; the pre regime shift period (1960-1976) and the 212
most recent period (1988-2011) we fit the Ricker spawner-recruit curve by period and area. 213
214
R = ������
where R is the number of returns (catch plus escapement) produced by spawners, S, in a brood 215
year, α and β are the estimated Ricker growth rate and density-dependence parameters, and 216
Page 10 of 37
https://mc06.manuscriptcentral.com/cjfas-pubs
Canadian Journal of Fisheries and Aquatic Sciences

Draft
epsilon is a normally distributed random error term. For each area we assessed eight hypotheses 217
that could account for changes in wild productivity between periods: a null hypothesis of no 218
change (α and β and ! remain equal), and all possible combinations of changes in growth rate, 219
density dependence and error variance between periods. We calculated the AIC, and AIC 220
weights for each model. AIC Model averaging (Burnham and Anderson 2002) was used to 221
calculate the magnitude of change and standard deviation of the parameters across models. 222
The estimated parameters were used to compute the biological reference points 223
maximum sustainable yield (MSY), biomass producing MSY (BMSY), and the optimal harvest 224
rate for achieving MSY (Hilborn 1985): 225
"#�$ = (0.5 − 0.07+)-
#�$ = "#�$��(��./0/�) − "#�$
226
Hatchery influence on variability of catch 227
Two indicators of catch variability were computed for each area and time period: the 228
variance and the coefficient of variation (CV = σ2/µ). Variance tends to increase with increasing 229
mean which can confound a comparison of variances. The CV is a normalized measure of 230
variability that accounts for differences in mean, and therefore removes the influence of 231
differences in means between time periods. After testing for normality (Shapiro test) an F-test 232
was conducted to test the hypothesis that the variances observed in each area during the first 233
(1960-1976) and last (1988-2011) periods were different. The modified Bennet’s test was used 234
to test the hypothesis that all the coefficients of variation (one for each combination of period 235
and area) belong to the same population of CVs. 236
237
Page 11 of 37
https://mc06.manuscriptcentral.com/cjfas-pubs
Canadian Journal of Fisheries and Aquatic Sciences
Draft
Results 238
Magnitude and drivers of increased catch 239
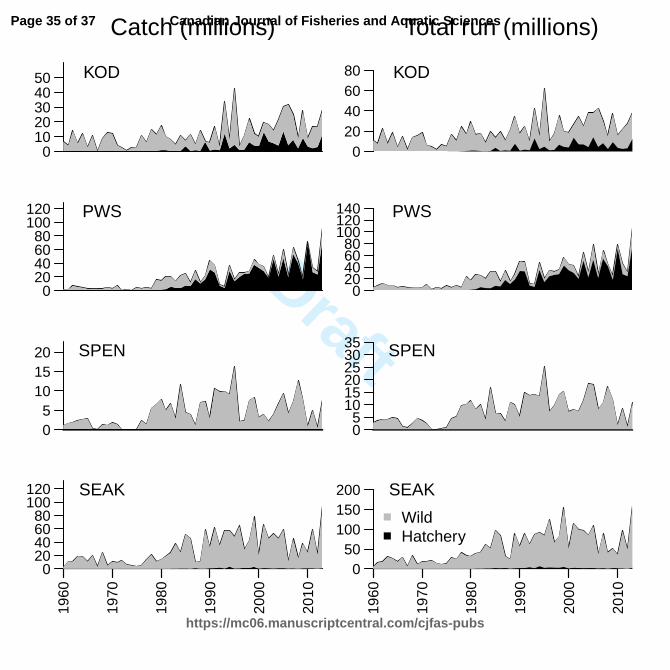
In all management areas examined pink salmon catch increased following a regime shift 240
in the late 1970s (Figure 3; Table 2). However, in PWS catch increased nearly tenfold between 241
the low productivity, pre-hatchery period (period 1) and the high productivity, full hatchery 242
production period (period 3). Meanwhile, in all other management areas (KOD, SEAK and 243
SPEN) catch increased approximately threefold. The disproportionate increase in catch observed 244
in PWS compared to the other areas suggests a significant contribution by the PWS hatchery 245
program, even after accounting for potentially increased wild stock productivity following the 246
shift to improved environmental conditions. We compared a model that explains changes in 247
catch as only affected by the productivity change from period 1 to 3 (Model 1) and a model that 248
also uses hatchery releases as a covariate (Model 2). Including hatchery releases as a covariate 249
improves model performance significantly compared with an environment/area only model 250
(model 1 AIC=553; model 2 AIC= 540; Figure 4). In particular, for PWS the model that ignores 251
hatchery releases failed to explain the large catches observed after 1990 (period 3); the model 252
using only regime changes predicts a mean catch of 19 million fish (Figure 4), while the average 253
observed catch for that period was 36 million, a difference of 17 million. Since 1990 an average 254
of 8 million fish per year have been harvested by the hatcheries to pay their operating expenses, 255
suggesting that the hatcheries in PWS had an average net contribution to the commercial fleet of 256
9 million fish. Meanwhile, there is very little difference between predicted catch in the absence 257
hatcheries and observed catch for KOD and SEAK which suggests a negligible effect of 258
enhancement in these areas. 259
Page 12 of 37
https://mc06.manuscriptcentral.com/cjfas-pubs
Canadian Journal of Fisheries and Aquatic Sciences
Draft
Hatchery impacts on wild stock productivity 260
The estimated parameters of the Ricker stock-recruitment function α and β represent 261
intrinsic population growth rate and carrying capacity, respectively. Thus, changes in either 262
value reflect altered productivity for salmon stocks. Following from the notion of spatial 263
coherence in trends of salmon productivity (Beamish et al. 1999; Finney et al. 2002) it is 264
reasonable to assume that, in the absence of region specific factors, the productivity of wild pink 265
salmon stocks would show similar trends in productivity. However, following the climate regime 266
shift in the late 1970s the period specific stock-recruit relationships appear to show a 267
commensurate shift in productivity in the SEAK and SPEN management areas, but not in KOD 268
or PWS (Figure 5, Table 4). The two regions without major hatchery programs experienced 269
increases in maximum sustainable yield of nearly 200% while in KOD and PWS no significant 270
change in productivity parameters or MSY was detected (Table 3). 271
In SEAK and SPEN a large increase in the β parameter of the Ricker model best explains 272
the differences between periods. Although several candidate models have similar weights (Table 273
4), when averaged across models the general pattern still holds; large increases in MSY are 274
observed in SEA and SPEN, while little or no increase in productivity is observed in PWS and 275
KOD. That these regions could have experienced similar productivity increases in the absence of 276
hatcheries seems plausible given that during the early 1980s, a period in which environmental 277
conditions had improved, but hatchery production averaged less than 20% of its current level, the 278
average return of wild pink salmon to PWS was 22.3 million fish and wild catch averaged over 279
15 million. Since 1988 when hatchery releases stabilized around 600 million fish the average 280
wild return and catch have been 10.7 and 5.4 million fish respectively; less than 50% of the pre-281
hatchery peak for returns and 35% for catch. 282
Page 13 of 37
https://mc06.manuscriptcentral.com/cjfas-pubs
Canadian Journal of Fisheries and Aquatic Sciences
Draft
283
Hatchery influence on variability of catch 284
The four areas showed a similar general pattern in the temporal evolution of catch 285
variability; as the mean catches increased the variability tended to be larger. However, the 286
increase in variability appeared to be sharper in PWS and KOD after 1990 (Figure 3). Statistical 287
tests comparing the variance between periods 1 and 3 showed a significant increase in all 288
management areas (Table 2). Although the absolute variability increased between periods, the 289
coefficient of variation decreased from period 1 to period 3 (note that in SEAK the reduction was 290
markedly larger). Despite this apparent trend, the Bennet’s test failed to reject the hypothesis that 291
all the coefficients of variation were equal (value=5.42; p=0.12; df=7). These findings suggest 292
that hatchery production has not had a stabilizing effect on pink salmon catch over time. 293
Discussion 294
Enhancement of pink salmon in Alaska – particularly in the PWS management area – has 295
succeeded in producing a significant and sustained enhancement effect and contributed to an 296
order of magnitude increase in catch since the 1960s. At the same time, local wild populations 297
have remained ‘sustainable’ insofar as their abundances remain stable and they appear at no 298
immediate risk of collapse. While increased variability in catch resulting from high abundances 299
may be problematic from a fisheries and processing perspective, overall the hatchery program 300
appears to provide a net contribution to harvest. However, our results also demonstrate that if 301
reduced wild productivity and the costs of hatchery production are not accounted for, the benefits 302
of enhancement may be considerably overestimated. The magnitude of increased catch in PWS 303
has been at least twice as great as nearby areas, implying a large contribution from hatchery 304
production, but comparisons with adjacent regions also suggest that favorable ocean conditions 305
Page 14 of 37
https://mc06.manuscriptcentral.com/cjfas-pubs
Canadian Journal of Fisheries and Aquatic Sciences

Draft
would have resulted in an increasing abundance trend even in the absence of an enhancement 306
program. Therefore, in the case of PWS, although the average catch of hatchery fish since 1990 307
has been 30 million, our best estimate of the net enhancement effect to the commercial fishery (9 308
million) is less than one third of the apparent contribution when impacts on wild production and 309
cost-recovery are ignored. In regions with smaller hatchery programs – KOD and SEAK – our 310
models suggest a negligible contribution of hatcheries to increased catches. Thus, overall our 311
results are consistent with previous studies that find enhancement effects of salmon hatcheries to 312
be relatively minor (Morita et al. 2006; Scheuerell et al. 2015) and context dependent (Kaev 313
2012). 314
The utilization of adjacent management areas as pseudo-replicates leaves the possibility 315
that some local phenomenon has caused the atypical trajectory of wild pink salmon productivity 316
in PWS and KOD. At a larger spatial scale wild pink salmon populations from throughout the 317
species range have increased in abundance by an average of 90% since the 1976/1977 ocean 318
regime shift; further suggesting some unique factor at play in PWS and KOD (Morita et al. 2006; 319
Ruggerone et al. 2010). A continued upward trend in hatchery returns despite relatively steady 320
release levels since 1990 demonstrate that local marine conditions are not limiting productivity 321
in hatchery pink salmon. Some persistent change in the productivity of the freshwater life-history 322
phase would therefore be required to explain constant productivity despite improved marine 323
conditions. Wertheimer and Smoker (Wertheimer and Smoker 2001) posited that the 1989 324
Exxon Valdez oil spill could account for the divergent pattern of abundance in PWS wild pink 325
salmon. However, recent estimates of the impact of the spill on PWS pink salmon are modest 326
and the populations have been considered fully recovered from spill impacts since 2002 (Quinn 327
et al. 2002; Brannon et al. 2012; EVOSTC 2014). 328
Page 15 of 37
https://mc06.manuscriptcentral.com/cjfas-pubs
Canadian Journal of Fisheries and Aquatic Sciences

Draft
Based on our analysis of wild pink salmon productivity in Alaska we conclude that the 329
release of hatchery pink salmon has likely reduced productivity of the wild populations that 330
interact significantly with hatchery salmon. While wild stocks in the SPEN and SEAK regions 331
experienced dramatic increases in MSY (~200%) – apparently as a result of increased carrying 332
capacity (Figure 5) – no such increases were observed in PWS or KOD. This pattern suggests 333
that natural carrying capacity may have also increased in PWS and KOD, but is utilized by 334
hatchery fish and thus no change is apparent for the wild stocks; essentially the pattern predicted 335
by the replacement hypothesis (Hilborn and Eggers 2001). Our analyses do not however 336
implicate any particular mechanism for negative impacts of hatchery-wild interaction. 337
Understanding the mechanism or mechanisms by which hatchery production reduces wild stock 338
productivity is critical for quantifying the long-term risk to wild stocks and identifying 339
appropriate management responses. If reduced productivity is primarily a result of ecological 340
interactions that reduce wild pink salmon survival or spawning success, then wild stocks would 341
presumably recover quickly in response to reduced hatchery releases. Although salmon are well 342
known for their ability to reliably return to their natal streams, some proportion of a population 343
will enter and spawn in other streams; a phenomenon known as straying (Westley et al. 2013). 344
Hatchery salmon commonly stray and often interbreed with wild conspecifics, but generally 345
produce fewer successful offspring than their wild counterparts (Naish et al. 2007; Christie et al. 346
2014). The long-term effects of regular hatchery introgression are uncertain, but in any case 347
genetic impacts on productivity would be expected persist for multiple generations (Grant 2011; 348
Baskett and Waples 2013; Harbicht et al. 2014). 349
Previous studies have identified the potential for both ecological and genetic interaction 350
between hatchery and wild pink salmon in Alaska. As noted previously, despite widespread 351
Page 16 of 37
https://mc06.manuscriptcentral.com/cjfas-pubs
Canadian Journal of Fisheries and Aquatic Sciences

Draft
marking of hatchery pink salmon in Alaska there is no systematic effort to quantify rates of 352
straying by hatchery fish. However, recent studies have provided evidence that straying rates by 353
PWS hatchery pink salmon may be significant. Brenner et al. (2012) found that in some PWS 354
streams up to 98% of fish on spawning grounds were of hatchery origin. The degree to which 355
these fish successfully breed with wild individuals is unknown, but recent genetic analyses have 356
found significant hatchery introgression in PWS and SEAK wild chum salmon (Jasper et al. 357
2013). Notwithstanding breeding success, high rates of straying reduce the validity of 358
escapement estimates and can therefore diminish the effectiveness of wild stock management. 359
High straying rates indicate significant potential for ecological or genetic interaction 360
between hatchery and wild fish, and also confound efforts to estimate wild escapement. With 361
hundreds of millions of hatchery releases occurring in PWS, even low absolute straying rates can 362
result in high proportions of hatchery fish on some wild spawning grounds. Further research on 363
the prevalence of straying, and the genetic contribution of hatchery strays to the wild gene pool 364
should be a priority. Though high stray rates implicate reproductive interaction as a likely 365
mechanism for hatchery impacts, interactions at other life-history stages should not be ignored. 366
The period immediately following ocean entry is thought to be very important to lifetime 367
survival of anadromous salmon, and localized resource depletion by large numbers of hatchery 368
fry may potentially impact growth and survival of wild fish (Cross et al. 2008). Increased 369
abundance is also thought to be driving a downward trend in adult body size in PWS hatchery 370
and wild pink salmon which suggests competition during ocean rearing and homeward migration 371
(Wertheimer et al. 2005). Taken together, these various interactions between hatchery and wild 372
pink salmon demonstrate that a variety of plausible mechanisms exist for hatchery program 373
impacts on wild productivity. It seems feasible that with improved understanding of these 374
Page 17 of 37
https://mc06.manuscriptcentral.com/cjfas-pubs
Canadian Journal of Fisheries and Aquatic Sciences

Draft
mechanisms an effective accounting of the benefits and risks hatchery operations for Alaska 375
salmon enhancement could be accomplished. However, because pink salmon migrate long 376
distances and potentially interact with many other salmon populations and species the net 377
benefits of enhancement will ultimately be sensitive to the geographic scope of analysis. 378
There is accumulating evidence that pink salmon have far reaching impacts on ocean 379
ecosystems. Patterns of alternating abundance in species that share ocean habitat with pink 380
salmon strongly suggest impacts of competition (Ruggerone and Nielsen 2004). Such patterns 381
have been observed in other salmon species including comparatively valuable Bristol Bay 382
sockeye salmon (Ruggerone et al. 2003) and threatened Puget Sound Chinook salmon 383
populations (Ruggerone and Goetz 2004). Recent analysis of long-term data on seabird 384
populations in the North Pacific demonstrated similar patterns in reproductive success implying 385
that pink salmon also compete directly or indirectly with higher trophic levels (Springer and van 386
Vliet 2014). There is also growing concern that large hatchery releases from around the North 387
Pacific may be resulting in density dependent declines in growth and survival for all salmon 388
species as oceanic carrying capacity is approached (Cooney and Brodeur 1998; Kaeriyama et al. 389
2009). When considered in this broader ecosystem context the analysis of stock enhancement 390
becomes much more complex. With an increasing focus ecosystem-based management of the 391
oceans the broader impacts of future enhancement efforts are likely to be heavily scrutinized 392
(Pikitch et al. 2004; Samhouri et al. 2014). Ultimately, if these efforts are to be compatible with 393
ecosystem-based principles it will be critical to understand the biological capacity for 394
enhancement and the potential unintended consequences of large-scale hatchery releases. 395
396
Literature Cited 397
Page 18 of 37
https://mc06.manuscriptcentral.com/cjfas-pubs
Canadian Journal of Fisheries and Aquatic Sciences

Draft
Baskett, M.L., and Waples, R.S. 2013. Evaluating alternative strategies for minimizing 398
unintended fitness consequences of cultured individuals on wild populations. Conserv. Biol. 399
27(1): 83–94. doi:10.1111/j.1523-1739.2012.01949.x. 400
Beamish, R., Noakes, D.L., McFarlane, G., Klyashtorin, L., Ivanov, V., and Kurashov, V. 1999. 401
The regime concept and natural trends in the production of Pacific salmon. Can. J. Fish. 402
Aquat. Sci. 56(3): 516–526. doi:10.1139/f98-200. 403
Beamish, R., Schnute, J., Cass, A., Neville, C., and Sweeting, R. 2004. The influence of climate 404
on the stock and recruitment of pink and sockeye salmon from the Fraser River, British 405
Columbia, Canada. Trans. Am. Fish. Soc. 133(6): 1396–1412. 406
Bell, J.D., Bartley, D.M., Lorenzen, K., and Loneragan, N.R. 2006. Restocking and stock 407
enhancement of coastal fisheries: Potential, problems and progress. Fish. Res. 80(1): 1–8. 408
doi:10.1016/j.fishres.2006.03.008. 409
Bostock, J., McAndrew, B., Richards, R., Jauncey, K., Telfer, T., Lorenzen, K., Little, D., Ross, 410
L., Handisyde, N., Gatward, I., and Corner, R. 2010. Aquaculture: global status and trends. 411
Philos. Trans. R. Soc. Lond. B. Biol. Sci. 365(1554): 2897–2912. 412
doi:10.1098/rstb.2010.0170. 413
Botz, J., Sheridan, T., Wiese, A., Scannell, H., Brenner, R.E., and Moffitt, S.D. 2013. 2011 414
Prince William Sound Area Finfish Management Report - Fishery Management Report No . 415
13-11. Alaska Department of Fish and Game - Division of Commercial Fisheries, Juneau. 416
Brannon, E.L., Collins, K., Cronin, M.A., Moulton, L.L., Maki, A.L., and Parker, K.R. 2012. Oil 417
spill effects on pink salmon in Prince William Sound, Alaska. Rev. Fish. Sci. 20(1): 20–60. 418
doi:10.1080/10641262.2011.643697. 419
Brenner, R.E., Moffitt, S.D., and Grant, W.S. 2012. Straying of hatchery salmon in Prince 420
Page 19 of 37
https://mc06.manuscriptcentral.com/cjfas-pubs
Canadian Journal of Fisheries and Aquatic Sciences
Draft
William Sound, Alaska. Environ. Biol. Fishes 94(1): 179–195. doi:10.1007/s10641-012-421
9975-7. 422
Buhle, E.R., Holsman, K.K., Scheuerell, M.D., and Albaugh, A. 2009. Using an unplanned 423
experiment to evaluate the effects of hatcheries and environmental variation on threatened 424
populations of wild salmon. Biol. Conserv. 142(11): 2449–2455. Elsevier Ltd. 425
doi:10.1016/j.biocon.2009.05.013. 426
Burnham, K.K.P., and Anderson, D.R.D.R. 2002. Model Selection and Multi-Model Inference : 427
A Practical Information-Theoretic Approach . In Ecological Modelling, 2nd edition. 428
Springer, Secaucus, NJ. doi:10.1016/j.ecolmodel.2003.11.004. 429
Chassot, E., Bonhommeau, S., Dulvy, N.K., Mélin, F., Watson, R., Gascuel, D., and Le Pape, O. 430
2010. Global marine primary production constrains fisheries catches. Ecol. Lett. 13: 495–431
505. doi:10.1111/j.1461-0248.2010.01443.x. 432
Christie, M.R., Ford, M.J., and Blouin, M.S. 2014. On the reproductive success of early-433
generation hatchery fish in the wild. Evol. Appl.: n/a-n/a. doi:10.1111/eva.12183. 434
Cooney, R.T., and Brodeur, R.D. 1998. Carrying capacity and north pacific salmon production: 435
stock enhancement implications. Bull. Mar. Sci. 62(2): 443–464. 436
Cross, A.D., Beauchamp, D.A., Myers, K.W., and Moss, J.H. 2008. Early marine growth of pink 437
salmon in Prince William Sound and the coastal Gulf of Alaska during years of low and 438
high survival. Trans. Am. Fish. Soc. 137(3): 927–939. doi:10.1577/T07-015.1. 439
Eggers, D.M., Peltz, L., B.G.Bue, and Willette, T. 1991. Trends in abundance of hatchery and 440
wild stocks of pink salmon in Cook Inlet, Prince William Sound, and Kodiak, Alaska. 441
Alaska Department of Fish and Game, Division of Commercial Fisheries, Juneau. 442
EVOSTC. 2014. Exxon Valdez Oil Spill Restoration Plan, 2014 Update: Injured Resources and 443
Page 20 of 37
https://mc06.manuscriptcentral.com/cjfas-pubs
Canadian Journal of Fisheries and Aquatic Sciences
Draft
Services. Exxon Valdez Oil Spill Trustee Council, Anchorage. 444
FAO. 2014. The State of World Fisheries and Aquaculture 2014. 445
Finney, B., Gregory-Eaves, I., Douglas, M.S., and Smol, J.P. 2002. Fisheries productivity in the 446
northeastern Pacific Ocean over the past 2,200 years. Nature 416: 729–33. 447
doi:10.1038/416729a. 448
Grant, W.S. 2011. Understanding the adaptive consequences of hatchery-wild interactions in 449
Alaska salmon. Environ. Biol. Fishes 94(1): 325–342. doi:10.1007/s10641-011-9929-5. 450
Harbicht, A., Wilson, C.C., and Fraser, D.J. 2014. Does human-induced hybridization have long-451
term genetic effects? Empirical testing with domesticated, wild and hybridized fish 452
populations. Evol. Appl. 7(10): 1180–1191. doi:10.1111/eva.12199. 453
Hare, S.R., Mantua, N.J., and Francis, R. 1999. Inverse production regimes: Alaska and west 454
coast Pacific salmon. Fisheries 24(1): 6–14. doi:10.1577/1548-455
8446(1999)024<0006:IPR>2.0.CO;2. 456
Heard, W.R. 2003. Alaska salmon enhancement: A successful program for hatchery and wild 457
stocks. In Proceedingss of the Thirtieth U.S. - Japan Meeting on Aquaculture. UJNR 458
Technical Report No. 30. Edited by Y.. Nakamura, J.. McVey, K. Leber, C. Neidig, S. Fox, 459
and K. Churchill. Sarasota, FL. pp. 149–169. 460
Hilborn, R. 1985. Simplified calculation of optimum spawning stock size from Ricker’s stock 461
recruitment curve. Can. J. Fish. Aquat. Sci. 42(11): 1833–1834. 462
Hilborn, R. 1998. The economic performance of marine stock enhancement projects. Bull. Mar. 463
Sci. 62(2): 661–674. 464
Hilborn, R., and Eggers, D.M. 2000. A review of the hatchery programs for pink salmon in 465
Prince William Sound and Kodiak Island, Alaska. Trans. Am. Fish. Soc. 129: 333–350. 466
Page 21 of 37
https://mc06.manuscriptcentral.com/cjfas-pubs
Canadian Journal of Fisheries and Aquatic Sciences
Draft
Hilborn, R., and Eggers, D.M. 2001. A review of the hatchery programs for pink salmon in 467
Prince William Sound and Kodiak Island , Alaska : Response to comment. Trans. Am. Fish. 468
Soc. 130(4): 720–724. 469
Jasper, J.R., Habicht, C., Moffitt, S., Brenner, R., Marsh, J., Lewis, B., Fox, E.C., Grauvogel, Z., 470
Olive, S.D.R., and Grant, W.S. 2013. Source-sink estimates of genetic introgression show 471
influence of hatchery strays on wild chum salmon populations in Prince William Sound, 472
Alaska. PLoS One 8(12). doi:10.1371/journal.pone.0081916. 473
Kaeriyama, M., Seo, H., and Kudo, H. 2009. Trends in run size and carrying capacity of Pacific 474
salmon in the North Pacific Ocean. N. Pac. Anad. Fish. Comm. Bull. 5: 293–302. 475
Kaev, A.M. 2012. Wild and hatchery reproduction of pink and chum salmon and their catches in 476
the Sakhalin-Kuril region, Russia. Environ. Biol. Fishes 94(1): 207–218. 477
doi:10.1007/s10641-011-9900-5. 478
Larkin, P.A. 1974. Play it again Sam — an essay on salmon enhancement. J. Fish. Res. Board 479
Canada 31: 1433–1456. doi:10.1139/f74-174. 480
Leber, K., Kitada, S., Blankenship, H.L., and Svasand, T. (Editors). 2004. Stock enhancement 481
and sea ranching: developments, pitfalls and opportunities. In 2nd edition. Blackwell 482
Publishing, Oxford. 483
Lorenzen, K. 2005. Population dynamics and potential of fisheries stock enhancement: practical 484
theory for assessment and policy analysis. Philos. Trans. R. Soc. Lond. B. Biol. Sci. 360: 485
171–89. doi:10.1098/rstb.2004.1570. 486
Lorenzen, K., Agnalt, A.-L., Blankenship, H.L., Hines, A.H., Leber, K.M., Loneragan, N.R., and 487
Taylor, M.D. 2013. Evolving context and maturing science: Aquaculture-based 488
enhancement and restoration enter the marine fisheries management toolbox. Rev. Fish. Sci. 489
Page 22 of 37
https://mc06.manuscriptcentral.com/cjfas-pubs
Canadian Journal of Fisheries and Aquatic Sciences
Draft
21(3–4): 213–221. doi:10.1080/10641262.2013.837358. 490
Mantua, N.J., Hare, S.R., Zhang, Y., Wallace, J.M., and Francis, R. 1997. A Pacific interdecadal 491
climate oscillation with impacts on salmon production. Bull. Am. Meteorol. Soc. 78: 1069–492
1079. doi:10.1175/1520-0477(1997)078<1069:APICOW>2.0.CO;2. 493
McGarvey, D.J., and Johnston, J.M. 2011. Hatcheries, conservation, and sustainable fisheries‚ 494
achieving multiple hoals: Results of the hatchery scientific review group’s Columbia River 495
basin review. Fisheries 36(11): 547–561. doi:10.1080/03632415.2011.626661. 496
Molony, B.W., Lenanton, R., Jackson, G.D., and Norriss, J. 2003. Stock enhancement as a 497
fisheries management tool. Rev. Fish Biol. Fish. 13(4): 409–432. doi:10.1007/s11160-005-498
1886-7. 499
Morita, K., Morita, S.H., and Fukuwaka, M. 2006. Population dynamics of Japanese pink salmon 500
(Oncorhynchus gorbuscha): are recent increases explained by hatchery programs or climatic 501
variations? Can. J. Fish. Aquat. Sci. 63(1): 55–62. doi:10.1139/f05-207. 502
Naish, K.A., Taylor III, J.E., Levin, P.S., Quinn, T.P., Winton, J.R., Huppert, D.D., and Hilborn, 503
R. 2007. An evaluation of the effects of conservation and fishery enhancement hatcheries 504
on wild populations of salmon. Adv. Mar. Biol. 53: 61–194. doi:10.1016/S0065-505
2881(07)53002-6. 506
North Pacific Anadromous Fish Commission (NPAFC). 2016. NPAFC Pacific salmonid 507
hatchery release statistics (Updated 20 July 2016). North Pacific Anadromous Fish 508
Commission, Vancouver. Accessed 2 November, 2016, Vancouver. Accessed 2 November, 509
2016. 510
Ohnuki, T., Morita, K., Tokuda, H., Okamoto, Y., and Ohkuma, K. 2015. Numerical and 511
economic contributions of wild and hatchery pink salmon to commercial catches in Japan 512
Page 23 of 37
https://mc06.manuscriptcentral.com/cjfas-pubs
Canadian Journal of Fisheries and Aquatic Sciences
Draft
estimated from mass otolith markings. North Am. J. Fish. Manag. 35(3): 598–604. 513
doi:10.1080/02755947.2015.1020078. 514
Olsen, J. 1993. Development of the pink salmon enhancement program in Prince William Sound, 515
Alaska. In Proceedings of the 16th Northeast Pacific Pink and Chum Salmon Workshop. 516
Alaska Sea Grant College Program, Juneau. 517
Pearson, W.H., Deriso, R.B., Elston, R. a., Hook, S.E., Parker, K.R., and Anderson, J.W. 2012. 518
Hypotheses concerning the decline and poor recovery of Pacific herring in Prince William 519
Sound, Alaska. Rev. Fish Biol. Fish. 22: 95–135. doi:10.1007/s11160-011-9225-7. 520
Peterman, R.M. 1991. Density-dependent marine processes in North Pacific salmonids: lessons 521
for experimental design of large-scale manipulations of fish stocks. ICES Mar. Sci. Symp. 522
192: 69–77. 523
Peterman, R.M., Holt, C.A., and Rutherford, M.R. 2012. The need for international cooperation 524
to reduce competition among salmon for a common pool of prey resources in the North 525
Pacific Ocean. N. Pac. Anad. Fish. Comm. Tech. Rep. 8: 99–101. 526
Pikitch, E., Santora, C., Babcock, E., Bakun, A., Bonfil, R., Conover, D., Dayton, P.K., 527
Doukakis, P., Fluharty, D., Heneman, B., Houde, E., Link, J.S., Livingston, P., Mangel, M., 528
McAllister, M., Pope, J., and Sainsbury, K. 2004. Ecosystem-based fishery management. 529
Science 305(5682): 346–7. doi:10.1126/science.1098222. 530
Pyper, B.J., Mueter, F.J., Peterman, R.M., Blackbourn, D.J., and Wood, C.C. 2001. Spatial 531
covariation in survival rates of Northeast Pacific pink salmon (Oncorhynchus gorbuscha). 532
Can. J. Fish. Aquat. Sci. 58(8): 1501–1515. doi:10.1139/cjfas-58-8-1501. 533
Quinn, T.P., Peterson, J.A., Gallucci, V.F., Hershberger, W.K., and Brannon, E.L. 2002. 534
Artificial selection and environmental change: Countervailing factors affecting the timing of 535
Page 24 of 37
https://mc06.manuscriptcentral.com/cjfas-pubs
Canadian Journal of Fisheries and Aquatic Sciences
Draft
spawning by coho and chinook salmon. Trans. Am. Fish. Soc. 131(4): 591–598. 536
doi:10.1577/1548-8659(2002)131<0591:ASAECC>2.0.CO;2. 537
Ruggerone, G.T., and Goetz, F.A. 2004. Survival of Puget Sound chinook salmon 538
(Oncorhynchus tshawytscha) in response to climate-induced competition with pink salmon 539
(Oncorhynchus gorbuscha). Can. J. Fish. Aquat. Sci. 61(9): 1756–1770. doi:10.1139/f04-540
112. 541
Ruggerone, G.T., and Nielsen, J. 2004. Evidence for competitive dominance of pink salmon 542
(Oncorhynchus gorbuscha) over other salmonids in the North Pacific Ocean. Rev. Fish 543
Biol. Fish. 14(3): 371–390. doi:10.1007/s11160-004-6927-0. 544
Ruggerone, G.T., Peterman, R.M., Dorner, B., and Myers, K.W. 2010. Magnitude and trends in 545
abundance of hatchery and wild pink salmon, chum salmon, and sockeye salmon in the 546
North Pacific Ocean. Mar. Coast. Fish. 2(1): 306–328. doi:10.1577/C09-054.1. 547
Ruggerone, G.T., Zimmermann, M., Myers, K.W., Nielsen, J.L., and Rogers, D.E. 2003. 548
Competition between Asian pink salmon (Oncorhynchus gorbuscha) and Alaskan sockeye 549
salmon (O. nerka) in the North Pacific Ocean. Fish. Oceanogr. 12(3): 209–219. 550
Sahashi, G., Morita, K., Ohnuki, T., and Ohkuma, K. 2015. An evaluation of the contribution of 551
hatchery stocking on population density and biomass: A lesson from masu salmon juveniles 552
within a Japanese river system. Fish. Manag. Ecol. 22(5): 371–378. doi:10.1111/fme.12136. 553
Samhouri, J.F., Haupt, A.J., Levin, P.S., Link, J.S., and Shuford, R. 2014. Lessons learned from 554
developing integrated ecosystem assessments to inform marine ecosystem-based 555
management in the USA. ICES J. Mar. Sci. 71(5): 1205–1215. doi:10.1093/icesjms/fst141. 556
Scheuerell, M.D., Buhle, E.R., Semmens, B.X., Ford, M.J., Cooney, T., and Carmichael, R.W. 557
2015. Analyzing large-scale conservation interventions with Bayesian hierarchical models: 558
Page 25 of 37
https://mc06.manuscriptcentral.com/cjfas-pubs
Canadian Journal of Fisheries and Aquatic Sciences
Draft
A case study of supplementing threatened Pacific salmon. Ecol. Evol. 5(10): 2115–2125. 559
doi:10.1002/ece3.1509. 560
Smoker, W.W., and Linley, T. 1997. Are Prince William Sound salmon hatcheries a fool’s 561
bargain? Alaska Fish. Res. Bull. 4(1): 75–78. 562
Springer, A.M., and van Vliet, G.B. 2014. Climate change, pink salmon, and the nexus between 563
bottom-up and top-down forcing in the subarctic Pacific Ocean and Bering Sea. Proc. Natl. 564
Acad. Sci. 111(18): E1880-8. doi:10.1073/pnas.1319089111. 565
Tarbox, K.E., and Bendock, T. 1996. Can alaska balance economic growth with fish habitat 566
protection? A biologist’s perspective. Alaska Fish. Res. Bull. 3(1): 49–53. 567
Trushenski, J., Blankenship, L., Bowker, J., Flagg, T., Hesse, J., Leber, K., Lorenzen, K., 568
MacKinlay, D., Maynard, D., Moffitt, C., Mudrak, V., Scribner, K., Stuewe, S., Sweka, J., 569
Whelan, G., and Young-Dubovsky, C. 2014. AFS completes assessment, issues new 570
guidance regarding hatchery operation and the use of hatchery-origin fish. Fisheries 39(11): 571
543–547. doi:10.1080/03632415.2014.964395. 572
Watson, R.A., Cheung, W.W.L., Anticamara, J.A., Sumaila, R.U., Zeller, D., and Pauly, D. 573
2013. Global marine yield halved as fishing intensity redoubles. Fish Fish. 14: 493–503. 574
doi:10.1111/j.1467-2979.2012.00483.x. 575
Wertheimer, A., Heard, W.R., Maselko, J.M., and Smoker, W.W. 2005. Relationship of size at 576
return with environmental variation, hatchery production, and productivity of wild pink 577
salmon in Prince William Sound, Alaska: does size matter? Rev. Fish Biol. Fish. 14(3): 578
321–334. doi:10.1007/s11160-004-2942-4. 579
Wertheimer, A., Heard, W.R., and Smoker, W.W. 2004. Effects of hatchery releases and 580
environmental variation on wild-stock productivity: consequences for sea ranching of pink 581
Page 26 of 37
https://mc06.manuscriptcentral.com/cjfas-pubs
Canadian Journal of Fisheries and Aquatic Sciences
Draft
salmon in Prince William Sound, Alaska. In Stock Enhancement and Sea Ranching: 582
Developments, Pitfalls and Opportunities, 2nd edition. Blackwell Publishing Ltd. pp. 307–583
326. 584
Wertheimer, A., and Smoker, W.W. 2001. Comment : A review of the hatchery programs for 585
pink salmon in Prince William Sound and Kodiak Island , Alaska. Trans. Am. Fish. Soc. 586
130(4): 712–720. 587
Westley, P.A., Quinn, T.P., and Dittman, A.H. 2013. Rates of straying by hatchery-produced 588
Pacific salmon (Oncorhynchus spp.) and steelhead (Oncorhynchus mykiss) differ among 589
species, life history types, and populations. Can. J. Fish. Aquat. Sci. 70(5): 735–746. 590
Worm, B., and Branch, T.A. 2012. The future of fish. Trends Ecol. Evol. 27(11): 594–599. 591
Elsevier Ltd. doi:10.1016/j.tree.2012.07.005. 592
Worm, B., Hilborn, R., Baum, J.K., Branch, T. a, Collie, J.S., Costello, C., Fogarty, M.J., Fulton, 593
E.A., Hutchings, J.A., Jennings, S., Jensen, O.P., Lotze, H.K., Mace, P.M., McClanahan, 594
T.R., Minto, C., Palumbi, S.R., Parma, A.M., Ricard, D., Rosenberg, A.A., Watson, R., and 595
Zeller, D. 2009. Rebuilding global fisheries. Science 325(5940): 578–585. 596
doi:10.1126/science.1173146. 597
Zhivotovsky, L.A., Fedorova, L.K., Rubtsova, G.A., Shitova, M. V., Rakitskaya, T.A., 598
Prokhorovskaya, V.D., Smirnov, B.P., Kaev, A.M., Chupakhin, V.M., Samarsky, V.G., 599
Pogodin, V.P., Borzov, S.I., and Afanasiev, K.I. 2012. Rapid expansion of an enhanced 600
stock of chum salmon and its impacts on wild population components. Environ. Biol. Fishes 601
94(1): 249–258. doi:10.1007/s10641-011-9873-4. 602
603
Juvenile Releases (millions)
Country Region Species 2006 - 2015 1952 - 2015
Page 27 of 37
https://mc06.manuscriptcentral.com/cjfas-pubs
Canadian Journal of Fisheries and Aquatic Sciences
Draft
average total
USA Alaska - PWS Pink 649.1 19,546.8
Japan Hokkaido - Pacific Chum 613.7 30,059.7
Japan Honshu - Pacific Chum 531.7 24,742.6
USA Alaska - SEAK Chum 443.4 11,104.9
Japan Hokkaido - West Chum 427.1 18,427.4
Russia Sakhalin Coast Chum 222.9 7,140.9
USA WA, OR, CA, ID Chinook 202.7 10,335.2
Russia Sakhalin Coast Pink 200.1 9,491.0
Japan Honshu - West Chum 150.3 9,230.0
USA Alaska - KOD Pink 147.8 4,456.6 604
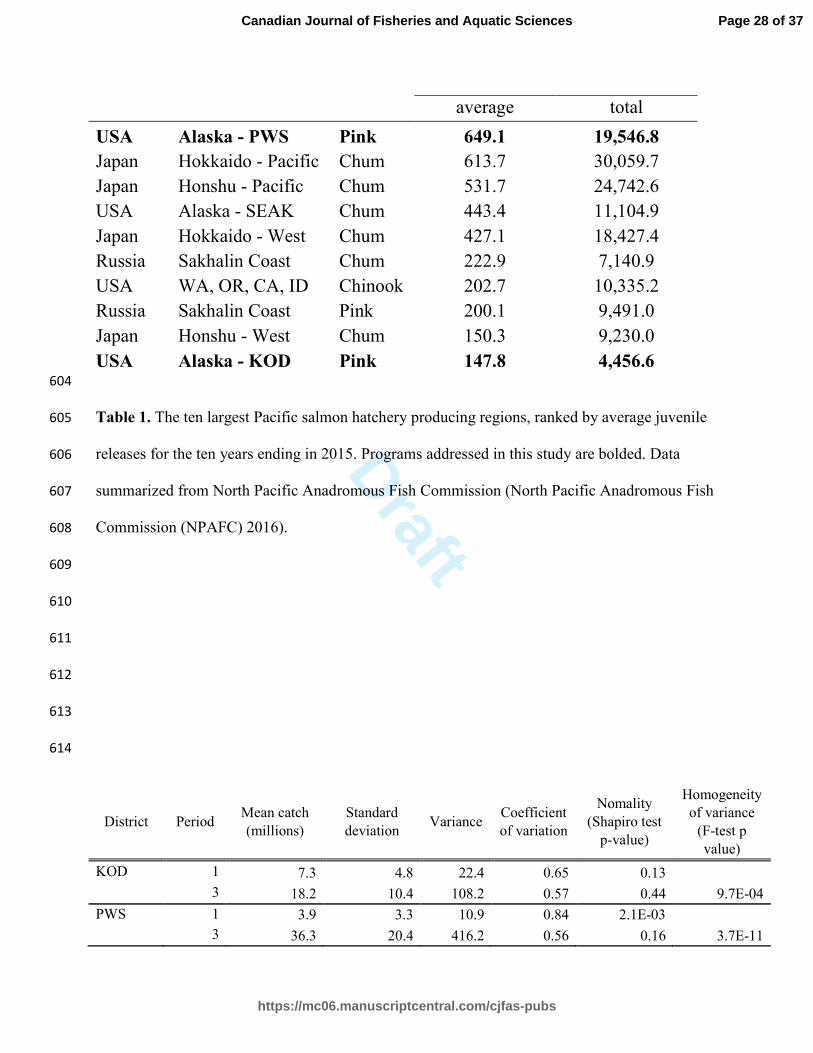
Table 1. The ten largest Pacific salmon hatchery producing regions, ranked by average juvenile 605
releases for the ten years ending in 2015. Programs addressed in this study are bolded. Data 606
summarized from North Pacific Anadromous Fish Commission (North Pacific Anadromous Fish 607
Commission (NPAFC) 2016). 608
609
610
611
612
613
614
District Period Mean catch
(millions)
Standard
deviation Variance
Coefficient
of variation
Nomality
(Shapiro test
p-value)
Homogeneity
of variance
(F-test p
value)
KOD 1 7.3 4.8 22.4 0.65 0.13
3 18.2 10.4 108.2 0.57 0.44 9.7E-04
PWS 1 3.9 3.3 10.9 0.84 2.1E-03
3 36.3 20.4 416.2 0.56 0.16 3.7E-11
Page 28 of 37
https://mc06.manuscriptcentral.com/cjfas-pubs
Canadian Journal of Fisheries and Aquatic Sciences

Draft
615
Table 2. Pink salmon catch and variability for the pre-regime shift (period 1: 1960-1976) and post-regime 616
shift, full hatchery production (period 3: 1988-2013) periods in four management areas in Alaska 617
618
619
620
621
622
623
624
625
626
627
628
629
630
631
SPEN 1 1.7 1.7 3.0 0.99 2.0E-02
3 6.4 4.0 15.9 0.61 0.37 5.7E-04
SEA 1 11.3 6.6 43.8 0.58 0.14
3 46.0 20.4 416.6 0.44 0.85 6.2E-06
KOD 1 KOD 3 PWS 1 PWS 3 SEAK 1 SEAK 3 S Pen 1 S Pen 3
α 1.42 1.42 1.04 1.04 1.39 1.39 1.25 1.25
β 21.22 21.22 11.46 14.77 28.36 82.76 3.92 11.87
σ 0.67 0.49 0.57 0.57 0.47 0.39 0.88 0.88
BMSY 8.49 8.49 4.89 6.30 11.17 33.30 1.61 4.89
MSY 11.42 11.42 4.03 5.19 14.85 43.33 1.76 5.33
∆MSY 0% 28% 202.7% 191.8%
Optimal
HR 57% 57% 45% 45% 56% 56% 52% 52%
Page 29 of 37
https://mc06.manuscriptcentral.com/cjfas-pubs
Canadian Journal of Fisheries and Aquatic Sciences

Draft
632
Table 3. Parameters of the lowest AIC Ricker model, optimum escapement, MSY, and harvest rate 633
producing MSY for each stock in for the pre-regime shift (1: 1960-1976) and post-regime shift, full 634
hatchery production (3: 1988-2013) periods. 635
636
637
638
639
640
641
642
643
644
645
646
647
648
649
650
651
652
District Model Specification Best Model Delta AIC AIC weight
KOD α1=α2 β1=β2 σ1= σ2 0 5.01 0.02
KOD α1≠α2 β1≠β2 σ1≠ σ2 0 2.44 0.07
KOD α1≠α2 β1≠β2 σ1= σ2 0 2.41 0.08
KOD α1=α2 β1=β2 σ1≠ σ2 1 0.00 0.25
KOD α1≠α2 β1=β2 σ1= σ2 0 0.68 0.18
KOD α1=α2 β1≠β2 σ1≠ σ2 0 1.78 0.10
Page 30 of 37
https://mc06.manuscriptcentral.com/cjfas-pubs
Canadian Journal of Fisheries and Aquatic Sciences

Draft
KOD α1=α2 β1≠β2 σ1= σ2 0 1.70 0.11
KOD α1≠α2 β1=β2 σ1≠ σ2 0 0.65 0.18
PWS α1=α2 β1=β2 σ1= σ2 0 0.37 0.15
PWS α1≠α2 β1≠β2 σ1≠ σ2 0 2.54 0.05
PWS α1≠α2 β1≠β2 σ1= σ2 0 0.54 0.14
PWS α1=α2 β1=β2 σ1≠ σ2 0 0.16 0.17
PWS α1≠α2 β1=β2 σ1= σ2 0 0.09 0.17
PWS α1=α2 β1≠β2 σ1≠ σ2 0 1.99 0.07
PWS α1=α2 β1≠β2 σ1= σ2 1 0.00 0.18
PWS α1≠α2 β1=β2 σ1≠ σ2 0 2.06 0.07
SPEN α1=α2 β1=β2 σ1= σ2 0 2.67 0.01
SPEN α1≠α2 β1≠β2 σ1≠ σ2 0 3.06 0.14
SPEN α1≠α2 β1≠β2 σ1= σ2 0 1.63 0.01
SPEN α1=α2 β1=β2 σ1≠ σ2 0 3.26 0.25
SPEN α1≠α2 β1=β2 σ1= σ2 0 3.92 0.01
SPEN α1=α2 β1≠β2 σ1≠ σ2 1 1.44 0.32
SPEN α1=α2 β1≠β2 σ1= σ2 0 0.00 0.01
SPEN α1≠α2 β1=β2 σ1≠ σ2 0 4.58 0.27
SEAK α1=α2 β1=β2 σ1= σ2 0 8.08 0.09
SEAK α1≠α2 β1≠β2 σ1≠ σ2 0 1.69 0.08
SEAK α1≠α2 β1≠β2 σ1= σ2 0 7.86 0.16
SEAK α1=α2 β1=β2 σ1≠ σ2 0 0.50 0.07
SEAK α1≠α2 β1=β2 σ1= σ2 0 6.91 0.05
SEAK α1=α2 β1≠β2 σ1≠ σ2 0 0.00 0.17
SEAK α1=α2 β1≠β2 σ1= σ2 1 6.14 0.35
SEAK α1≠α2 β1=β2 σ1≠ σ2 0 0.34 0.04
Table 4. Candidate models assessed to explain changes in production between periods and the respective 653
AIC and AIC weights. 654
655
Figure Legends 656
Figure 1. Annual releases of pink salmon fry to the North Pacific Ocean between 1952 and 657
2015. Data from North Pacific Anadromous Fish Commission (NPAFC 2016). 658
659
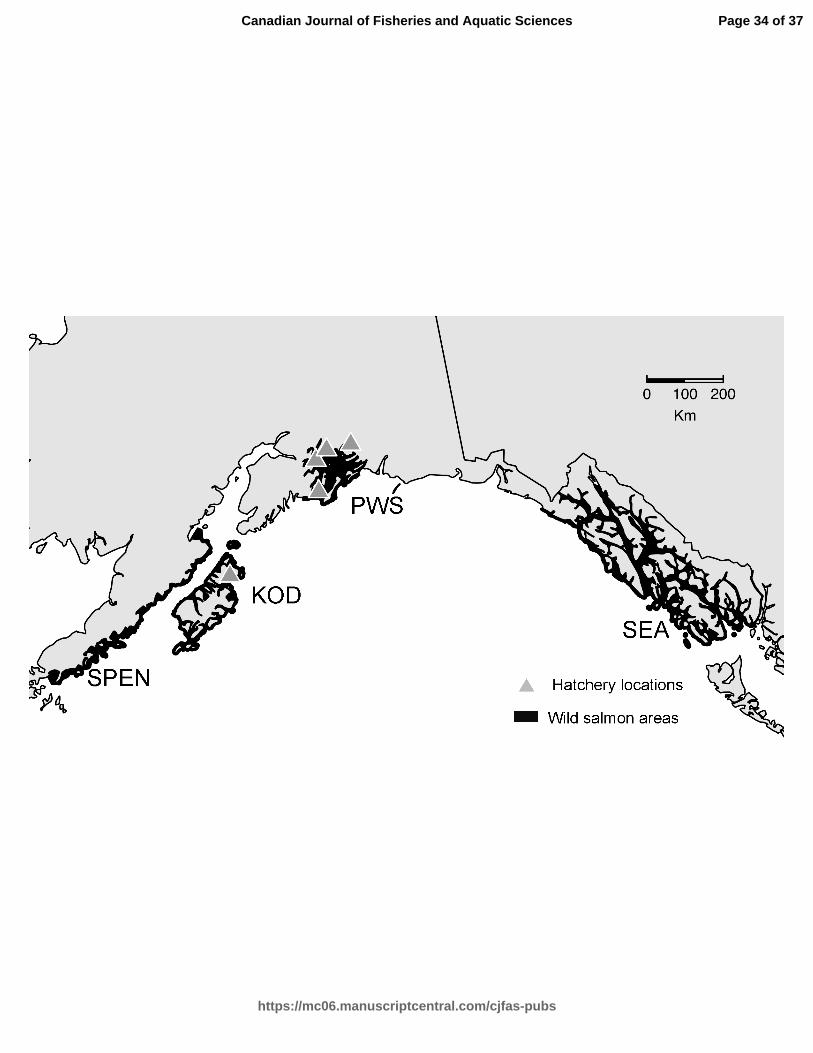
Figure 2. Study area map showing the four Gulf of Alaska pink salmon producing regions. 660
Triangles indicate the location of major pink salmon hatcheries. Basemap created from TM 661
World Borders 0.3 (https://koordinates.com/layer/7354-tm-world-borders-03/). 662
Page 31 of 37
https://mc06.manuscriptcentral.com/cjfas-pubs
Canadian Journal of Fisheries and Aquatic Sciences
Draft
663
Figure 3. Stacked area plot showing catch and total abundance (catch + escapement/ broodstock) 664
of hatchery and wild pink salmon in four management areas of Alaska, 1960-2013. 665
666
Figure 4. Observed (grey lines and points) and model predicted (solid and dashed lines) pink 667
salmon catch for four management areas in Alaska, 1960-2013. Model 1 includes period and area 668
effects while model 2 adds hatchery releases as a predictor. 669
670
Figure 5: Lowest AIC Ricker model parameter estimates for pre-regime shift (period 1: 1960-671
1976) and post-regime shift, full hatchery production (period 3: 1988-2011) periods in four pink 672
salmon management areas in Alaska. α values have been multiplied by 10 to aid in visualization. 673
Error bars show standard errors as calculated using the delta method. 674
675
Page 32 of 37
https://mc06.manuscriptcentral.com/cjfas-pubs
Canadian Journal of Fisheries and Aquatic Sciences

Draft
0.0
0.2
0.4
0.6
0.8
1.0
1.2
1.4
1.6
1952 1962 1972 1982 1992 2002 2012
Pink
sal
mon
fry
rele
ases
(billi
ons)
Release year
PWSKODSEAKAll Other
Page 33 of 37
https://mc06.manuscriptcentral.com/cjfas-pubs
Canadian Journal of Fisheries and Aquatic Sciences
Draft
Page 34 of 37
https://mc06.manuscriptcentral.com/cjfas-pubs
Canadian Journal of Fisheries and Aquatic Sciences
Draft
01020304050
Catch (millions)
KOD
020406080
Total run (millions)
KOD
020406080
100120 PWS
020406080
100120140 PWS
05
101520 SPEN
05
101520253035 SPEN
020406080
100120
1960
1970
1980
1990
2000
2010
SEAK
050
100150200
1960
1970
1980
1990
2000
2010
WildHatchery
SEAK
Page 35 of 37
https://mc06.manuscriptcentral.com/cjfas-pubs
Canadian Journal of Fisheries and Aquatic Sciences

Draft
0
10
20
30
40
50
KOD
0
20
40
60
80
100
120PWS
Model 1Model 2
1960
1970
1980
1990
2000
2010
0
5
10
15
20
SPEN
1960
1970
1980
1990
2000
2010
0
20
40
60
80
100
120
SEAK
Cat
ch (
mill
ions
)Page 36 of 37
https://mc06.manuscriptcentral.com/cjfas-pubs
Canadian Journal of Fisheries and Aquatic Sciences

Draft
α β MSY
0
10
20
0
5
10
15
20
0
25
50
75
100
0
5
10
15
KO
DP
WS
SE
AK
SP
EN
Period 1 Period 3 Period 1 Period 3 Period 1 Period 3Period
Val
ue *10
Page 37 of 37
https://mc06.manuscriptcentral.com/cjfas-pubs
Canadian Journal of Fisheries and Aquatic Sciences