dr andrew wilson domain group senior economist april...
TRANSCRIPT

marketview
Australian housing markets report
Melbourne shifts up a gear
Dr Andrew Wilson – Domain Group senior economist April 2015
Copyright 2015 Dr Andrew Wilson – all rights reserved

marketview
Housing market model – Wilson Curve

marketview
trough
peak
trough
peak
correction recovery
expansion
contraction
• Change points........
• Define phases
Housing market analysis – house price cycle model (Wilson 98)
Prices below last peak
Prices below last trough
Prices above last trough
Prices above last peak

marketview
Recent capital city performance

marketview
Capital city house price cycle - recent history
Correction 2011 Prices fall
Affordability falls from higher rates, higher prices PLUS economy down
Recovery 2012 Prices rise
Affordability improves as rates fall, lower prices AND economy revives
Expansion 2013 Price records emerge and consolidate as affordability peaks
Historically low rates, still solid economy, CONFIDENCE RESTORED
Expansion 2014 Price growth moderates as general economy and low rate impact wane
Sydney breaks clear of the pack - other capitals flat or flattening – CONFIDENCE TESTED

marketview
Current state of the national market

marketview
Current state of the national housing market
Expansion consolidated but now moderating All capital city house prices at or near record levels
Brisbane, Adelaide and Hobart still on the move with moderate growth
Perth prices growth remains modest, but better signs for Canberra - Darwin down
Solid finish to 2014 - all markets on the up – except Darwin
Peak price growth rates however moderated though 2014
Sydney still booming
CONTEXT Mixed-speed economies – AND housing markets
Markets and market segments patchy
Forward indicators and market drivers increasingly mixed and local
Lower rates to impact markets – affordability, confidence offset by local economy drag

marketview
Key price drivers

marketview
The future for house price growth?
....as usual depends on the economy
Key Drivers
Low unemployment and more jobs
Rising wages, incomes and profits
Lower interest rates
Rising stockmarket
Confidence

marketview
Recent prices growth

marketview
Correction phase 2011 - prices fall
-1.4%
-4.2%
-5.0%
-3.5%
-4.0%
-1.7%
-4.4%
-8.0%
Sydney Melbourne Brisbane Adelaide Perth Canberra Hobart Darwin

marketview
Recovery phase 2012 - prices stabilise and rise
4.6%
0.8% 0.7%
-0.4%
5.5%
1.8%
-4.5%
12.6%
Sydney Melbourne Brisbane Adelaide Perth Canberra Hobart Darwin

marketview
Expansion phase 2013 - all markets rising
15.4%
10.0%
5.1%
3.4%
9.6%
2.2%
5.0% 5.6%
Sydney Melbourne Brisbane Adelaide Perth Canberra Hobart Darwin

marketview
Expansion phase 2014 - growth moderates
14.0%
4.1%
5.9% 4.6%
0.6% 0.9% 2.1%
-6.8%
Sydney Melbourne Brisbane Adelaide Perth Canberra Hobart Darwin

marketview
Prices rise over December quarter – except Darwin
3.5%
0.6%
1.5% 0.9% 1.0%
1.9% 2.1%
-5.9%
Sydney Melbourne Brisbane Adelaide Perth Canberra Hobart Darwin

marketview
Most markets now above or close to previous peaks
34.8%
8.4%
3.6% 3.0%
7.9%
3.2%
-2.1% -0.7%
Sydney Melbourne Brisbane Adelaide Perth Canberra Hobart Darwin

marketview
Markets now well above previous price troughs
37.5%
16.6%
13.1%
9.5%
16.4%
4.9%
8.8%
10.9%
Sydney Melbourne Brisbane Adelaide Perth Canberra Hobart Darwin

marketview
Current capital city price cycle

marketview
Capital city house price cycle (Wilson Curve)
correction recovery
expansion
contraction
Sydney
Perth Melbourne
Brisbane
Adelaide
Darwin
Hobart
Canberra
marketview
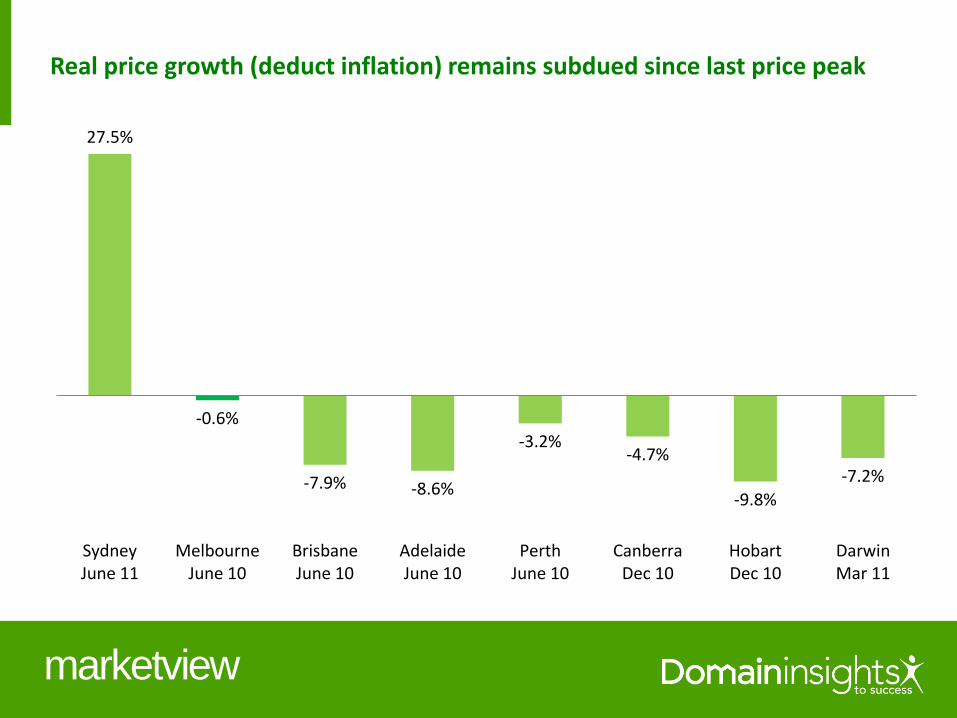
Real price growth (deduct inflation) remains subdued since last price peak
27.5%
-0.6%
-7.9% -8.6%
-3.2% -4.7%
-9.8%
-7.2%
SydneyJune 11
MelbourneJune 10
BrisbaneJune 10
AdelaideJune 10
PerthJune 10
CanberraDec 10
HobartDec 10
DarwinMar 11

marketview
Current capital city growth

marketview
Housing Market Barometer
4%
2%
0.5%
0%
Sydney 3.5%
Melbourne 0.6%
R
I
S
I
N
G
F
A
L
L
I
N
G
December quarter 2014
5%
4% 3%
2%
1%
0.5%
1%
2%
3%
4%
Boom
Strong
Solid
Moderate
Modest
Modest
Moderate
Solid
Strong
Bust
Flat
R
I
S
I
N
G
F
A
L
L
I
N
G
Perth 1.0%
Darwin -5.9%
Hobart 2.1% Canberra 1.9% Brisbane 1.5%

marketview
Sydney the most expensive – Melbourne affordable?
$872,811
$614,479
$489,128 $469,097
$615,280 $588,023
$332,998
$634,316
Sydney Melbourne Brisbane Adelaide Perth Canberra Hobart Darwin

marketview
Melbourne price cycle
marketview
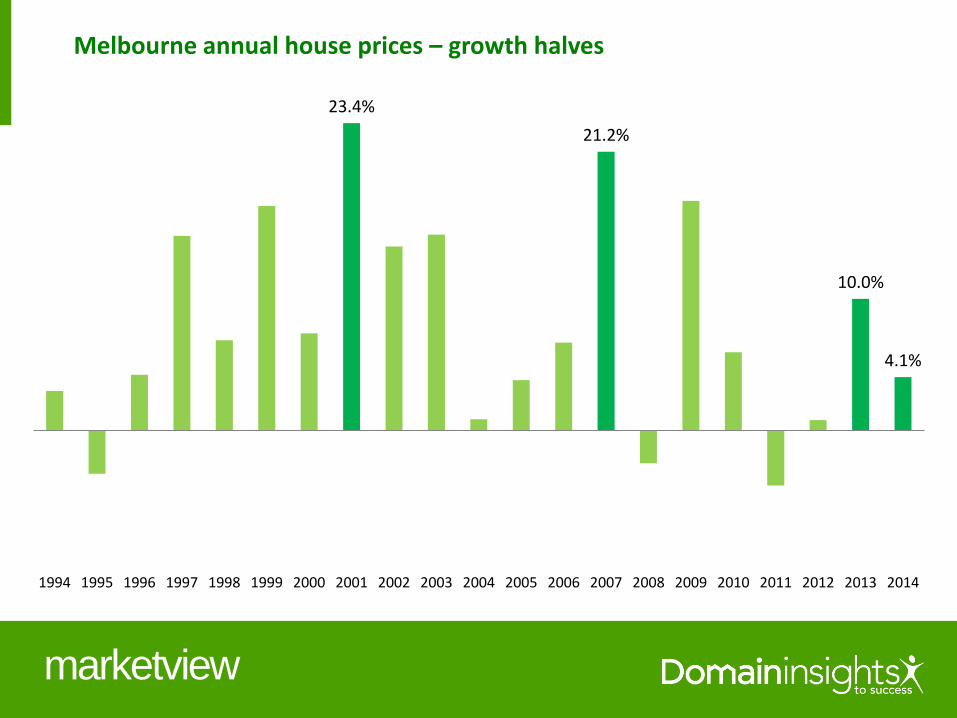
Melbourne annual house prices – growth halves
23.4%
21.2%
10.0%
4.1%
1994 1995 1996 1997 1998 1999 2000 2001 2002 2003 2004 2005 2006 2007 2008 2009 2010 2011 2012 2013 2014

marketview
Melbourne quarterly price growth – trend waning
6.8%
3.9%
0.6%
2007 2008 2009 2010 2011 2012 2013 2014

marketview
Melbourne house price cycle (Wilson Curve)
correction recovery
expansion
contraction
peak $566,661 June 2010
current $614,479 December 2014
trough $526,993 September 2012

marketview
Melbourne unit market

marketview
Melbourne houses versus units – in sync but units flatter
$614,479
$431,419
$200,000
$250,000
$300,000
$350,000
$400,000
$450,000
$500,000
$550,000
$600,000
$650,000
2004 2005 2006 2007 2008 2009 2010 2011 2012 2013 2014
Houses Units
marketview
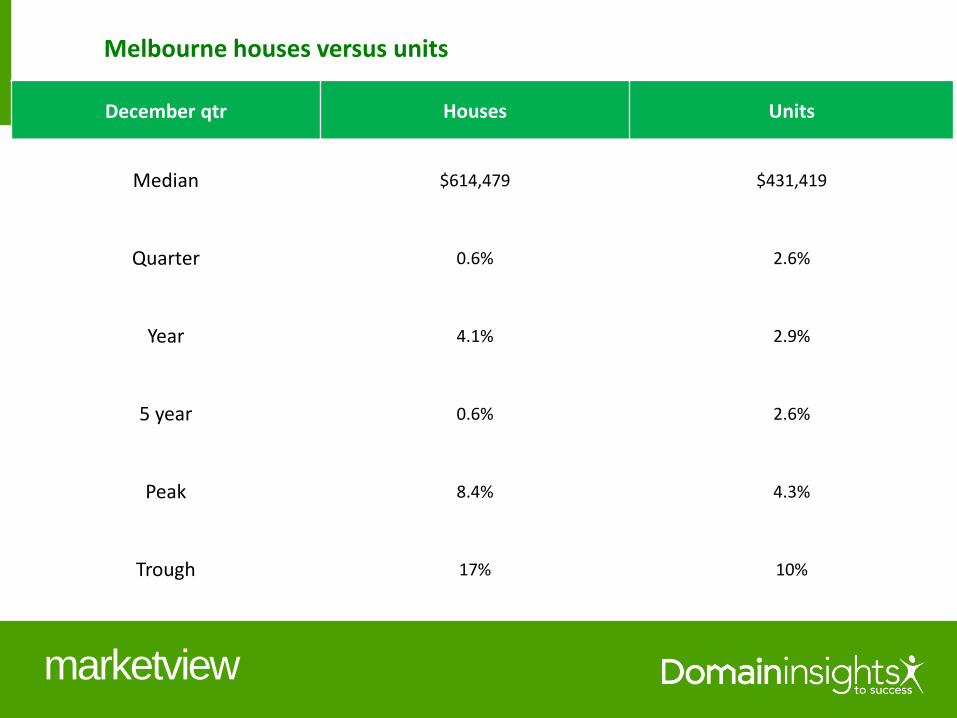
Melbourne houses versus units
December qtr Houses Units
Median $614,479 $431,419
Quarter 0.6% 2.6%
Year 4.1% 2.9%
5 year 0.6% 2.6%
Peak 8.4% 4.3%
Trough 17% 10%

marketview
Melbourne house price cycle (Wilson Curve)
correction recovery
expansion
contraction
Houses Units
marketview
Interest rates and housing markets

marketview
0%
1%
2%
3%
4%
5%
6%
7%
8%
$25 0,000
$35 0,000
$45 0,000
$55 0,000
$65 0,000
$75 0,000
$85 0,000
2006 2007 2008 2009 2010 2011 2012 2013 2014
Sydney Melbourne Brisbane Adelaide Perth Interest rate
Interest rates drive the cycle – for ALL capitals in sync
Rates rise 09-10 (FHOGB – mining boom 2)
Rates fall 11-12-13 (economy fades) Rates fall 08
(GFC) Rates rise 06-07 (mining boom 1)

marketview
Melbourne house prices and interest rates – underlying relationship
7.25%
3.00%
4.75%
2.50%
$614,479
$300,000
$350,000
$400,000
$450,000
$500,000
$550,000
$600,000
$650,000
0%
1%
2%
3%
4%
5%
6%
7%
8%
2006 2007 2008 2009 2010 2011 2012 2013 2014
Interest rate Melbourne median

marketview
Melbourne buyer types

marketview
VIC buyer types market share – higher investors? (ABS Jan loans)
11.2%
47.5%
41.4%
First home buyers Investors Changeover buyers

marketview
VIC buyer type annual growth – investors best (ABS loans year to date Jan 2014 vs. Jan 2013 )
-13.7%
26.0%
0.0%
16.1%
First home buyers Investors Changeover buyers Total

marketview
45.0%
26.1%
13.9%
3.7%
8.4%
NSW VIC QLD SA WA
National investor market share – NSW nearly half (ABS January loans)

marketview
VIC investors and changeover buyers in sync but FHB’s flatter
$0.0
$2.0
$4.0
$6.0
$8.0
$10.0
$12.0
2007 2008 2009 2010 2011 2012 2013 2014
Bill
ion
s
Changeover Investors FHB

marketview
FHB local market share - VIC low but slowly recovering (ABS January loans)
6.5%
11.2% 10.5% 10.5%
18.3%
15.0%
13.3%
11.2% 10.1%
NSW VIC QLD SA WA TAS ACT NT AUS

marketview
Melbourne prices track VIC loans – reliable forward indicator
$0
$5
$10
$15
$20
$25
$300,000
$340,000
$380,000
$420,000
$460,000
$500,000
$540,000
$580,000
$620,000
$660,000
2007 2008 2009 2010 2011 2012 2013 2014
Bill
ion
s
ABS loans Melbourne house price

marketview
Stable investor share through cycle reflects longer-term investment focus
32.2%
45.7%
37.1%
46.0%
38.2%
47.1%
41.5%
48.5%
41.4%
$190,000
$240,000
$290,000
$340,000
$390,000
$440,000
$490,000
$540,000
$590,000
$640,000
25%
30%
35%
40%
45%
50%
55%
2000 2001 2002 2003 2004 2005 2006 2007 2008 2009 2010 2011 2012 2013 2014
Investor share Average investor share Melbourne house price

marketview
Melbourne price ranges

marketview
$250,000
$350,000
$450,000
$550,000
$650,000
$750,000
$850,000
$100,000
$300,000
$500,000
$700,000
$900,000
$1,100,000
$1,300,000
2004 2005 2006 2007 2008 2009 2010 2011 2012 2013 2014
Prestige Budget Middle
Melbourne price ranges in sync
Prestige top 10% of suburbs
Middle Middle 40% of suburbs
Budget Bottom 50% of suburbs

marketview
Price ranges – prestige still lagging
2.1%
3.3%
2.2%
5.3%
8.0%
5.1%
7.4%
13.5%
7.6%
Budget (up to $560k) Middle ($560k to $1.38m) Prestige ($1.38m+)
December Qtr Year Peak

marketview
Melbourne house price range cycle (Wilson Curve)
correction recovery
expansion
contraction
Prestige Middle
Budget

marketview
Melbourne regions

marketview
200000
300000
400000
500000
600000
700000
800000
900000
1000000
1100000
1200000
2004 2005 2006 2007 2008 2009 2010 2011 2012 2013 2014
Inner East Inner Urban Inner South Outer East
North East North West South East
Melbourne prestige significant separation but outer east rising
Prestige
Middle
Budget

marketview
Melbourne’s east breaks clear
Houses Median Dec qtr 2014 5 year Last peak Listings per sale
Inner East $1,160,000 4.0% 16.9% 30.9% 21.5% 1.6
Inner Urban $1,080,500 9.3% 7.4% 22.8% 15.7% 1.5
Inner South $909,500 1.6% 9.3% 15.1% 10.6% 1.4
Outer East $641,600 5.9% 8.7% 28.3% 20.6% 1.6
North East $560,000 4.7% 6.4% 21.4% 11.4% 2.6
North $481,750 4.7% 3.6% 13.4% 4.7% 3.2
West $460,000 4.5% 3.4% 18.9% 7.0% 3.6
South East $434,000 2.1% 5.9% 19.4% 9.9% 3.8

marketview
Melbourne region house price cycle (Wilson Curve)
correction recovery
expansion
contraction
Outer east
North West
South east
Inner east
Inner urban
North east Inner south

marketview
Melbourne’s east breaks clear for units too
Units Median Dec qtr 2014 5 year Last peak Listings per sale
Inner East $585,000 4.5% 8.1% 13.0% 7.3% 2.8
Inner Urban $536,000 1.1% 1.1% 8.3% 3.1% 2.7
Inner South $522,500 13.6% 1.9% 13.3% 4.0% 2.2
Outer East $493,000 9.6% 8.4% 28.1% 16.4% 2.0
North East $412,000 1.0% 0.0% 6.7% 0.5% 2.4
North $398,000 2.8% -3.2% 4.7% -2.9% 2.7
West $385,000 2.7% 5.5% 14.1% -1.3% 3.2
South East $320,000 2.6% 3.2% 8.5% -0.6% 4.0

marketview
Melbourne region unit price range cycle (Wilson Curve)
correction recovery
expansion
contraction
Outer east
North
West
South east
Inner east
Inner urban
North east
Inner south

marketview
North suburbs

marketview
North top selling suburbs (6 months December 2014)
Houses Sold Median Listings per sale 6 month 1 year 5 year
Craigieburn 375 $386,000 4.6 5.4% 5.8% 14.9%
Glenroy 222 $485,000 1.3 7.8% 11.5% 13.2%
Coburg 217 $701,000 1.2 5.4% 12.2% 32.3%
Brunswick 174 $764,000 1.1 3.9% 4.7% 21.9%
Pascoe Vale 157 $558,000 1.1 5.8% 5.8% 7.2%
Roxburgh Park 132 $405,000 2.7 5.9% 11.0% 12.5%
Fawkner 113 $447,000 1.2 4.4% 9.0% 13.2%
Greenvale 98 $561,250 10.0 3.9% -2.0% 9.6%
Brunswick West 96 $705,500 1.1 -2.0% 9.5% 17.9%
Broadmeadows 95 $350,000 2.0 0.6% 2.9% 1.9%

marketview
North top selling suburbs (6 months December 2014)
Units Sold Median Listings per sale 6 month 1 year 5 year
Brunswick 105 $431,000 1.6 -10.0% -7.5% -2.7%
Brunswick East 61 $505,000 1.8 0.6% 5.2% 5.2%
Brunswick West 61 $398,000 1.7 0.1% 5.0% 12.1%
Coburg 46 $435,000 1.9 8.2% 8.5% 3.6%
Pascoe Vale 42 $426,250 1.3 -4.2% 0.3% 5.1%
Glenroy 39 $336,619 1.8 -10.6% -15.3% -7.5%
Craigieburn 20 $326,000 0.7 3.5% 3.2% 14.4%
Broadmeadows 14 $297,500 3.0 -1.0% 5.3% -0.2%
Oak Park 10 $368,500 1.6 -22.5% NA -4.3%
Tullamarine 10 $305,250 2.4 -6.9% -4.6% -4.6%

marketview
North east top selling suburbs (6 months December 2014)
Houses Sold Median Listings per sale 6 month 1 year 5 year
Reservoir 398 $520,000 1.3 4.4% 7.0% 23.2%
Preston 241 $685,000 1.1 7.0% 8.7% 29.2%
Epping 229 $390,000 5.3 0.0% 5.4% 8.6%
Bundoora 220 $550,000 1.3 3.8% 3.6% 25.7%
Mill Park 207 $430,500 1.3 0.1% 3.7% 13.0%
South Morang 200 $420,000 2.1 2.3% 0.0% 13.2%
Doreen 188 $450,000 6.8 7.1% 8.4% 13.9%
Greensborough 163 $580,000 1.2 7.4% 7.6% 27.2%
Eltham 160 $676,750 1.2 5.7% 9.2% 25.3%
Northcote 154 $940,000 1.1 4.4% 13.6% 34.2%
marketview
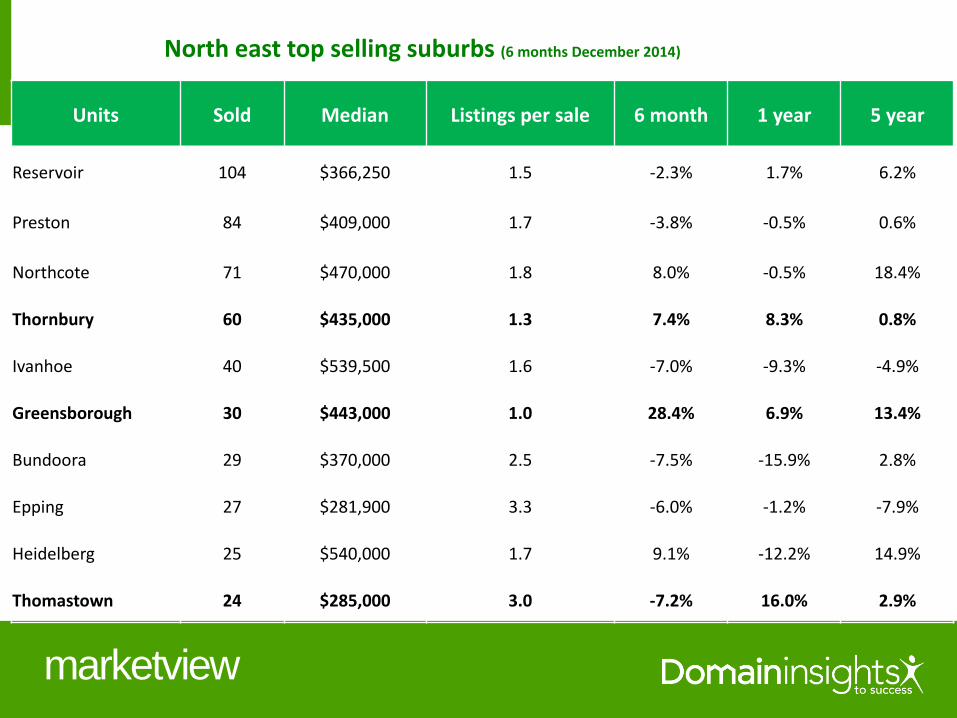
North east top selling suburbs (6 months December 2014)
Units Sold Median Listings per sale 6 month 1 year 5 year
Reservoir 104 $366,250 1.5 -2.3% 1.7% 6.2%
Preston 84 $409,000 1.7 -3.8% -0.5% 0.6%
Northcote 71 $470,000 1.8 8.0% -0.5% 18.4%
Thornbury 60 $435,000 1.3 7.4% 8.3% 0.8%
Ivanhoe 40 $539,500 1.6 -7.0% -9.3% -4.9%
Greensborough 30 $443,000 1.0 28.4% 6.9% 13.4%
Bundoora 29 $370,000 2.5 -7.5% -15.9% 2.8%
Epping 27 $281,900 3.3 -6.0% -1.2% -7.9%
Heidelberg 25 $540,000 1.7 9.1% -12.2% 14.9%
Thomastown 24 $285,000 3.0 -7.2% 16.0% 2.9%

marketview
West top selling suburbs (6 months December 2014)
Houses Sold Median Listings per sale 6 month 1 year 5 year
Point Cook 579 $471,000 3.6 4.7% 4.2% 16.3%
Sunbury 346 $358,975 2.2 -1.7% -0.3% 17.7%
Werribee 324 $320,000 3.1 4.9% 3.1% 19.9%
Hoppers Crossing 316 $340,000 1.9 -0.6% 2.4% 15.3%
Tarneit 291 $384,000 6.0 1.1% 2.4% 18.4%
Caroline Springs 251 $455,000 1.8 2.2% 2.9% 20.7%
St Albans 239 $370,000 2.0 1.4% 5.7% 10.4%
Wyndham Vale 193 $330,000 4.4 2.7% 6.0% 16.2%
Truganina 170 $369,900 11.6 4.5% 2.8% 17.5%
Yarraville 158 $739,250 1.1 6.9% 5.6% 32.2%

marketview
West top selling suburbs (6 months December 2014)
Units Sold Median Listings per sale 6 month 1 year 5 year
Footscray 93 $431,000 1.8 6.4% 9.1% 14.9%
Essendon 71 $400,000 1.9 -11.1% -10.8% -5.4%
Maribyrnong 62 $410,000 2.1 -6.8% -16.0% -6.6%
Kensington 58 $426,250 1.1 0.3% 1.5% 4.1%
Ascot Vale 48 $519,000 1.2 19.9% 17.4% 23.7%
West Footscray 41 $365,000 1.5 18.9% -2.7% 10.8%
St Albans 40 $280,000 3.0 -1.8% 3.7% 4.5%
Moonee Ponds 39 $405,000 2.3 -12.9% 0.4% 3.2%
Essendon North 34 $485,000 0.9 2.1% 15.5% 18.3%
Altona 32 $485,000 1.6 5.4% 9.0% 24.4%

marketview
Melbourne rental market

marketview
$200
$250
$300
$350
$400
$275,000
$325,000
$375,000
$425,000
$475,000
$525,000
$575,000
$625,000
$675,000
2004 2005 2006 2007 2008 2009 2010 2011 2012 2013 2014
House price House rent
Melbourne house rents versus house prices

marketview
Melbourne unit rents versus unit prices
$100
$150
$200
$250
$300
$350
$220,000
$270,000
$320,000
$370,000
$420,000
$470,000
2004 2005 2006 2007 2008 2009 2010 2011 2012 2013 2014
Unit price Unit rent

marketview
Melbourne house rents versus unit rents
$200
$220
$240
$260
$280
$300
$320
$340
$360
$380
$400
2004 2005 2006 2007 2008 2009 2010 2011 2012 2013 2014
Unit rent House rent

marketview
Melbourne house yields versus unit yields
4.08%
4.60%
3.0%
3.2%
3.4%
3.6%
3.8%
4.0%
4.2%
4.4%
4.6%
4.8%
5.0%
2004 2005 2006 2007 2008 2009 2010 2011 2012 2013 2014
House Unit

marketview
Capital city rental markets (December qtr 2014)
Houses Rent Qtr change Annual change Yield Vacancy rate (January)
Sydney $520 2.0% 4.0% 4.00% 1.8%
Melbourne $380 0.0% 0.0% 4.08% 2.0%
Brisbane $400 0.0% 0.0% 5.02% 2.1%
Adelaide $350 1.4% 0.0% 4.81% 1.3%
Perth $450 0.0% -6.3% 4.57% 2.4%
Canberra $450 0.0% -2.2% 4.55% 1.3%
Darwin $660 0.0% -5.7% 5.21% 1.3%
Hobart $320 3.2% 3.2% 5.44% 1.0%
marketview
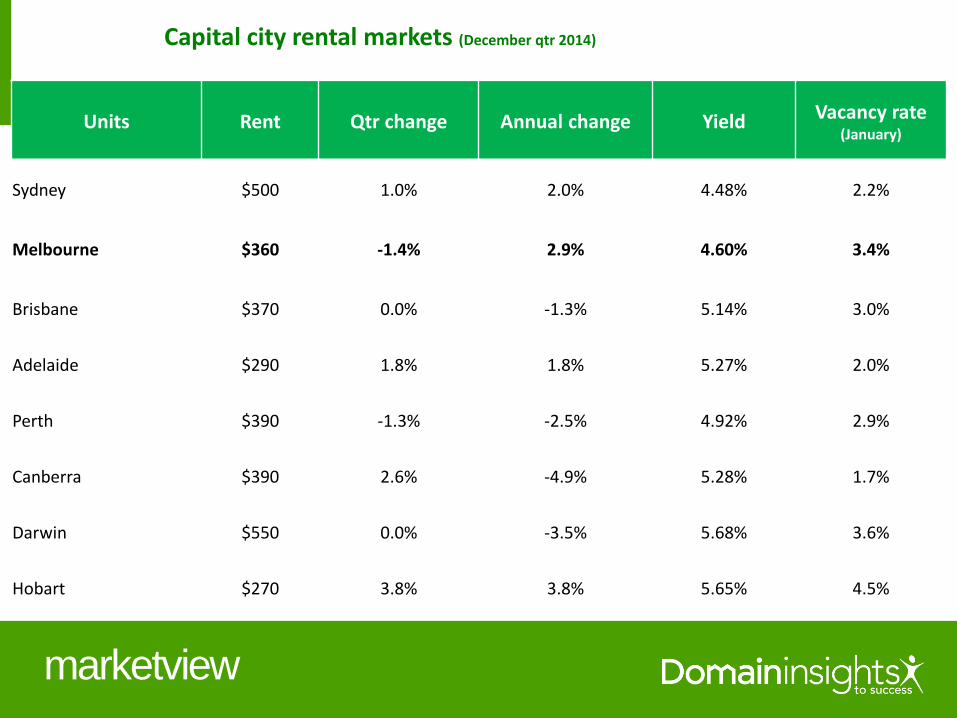
Capital city rental markets (December qtr 2014)
Units Rent Qtr change Annual change Yield Vacancy rate (January)
Sydney $500 1.0% 2.0% 4.48% 2.2%
Melbourne $360 -1.4% 2.9% 4.60% 3.4%
Brisbane $370 0.0% -1.3% 5.14% 3.0%
Adelaide $290 1.8% 1.8% 5.27% 2.0%
Perth $390 -1.3% -2.5% 4.92% 2.9%
Canberra $390 2.6% -4.9% 5.28% 1.7%
Darwin $550 0.0% -3.5% 5.68% 3.6%
Hobart $270 3.8% 3.8% 5.65% 4.5%

marketview
Melbourne regions rental market

marketview
Region rental markets ( 3 months December 2014)
Houses Vacancies Rent 6 month change Annual change Yield
Inner Urban 2155 $600 3.4% 0.8% 2.9%
Inner East 1879 $515 3.0% -1.0% 2.3%
Inner South 2258 $500 1.0% 1.0% 2.9%
Outer East 2926 $400 0.0% 2.6% 3.2%
North East 3087 $360 0.0% 2.9% 3.3%
North 1990 $360 0.0% 2.3% 3.9%
South East 3956 $350 0.0% 2.9% 4.2%
West 6707 $350 0.0% 2.9% 4.0%

marketview
Region rental markets ( 3 months December 2014)
Units Vacancies Rent 6 month change Annual change Yield
Inner Urban 10127 $420 -2.3% 3.7% 4.1%
Inner East 2506 $360 -4.0% 1.4% 3.2%
Inner South 3157 $350 -2.8% 0.0% 3.5%
Outer East 1117 $350 1.4% 2.9% 3.7%
North 1203 $330 0.0% 0.0% 4.3%
North East 1829 $320 0.0% 3.2% 4.0%
West 2871 $310 0.0% 3.3% 4.2%
South East 1554 $290 0.0% 3.6% 4.7%

marketview
North rental market

marketview
North top rental suburbs ( 6 months December 2014)
Houses Vacancies Rent 6 month change Annual change Yield
Craigieburn 695 $340 0.0% 3.0% 4.6%
Brunswick 323 $520 4.0% 8.3% 3.5%
Glenroy 282 $350 1.4% 2.9% 3.8%
Coburg 264 $450 0.0% 2.3% 3.3%
Pascoe Vale 215 $370 -2.6% 2.8% 3.3%
Brunswick West 174 $490 2.6% 2.1% 3.6%
Wallan 161 $320 0.0% 3.2% 4.8%
Roxburgh Park 157 $360 2.9% 2.9% 4.7%
Brunswick East 154 $515 -1.0% 6.2% 3.9%
Broadmeadows 153 $320 3.2% 3.2% 4.8%

marketview
North top rental suburbs ( 6 months December 2014)
Units Vacancies Rent 6 month change Annual change Yield
Brunswick 507 $370 1.4% 0.0% 4.5%
Brunswick West 376 $310 0.0% 3.3% 4.1%
Brunswick East 257 $365 -2.0% 1.4% 3.8%
Coburg 214 $340 -0.7% 0.0% 4.0%
Glenroy 151 $300 -3.2% 0.0% 4.6%
Pascoe Vale 143 $330 -1.5% 0.0% 4.1%
Tullamarine 104 $300 1.7% 3.4% 5.1%
Oak Park 51 $330 3.1% 3.1% 4.3%
Broadmeadows 50 $310 3.3% 3.3% 5.4%
Fawkner 36 $313 4.2% 4.0%

marketview
North east top rental suburbs ( 6 months December 2014)
Houses Vacancies Rent 6 month change Annual change Yield
Reservoir 616 $340 3.0% 3.0% 3.4%
Epping 401 $340 3.0% 3.0% 4.5%
Preston 383 $400 0.0% 0.0% 3.0%
Bundoora 306 $355 1.4% 1.4% 3.4%
Northcote 303 $550 0.0% 10.0% 3.1%
Mill Park 291 $340 0.0% 0.0% 4.1%
Doreen 253 $350 0.0% 0.0% 4.0%
South Morang 252 $350 -1.4% 0.0% 4.3%
Mernda 241 $340 0.0% 3.0% 4.6%
Thornbury 232 $493 2.6% 7.0% 3.1%

marketview
North east top rental suburbs ( 6 months December 2014)
Units Vacancies Rent 6 month change Annual change Yield
Reservoir 462 $310 3.3% 3.3% 4.4%
Preston 346 $340 -2.9% -2.9% 4.3%
Thornbury 314 $300 -6.3% 0.0% 3.8%
Northcote 288 $360 2.9% 2.9% 4.0%
Bundoora 170 $340 3.0% 6.3% 4.8%
Ivanhoe 139 $340 -3.5% -2.9% 3.2%
Fairfield 135 $295 -4.8% -1.3% 3.3%
Heidelberg 129 $350 0.0% 2.9% 3.4%
MacLeod 124 $200 -4.8% -4.8% 2.0%
Epping 120 $290 -1.7% 0.0% 5.3%
marketview
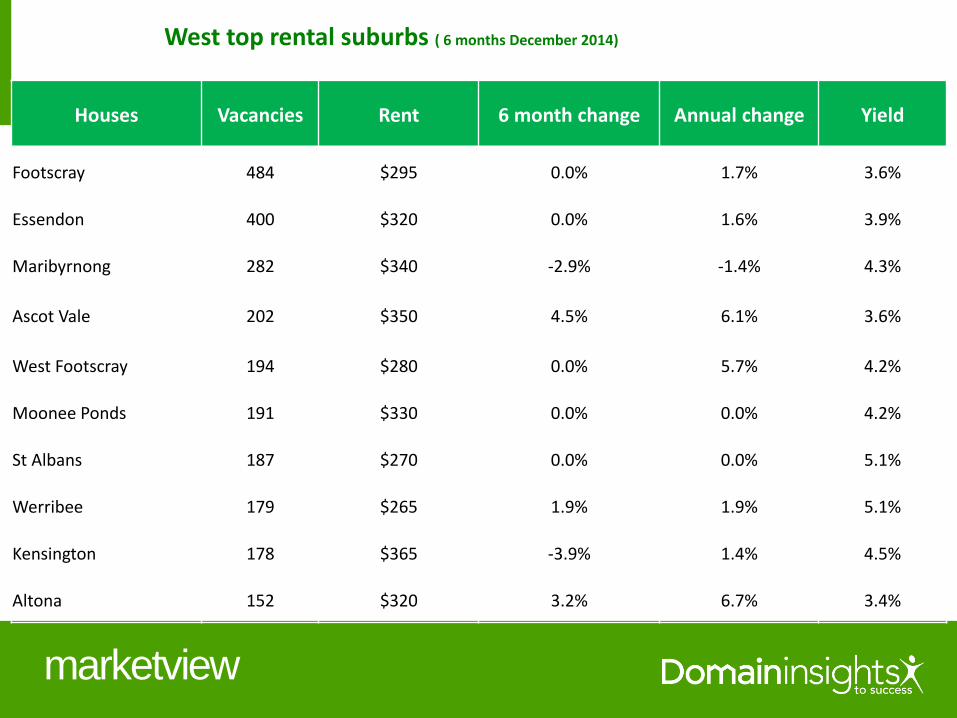
West top rental suburbs ( 6 months December 2014)
Houses Vacancies Rent 6 month change Annual change Yield
Footscray 484 $295 0.0% 1.7% 3.6%
Essendon 400 $320 0.0% 1.6% 3.9%
Maribyrnong 282 $340 -2.9% -1.4% 4.3%
Ascot Vale 202 $350 4.5% 6.1% 3.6%
West Footscray 194 $280 0.0% 5.7% 4.2%
Moonee Ponds 191 $330 0.0% 0.0% 4.2%
St Albans 187 $270 0.0% 0.0% 5.1%
Werribee 179 $265 1.9% 1.9% 5.1%
Kensington 178 $365 -3.9% 1.4% 4.5%
Altona 152 $320 3.2% 6.7% 3.4%
marketview
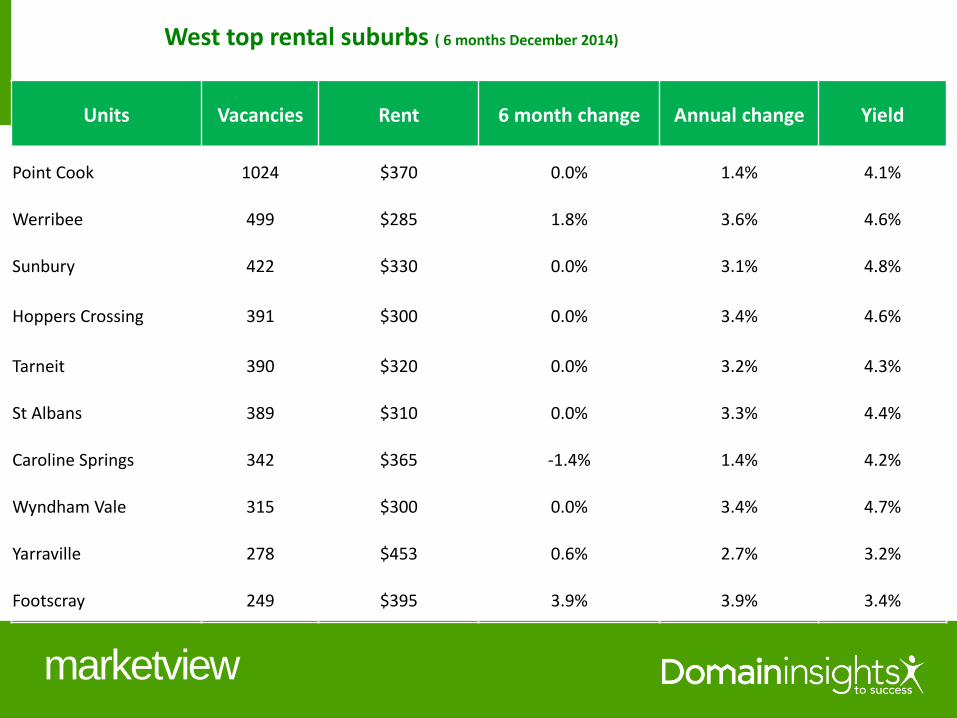
West top rental suburbs ( 6 months December 2014)
Units Vacancies Rent 6 month change Annual change Yield
Point Cook 1024 $370 0.0% 1.4% 4.1%
Werribee 499 $285 1.8% 3.6% 4.6%
Sunbury 422 $330 0.0% 3.1% 4.8%
Hoppers Crossing 391 $300 0.0% 3.4% 4.6%
Tarneit 390 $320 0.0% 3.2% 4.3%
St Albans 389 $310 0.0% 3.3% 4.4%
Caroline Springs 342 $365 -1.4% 1.4% 4.2%
Wyndham Vale 315 $300 0.0% 3.4% 4.7%
Yarraville 278 $453 0.6% 2.7% 3.2%
Footscray 249 $395 3.9% 3.9% 3.4%

marketview
Melbourne key market drivers

marketview
Melbourne ABS annual home approvals
18,633 18,562
22,284 22,838 21,654
26,451
41,471 40,216
48,735
2012 2013 2014
Houses Units Total

marketview
Melbourne ABS dwelling approvals year to date – many more units (February)
3388 3439
6827
3479
5173
8652
Houses Units Total
2014 2015

marketview
Melbourne ABS unit approvals - oversupplied again?
26,451
0
5,000
10,000
15,000
20,000
25,000
30,000
2002 2003 2004 2005 2006 2007 2008 2009 2010 2011 2012 2013 2014

marketview
Victorian overseas migration drives local housing markets (ABS financial year)
48,165
55,854
62,532
68,141
2011 2012 2013 2014

marketview
Melbourne population growth drives prices (ABS financial year)
2.5%
2.2%
$0
$100,000
$200,000
$300,000
$400,000
$500,000
$600,000
$700,000
0.0%
0.5%
1.0%
1.5%
2.0%
2.5%
3.0%
2002 2003 2004 2005 2006 2007 2008 2009 2010 2011 2012 2013 2014
Population growth House price

marketview
Melbourne economic performance

marketview
Melbourne job surge – 94,480 new jobs over year (ABS February)
2,098,809
2,156,136 2,150,997
2,212,810
2,190,006
2,284,486
1,950,000
2,000,000
2,050,000
2,100,000
2,150,000
2,200,000
2,250,000
2,300,000
2010 2011 2012 2013 2014 2015

marketview
Melbourne jobless falling (ABS February)
5.8%
5.4%
6.0% 6.2%
7.3%
6.6%
0%
1%
2%
3%
4%
5%
6%
7%
8%
2010 2011 2012 2013 2014 2015

marketview
Melbourne in work rising - reflects strong migration effect waning (ABS February)
66.8%
67.2%
66.2%
66.9%
65.7%
66.6%
64%
64%
65%
65%
66%
66%
67%
67%
68%
2010 2011 2012 2013 2014 2015

marketview
National economic performance

marketview
National turnaround?
February ABS jobless rate 2014 2015 Trend
Sydney 5.8% 5.8%
Melbourne 7.3% 6.6%
Brisbane 6.7% 6.5%
Adelaide 7.5% 7.1%
Perth 6.3% 6.4%
Hobart 8.0% 6.8%
Canberra 3.6% 5.4%
Darwin 3.3% 3.1%

marketview
NSW retail spending top performer but VIC healthy (ABS growth year to date Feb 15 vs Feb14)
5.7%
4.4%
2.9%
4.1%
2.7%
3.5%
-0.6%
3.5%
4.2%
NSW VIC QLD SA WA TAS NT ACT AUS

marketview
VIC economy on the rise – state final demand (ABS rolling annual quarters Dec 2014)
2.8%
-1%
0%
1%
2%
3%
4%
5%
6%
2009 2010 2011 2012 2013 2014

marketview
VIC economy a top performer – state final demand (ABS Dec qtr 2014 vs Dec qtr 2013)
4.0%
2.7%
-3.5%
1.9%
-1.7%
1.6%
6.2%
1.5%
NSW VIC QLD SA WA TAS NT ACT
marketview
Economic outlook

marketview
Economic outlook 2015
Mixed national economic outlook Pessimism outweighing optimism - future cloudy - but a glimmer of hope? Reserve Bank still wary on near-term direction of economy but rates on hold
International economy wavering? Growth in China remains relatively strong but signs of fading international economy US economy continues to slowly revive but real growth (wages) still too low AUD to fall as USD rises with higher US rates
Mixed results for local economies VIC in transition as manufacturing base wanes but building and services holding up NSW solid growth trend – top performer as mixed economy spreads the load QLD up as dollar falls - strong exporter, tourism, population rising – confidence up slowly SA showing early signs of revival but will be a gradual and lengthy process WA still OK with population surge but mining building boom over and lower iron ore prices TAS showing early signs of revival but remains national underperformer NT boom resources economy creaking under population surge but set to resume growth

marketview
Economic drivers - rates, dollar, wages, profits all low and falling - but shares up
Interest rates remaining at 60 year low
Downward bias until jobless falls below 6% - less stimulus capacity from record low rates – deflation risk
Mortgage costs falling as banks compete for market share – but still at 2009 rates
Rate cuts likely to continue through 2015 - economy needs more stimulus – watch the currency
Stockmarket rising with lower dollar but hostage to global forces
Investors shift to shares and increased international investment with lower dollar
Solid growth upside as still 10% below 2007 peak, unlike other exchanges at or near highs
Lower dollar and looming deflation
Imports more expensive, living standards fall, spending and investment decline
Wages and profits subdued in low inflation economy – places lid on house price growth despite rate cuts
Government spending constrained by high deficit - horror budgets?
Retail sales, building, profits, sentiment and exports mixed - but not good enough yet

marketview
Melbourne housing market outlook

marketview
• Market to revive from lower rates, rising confidence and aspirational buyers in the east
• Changeover buyers in mid to higher price ranges resilient as value opportunities remain
• Lower rates and rising confidence to generate market momentum despite economic drag
• Investors to remain active - yields low but stable as fundamentals hold - better than deposit rates
• Prestige rising with shares and FHB’s to trickle back into market from low base
• CBD unit market oversupplied but inner suburban units to remain in demand
• Budget outer suburban markets however to continue to underperform due to concerns over job security
• Underperforming local economy showing some early signs of improvement
• Jobless falling, jobs growth resuming and participation rate higher despite surge in population
• Increased dwelling construction to continue – more unit approvals - creating jobs despite oversupply
• Rising population enhanced by improved economy
• Wealth effect from rising house prices to generate downstream economic activity
• Market still affordable with real prices growth flat over past 5 years
• Melbourne to record similar house price growth to last year up by a solid 5%
• Eastern suburbs remain strong from aspirational buyers with outer north and west modest
although improving with economy
Melbourne housing market outlook 2015 - a moderate revival from usual suspects

marketview
National housing market outlook

marketview
Housing Market Barometer
12%
2%
1%
0%
0%
Sydney 9%
Perth, Darwin, Canberra 2%
Brisbane 7%
R I S I NG
F A L L I N G
2015 forecasts
5%
4% 8%
6%
4%
2%
2%
3%
4%
5%
Boom
Strong
Robust
Solid
Moderate
Moderate
Solid
Robust
Strong
Bust
Flat
Melbourne, Adelaide, Hobart 5%

marketview
Melbourne local housing market outlook

marketview
Housing Market Barometer
12%
2%
1%
0%
0%
Middle 7%
Prestige 5%
R I S I NG
F A L L I N G
2015 forecasts
5%
4% 8%
6%
4%
2%
2%
3%
4%
5%
Boom
Strong
Robust
Solid
Moderate
Moderate
Solid
Robust
Strong
Bust
Flat
Budget 3%

marketview
Housing Market Barometer
12%
2%
1%
0%
0%
inner east, outer east 10%
north east, inner south, inner urban 5%
R I S I NG
F A L L I N G
2015 forecasts
5%
4% 8%
6%
4%
2%
2%
3%
4%
5%
Boom
Strong
Robust
Solid
Moderate
Moderate
Solid
Robust
Strong
Bust
Flat
west, south east, north 3%

marketview
Melbourne auctions reliable and timely market indicator

marketview
Melbourne clearance rate reflects prices growth – reliable weekly indicator
$325,000
$375,000
$425,000
$475,000
$525,000
$575,000
$625,000
$675,000
0.0%
10.0%
20.0%
30.0%
40.0%
50.0%
60.0%
70.0%
80.0%
90.0%
2004 2005 2006 2007 2008 2009 2010 2011 2012 2013 2014
Median house price Auction clearance rate

marketview
Melbourne auction volumes also reflect prices growth – reliable weekly indicator
$0
$100,000
$200,000
$300,000
$400,000
$500,000
$600,000
$700,000
0
2000
4000
6000
8000
10000
12000
14000
2004 2005 2006 2007 2008 2009 2010 2011 2012 2013 2014
Auctions Median house price 4 per. Mov. Avg. (Auctions)

marketview
North clearance rate reflects prices growth – reliable weekly indicator
$275,000
$325,000
$375,000
$425,000
$475,000
$525,000
0.0%
10.0%
20.0%
30.0%
40.0%
50.0%
60.0%
70.0%
80.0%
90.0%
2004 2005 2006 2007 2008 2009 2010 2011 2012 2013 2014
Median house price Clearance rate

marketview
North east clearance rate reflects prices growth – reliable weekly indicator
$275,000
$325,000
$375,000
$425,000
$475,000
$525,000
$575,000
0%
10%
20%
30%
40%
50%
60%
70%
80%
90%
2004 2005 2006 2007 2008 2009 2010 2011 2012 2013 2014
Median house price Clearance rate

marketview
West clearance rate reflects prices growth – reliable weekly indicator
$250,000
$300,000
$350,000
$400,000
$450,000
$500,000
0%
10%
20%
30%
40%
50%
60%
70%
80%
2004 2005 2006 2007 2008 2009 2010 2011 2012 2013 2014
Median house price Clearance rate

marketview
March clearance rates rising
86.6% 82.5% 82.1%
73.7% 72.3% 71.5% 68.8%
61.7%
Outer East Inner East Inner South North East North Inner Urban West South East

marketview
Melbourne clearance rates rising
78.8%
68.9%
72.2%
Current 4 weekend average Previous 4 weekend average(Dec14)
Last year 4 weekend average

marketview
Melbourne auction volumes down - earlier Easter this year
7,400
8,778
2015 2014

marketview
North March clearance rates rising
61.7%
71.9%
2014 2015

marketview
North east March clearance rates – up sharply
66.6%
73.3%
2014 2015

marketview
West March clearance rates up
63.9%
68.5%
2014 2015

marketview
Auction clearance rates April 11 – strongest market since 2010
90.2% 86.0%
81.3% 81.2% 78.6% 78.3%
69.3%
60.9%
Outer East Inner East Inner Urban North East North Inner South West South East

marketview
The rising tide

marketview
House price history lesson
• Australian housing markets are historically trend-linked
1993 1995 1997 1999 2001 2003 2005 2007 2009 2011 2013
Sydney Melbourne Brisbane Adelaide Perth

marketview
Rising dwelling type tide
2004 2005 2006 2007 2008 2009 2010 2011 2012 2013 2014
Houses Units

marketview
Rising buyer type tide
2007 2008 2009 2010 2011 2012 2013 2014
Changeover Investors FHB

marketview
$25 0,000
$35 0,000
$45 0,000
$55 0,000
$65 0,000
$75 0,000
$85 0,000
$10 0,000
$30 0,000
$50 0,000
$70 0,000
$90 0,000
$1, 100,00 0
$1, 300,00 0
2004 2005 2006 2007 2008 2009 2010 2011 2012 2013 2014
Prestige Budget Middle
Rising price ranges tide

marketview
Rising regional tide
2004 2005 2006 2007 2008 2009 2010 2011 2012 2013 2014
Inner East Inner Urban Inner South Outer East
North East North West South East

marketview
A rising tide lifts all boats - in time
Economies
Employment
Incomes
Population growth
Prosperity
Confidence
House prices
Monolithic Australian economy and housing market

marketview
Australian residential property’s best friend (the Wilson curve)
Secure reliable long-term tax-enhanced capital growth

marketview
Melbourne affordability debate

marketview
Falling repayments enable prices growth (Reserve Bank indicator rate, 30 year variable, ABS)
$535
$412
$662
$407
$486 $477
$614,479
$350,000
$400,000
$450,000
$500,000
$550,000
$600,000
$650,000
$300.00
$350.00
$400.00
$450.00
$500.00
$550.00
$600.00
$650.00
$700.00
2007 2008 2009 2010 2011 2012 2013 2014
VIC average repayment Overall average repayment Melbourne median

marketview
Incomes rise, repayments fall, affordability improves and prices rise (ABS)
38.5%
29.3%
43.2%
25.0%
28.9%
32.5%
$300,000
$350,000
$400,000
$450,000
$500,000
$550,000
$600,000
$650,000
20%
25%
30%
35%
40%
45%
2007 2008 2009 2010 2011 2012 2013 2014
VIC loan % of Melbourne income Average VIC loan % of Melbourne income
Melbourne median

marketview
38.5%
29.3%
43.2%
25.0%
28.9%
32.5%
320
398
333
365
351
300
320
340
360
380
400
420
20%
25%
30%
35%
40%
45%
2007 2008 2009 2010 2011 2012 2013 2014
VIC loan % of Melbourne income
Average VIC loan % of Melbourne income
Weekly Melbourne income as a factor of Melbourne price
Average income as a factor of price
Incomes, prices, loans – which is the effective affordability benchmark? (ABS)
Income factor above average
Loan proportion still below average

marketview
Melbourne home owners higher interest rate vulnerability – just 2.7% (ABS)
28.2%
33.8%
35.4%
2.7%
Non-owners Outright owners
Repayments 30% or less than income Repayments 30% or more than income

marketview
Where do you go to find out what's really happening in your housing
market?
Buy? Sell? Hold? or Rent?
Expert real-time insights into the current state and future prospects of
your housing market
Coming soon Domain Marketview on the Domain website
Australian property market analysis - Domain Marketview
marketview
If you require any further information regarding Australian property
market analysis I may be contacted by email at
[email protected] or phone 0427 410 240
For all the real-time housing market insights follow me on twitter at
@DocAndrewWilson
Australian property market analysis

Thank you