RESEARCH PAPER
The Shale Technology Revolution and
the Implications for the GCC
Paul Stevens | Jan 2015

The Shale Technology Revolution and the Implications for the GCC
Series: Research Paper
Paul Stevens | Jan 2015
Copyright © 2015 Arab Center for Research and Policy Studies. All Rights Reserved.
____________________________
The Arab Center for Research and Policy Studies is an independent research institute
and think tank for the study of history and social sciences, with particular emphasis on
the applied social sciences.
The Center’s paramount concern is the advancement of Arab societies and states, their
cooperation with one another and issues concerning the Arab nation in general. To that
end, it seeks to examine and diagnose the situation in the Arab world - states and
communities- to analyze social, economic and cultural policies and to provide political
analysis, from an Arab perspective.
The Center publishes in both Arabic and English in order to make its work accessible to
both Arab and non-Arab researchers.
Arab Center for Research and Policy Studies
PO Box 10277
Street No. 826, Zone 66
Doha, Qatar
Tel.: +974 44199777 | Fax: +974 44831651
www.dohainstitute.org
Table of Contents


THE SHALE TECHNOLOGY REVOLUTION
1
Abstract
The “shale technology revolution”, which began in the United States, will and already is
having significant consequences for the GCC countries1 in terms of energy and geo-
political issues. This paper attempts to consider what those consequences are and
might be in the future. It begins by discussing the nature of this “shale technology
revolution” and then considers how the impact on the United States has already begun
to influence directly global energy markets and geo-politics. It also considers how the
revolution may indirectly influence global energy markets and geo-politics in the future,
and how these influences may have relevance for the GCC countries.
1 These are Bahrain, Kuwait, Oman, Qatar, Saudi Arabia, and the United Arab Emirates.

ARAB CENTER FOR RESEARCH AND POLICY STUDIES
2
What is the “Shale Technology Revolution”?
The “shale technology revolution” has undoubtedly been a major game changer in
global energy. Although it has only attracted attention relatively recently, in reality it
has been over 30 years in the making (Stevens, 2010, 2012). The two main technical
components of the revolution are extended reach horizontal drilling and multi-stage
hydraulic fracturing. Neither are “new” technologies. Horizontal drilling was developed
in the United States in the 1930s and the first well was hydraulically fracked2 in the
United States in 1947 (Zuckerman, 2013). Two other technologies are also contributing
to the revolution. The first is three-dimensional and four-dimensional seismic, and the
second is coil tube drilling. The seismic allow operators to identify deposits of shale gas
or shale oil more precisely and to target the “sweet spots”3. Coiled tube drilling is where
the drill bit is attached to a flexible cable and liquid nitrogen, rather than conventional
drilling muds, lubricates the drilling. The drill bit is directed by an operator observing a
3-D map on the computer and can be manipulated to within a few feet several miles
away.
Several points need to be emphasized about this technology revolution. First, as already
indicated, it is not “new”. While attention has focused on shale technology in the last
few years, due to the rise of domestic shale production in the United States, the
revolution has been in the making for years. Cynics describe this as an “over-night
sensation that has taken 30 years”. Second, the government has played a significant
role in its development. In the early 1980s, the United States’ Government, aware of
predictions of anticipated serious declines in domestic gas production, began to pour
millions of dollars into basic scientific research covering low permeability operations for
shale plays. The results were then made available to the industry, owners and
operators, who then took them and used them in the development of their operations
(Zuckerman, 2013). This was a crucial kick-start to the process of producing shale gas
2 The industry, in an attempt to distance itself from the negative connotations of “fracking”, either spell it
“fraccing” or refer to “well stimulation” which is supposed to sound much more attractive.
3 The shale technology revolution is spawning its own jargon. For example, what in conventional oil and
gas are called “fields” have become in shale jargon “plays”.
THE SHALE TECHNOLOGY REVOLUTION
3
and oil since private companies would not invest in such fundamental scientific
research4.
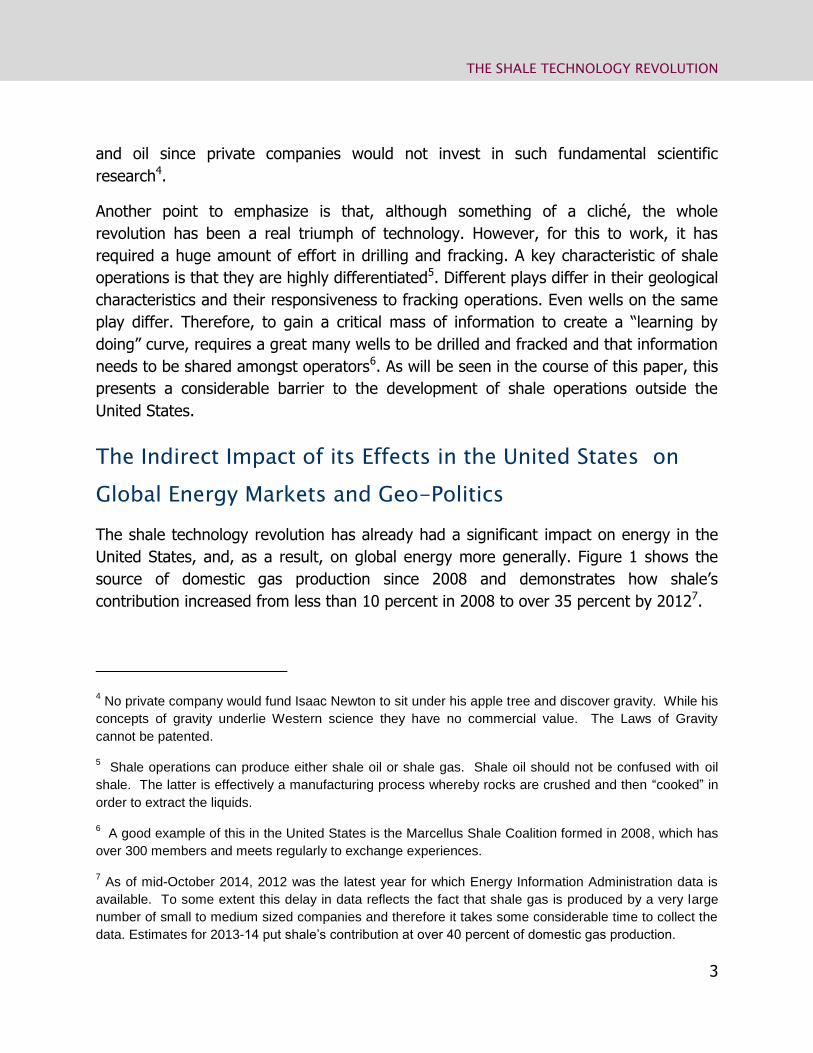
Another point to emphasize is that, although something of a cliché, the whole
revolution has been a real triumph of technology. However, for this to work, it has
required a huge amount of effort in drilling and fracking. A key characteristic of shale
operations is that they are highly differentiated5. Different plays differ in their geological
characteristics and their responsiveness to fracking operations. Even wells on the same
play differ. Therefore, to gain a critical mass of information to create a “learning by
doing” curve, requires a great many wells to be drilled and fracked and that information
needs to be shared amongst operators6. As will be seen in the course of this paper, this
presents a considerable barrier to the development of shale operations outside the
United States.
The Indirect Impact of its Effects in the United States on
Global Energy Markets and Geo-Politics
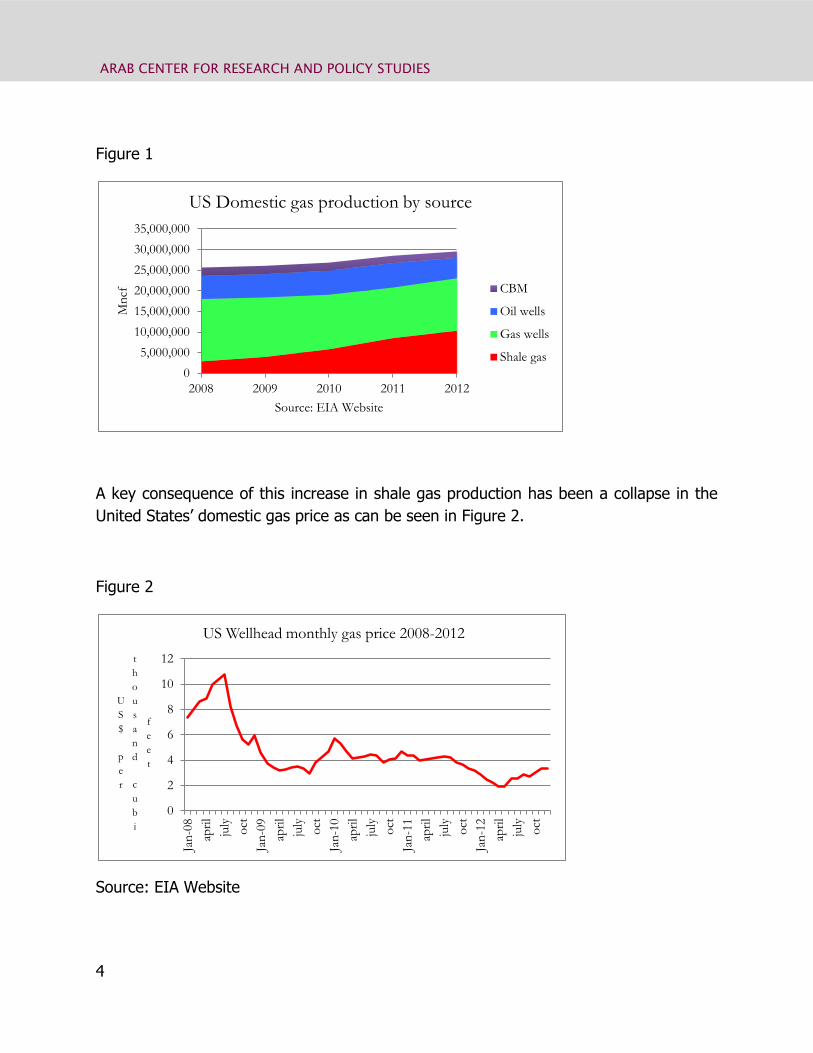
The shale technology revolution has already had a significant impact on energy in the
United States, and, as a result, on global energy more generally. Figure 1 shows the
source of domestic gas production since 2008 and demonstrates how shale’s
contribution increased from less than 10 percent in 2008 to over 35 percent by 20127.
4 No private company would fund Isaac Newton to sit under his apple tree and discover gravity. While his
concepts of gravity underlie Western science they have no commercial value. The Laws of Gravity
cannot be patented.
5 Shale operations can produce either shale oil or shale gas. Shale oil should not be confused with oil
shale. The latter is effectively a manufacturing process whereby rocks are crushed and then “cooked” in
order to extract the liquids.
6 A good example of this in the United States is the Marcellus Shale Coalition formed in 2008, which has
over 300 members and meets regularly to exchange experiences.
7 As of mid-October 2014, 2012 was the latest year for which Energy Information Administration data is
available. To some extent this delay in data reflects the fact that shale gas is produced by a very large
number of small to medium sized companies and therefore it takes some considerable time to collect the
data. Estimates for 2013-14 put shale’s contribution at over 40 percent of domestic gas production.
ARAB CENTER FOR RESEARCH AND POLICY STUDIES
4
Figure 1
A key consequence of this increase in shale gas production has been a collapse in the
United States’ domestic gas price as can be seen in Figure 2.
Figure 2
Source: EIA Website
0
5,000,000
10,000,000
15,000,000
20,000,000
25,000,000
30,000,000
35,000,000
2008 2009 2010 2011 2012
Mn
cf
Source: EIA Website
US Domestic gas production by source
CBM
Oil wells
Gas wells
Shale gas
0
2
4
6
8
10
12
Jan
-08
apri
l
july
oct
Jan
-09
apri
l
july
oct
Jan
-10
apri
l
july
oct
Jan
-11
apri
l
july
oct
Jan
-12
apri
l
july
oct
U
S
$
p
e
r
t
h
o
u
s
a
n
d
c
u
b
i
f
e
e
t
US Wellhead monthly gas price 2008-2012
THE SHALE TECHNOLOGY REVOLUTION
5
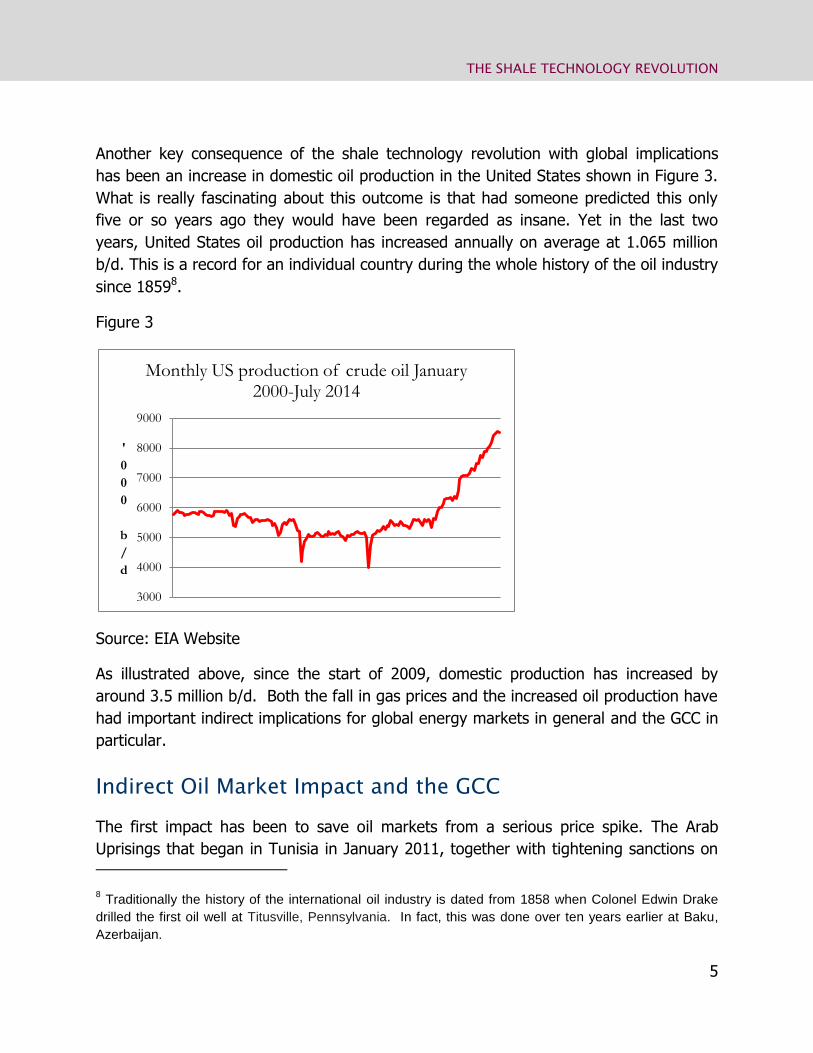
Another key consequence of the shale technology revolution with global implications
has been an increase in domestic oil production in the United States shown in Figure 3.
What is really fascinating about this outcome is that had someone predicted this only
five or so years ago they would have been regarded as insane. Yet in the last two
years, United States oil production has increased annually on average at 1.065 million
b/d. This is a record for an individual country during the whole history of the oil industry
since 18598.
Figure 3
Source: EIA Website
As illustrated above, since the start of 2009, domestic production has increased by
around 3.5 million b/d. Both the fall in gas prices and the increased oil production have
had important indirect implications for global energy markets in general and the GCC in
particular.
Indirect Oil Market Impact and the GCC
The first impact has been to save oil markets from a serious price spike. The Arab
Uprisings that began in Tunisia in January 2011, together with tightening sanctions on
8 Traditionally the history of the international oil industry is dated from 1858 when Colonel Edwin Drake
drilled the first oil well at Titusville, Pennsylvania. In fact, this was done over ten years earlier at Baku,
Azerbaijan.
3000
4000
5000
6000
7000
8000
9000
'
0
0
0
b
/
d
Monthly US production of crude oil January 2000-July 2014
ARAB CENTER FOR RESEARCH AND POLICY STUDIES
6
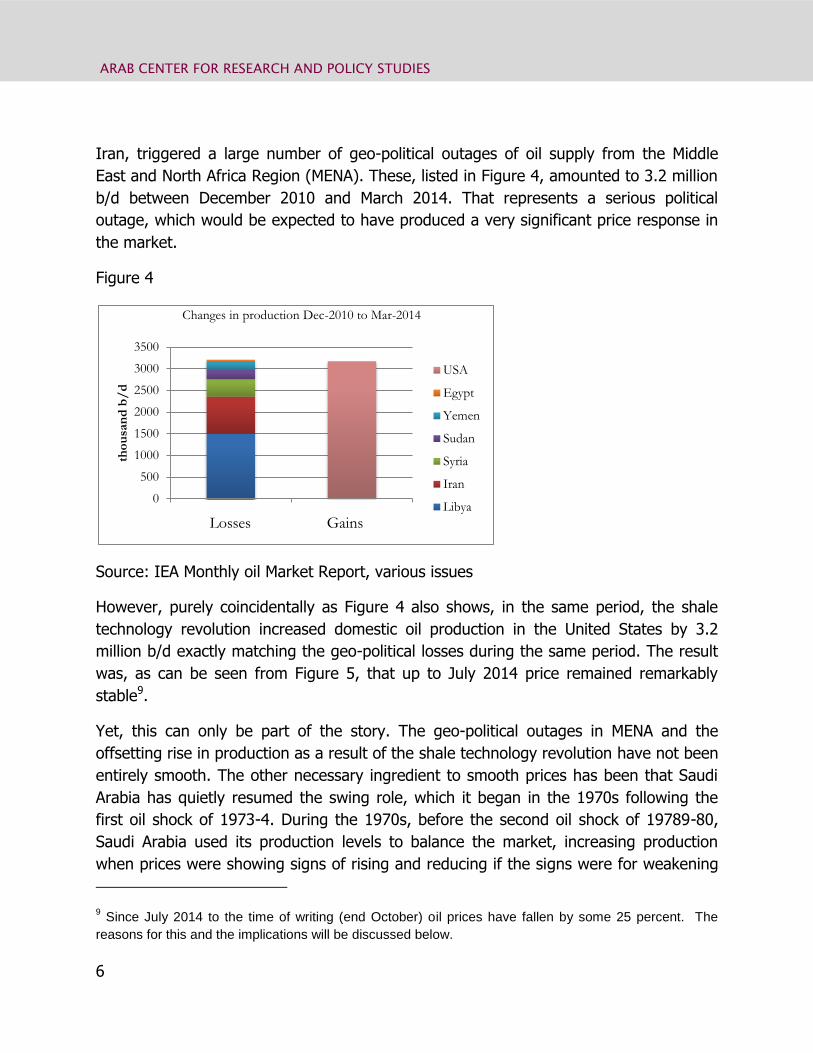
Iran, triggered a large number of geo-political outages of oil supply from the Middle
East and North Africa Region (MENA). These, listed in Figure 4, amounted to 3.2 million
b/d between December 2010 and March 2014. That represents a serious political
outage, which would be expected to have produced a very significant price response in
the market.
Figure 4
Source: IEA Monthly oil Market Report, various issues
However, purely coincidentally as Figure 4 also shows, in the same period, the shale
technology revolution increased domestic oil production in the United States by 3.2
million b/d exactly matching the geo-political losses during the same period. The result
was, as can be seen from Figure 5, that up to July 2014 price remained remarkably
stable9.
Yet, this can only be part of the story. The geo-political outages in MENA and the
offsetting rise in production as a result of the shale technology revolution have not been
entirely smooth. The other necessary ingredient to smooth prices has been that Saudi
Arabia has quietly resumed the swing role, which it began in the 1970s following the
first oil shock of 1973-4. During the 1970s, before the second oil shock of 19789-80,
Saudi Arabia used its production levels to balance the market, increasing production
when prices were showing signs of rising and reducing if the signs were for weakening
9 Since July 2014 to the time of writing (end October) oil prices have fallen by some 25 percent. The
reasons for this and the implications will be discussed below.
0
500
1000
1500
2000
2500
3000
3500
tho
usa
nd
b/
d
Losses Gains
Changes in production Dec-2010 to Mar-2014
USA
Egypt
Yemen
Sudan
Syria
Iran
Libya
THE SHALE TECHNOLOGY REVOLUTION
7
prices. After the second oil shock, it tried to resume this role to defend the high prices
generated by the Iranian Revolution and the Iran-Iraq War. However, faced with
weakening demand and increasing supply as a result of the much higher oil prices in
the 1970’s, Saudi production simply fell. In 1980 Saudi Arabia produced 10.27 million
b/d. By the summer of 1985 this had fallen to 2.6 million b/d. The result was a change
in policy to move away from defending price and instead, producing to quota at the
same time as adopting netback pricing. This presaged the 1986 price collapse.
Inevitably, this generated very unhappy memories, and so Saudi Arabia was reluctant
to repeat the exercise. However, despite these painful memories they resumed the role
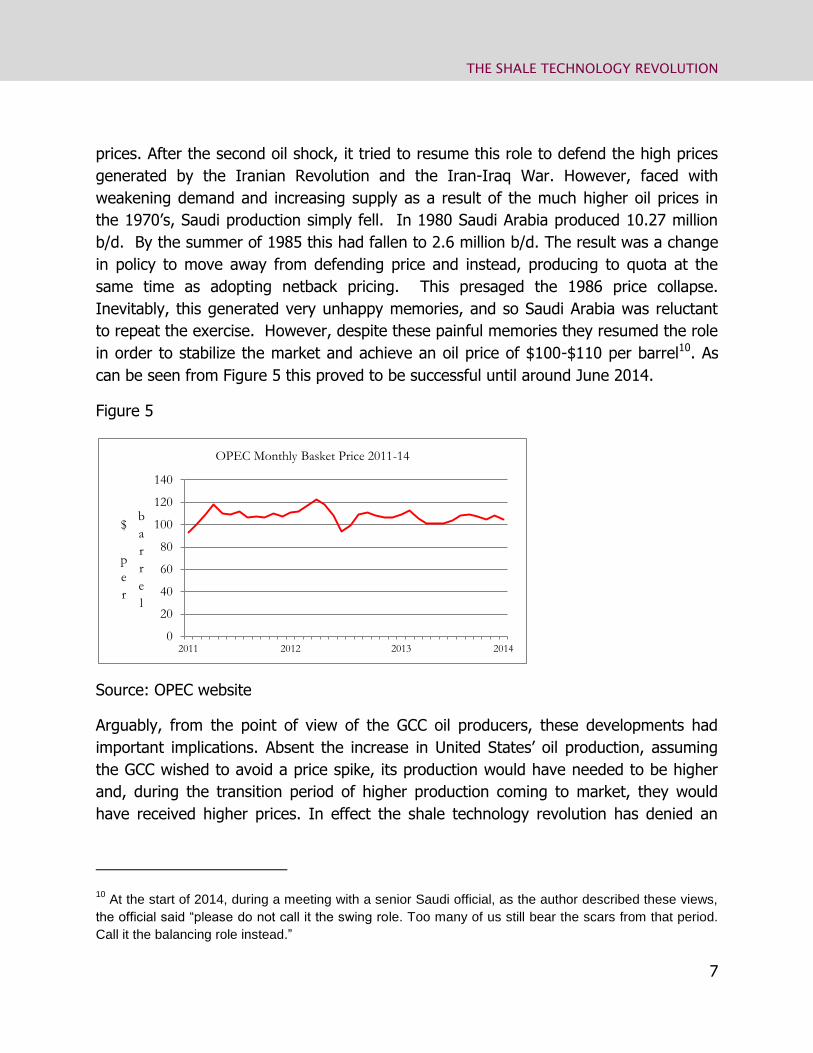
in order to stabilize the market and achieve an oil price of $100-$110 per barrel10. As
can be seen from Figure 5 this proved to be successful until around June 2014.
Figure 5
Source: OPEC website
Arguably, from the point of view of the GCC oil producers, these developments had
important implications. Absent the increase in United States’ oil production, assuming
the GCC wished to avoid a price spike, its production would have needed to be higher
and, during the transition period of higher production coming to market, they would
have received higher prices. In effect the shale technology revolution has denied an
10 At the start of 2014, during a meeting with a senior Saudi official, as the author described these views,
the official said “please do not call it the swing role. Too many of us still bear the scars from that period.
Call it the balancing role instead.”
0
20
40
60
80
100
120
140
2011 2012 2013 2014
$
p
e
r
b
a
r
r
e
l
OPEC Monthly Basket Price 2011-14

ARAB CENTER FOR RESEARCH AND POLICY STUDIES
8
important revenue windfall to those in the GCC with spare capacity – predominantly
Saudi Arabia but also Abu Dhabi and to a lesser extent Kuwait.
Another indirect impact relates to an oil market issue that has been labeled “OPEC’s
dilemma” (Stevens & Hulbert, 2012). The idea is a simple one. Since the Arab Uprisings
began in Tunisia11 at the start of 2011, the Arab oil producers have needed higher oil
revenues to assuage their populations through the provision of jobs and subsidies. This
requires higher oil prices. Figure 6 provides estimates of the higher prices needed based
upon work done by Apicorp (Aissaoui, 2014). To put this in perspective, in 2008 it was
estimated that the break-even price for Saudi Arabia was some $40 - $50 per barrel.
Figure 6
Figure 7 illustrates the issue for Saudi Arabia. In the 1990s, the Saudi Government
slowed the growth in jobs for Saudi nationals in the public sector in the hope that, with
a programme of Saudiization, the private sector would generate more employment. This
failed to happen and unemployment among nationals began to rise. As the first decade
of the 21st Century progressed, the government policy changed and more public sector
11 These are popularly referred to as “The Arab Spring”. However, those actively involved protesting on
the streets and in the squares hate this term. They regard it as a Western media construct that also hints
at the failure associated with the Prague Spring when Russian tanks crushed the Czechoslovak uprisings
in 1968. They prefer the term either Arab Revolution or Arab Uprisings. This author, regarding it as too
early to tell if it is a revolution, prefers the term Arab Uprising. This term also carries resonance of George
Antonius’s famous work The Arab Awakening, published in 1939.
020406080
100120140160
US$
per
bar
rel
Source: Ali Aissaoui Apicorp Economic Commentary Vol 9 N0. 708 July- August 2014
OPEC Median Budgetary Break-Even Price

THE SHALE TECHNOLOGY REVOLUTION
9
jobs were offered to try to alleviate the growing problem of unemployment amongst
Saudi nationals, a process that significantly accelerated after 2010. The implications of
this for current spending can be seen in Figure 712.
Figure 7
Source: Sama Annual Reports, various issues
However, higher oil prices driven by the imperative of higher levels of spending by
MENA/GCC oil producing governments lead inevitably to market feedback loops. Thus it
will lead to demand destruction. Already, as 2014 progresses, forecasts of oil demand
are being trimmed. For example, since August 2013 the IEA has reduced its oil demand
forecast for 2014 from 92.7million b/d to 92.4 million b/d. Other forecasters have
produced similar reductions in expected demand growth.
Higher prices will also increase non-OPEC supply, and it is here where the shale
technology revolution is having its most spectacular impact with the dramatic increase
in oil production in the United States as illustrated by Figure 3.
This global oil market situation described by “OPEC’s Dilemma” is clearly unsustainable.
It is impossible to have a high price market needed for political survival with weakening
demand and increasing supply for any length of time. The only way this can be
sustained is if Saudi Arabia continues to play a “balancing role” in the market. While the
12 This growth in state current spending was reinforced as existing employees were offered large
increases in salaries in 2011.
100000
300000
500000
700000
900000
1100000
1992
1994
1996
1998
2000
2002
2004
2006
2008
2010
2012
Saudi Arabia Public Sector employment and current government spending 1995-2013
Current spending(Mn SR)
Saudis employed(thousands)
ARAB CENTER FOR RESEARCH AND POLICY STUDIES
10
Call on OPEC fluctuates this is not difficult. However, if the Call shows a determined
downward trend, the question then arises on how long Saudi Arabia can afford to
watch its financial reserves fall as its falling production, required to balance the market,
brings down oil revenues. It effectively seems like a re-run of the period 1980-85 when
Saudi Arabia was eventually forced to drop the “swing role” which in turn triggered the
1986 price collapse.
There are of course differences. To start with, there were no significant paper markets
in the early 1980s, implying prices were less volatile. Also, the pain involved for Saudi
Arabia in the early 1980s means lessons will have been learnt. However, the current
Saudi response to the fall in prices seen since the start of August 201413 appears to be
somewhat confused. On the one hand, there has been a cut in production of 300,000
b/d in August, followed by a further cut in sales of another 300,000 b/d (but not in
production) in September14, followed by the shutting in of the Khafji field in the Neutral
Zone which had been producing 300,000 b/d15. On the other hand, the recent fall in
prices has also elicited a response that Saudi Arabia is content to see lower prices for
some time to come16. All this led to speculation regarding Saudi Arabia’s motives and
the idea that falling prices have been deliberately engineered by Saudi Arabia. It is here
where conspiracy theorists are having a field day. In this regard, there are two main
schools. Both agree Saudi Arabia would welcome lower prices that will damage Iraq and
Iran. Although it also hurts Saudi revenue, they have a considerable financial cushion.
Neither Iraq nor Iran has any financial cushion. The schools then diverge. One school
argues that the US has encouraged the Saudis, given that lower prices hurt Russia in
the context of Ukraine. The other school argues lower prices damage the US since it
inhibits the shale revolution that (allegedly) depends on high prices to keep it going.
This school argues this suits the Al Saud. Relations with Washington have been
13 At the start of August the OPEC basket stood at $105 per barrel. By mid-October this had fallen to
$82.
14 There is some confusion over this announced cut. Bloomberg on the 24
th October announced the cut
in “supply” to international markets of 382,000 b/d/ in response to increased domestic demand from new
refinery capacity
15 The official reason given by Saudi Arabia was that there were environmental concerns about the field
that need to be addressed. However, it appears that Kuwait, at least initially, was less than happy with
this decision although they have subsequently denied a rift.
16 It is not clear just how “official” this view of the market situation is.
THE SHALE TECHNOLOGY REVOLUTION
11
distinctly cool since the fall of Mubarak, events in Syria, and the Iranian nuclear deal. It
also (possibly) undermines a significant competing source of oil.
The truth of the situation was hard to fathom. Since prices began to fall in summer, the
Saudi response as indicated above has been to cut sales to the market. However, at the
same time, they have been cutting prices leading to speculation about a “price war”.
All this uncertainty has not helped because mixed messages, many of them
“anonymous”, are emerging from the Saudi oil sector that normally speaks with a clear
unambiguous voice. This is reinforced by the suggestion that the oil sector, as with
other sectors, is trying to position itself for a change of leadership when the Al Saud are
forced to jump a generation in the succession.
At the end of November, OPEC kept its formal production level of 30 million b/d in what
was a clearly oversupplied market. This controversial decision was taken because to
have cut production would cede market share to the growing production flooding out of
the USA. The immediate result was a significant fall in oil prices.
The “official” logic behind the decision was twofold. First, weak demand was temporary
because of slow economic growth and would recover next year. Second, lower prices
would shut in the high cost production from the shale technology revolution. In other
words, current prices were too low and the market, allowed to operate, would rectify
this. Many (rightly) saw this decision as a significant landmark in global oil markets. In
effect, OPEC had ceded any semblance of control over the market and prices, instead
launching the oil price onto a sea governed by market forces.
Those with knowledge of oil market history will see this as a very dangerous gamble
based on two serious misconceptions. After the oil shocks of the 1970’s, the market was
in a similar position as now. Demand was falling and non-OPEC supply was rising. In
response, to defend prices, OPEC (but effectively Saudi Arabia) cut production because
the fall in demand was seen as temporary as a result of global recession and would
shortly recover. When the oil price eventually collapsed in 1986, the OPEC view was
that lower prices would quickly reverse as they would shut-in high cost production,
specifically in the North Sea. These views in the 1980s were conceptual mistakes still
relevant today and likely to undermine OPEC’s current strategy. The mistakes are a
failure to understand the difference between an income effect and a price effect on
demand and the failure to understand the difference between a break-even price and a
shut-in price.

ARAB CENTER FOR RESEARCH AND POLICY STUDIES
12
While some of the fall in demand in the 1980s was because of the recession (an income
effect), some was due also to genuine demand destruction as the result of much higher
prices (a price effect). The significance was (and is) recession induced lower demand
reverses itself when the global economy recovers but demand destruction was (and is)
permanent. Today, part of the fall in oil demand is because oil prices have inexorably
risen (from $32.40 in 2002 to $108.66 in constant 2013$). Furthermore, many sources
of recent oil demand growth, notably China and India, have been moving from
subsidized domestic oil prices to higher border based prices. OPEC’s expectations of
quickly recovering demand may be optimistic as they were in the early 1980s.
OPEC is hoping lower break-even prices will reduce shale production. The break-even
price is what investors consider when deciding whether to invest in new producing
capacity. Various estimates for the US shale break-even price have being bandied
around ($60-$80 per barrel). Most are far too high because they ignore the fact that
the recent boom in shale operations has grossly inflated project costs. If investment in
new capacity slows then project costs, and hence the break-even price, will fall.
However, in terms of OPEC’s current strategy, the break-even price is the wrong metric.
What matters in the next few years is the shut-in price. This is the price where the
operator cannot cover variable costs and therefore stops producing from existing wells.
Post the 1986 price collapse, a number of stripper wells in USA (with high variable
costs) did close but the loss of production was minimal. North Sea production, which
had been OPEC’s prime target, was hardly affected and actually increased in 1987. The
current level of shut-in price for shale oil is again debatable but almost certainly is well
below $40 per barrel. Thus it will be some time before existing shale oil production falls
even if prices stay low. Should the oil price fall towards variable costs threatening shale
supply it will be the OPEC producers who must blink first from the pain and try to take
back control of the market, if they can.
Indirect Gas Market Impact and the GCC
The main indirect way the shale technology revolution has impacted global gas markets
is through its impact on LNG markets. In the EIA’s 2006 Energy Outlook, the projection
was that because of declining domestic gas production, the United States’ import of
LNG would rise from virtually nil to 4 trillion cubic feet by 2030. This amounts to the
equivalent output of six Trinidad & Tobago’s or four Indonesia’s. It is a lot of LNG. In
anticipation of this new market, a great many gas producers began to build new LNG
capacity. However, as the domestic production of shale gas rose, this new capacity

THE SHALE TECHNOLOGY REVOLUTION
13
aimed at the American market effectively became surplus to requirements leading to
something of a glut in potential LNG supplies. This was reinforced as the global financial
crisis and subsequent recession generally led to a decline in gas demand, with OECD
gas demand falling by 2.75 percent in 2009 over 2008. The impact of this on the GCC is
fairly limited because, as will be discussed below, only Qatar among the GCC States
might have serious ambitions for more LNG projects and this would seem unlikely given
the current moratorium on further gas projects. However, the resulting weakening of
the LNG market may encourage those GCC countries who may be interested in
importing LNG, most obviously Kuwait, to take advantage of what has become a buyers’
market.
Possible Direct Impacts of the Shale Revolution on Energy
and Geo-Politics Relevant to the GCC Countries
The direct effects of the shale technology revolution on global energy markets, and
hence the GCC, will depend in large part upon the ability of the United States’
experience with shale to be replicated elsewhere. To consider this, it is useful to ask
why the United States experienced a shale revolution in the first place. There were in
place a number of characteristics that collectively explain the development of shale
(Stevens, 2010; 2013). These are listed in Table 1
Table 1 Necessary Conditions for the shale revolution in the USA
1. Favorable geology
2. Lots of drill core data to help identify “sweet spots”
3. Weak environmental regulation for fracking
4. Tax credits + Intangible drilling cost expensing
5.Property rights to the landowner

ARAB CENTER FOR RESEARCH AND POLICY STUDIES
14
6.Pipeline access easy –large network + common carriage
7 Selling gas into a “commodity supply” market very easy
8. Driven by small entrepreneurial companies
9. Dynamic and competitive service industry
10. Population familiar with oil and gas operations
11. Licensing large areas with vague work programs
12. Significant government investment in basic R & D
13. High liquids content in the gas
14. Started by rising gas prices
15.Access to risk capital on a large scale
16. Easy access to water
17. Easy access to futures markets to hedge price risk
Source: Stevens, 2013
The key underlying the impact of these characteristics was the fact that the sector in
the United States was dynamic and competitive in a private sector environment. Trying
to replicate these conditions elsewhere will prove to be extremely difficult and it is
unlikely that other areas of the world will be able to replicate such conditions in the
near term. Over time however, it is likely that the shale technology revolution will boost
THE SHALE TECHNOLOGY REVOLUTION
15
global oil supplies even if it is a more gradual process than experienced in the United
States.
The area this will initially influence will be how long OPEC’s Dilemma will continue since
this will be influenced by the response of Non-OPEC supply to higher prices. The
greater the supply response, the sooner high prices will be undermined. At the time of
writing, this begins to look to be sooner rather than later. Thus the recent path of oil
prices show a dramatic fall. In September 2013, the OPEC basket averaged $108.73. In
July 2014 the average was $105.61 but by mid-October 2014 the price averaged
$88.06.
In the past the oil price has been rescued because Saudi Arabia and Iran have been
able to broker a deal for the whole of OPEC that lasted long enough for oil prices to
recover. Whether in the current circumstances, with Saudi Arabia and Iran at
loggerheads over the nuclear issue and the situation in Syria and Iraq, such
collaboration could be repeated must be regarded as uncertain. Faced with a collapse in
oil prices, the main GCC players have in the last few years been able to accumulate
large financial surpluses and could therefore “survive” for longer than any of the other
OPEC members. Estimates suggest Saudi Arabia has reserves amounting to $745 billion.
Figure 8
Source: BP Statistical Review of World Energy 2014
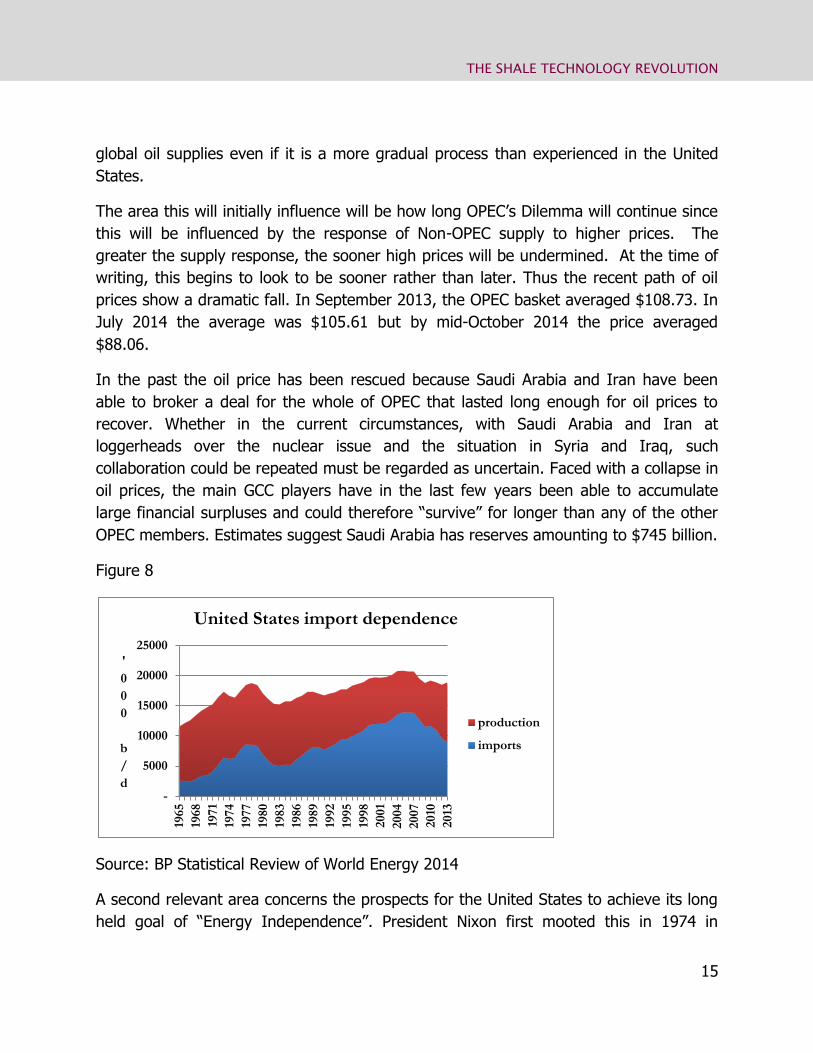
A second relevant area concerns the prospects for the United States to achieve its long
held goal of “Energy Independence”. President Nixon first mooted this in 1974 in
-
5000
10000
15000
20000
25000
1965
1968
1971
1974
1977
1980
1983
1986
1989
1992
1995
1998
2001
2004
2007
2010
2013
'
0
0
0
b
/
d
United States import dependence
production
imports

ARAB CENTER FOR RESEARCH AND POLICY STUDIES
16
response to the Arab Oil embargo and the first oil shock at a time when the country
faced rising oil imports as can be seen in Figure 8.
Figure 9 illustrates how two of the five scenarios from the Energy Information
Administration suggest that Energy Independence could be a reality.
Figure 9
Source: EIA Energy Outlook May 2014
There are many who question the viability of the United States reducing its oil imports
to zero. Specifically, this revolves round the sustainability of the shale/tight oil
revolution. Several factors throw doubt on continued increases in domestic oil
production17. First, there are concerns over the apparently rapid depletion rates on
shale wells, the implication being that more frequent fracking will inevitably increase
production costs. Second there are concerns over the economics of shale oil production
in a world of falling oil prices. It is clearly difficult to arrive at how low oil prices must
fall before production is shut in. Various estimates are being suggested as to what the
“break even” prices might be. However, such numbers miss a key point. Costs are as
they are because there has been a boom in shale operations over the last few years.
The classic often quoted example is that truck drivers in North Dakota can command
17 It is important to note that in the two scenarios indicating zero imports, around half the reduction in
imports is accounted for by improved energy efficiency reducing demand growth. It is not just a response
to the shale technology revolution.
-20
-10
0
10
20
30
40
50
60
70
200
5
200
8
201
1
201
4
201
7
202
0
202
3
202
6
202
9
203
2
203
5
203
8Net import share of liquid fuels in five EIA cases
2005-2040 (percent)
Reference
High Net Imports
High Oil and Gas
Resource
Low Oil and Gas
Resource
Low/No Net
Imports
THE SHALE TECHNOLOGY REVOLUTION
17
over $200,000 per year. However, if the boom falters, they would clearly be willing to
work for significantly less. This is true of other services that have been pushing up the
cost of shale oil production. A third reason why the prospects for a continuation of the
shale revolution might be in doubt is that much of the operations have been built upon
a mountain of debt. The result is that many of the small to medium sized operators are
very highly leveraged. When interest rates rise, as they inevitably will, many operators
will go bankrupt. At the very least this will lead to a large number of orphaned wells18.
This leads to the final grounds for concern over the sustainability of shale operations in
the United States. To date there have been relatively limited protests over the potential
environmental damage associated with shale operations. Such damage relates to
pollution of water tables, the creation of “earthquakes” and fugitive methane emissions
in a world concerned about levels of greenhouse gas emissions and climate change. It
is perfectly reasonable to anticipate this environmental “holiday” coming to an end,
resulting in a dramatic rise in local community opposition of the sort that has been
seriously inhibiting shale operations in Europe19. Such an environmental backlash would
be greatly aggravated in a world where orphaned wells become an issue.
However, for the sake of argument, this paper assumes there will be a move towards
much lower oil imports. Such a trend could have serious geo-political and economic
implications for the GCC countries.
First, there is the fact that around half of the United States’ current account deficit is
accounted for by oil imports. Thus as oil imports fall, so too does the trade deficit. This
will be reinforced because as coal is being pushed out from under the boiler by low
domestic gas prices, it is being exported from the United States. These increased coal
exports will further reduce the trade deficit. This will clearly have implications for the
value of the dollar although what these may be is far from clear. However, given the
fact that much of the overseas assets held by the GCC countries are in US dollars and
indeed a number of GCC currencies, notably the Saudi Riyal, which are directly linked to
the value of the dollar, clearly this will carry important albeit uncertain implications.
Second, there is the expectation that lower domestic energy costs will lead to a revival
in the petrochemical industry. All the signs are that this is already happening. This
18 These are wells for which no one will take responsibility in terms of decommissioning.
19 The “holiday” was kicked off in 2005 when the Energy Act explicitly excluded hydraulic fracturing from
the EPA’s Clean Water Act, the so-called “Cheney/Haliburton loophole”.
ARAB CENTER FOR RESEARCH AND POLICY STUDIES
18
would directly compete with the GCC’s industrialization strategy that is largely based
upon moving down the petrochemical value chain and has been a central tenet of the
GCC’s industrialization strategy for many decades. This could create tensions with the
United States, not least in the context of the WTO where there are likely to be claims
and counter claims regarding the “subsidization” of petrochemical feedstock and
energy. There is also the fact that the GCC will now have to compete with the United
States for inward foreign investment into petrochemicals.
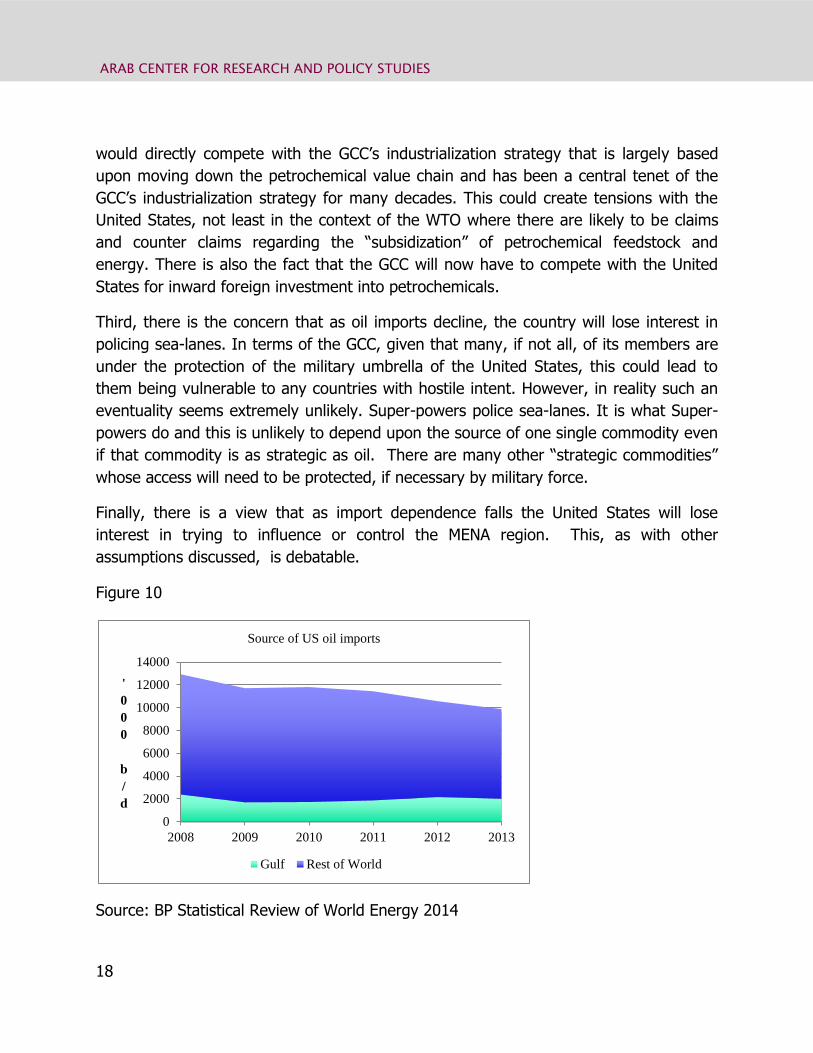
Third, there is the concern that as oil imports decline, the country will lose interest in
policing sea-lanes. In terms of the GCC, given that many, if not all, of its members are
under the protection of the military umbrella of the United States, this could lead to
them being vulnerable to any countries with hostile intent. However, in reality such an
eventuality seems extremely unlikely. Super-powers police sea-lanes. It is what Super-
powers do and this is unlikely to depend upon the source of one single commodity even
if that commodity is as strategic as oil. There are many other “strategic commodities”
whose access will need to be protected, if necessary by military force.
Finally, there is a view that as import dependence falls the United States will lose
interest in trying to influence or control the MENA region. This, as with other
assumptions discussed, is debatable.
Figure 10
Source: BP Statistical Review of World Energy 2014
0
2000
4000
6000
8000
10000
12000
14000
2008 2009 2010 2011 2012 2013
'
0
0
0
b
/
d
Source of US oil imports
Gulf Rest of World
THE SHALE TECHNOLOGY REVOLUTION
19
First, it assumes that the foreign policy of the United States has been driven largely by
oil. It is true that since the end of World War II there have been occasions when oil
has played a role in driving policy, most recently following Iraq’s invasion of Kuwait in
1990 when there was a real fear in Washington that the Iraqi forces would continue
further south into the Eastern Province of Saudi Arabia. Generally, however, other
drivers determine policy in the MENA region, most obviously the support of successive
Administrations for Israel. Also in recent years, relatively little crude oil has come from
the Middle East into the United States as can be seen from Figure 1020. However, the
most convincing argument for continued American interest in the region, in terms of oil,
concerns the nature of international oil markets. The oil market is “one big pool”. Thus
if geo-political events in (say) Saudi Arabia cause the oil price at Ras Tanura to be
$200 per barrel, the price will also be $200 per barrel (give or take) in Houston. Thus
the United States will retain an interest in ensuring stability in the Middle East if only to
mitigate the impact of high and volatile oil prices on the United States’ and global
economies.
All this analysis of course assumes that China believes that the United States will
continue to police sea-lanes and seek to influence geo-politics in the region. If the
Chinese were to doubt this then they would seek to some degree to police sea-lanes21
and also to seek political influence in the Middle East. This could of course lead to the
sort of client-patron relations between the super-powers and the states of the region of
the sort that characterized the Cold War between the United States and the Soviet
Union, potentially leading to all sorts of geo-political implications for the GCC and its
position in the region.
Figure 11
20 Much of the oil imported has come from Saudi Arabia at the insistence of the Kingdom despite
opposition from Saudi Aramco’s American joint venture partners who argue they can get their crude
slates far cheaper from the Western Hemisphere. The result has been that Saudi Aramco has had to
offer discounts on the crude price.
21 China is already in the process of developing a blue water naval capability.
ARAB CENTER FOR RESEARCH AND POLICY STUDIES
20
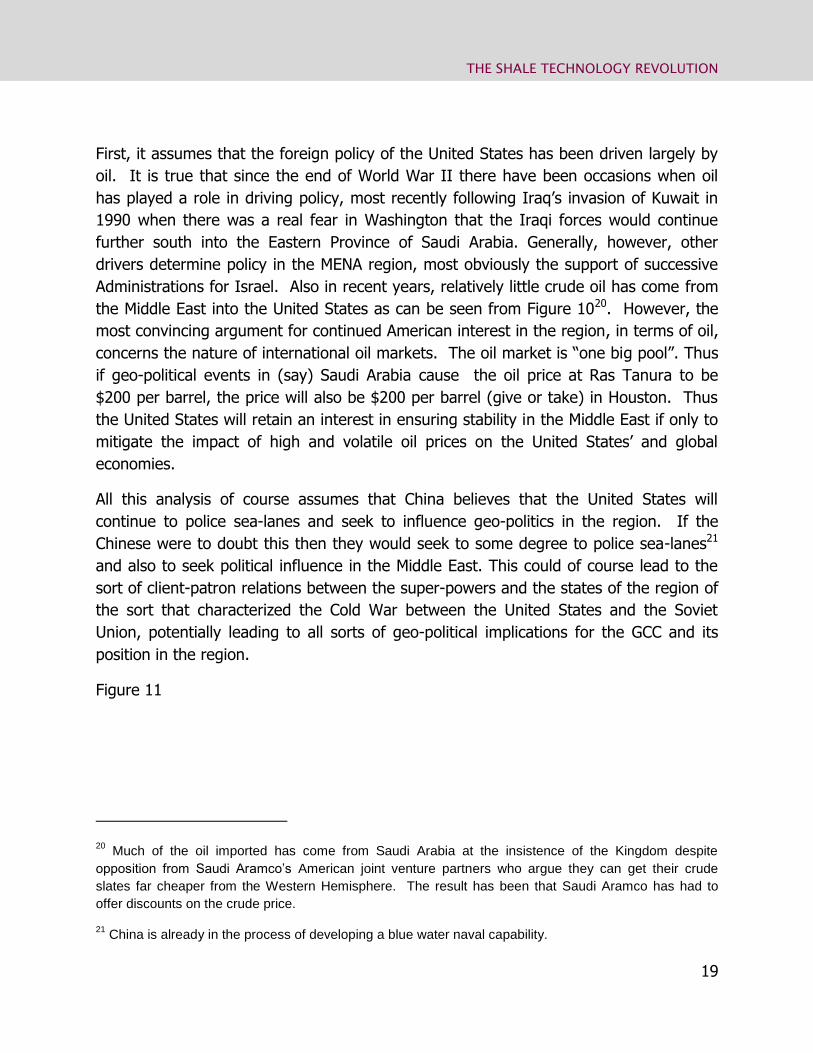
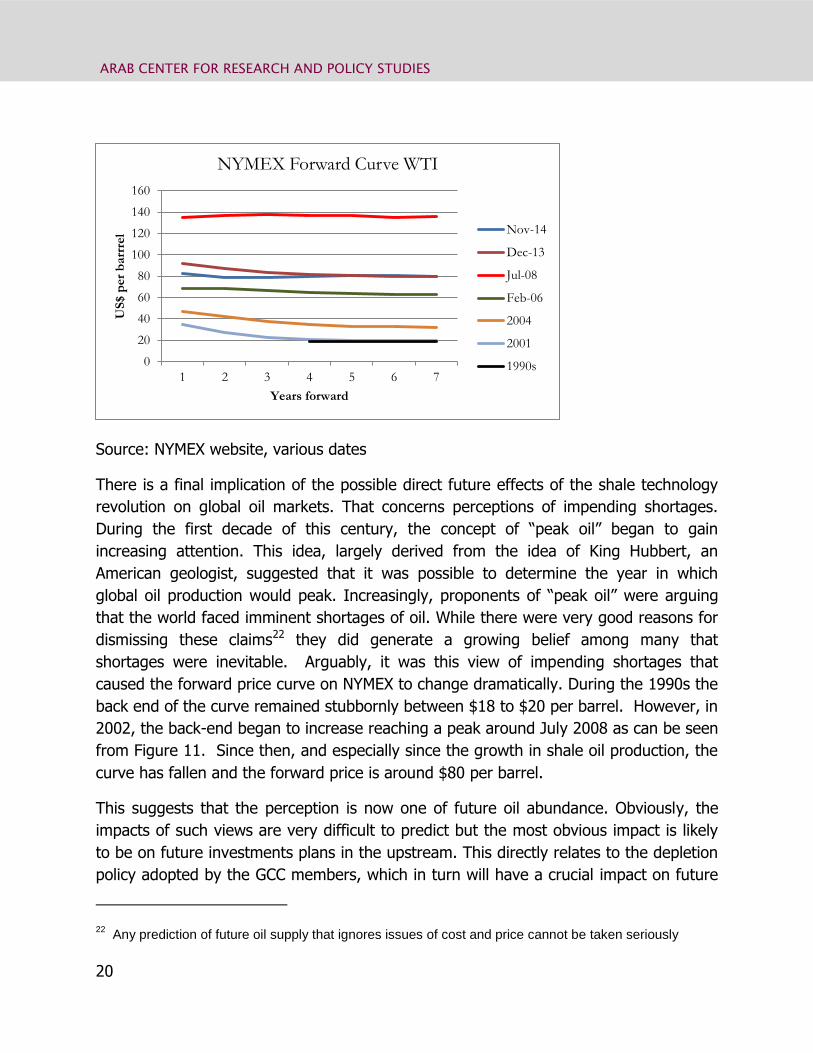
Source: NYMEX website, various dates
There is a final implication of the possible direct future effects of the shale technology
revolution on global oil markets. That concerns perceptions of impending shortages.
During the first decade of this century, the concept of “peak oil” began to gain
increasing attention. This idea, largely derived from the idea of King Hubbert, an
American geologist, suggested that it was possible to determine the year in which
global oil production would peak. Increasingly, proponents of “peak oil” were arguing
that the world faced imminent shortages of oil. While there were very good reasons for
dismissing these claims22 they did generate a growing belief among many that
shortages were inevitable. Arguably, it was this view of impending shortages that
caused the forward price curve on NYMEX to change dramatically. During the 1990s the
back end of the curve remained stubbornly between $18 to $20 per barrel. However, in
2002, the back-end began to increase reaching a peak around July 2008 as can be seen
from Figure 11. Since then, and especially since the growth in shale oil production, the
curve has fallen and the forward price is around $80 per barrel.
This suggests that the perception is now one of future oil abundance. Obviously, the
impacts of such views are very difficult to predict but the most obvious impact is likely
to be on future investments plans in the upstream. This directly relates to the depletion
policy adopted by the GCC members, which in turn will have a crucial impact on future
22 Any prediction of future oil supply that ignores issues of cost and price cannot be taken seriously
0
20
40
60
80
100
120
140
160
1 2 3 4 5 6 7
US
$ p
er
barr
rel
Years forward
NYMEX Forward Curve WTI
Nov-14
Dec-13
Jul-08
Feb-06
2004
2001
1990s
THE SHALE TECHNOLOGY REVOLUTION
21
oil supplies. During the 1970s, a commonly held view among the GCC oil producers
was that “oil in the ground is worth more than money in the bank”. In recent years, as
the policy makers have become more sophisticated, this is modified by a codicil which
adds”…especially if the bank has sub-prime mortgage assets”. This view assumes that
future oil prices are likely to be higher. However, if views of impending shortages are
now challenged as a result of the shale technology revolution this could persuade
producer governments to produce sooner rather than later.
Such views might also be influenced as the debate over “unburnable carbon” begins to
gather momentum. This debate — one that began to gain public attention in the last 18
months – revolves around the argument that if the world actually burns all of the
proven hydrocarbon reserves available then the consequences for climate change would
be catastrophic. This is beginning to generate a backlash reminiscent of the campus
campaigns of the 1960s against apartheid South Africa. For example, the Norwegian
Parliament is discussing whether to force the Norwegian Pension Fund (Norway’s’
sovereign wealth fund) to divest itself of shares in BHP Billiton because it is a coal
producer. In a similar vein, the Australian National University has announced it is
divesting itself of a number of shares in companies associated with the production and
consumption of hydrocarbons. Even the Rockefeller Foundation has announced it will
remove oil and coal companies from its portfolio. If such movements gained more
traction, this could well force more governments to take climate change seriously and
impose policy measure to reduce carbon emission. Although obviously coal would take
the greatest hit, oil and gas would not be immune. Given the location of conventional
proven oil and gas reserves in the GCC this would have serious consequences.
This analysis on producers’ reactions is further complicated as the major international
oil companies (IOCs) struggle to satisfy their shareholders. There are a number of
reasons why this is the case (Stevens, forthcoming) but a key consequence is that in
the last 12 months the buzz words amongst the IOCs have been “capital discipline”.
This simply translates into a loss of appetite for large, high risk, long term oil and gas
projects. Thus, it appears the upstream investment pot of the IOCs is shrinking which
will threaten future oil supplies. This threatens less supplies while a change in GCC
depletion policy would create more supplies hence the complexity of the analysis.
The direct impacts of the shale technology revolution are also relevant for the GCC in
terms of global gas markets.

ARAB CENTER FOR RESEARCH AND POLICY STUDIES
22
First, there is the issue of future competition in the LNG market. The indirect impact
arising from lower than expected LNG demand from the United States has already been
discussed. The result has been the creation of what amounts to a buyers’ market for
LNG up to the end of the decade as LNG capacity intended for the American market
comes on-stream and seeks alternative buyers. There is also uncertainty over the
extent to which United States’ own LNG exports will actually materialize. To date, only
two projects have received full regulatory authority to operate. Another 12 are going
through the approval process and despite talk of streamlining this, it remains a
daunting prospect. At the same time there are growing lobby pressures in Washington
to restrict LNG exports from two sources. From those still wedded to the ideas of
Energy Independence who see gas exports undermining that as a goal; and from those
who see lower domestic gas prices as a major incentive to the continued revival of
petrochemical activities specifically and manufacturing more generally.
It is not entirely clear how such LNG developments would affect the GCC. Of the GCC
countries, only Qatar has the capacity to expand its LNG operations and this is currently
extremely debatable given the now long-standing moratorium on further gas projects.23
There appear to be few, if any, new LNG projects from the region that would be
affected. Indeed the only consequence might be cheaper LNG imports for those GCC
members considering such an option.
A second indirect impact is the possibility that the GCC countries could develop their
own shale gas resources.
As can be seen from Figure 11, the region already has significant reserves of gas and
even more potential for technically recoverable reserves of shale gas24. Despite this, the
region already suffers from severe gas shortages. This largely reflects serious
institutional weakness within the sector, largely associated with gas prices being set at
levels that are far too low, encouraging wasteful consumption and limited production.
23 Qatar introduced a moratorium on new gas projects in 2005 to last until 2009. In 2009 this was
extended to 2015. The reasons for the moratorium have been the subject of much speculation. They
include the view that it was Iranian pressure to prevent Qatar from draining gas currently located in Iran’s
South Pars field, to the possibility that the North Field is facing serious problems due to over production.
24 Estimates of technically recoverable resources for shale gas need to be treated with great care. In the
United States the general rule of thumb is that only 10 percent are likely to convert to reserves. Even
then such numbers face constant revision since they are, for the most part, based upon very limited
geological data.

THE SHALE TECHNOLOGY REVOLUTION
23
Clearly shale gas would be a welcome source of energy in the region. However, when
the barriers listed in Table 1 are considered, the prospects for a shale gas revolution do
not look promising. In particular the conditions require “…the sector (to be) dynamic
and competitive in a private sector environment” and this does not fit well in the GCC.
The argument, put rather unkindly, is that if the GCC cannot get its gas act together
when sitting on 22.5 percent of global proven conventional gas reserves there is little
hope of rapidly promoting the production of unconventional shale gas.
Figure 11
Source: Technically Recoverable Shale Oil and Shale Gas Resources: An Assessment of
137 Shale Formations in 41 Countries Outside the United States. Release date: June 10,
2013 Updated: June 13, 2013
A third indirect consequence relevant to global energy markets might be that if gas
becomes more generally available, this could threaten the dominance of oil in the
transport sector thereby undermining the last bastion of protection for oil markets. The
oil shocks of the 1970s pushed out oil from the static sector but oil in transport
remained secure. However, today, gas could threaten the transport market for oil in
one of two ways. First, by the use of compressed natural gas CNG. This is increasingly
being used, especially in urban areas where air quality is an issue. Second, the use of
0
1000
2000
3000
4000
5000
6000
7000
EIA Estimates of gas reserves and shale gas resources 2013 (tcf)
Conventional proven gasreserves
Technically recoverableresources

ARAB CENTER FOR RESEARCH AND POLICY STUDIES
24
LNG for long haul heavy road freight is being considered both in North America and in
Australia.
Finally, as already referred to, there is the prospect of greater competitive threats to
GCC petrochemical exports as lower domestic feedstock prices in the United States
attract increasing amounts of investment in petrochemicals. At the very least this
threatens the whole basis of the development strategy adopted by the GCC countries.
Conclusions
In the now famous words of Zhou Enlai in response to a question about the importance
of the French Revolution, “it is too early to tell”25; a similar reply is justified when asking
about the impact of the shale technology revolution on the GCC countries. Two reasons
explain this. First, the shale revolution is only just beginning and there are
uncertainties regarding how far it can be replicated outside of the United States and
indeed its sustainability within the United States. There has been much hype regarding
the revolution (Stevens, 2010) but fortunately now more measured views are emerging
as to what may or may not be possible. That said, the impacts for the GCC countries
are likely to be important and far-reaching and they could be positive or negative.
Second, the impact will ultimately be determined by a multitude of policy decisions
taken by companies and governments. These are far from known or predictable.
However, one thing can be said with certainty and that is that the shale technology
revolution will have major impacts on global energy markets and indeed has already
done so. Any impact on global energy markets will inevitably impact the GCC countries
given their total dependence upon the production and export of oil and gas. Despite
much rhetoric and some effort, the GCC today is more dependent on oil and gas than it
was in 1990. In the GCC, the IMF claims in 1990 non-Hydrocarbon GDP was 61 percent
of GDP but by 2010 had fallen to 51 percent. It is therefore of crucial importance for
these countries that they monitor closely shale technology developments and consider
how these may impact upon their current and future strategies regarding their
hydrocarbon sectors.
25 This is disputed and some believe he was talking about the French student unrest of 1968
THE SHALE TECHNOLOGY REVOLUTION
25
Bibliography
Stevens P (2010) The “Shale Gas Revolution” Hype and Reality. A Chatham House Report.
Chatham House, London.
Stevens P (2012) The 'Shale Gas Revolution': Developments and Changes, Briefing Paper, August 2012
Stevens P (2013) Shale gas in the United Kingdom. Programme Paper. Chatham House, London
Stevens P (Forthcoming) The death of the IOC business model. Chatham House Report. Chatham House, London
Stevens P & Hulbert M (2012) Oil prices: Energy investment, political stability in the exporting countries and OPEC’s dilemma. Chatham House Briefing Paper. October G Zuckerman (2013) The Outrageous Inside Story of the New Energy Revolution. Portfolio/Penguin, New York.


