
Tourist resort and restaurant - Jerash
1 1
Pre-Feasibility Study for Tourist Resort and Restaurant in Jerash
2017

Tourist resort and restaurant - Jerash 2
Table of Contents
1. EXECUTIVE SUMMARY .............................................................................................................................................. 5
2. KEY HIGHLIGHT OF JORDAN .................................................................................................................................. 6
3. MARKET ANALYSIS .................................................................................................................................................. 12
Project Description ................................................................................................................................................... 12
Project Objectives ..................................................................................................................................................... 12
Proposed Services ..................................................................................................................................................... 13
Target Segments ........................................................................................................................................................ 13
Market Size Analysis ................................................................................................................................................ 13
Competitors Analysis ............................................................................................................................................... 15
Project Capacity ......................................................................................................................................................... 15
Price Analysis and Pricing Policy ........................................................................................................................... 16
Expected Occupancy Rates .................................................................................................................................... 17
Expected Revenues ................................................................................................................................................... 17
4. TECHNICAL ANALYSIS ............................................................................................................................................ 19
Required Human Resources .................................................................................................................................. 19
Location Analysis ...................................................................................................................................................... 20
Technical Requirements Analysis ......................................................................................................................... 20
Machinery and Equipment ..................................................................................................................................... 21
Machinery and equipment ..................................................................................................................................... 21
Furniture Requirements .......................................................................................................................................... 21
Legal requirements and procedures ..................................................................................................................... 21
5. FINANCIAL ANALYSIS ............................................................................................................................................. 23
Assumptions ............................................................................................................................................................... 23
Capital Expenditures ................................................................................................................................................ 26
Operating Expenses.................................................................................................................................................. 30
General and Administrative Expenses ................................................................................................................. 31
Marketing Expenses ................................................................................................................................................. 31
Human Resources ..................................................................................................................................................... 32
Tourist resort and restaurant - Jerash 3
Depreciations ............................................................................................................................................................. 33
Loan .............................................................................................................................................................................. 34
Income Statement ..................................................................................................................................................... 35
Expected Cashflows Statement ............................................................................................................................. 36
Expected Balance Sheet ........................................................................................................................................... 38
Feasibility Indicators ................................................................................................................................................ 40
Summary of Feasibility Indicators......................................................................................................................... 41
Sensitivity Analysis ................................................................................................................................................... 42
List of Table
TABLE 1 : ECONOMIC INDICATORS ............................................................................................................................................ 5
TABLE 2: POPULATION DISTRIBUTION ACCORDING TO AGE GROUP ......................................................................................... 7
TABLE 3: INCOME TAX AND EXEMPTIONS ............................................................................................................................... 11
TABLE 4: COMPARISON BETWEEN THE JORDANIAN VISITORS AND FOREIGN TOURISTS DURING THE FIRST THREE MONTHS OF
YEARS 2015 AND 2016. ............................................................................................................................................... 14
TABLE 5: PROJECT CAPACITY .................................................................................................................................................... 15
TABLE 6:RESTAURANT CAPACITY .............................................................................................................................................. 15
TABLE 7: EXPECTED PRICES DURING THE PERIOD 2018-2027 .............................................................................................. 16
TABLE 8 : EXPECTED OCCUPANCY RATES ................................................................................................................................. 17
TABLE 9: EXPECTED REVENUE ................................................................................................................................................... 18
TABLE 10: THE REQUIRED HUMAN RESOURCES FOR THE PROJECT ......................................................................................... 19
TABLE 11:THE REQUIRED LAND .............................................................................................................................................. 20
TABLE 11 : REQUIRED CONSTRUCTION WORK ..................................................................................................................... 20
TABLE 13:MACHINERY AND EQUIPMENT ................................................................................................................................ 21
TABLE 14:FURNITURE REQUIREMENTS .................................................................................................................................... 21
TABLE 15:GENERAL ASSUMPTIONS ......................................................................................................................................... 24
TABLE 16:CURRENCY EXCHANGE RATES ................................................................................................................................. 24
TABLE 17: PROJECT WORKING TIMES ....................................................................................................................................... 24
TABLE 18: ANNUAL GROWTH RATES ASSUMPTIONS .............................................................................................................. 24
TABLE 19:ASSUMPTIONS OF EXPENSES.................................................................................................................................... 24
TABLE 20:INCOME TAX ASSUMPTIONS ................................................................................................................................... 25
TABLE 21:RISK PREMUIM ........................................................................................................................................................ 25

Tourist resort and restaurant - Jerash 4
TABLE 22:WEIGHTED AVERAGE COST OF CAPITAL .................................................................................................................. 25
TABLE 23: LAND CAPITAL EXPENDITURE ................................................................................................................................. 26
TABLE 24:CONSTRUCTION WORK CAPITAL EXPENDITURE ..................................................................................................... 26
TABLE 25: MACHINES AND EQUIPMENT CAPITAL EXPENDITURE ............................................................................................ 27
TABLE 26: FURNITURE CAPITAL EXPENDITURE ........................................................................................................................ 27
TABLE 27: TRANSPORATION AND VEHICLES CAPEX ................................................................................................................ 27
TABLE 28:PRE OPERATING EXPENSES ...................................................................................................................................... 28
TABLE 29:WORKING CAPITAL ................................................................................................................................................. 28
TABLE 30:EXPENSES SUMMARY ............................................................................................................................................... 28
TABLE 31:SOURCES OF FUNDING ............................................................................................................................................ 29
TABLE 32:OPERATING EXPENSES ............................................................................................................................................. 30
TABLE 33:GENERAL AND ADMINISTRATIVE EXPENSES ............................................................................................................ 31
TABLE 34:MARKETING EXPENSE .............................................................................................................................................. 32
TABLE 35:EXPECTED SALARIES AND WGES (2027-2018) .................................................................................................... 32
TABLE 36:CAPEX AND DEPRECIATION EXPENSES .................................................................................................................... 33
TABLE 37:DEPRECIATIONS AND ADDITIONS ON CONSTRUCTION WORKS ............................................................................ 34
TABLE 38:LOAN DETAILS ......................................................................................................................................................... 34
TABLE 39:INCOME STATEMENT ............................................................................................................................................... 35
TABLE 40:EXPECTED CASHFLOWS ........................................................................................................................................... 37
TABLE 41:EXPECTED BALANCE SHEET ...................................................................................................................................... 38
TABLE 42:FREE NET CASH FLOWS TABLE ................................................................................................................................. 40
TABLE 43: PAYBACK PERIOD .................................................................................................................................................... 41
TABLE 44: FINANCIAL ANALYSIS RESULTS ............................................................................................................................... 42
TABLE 45:SENSITIVITY ANALYSIS ............................................................................................................................................. 42
List of Figures
FIGURE 1:POPULATION OF JORDAN ............................................................................................................................................................................... 6
FIGURE 2: SECTORS CONTIBUTION TO JORDAN’S ECONOMY ....................................................................................................................................... 8
FIGURE 3:NUMBER OF FOREIGN TOURISTS FOR THE YEARS (2010-2015) ............................................................................................................... 13
FIGURE 4: NUMBER OF JORDANIAN TOURISTS FOR THE YEARS (2010-2015).......................................................................................................... 14

Tourist resort and restaurant - Jerash 5
1. Executive summary
Jerash is one of the most important tourist attractions city in Jordan being embracing cultural heritage,
Greek, Roman and Islamic culture. Due to the lack of tourist resorts of high level, the idea of this project is
to build a tourist resort overlooking the King Talal Dam. This can be considered as a unique idea since the
project will provide a variety of services.
The project will contribute of economic recovery of the city as will as participating increasing the number
of tourist and local visitors, in addition to providing 25 jobs.
Based on the proposed market share and prices that have been adopted by the proposed project, the
expected revenue amounted to 479,430 Jordanian dinars during the first year of the project life, to be
gradually rise to reach 816197 Jordanian dinars during the tenth year. Furthermore, the pay back period is
six years with an internal rate of return equal to 21.66%. It provides 25 job opportunities for governorate
residents, as well.
The economic indicators of the project are shown in the following table:
Table 1 :Economic Indicators
Indicator
009,091 Total Investment Requirement (JD)
11.22% Internal Rate of Return (IRR)
2 Pay-Back Period (year)
819,850 Net present value (JD)
15 Job Opportunities provided by the project
2,042,941 Annual Revenue Projections (10 years)
015101493 Total Operating Expenses (10 years)
1,904,829 Net Profit (10 years)

Tourist resort and restaurant - Jerash 6
2. Key Highlight of Jordan
Jordan Hashemite Kingdom area is 89342 Kilometers with a population exceed 9.8 Millions distributed
among 12 Governorates.Jordan is bounded by Saudi Arabia, Iraq, Syria and Palestine from the South, East,
North and west respectively. Jordan climate is mostly arid desert with rainy season between November to
April Months.
Jordan is a free market economy, ranked as the fifth freest economy in the MENA region in the Index of
Economic Freedom. Its free market economy enjoys strong partnerships amongst its neighboring country
as well as Europe and the USA. Jordan is a signatory of several bilateral and multilateral trade agreements
such as (Free Trade Agreement with the US and the EU, a Free Trade Agreement with the EFTA states, an
FTA with Singapore, A member of the Greater Arab Free Trade Agreement (GAFTA) and a signatory of the
Aghadir Agreement. Looking at the range of countries these agreements cover and facilitate trade between,
one is confident to say that Jordan has business gateways and partnerships across the globe.
Population Overview
Based on the latest surveys done by Department of Statistics (DOS) in 2017, total number of population
has reached around 9.814.995 with an increase rate of 2.88% from 2016 year, figure below summarizes
the population distribution among the kingdom governorates.
Figure 1:Population of Jordan
Department of Statistics (DOS), 2015

Tourist resort and restaurant - Jerash 7
Moreover, and based on the latest survey conducted by (DOS) which related to population nationality
distribution over the governorates, it was found that total Non-Jordanian residents constitutes around 30%
of the total population. Half of these are Syrians (1.3 Million) concentrated mainly in Amman Capital (436
Thousand) then Irbid (343 Thousand), Mafraq at 208 Thousand and Zarqa at 175 Thousand.
Jordan prides itself in its youthful population with 35% of ages below 15 years old and only 4% with ages
above 65 years old. Table below summarizes population distribution of Jordanians according to Age
Group:
Table 2: Population Distribution according to Age Group
Females Males Population % Age Group
%1.81 %10.1 %05.94 0-11 Years
%1.82 %09.3 %21.91 11-21 Years
%182 %1.2 %0.04 More than 65 Years
Department of Statistics (DOS), 2015
Overview of Jordan Economy
Classified as an upper middle economy by the World Bank and as a country of High Human Development
by the UNDP, Jordan is an important financial power in the Middle East. Its small market witnessed growth
in the last two decades since King Abdullah II accessed the throne. Jordan’s GNI per capita has increased in
the last four years due to the basket of economic reforms that were enacted in the recent decade such as
(the new Income Tax Law, Public Private Partnership Law and Investment Law). These laws aim to
encourage the participation of the private sector in the Kingdom’s economic development and provide an
enabling legislative environment for current and new investment opportunities.
The Jordanian economy is overwhelmingly services oriented and its contribution in the GDP is 68.1%. The
contribution of the industrial sector is 22.4%, the construction sector is 4.2% and the agricultural sector is
2.9%. These contributions are aimed to increase to (27.4%), (5.8%) and (3.4%) respectively and that of the
service sector is due to decrease according to Jordan 2025 vision.

Tourist resort and restaurant - Jerash 8
70%
23%
4% 3%
Service sector
Indusrty sector
construction sector
Agriculture sector
Jordan’s exports include variety of textiles, potassium, phosphates, fertilizers, vegetables and
pharmaceutical products. While it’s main imports are crude and refined petroleum. Distinguished by its
strategic location, on the crossroads between Asia, Africa and Europe with strong connections to the
Levant and the GCC, Jordan has a regional market of interest that represents US$3.8 trillion market and
compromising 380 million consumers.
Jordan infrastructure ranks comparatively well (38th out of 148 comparable economies), with an extensive
8000 KM road network connecting Jordan domestically and externally The new Queen Alia International
Airport and the Port of Aqaba are the major gateways to the international market. In addition to some
mega projects such as the Red- Dead Sea Canal and the national railway network that will be developed to
position Jordan as a hub for regional commerce.
Jordan banking system is quite sophisticated, resilient and in compliance with international standards,
making it very attractive and trustworthy to investors. This is reflected in the fact that 50% of equity in
licensed banks in Jordan is held by non-Jordanians, and non residents’ deposits in Jordanian banks
witnessed a steady growth of 19.2%.
Moreover, realizing the value of MSMEs to drive economic growth, the government has developed the
national Strategy for the encouragement of entrepreneurship and the development of micro small and
medium sized enterprises for 2015-2019. This shows the commitment of the Jordan government to
enhance the private sector development and leveraging the country’s strong human capital.
Figure 2 Figure 2: Sectors Contibution to Jordan’s Economy

Tourist resort and restaurant - Jerash 9
Jordan prides itself in its youthful population. It’s the country most valuable capital. A tech savvy well
educated and trained workforce attracts a lot of investors to Jordan. More than 20.4% of Jordan’s GDP is
dedicated to the education and capacity building for the labor force, this has resulted in securing a 91%
literacy rate and enabled Jordanians to be among most hired and qualified middle-eastern workforce.
Such solid, diverse and resilient characteristics of the Jordanian economy and investment scene position
Jordan as a competitive investment destination
Major Economic Indicators GDP Growth
The Jordanian economy slowed and reached 2.4 percent in 2015 compared to growth rate of 3.1 in 2014
and similar to MENA growth rates.
The growth also slowed for trade, restaurants and hotels; manufacturing; transport; and electricity and
water. Meanwhile, finance, insurance, and business services advanced at a faster pace. Inflation rate
Inflation rate decreased to 0.9 in 2015 after 2% decline in the previous year. Inflation Rate in Jordan
averaged 3.1 percent from 2011 until 2015.
Unemployment
The unemployment rate in Jordan was recorded at 13 percent in 2015, comparing to 11.9 percent a year
earlier. This increase due to the current instability in the labor market structure as well as high competition
from low cost foreign labors especially from Syria.
External Sector
A number of risks manifested in 2015, the closure of land trade routes with Syria and Iraq and the
deepening instability in the region adversely impacted many external sector indicators such as trade,
tourism and direct Investment.
Moreover, loans disbursements increased by JD 545.3 million, due to the use of the International and Arab
Monetary Funds (IMF and AMF) credit facilities. As an outcome of these developments, the overall balance
of the balance of payments registered a surplus of JD 328.7 million in 2015, compared with a surplus of JD
1,550.7 million in 2014. Further, net international investment position (IIP) witnessed an increase in the Kingdom’s net obligations
to abroad; to reach JD 24,357.5 million, compared to a net obligation of JD 22,578.8 million at the end of
2014 as a result of the increase in the stock of external financial assets and liabilities of all resident
economic sectors to reach JD 18,657.9 million and JD 43,015.5 million; respectively.

Tourist resort and restaurant - Jerash 10
External Debt in Jordan increased to 9390.50 JOD Million in 2015 from 8030.10 JOD Million in 2014.
External Debt in Jordan averaged 5433.67 JOD Million from 1988 until 2015, reaching an all time high of
9390.50 JOD Million in 2015 and a record low of 3640.20 JOD Million in 2008.
Investment Climate in Jordan
Investment in Jordan is considered as one of the vital sources to boost the economy considering that
Jordan's economy is among the smallest in the Middle East, with insufficient supplies of water, oil, and
other natural resources, underlying the government's heavy reliance on foreign assistance.
The country’s location, supported by myriad free trade agreements (FTAs) offering access to 1.5bn
consumers, enables the kingdom to be a strategic trade route to many of its neighboring countries and
regions.
Jordan aspires to create a competitive investment destination capitalizing on its many advantages
mentioned above. The government focused its efforts to implement significant advances in structural and
legal reform. These efforts are represented in the new Investment Law of 2014, the tax law, in addition to
other endeavors related to providing greater access to credit for MSMEs, and by providing greater
investment incentives to specific priority sectors identified by the new Investment law and the Jordan 2025
vision.
Furthermore, in it endeavor to enhance the business environment, several geographically industrial states
were created across the kingdom. These range in type to include (industrial estates, free zones and special
economic zones). Under the new Investment Law, these zones are given a number of incentives that
include a tax rate of 0% on exports, sales tax, import duties, social service tax, dividends tax and a 5%
income tax from all economic and manufacturing activities undertaken in the development zones. As for
the investments in Free Zones, they enjoy Exemptions from customs duties, income tax exemptions and
exemptions from land and building taxes among others. Both development and free zones also enjoy
facilitations regarding visa and residency permits for investors and workers in addition to Repatriation of
capital and profits in a convertible currency. Such estates have succeeded in attracting relatively large
amounts of FDI to Jordan.
Key National Investment Priorities:

Tourist resort and restaurant - Jerash 11
Jordan Investment commission worked on taking a leading role in the application of government policies
to promote and attract domestic and foreign investments and create an investment environment that
stimulates economic performance through investment promotion strategy launched in 2016
Jordan investment commission aims to:
Regulating the special provisions governing Development Zones and Free Zones in the Kingdom
and developing them placing them in service of the national economy as well as monitoring their
functioning.
Developing plan and programs to stimulate domestic and foreign investments.
Establishing trade centers and organizing exhibitions as well as opening markets and organizing
trade missions in order to promote national products, in addition to marketing and development
of national exports and encouraging investment.
Taking appropriate decisions related to private or public institutions to improve Investors’
confidence in Jordan’s investment environment.
Investment Climate in Jerash:
Under the provisions of fifth article of the investment law No. 30 of 2014 and Income tax regulations in the
less developed areas, the reduction of the income tax system on the investment projects are clarified in the
table below:
Table 3: Income Tax and Exemptions
Less Developed Areas Within the
Development Zone or
Free Zone Income Tax is 20% As per Investment Law categorization, Jerash is classified in Class (C)
Income Tax is 5%

Tourist resort and restaurant - Jerash 12
where investors enjoys 60% exemption on Income tax for 20 years, where
net income tax after reduction should not be less than 5%8
3. Market analysis
Project Description
The idea of the project based on the establishment of a tourist restaurant and resort in Jerash overlooks the
King Talal Dam.
Jerash is recognized its ancient Romanian monuments, in addition of being overlooks the King Talal Dam,
which is characterized as the biggest dams in Jordan, so the exterior and interior design of the resort will
simulates the ancient Roman style as well as some of the modern designs.
The resort will contain the following facilities:
• Cafeteria and restaurant
• Small Hotel
• swimming pool
• Shopping center
Project Objectives
Provide job opportunities for unemployed citizens in the governate and improve the overall
economic situation.
Achieve profitable return to the project owner .
Establish an entertainment resort for the governorate residents and nearby governorate since
there is lack of such facilities.
Improve the tourism sector in Jordan to attract tourists and local residents to visit the resort.

Tourist resort and restaurant - Jerash 13
Encourage and develope the tourism and the investment in Jerash
Proposed Services
The proposed project provides a relaxing atmosphere by staying an overnight in the hotel, in addition to a
swimming pool overlooking the King Talal Dam and to the surrounding forest tree. The project offers a
restaurant and shopping center to serve resort visitors, as well.
Target Segments
The Targeted customers of the proposed project:
• Tourists from different countries.
• Jerash residents and other kingdom residents.
Market Size Analysis
Number of population in Jerash is 237,059 people, the following figure shows the number of foreign
tourists for the years ( 2010-2015):
Figure No (3) Showing the number of foreign tourists for the years (2010-2015):
Source: Ministry of Tourism and Antiquities
Figure No (4) Showing the number of Jordanian tourists for the years (2010-2015):
0
20000
40000
60000
80000
100000
120000
140000
160000
180000
200000
201020112012201320142015
السنوات
ارزو
الدد
ع
Years
Nu
mb
er o
f v
isit
ors
Num
ber o
f for
eign
tour
ists
Figure 3:number of foreign tourists for the years (2010-2015)

Tourist resort and restaurant - Jerash 14
Figure 4: number of Jordanian tourists for the years (2010-2015)
Source: Ministry of Tourism and Antiquities
Table (4) shows the comparison between the Jordanian visitors and foreign tourists during the first three
months of years 2015 and 2016.
Table 4: Comparison between the Jordanian visitors and foreign tourists during the first three
months of years 2015 and 2016.
Month 2015 2016
Tourists Jordanian Total Tourists Jordanian Total
January 6,179 3,571 9,750 3,600 3,800 7,400
February 6,753 2,847 9,600 5,500 6,450 11,950
March 12,657 7,443 20,100 9,774 15,882 25,656
Total 25,589 13,861 39,450 18,874 26,132 45,006 Source: Tourism Statistical Bulletin of the Ministry of Tourism and Antiquities
0
10000
20000
30000
40000
50000
60000
70000
80000
90000
201020112012201320142015
السنوات
روا
ز ال
ددع
Tourist resort and restaurant - Jerash
15 15
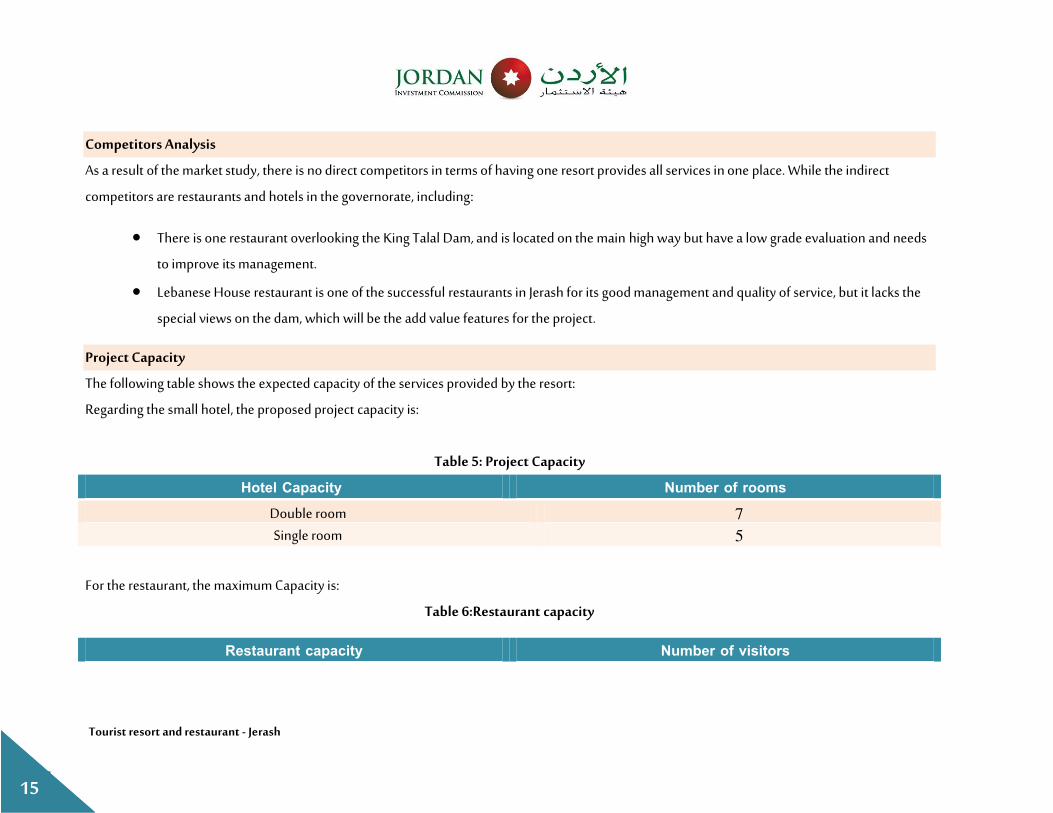
Competitors Analysis
As a result of the market study, there is no direct competitors in terms of having one resort provides all services in one place. While the indirect
competitors are restaurants and hotels in the governorate, including:
There is one restaurant overlooking the King Talal Dam, and is located on the main high way but have a low grade evaluation and needs
to improve its management.
Lebanese House restaurant is one of the successful restaurants in Jerash for its good management and quality of service, but it lacks the
special views on the dam, which will be the add value features for the project.
Project Capacity
The following table shows the expected capacity of the services provided by the resort:
Regarding the small hotel, the proposed project capacity is:
Table 5: Project Capacity
Hotel Capacity Number of rooms Double room 7 Single room 5
For the restaurant, the maximum Capacity is:
Table 6:Restaurant capacity
Restaurant capacity Number of visitors

Tourist resort and restaurant - Jerash 16
Restaurant 052
Price Analysis and Pricing Policy
The following table shows the prices assumptions and the bookings for the proposed project:
Table 7: Expected prices during the period 2018-2027
Assumptions of Prices and bookings 2018 2019 2020 2021 2022 2023 2024 2025 2026 2027
Single room price 45 46 48 49 51 52 54 55 57 59 Double room price 65 67 69 71 73 75 78 80 82 85
average amount paid in the restaurant by
the customer
17.5 18.0 18.6 19.1 19.7 20.3 20.9 21.5 22.2 22.8
Occupancy rate for the single room 35% 36% 37% 38% 39% 41% 42% 43% 44% 46%
Occupancy rate for the double room 35% 36% 37% 38% 39% 41% 42% 43% 44% 46%
Occupancy rate for the restaurant 25% 26% 27% 27% 28% 29% 30% 31% 32% 33%
Hotel revenues 85680 90898 96434 102306 108537 115147 122159 129599 137491 145864
Restaurant revenues 393750 417729 443169 470158 498791 529167 561393 595582 631853 670333
Total revenues 479430 508627 539603 572464 607328 644314 683553 725181 769344 816197

Tourist resort and restaurant - Jerash
17 17 17
Expected Occupancy Rates
The expected market share calculated based on the proposed capacity of the project, which
amounts to 262 person / day. Furthermore, the estimated annual occupancy rate of the project
are as follows:
Number of visitors to the proposed project are 262 person / day, equivalent to 94 320 / year,
distributed in single, double rooms and restaurant, where the assumed occupancy rate of single
and double rooms are 35% of the project capacity in the first year (2018), while the assumed
occupancy rate for the restaurant is 25% of project capacity in the first year (2018).
The following table shows the occupancy rate for the project:
Table . : Expected Occupancy Rates
2027 2026 2025 2024 2023 2022 2021 2020 2019 2018 multiple usage
halls 42% 44% 40% 41% 41% 00% 08% 03% 02% 05% Occupancy rate
for single rooms 42% 44% 40% 41% 41% 00% 08% 03% 02% 05% Occupancy rate
for double rooms 33% 32% 31% 30% 29% 28% 27% 27% 26% 25% Occupancy rate
for restaurant
Expected Revenues
The expected annual revenues of the project
After the expected market share calculation and the selection of pricing policy of the project, the
total annual revenues for rooms booking are (85,680) JD.
The total revenues for the restaurant were amounted to (393,750) JD per year.

Tourist resort and restaurant - Jerash
18 18 18
The following table shows the expected revenues of the project during the years (1918-1913:)
Table 9: expected revenue
2018 2019 2020 2021 2022 2023 2024 2025 2026 2027
Single room price 45 46 48 49 51 52 54 55 57 59
Double room price 65 67 69 71 73 75 78 80 82 85
average amount paid in the restaurant by the customer 17.5 18.0 18.6 19.1 19.7 20.3 20.9 21.5 22.2 22.8
Occupancy rate for the single room 35% 36% 37% 38% 39% 41% 42% 43% 44% 46%
Occupancy rate for the double room 35% 36% 37% 38% 39% 41% 42% 43% 44% 46%
Occupancy rate for the restaurant 25% 26% 27% 27% 28% 29% 30% 31% 32% 33%
Hotel revenues 85680 90898 96434 102306 108537 115147 122159 129599 137491 145864
Restaurant revenues 393750 417729 443169 470158 498791 529167 561393 595582 631853 670333
Total revenues 479430 508627 539603 572464 607328 644314 683553 725181 769344 816197

Tourist resort and restaurant - Jerash
19 19 19
4. Technical analysis
The pre-feasibility study aims to set up the technical specifications of the project, based on the
results of the market study, as well as, to estimate and review the most important investment and
operational cost items.
The technical study of the project includes the explanation and general description of the project
aspects and components, in addition to calculations of the expense of construction and
operational costs of the project, according to the technical study team estimations.
Required Human Resources
Table 10: The required Human Resources for the project
Job Title Number
General Manager 1
Accountant 1
Marketing employee 1
Guard 1
Total Number of indirect employees 1
Receptionest 2
Chef 1
Sous chef 2
Waiter 10
Janitors 5
Total Number of direct employees 10
Grand Total of employees 25
Job Description:
General Manager: Suggests policies and plans and managing the overall work in the resort, and
follow-up implementation of plans and programs in accordance with the policies and goals and
objectives of the resort in an optimal manner, and oversee the management of financial and
administrative in the resort in line with the instructions in this regard, Also, manage subordinates
and development of their skills, in addition to the development of procedures and ensure the
requirements of occupational and public safety and health.

Tourist resort and restaurant - Jerash
20 20 20
Accountant: Responsible for the daily accounts of the project from revenues and expenses, in
addition to providing an annual report on the financial status of the resort.
Sous Chef: He works with the chef and helps prepare different meals, cleaning the kitchen with
its accessories.
Waiter: Receiving customers in dining halls, recording customer requests, filling out business
models, and applying professional and general safety and health procedures and instructions.
Guard: Securing the place and maintaining the public safety of the resort.
Location Analysis
After studying the different geographical locations in Jerash.
Suitable two sites for the project:
- Mustaba area: away from the main high way (Irbid - Amman) 2 km.
- Al-Jaba area: one of the places that overlook the King Talal Dam.
The two areas can be considered as beautiful views areas, which complied with the proposed
project specifications.
Technical Requirements Analysis
Land and Costruction works:
Project will be constructed on a land of 6000 m2. The following table shows the plot area
needed:
Table 11:The Required Land
Land Area( m2)
The Required Land 6000 2م
The construction works required for the project are represented as follows:
Table 11 : Required construction work
Area ( m2) Required construction work
10000 Building Construction 10000 Building design and drawings
9 Swimming pool

Tourist resort and restaurant - Jerash
21 21 21
Area ( m2) Required construction work
10000 Drilling works
0000 Paving
Machinery and Equipment
The following table shows the machinery and equipment needed for the project as follows:
Table 13:Machinery and equipment
Machinery and equipment Number
Fire-fighting equipment 1
Central air condition 14
42-inch screen 0
Washers 1
Vapor Iron Stand 1
Furniture Requirements
The project needs the following furniture and furnishings:
Table 14:Furniture Requirements
Furnitures Number
Beds 19
TV inside the rooms 12
Refrigerators inside the rooms 12
Rooms Furnitures 12
Pool requirements 1
Hall requirements 1
Restaurant Tables 50
Restaurant Chairs 255
Restaurant cooking equipment 1
Legal requirements and procedures

Tourist resort and restaurant - Jerash
22 22 22
Licensing Procedures for Tourist Resorts:
1. Filling out a Licensing Proposal Form.
2. Ownership deed or rent contract duly certified.
3. A recent site-zoning plan.
4. Land plan issued by Department of Land and Survey/ recent.
5. Zoning scheme (issued by concerned bodies).
6. Presentation of preliminary architectural blueprints for complied with requested classification
grade after being certified by the Civil Defense Directorate and Greater Jerash Municipality.
7. Clarification of expected environmental impact of the project in areas lying outside zoning
boundaries.
After the completion of the presentation of the above documents and requirements, together
with the physical inspection and approval of the Tourism Committee on the recommendations of
the Technical Committee, the Minister issues a preliminary conditional approval for the project
valid for two years, the owners of the project will be informed.
After completion of the preliminary approval necessary to execute the project, realization of
conditions and requirements, and furnishing of material assets, concerned parties submit a
written request for the physical inspection and completion of licensing procedures and
classifications according to requirements, after providing the following documents and
requirements:
1. Two copies of detailed architectural blueprints as built, duly certified
2. Occupancy permit issued by concerned parties.
3. Approval by Civil Defense to allow receiving guests.
4. Trade name registration at the Ministry of Trade and Industry, or trade mark.
After completion of all above procedures, technical and classification committees visit the site to
compare the executed building with the architectural blueprints presented to the Ministry and
prepare a report to determine the appropriate classification grade, which is presented to the
Tourism Committee for approval to classify and license the establishment in the suitable grade.
The Minister forwards a written notification to the owner of the establishment informing
him/her of the classification decision based on the site visit comparing what has been executed
with the architectural plans presented to the Ministry and the report defining the appropriate
grade of classification presented to the Tourism Committee for approval and licensing.
The Minister forwards the written notification to the owner of the establishment informing
him/her of the classification decision based on the recommendations of the Tourism Committee.
The decision may be contested within a period of 15 days from the date of issue. Moreover, the

Tourist resort and restaurant - Jerash
23 23 23
concerned party is requested to provide the Ministry with the following documents and
requirements:
1. A membership certificate and subscription to the Jordan Hotel Association.
2. A copy of membership and subscription to the Jordan Tourism Board for hotels of three stars
and above, as well as hotel suites of grades (A-B).
3. The hotel establishment is licensed in its final form after settling the due fees.
5. Financial Analysis
The Financial Part illustrates all the assumptions which were used when we have developed the
study including project expenses related to capital expenditures, operating expenses ( Fixed and
Variable costs) followed by illustrating project revenues.
Assumptions
Assumptions
Calculation Assumptions:
The weighted average cost of capital used in the study is 11.61% as it was calculated
considering risk free and debt Interest rates as well as Market risk premiums to consider
alternative opportunity costs for investor.
Icome tax on the net project income is 5 % during the life time of the project.
Project working capital has been estimated and added to project cash outflows at the
beginning of the project and annual increase in working capital has been also estimated
and added to the operating expenses then net working capital has been added to total
cash inflows at the end of project lifetime.
The time span for the financial study is 10 years starting from 2018, where annual increase
rates have been estimated as per the tables below:

Tourist resort and restaurant - Jerash
24 24 24
Table 15:General Assumptions
General Information
All Financial Numbers (Currency) Jordan Dinars
Financial Study Time Span (Years)
0
19
Expected Project First Operating Year 1918
Last Year in the Financial Study 1913
Table 16:Currency Exchange Rates
Exchange Rates Jordan Dinars
American Dollar 9.398
Euro 9.329
Table 17: Project working times
Project working times
Number of weeks/Year 51
Working Days/Week 3
Number of days / Year 029
Number of working hours/Day 8
Table 18: Annual Growth Rates Assumptions
Annual Growth Rates Average
Annual Population Growth Rate 2.20%
Annual Sales Price Increase Rate 3.00%
Annual Expenses Increase Rate 3.00%
Annual Increase Rate in Employees Salaries 4.1% (1 ) and (2) Source: Inflation Rates, Central Bank of Jordan
(3) Source: Social Security
Table 19:Assumptions of expenses
Assumptions of expenses

Tourist resort and restaurant - Jerash
25 25 25
Expenses of raw materials of income (food and drink) 20%
Service benefit expenses from revenues 5.0%
Maintenance expenses from revenues 1%
Consumer expenses from revenues 1.0%
Insurance expenses from the value of assets 0.75%
Marketing expenses of revenue 1%
Table 20:Income Tax Assumptions
Income Tax Assumptions Value
Average Income Tax in Jordan (1) 20%
Income Tax Deduction (1) 60%
Income Tax after Deduction 5%
Compulsary Reserve Percentage (0) 10%
Other Assumptions Value
Annual Monthly Salaries have been calculated after multiplying monthly salaries by: (1) 16
Table 21:Risk Premuim
Risk Premuim
Risk Free Rate of Return (1) 6.50%
Return to Debt Maturity (1) 9.48%
Market Risk Premuim (0) 10.12%
Income Tax Rate 5%
Beta (4) 0.89
Growth Rate 4.00% (1 ) Source :Damodaran's Country Default Spreads and Risk Premiums Report
(1 ) Source :Central Bank of Jordan
(0 ) Source :Damodaran's Country Default Spreads and Risk Premiums Report
(4 ) Source :Damodoran Beta By Sector, , pages.stern.nyu.edu
Table 22:Weighted Average Cost of Capital
Weighted Average Cost of Capital
Average Return on Risk Free Investment 2.59%

Tourist resort and restaurant - Jerash
26 26 26
Return to Debt Maturity 0.48%
Market Risk Premuim 19.11%
Income Tax Rate 5%
Bets 9.80
Equity 002,111
Loans Value 504,181
Loans
Cost of Borrowing before Tax 0.48%
Cost of Borrowing After Tax 0.91%
Loans Value
504,181
Loans Percentage 29%
Equity
Cost of Equity 15.5%
Equity Value 002,111
Equety Percentage 49%
Gross
Project Value 009,091
Project Precentage 199%
Weighted Average Cost of Capital 11.21%
Capital Expenditures
The estimated cost of the project is 990,302 JD and it covers land costs, construction works,
machinery and equipment, furniture, pre-operating expenses, working capital and vehicle
requirement. The following tables summarize the details of these expenses:
Table 23: Land Capital Expenditure
Land Cost (Jordan Dinar/Meters Square) Area (m2) Cost/JD
Required Land 11.55 2,999 105,999
Cost 1010000
Table 24:Construction Work Capital Expenditure
Description Cost (JOD per Squared
Meters)
Area
(Squared Meters)
Gross
Cost/ JD
Building Construction 250 2000 500,000

Tourist resort and restaurant - Jerash
27 27 27
Building design and drawings 7 2000 14,000
Swimming pool 1,333 9 12,000
Drilling works 5 2000 10,000
Paving 12 300 3,600
Soil Test - 1 200
Other Works - - 70,000
Total 546,800
Table 25: Machines and equipment Capital Expenditure
Description Number Unit Cost / JD Gross
Cost/ JD
Fire-fighting equipment 2 500 1,000
Central air condition 24 400 9,600
42-inch screen 3 250 750
Washers 2 1,500 3,000
Vapor Iron Stand 2 75 150
Total 14,500
Table 26: Furniture Capital Expenditure
Description Number Unit Cost / JD Gross Cost/ JD
Beds 19 500 9,500 TV inside the rooms 12 200 2,400
Refrigerators inside the rooms 12 100 1,200
Rooms Furnitures 12 700 8,400
Pool requirements 1 7,000 7,000
Hall requirements 1 5,000 5,000
Restaurant Tables 50 100 5,000
Restaurant Chairs 255 50 12,750
Restaurant cooking equipment 1 30,000 30,000
Total 81,250
Table 27: Transporation and Vehicles Capex
Transporation and Vehicles No Unit Cost/JOD Total Cost/JOD

Tourist resort and restaurant - Jerash
28 28 28
Transporation and Vehicles No Unit Cost/JOD Total Cost/JOD
Pick up 1 23,400 23,400
Total 23,400
Pre Operating Expenses
Consist of a set of expenses that are expended before the start of the project and before any
revenue is realized. It consist of Government fees, licenses, marketing expenses, training and
transportation expenses which are estimated as follows:
Table 28:Pre Operating Expenses
Pre-operating expenses Estimaited cost (JD)
Governmental fees 11599
Transportation 11599
Marketing 01999
Training 11599
Total .0100
The initial working capital reflects the project's amounts needed to cover all the expenses during
operation until the project starts generating income, the following table shows the components
of the initial working capital:
Table 29:Working Capital
Working Capital No. of
Months
% Estimated Cost
(JD)
Operating expenses 3 15% 20,438
General and administrative expenses 3 15% 1,218
Marketing expenses 3 15% 1,100
Indirect Salaries 3 15% 13,519
Total 500.11
Table 30:Expenses Summary
Capital expenditure
summary
Cost (JD) Contingency Cost (JD) %
Land 135,000 10% 148,500 15.9%
Construction works 546,800 10% 601,480 29.3%

Tourist resort and restaurant - Jerash
29 29 29
Capital expenditure
summary
Cost (JD) Contingency Cost (JD) %
Machinery &Equipment 14,500 10% 15,950 1.2%
Furniture 81,250 10% 89,375 0.9%
Vehicles 23,400 10% 25,740 1.2%
Pre-Operating Expenses 8,500 10% 9,350 9.0%
Working capital 90,825 10% 99,907 19.1%
Total (JD) 900,275 990,302 100%
Source of funding
The financing structure of the project consists of loans and Equity. The investment cost of this
project is estimated at (990,302) JD, where 60% of the project will be financed through loans
(594,181) JD, and the remaining (40%) through (Equity) with (396,121) JD. The following table
summarizes the general structure of the required financing:
Table 31:Sources of Funding
Funding Sources Amount Percentage
Equity
(Self Financing)
396,121 49% Loans 594,181 29%
Total 5500001 100%
Use of Fund: Value Ratio
Capital Expenditures 881,045 88.03%
Pre-Operating Expenses 9,350 9.04%
Working Capital 99,907 19.90%
Total 5500001 100800%

Tourist resort and restaurant - Jerash
30 30 30
Operating Expenses
The following table sumarizes the expected operating expenses for the proposed project (2018-2027):
Table 32:Operating Expenses
Description 2018 2019 2020 2021 2022 2023 2024 2025 2026 2023
Raw Materials and
Packaging from
Revenues
05,882 191,315 193,011 114,400 111,422 118,820 102,311 145,902 150,820 120,100
Utilities from Revenues 10,031 15,401 12,089 18,210 09,022 01,112 04,138 02,150 08,423 49,819
Maintenance from
Revenues
4,304 5,982 5,002 5,315 2,930 2,440 2,802 3,151 3,200 8,121
Disposables from
Revenues
4,304 5,982 5,002 5,315 2,930 2,440 2,802 3,151 3,200 8,121
Direct Salaries 110,199 118,151 100,590 108,080 144,281 159,214 152,380 120,113 120,090 132,835
Others 15,125 12,558 13,019 10,055 09,822 01,458 04,105 05,091 03,320 00,315
Total 277,911 292,139 307,122 322,904 339,526 357,036 375,483 394,918 415,395 436,974

Tourist resort and restaurant - Jerash
31 31 31
General and Administrative Expenses
The following table sumarizes the expected general and administrative expenses for the proposed project (2018-2027):
Table 33:General and Administrative Expenses
Description 2018 2019 2020 2021 2022 2023 2024 2025 2026 2023
Telecom 359 330 302 819 844 820 802 011 059 030 Hospitality 199 192 111 110 115 101 100 142 150 121
Staionary and
Printing
159 158 125 130 181 109 100 093 013 012
Transportaton 359 330 302 819 844 820 802 011 059 030
Training 1,999 1,909 1,921 1,900 1,112 1,150 1,104 1,109 1,123 1,095
Insurance 2,298 2,892 3,919 3,111 3,403 3,229 3,809 8,113 8,031 8,211
Miscellaneous 052 084 1,914 1,944 1,932 1,198 1,141 1,135 1,111 1,143
Total 100111
10,514
10,829 110111
11,154
1101.5
11,489
110.00
11,833
1101..
12,188
110111
12,554
110500
12,930
10001.
13,318
100,1.
13,718
Marketing Expenses
The Following table shows the marketing expenses for the proposed project, which is 50% of the revenus based on the assumption of the study team:

Tourist resort and restaurant - Jerash
32 32 32
Table 34:Marketing Expense
Description 2018 2019 2020 2021 2022 2023 2024 2025 2026 2023
Marketing Expenses 4,304 5,982 5,002 5,315 2,930 2,440 2,802 3,151 3,200 8,121
Total 4,794 5,086 5,396 5,725 6,073 6,443 6,836 7,252 7,693 8,162
Human Resources
The total annual salaries and monthly wages has been estimated on 16 months for the purpose of considering annual increments on salaries as well as payments
related to social security and health insurance,… etc.
The following table summarizes the expected annual salaries and wages, considering annual increment on salaries as per the income statement:
Table 35:Expected Salaries and Wges (2027-2018)
Job Title Number Monthly Salary (JD) Total Monthly Salary
(JD)
Total Annual Salary
(JD)
Indirect Employees
General Manager 1 1,599 1,599 49,999
Accountant 1 299 299 0,299
Marketing Representative 1 099 099 14,499
Gurad 1 109 089 2,989
Total indirect salaries 1 100.0 ,000.0

Tourist resort and restaurant - Jerash
33 33 33
Direct Employees
Receptionst 2 300 299 0,299
Chef 1 1,500 1,599 14,999
Assistant Chef 2 800 1,299 15,299
Waiter 10 300 0,999 48,999
Cleaning Labor 5 200 1,999 12,999
Total direct salaries 10 ,0,00 1100100 Total Salaries 25 7,700 123,200
Depreciations
The following tables illustrate cost of Capex and Depreciaition rates:
Table 36:Capex and Depreciation Expenses
Capex Cost and Annual Depreciation Rates
Cost (JOD) Depreciation Rate Annual Additions Percentage
Land 148,599 9.9% 9.9% Construction Works 291,489 5.9% 9.9%
Machineries 15,059 19.9% 1.9%
Furniture 80,035 19.9% 5.9%
Vehicles 15,349 19.9% 9.9%
Total ..10011

Tourist resort and restaurant - Jerash
34 34 34
Table 37:Depreciations and Additions on Construction Works
Capex, Annual Additions and Depreciaitions
1918 1910 1919 1911 1911 1910 1914 1915 1912 1913
Total Fixed Assets 881,945 885,800 809,859 802,190 091,211 093,008 010,450 010,891 012,452 000,401
Total Depreciation Expenses 40,181 40,250 44,121 44,283 45,108 45,812 42,411 43,952 43,311 48,410
Total Accumulated Depreciation 40,181 82,849 101,991 135,288 119,012 122,341 010,120 029,110 493,041 452,029
Total Additions 9 4,388 5,918 5,150 5,511 5,333 2,952 2,048 2,254 2,032
Total Net Book Values .0,0.21 ,5.0550 ,150.10 ,100111 2.00251 2100212 2000150 11501.1 11.0111 1,,00,1
Loan
The table below summarizes all details related to the loan such as annual installments and payment methods for the remaining amount of the loan for each year of
the project to 2020.
Table 38:Loan Details
Loan Value 594,181
Annual Interst Rate 9.48%
Loans Period 5
Loan Starts at year: 2018
Annual Payment 154,667

Tourist resort and restaurant - Jerash
35 35 35
Number of Payments 5
Year Annual Payment Interest Capital Loan Remaining Value
101. 594,181 1015 154,667 56,328 98,338 495,843
1010 154,667 47,006 107,661 388,182
1011 154,667 36,800 117,867 270,315
1011 154,667 25,626 129,041 141,274
2023 154,667 13,393 141,274 0
Income Statement
Basen on financial information and analysis of the financial expenses of the project, the estimated income statement for the years (2018-2027) will be as shown in
the following table:
Table 39:Income Statement
Description 2018 2019 2020 2021 2022 2023 2024 2025 2026 2027
Revenues
Sales Revenues 430,409 598,213 500,290 531,424 293,018 244,014 280,550 315,181 320,044 812,103
Gross Operating Revenues 430,409 598,213 500,290 531,424 293,018 244,014 280,550 315,181 320,044 812,103
Operating Expenses (133,011
)
(101,100
)
(093,111
)
(011,094
)
(000,512
)
(053,902
)
(035,480
)
(004,018
)
(415,005
)
(402,034
) Gross Operating Profit 191,510 112,480 101,489 140,521 123,891 183,138 098,939 009,120 050,040 030,114

Tourist resort and restaurant - Jerash
36 36 36
Description 2018 2019 2020 2021 2022 2023 2024 2025 2026 2027
Gross Profit Percentage 41% 40% 40% 44% 44% 45% 45% 42% 42% 42%
Salaries and Benefits (Indirect Staff) (39,989) (31,050) (35,044) (30,958) (81,100) (85,234) (80,182) (01,840) (02,259) (199,211
) General and Administraive Expenses (19,514) (19,810) (11,154) (11,480) (11,800) (11,188) (11,554) (11,009) (10,018) (10,318)
Markeing Expenses (4,304) (5,982) (5,002) (5,315) (2,930) (2,440) (2,802) (3,151) (3,200) (8,121)
Pre Operating Expenses (0,059)
Gross Indirect Expenses (04,308) (88,820) (01,404) (02,131) (199,192
)
(194,095
)
(198,532
)
(110,915
)
(113,221
)
(111,401
) Income before Interest, Depreciation and
Tax
192,381 113,219 100,082 150,109 123,505 181,030 100,404 113,108 102,188 152,301
Fixed Assets Depreciations (40,181) (40,250) (44,121) (44,283) (45,108) (45,812) (42,411) (43,952) (43,311) (48,410)
Income before Tax and Interests 20,291 80,021 05,815 198,290 111,053 103,153 150,930 139,181 188,522 198,010
Bank Interests (52,018) (43,992) (02,899) (15,212) (10,000) 9 9 9 9 9
Income Before Tax 3,131 02,055 50,915 81,033 198,025 103,153 150,930 139,181 188,522 198,010
Income Tax (024) (1,848) (1,051) (4,140) (5,448) (2,858) (3,254) (8,590) (0,418) (19,412)
Net Profit 2,090 05,193 52,934 38,818 190,512 109,100 145,410 121,230 130,108 103,803
Net Profit Percentage 1% 3% 19% 14% 13% 19% 11% 11% 10% 14%
Compulsory Reserves (201) (0,511) (5,293) (3,880) (19,051) (10,909) (14,541) (12,123) (13,014) (10,309)
Retained Earnings 2,118 03,814 88,181 150,112 151,001 020,229 599,503 242,940 893,123 085,034
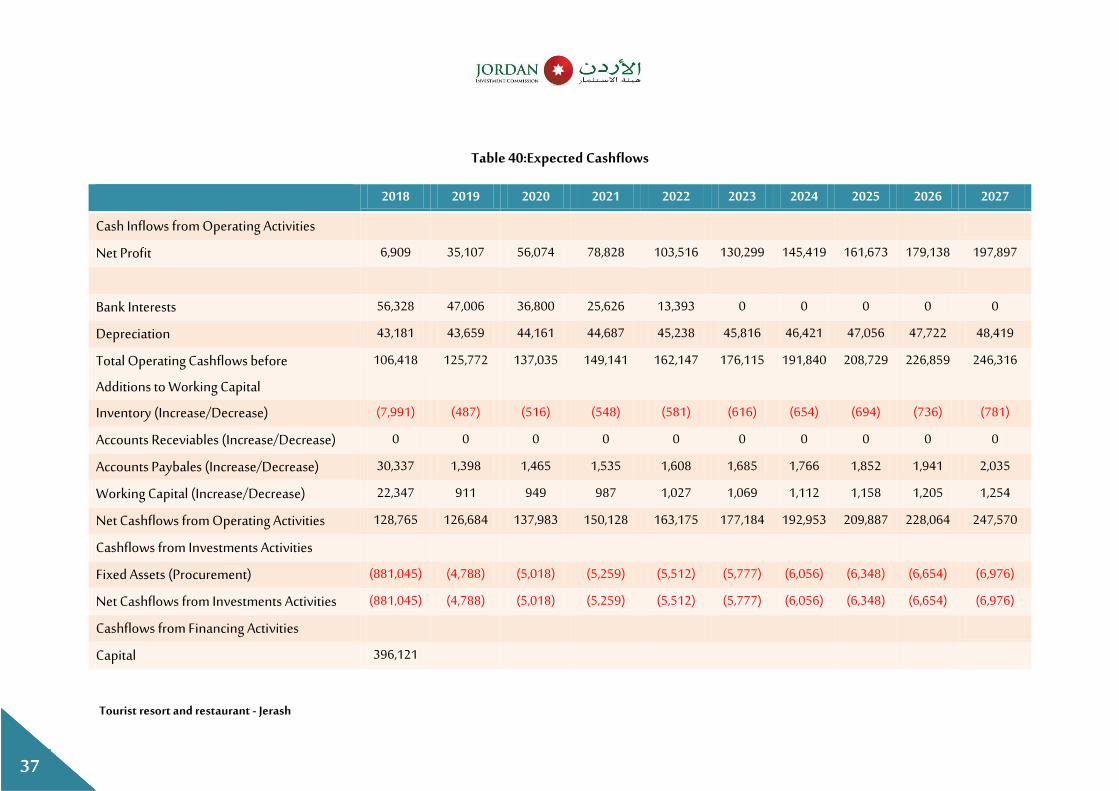
Expected Cashflows Statement
The table bellow summarizes project cashflows statement, where net cash flows are positive during all years as below:
Tourist resort and restaurant - Jerash
37 37 37
Table 40:Expected Cashflows
101. 1015 1010 1011 1011 1010 1011 1011 1012 101,
Cash Inflows from Operating Activities
Net Profit 2,090 05,193 52,934 38,818 190,512 109,100 145,410 121,230 130,108 103,803
Bank Interests 52,018 43,992 02,899 15,212 10,000 9 9 9 9 9
Depreciation 40,181 40,250 44,121 44,283 45,108 45,812 42,411 43,952 43,311 48,410
Total Operating Cashflows before
Additions to Working Capital
192,418 115,331 103,905 140,141 121,143 132,115 101,849 198,310 112,850 142,012
Inventory (Increase/Decrease) (3,001) (483) (512) (548) (581) (212) (254) (204) (302) (381)
Accounts Receviables (Increase/Decrease) 9 9 9 9 9 9 9 9 9 9
Accounts Paybales (Increase/Decrease) 09,003 1,008 1,425 1,505 1,298 1,285 1,322 1,851 1,041 1,905
Working Capital (Increase/Decrease) 11,043 011 040 083 1,913 1,920 1,111 1,158 1,195 1,154
Net Cashflows from Operating Activities 118,325 112,284 103,080 159,118 120,135 133,184 101,050 190,883 118,924 143,539
Cashflows from Investments Activities
Fixed Assets (Procurement) (881,945) (4,388) (5,918) (5,150) (5,511) (5,333) (2,952) (2,048) (2,254) (2,032)
Net Cashflows from Investments Activities (881,945) (4,388) (5,918) (5,150) (5,511) (5,333) (2,952) (2,048) (2,254) (2,032)
Cashflows from Financing Activities
Capital 002,111

Tourist resort and restaurant - Jerash
38 38 38
101. 1015 1010 1011 1011 1010 1011 1011 1012 101,
Loan Amortization (08,008) (193,221) (113,823) (110,941) (141,134) 9 9 9 9 9
Bank Interest Rate (52,018) (43,992) (02,899) (15,212) (10,000) 9 9 9 9 9
Loans 504,181 9 9 9 9 9 9 9 9 9
Net Cashflows from Financing Activities 805,205 (154,223) (154,223) (154,223) (154,223) 9 9 9 9 9
Net (Increase/Decrease) in Cash 80,055 (01,331) (11,391) (0,308) 1,002 131,493 182,803 190,500 111,419 149,504
Cashflows at the Beginning of Period 9 80,055 59,584 18,880 10,982 11,981 100,488 089,082 580,015 895,004
Cashflows at the End of Period 80,055 59,584 18,880 10,982 11,981 100,488 089,082 580,015 895,004 1,945,018
Expected Balance Sheet
The balance sheet is one of the main statements which the project depends on, as it reflects the financial position of the entity and is usually estimated on the last
day of the financial year.
All financial information and analysis of the project shall be the estimated for the years (2018-2027) as shown in the table below:
Table 41:Expected Balance Sheet
Description 101. 1015 1010 1011 1011 1010 1011 1011 1012 101,
Assets
Current Assets
Cash 83,355 50,584 28,883 19,086 22,082 193,488 380,386 583,925 805,334 1,045,928

Tourist resort and restaurant - Jerash
39 39 39
Description 101. 1015 1010 1011 1011 1010 1011 1011 1012 101,
Inventory 7,991 8,477 8,993 9,541 10,122 10,739 11,393 12,086 12,822 13,603
Accounts Receivable 0 0 0 0 0 0 0 0 0 0
Total current Assets 91,346 59,061 37,877 28,627 32,204 204,227 391,778 596,011 818,157 1,059,531
Non Current Assets
Fixed Assets (net) 837,865 798,993 759,850 720,421 680,695 640,656 600,290 559,582 518,515 477,072
Total Non Current Assets 837,865 798,993 759,850 720,421 680,695 640,656 600,290 559,582 518,515 477,072
Total Assets 929,210 858,054 797,726 749,048 712,899 844,883 992,069 1,155,593 1,336,672 1,536,603
Liabilities
Current Liabilities
Paybles 30,337 31,736 33,200 34,735 36,343 38,029 39,795 41,647 43,588 45,622
Remaining amount of Loan 107,661 117,867 129,041 141,274 0 0 0 0 0 0
Total current Liabilities 137,998 149,603 162,241 176,009 36,343 38,029 39,795 41,647 43,588 45,622
Non Current Liabilities
Long Terms Loans 388,182 270,315 141,274 0 0 0 0 0 0 0
Total Long Term Liabilities 388,182 270,315 141,274 0 0 0 0 0 0 0
Total Liabilities 526,180 419,918 303,515 176,009 36,343 38,029 39,795 41,647 43,588 45,622
Owners Equity
Shareholders Contributions 396,121 396,121 396,121 396,121 396,121 396,121 396,121 396,121 396,121 396,121
Statutory Reseve 691 4,202 9,809 17,692 28,043 41,073 55,615 71,783 89,696 109,486
Retained Profits 6,218 37,814 88,281 159,226 252,391 369,660 500,537 646,043 807,267 985,374
Tourist resort and restaurant - Jerash
40 40 40
Description 101. 1015 1010 1011 1011 1010 1011 1011 1012 101,
Total Equity 403,030 438,137 494,211 573,039 676,555 806,854 952,273 1,113,946 1,293,084 1,490,981
Total Liabilities and Equity 929,210 858,054 797,726 749,048 712,899 844,883 992,069 1,155,593 1,336,672 1,536,603
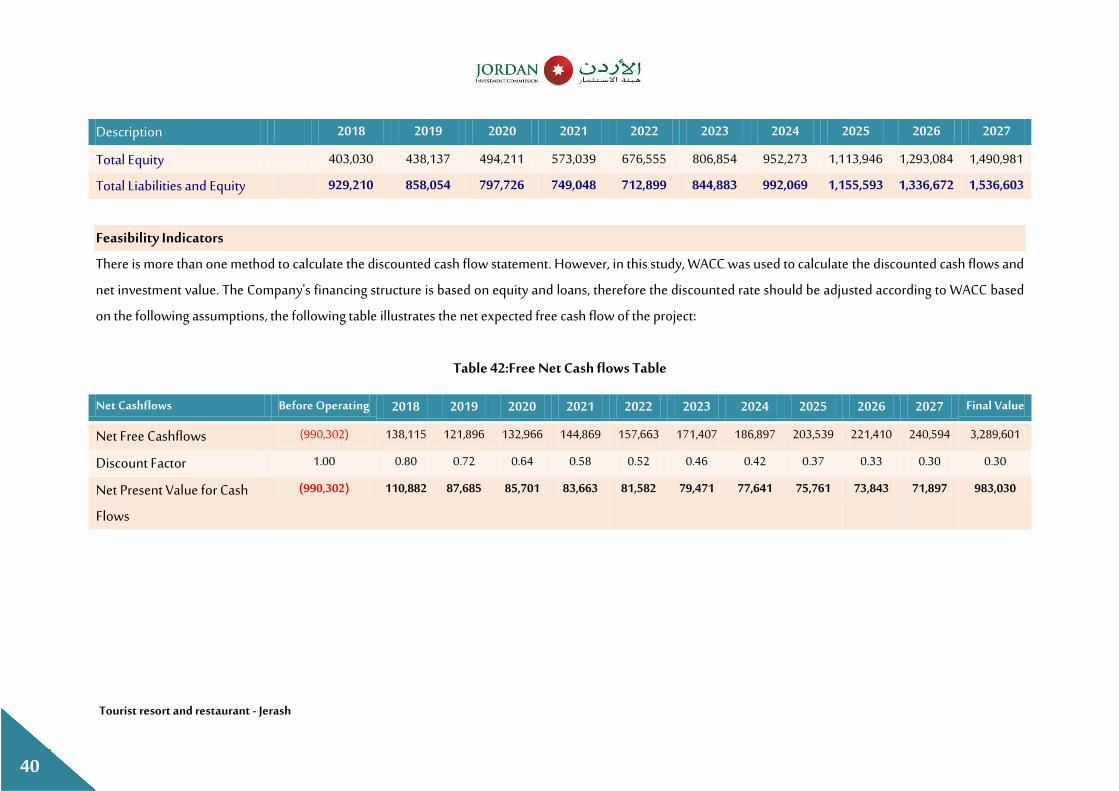
Feasibility Indicators
There is more than one method to calculate the discounted cash flow statement. However, in this study, WACC was used to calculate the discounted cash flows and
net investment value. The Company's financing structure is based on equity and loans, therefore the discounted rate should be adjusted according to WACC based
on the following assumptions, the following table illustrates the net expected free cash flow of the project:
Table 42:Free Net Cash flows Table
Net Cashflows Before Operating 2018 2019 2020 2021 2022 2023 2024 2025 2026 2027 Final Value
Net Free Cashflows (009,091) 108,115 111,802 101,022 144,820 153,220 131,493 182,803 190,500 111,419 149,504 0,180,291
Discount Factor 1.99 9.89 9.31 9.24 9.58 9.51 9.42 9.41 9.03 9.00 9.09 9.09
Net Present Value for Cash
Flows
(5500001) 1100..1 .,02.1 .10,01 .00220 .101.1 ,501,1 ,,0211 ,10,21 ,00.10 ,10.5, 5.00000

Tourist resort and restaurant - Jerash
41 41 41
Summary of Feasibility Indicators
1. Payback Period
Table bellow illustrates payback period for the project, as it is one of the indicators which investors care about before taking the investment decision as they need to
know when the project will return the invested amount of money. Payback period definition is the total required period so that the project generates total money
equal to the total invested capital expenditure, as investor is always looking to return the full invested amount of money at the earliest possible.
Table 43: Payback Period
Payback Period Before Operating 2018 2019 2020 2021 2022 2023 2024 2025 2026 2027
Net Free Cashflows (009,091) 108,115 111,802 101,022 144,820 153,220 131,493 182,803 190,500 111,419 149,504
Project Value Returned 009,091 851,183 309,101 503,012 451,453 104,304 110,083 (20,519) (123,940) (488,450) (310,950)
Payback Period (Year) 2 1 1 1 1 1 1 9 9 9 9
2. Net Present Value
The net present value of the investment project indicates the difference between the present value of the cash inflows generated by the project and the present
value of the project's outflows. If the NPV is positive - ie, the present value of the inflows increase than the cash outflows - the investment project is profitable, and
vice versa. If there is more than one investment option, the option that gives the largest net present value is preferred.
3. Internal Rate of Return
The IRR is one of the most important criteria used for evaluating and comparing different investment projects. It is currently used by the World Bank in all types of
financial and economic analysis of projects. As well as by most IFIs when they accept or reject projects submitted for funding. This criterion is at the rate at which
the present value of cash flows is equal to the present value of the cash outflows of the project, ie the discount rate at which the net present value of the investment
project is zero. The following table shows the results of the financial analysis of the project:
Tourist resort and restaurant - Jerash
42 42 42
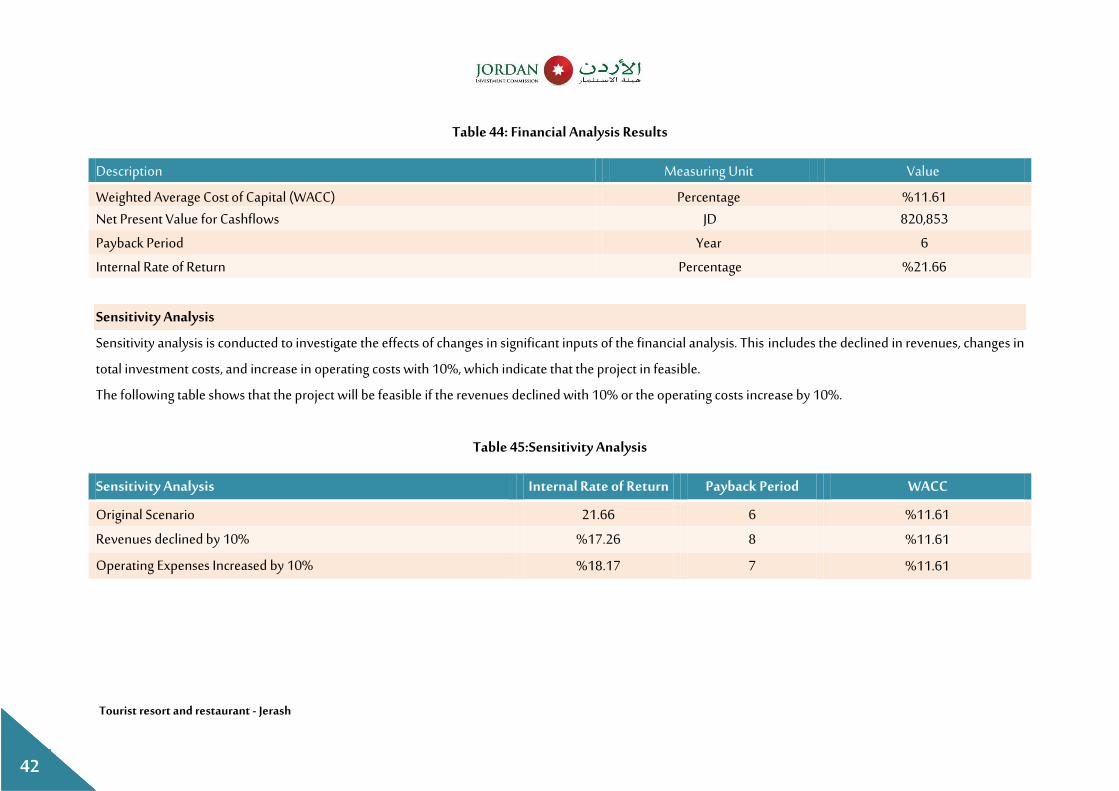
Table 44: Financial Analysis Results
Description Measuring Unit Value
Weighted Average Cost of Capital (WACC) Percentage 11.21% Net Present Value for Cashflows JD 819,850
Payback Period Year 2
Internal Rate of Return Percentage 11.22%
Sensitivity Analysis
Sensitivity analysis is conducted to investigate the effects of changes in significant inputs of the financial analysis. This includes the declined in revenues, changes in
total investment costs, and increase in operating costs with 10%, which indicate that the project in feasible.
The following table shows that the project will be feasible if the revenues declined with 10% or the operating costs increase by 10%.
Table 45:Sensitivity Analysis
Sensitivity Analysis Internal Rate of Return Payback Period WACC
Original Scenario 11.22 2 11.21%
Revenues declined by 10% 13.12% 8 11.21%
Operating Expenses Increased by 10% 18.13% 3 11.21%
Tourist resort and restaurant - Jerash
43 43 43
Conclusions and Recommendations
Based on the profitability analysis and considering that project inrernal rate of return is higher than WACC, it is concluded that the project is feasible as the net
present value for the project is positive 820,853Jordan Dinars considering that the project provides 25 Job Opportunitites for the governorate residents.


