Observational and modeling constraints on enrichment and the implications for the future
Helen M. Amos, Jeroen E. Sonke, Daniel Obrist, Nicole Hagan, Hannah M. Horowitz, Robert P. Mason, Melanie Witt, Ian
Hedgecock, E. S. Corbitt, Elsie M. Sunderland
ICMGP – Jeju, South Korea 15 June 2015

LITHOSPHERE
SOIL OCEAN
Humans have perturbed the global Hg cycle – But how much? Implications for the future?
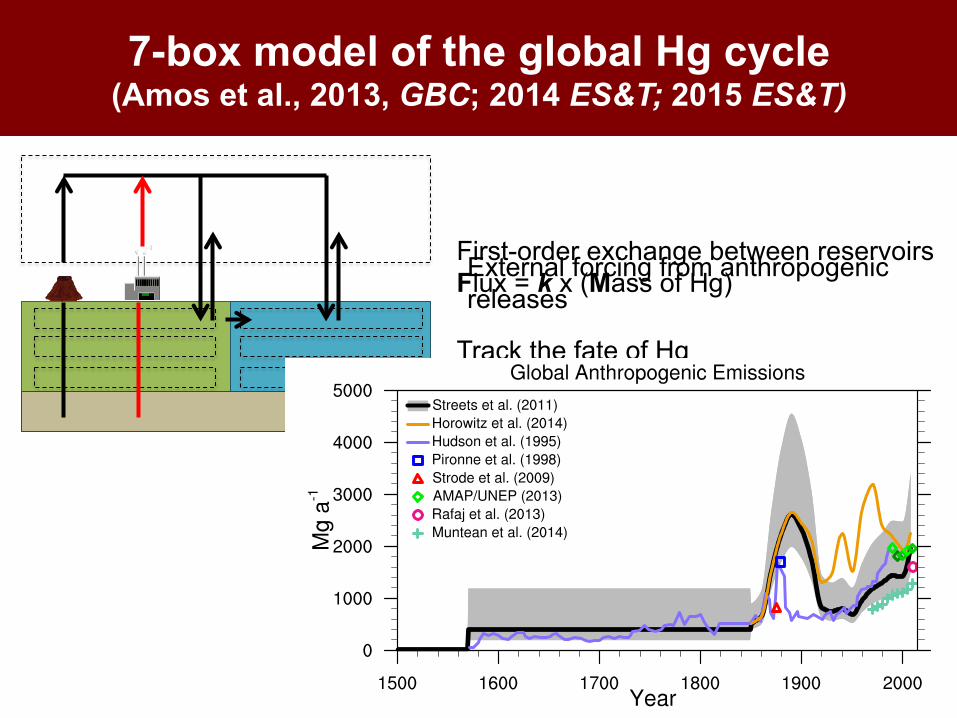
First-order exchange between reservoirs Flux = k x (Mass of Hg)
7-box model of the global Hg cycle (Amos et al., 2013, GBC; 2014 ES&T; 2015 ES&T)
Track the fate of Hg
1 10 100 1,000 10,0000
0.5
1
Frac
tion
Atmospheric pulse
1 10 100 1,000 10,0000
0.5
1
Frac
tion
Fast terrestrial pulse
1 10 100 1,000 10,0000
0.5
1
Frac
tion
Time (years)
Surface ocean pulse
atmospherefast terrestrialslow soilarmored soilsurface oceansubsurface oceandeep oceanocean margin sedimentdeep ocean sediment
Time (years)
atmosphere slow soil armored soil
ocean margin
sediment
deep ocean sediment
Fate of a pulse to the atmosphere
External forcing from anthropogenic releases

Use model to explore impacts of uncertainty in cycling and emissions
Scenarios 1 & 2 Published emissions
Scenario 3 Larger geogenic source
Scenario 4 Greater ocean evasion
Scenario 5 Greater retention in soils
Scenario 6 More sediment burial

OCEAN
Use multiple lines of evidence to evaluate plausibility of scenarios
Aircraft Surface air
Soil Seawater
Historical documents
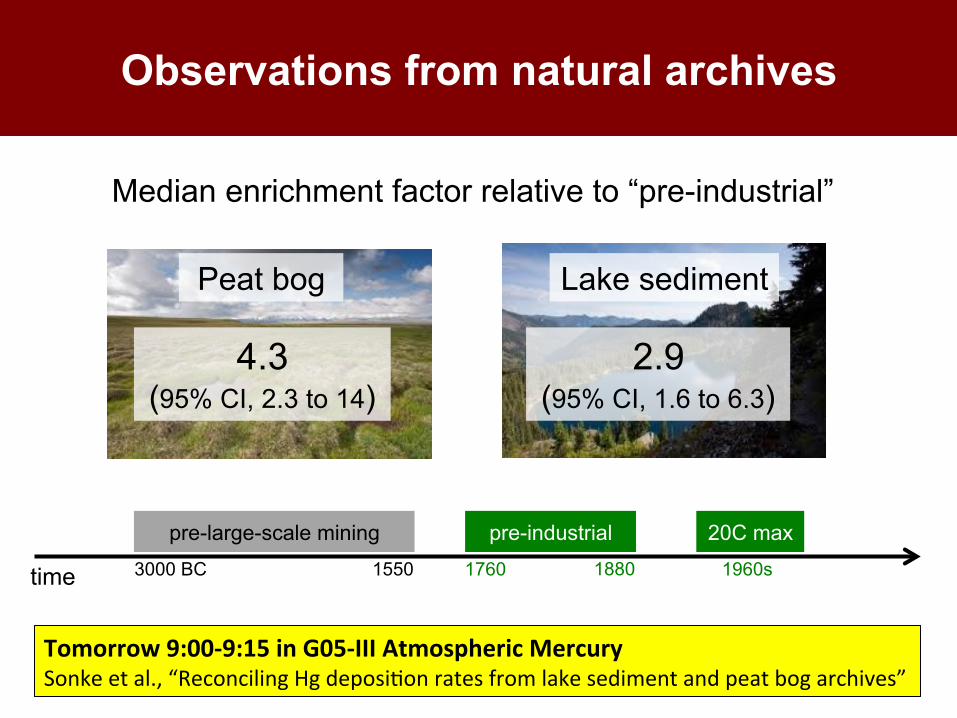
Observations from natural archives
Median enrichment factor relative to “pre-industrial”
Peat bog Lake sediment
2.9 (95% CI, 1.6 to 6.3)
4.3 (95% CI, 2.3 to 14)
Tomorrow 9:00-‐9:15 in G05-‐III Atmospheric Mercury Sonke et al., “Reconciling Hg deposi5on rates from lake sediment and peat bog archives”
time
pre-large-scale mining pre-industrial 20C max
3000 BC 1550 1760 1880 1960s
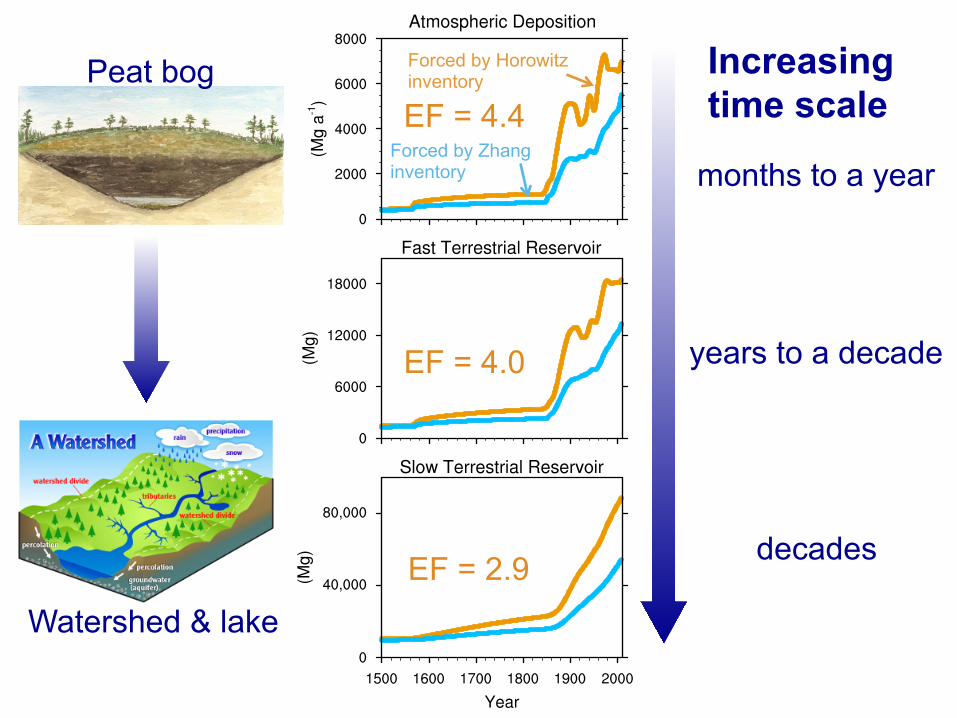
Increasing time scale
months to a year
years to a decade
decades
Peat bog
Watershed & lake
Forced by Horowitz inventory
Forced by Zhang inventory
EF = 4.0
EF = 4.4
EF = 2.9
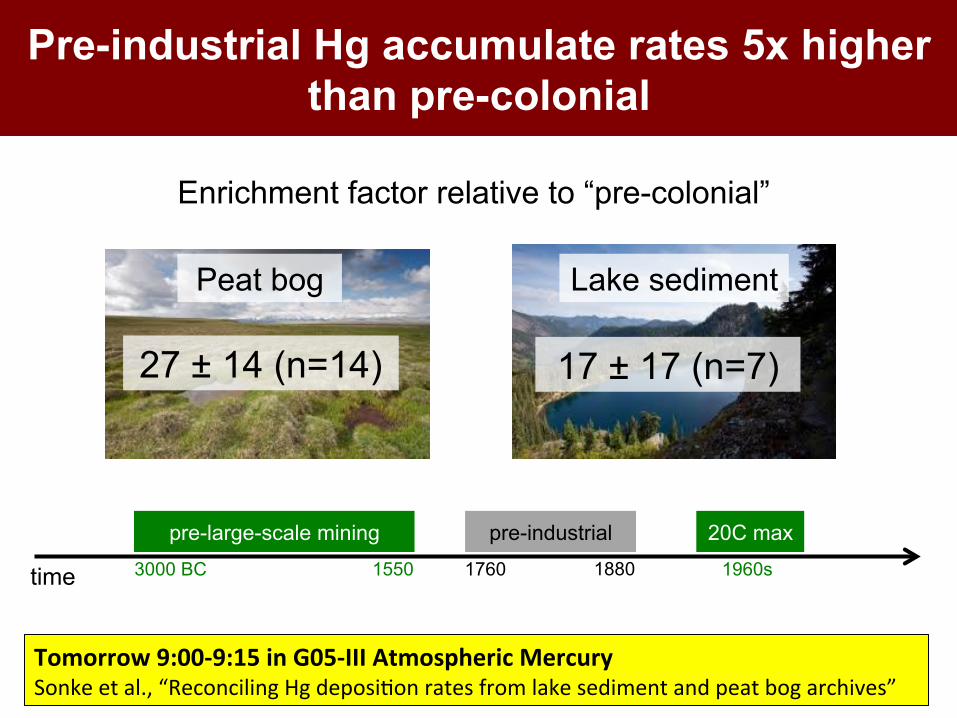
Pre-industrial Hg accumulate rates 5x higher than pre-colonial
Enrichment factor relative to “pre-colonial”
Peat bog Lake sediment
17 ± 17 (n=7) 27 ± 14 (n=14)
Tomorrow 9:00-‐9:15 in G05-‐III Atmospheric Mercury Sonke et al., “Reconciling Hg deposi5on rates from lake sediment and peat bog archives”
time
pre-large-scale mining pre-industrial 20C max
3000 BC 1550 1760 1880 1960s
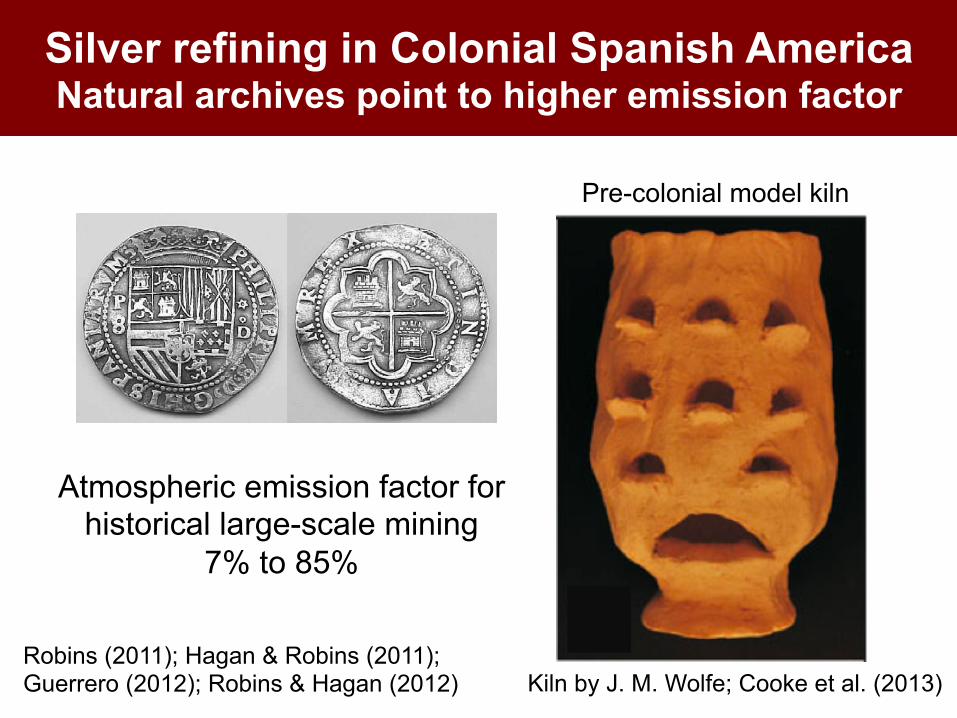
Silver refining in Colonial Spanish America Natural archives point to higher emission factor
Kiln by J. M. Wolfe; Cooke et al. (2013)
Pre-colonial model kiln
Atmospheric emission factor for historical large-scale mining
7% to 85%
Robins (2011); Hagan & Robins (2011); Guerrero (2012); Robins & Hagan (2012)

Atmosphere (Mg)
Upper Ocean (pM)
Deep Ocean (pM)
Soil (Mg)
Ocean Evasion
(ng m-‐2 hr-‐1)
Terrestrial Re-‐emission (ng m-‐2 hr-‐1)
Pre-‐industrial Enrichment
Factor (unitless)
All-‐Kme Enrichment
Factor (unitless)
peat
Amos et al. (2014) Mining emissions 3x Zero pre-‐1850 emissions
Greater geogenic emissions Greater soil reten5on Greater burial
Increased ocean evasion
Amos et al. (2015)
sediment
Using observations to evaluate plausibility of different scenarios of cycling and emissions
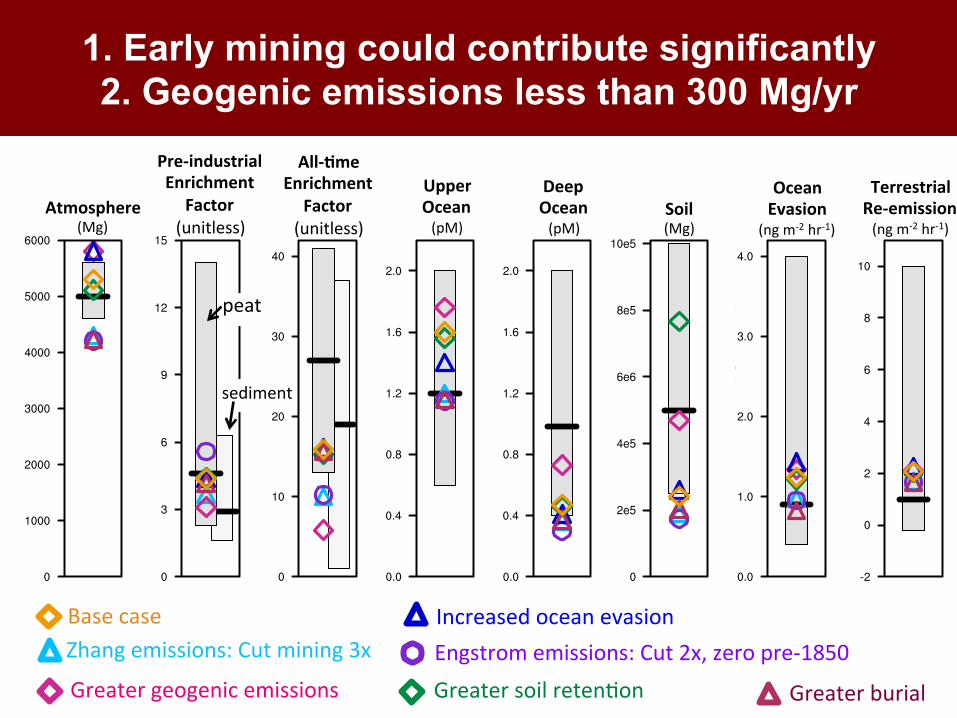
Atmosphere (Mg)
Upper Ocean (pM)
Deep Ocean (pM)
Soil (Mg)
Ocean Evasion
(ng m-‐2 hr-‐1)
Terrestrial Re-‐emission (ng m-‐2 hr-‐1)
Pre-‐industrial Enrichment
Factor (unitless)
All-‐Kme Enrichment
Factor (unitless)
peat
sediment
Base case Zhang emissions: Cut mining 3x Engstrom emissions: Cut 2x, zero pre-‐1850 Greater geogenic emissions Greater soil reten5on Greater burial
Increased ocean evasion
1. Early mining could contribute significantly 2. Geogenic emissions less than 300 Mg/yr
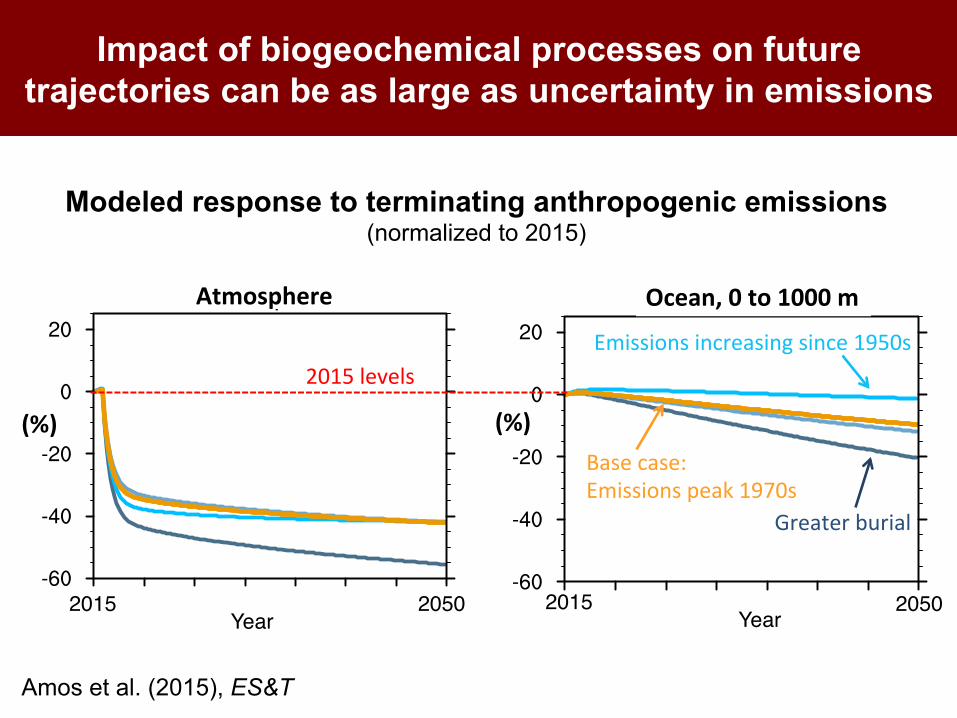
Impact of biogeochemical processes on future trajectories can be as large as uncertainty in emissions
Atmosphere Ocean, 0 to 1000 m
Modeled response to terminating anthropogenic emissions (normalized to 2015)
(%) (%)
2015! 2015!2050! 2050!Year! Year!
2015 levels Emissions increasing since 1950s
Base case: Emissions peak 1970s
Greater burial
Amos et al. (2015), ES&T
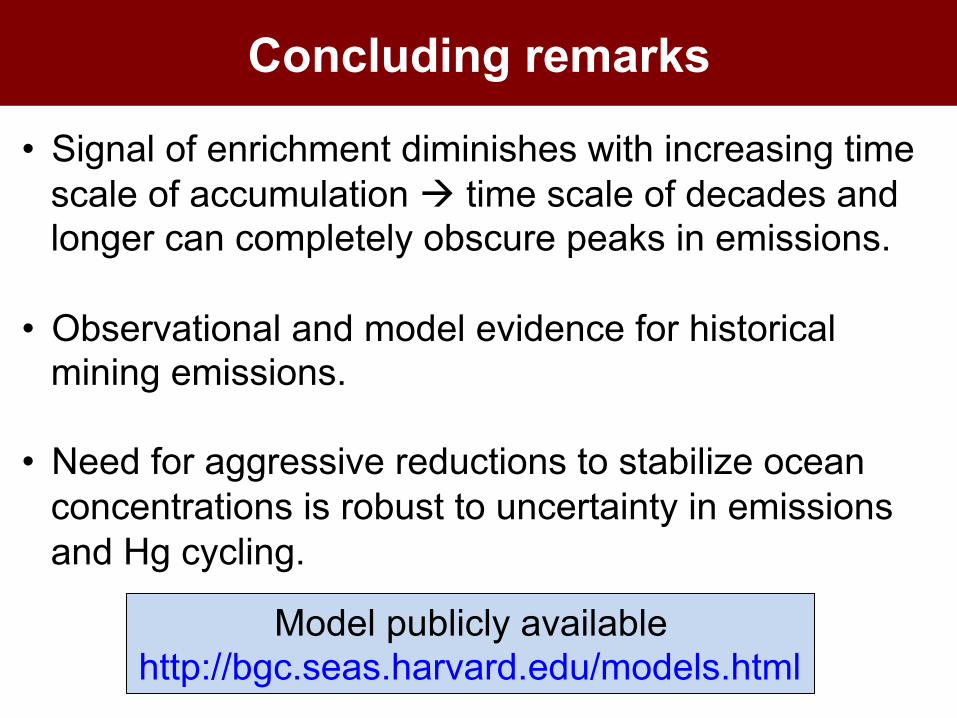
Concluding remarks • Signal of enrichment diminishes with increasing time
scale of accumulation à time scale of decades and longer can completely obscure peaks in emissions.
• Observational and model evidence for historical mining emissions.
• Need for aggressive reductions to stabilize ocean
concentrations is robust to uncertainty in emissions and Hg cycling.
Model publicly available http://bgc.seas.harvard.edu/models.html
Thanks to our funders
US Environmental Protection Agency
Contract No. EP-11-H-0013646
European Research Council Grant ERC-2010-StG_20091028


