Download - Dosimetry and beam calibration - aapm.org
1
Dosimetry and beam calibration
Hugo Palmans1,2 and Stanislav Vatnitksy1
1 EBG MedAustron GmbH, Wiener Neustadt, Austria 2 National Physical Laboratory, Teddington, UK
2
Overview - Learning objectives
• What are potential primary standard instruments for proton dosimetry, how do they work specifically for protons.
• The principles of reference dosimetry using calibrated ionization chambers
• Dosimetry protocols and data
• Reference dosimetry of small and scanned beams
• Instruments for micro- and nano-dosimetry
3
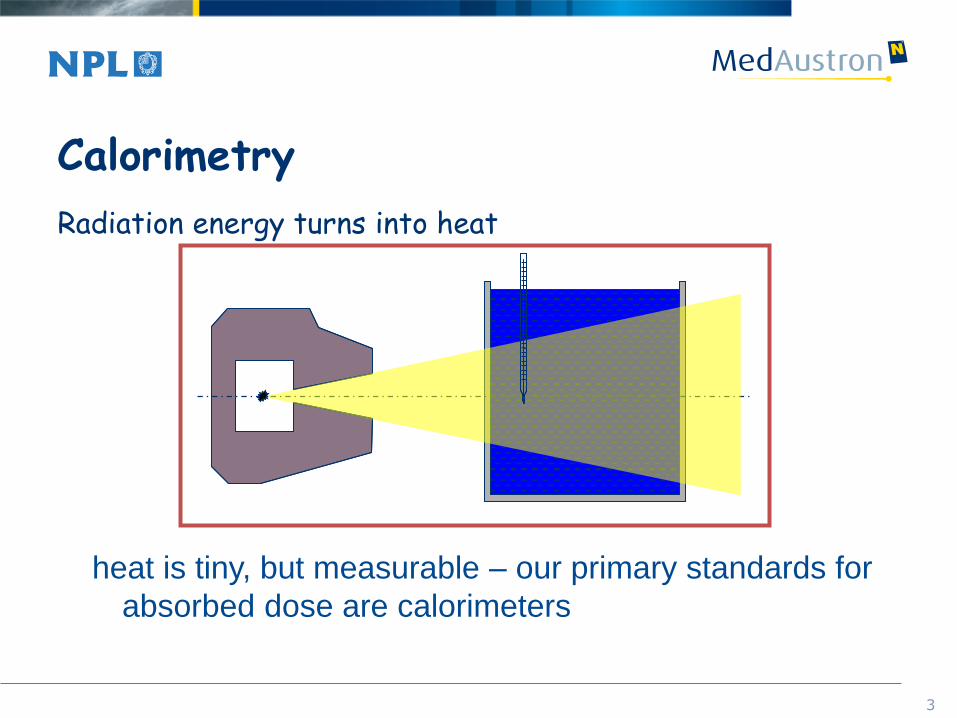
Calorimetry
Radiation energy turns into heat
heat is tiny, but measurable – our primary standards for
absorbed dose are calorimeters
4
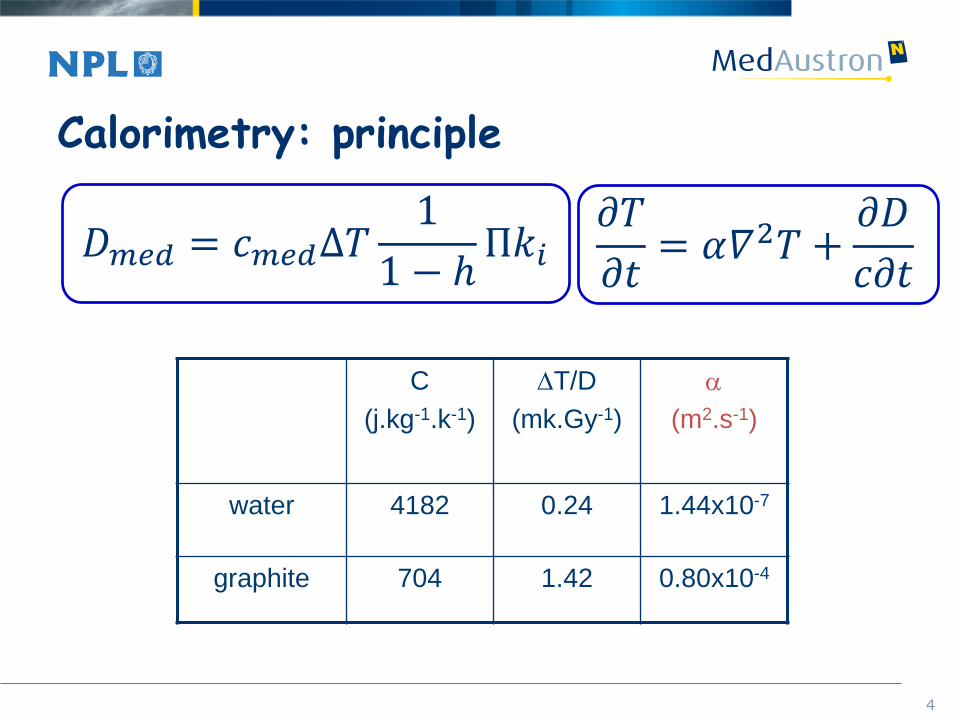
𝐷𝑚𝑒𝑑 = 𝑐𝑚𝑒𝑑∆𝑇
Calorimetry: principle
C
(j.kg-1.k-1)
T/D
(mk.Gy-1)
(m2.s-1)
water 4182 0.24 1.44x10⁻⁷
graphite 704 1.42 0.80x10⁻⁴
𝐷𝑚𝑒𝑑 = 𝑐𝑚𝑒𝑑∆𝑇1
1 − ℎΠ𝑘𝑖
𝜕𝑇
𝜕𝑡= 𝛼𝛻2𝑇 +
𝜕𝐷
𝑐𝜕𝑡
5
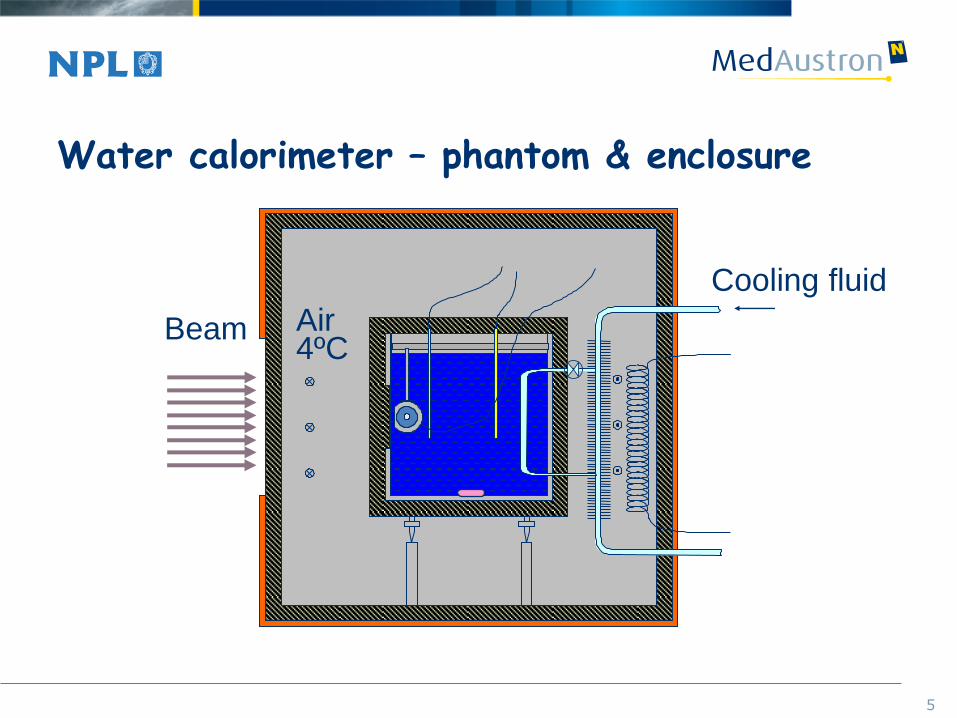
Water calorimeter – phantom & enclosure
Cooling fluid
Air 4ºC
Beam
6
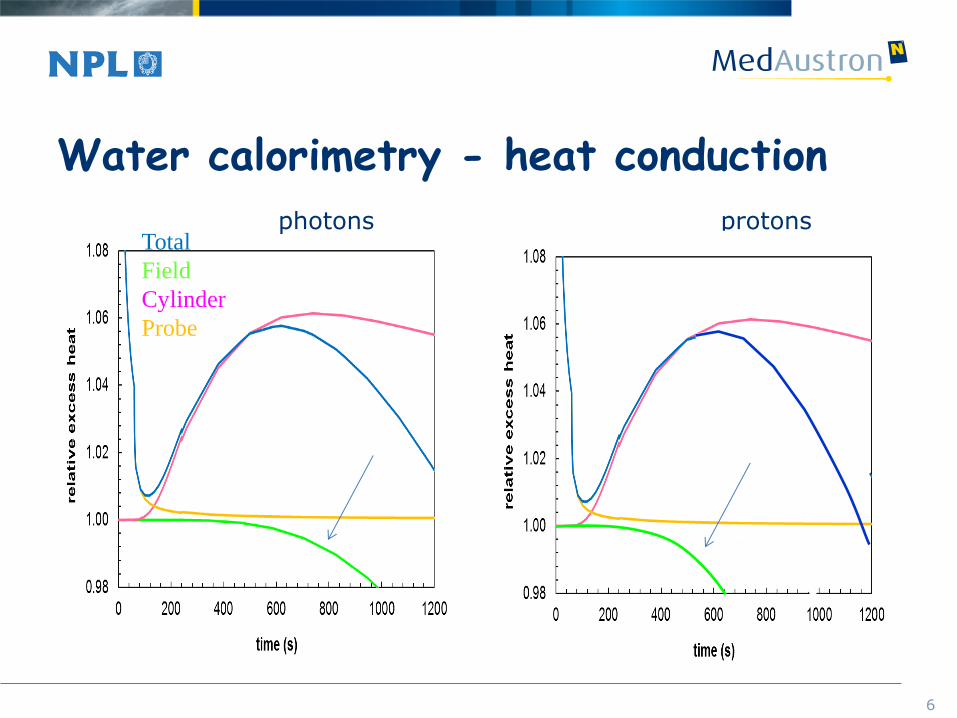
Water calorimetry - heat conduction
Total
Field
Cylinder
Probe
photons protons
7
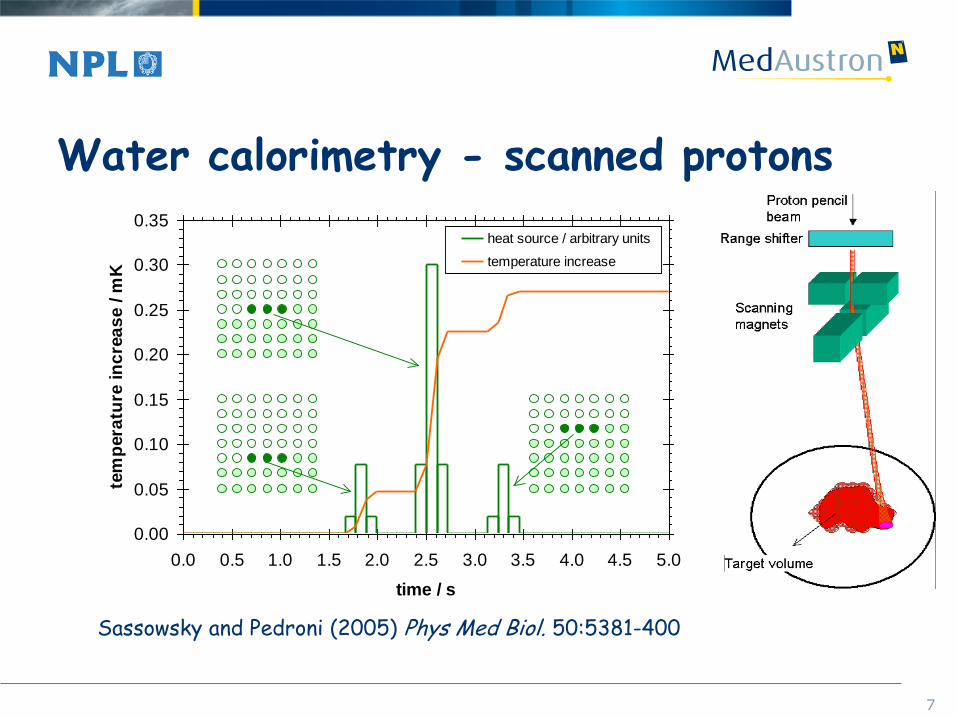
Water calorimetry - scanned protons
Sassowsky and Pedroni (2005) Phys Med Biol. 50:5381-400
0.00
0.05
0.10
0.15
0.20
0.25
0.30
0.35
0.0 0.5 1.0 1.5 2.0 2.5 3.0 3.5 4.0 4.5 5.0
time / s
tem
pera
ture
in
cre
as
e /
mK
heat source / arbitrary units
temperature increase
8
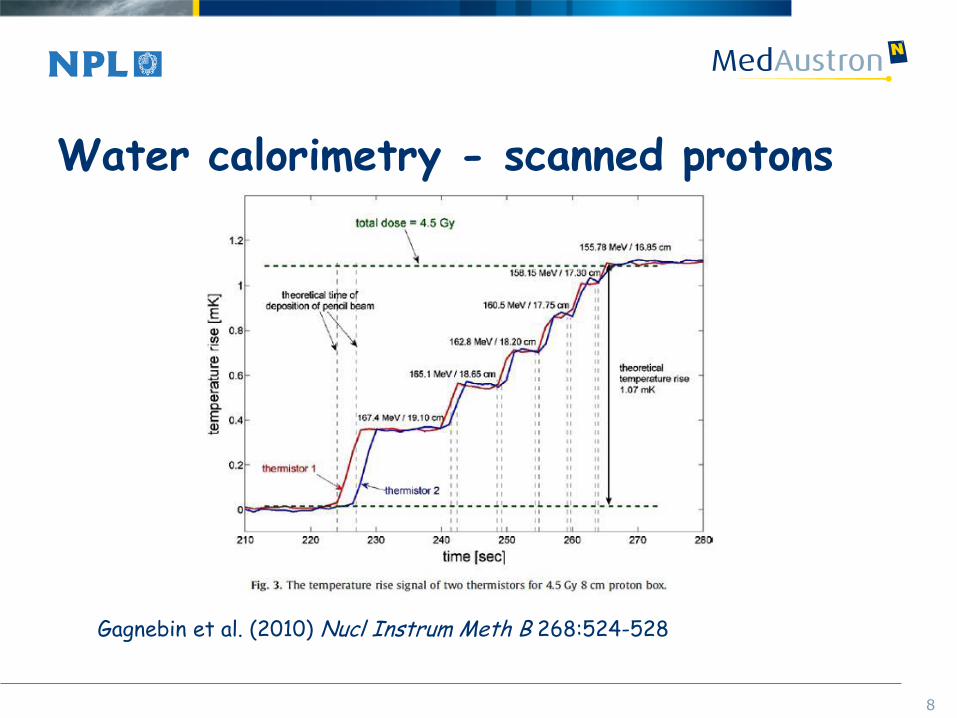
Water calorimetry - scanned protons
Gagnebin et al. (2010) Nucl Instrum Meth B 268:524-528
9
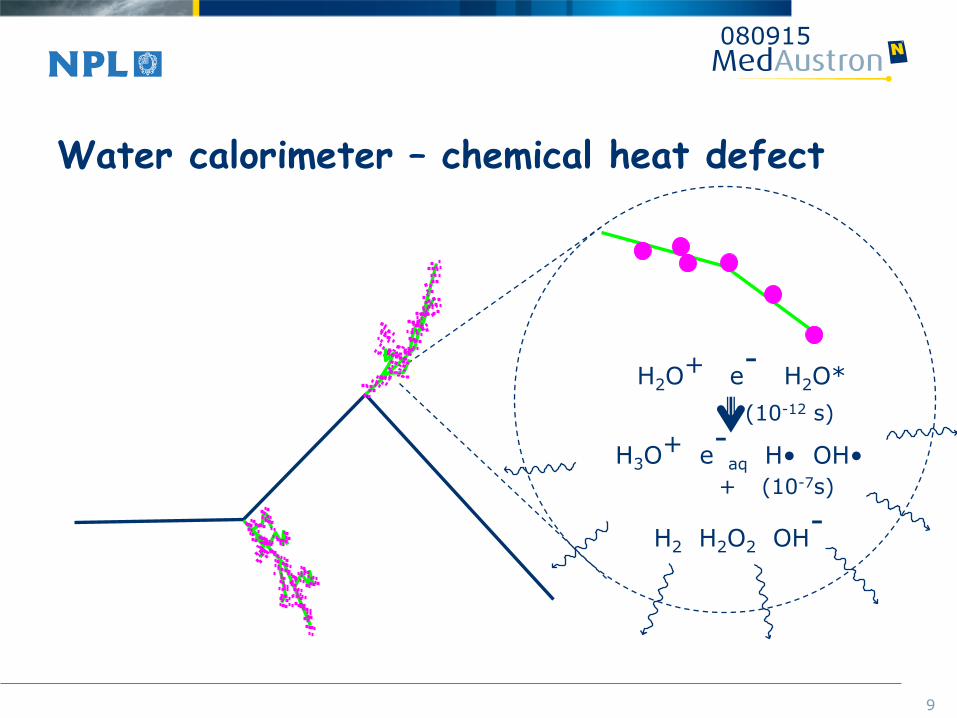
Water calorimeter – chemical heat defect
080915
H2O+ e
- H2O*
H3O+ e
-aq H• OH•
+ (10-7s)
H2 H2O2 OH-
(10-12 s)
10
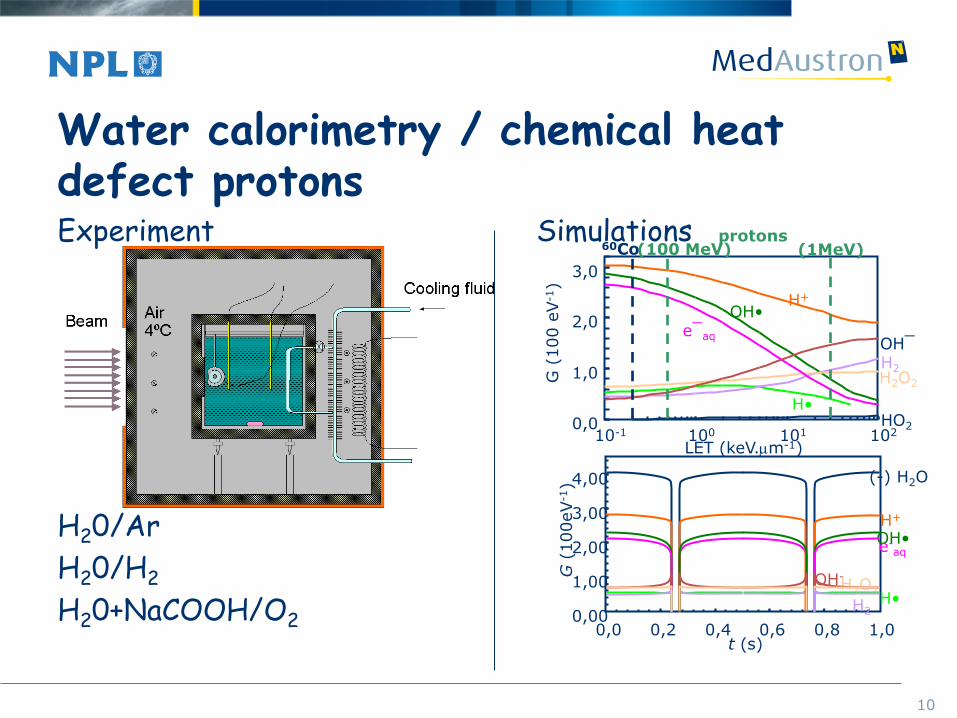
Water calorimetry / chemical heat defect protons Experiment Simulations
H20/Ar
H20/H2
H20+NaCOOH/O2
0,0
1,0
2,0
3,0
LET (keV.mm-1)
G (
100 e
V-1
)
10-1 100 101 102
H+ OH•
e¯aq
H•
OH¯
H2
HO2
H2O2
60Co (100 MeV) (1MeV) protons
0,00
1,00
2,00
3,00
4,00
0,0 0,2 0,4 0,6 0,8 1,0 t (s)
G (
100eV
-1) (-) H2O
H2 H• H2O2
H+ OH• e-
aq
OH-
11
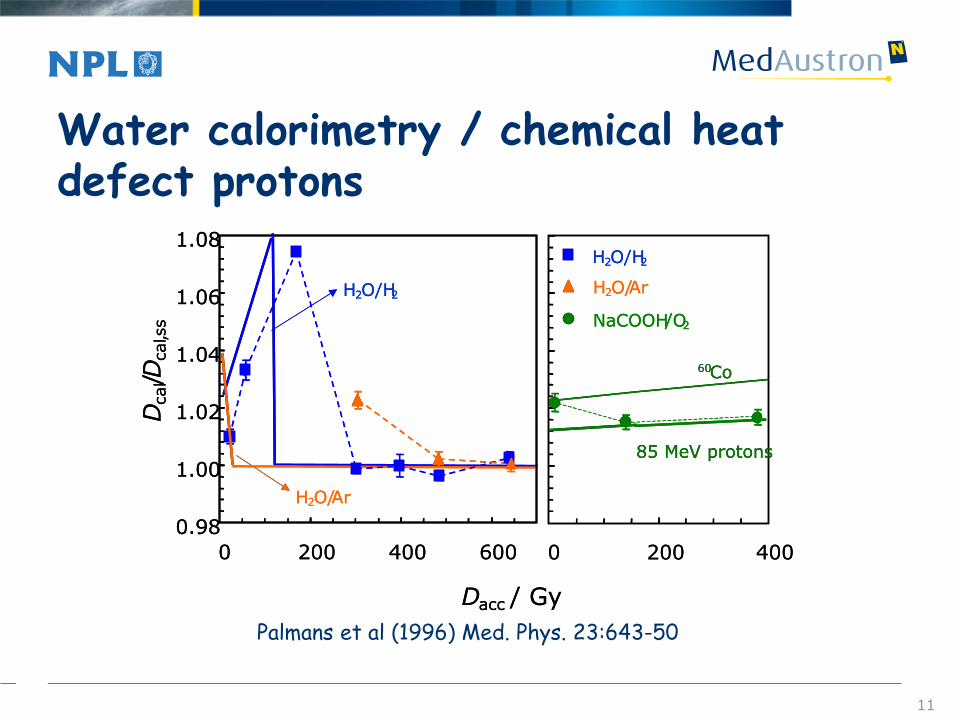
Water calorimetry / chemical heat defect protons
0.98
1.00
1.02
1.04
1.06
1.08
0 200 400 600
D acc / Gy
D ca
l / D ca
l , ss
0 200 400
H 2 O/H 2
H 2 O/ Ar
NaCOOH /O 2
85 MeV protons
60 Co
H 2 O/H 2
H 2 O/ Ar
0.98
1.00
1.02
1.04
1.06
1.08
0 200 400 600
D acc / Gy
D ca
l / D ca
l , ss
0 200 400
H 2 O/H 2
H 2 O/ Ar
NaCOOH /O 2
85 MeV protons
60 Co
H 2 O/H 2
H 2 O/ Ar
Palmans et al (1996) Med. Phys. 23:643-50
12
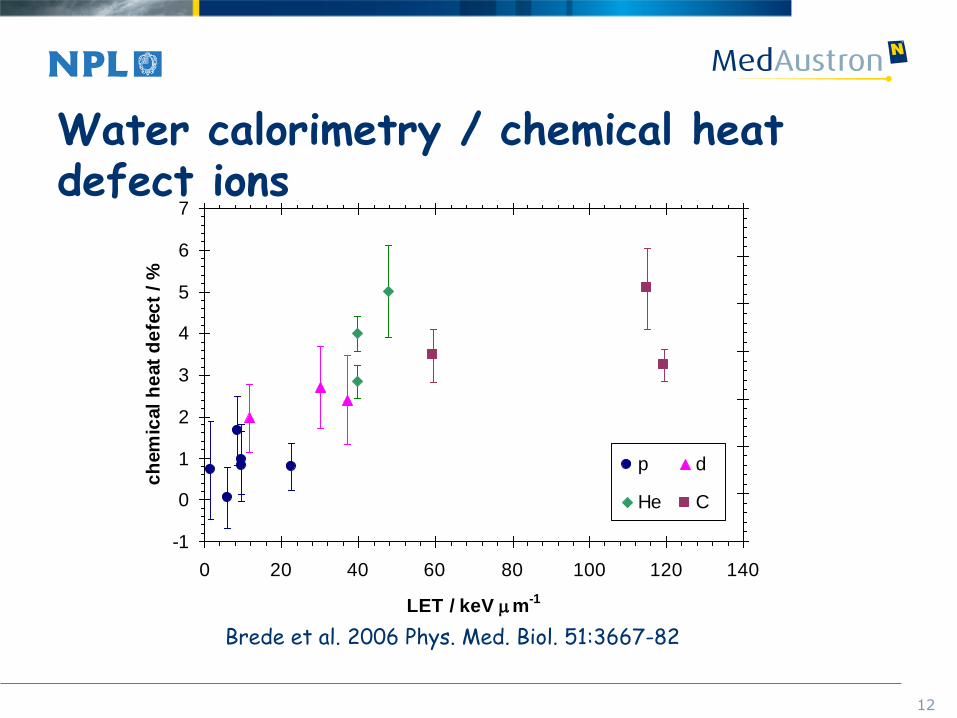
Water calorimetry / chemical heat defect ions
Brede et al. 2006 Phys. Med. Biol. 51:3667-82
-1
0
1
2
3
4
5
6
7
0 20 40 60 80 100 120 140
LET / keV mm-1
ch
em
ical
he
at
de
fec
t /
%
p d
He C
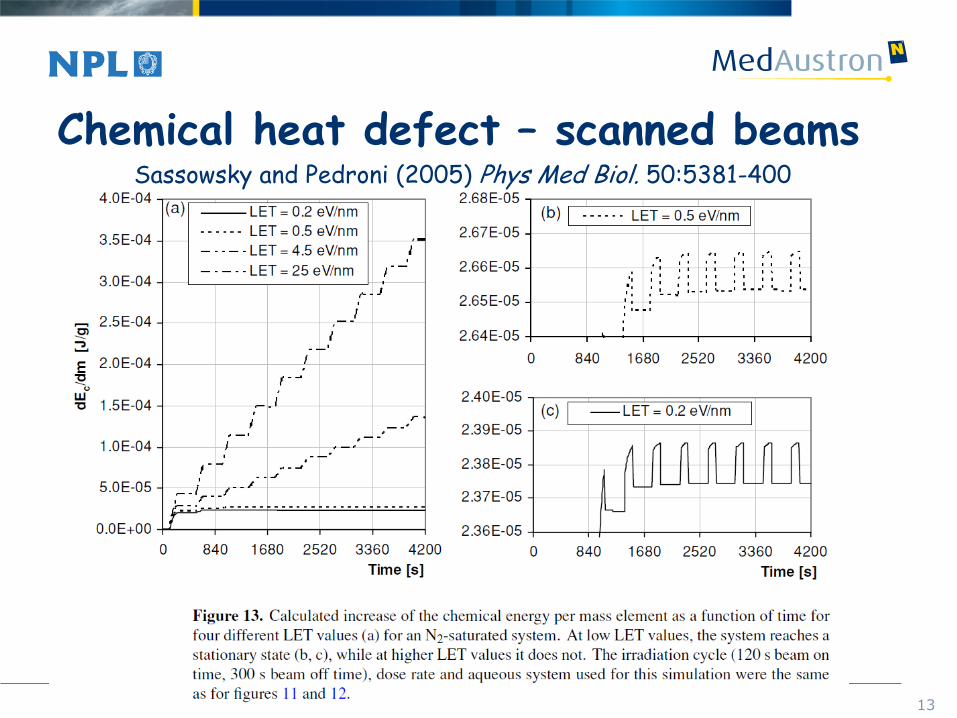
13
Chemical heat defect – scanned beams Sassowsky and Pedroni (2005) Phys Med Biol. 50:5381-400
14
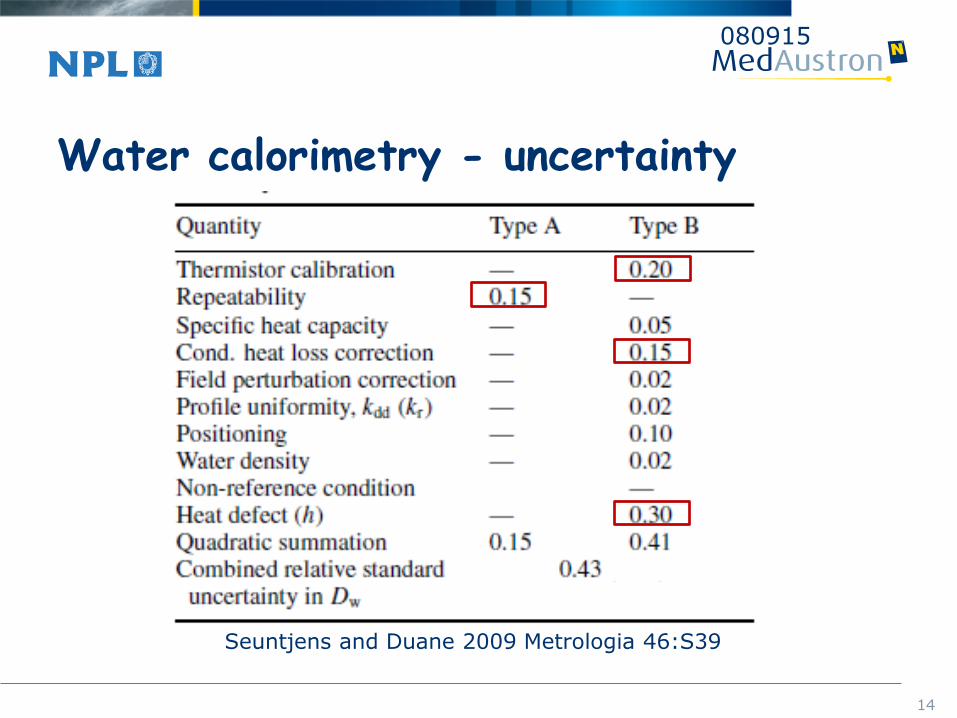
Water calorimetry - uncertainty
080915
Seuntjens and Duane 2009 Metrologia 46:S39
15
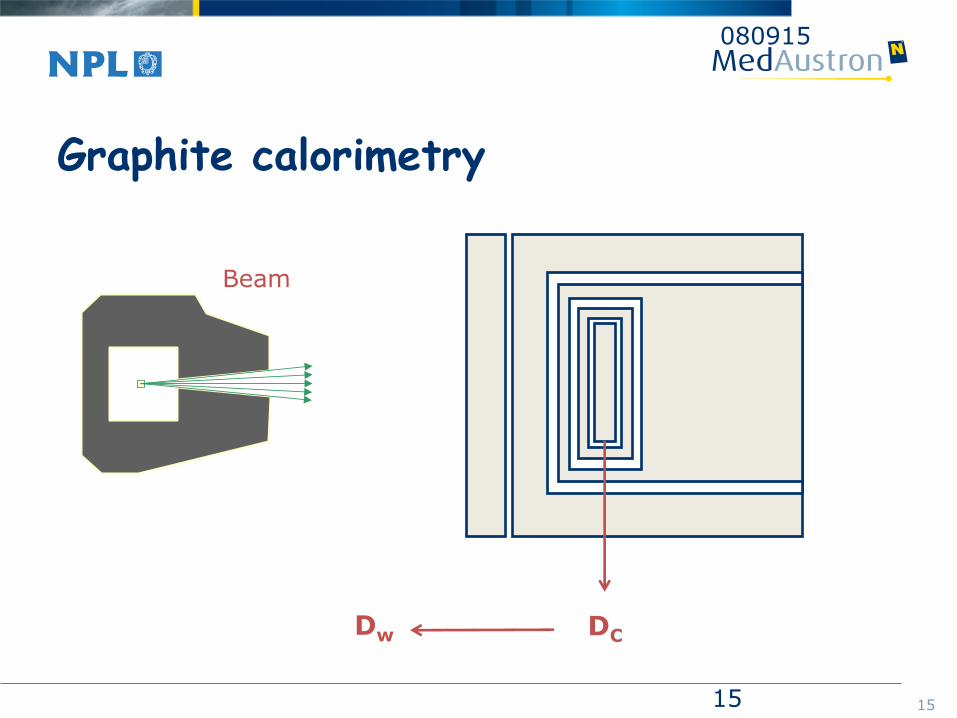
Graphite calorimetry
080915
15
Beam
DC Dw
16
Palmans et al (2004) Phys Med Biol 49:3737
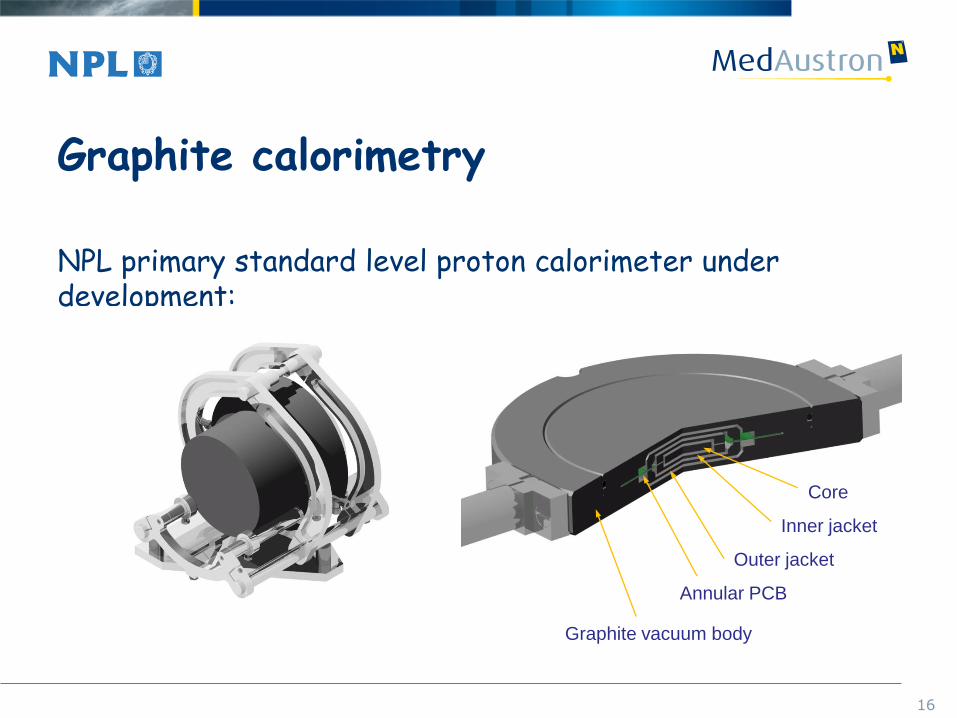
Graphite calorimetry
NPL primary standard level proton calorimeter under development:
Core
Inner jacket
Outer jacket
Annular PCB
Graphite vacuum body
17
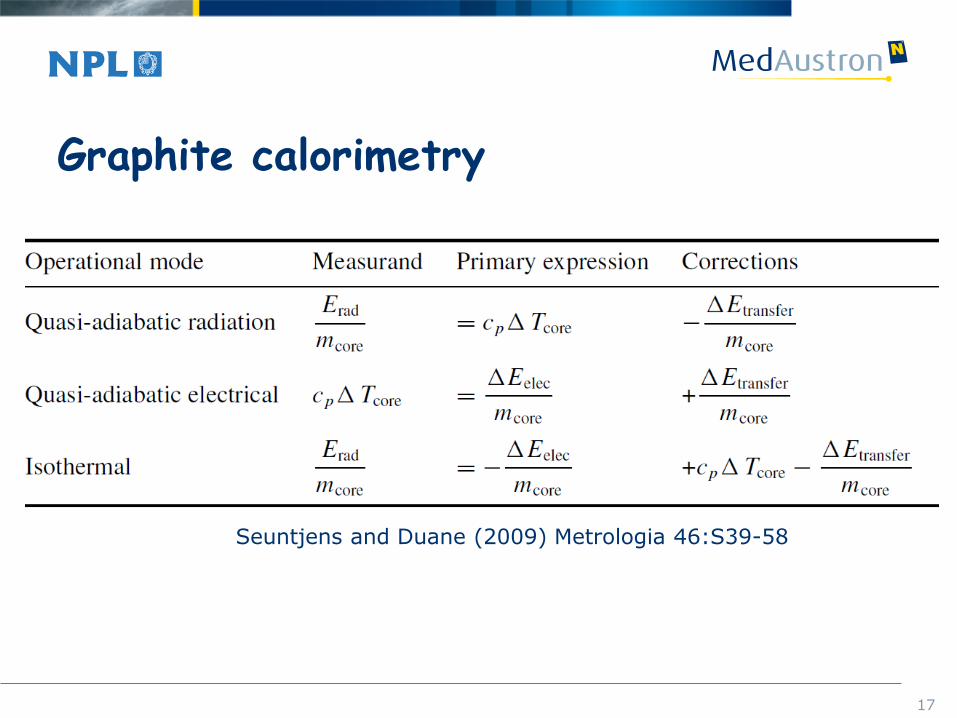
Graphite calorimetry
Seuntjens and Duane (2009) Metrologia 46:S39-58
18
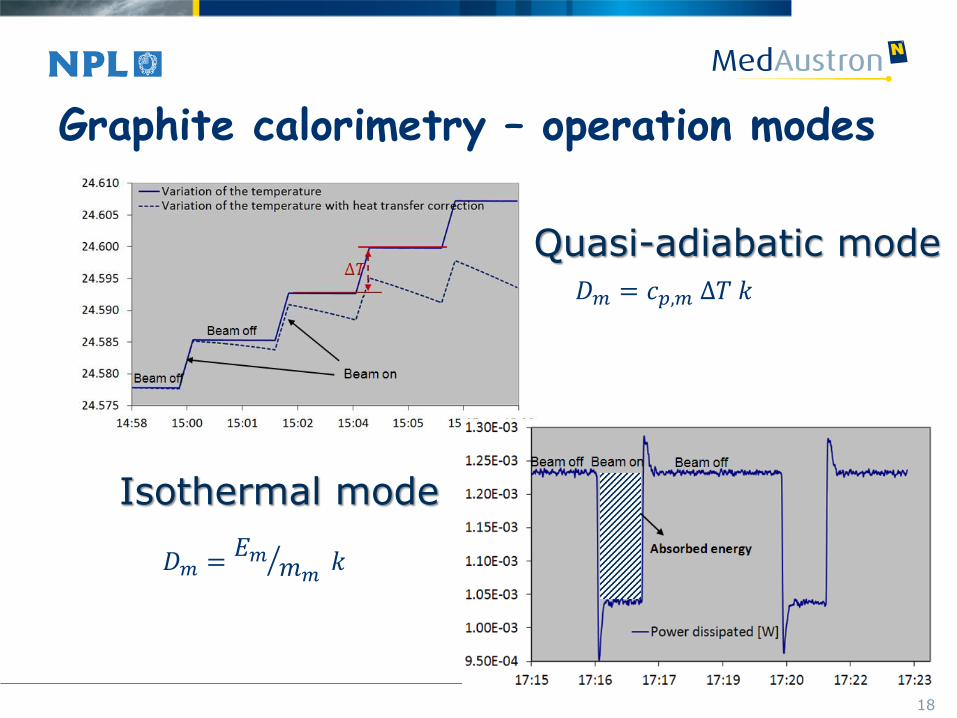
𝐷𝑚 =𝐸𝑚
𝑚𝑚 𝑘
𝐷𝑚 = 𝑐𝑝,𝑚 ∆𝑇 𝑘
Quasi-adiabatic mode
Isothermal mode
Graphite calorimetry – operation modes
19
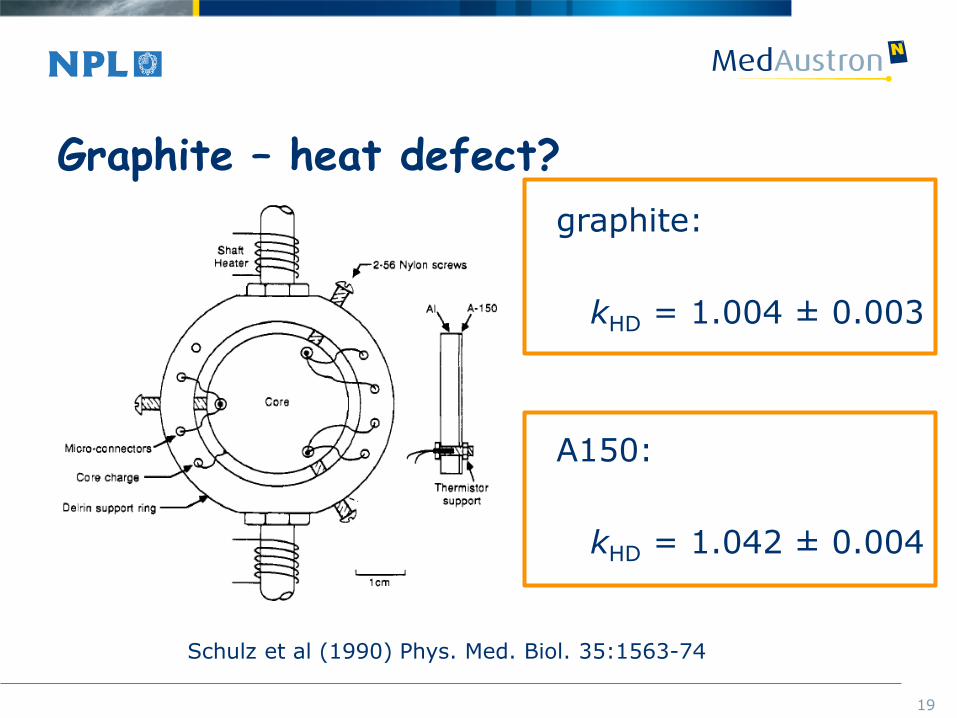
Graphite – heat defect?
Schulz et al (1990) Phys. Med. Biol. 35:1563-74
graphite:
kHD = 1.004 ± 0.003
A150:
kHD = 1.042 ± 0.004
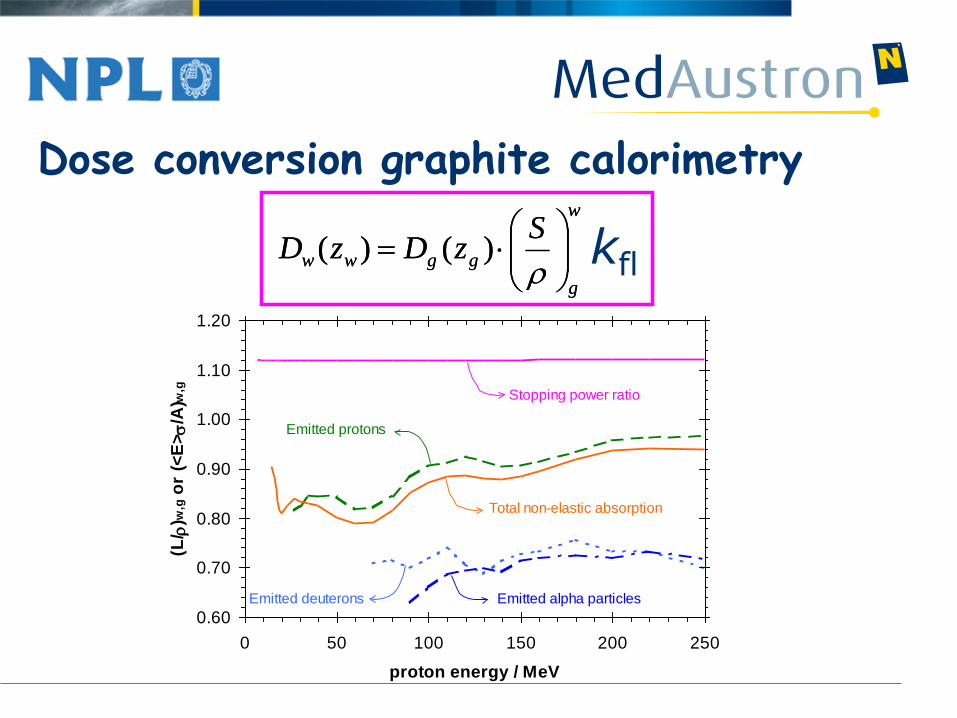
Dose conversion graphite calorimetry
0.60
0.70
0.80
0.90
1.00
1.10
1.20
0 50 100 150 200 250
proton energy / MeV
(L/
)w,g
or
(<E
>
/A)w
,g
Stopping power ratio
Total non-elastic absorption
Emitted protons
Emitted deuterons Emitted alpha particles
?
w
g
ggww
SzDzD
)()( kfl
w
g
ggww
SzDzD
)()(
21
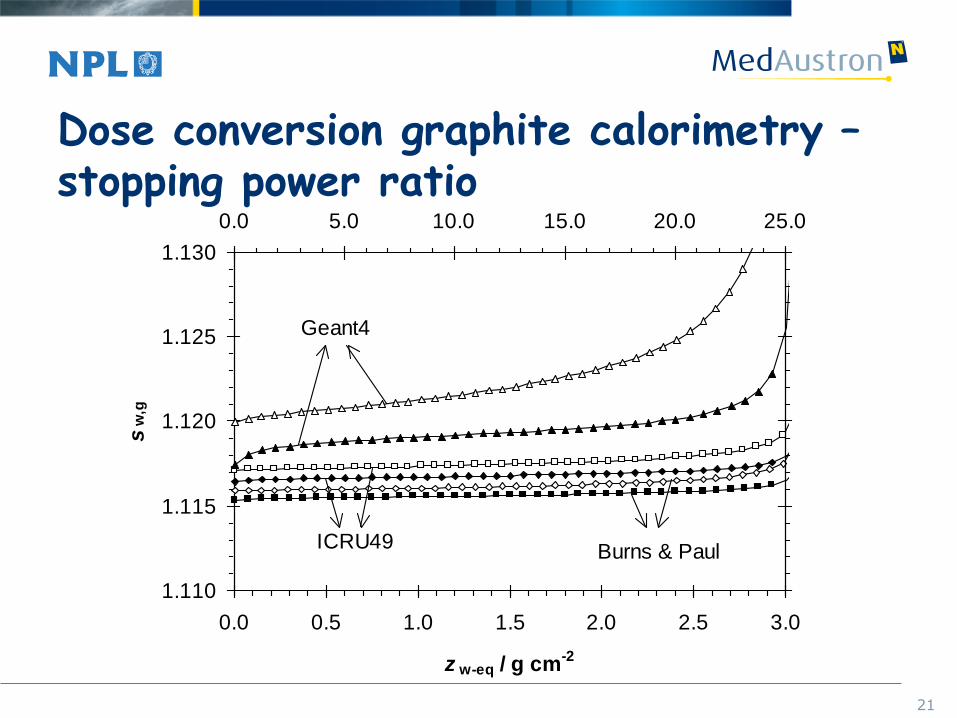
Dose conversion graphite calorimetry – stopping power ratio
1.110
1.115
1.120
1.125
1.130
0.0 0.5 1.0 1.5 2.0 2.5 3.0
z w-eq / g cm-2
sw
,g
0.0 5.0 10.0 15.0 20.0 25.0
ICRU49
Geant4
Burns & Paul

22
Dose conversion graphite calorimetry – fluence correction factor
0.96
0.98
1.00
1.02
0.0 0.5 1.0 1.5 2.0 2.5 3.0
z w-eq / g cm-2
kfl
0.96
0.98
1.00
1.02
1.04
1.06
0.0 5.0 10.0 15.0 20.0 25.0
60 MeV
200 MeV
23
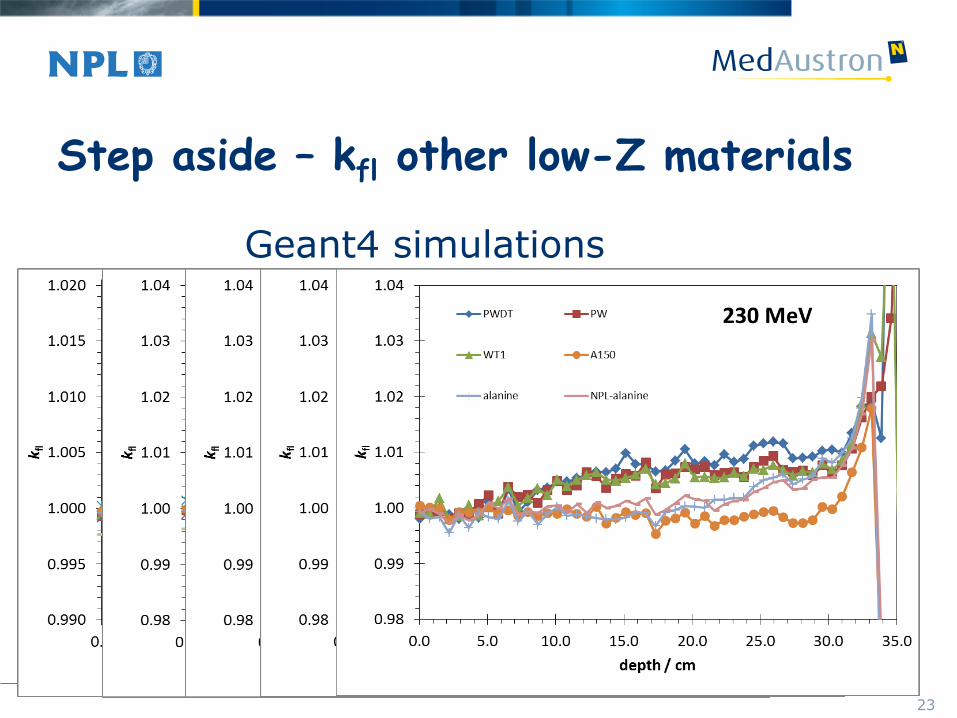
Step aside – kfl other low-Z materials
Geant4 simulations
24
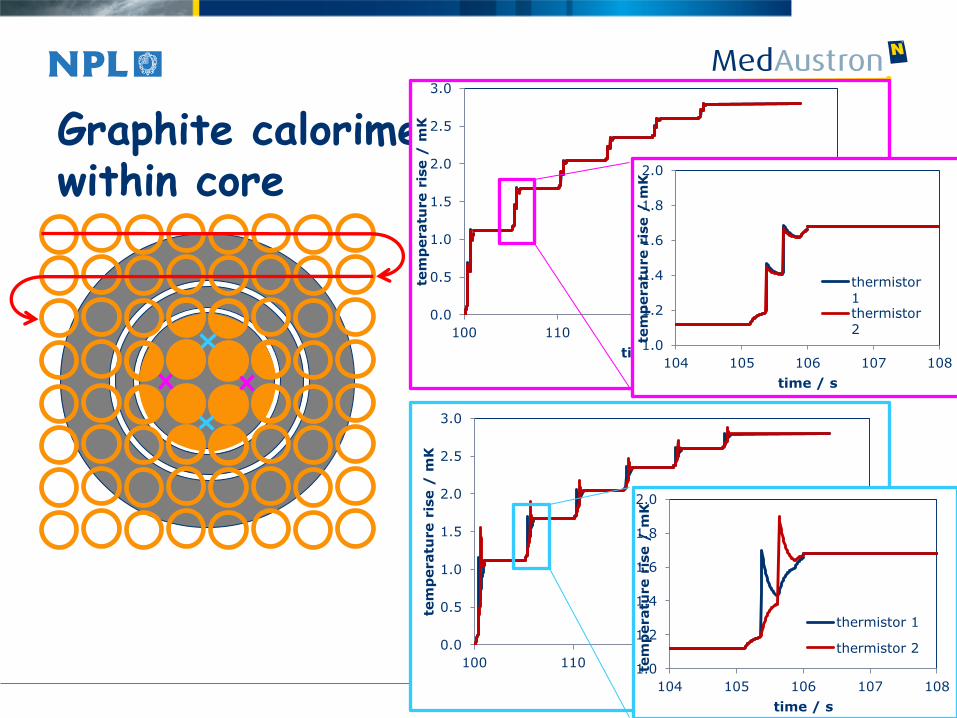
Graphite calorimetry – heat transfer within core
24
0.0
0.5
1.0
1.5
2.0
2.5
3.0
100 110 120 130 140
tem
peratu
re r
ise /
mK
time / s
thermistor
1
0.0
0.5
1.0
1.5
2.0
2.5
3.0
100 110 120 130 140
tem
peratu
re r
ise /
mK
time / s
thermistor
1
1.0
1.2
1.4
1.6
1.8
2.0
104 105 106 107 108
tem
peratu
re r
ise /
mK
time / s
thermistor
1thermistor
2
1.0
1.2
1.4
1.6
1.8
2.0
104 105 106 107 108
tem
peratu
re r
ise /
mK
time / s
thermistor 1
thermistor 2
25
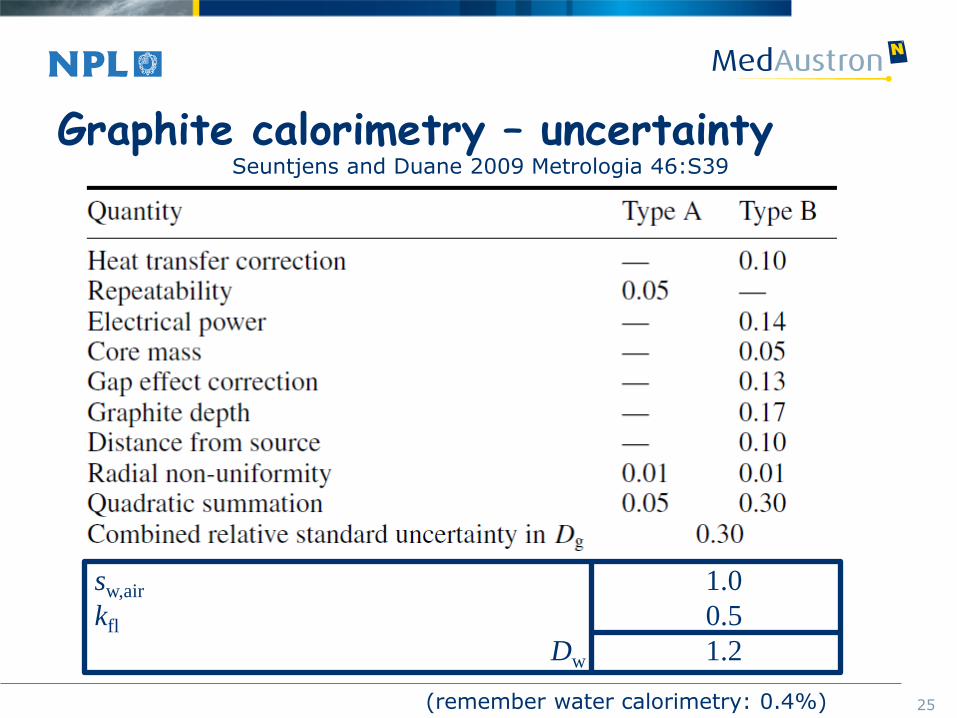
Graphite calorimetry – uncertainty Seuntjens and Duane 2009 Metrologia 46:S39
sw,air 1.0
kfl 0.5
Dw 1.2
(remember water calorimetry: 0.4%)

26
Absolute dosimetry – Fluence based methods
N protons A
med
med
S
A
N D
27
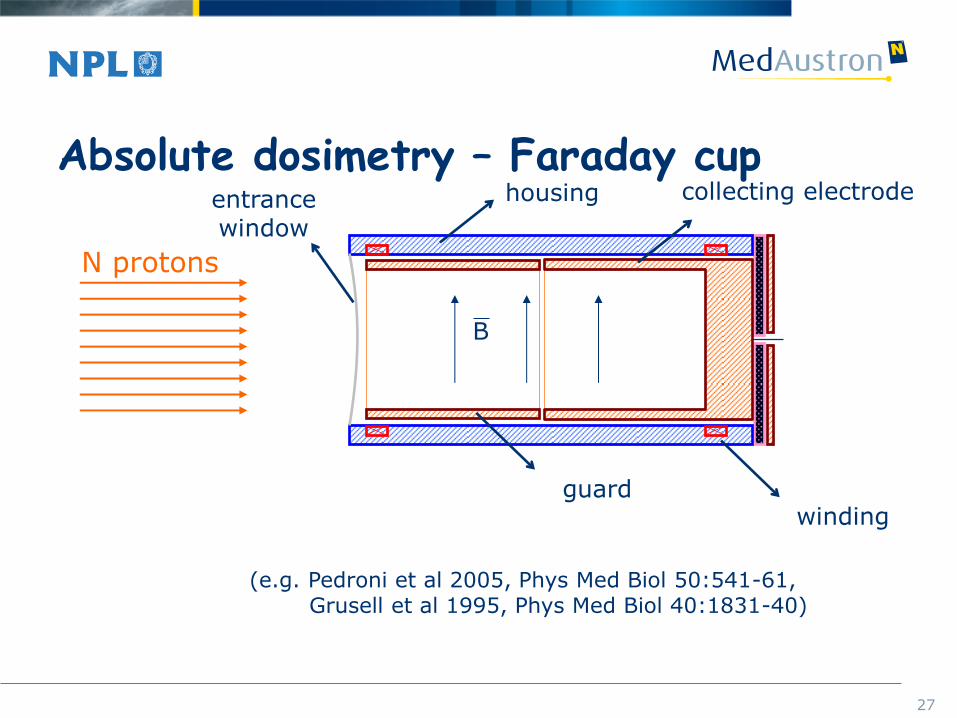
Absolute dosimetry – Faraday cup
guard
collecting electrode housing entrance window
winding
N protons
(e.g. Pedroni et al 2005, Phys Med Biol 50:541-61, Grusell et al 1995, Phys Med Biol 40:1831-40)
B
28
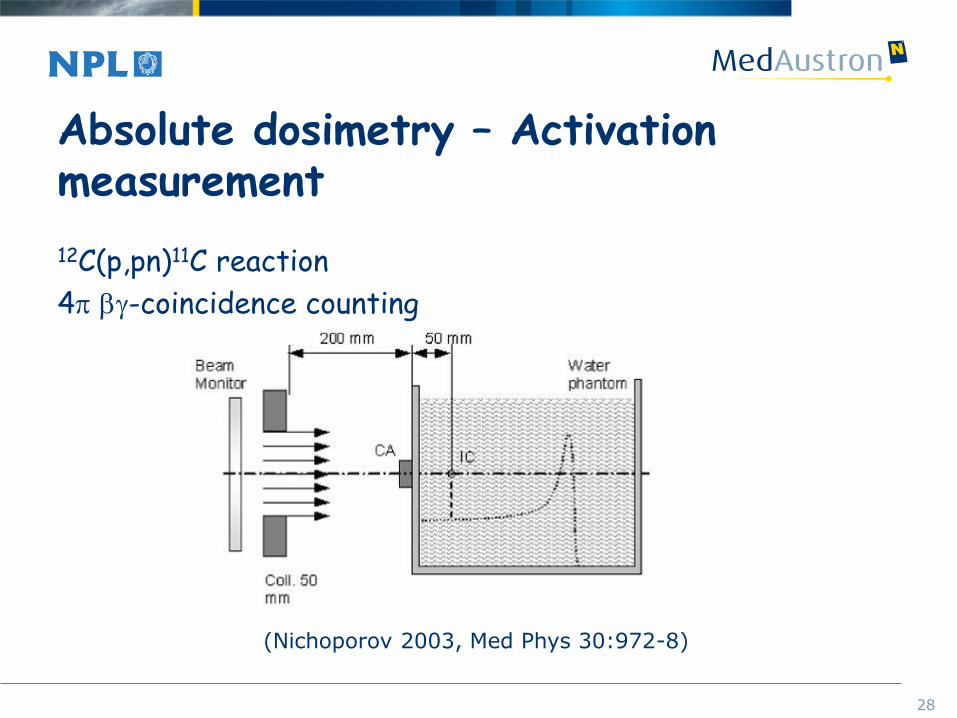
Absolute dosimetry – Activation measurement
12C(p,pn)11C reaction
4p bg-coincidence counting
(Nichoporov 2003, Med Phys 30:972-8)
29
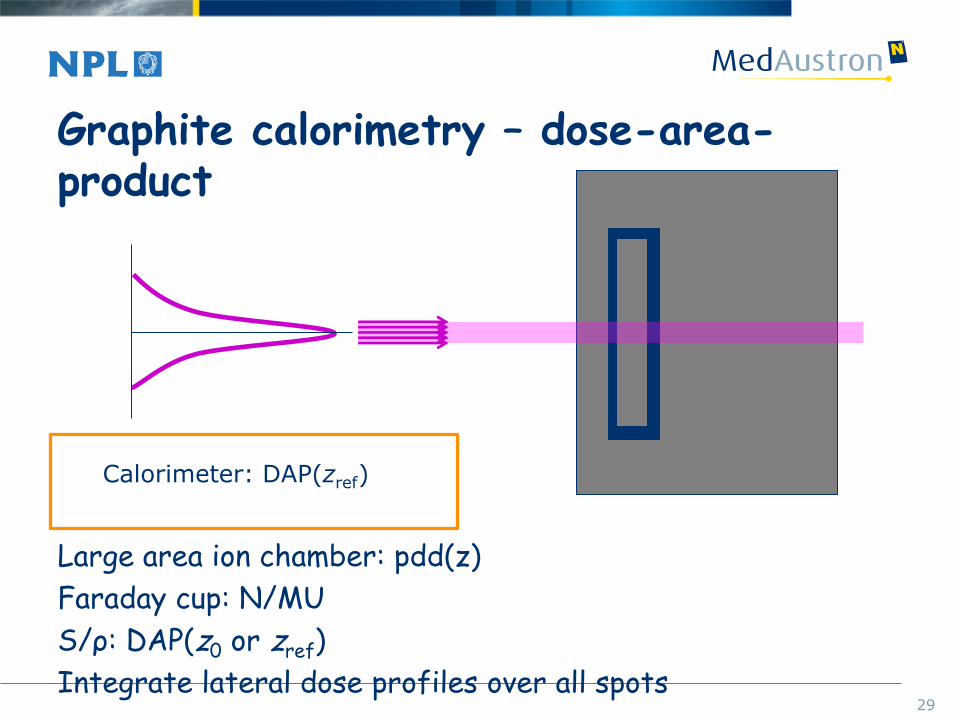
Graphite calorimetry – dose-area-product
Large area ion chamber: pdd(z)
Faraday cup: N/MU
S/ρ: DAP(z0 or zref)
Integrate lateral dose profiles over all spots
Calorimeter: DAP(zref)
30
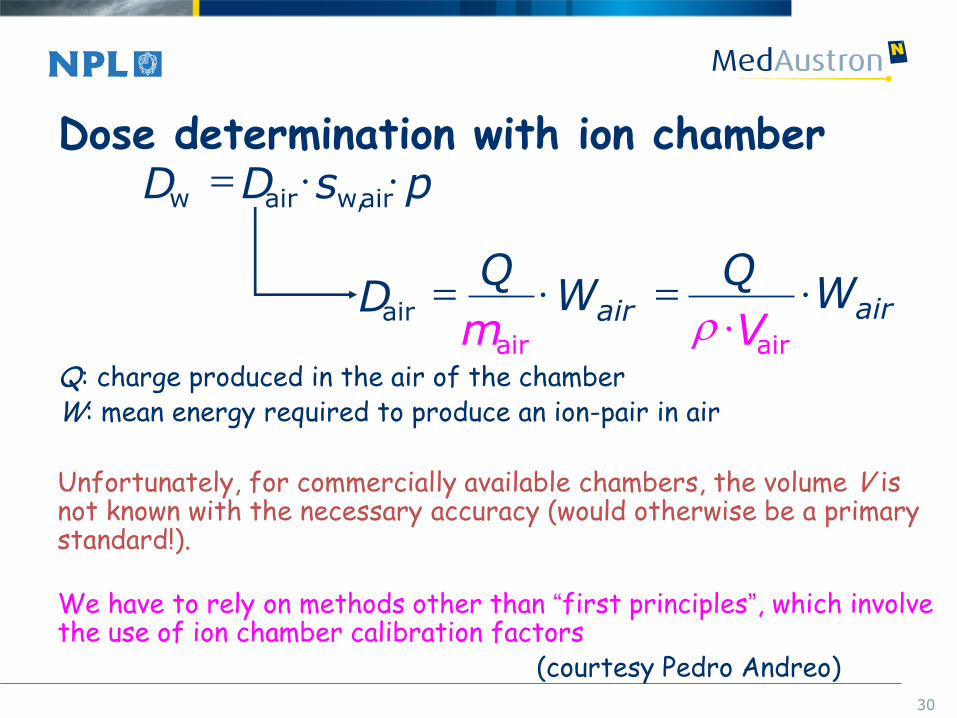
Dose determination with ion chamber
Q: charge produced in the air of the chamber W: mean energy required to produce an ion-pair in air Unfortunately, for commercially available chambers, the volume V is not known with the necessary accuracy (would otherwise be a primary standard!). We have to rely on methods other than “first principles”, which involve the use of ion chamber calibration factors (courtesy Pedro Andreo)
p s D D air w, air w
Wair m
Q D
air
air Wair
V
Q
air
31
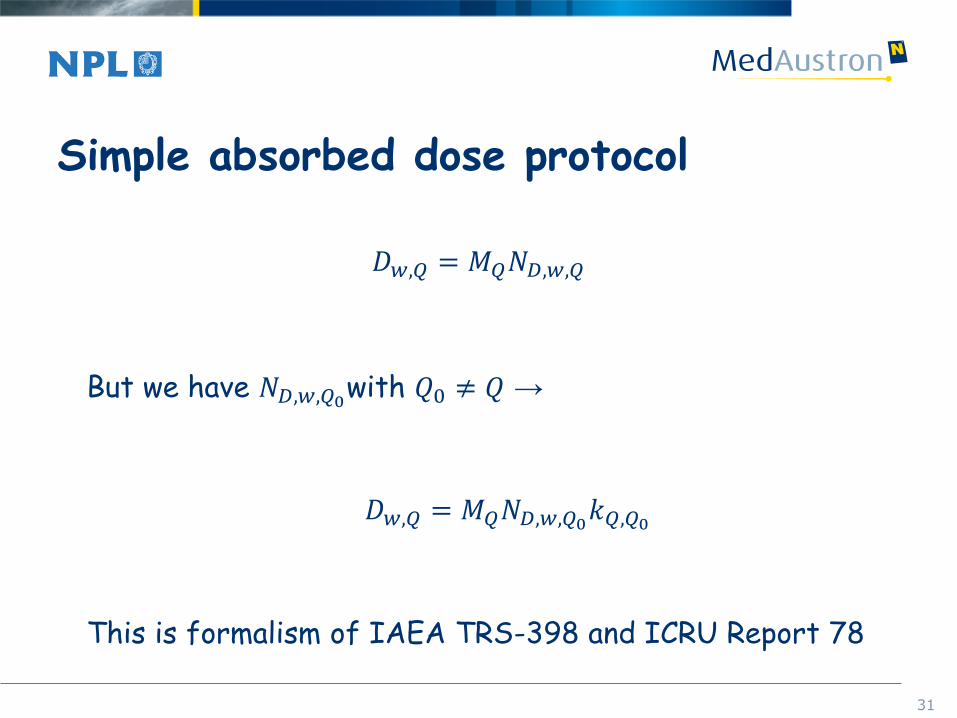
Simple absorbed dose protocol
𝐷𝑤,𝑄 = 𝑀𝑄𝑁𝐷,𝑤,𝑄
But we have 𝑁𝐷,𝑤,𝑄0with 𝑄0 ≠ 𝑄 →
𝐷𝑤,𝑄 = 𝑀𝑄𝑁𝐷,𝑤,𝑄0𝑘𝑄,𝑄0
This is formalism of IAEA TRS-398 and ICRU Report 78

32
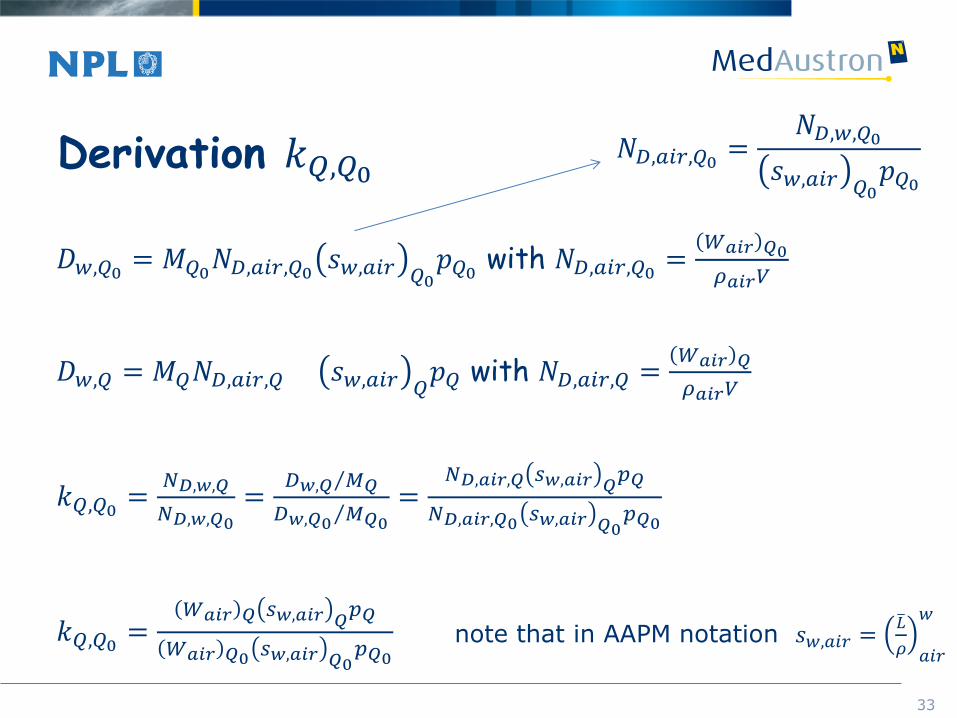
Derivation 𝑘𝑄,𝑄0
𝐷𝑤,𝑄0 = 𝐷𝑎𝑖𝑟,𝑄0 𝑠𝑤,𝑎𝑖𝑟 𝑄0𝑝𝑄0
𝐷𝑤,𝑄 = 𝐷𝑎𝑖𝑟,𝑄 𝑠𝑤,𝑎𝑖𝑟 𝑄
𝑝𝑄
33
Derivation 𝑘𝑄,𝑄0
𝐷𝑤,𝑄0 = 𝐷𝑎𝑖𝑟,𝑄0 𝑠𝑤,𝑎𝑖𝑟 𝑄0𝑝𝑄0
𝐷𝑤,𝑄 = 𝐷𝑎𝑖𝑟,𝑄 𝑠𝑤,𝑎𝑖𝑟 𝑄
𝑝𝑄
𝐷𝑤,𝑄0 = 𝑀𝑄0𝑁𝐷,𝑎𝑖𝑟,𝑄0 𝑠𝑤,𝑎𝑖𝑟 𝑄0𝑝𝑄0 with 𝑁𝐷,𝑎𝑖𝑟,𝑄0 =
𝑊𝑎𝑖𝑟 𝑄0
𝜌𝑎𝑖𝑟𝑉
𝐷𝑤,𝑄 = 𝑀𝑄𝑁𝐷,𝑎𝑖𝑟,𝑄 𝑠𝑤,𝑎𝑖𝑟 𝑄𝑝𝑄 with 𝑁𝐷,𝑎𝑖𝑟,𝑄 =
𝑊𝑎𝑖𝑟 𝑄
𝜌𝑎𝑖𝑟𝑉
𝑘𝑄,𝑄0 =𝑁𝐷,𝑤,𝑄
𝑁𝐷,𝑤,𝑄0=
𝐷𝑤,𝑄 𝑀𝑄
𝐷𝑤,𝑄0 𝑀𝑄0
=𝑁𝐷,𝑎𝑖𝑟,𝑄 𝑠𝑤,𝑎𝑖𝑟 𝑄
𝑝𝑄
𝑁𝐷,𝑎𝑖𝑟,𝑄0 𝑠𝑤,𝑎𝑖𝑟 𝑄0𝑝𝑄0
𝑘𝑄,𝑄0 =𝑊𝑎𝑖𝑟 𝑄 𝑠𝑤,𝑎𝑖𝑟 𝑄
𝑝𝑄
𝑊𝑎𝑖𝑟 𝑄0 𝑠𝑤,𝑎𝑖𝑟 𝑄0𝑝𝑄0
𝑁𝐷,𝑎𝑖𝑟,𝑄0 =𝑁𝐷,𝑤,𝑄0
𝑠𝑤,𝑎𝑖𝑟 𝑄0𝑝𝑄0
note that in AAPM notation 𝑠𝑤,𝑎𝑖𝑟 =𝐿
𝜌 𝑎𝑖𝑟
𝑤

34
Factorisation
𝐷𝑤,𝑄 = 𝑀𝑄
1
𝜌𝑎𝑖𝑟𝑉𝑐𝑎𝑣𝑊𝑎𝑖𝑟 𝑄 𝑠𝑤,𝑎𝑖𝑟 𝑄
𝑝𝑄
Helpful to compare codes of practice:
e.g. TRS-398: 1
𝜌air𝑉cav=
𝑁𝐷,𝑤,𝑄0𝑊air 𝑄0 𝑠𝑤,air 𝑄0
𝑝𝑄0
ICRU 59: 1
𝜌air𝑉cav=
𝑁𝐾(1−𝑔)𝐴wall𝐴ion
𝑊air 𝑐𝑠wall,𝑔 𝜇en 𝜌 air,wall𝐾hum
35
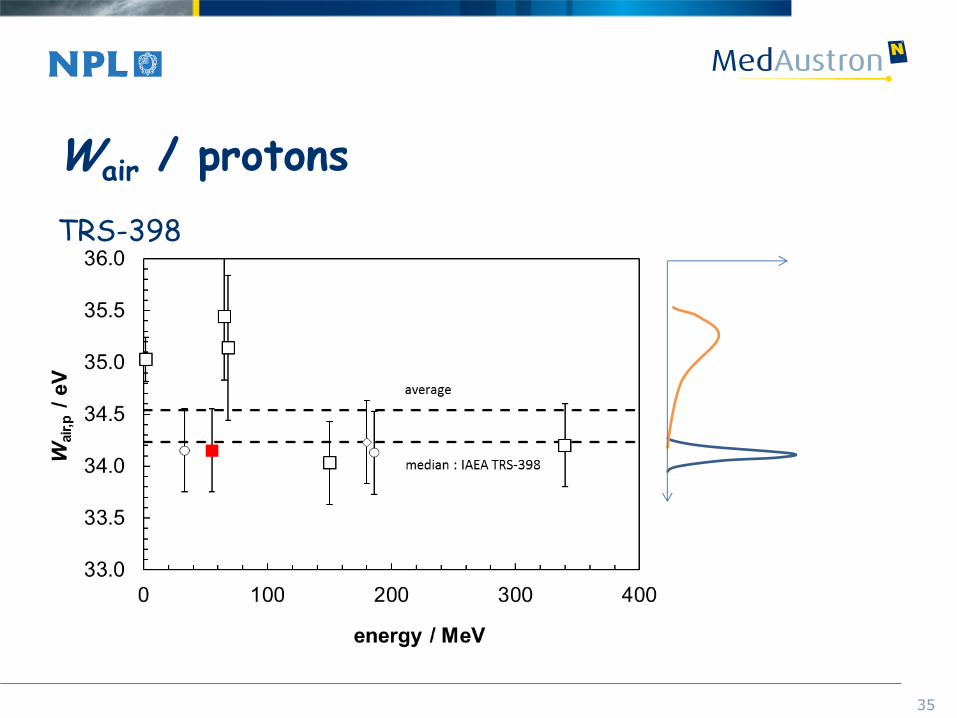
Wair / protons
TRS-398
36
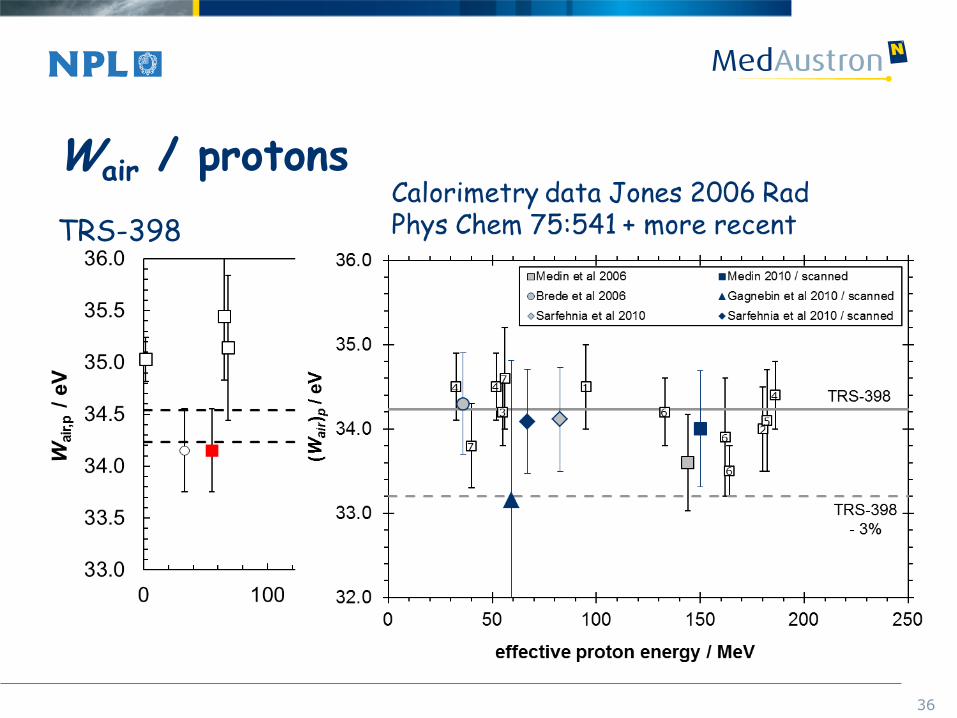
Wair / protons
TRS-398
37
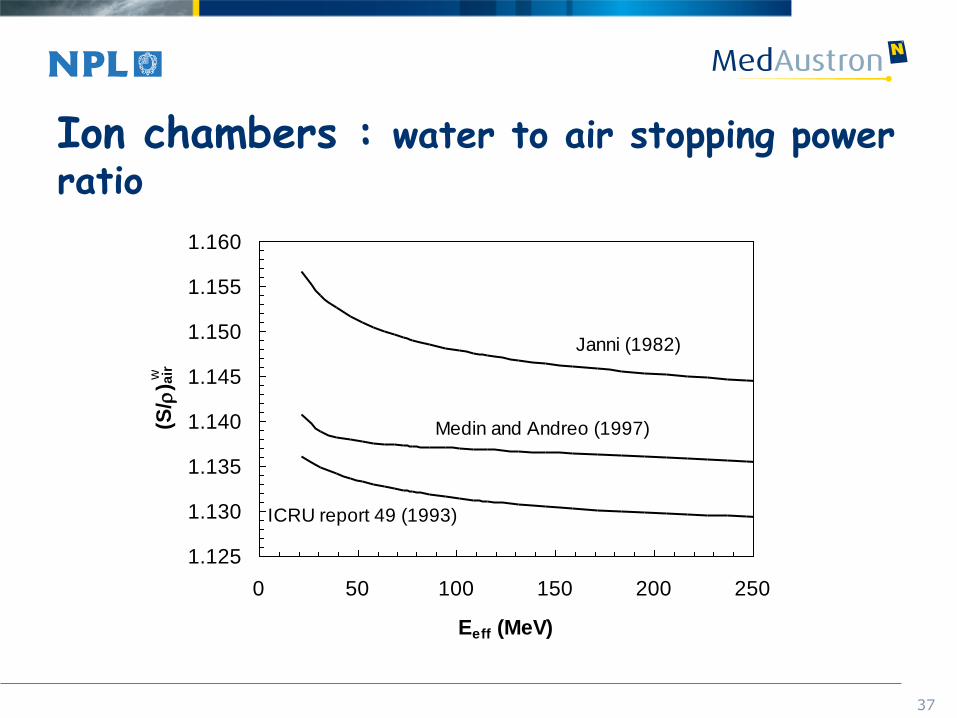
Ion chambers : water to air stopping power ratio
1.125
1.130
1.135
1.140
1.145
1.150
1.155
1.160
0 50 100 150 200 250
Eeff (MeV)
(S/
) air
Janni (1982)
ICRU report 49 (1993)
Medin and Andreo (1997)
w

38
Ion chambers – perturbation correction factors for proton beams
Overall perturbation correction factor
pQ = 1 assumed in IAEA TRS-398 and ICRU 78
Gradient correction factors
pdis = 1 assumed in SOBP or plateau
Secondary electron correction factors
ignored in IAEA TRS-398 and ICRU 78
39
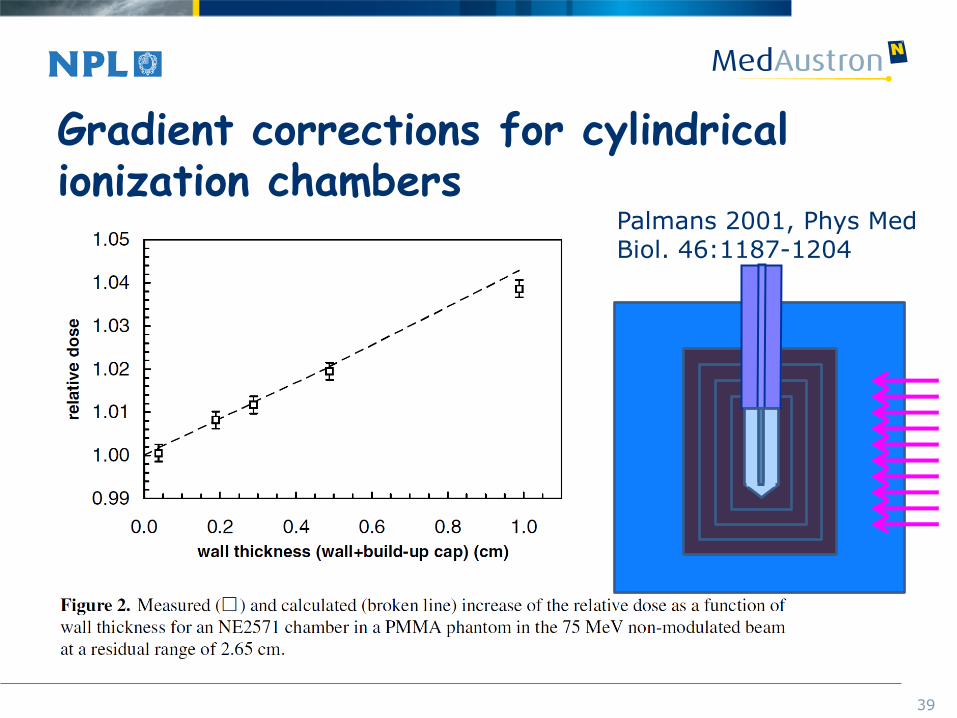
Gradient corrections for cylindrical ionization chambers
Palmans 2001, Phys Med Biol. 46:1187-1204
40
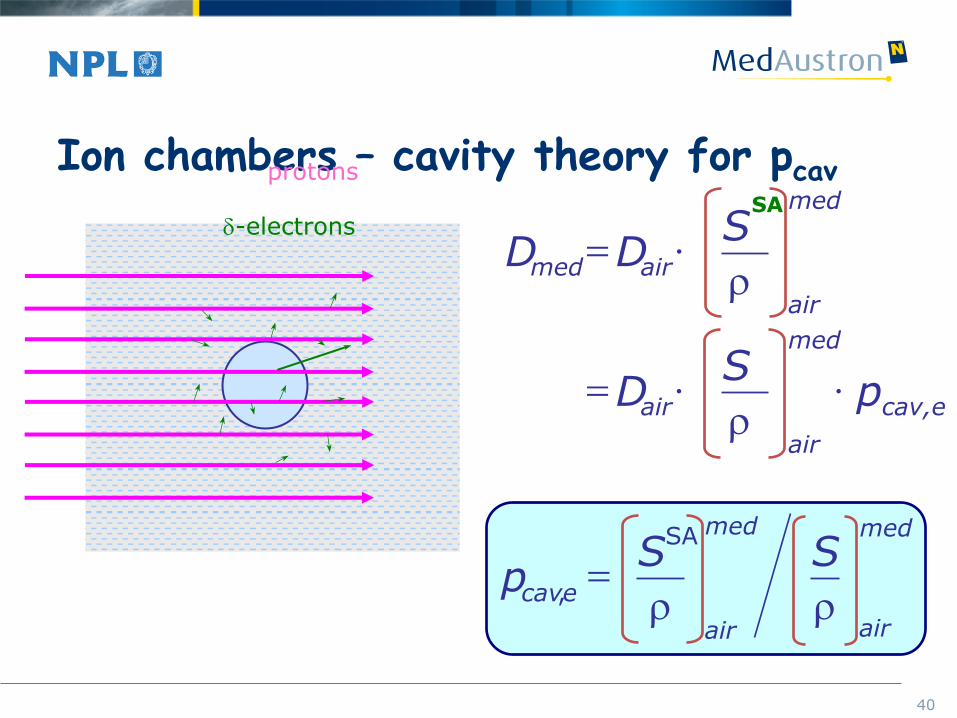
Ion chambers – cavity theory for pcav protons
SA d-electrons
med
air
air med
S D D
med
air
air
S D
cav,e p
med
air
med
air
e cav
S S p
SA
,
41
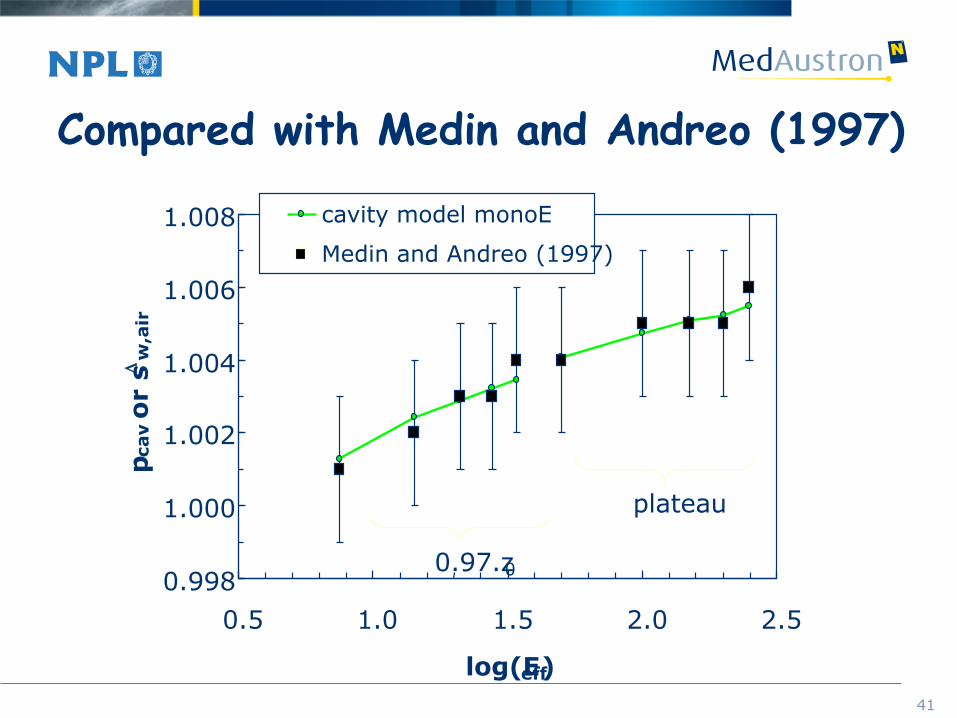
Compared with Medin and Andreo (1997)
0.998
1.000
1.002
1.004
1.006
1.008
0.5 1.0 1.5 2.0 2.5
log(E eff )
p ca
v o
r s
w,a
ir
cavity model monoE
Medin and Andreo (1997)
plateau
0.97.z 0
42
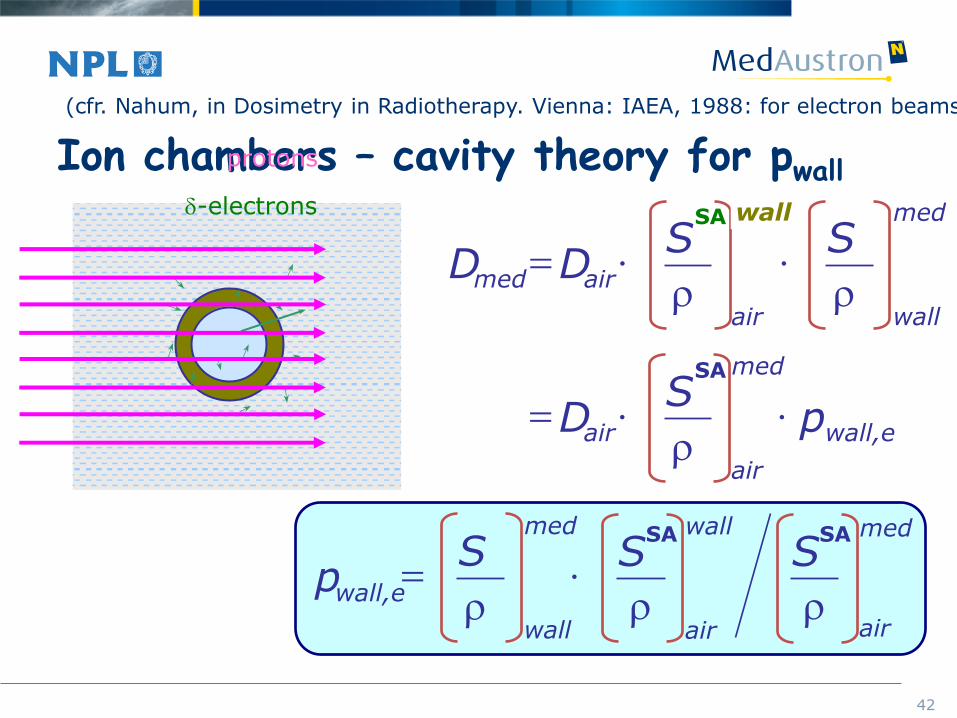
Ion chambers – cavity theory for pwall d-electrons SA
protons
(cfr. Nahum, in Dosimetry in Radiotherapy. Vienna: IAEA, 1988: for electron beams.)
med
air
air med
S D D
med
wall
S wall
med
air
air
S D
wall,e p
SA
med
air
wall
air
wall,e p S
SA
med
wall
S S
SA
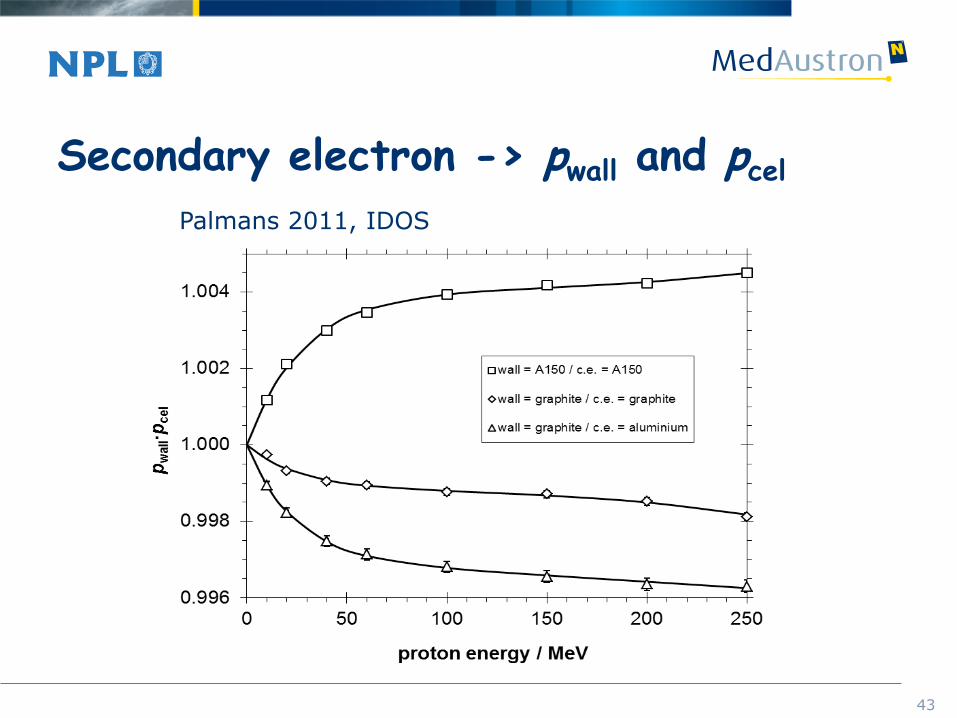
43
Secondary electron -> pwall and pcel
Palmans 2011, IDOS
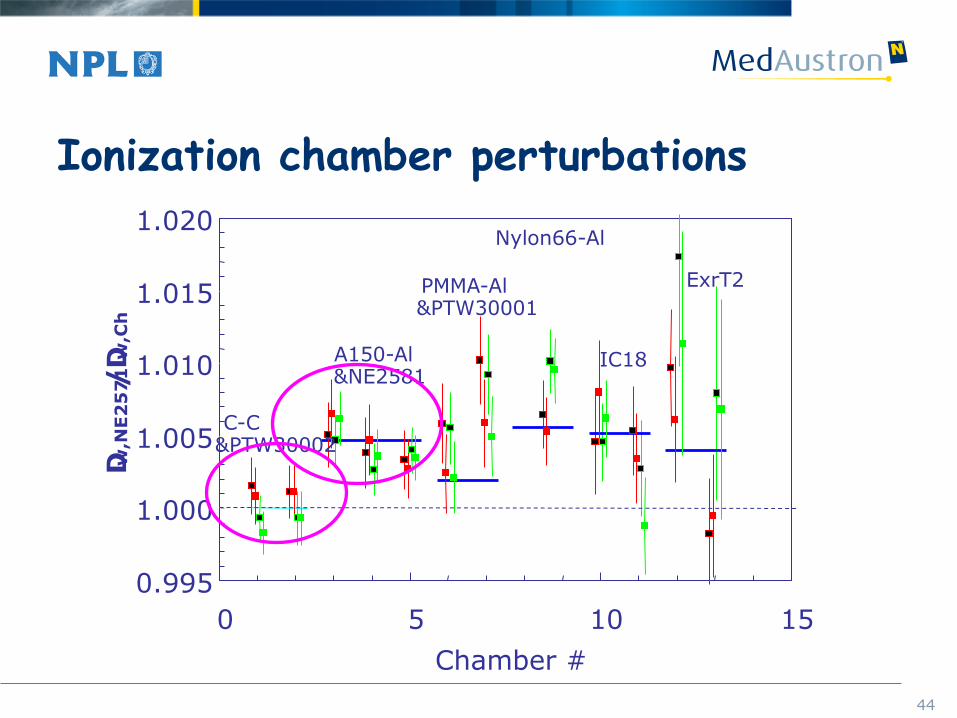
44
Ionization chamber perturbations
0.995
1.000
1.005
1.010
1.015
1.020
0 5 10 15
Chamber #
D
w,N
E2
57
1
/D
w
,Ch
C-C &PTW30002
A150-Al &NE2581
PMMA-Al &PTW30001
Nylon66-Al
IC18
ExrT2
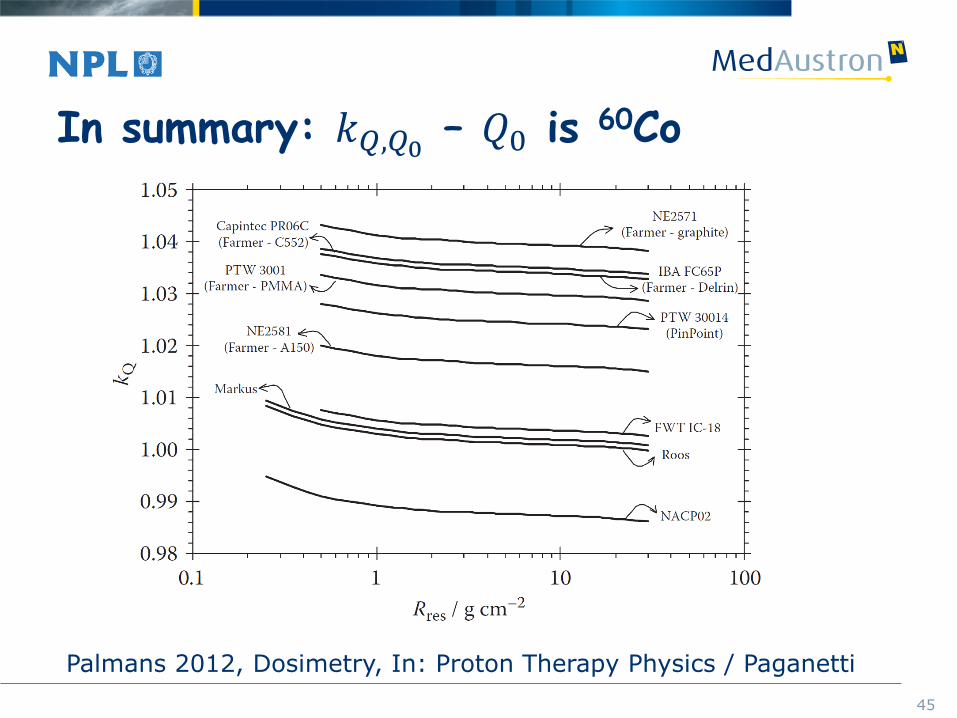
45
In summary: 𝑘𝑄,𝑄0 – 𝑄0 is 60Co
Palmans 2012, Dosimetry, In: Proton Therapy Physics / Paganetti
46
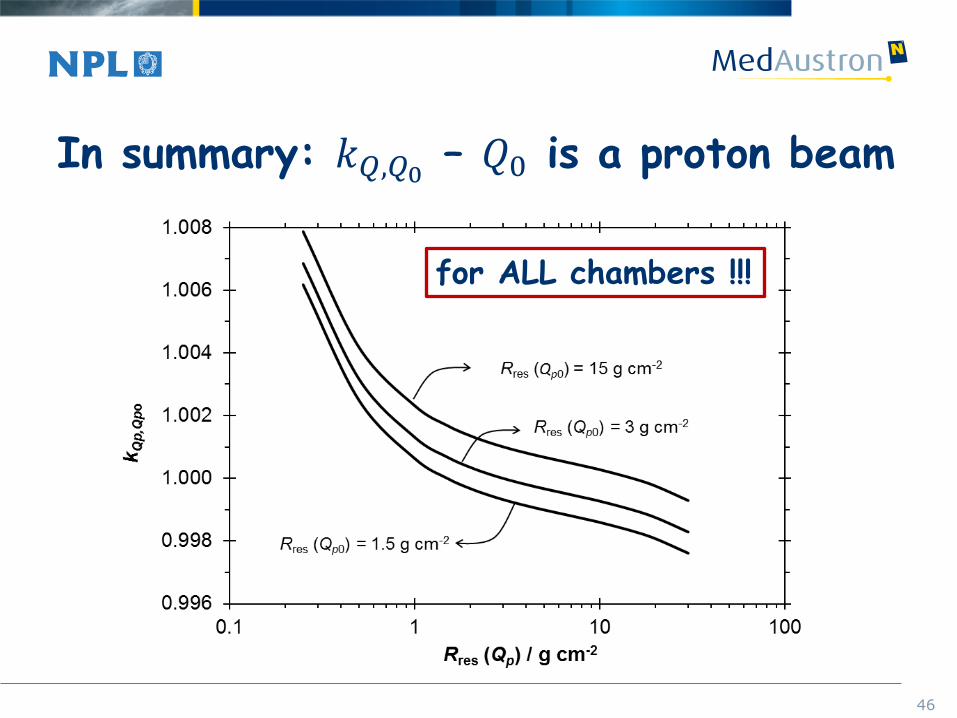
In summary: 𝑘𝑄,𝑄0 – 𝑄0 is a proton beam
for ALL chambers !!!
47
Influence quantities
Pressure, temperature, humidity
Polarity effects
Ion recombination
48
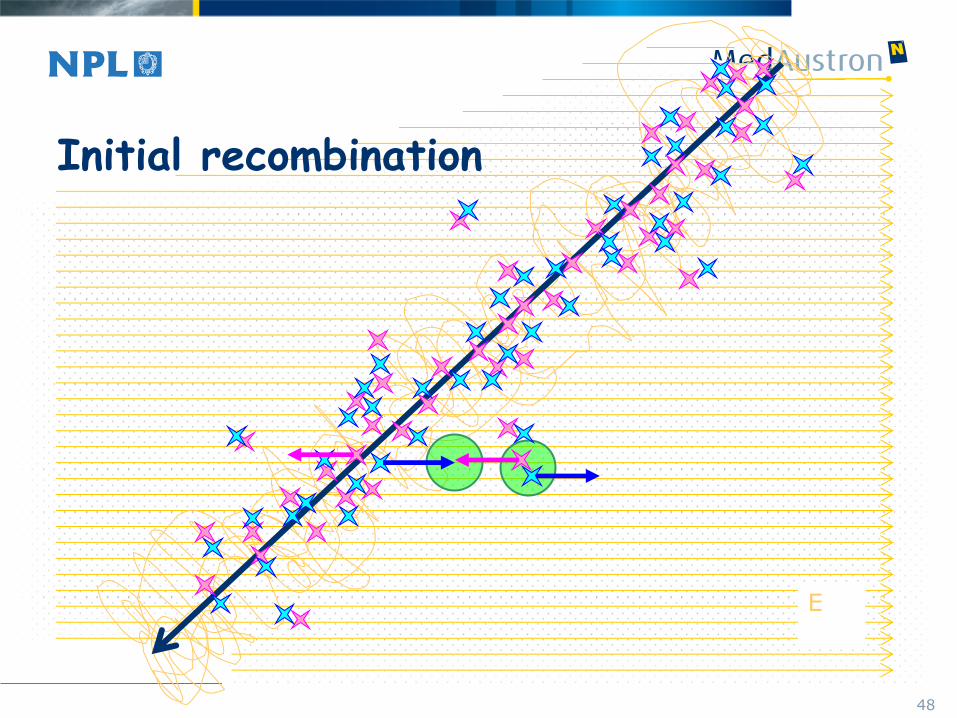
Initial recombination
E
49
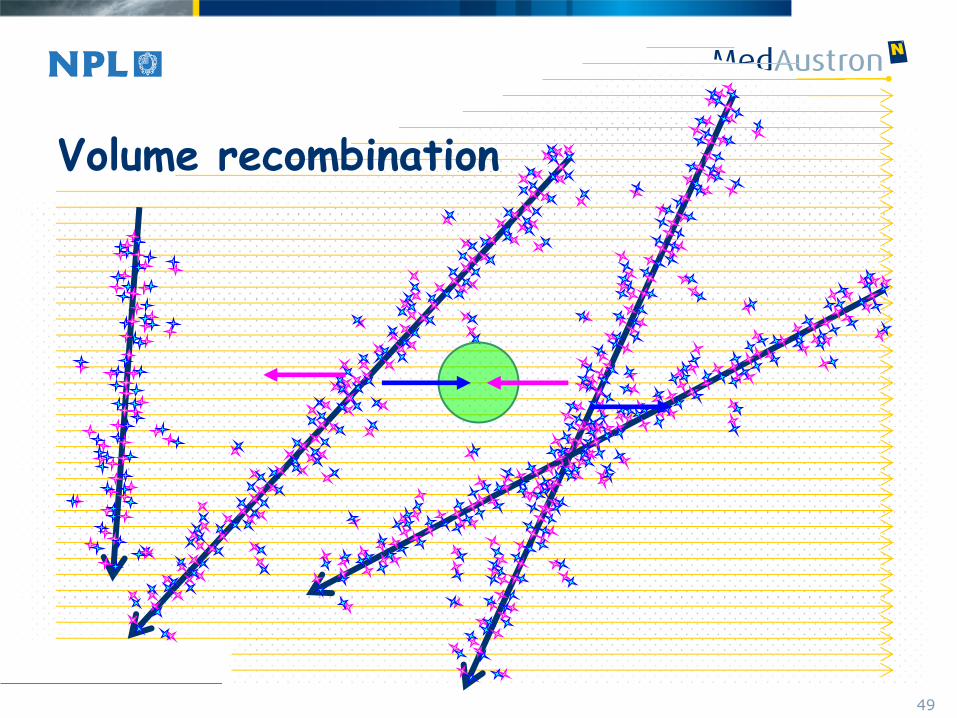
Volume recombination

50
Volume recombination – continuous radiation – plane-parallel chamber
-> 2-voltage: quadratic
𝑘𝑠 =
𝑉1𝑉2
2−1
𝑉1𝑉2
2−𝑀1𝑀2
+ -
0 x d
dx
+ -
0 x d
dx
𝑘𝑠 = 1 +𝑚2𝑔
𝑉2𝑖𝑠𝑎𝑡
51
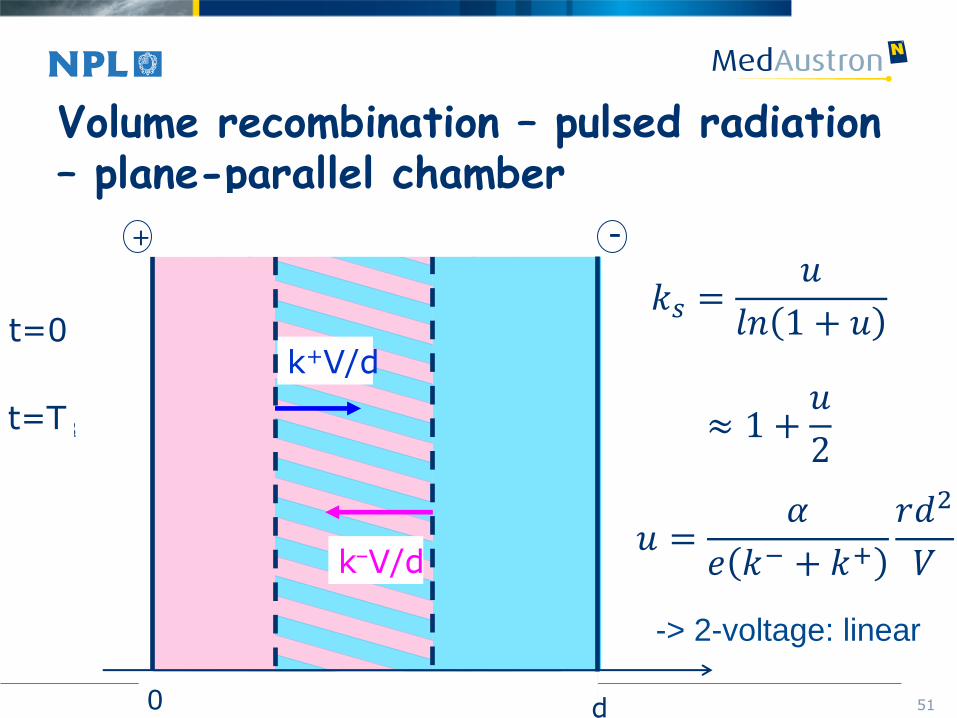
Volume recombination – pulsed radiation – plane-parallel chamber
-> 2-voltage: linear
k+V/d
k–V/d
t=T1
k+V/d
k–V/d
t=T2
k+V/d
k–V/d
t=T3
k+V/d
k–V/d
t=T
0 d
t=0
- +
𝑘𝑠 =𝑢
𝑙𝑛 1 + 𝑢
≈ 1 +𝑢
2
𝑢 =𝛼
𝑒 𝑘− + 𝑘+𝑟𝑑2
𝑉
52
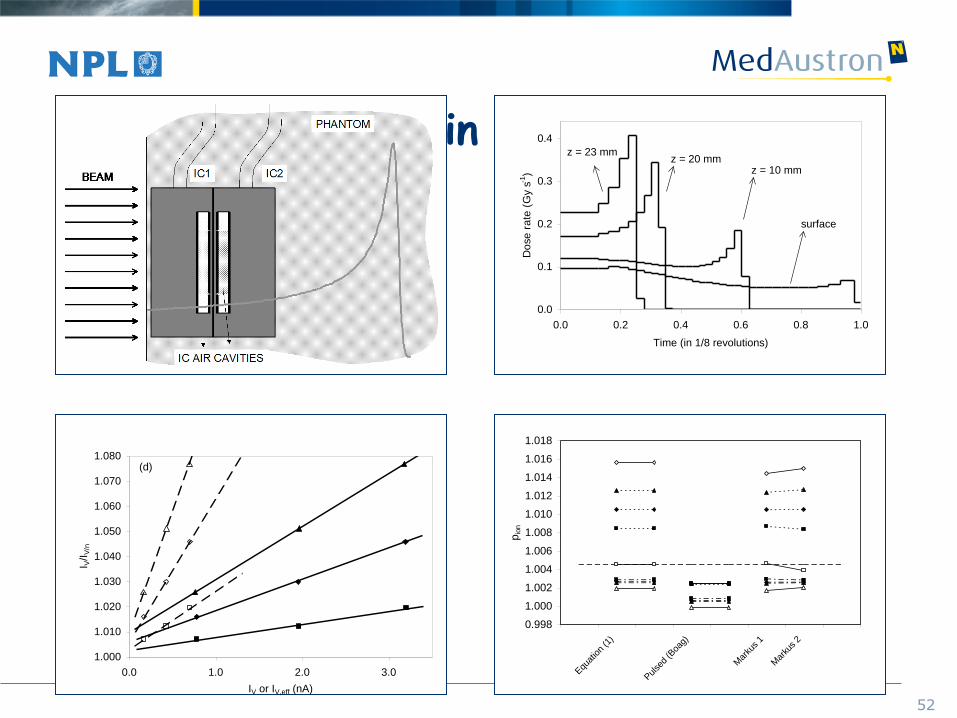
Ion recombination in ionization chambers
0.0
0.1
0.2
0.3
0.4
0.0 0.2 0.4 0.6 0.8 1.0
Time (in 1/8 revolutions)
Do
se
ra
te (
Gy s
-1)
surface
z = 23 mmz = 20 mm
z = 10 mm
1.000
1.010
1.020
1.030
1.040
1.050
1.060
1.070
1.080
0.0 1.0 2.0 3.0
IV or IV,eff (nA)
I V/I
V/n
(d)
0.998
1.000
1.002
1.004
1.006
1.008
1.010
1.012
1.014
1.016
1.018
Equ
ation
(1)
Pulse
d (B
oag)
Mar
kus 1
Mar
kus 2
pio
n
53
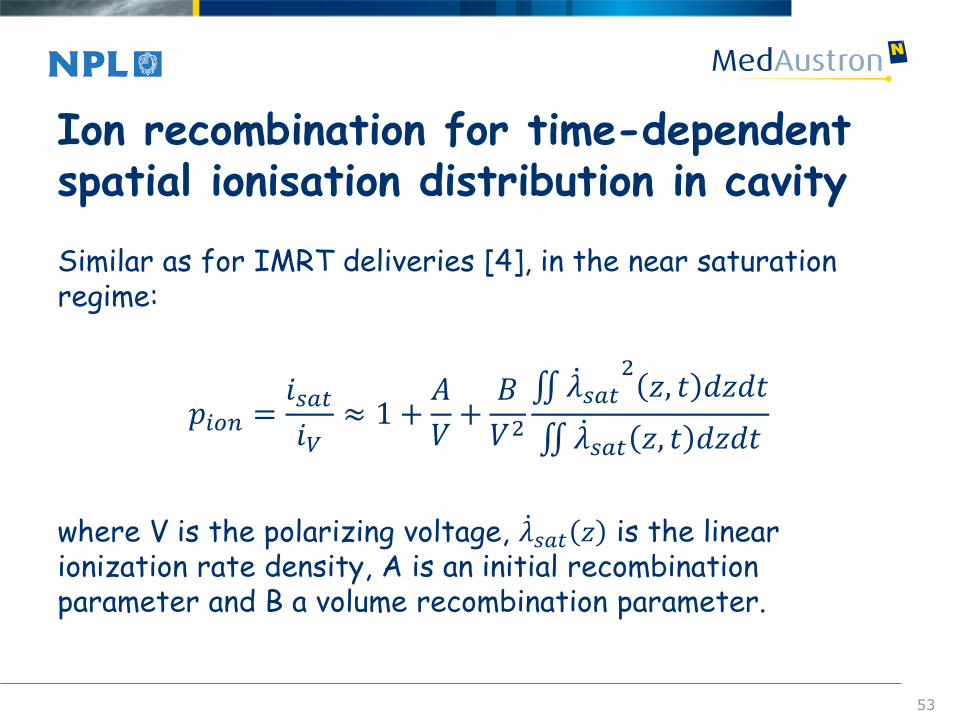
Ion recombination for time-dependent spatial ionisation distribution in cavity
Similar as for IMRT deliveries [4], in the near saturation regime:
𝑝𝑖𝑜𝑛 =𝑖𝑠𝑎𝑡𝑖𝑉
≈ 1 +𝐴
𝑉+𝐵
𝑉2 𝜆 𝑠𝑎𝑡
2𝑧, 𝑡 𝑑𝑧𝑑𝑡
𝜆 𝑠𝑎𝑡 𝑧, 𝑡 𝑑𝑧𝑑𝑡
where V is the polarizing voltage, 𝜆 𝑠𝑎𝑡 𝑧 is the linear ionization rate density, A is an initial recombination parameter and B a volume recombination parameter.

54
Cumulative recombination patterns and voltage-dependence continuous
pulsed
250 μs pulse

55
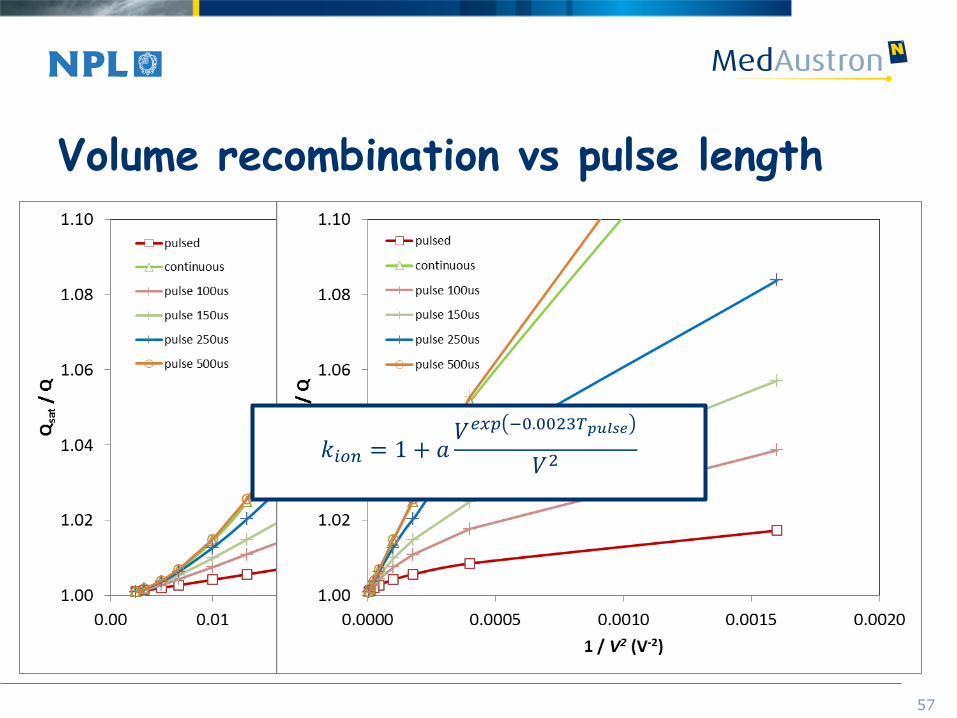
Volume recombination vs pulse length
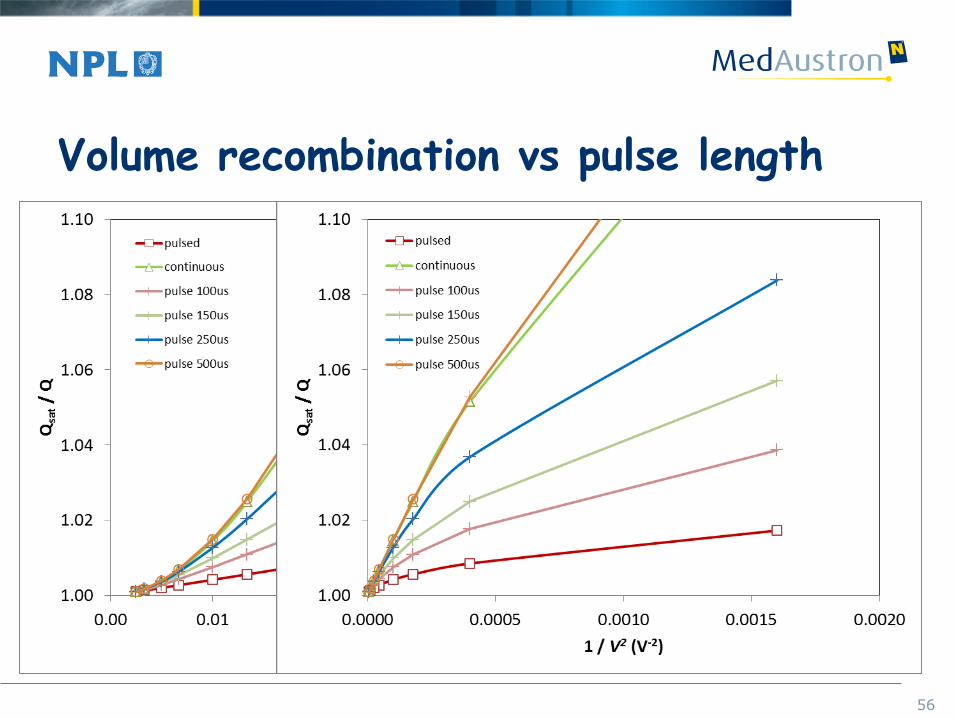
56
Volume recombination vs pulse length
57
Volume recombination vs pulse length
𝑘𝑖𝑜𝑛 = 1 + 𝑎𝑉𝑒𝑥𝑝 −0.0023𝑇𝑝𝑢𝑙𝑠𝑒
𝑉2
58
Beam monitor calibration of scanned beams
59
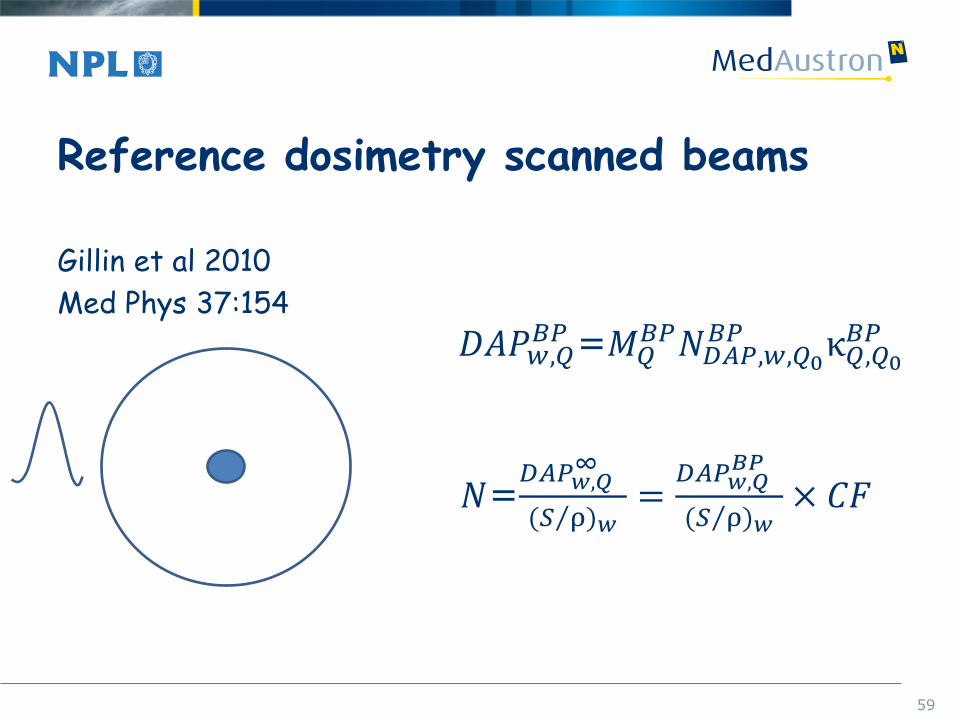
Reference dosimetry scanned beams
Gillin et al 2010
Med Phys 37:154
𝐷𝐴𝑃𝑤,𝑄𝐵𝑃 =𝑀𝑄
𝐵𝑃𝑁𝐷𝐴𝑃,𝑤,𝑄0𝐵𝑃 κ𝑄,𝑄0
𝐵𝑃
𝑁=𝐷𝐴𝑃𝑤,𝑄
∞ (𝑆 ρ )𝑤
=𝐷𝐴𝑃𝑤,𝑄
𝐵𝑃 (𝑆 ρ )𝑤
× 𝐶𝐹
60
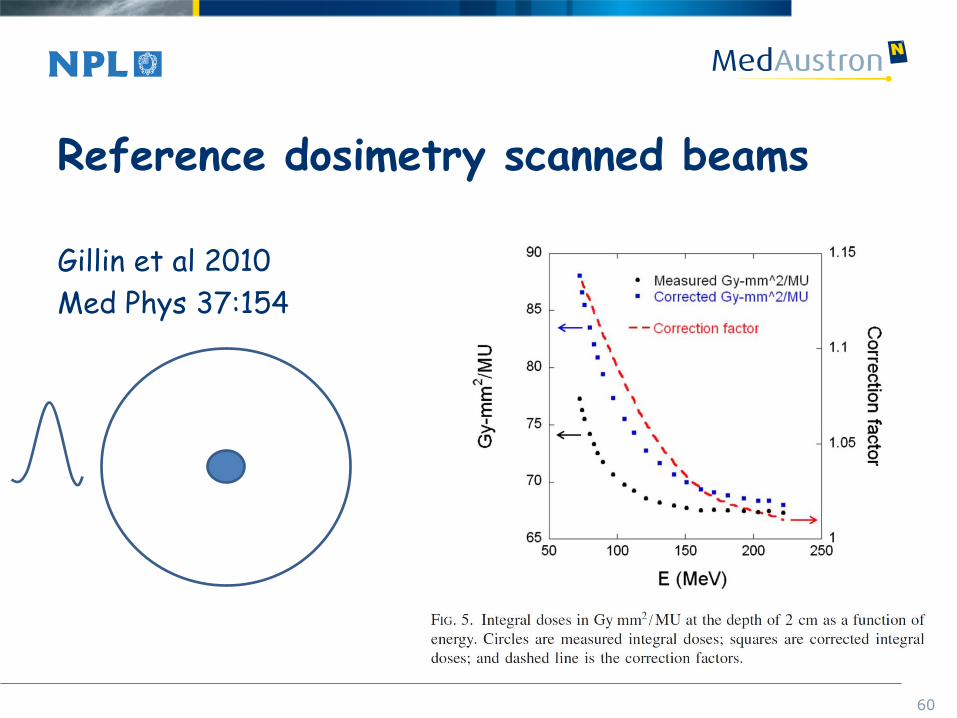
Reference dosimetry scanned beams
Gillin et al 2010
Med Phys 37:154
𝐷𝐴𝑃𝑤,𝑄𝐵𝑃 =𝑀𝑄
𝐵𝑃𝑁𝐷𝐴𝑃,𝑤,𝑄0𝐵𝑃 κ𝑄,𝑄0
𝐵𝑃
𝑁=𝐷𝐴𝑃𝑤,𝑄
∞ (𝑆 ρ )𝑤
=𝐷𝐴𝑃𝑤,𝑄
𝐵𝑃 (𝑆 ρ )𝑤
× 𝐶𝐹
61
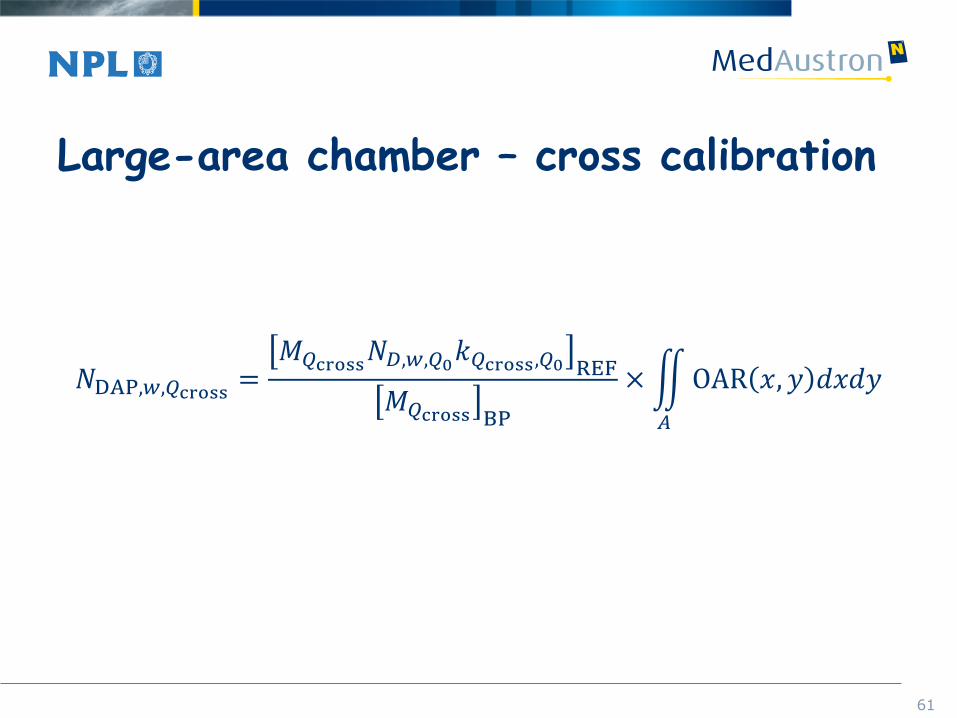
Large-area chamber – cross calibration
𝑁DAP,𝑤,𝑄cross =𝑀𝑄cross𝑁𝐷,𝑤,𝑄0𝑘𝑄cross,𝑄0 REF
𝑀𝑄cross BP
× OAR 𝑥, 𝑦 𝑑𝑥𝑑𝑦
𝐴
62
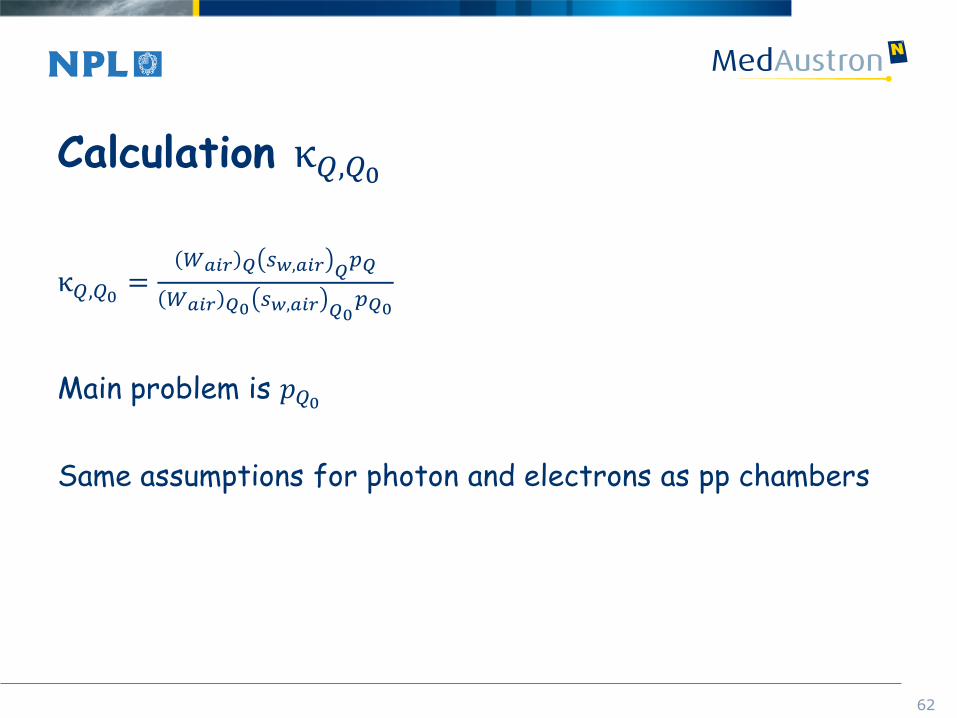
Calculation κ𝑄,𝑄0
κ𝑄,𝑄0 =𝑊𝑎𝑖𝑟 𝑄 𝑠𝑤,𝑎𝑖𝑟 𝑄
𝑝𝑄
𝑊𝑎𝑖𝑟 𝑄0 𝑠𝑤,𝑎𝑖𝑟 𝑄0𝑝𝑄0
Main problem is 𝑝𝑄0
Same assumptions for photon and electrons as pp chambers

63
Reference dosimetry scanned beams
Jaekel et al Phys Med
Biol2004
ΔX
ΔY
𝐷𝑤,𝑄𝑐𝑦𝑙
=𝑀𝑄𝑐𝑦𝑙𝑁𝐷,𝑤,𝑄0𝑐𝑦𝑙
𝑘𝑄,𝑄0𝑐𝑦𝑙
𝑁=𝐷𝑤,𝑄𝑐𝑦𝑙ΔXΔY
(𝑆 ρ )𝑤
64
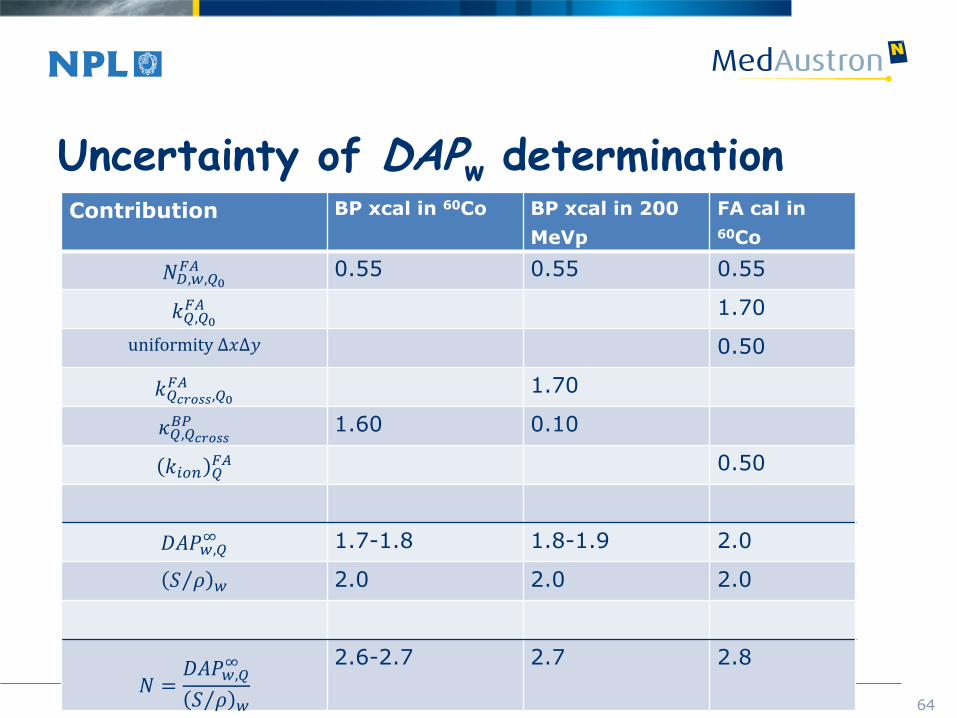
Uncertainty of DAPw determination Contribution BP xcal in 60Co BP xcal in 200
MeVp
FA cal in
60Co
𝑁𝐷,𝑤,𝑄0𝐹𝐴 0.55 0.55 0.55
𝑘𝑄,𝑄0𝐹𝐴 1.70
uniformity ∆𝑥∆𝑦 0.50
𝑘𝑄𝑐𝑟𝑜𝑠𝑠,𝑄0𝐹𝐴 1.70
𝜅𝑄,𝑄𝑐𝑟𝑜𝑠𝑠𝐵𝑃 1.60 0.10
𝑘𝑖𝑜𝑛 𝑄𝐹𝐴 0.50
𝐷𝐴𝑃𝑤,𝑄∞ 1.7-1.8 1.8-1.9 2.0
𝑆 𝜌 𝑤 2.0 2.0 2.0
𝑁 =𝐷𝐴𝑃𝑤,𝑄
∞
𝑆 𝜌 𝑤
2.6-2.7 2.7 2.8
Microdosimetry
66
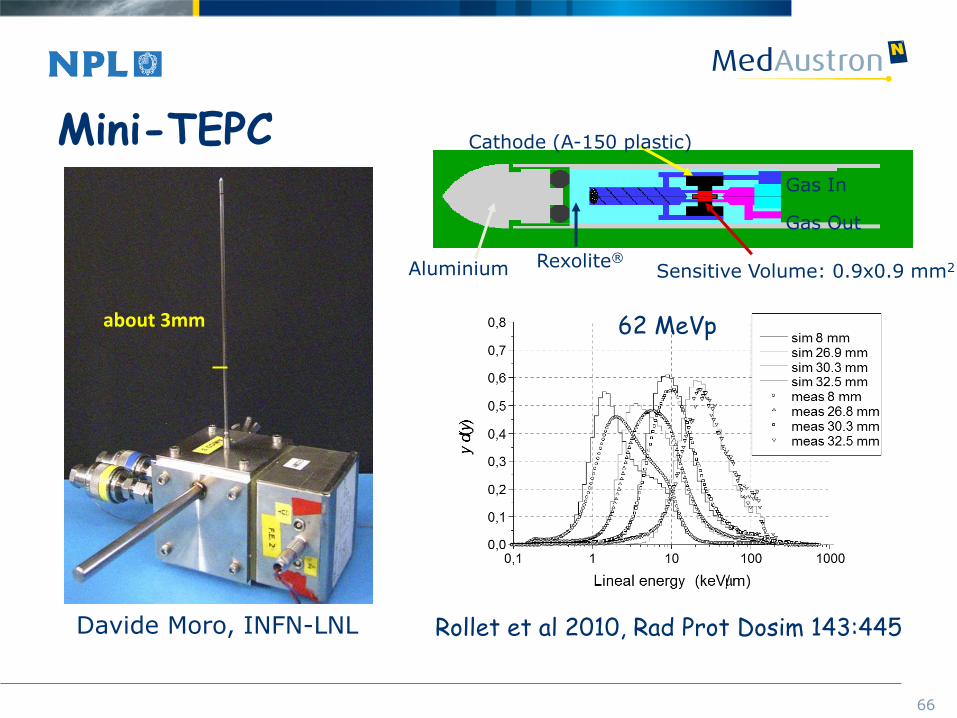
Mini-TEPC
about 3mm
Davide Moro, INFN-LNL
Cathode (A-150 plastic)
Rexolite®
Sensitive Volume: 0.9x0.9 mm2
Gas Out
Gas In
Aluminium
Rollet et al 2010, Rad Prot Dosim 143:445
62 MeVp
67
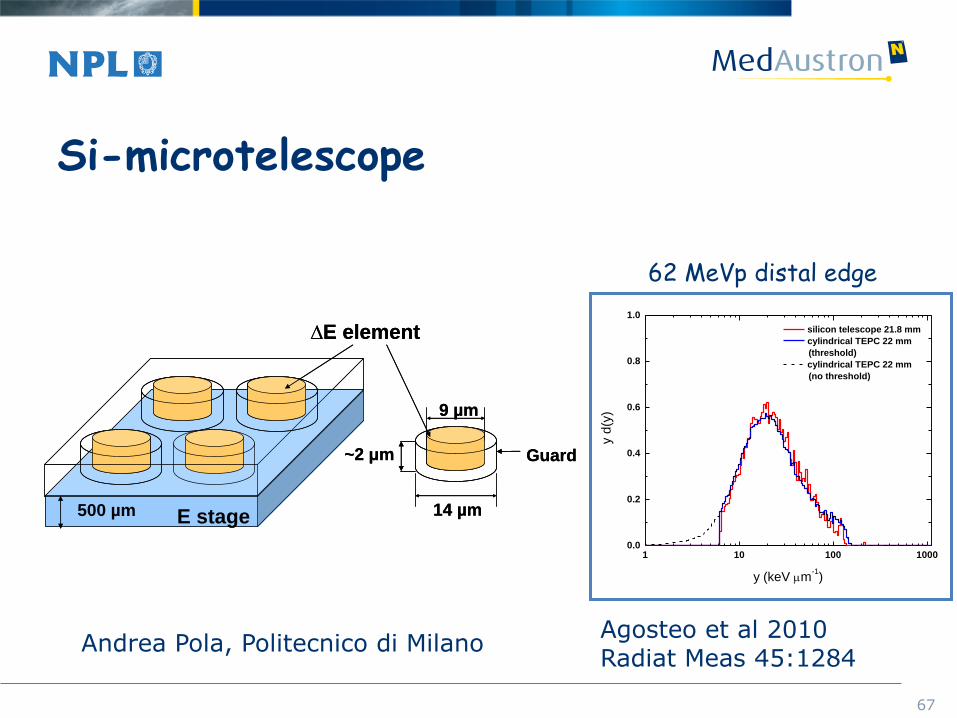
Si-microtelescope
500 µm 14 µm
9 µm
E stage
Guard~2 μm
∆E element
500 µm 14 µm
9 µm
E stage
Guard~2 μm
∆E element
Andrea Pola, Politecnico di Milano
1 10 100 10000.0
0.2
0.4
0.6
0.8
1.0
silicon telescope 21.8 mm
cylindrical TEPC 22 mm
(threshold)
cylindrical TEPC 22 mm
(no threshold)
y d
(y)
y (keV mm-1)
62 MeVp distal edge
Agosteo et al 2010 Radiat Meas 45:1284
68
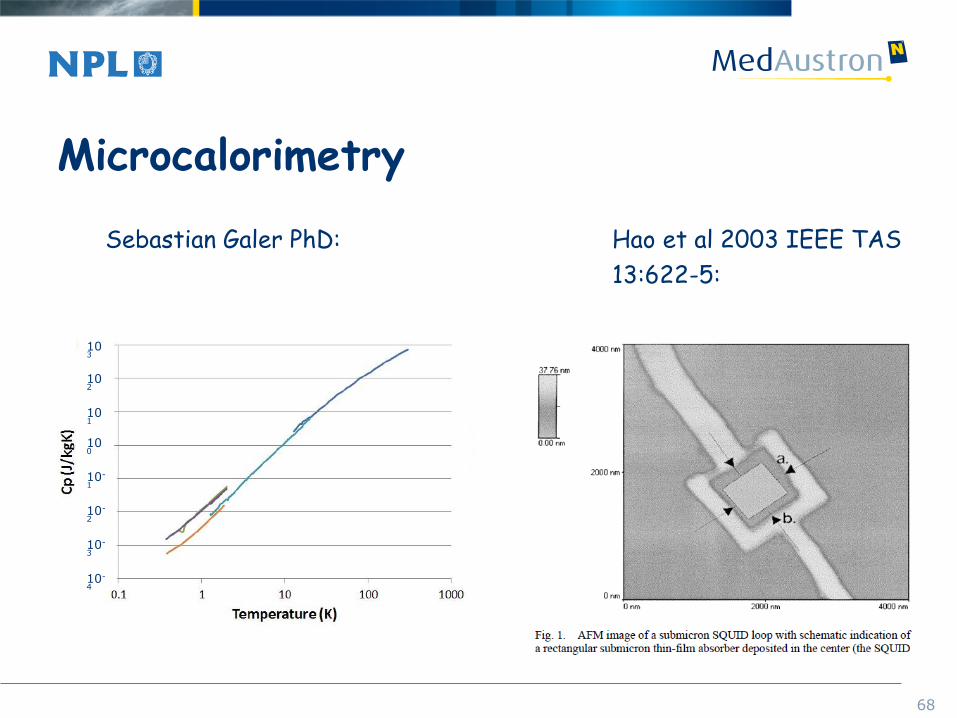
Microcalorimetry
Sebastian Galer PhD: Hao et al 2003 IEEE TAS
13:622-5:
103
102
101
100
10-
1
10-
2
10-
3
10-
4
Nanodosimetry
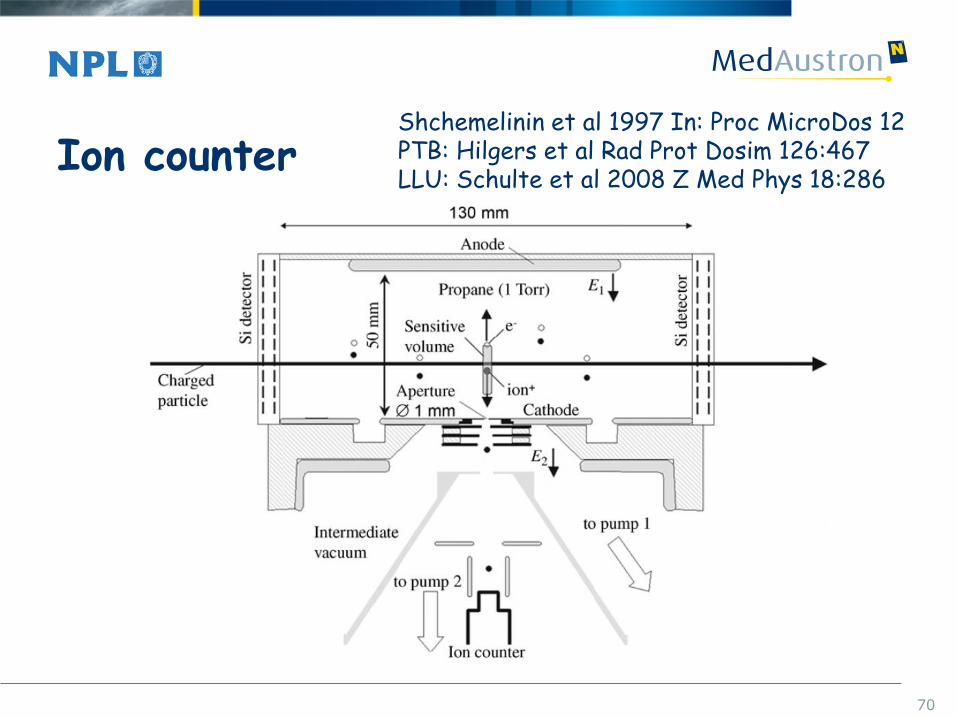
70
Ion counter Shchemelinin et al 1997 In: Proc MicroDos 12 PTB: Hilgers et al Rad Prot Dosim 126:467 LLU: Schulte et al 2008 Z Med Phys 18:286
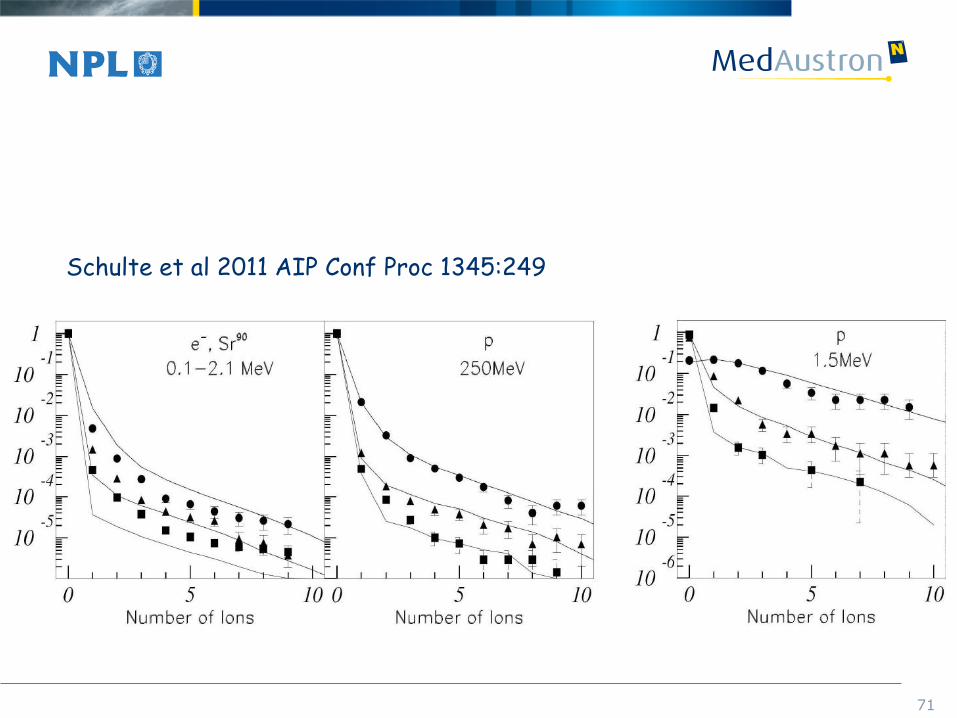
71
Schulte et al 2011 AIP Conf Proc 1345:249
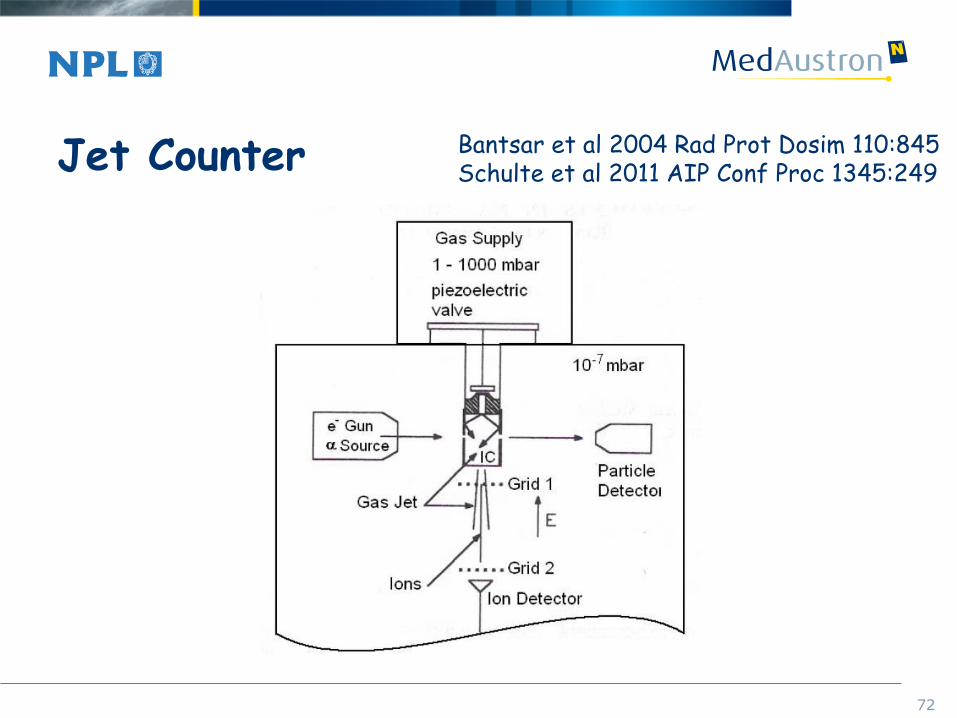
72
Jet Counter Bantsar et al 2004 Rad Prot Dosim 110:845 Schulte et al 2011 AIP Conf Proc 1345:249
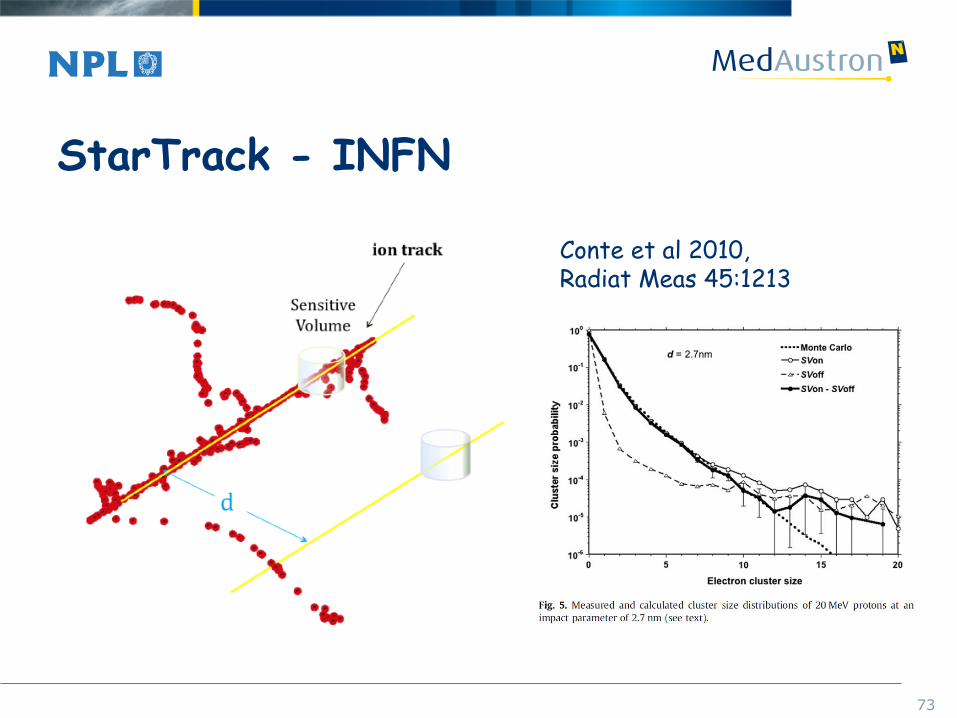
73
StarTrack - INFN
Conte et al 2010, Radiat Meas 45:1213
74
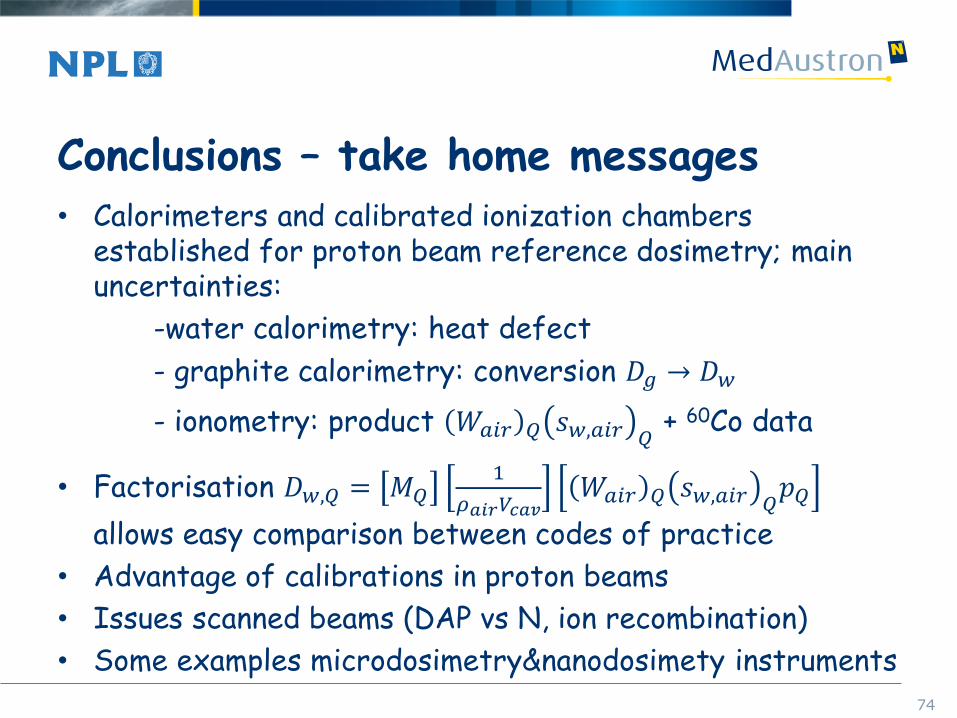
Conclusions – take home messages • Calorimeters and calibrated ionization chambers
established for proton beam reference dosimetry; main uncertainties:
-water calorimetry: heat defect
- graphite calorimetry: conversion 𝐷𝑔 → 𝐷𝑤
- ionometry: product 𝑊𝑎𝑖𝑟 𝑄 𝑠𝑤,𝑎𝑖𝑟 𝑄 + 60Co data
• Factorisation 𝐷𝑤,𝑄 = 𝑀𝑄1
𝜌𝑎𝑖𝑟𝑉𝑐𝑎𝑣𝑊𝑎𝑖𝑟 𝑄 𝑠𝑤,𝑎𝑖𝑟 𝑄
𝑝𝑄
allows easy comparison between codes of practice
• Advantage of calibrations in proton beams
• Issues scanned beams (DAP vs N, ion recombination)
• Some examples microdosimetry&nanodosimety instruments
75
Reading
C. P. Karger, O. Jäkel, H. Palmans and T. Kanai, “Dosimetry for Ion Beam Radiotherapy,” Phys. Med. Biol. 55(21) R193-R234, 2010
H. Palmans, A. Kacperek and O. Jäkel, “Hadron dosimetry” In: Clinical Dosimetry Measurements in Radiotherapy (AAPM 2009 Summer School), Ed. D. W. O. Rogers and J. Cygler, (Madison WI, USA: Medical Physics Publishing), 2009, pp. 669-722
H. Palmans, “Dosimetry,” In: Proton Therapy Physics, Ed. H. Paganetti (London: Taylor & Francis), 2011, pp. 191-219
H. Palmans, “Monte Carlo for proton and ion beam dosimetry,” In: Monte Carlo Applications in Radiation Therapy, Ed. F. Verhaegen and J Seco, (London: Taylor & Francis), 2013, pp. 185-199


