
IFP Energies nouvelles International ConferenceRencontres Scientifiques d'IFP Energies nouvelles
RHEVE 2011: International Scientific Conference on Hybrid and Electric VehiclesRHEVE 2011 : Conférence scientifique internationale sur les véhicules hybrides et électriques
Advanced and Integrated Petrophysical
Characterization for CO2 Storage: Application
to the Ketzin Site
M. Fleury1*, S. Gautier
1, N. Gland
1, P.F. Boulin
1, B. Norden
2
and C. Schmidt-Hattenberger2
1 IFP Energies nouvelles, 1-4 avenue de Bois-Préau, 92852 Rueil-Malmaison - France2 GFZ German Research Centre for Geosciences, Helmholtz Centre Potsdam - Germany
e-mail: [email protected]
* Corresponding author
Resume — Caracterisation petrophysique integree pour le stockage de CO2 : application au site de
Ketzin — La simulation et le suivi d’un stockage de CO2 requiert des donnees petrophysiques
specifiques. Nous presentons un ensemble d’experiences applicables a tout stockage et a toute
couverture, fournissant des donnees pour des simulations numeriques realistes du potentiel de
stockage et de l’injection. Ces experiences sont integrees avec les donnees diagraphiques pour
l’estimation de la porosite, la saturation irreductible, la pression capillaire et la permeabilite
relative de l’eau en drainage, la saturation en gaz residuelle, les relations resistivite-saturation
et les proprietes de transport de la couverture (permeabilite et diffusivite). Le cas considere est
l’aquifere salin du Trias dans le contexte du projet CO2SINK, le premier site experimental de
stockage en Allemagne situe pres de Ketzin.
Nous avons utilise des methodes de mesure necessitant des durees raisonnables tout en restant
representatives des processus in situ. Pour le transport diphasique, nous avons utilise la
centrifugation. Pour la resistivite, nous avons utilise une methode rapide « Fast Resistivity
Index Measurement » (FRIM) en drainage et imbibition, en condition ambiante et en
condition de stockage. Pour la caracterisation de la couverture, nous avons utilise une
technique rapide RMN (Resonance Magnetique Nucleaire) utilisant le deuterium comme
traceur pour la mesure de diffusion et une methode stationnaire innovante pour la mesure de
permeabilite. La pression d’entree a egalement ete evaluee. Les diagraphies RMN et de
resistivite ont egalement ete utilisees pour estimer de maniere continue la saturation
irreductible et juger de la representativite des echantillons analyses au laboratoire.
Pour le site de Ketzin, la zone de stockage est un gres argileux d’origine fluviatile localement
tres cimente d’une porosite d’environ 30 % et d’une permeabilite variant de 100 a 300 mD.
Deux zones se distinguent par des saturations irreductibles variant de 15 a 35 %. La courbe de
permeabilite relative a l’eau presente une forte pente et suggere qu’une saturation inferieure a
50 % n’est pas atteignable en pratique. L’exposant de saturation de l’indice de resistivite est de
1,7, plus faible que la valeur standard de 2. La couverture a une permeabilite de 27 nD, une
porosite de 15 % et une diffusivite de 0,8 9 10�9 m2/s.
Oil & Gas Science and Technology – Rev. IFP Energies nouvelles, Vol. 68 (2013), No. 3, pp. 557-576Copyright � 2013, IFP Energies nouvellesDOI: 10.2516/ogst/2012084

Abstract— Advanced and Integrated Petrophysical Characterization for CO2 Storage: Application
to the Ketzin Site — Reservoir simulations and monitoring of CO2 storage require specific
petrophysical data. We show a workflow that can be applied to saline aquifers and caprocks in order
to provide the minimum data set for realistic estimations of storage potential and perform pertinent
simulations of CO2 injection. The presented series of experiments are fully integrated with quanti-
tative log data analysis to estimate porosity, irreducible saturation, drainage capillary pressure
and water relative permeability, residual gas saturation, resistivity-saturation relationships and cap-
rock transport properties (permeability and diffusivity). The case considered is a saline aquifer of
the Triassic Stuttgart formation studied in the framework of the CO2SINK onshore research stor-
age, the first in situ testing site of CO2 injection in Germany located near the city of Ketzin.
We used petrophysical methods that can provide the required data in a reasonable amount of time
while still being representative of the in situ injection process. For two phase transport properties,
we used the centrifuge technique. For resistivity measurements, we used the Fast Resistivity Index
Measurement (FRIM) method in drainage and imbibition, at ambient and storage conditions.
For caprock characterization, we used a fast NMR (Nuclear Magnetic Resonance) deuterium
tracer technique to measure diffusivity and a modified steady state innovative technique to determine
permeability. Entry pressure has also been evaluated using several methods. Resistivity and NMR
logs were analyzed to provide a continuous estimation of irreducible saturation for the entire storage
zone and to judge on the representativity of the samples analyzed in the laboratory.
For the Ketzin site, the storage zone is a clayey sandstone of fluvial origin locally highly cemented,
with porosity around 30% and permeability ranging from 100 to 300 mD. Two zones were identified
on the logs characterized by two different irreducible saturation ranging from 15 up to 35%. The
measured relative permeability curves show a sharp decrease of the water effective permeability
and suggest that a saturation lower than 50% cannot be reached in practice. The exponent of the
resistivity index curve is about 1.7, lower than the default value of 2. The caprock has a permeability
of 27 nD, a porosity around 15% and a pore diffusivity of 0.8 9 10�9 m2/s.
INTRODUCTION
Carbon Capture and Sequestration (CCS) is one of the
many solutions to limit the current emissions of carbon
dioxide into the atmosphere resulting in global warming.
Although depleted oil and gas reservoirs can be used for
CCS, their worldwide capacity and distribution is much
less attracting than saline aquifers. From the petrophys-
ical point of view, quick appraisal of such formation
must be performed with appropriate laboratory experi-
ments. The experimental methods are similar to those
applied to oil and gas reservoirs but for CCS, the first
drainage is a key process which is not of primary interest
when producing gas. In addition, specific protocols are
needed to characterize caprock samples.
The study was conducted in the framework of the
COSMOS-2 program linked to the Ketzin EU-project
CO2SINK, which represents the first onshore in situ testing
site of carbon dioxide (CO2) injection in Europe (Schilling
et al., 2009). TheKetzin project is located at theKetzin anti-
cline, which is located approximately 25 km west of Berlin
(Forster et al., 2006). Target reservoir is the saline aquifer
of the Triassic Stuttgart Formation at a depth of 625 to
700 m at the injection site. Three boreholes were drilled,
including coring of the target reservoir, and instrumented
in 2007 to realize injection (CO2 Ktzi 201/2007 borehole)
and monitoring of CO2 (CO2 Ktzi 200/2007 and CO2Ktzi
202/2007 boreholes; Prevedel et al., 2008). Since June 2008,
53 000 tofCO2 (September 2011) has been injected and con-
tinuously monitored (Wuerdemann et al., 2010; Martens
et al., 2011). For monitoring of CO2, the injection well
and the two observationwells were equippedwith geophys-
ical sensors including e.g. a fiber-optic-sensor cable loop for
Distributed Temperature Sensing (DTS; all wells) and a
Vertical Electrical Resistivity Array (VERA) consisting of
fifteen toroidal steel electrodes per well and 15-line surface
connection cables (Prevedel et al., 2009; Giese et al., 2009).
In recent studies, Electrical Resistivity Tomography
(ERT) based on cross-hole measurements has been evalu-
ated as a suitable method to detect the resistivity changes
caused by CO2 injection and migration in geological reser-
voirs (Ramirez et al., 2003; Christensen et al., 2006).
Both, reservoir simulations and the application of
resistivity monitoring techniques require petrophysical
data, beside geological information and appropriate up-
scaling methods. In this study, we conducted not only a
series of experiments to fulfill these requirements, we
suggest also a best-practice workflow to ensure the use-
fulness and the coherency of the data obtained. A first
storage capacity evaluation can be made from porosity
558 Oil & Gas Science and Technology – Rev. IFP Energies nouvelles, Vol. 68 (2013), No. 3
and irreducible saturation, among other parameters, and
they can be estimated from log and laboratory data.
More precise evaluation can be performed from numer-
ical simulations of CO2 injection where at least, perme-
ability, capillary pressure and water relative
permeability must be known. Furthermore, in the pres-
ent context, resistivity data acquired are closely related
to the new in situ monitoring technology (VERA sys-
tem), which has been developed and tested in other
research programs (Kiessling et al., 2010; Bergmann
et al., 2010).
In this study, the samples analyzed are from the cored
reservoir and caprock section of the Ketzin 201 bore-
hole. Some experiments conducted are often part of a
standard characterization scheme (like mercury injec-
tion), others are much more advanced (like centrifuge
relative permeability or resistivity measurements at
in situ conditions) but all must be carefully planned in
terms of core preparation and handling to insure coher-
ency. Some techniques presented here could also be used
as a screening method before going to more sophisti-
cated and time consuming experiments performed with
supercritical CO2 at storage conditions. For example,
the centrifuge technique is a very efficient screening
method to evaluate simultaneously capillary pressure
and water relative permeability curves on several sam-
ples in a single run. In this work, we also show how cap-
rock formation could be characterized in terms of
permeability, entry pressure and diffusivity using new
and optimized techniques. On the Ketzin site, published
petrophysical studies focused on the effect of CO2 on
permeability, resistivity and P-wave velocity (Zemke
et al., 2010) and the effect of CO2 containing impurities
(such as SO2, Kummerow and Spangenberg, 2011) on
these properties. Both studies concluded that (pure)
CO2 injection has little impact on the above mentioned
properties when monitored over long periods of time
(up to 1 year). However, in the presence of SO2, this is
not the case and the pore structure is modified, as shown
by NMR measurements, generating fine migration, per-
meability and P-wave velocity changes.
After an overview on the applied petrophysical meth-
ods, we present the results of the Ketzin analysis from
log to laboratory scale, showing the measured reservoir
(transport) and caprock properties as integrated
concept.
1 PETROPHYSICAL METHODS
Several laboratory techniques were applied for charac-
terizing pore structures, for the evaluation of transport
properties of reservoir rocks and for the assessment of
caprock properties. We present here the workflow of
the measurements conducted in this study, starting from
sampling and petrophysical standard methods to more
advanced experimental settings.
1.1 CT Scan Characterization, Sample Selection,and Sample Preparation
Prior to plugging, full-size cores were analyzed using a
medical X-ray CT scanner to detect major heterogene-
ities and perform the plugging in favorable zones. For
sensitive samples of the caprock zone, it was necessary
to saw a cube shaped sample first. This sample was then
machined very carefully obtaining a cylinder fitting the
core holder. Since porosity was measured using NMR
techniques described below, samples were never dried
but simply flushed with synthetic brine, except before
mercury injection experiments; in that case, the drying
is performed at 60 �C until a stable weight was reached.
1.2 Pore Entry Size Distribution by Mercury Injection
High Pressure Mercury Injection (HPMI) capillary pres-
sure experiments were performed on trim ends after cor-
ing the plugs from the full size samples. In a mercury
injection experiment, one measures the volume of mer-
cury penetrating the porous media for a given pressure
(see e.g. Dullien, 1992). From the derivative of that
curve, one can obtain the pore throat distribution
f (dHG) according to:
f dHGð Þ ¼ P2
2c cos 0dS
dPð1Þ
where P is pressure, S saturation, c surface tension and
0 contact angle. Here, the function f is a true distribution
in the mathematical sense. However, it is well known
that f is not the appropriate way for representing the
throat distribution (Lenormand, 2003). Therefore, the
dimensionless function g defined by:
g dHGð Þ ¼ PdS
dPð2Þ
is plotted in order to retrieve the “usual” aspect of HPMI
derived distribution. The derivative is calculated using
spline fitting of the S(P) curve.
1.3 NMR T2 Distribution
NMRmeasurements were performed using two low-field
instruments (Oxford Instruments) operating at 2 MHz
for plugs with a diameter of 40 mm and 23 MHz for
plugs with a diameter of 15 mm, the latter used to
M. Fleury et al. / Advanced and Integrated Petrophysical Characterization for CO2 Storage:Application to the Ketzin Site
559
perform diffusion measurements. NMR porosity and T2
relaxation time distributions, calculated using a in-house
software, were measured on all plugs without drying.
First, NMR was used for determination of pore volumes
after coring from the full-size core and re-saturation by
flooding. The pore volume was deduced from the total
NMR magnetization after calibration with a known vol-
ume of water. Porosity was calculated from the pore vol-
ume and the total sample volume given by the diameter
D (40 mm) and the length L (25 or 30 mm) of the sample.
Second, NMR was used as an indicator of pore-size dis-
tribution, in complement to the pore entry size distribu-
tion determined by mercury injection. The measured T2
distribution is related to the distribution of the volume-
to-surface ratio of a pore, called the pore-size distribu-
tion, by the equation:
V
S¼ q2
1
T2� 1
T2B
� ��1
ð3Þ
where q2 is a surface relaxivity, V and S is the volume
and surface of a pore, respectively, and T2B represents
the bulk water relaxation (about 3 s at 30 �C). Basedon our experience (Fleury, 2007), an order of magnitude
of 5 lm/s should be chosen in the present case, much
lower than the value taken by Zemke et al. (2010)
(50 lm/s). Typically, a relaxation time of 10 ms corre-
sponds to a V/S ratio of 10 nm but this approximate cor-
respondence has no impact in our study. Water
relaxations in small pores from the clays are typically
below 5 to 10 ms, depending on the type of clay.
NMR cut-off measurements were also determined
using centrifuge de-saturated plugs. If Swirr is the small-
est saturation obtained at the highest capillary pressure
(2.2 bar) on a given sample (asymptotic saturation value
on the Pc curve), the cut-off value T2c is determined
using the T2 distribution measured on the same sample
saturated at 100% and is defined as:
Z T2c
0A T 2ð ÞdT2 ¼ Swirr ð4Þ
where A(T2) is the relaxation-time distribution. Relaxa-
tion times up to the cut-off T2c corresponds to small
pores that are not de-saturated.
1.4 Formation Factor and Resistivity IndexMeasurements
The formation factor was measured simultaneously with
permeability using a classical face to face two electrode
system at ambient laboratory temperature. The conduc-
tivity of the brine was measured at the outlet of the core
holder using a conductivity meter in which a temperature
sensor was included. The formation factor was then
determined from the ratio of brine to sample conductiv-
ity (FF = Cw/C0) measured at the same temperature.
The sample conductivity C0 was determined using the
measured resistance R, the sample length L and diameter
D by the formula C0 = L/(R pD2/4).
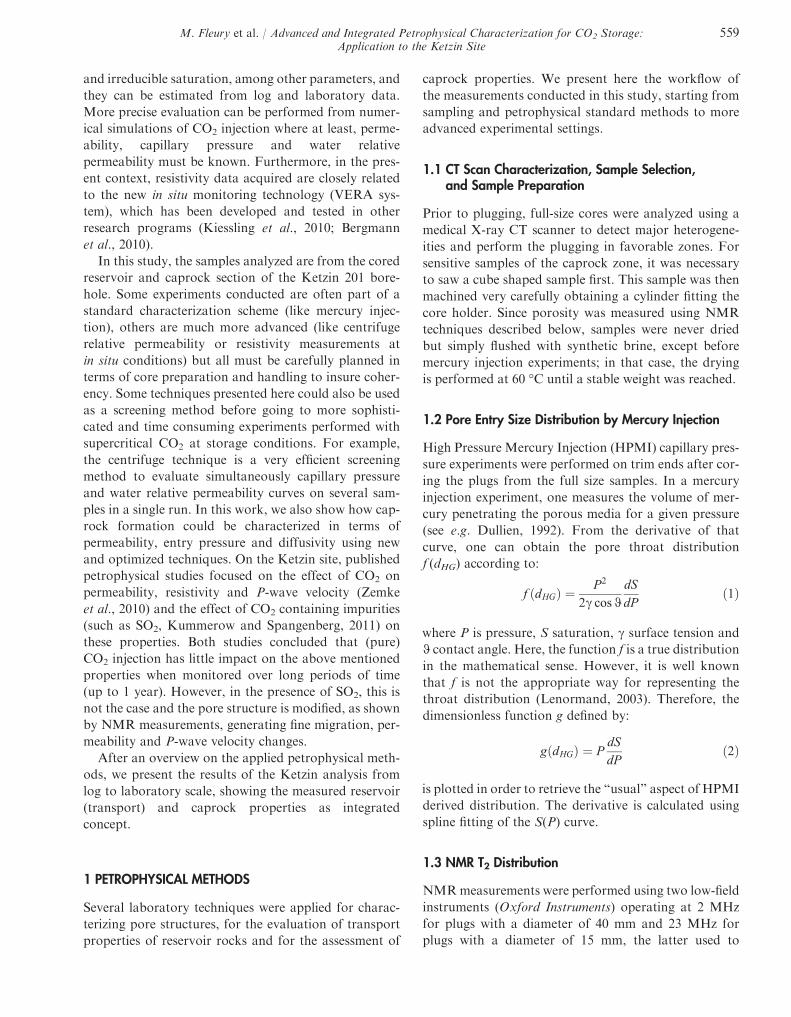
The method used to measure resistivity index (RI) is
based on the Fast Resistivity Index Measurement
method called FRIM (Fleury, 1998). It was originally
planned to use a screening method (Han et al., 2007)
but the Ketzin sample consolidation was not sufficient
for this technique to be applied. At ambient conditions,
we measured resistivity indexes in drainage and sponta-
neous imbibition using the system presented in Figure 1.
In drainage, the pressure difference between air and
brine is increased step-wise (typically using pressure dif-
ferences of 50, 100, 180, 360, 640, 1 300, 1 800 mbar) to
decrease the saturation, and then decreased again in
imbibition. From the recording of the average water sat-
uration (Sw) using the water level detector (water
expelled from the sample), and the average resistance
using the impedance meter, we can deduce “continuous”
RI-Sw curves. Compared to other systems, this experi-
ment has very little sensitivity to saturation profiles, if
any, contrary to flooding experiments with electrodes
located along the sample. At storage conditions, the
measurement principle is similar to the one described
above but the experimental set-up is designed to handle
high pressure and temperature (Fleury, 2003), as well as
CO2 at typically 100 bar. In the performed study, the
average pore pressure was 80 bar, the confining pressure
Oil/gas in/out
Brine in/out
CAPRIWET cell:
Sample ΔU ~I
R = Δ U / I
Six electrodes radial geometry:
Sample
Figure 1
Schematic of the cell and electrode geometry for measuring
resistivity index. A water wet ceramic located at the bottom
of the sample prevents the breakthrough of oil or gas at the
lower face of the sample and allows reaching high capillary
pressure uniformly along the sample. The brine outlet is
connected to a level detector to determine brine saturation.
Sample length is 25 mm.
560 Oil & Gas Science and Technology – Rev. IFP Energies nouvelles, Vol. 68 (2013), No. 3
110 bar and the temperature 30 �C. The length of the
sample used is 25 mm (diameter = 40 mm).
At ambient conditions, in addition to the standard
1 kHz frequency measurement, the system allows scan-
ning the frequency range [1 Hz-1 MHz] using an
advanced impedance meter (Fleury and Liu, 2000). In
this case, it was of interest to study the low frequency
ranges around 1 Hz, because it is close to those used in
the measurement cycles of the VERAmonitoring system
installed in Ketzin (Schmidt-Hattenberger et al., 2011a).
The frequency dispersion was studied and we concluded
that resistivity index data obtained at 1 kHz can be used
at 1 Hz without significant deviation. This is not pre-
sented in this paper.
1.5 Centrifuge Capillary Pressure and RelativePermeability Measurements
We performed air-brine first drainage centrifuge capil-
lary pressure and relative permeability measurements
using an automated centrifuge (Fleury et al., 1998).
Essentially, the system can record continuously the
amount of water expelled from the sample as a function
of time and speed of rotation. When the saturation in the
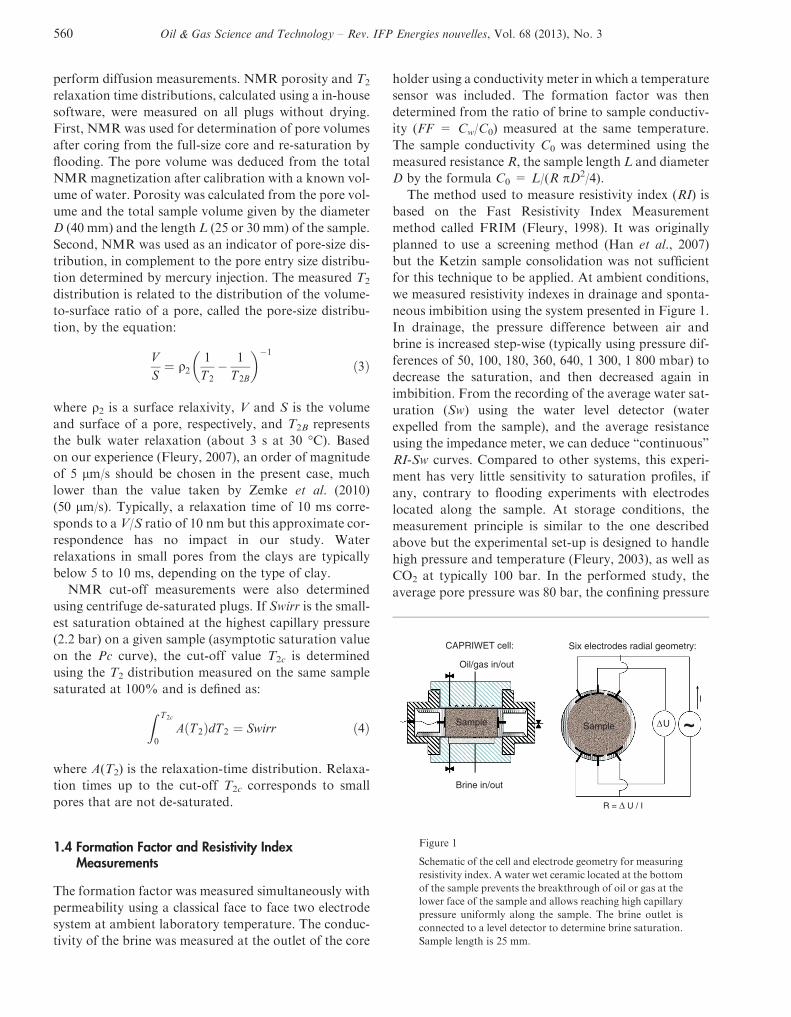
sample is stabilized, the equilibrium between capillary
and gravity forces is given by (Fig. 2):
PC Rð Þ ¼ 1
2x2 R2
max � R2� �
qw � qg� � ð5Þ
where x is the rotation velocity, Rmax is the distance
between the rotation center and the outlet face of the
plug, qw and qg are the densities of brine and air. Accord-
ing to the above equation, the maximum pressure Pc is
obtained at the inlet face of the plug (Rmin), then it
diminishes to zero at the opposite face (Rmax), which
stays at 100% saturation. As a result, there is a satura-
tion profile and a non-trivial calculation is necessary.
We used the Forbes method (Forbes, 1991) to calculate
capillary pressure curves from average saturation data.
The number of points describing the Pc curves is directly
related to the number of speed steps.
With the recording of water saturation versus time
and speed of rotation, the water relative permeability
curve can be deduced. Indeed, the time needed to go
from one equilibrium state to another (one speed of rota-
tion to another) is directly linked to the effective perme-
ability of one phase (brine) in the presence of the other
one (air). Again, due to the saturation profile, a numer-
ical interpretation is necessary. It consists of fitting the
recorded saturation data using a forward model based
on two-phase Darcy’s law in a centrifuge with appropri-
ate boundary conditions. We used the SENDRA soft-
ware (from Weatherford�) to perform this analysis.
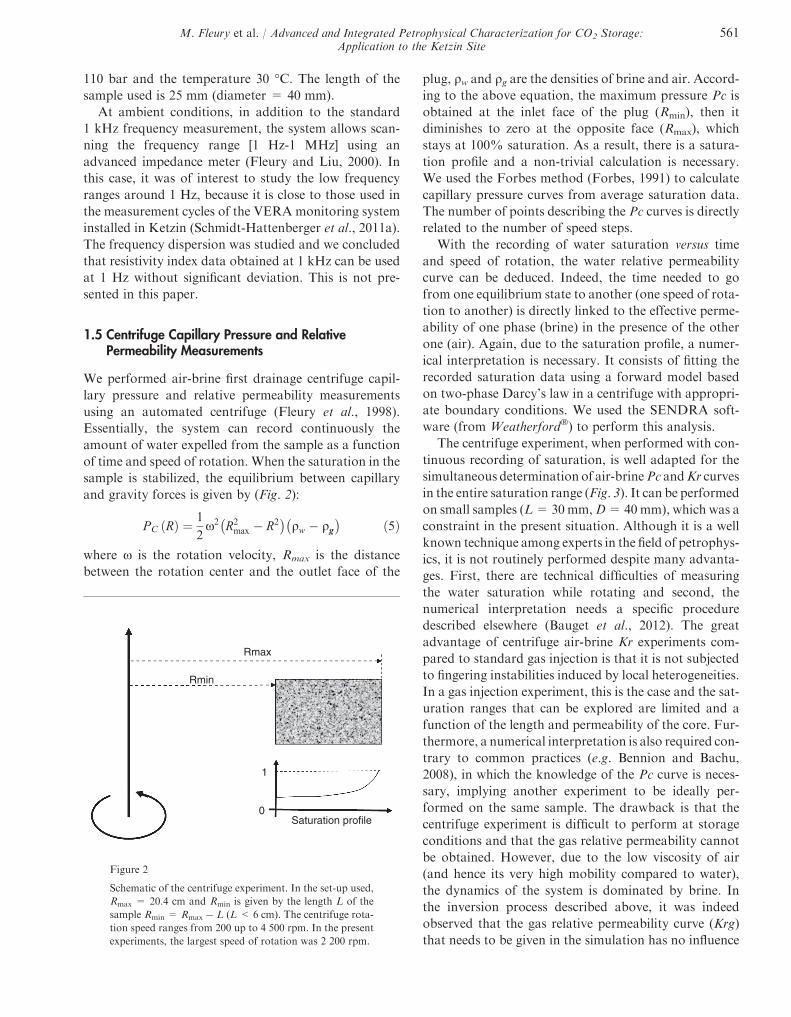
The centrifuge experiment, when performed with con-
tinuous recording of saturation, is well adapted for the
simultaneous determination of air-brinePc andKr curves
in the entire saturation range (Fig. 3). It can be performed
on small samples (L=30mm,D=40mm), which was a
constraint in the present situation. Although it is a well
known technique among experts in the field of petrophys-
ics, it is not routinely performed despite many advanta-
ges. First, there are technical difficulties of measuring
the water saturation while rotating and second, the
numerical interpretation needs a specific procedure
described elsewhere (Bauget et al., 2012). The great
advantage of centrifuge air-brine Kr experiments com-
pared to standard gas injection is that it is not subjected
to fingering instabilities induced by local heterogeneities.
In a gas injection experiment, this is the case and the sat-
uration ranges that can be explored are limited and a
function of the length and permeability of the core. Fur-
thermore, a numerical interpretation is also required con-
trary to common practices (e.g. Bennion and Bachu,
2008), in which the knowledge of the Pc curve is neces-
sary, implying another experiment to be ideally per-
formed on the same sample. The drawback is that the
centrifuge experiment is difficult to perform at storage
conditions and that the gas relative permeability cannot
be obtained. However, due to the low viscosity of air
(and hence its very high mobility compared to water),
the dynamics of the system is dominated by brine. In
the inversion process described above, it was indeed
observed that the gas relative permeability curve (Krg)
that needs to be given in the simulation has no influence
Rmax
Rmin
Saturation profile
1
0
Figure 2
Schematic of the centrifuge experiment. In the set-up used,
Rmax = 20.4 cm and Rmin is given by the length L of the
sample Rmin = Rmax � L (L < 6 cm). The centrifuge rota-
tion speed ranges from 200 up to 4 500 rpm. In the present
experiments, the largest speed of rotation was 2 200 rpm.
M. Fleury et al. / Advanced and Integrated Petrophysical Characterization for CO2 Storage:Application to the Ketzin Site
561
on the result, as expected. To some degree, this is also the
case for field simulations. Hence, we obtained from this
experiment the most important parameter, the water Kr
curve, and in the absence of Krg data for the considered
storage, one can take an arbitrary shape based on litera-
ture data.
At the end of drainage, samples are immersed in water
in order to obtain the residual gas saturation. Prior to
centrifugation, brine permeability and formation factor
are measured. For various reasons (corrosion, salt pre-
cipitation), a diluted formation brine (50 g/L) has been
used but this has no consequences on the transport prop-
erties determined in the centrifuge experiment. Although
the system can handle sample lengths of up to 60 mm, we
used a sample of length 25 mm or 30 mm (D = 40 mm)
in order to improve the accuracy at low capillary pres-
sures. The accuracy of volume measurements is
0.05 cc, about 1% of the pore volume.
1.6 Caprock Permeability Measurements
Both the steady state and pulse decaymethods were used.
In the steady state method, a pressure gradient is applied
and the corresponding water flux is measured. The water
permeability k (m2) is deduced from Darcy’s law:
Q ¼ S � kl� Pu � Pd
Lð6Þ
whereQ is thewater flux (m3/s),S the sample surface (m2),
l the water viscosity (Pa.s), L the sample length (m), Pu
the upstream pressure (Pa) and Pd the downstream pres-
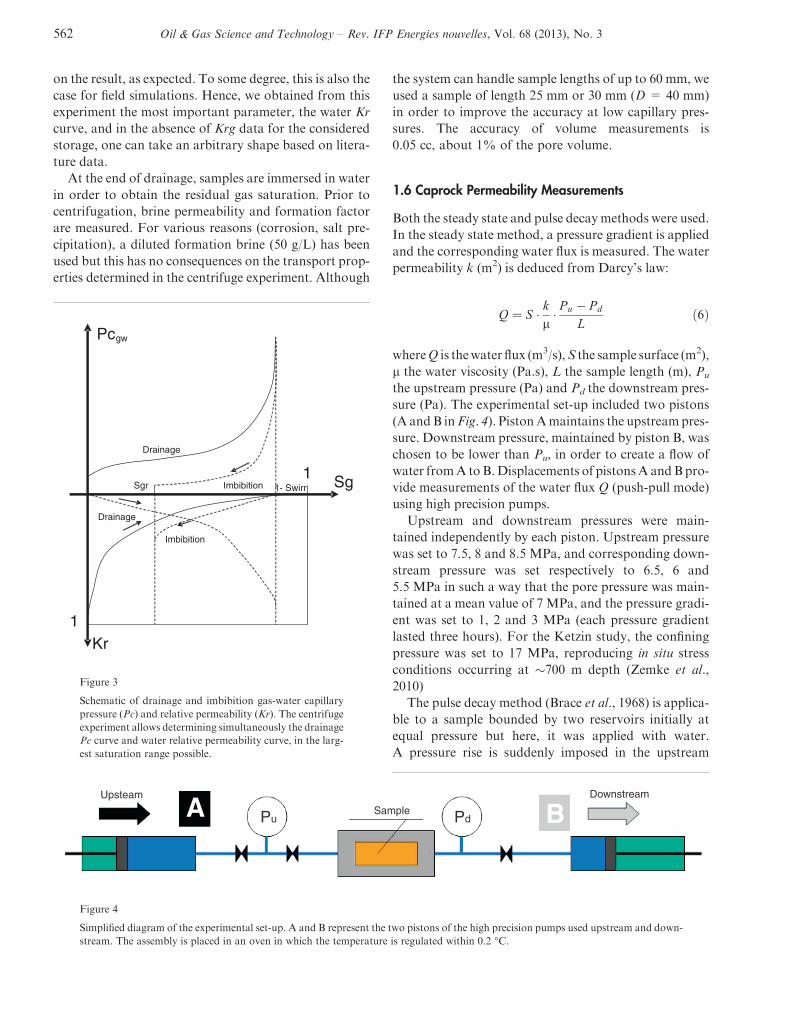
sure (Pa). The experimental set-up included two pistons
(A andB inFig. 4). PistonAmaintains the upstreampres-
sure. Downstream pressure, maintained by piston B, was
chosen to be lower than Pu, in order to create a flow of
water fromA toB.Displacements of pistonsA andBpro-
vide measurements of the water flux Q (push-pull mode)
using high precision pumps.
Upstream and downstream pressures were main-
tained independently by each piston. Upstream pressure
was set to 7.5, 8 and 8.5 MPa, and corresponding down-
stream pressure was set respectively to 6.5, 6 and
5.5 MPa in such a way that the pore pressure was main-
tained at a mean value of 7 MPa, and the pressure gradi-
ent was set to 1, 2 and 3 MPa (each pressure gradient
lasted three hours). For the Ketzin study, the confining
pressure was set to 17 MPa, reproducing in situ stress
conditions occurring at �700 m depth (Zemke et al.,
2010)
The pulse decay method (Brace et al., 1968) is applica-
ble to a sample bounded by two reservoirs initially at
equal pressure but here, it was applied with water.
A pressure rise is suddenly imposed in the upstream
Pcgw
1
1 Sg
Kr
Drainage
Drainage
Imbibition
Imbibition
1- SwirrSgr
Figure 3
Schematic of drainage and imbibition gas-water capillary
pressure (Pc) and relative permeability (Kr). The centrifuge
experiment allows determining simultaneously the drainage
Pc curve and water relative permeability curve, in the larg-
est saturation range possible.
Upsteam Downstream
Pd Pu BA Sample
Figure 4
Simplified diagram of the experimental set-up. A and B represent the two pistons of the high precision pumps used upstream and down-
stream. The assembly is placed in an oven in which the temperature is regulated within 0.2 �C.
562 Oil & Gas Science and Technology – Rev. IFP Energies nouvelles, Vol. 68 (2013), No. 3
reservoir and the pressure evolution is recorded in both
reservoirs. The determination of the permeability is
made using the transient phase leading to pressure equi-
librium in the reservoirs. The water motion within the
sample is described by the equation:
Ssqwg
@Pw
ot¼ �r kw
lw� rPw
� �ð7Þ
where Ss (m�1) is the specific storage of the sample and
corresponds to the volume of water over the total vol-
ume of the rock which can be stored per unit of water
head change. Both permeability and specific storage
can be obtained when interpreting a single pulse decay
experiment.
1.7 Caprock Entry Pressure Measurements
Two measurement techniques were used. First, the stan-
dard method (Li et al., 2005) in which an upstream gas
pressure is increased step by step until water is displaced
at the outlet. The duration of the respective steps should
be long enough to allow for observation of downstream
water production (3 to 4 days). The water production
itself is recorded by a pump placed downstream. The sec-
ond method follows the dynamic approach presented by
Egermann et al. (2006). Here, gas is injected upstream at
a constant pressure Pg, gas pressure is chosen above the
entry pressure. Upstream, gas displaces water until gas is
in contact with the sample’s surface. As the downstream
pressure is maintained to be constant, two different flow
rates are observed: before and after gas entry. The flow
rate difference is related to the entry pressure value.
Before conducting the caprock entry-pressure experi-
ments, the permeability was measured using the steady
state method (three flow rates at three different pressure
gradients, see previous paragraph).
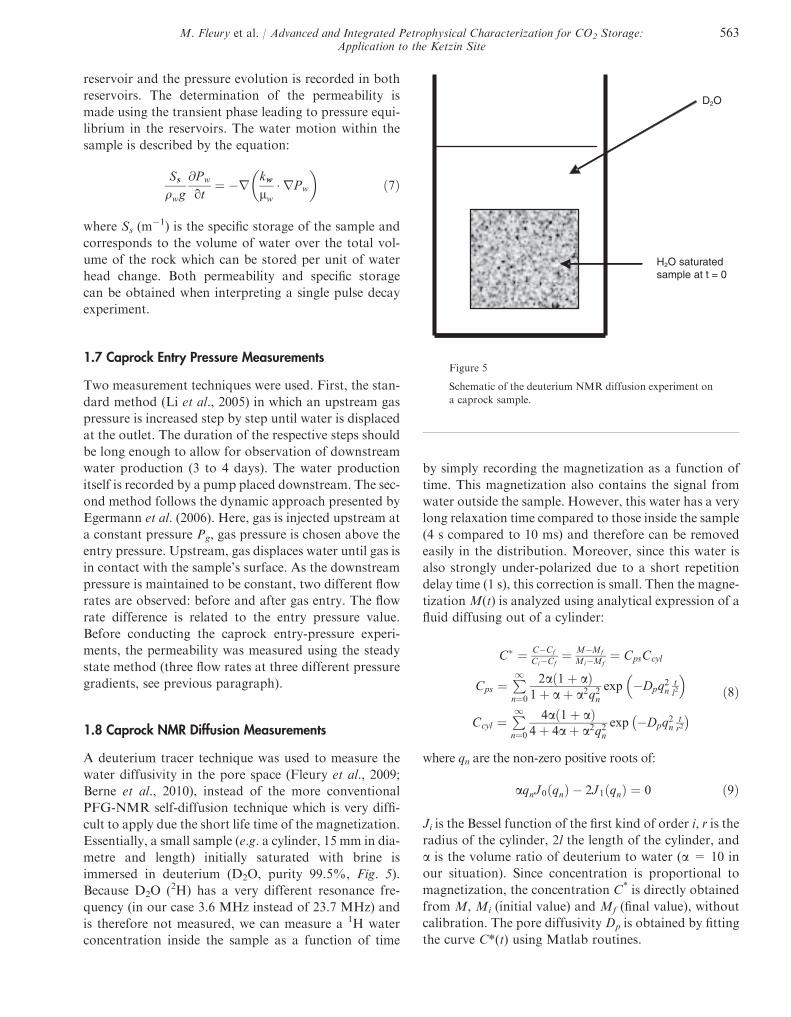
1.8 Caprock NMR Diffusion Measurements
A deuterium tracer technique was used to measure the
water diffusivity in the pore space (Fleury et al., 2009;
Berne et al., 2010), instead of the more conventional
PFG-NMR self-diffusion technique which is very diffi-
cult to apply due the short life time of the magnetization.
Essentially, a small sample (e.g. a cylinder, 15 mm in dia-
metre and length) initially saturated with brine is
immersed in deuterium (D2O, purity 99.5%, Fig. 5).
Because D2O (2H) has a very different resonance fre-
quency (in our case 3.6 MHz instead of 23.7 MHz) and
is therefore not measured, we can measure a 1H water
concentration inside the sample as a function of time
by simply recording the magnetization as a function of
time. This magnetization also contains the signal from
water outside the sample. However, this water has a very
long relaxation time compared to those inside the sample
(4 s compared to 10 ms) and therefore can be removed
easily in the distribution. Moreover, since this water is
also strongly under-polarized due to a short repetition
delay time (1 s), this correction is small. Then the magne-
tization M(t) is analyzed using analytical expression of a
fluid diffusing out of a cylinder:
C� ¼ C�Cf
Ci�Cf¼ M�Mf
Mi�Mf¼ CpsCcyl
Cps ¼P1n¼0
2a 1þ að Þ1þ aþ a2q2n
exp �Dpq2ntl2
� �
Ccyl ¼P1n¼0
4að1þ aÞ4þ 4aþ a2q2n
exp �Dpq2ntr2
� �ð8Þ
where qn are the non-zero positive roots of:
aqnJ 0 qnð Þ � 2J 1ðqnÞ ¼ 0 ð9Þ
Ji is the Bessel function of the first kind of order i, r is the
radius of the cylinder, 2l the length of the cylinder, and
a is the volume ratio of deuterium to water (a = 10 in
our situation). Since concentration is proportional to
magnetization, the concentration C* is directly obtained
from M, Mi (initial value) and Mf (final value), without
calibration. The pore diffusivity Dp is obtained by fitting
the curve C*(t) using Matlab routines.
D2O
H2O saturatedsample at t = 0
Figure 5
Schematic of the deuterium NMR diffusion experiment on
a caprock sample.
M. Fleury et al. / Advanced and Integrated Petrophysical Characterization for CO2 Storage:Application to the Ketzin Site
563
2 RESULTS
2.1 Log Data Analysis
As part of the wireline-logging program of the CO2 Ktzi
201/2007 borehole, NMR data were recorded in addition
to the performed standard logging measurements of the
natural radioactivity (GR-log), acoustic properties, elec-
trical resistivity, bulk density and neutron porosity. The
entire log data suite has been analyzed to derive litholog-
ical and petrophysical information, calibrated on core
data (Norden et al., 2010). In this paper, we focus on
the interpretation of the NMR and resistivity data of
the injection interval (632 to 652 m) and of the caprock
at a short distance above the injection interval (620 to
632 m), where samples of this study were analyzed.
The Stuttgart Formation, which was completely cored
at the CO2 Ktzi 201/2007 borehole, is lithologically
heterogeneous, consisting of sandstone, siltstone, and
mudstone intervals, the latter inter-bedded with variable
amounts of anhydrite and minor coal (Norden et al.,
2010). The sandstones are of fluvial origin and show
remarkable differences in porosity, ranging from 13%
to 26%. In areas, where the sandstone is intensely
cemented by anhydrite and analcime, nearly no porosity
is present. The dominantly fine-grained and well to
moderately-well sorted, immature sandstones classify
as feldspathic litharenites and lithic arkoses (Forster
et al., 2010): Quartz (22-43 wt%), plagioclase
(19-32 wt%) and K-feldspar (5-13 wt%) predominate
mineralogically. Muscovite plus illite and mixed-layer
minerals are omnipresent (4-13 wt%). The depth interval
studied (632-652 m, Fig. 6) hosts the main-reservoir
sandstone and represents the upper part of the total
Stuttgart Formation (630-701 m). The silty to muddy
rocks on top of the sandstone sequence reflect sediments
of the floodplain facies, whereas the sandstone complex
belongs to a fluvial channel system. In certain depth
zones, the sandstone which shows often a pronounced
mud-cake (indicating high porosity and permeability)
Porosity m
M
SCSS
CS
S
CS
S
S
CS
1 2 3
0.8 0.6 0.4 0.2
0.3 0.2 0.1
Swirr
KTZ1
KTZ2
630
632
634
636
638
640
642
644
646
648
101 102 103 10-1 100 T2 (ms)
Dep
th (
m)
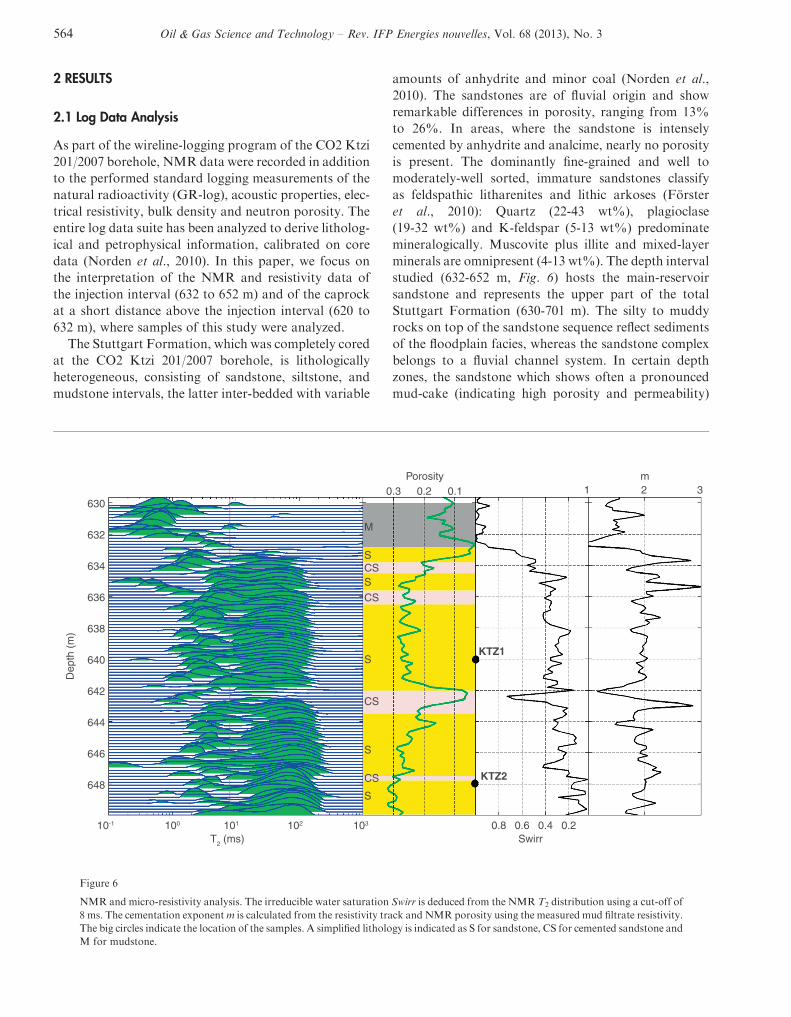
Figure 6
NMR and micro-resistivity analysis. The irreducible water saturation Swirr is deduced from the NMR T2 distribution using a cut-off of
8 ms. The cementation exponentm is calculated from the resistivity track and NMR porosity using the measured mud filtrate resistivity.
The big circles indicate the location of the samples. A simplified lithology is indicated as S for sandstone, CS for cemented sandstone and
M for mudstone.
564 Oil & Gas Science and Technology – Rev. IFP Energies nouvelles, Vol. 68 (2013), No. 3
is strongly cemented, perhaps indicating different
merged channel systems (Forster et al., 2010). The
caprock interval cored and analyzed in this study con-
sists of couplets of mudstone with anhydrite or dolomite
beds of the Triassic Stuttgart and Weser Formations
(Fig. 7), which represent sediments of mud-sulfate playa
facies (Beutler and Nitsch, 2005).
Raw NMR magnetization decay data and resistivity
data were extracted from the recorded logging data
file provided by the logging company. For NMR, we
computed the T2 distribution using an in-house software,
which was also used for analyzing laboratory data.
Unlike the NMR distribution presented by Norden
et al. (2010), no data averaging is performed in order to
have a better vertical resolution. Therefore, the distribu-
tion is shown at the highest possible vertical resolution
(about 0.25 m). For resistivity, we extracted the micro-
resistivity track (MCFL track), for which the depth of
measurement is a few inches, which is similar to the
NMR investigation depth. Hence, due to the high perme-
ability in the injection interval, this resistivity track
is clearly reading in the invaded zone. Taking this as a
prerequisite, the formation brine resistivity is not
needed in the interpretation and one can take the
known mud-filtrate resistivity instead. The cementation
exponent m of the Archie relationship was calculated
using the formulae:
m ¼ � log FFð Þlog UNMRð Þ where FF ¼ Rt
Rw1þ 0:785Rwð Þ ð10Þ
Rt is the resistivity given by the logging tool (MCFL
track) as a function of depth, U is the (total) porosity
obtained byNMR, andRw is the brine resistivity saturat-
ing the formation at the depth of measurement. The for-
mulae for the calculation of the formation factorFF is due
to clay effects and is presented in section electrical prop-
erties. As mentioned above, we take the resistivity value
of the mud filtrate, i.e. we assumed that the near wellbore
region is completely flushed by the mud filtrate. For the
mud filtrate resistivity, we used the measured value (Rw
=0.137Xmat 20.9 �C) and the estimated formation tem-
perature (35 �C), yielding a value Rw = 0.103 Xm (note
that the temperature correction has a significant effect
on the calculation of m). Such interpretation cannot be
applied in the caprock zone because no or very little inva-
sion is occurring. Similarly, this interpretationmay not be
valid in the thin cemented sandstone layer present in the
middle of the reservoir section, as discussed below.
The investigated reservoir section can be subdivided
into two zones (upper and lower corresponding respec-
tively to sample KTZ1 and KTZ2) separated by a
cemented sandstone layer, showing very low porosities
(at 642 m, Fig. 6). The upper zone is slightly less porous
than the lower zone, the latter being characterized by
T2 value slightly larger. There is also a qualitative agree-
ment between laboratory and log T2 relaxation time dis-
tribution in terms of shape and peak positions.
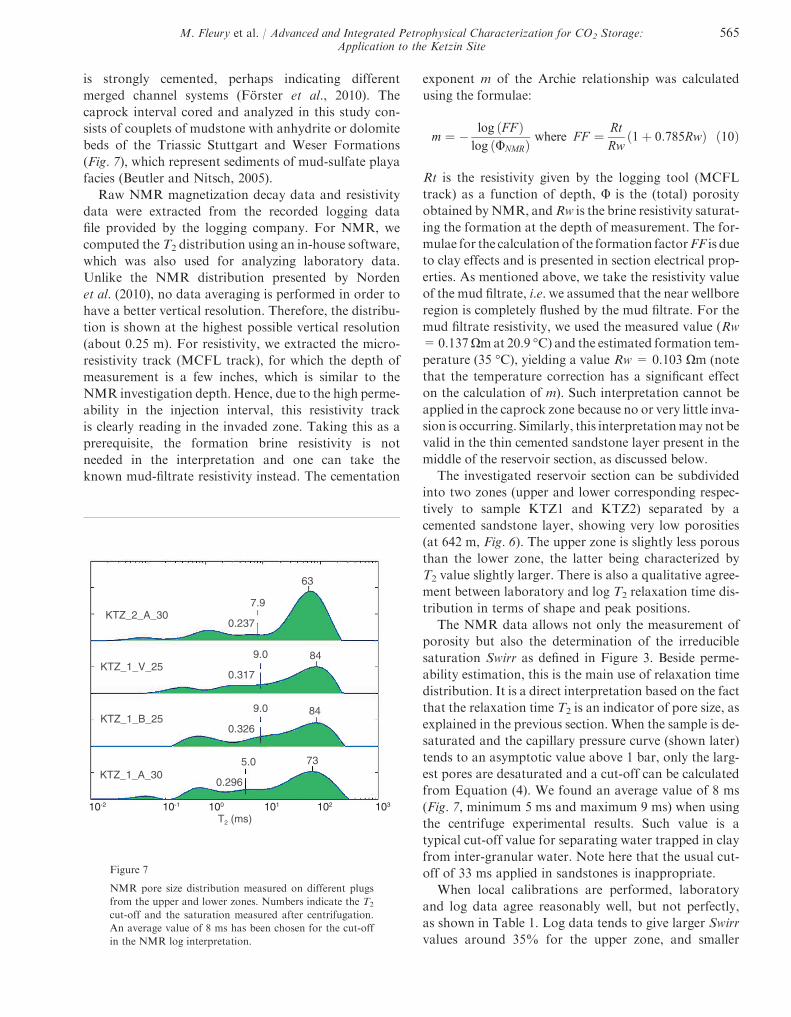
The NMR data allows not only the measurement of
porosity but also the determination of the irreducible
saturation Swirr as defined in Figure 3. Beside perme-
ability estimation, this is the main use of relaxation time
distribution. It is a direct interpretation based on the fact
that the relaxation time T2 is an indicator of pore size, as
explained in the previous section. When the sample is de-
saturated and the capillary pressure curve (shown later)
tends to an asymptotic value above 1 bar, only the larg-
est pores are desaturated and a cut-off can be calculated
from Equation (4). We found an average value of 8 ms
(Fig. 7, minimum 5 ms and maximum 9 ms) when using
the centrifuge experimental results. Such value is a
typical cut-off value for separating water trapped in clay
from inter-granular water. Note here that the usual cut-
off of 33 ms applied in sandstones is inappropriate.
When local calibrations are performed, laboratory
and log data agree reasonably well, but not perfectly,
as shown in Table 1. Log data tends to give larger Swirr
values around 35% for the upper zone, and smaller
63
84
84
73
7.9
0.237
9.0
0.317
9.0
0.326
5.0
0.296
KTZ_2_A_30
KTZ_1_V_25
KTZ_1_B_25
KTZ_1_A_30
T2 (ms)10-2 10-1 101 102 103100
Figure 7
NMR pore size distribution measured on different plugs
from the upper and lower zones. Numbers indicate the T2
cut-off and the saturation measured after centrifugation.
An average value of 8 ms has been chosen for the cut-off
in the NMR log interpretation.
M. Fleury et al. / Advanced and Integrated Petrophysical Characterization for CO2 Storage:Application to the Ketzin Site
565

values below 20% for the lower zone. There is a better
agreement for the cementation values m because
resistivity is much less dependant on small scales
fluctuations.
For the caprock zone, the log data are plotted over an
interval of 10 m above the storage (Fig. 8, note that the
transition reservoir/caprock is at 633 m, see Fig. 6). The
very small pore sizes characterizing the caprock forma-
tion is clearly evidenced by relaxation times around
0.5 ms instead of 80 ms. The NMR log porosity is found
around 15%, a usual value for compacted formation
dominated by clays. Although the small relaxation time
is at the limit of resolution of the logging tool (around
0.2 ms), log porosity does not appear to be underesti-
mated; laboratory NMR measurements show similar
relaxation times, without the presence of shorter compo-
nents (the resolution of laboratory measurements is
about 0.08 ms).
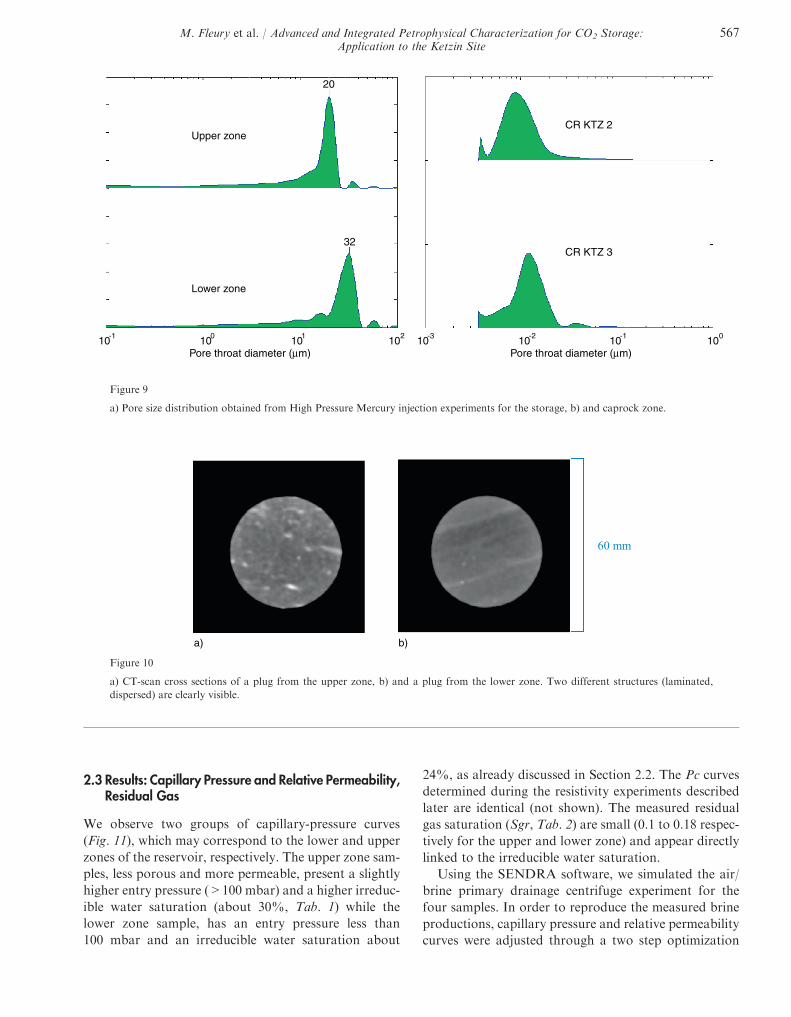
2.2 Results: Pore Structure Characterization
From standard mercury injection experiments, we
obtain the pore size distribution (Fig. 9). For the stor-
age zone, the distribution of pore-entry size is narrow,
with a tail toward small values representing the clays.
The upper zone has the lowest porosity, highest perme-
ability and smaller pore sizes (Fig. 9, Tab. 1), giving an
illustration of the influence of the clays in these sand-
stones. The upper and lower zones also differ by a dif-
ferent organization of the clays in the grains, at least
for the analyzed samples, as revealed by CT-scan
images (Fig. 10). Clays are clearly laminated for the
samples of the lower zone, whereas they are more dis-
persed for the samples of the upper zone. We will see
later that the petrophysical properties measured on
the upper and lower samples have differences that
are linked to these observations.
10-1
100
101
102
103
620
621
622
623
624
625
626
627
628
629
T2 (ms)
0.10.20.30.4
Porosity
Dep
th (
m)
0.38
0.33
0.25
0.25
10-2
10-1
100
101
102
103
T2 (ms)
CR_KTZ_201_3_b
CR_KTZ_201_3_a
CR_KTZ_201_2_b
CR_KTZ_201_2_a
a) b)
Figure 8
a) NMR data for the caprock zone immediately above the storage. Circles indicate NMR porosity measured on small samples.
b) Relaxation time distributions measured on samples in the laboratory.
TABLE 1
Main characteristics of the samples from the storage zone
Sample Depth (m) Porosity (%) Permeability(mD)
m Swirr (%)
Lab. log Lab. log Lab. log
KTZ 1 639.7 26.8-28.0 28 182-280 1.83-1.93 1.95 30-32 35
KTZ 2 648.9 31.4 30 104 1.92 2.01 24 15-20
566 Oil & Gas Science and Technology – Rev. IFP Energies nouvelles, Vol. 68 (2013), No. 3
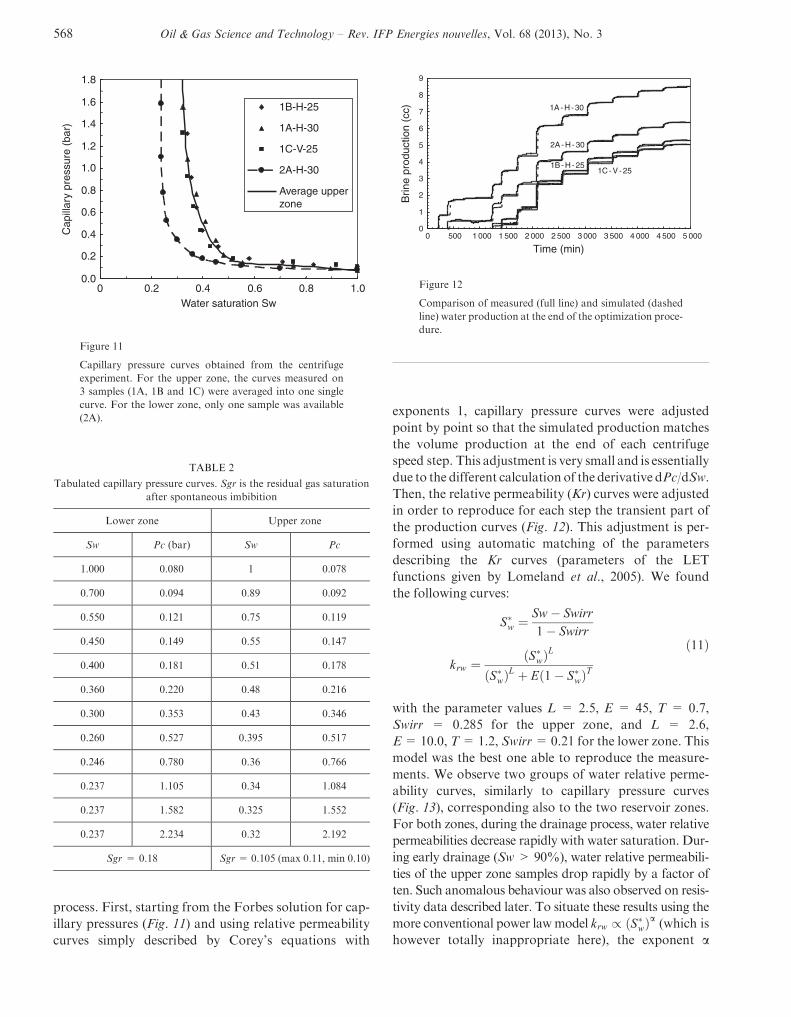
2.3 Results: Capillary Pressure and Relative Permeability,Residual Gas
We observe two groups of capillary-pressure curves
(Fig. 11), which may correspond to the lower and upper
zones of the reservoir, respectively. The upper zone sam-
ples, less porous and more permeable, present a slightly
higher entry pressure (>100 mbar) and a higher irreduc-
ible water saturation (about 30%, Tab. 1) while the
lower zone sample, has an entry pressure less than
100 mbar and an irreducible water saturation about
24%, as already discussed in Section 2.2. The Pc curves
determined during the resistivity experiments described
later are identical (not shown). The measured residual
gas saturation (Sgr, Tab. 2) are small (0.1 to 0.18 respec-
tively for the upper and lower zone) and appear directly
linked to the irreducible water saturation.
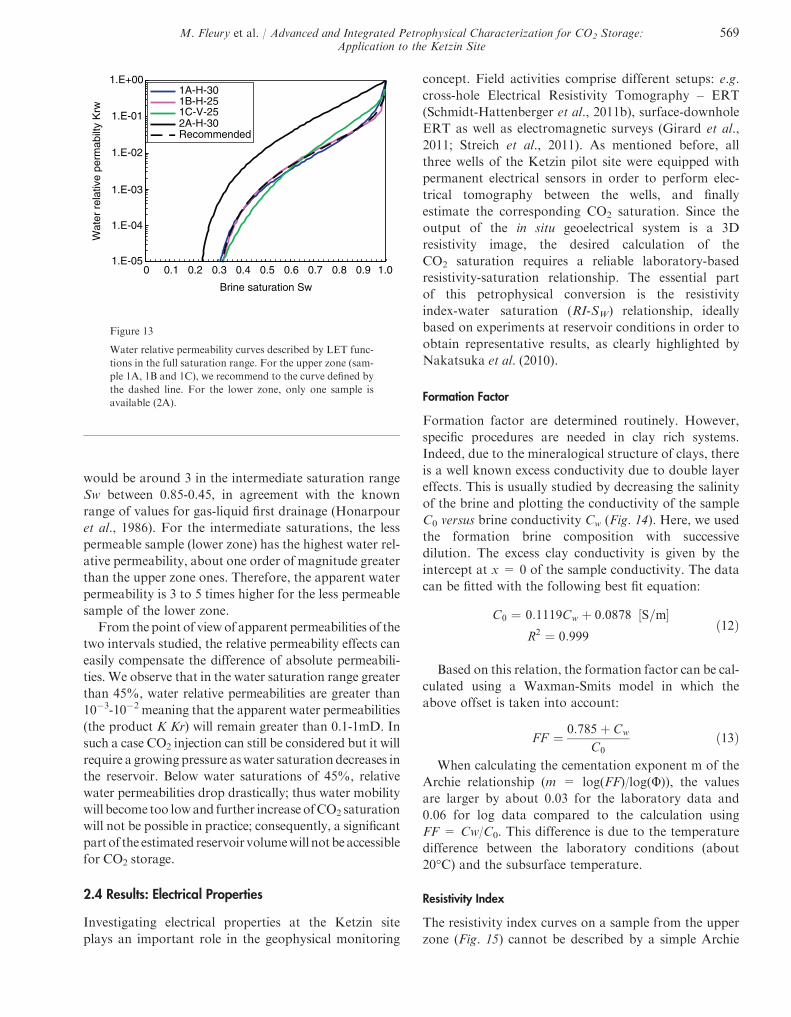
Using the SENDRA software, we simulated the air/
brine primary drainage centrifuge experiment for the
four samples. In order to reproduce the measured brine
productions, capillary pressure and relative permeability
curves were adjusted through a two step optimization
Pore throat diameter (μm) Pore throat diameter (μm)
CR KTZ 3
CR KTZ 2 Upper zone
Lower zone
20
32
10-1 100 101 102 10-3 10-2 10-1 100
Figure 9
a) Pore size distribution obtained from High Pressure Mercury injection experiments for the storage, b) and caprock zone.
60 mm
a) b)
Figure 10
a) CT-scan cross sections of a plug from the upper zone, b) and a plug from the lower zone. Two different structures (laminated,
dispersed) are clearly visible.
M. Fleury et al. / Advanced and Integrated Petrophysical Characterization for CO2 Storage:Application to the Ketzin Site
567
process. First, starting from the Forbes solution for cap-
illary pressures (Fig. 11) and using relative permeability
curves simply described by Corey’s equations with
exponents 1, capillary pressure curves were adjusted
point by point so that the simulated production matches
the volume production at the end of each centrifuge
speed step. This adjustment is very small and is essentially
due to the different calculation of the derivative dPc/dSw.
Then, the relative permeability (Kr) curves were adjusted
in order to reproduce for each step the transient part of
the production curves (Fig. 12). This adjustment is per-
formed using automatic matching of the parameters
describing the Kr curves (parameters of the LET
functions given by Lomeland et al., 2005). We found
the following curves:
S�w ¼ Sw� Swirr
1� Swirr
krw ¼ ðS�wÞLðS�wÞL þ Eð1� S�wÞT
ð11Þ
with the parameter values L = 2.5, E = 45, T = 0.7,
Swirr = 0.285 for the upper zone, and L = 2.6,
E=10.0, T=1.2, Swirr=0.21 for the lower zone. This
model was the best one able to reproduce the measure-
ments. We observe two groups of water relative perme-
ability curves, similarly to capillary pressure curves
(Fig. 13), corresponding also to the two reservoir zones.
For both zones, during the drainage process, water relative
permeabilities decrease rapidly with water saturation. Dur-
ing early drainage (Sw > 90%), water relative permeabili-
ties of the upper zone samples drop rapidly by a factor of
ten. Such anomalous behaviour was also observed on resis-
tivity data described later. To situate these results using the
more conventional power lawmodel krw / ðS�wÞa (which is
however totally inappropriate here), the exponent a
TABLE 2
Tabulated capillary pressure curves. Sgr is the residual gas saturation
after spontaneous imbibition
Lower zone Upper zone
Sw Pc (bar) Sw Pc
1.000 0.080 1 0.078
0.700 0.094 0.89 0.092
0.550 0.121 0.75 0.119
0.450 0.149 0.55 0.147
0.400 0.181 0.51 0.178
0.360 0.220 0.48 0.216
0.300 0.353 0.43 0.346
0.260 0.527 0.395 0.517
0.246 0.780 0.36 0.766
0.237 1.105 0.34 1.084
0.237 1.582 0.325 1.552
0.237 2.234 0.32 2.192
Sgr = 0.18 Sgr = 0.105 (max 0.11, min 0.10)
0.0
0.2
0.4
0.6
0.8
1.0
1.2
1.4
1.6
1.8
0 0.2 0.4 0.6 0.8 1.0Water saturation Sw
Cap
illar
y pr
essu
re (
bar)
1B-H-25
1A-H-30
1C-V-25
2A-H-30
Average upperzone
Figure 11
Capillary pressure curves obtained from the centrifuge
experiment. For the upper zone, the curves measured on
3 samples (1A, 1B and 1C) were averaged into one single
curve. For the lower zone, only one sample was available
(2A).
0
1
2
3
4
5
6
7
8
9
0 500 1 000 1 500 2 000 2 500 3 000 3 500 4 000 4 500 5 000
Time (min)
2A - H - 30
1B - H - 251C - V - 25
1A - H - 30
Brin
e pr
oduc
tion
(cc)
Figure 12
Comparison of measured (full line) and simulated (dashed
line) water production at the end of the optimization proce-
dure.
568 Oil & Gas Science and Technology – Rev. IFP Energies nouvelles, Vol. 68 (2013), No. 3
would be around 3 in the intermediate saturation range
Sw between 0.85-0.45, in agreement with the known
range of values for gas-liquid first drainage (Honarpour
et al., 1986). For the intermediate saturations, the less
permeable sample (lower zone) has the highest water rel-
ative permeability, about one order of magnitude greater
than the upper zone ones. Therefore, the apparent water
permeability is 3 to 5 times higher for the less permeable
sample of the lower zone.
From the point of viewof apparent permeabilities of the
two intervals studied, the relative permeability effects can
easily compensate the difference of absolute permeabili-
ties. We observe that in the water saturation range greater
than 45%, water relative permeabilities are greater than
10�3-10�2 meaning that the apparent water permeabilities
(the product K Kr) will remain greater than 0.1-1mD. In
such a case CO2 injection can still be considered but it will
require a growing pressure aswater saturation decreases in
the reservoir. Below water saturations of 45%, relative
water permeabilities drop drastically; thus water mobility
will become too lowand further increase ofCO2 saturation
will not be possible in practice; consequently, a significant
partof the estimated reservoir volumewill not beaccessible
for CO2 storage.
2.4 Results: Electrical Properties
Investigating electrical properties at the Ketzin site
plays an important role in the geophysical monitoring
concept. Field activities comprise different setups: e.g.
cross-hole Electrical Resistivity Tomography – ERT
(Schmidt-Hattenberger et al., 2011b), surface-downhole
ERT as well as electromagnetic surveys (Girard et al.,
2011; Streich et al., 2011). As mentioned before, all
three wells of the Ketzin pilot site were equipped with
permanent electrical sensors in order to perform elec-
trical tomography between the wells, and finally
estimate the corresponding CO2 saturation. Since the
output of the in situ geoelectrical system is a 3D
resistivity image, the desired calculation of the
CO2 saturation requires a reliable laboratory-based
resistivity-saturation relationship. The essential part
of this petrophysical conversion is the resistivity
index-water saturation (RI-SW) relationship, ideally
based on experiments at reservoir conditions in order to
obtain representative results, as clearly highlighted by
Nakatsuka et al. (2010).
Formation Factor
Formation factor are determined routinely. However,
specific procedures are needed in clay rich systems.
Indeed, due to the mineralogical structure of clays, there
is a well known excess conductivity due to double layer
effects. This is usually studied by decreasing the salinity
of the brine and plotting the conductivity of the sample
C0 versus brine conductivity Cw (Fig. 14). Here, we used
the formation brine composition with successive
dilution. The excess clay conductivity is given by the
intercept at x = 0 of the sample conductivity. The data
can be fitted with the following best fit equation:
C0 ¼ 0:1119Cw þ 0:0878 S=m½ �R2 ¼ 0:999
ð12Þ
Based on this relation, the formation factor can be cal-
culated using a Waxman-Smits model in which the
above offset is taken into account:
FF ¼ 0:785þ Cw
C0ð13Þ
When calculating the cementation exponent m of the
Archie relationship (m = log(FF)/log(U)), the values
are larger by about 0.03 for the laboratory data and
0.06 for log data compared to the calculation using
FF = Cw/C0. This difference is due to the temperature
difference between the laboratory conditions (about
20�C) and the subsurface temperature.
Resistivity Index
The resistivity index curves on a sample from the upper
zone (Fig. 15) cannot be described by a simple Archie
1.E-05
1.E-04
1.E-03
1.E-02
1.E-01
1.E+00
0 0.1 0.2 0.3 0.4 0.5 0.6 0.7 0.8 0.9 1.0
Brine saturation Sw
1A-H-301B-H-251C-V-252A-H-30Recommended
Wat
er r
elat
ive
perm
abilt
y K
rw
Figure 13
Water relative permeability curves described by LET func-
tions in the full saturation range. For the upper zone (sam-
ple 1A, 1B and 1C), we recommend to the curve defined by
the dashed line. For the lower zone, only one sample is
available (2A).
M. Fleury et al. / Advanced and Integrated Petrophysical Characterization for CO2 Storage:Application to the Ketzin Site
569

law. At the beginning of drainage (SW�3.5), there is first a
sharp increase of RI followed by a change of slope and a
more classical behavior (SW�2.0). The model deduced
from the data is the following:
RI ¼ S�3:5w 0:82 < Sw < 1
RI � RI0 ¼ S�2:0w Sw < 0:82 RI0 ¼ 0:56
in drainage and imbibition
ð14Þ
This means that the resistivity changes are larger at
large saturation (Sw � 0.8) compared to a simple Archie
law Sw�2. The origin of the sharp increase at the begin-
ning is not due to an experimental artefact (there is no
dead volume correction and the RI curve is obtained
directly from the data). It is also consistent with Krw
curves. A possible explanation is that a network of large
pores may exist in the sample. This network may have a
large contribution in terms of conductivity and when
invaded by air, this contribution is rapidly lost. There
is no hysteresis effects (no difference between drainage
and imbibition) as expected for this type of porous
media.
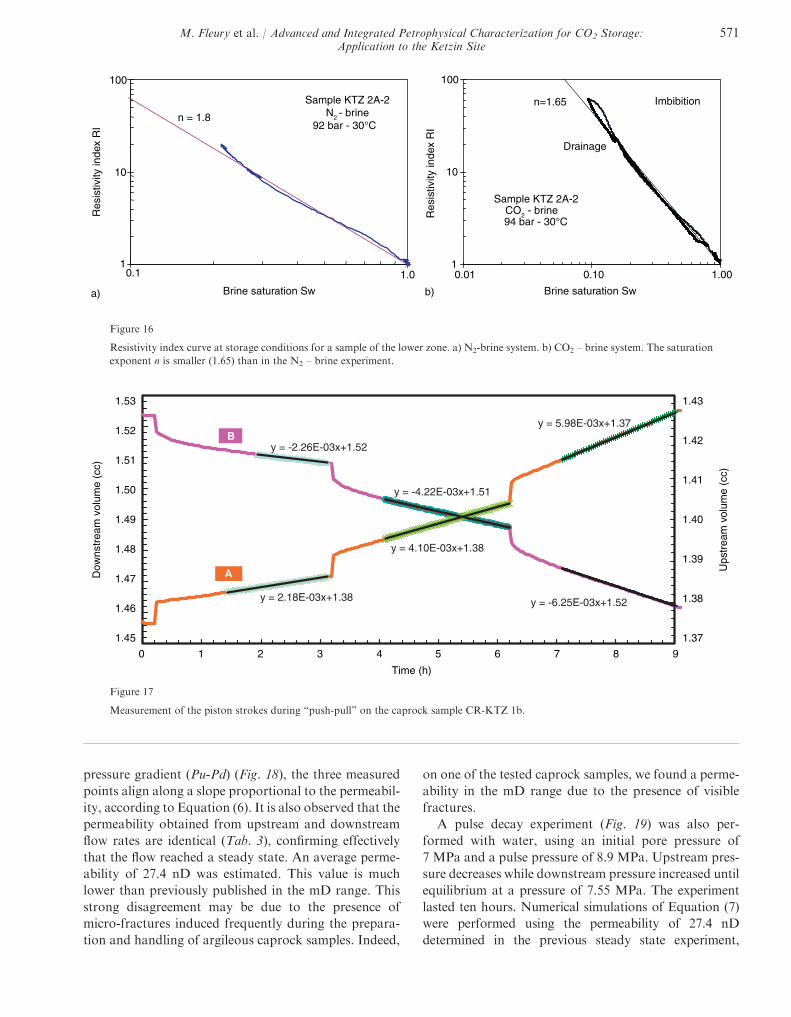
For the sample of the lower zone, a classical Archie
behavior is found with a saturation exponent n = 1.8
for the N2-brine system at storage conditions (Fig. 16).
At ambient conditions (a pore pressure of 8 bar), we
found a similar value of the saturation exponent n
(1.7), within experimental errors. However, for the
CO2-brine system at storage conditions (Fig. 16), the sat-
uration exponent n is significantly lowered (1.65). This
behavior has been observed on sandstones in another
investigation performed at IFP Energies nouvelles
(Fleury et al., 2010, unpublished) and therefore it is
believed not to be specific to the Ketzin samples but
rather to the presence of clays and presumably in con-
junction with a lower pH value caused by CO2 dissolu-
tion. Another difference between the two systems is the
much lower interfacial tension for the CO2 case (about
28 instead of 73 mN/m). Hence, the water distribution
in the pore network may not be necessarily the same,
yielding a slightly different n value. Note also that the
final saturation is lower (Sw = 0.1 instead of 0.23) due
to the lower interfacial tension (a similar pressure was
applied on the CO2 experiment). A low n value (1.62)
has also been found by Kummerow and Spangenberg
(2011) using a very different set-up at storage conditions.
2.5 Results: Specific Measurements on Caprocks
In this section, we present the experimental results on
samples from the caprock formation. Permeability and
entry pressure were measured, as well as water diffusivity
to provide basic data for modeling CO2 migration, if
any, at the base of the caprock.
Permeability
The displaced volume of water in the “push-pull” mode
is shown in Figure 17 for both pumps A and B. At steady
state, these two volumes should be equal but this is
reached only after a certain time delay, of the order of
2 hours. Hence, when the evolution is linear, the slopes
corresponding to the upstream and downstream water
flow can be used to calculate permeability. This proce-
dure was repeated for three successive flow rates. When
the successive flow rates (Q) are plotted against the
1
10
100
0.1 1.0Brine saturation Sw
Res
istiv
ity in
dex
RI
Imbibition
Drainage
Model
Sample KTZ1B
Figure 15
N2-brine resistivity index measured at ambient conditions
for sample KTZ1 (upper zone).
0.0
0.5
1.0
1.5
2.0
2.5
3.0
0 5 10 15 20 25
Brine conductivity (S/m)
KTZ 2A-30
Sam
ple
cond
uctiv
ity (
S/m
)
Figure 14
Sample conductivity versus brine conductivity using the
formation brine composition.
570 Oil & Gas Science and Technology – Rev. IFP Energies nouvelles, Vol. 68 (2013), No. 3
pressure gradient (Pu-Pd) (Fig. 18), the three measured
points align along a slope proportional to the permeabil-
ity, according to Equation (6). It is also observed that the
permeability obtained from upstream and downstream
flow rates are identical (Tab. 3), confirming effectively
that the flow reached a steady state. An average perme-
ability of 27.4 nD was estimated. This value is much
lower than previously published in the mD range. This
strong disagreement may be due to the presence of
micro-fractures induced frequently during the prepara-
tion and handling of argileous caprock samples. Indeed,
on one of the tested caprock samples, we found a perme-
ability in the mD range due to the presence of visible
fractures.
A pulse decay experiment (Fig. 19) was also per-
formed with water, using an initial pore pressure of
7 MPa and a pulse pressure of 8.9 MPa. Upstream pres-
sure decreases while downstream pressure increased until
equilibrium at a pressure of 7.55 MPa. The experiment
lasted ten hours. Numerical simulations of Equation (7)
were performed using the permeability of 27.4 nD
determined in the previous steady state experiment,
1
10
100
0.1 1.0
Brine saturation Sw
Res
istiv
ity in
dex
RI
Sample KTZ 2A-2N2 - brine
92 bar - 30°C n = 1.8
a)
Drainage
1
10
100
0.01 0.10 1.00
Brine saturation Sw
Res
istiv
ity in
dex
RI
Imbibitionn=1.65
Sample KTZ 2A-2CO2 - brine94 bar - 30°C
b)
Figure 16
Resistivity index curve at storage conditions for a sample of the lower zone. a) N2-brine system. b) CO2 – brine system. The saturation
exponent n is smaller (1.65) than in the N2 – brine experiment.
A
1.45
1.46
1.47
1.48
1.49
1.50
1.51
1.52
1.53
0 1 2 3 4 5 6 7 8 9
Time (h)
Dow
nstr
eam
vol
ume
(cc)
1.37
1.38
1.39
1.40
1.41
1.42
1.43
Ups
trea
m v
olum
e (c
c)
y = -2.26E-03x+1.52
y = -4.22E-03x+1.51
y = -6.25E-03x+1.52y = 2.18E-03x+1.38
y = 4.10E-03x+1.38
y = 5.98E-03x+1.37B
Figure 17
Measurement of the piston strokes during “push-pull” on the caprock sample CR-KTZ 1b.
M. Fleury et al. / Advanced and Integrated Petrophysical Characterization for CO2 Storage:Application to the Ketzin Site
571
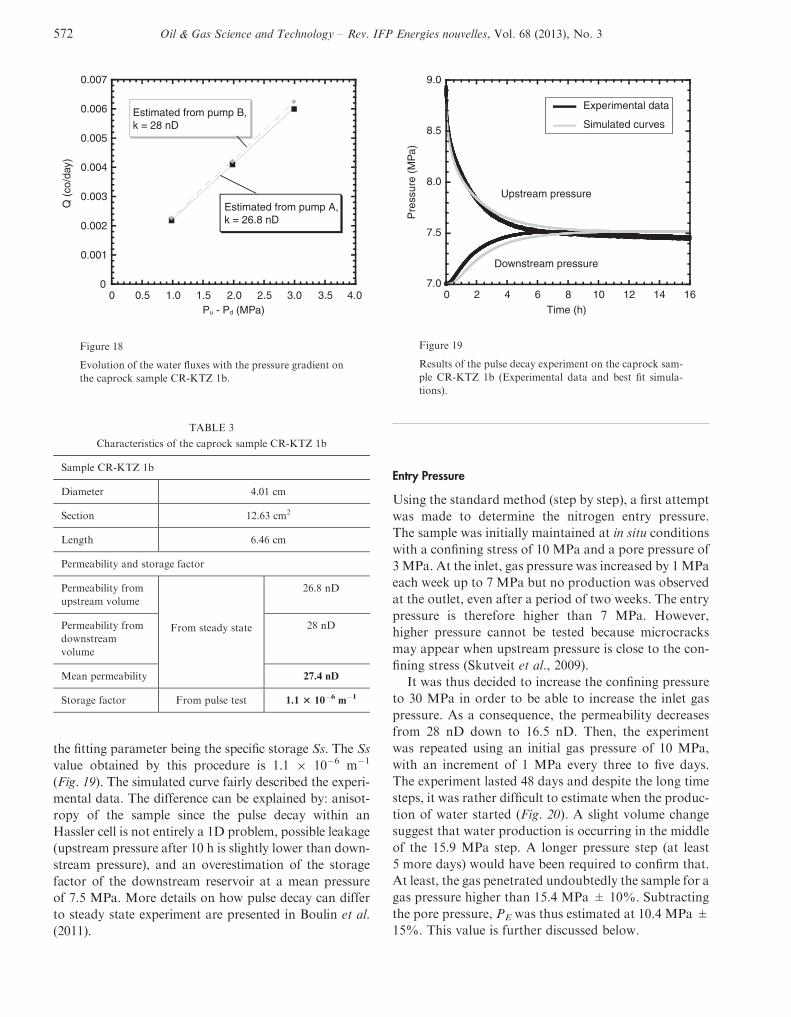
the fitting parameter being the specific storage Ss. The Ss
value obtained by this procedure is 1.1 9 10�6 m�1
(Fig. 19). The simulated curve fairly described the experi-
mental data. The difference can be explained by: anisot-
ropy of the sample since the pulse decay within an
Hassler cell is not entirely a 1D problem, possible leakage
(upstream pressure after 10 h is slightly lower than down-
stream pressure), and an overestimation of the storage
factor of the downstream reservoir at a mean pressure
of 7.5 MPa. More details on how pulse decay can differ
to steady state experiment are presented in Boulin et al.
(2011).
Entry Pressure
Using the standard method (step by step), a first attempt
was made to determine the nitrogen entry pressure.
The sample was initially maintained at in situ conditions
with a confining stress of 10 MPa and a pore pressure of
3MPa. At the inlet, gas pressure was increased by 1MPa
each week up to 7 MPa but no production was observed
at the outlet, even after a period of two weeks. The entry
pressure is therefore higher than 7 MPa. However,
higher pressure cannot be tested because microcracks
may appear when upstream pressure is close to the con-
fining stress (Skutveit et al., 2009).
It was thus decided to increase the confining pressure
to 30 MPa in order to be able to increase the inlet gas
pressure. As a consequence, the permeability decreases
from 28 nD down to 16.5 nD. Then, the experiment
was repeated using an initial gas pressure of 10 MPa,
with an increment of 1 MPa every three to five days.
The experiment lasted 48 days and despite the long time
steps, it was rather difficult to estimate when the produc-
tion of water started (Fig. 20). A slight volume change
suggest that water production is occurring in the middle
of the 15.9 MPa step. A longer pressure step (at least
5 more days) would have been required to confirm that.
At least, the gas penetrated undoubtedly the sample for a
gas pressure higher than 15.4 MPa ± 10%. Subtracting
the pore pressure, PE was thus estimated at 10.4 MPa ±
15%. This value is further discussed below.
0
0.001
0.002
0.003
0.004
0.005
0.006
0.007
0 0.5 1.0 1.5 2.0 2.5 3.0 3.5 4.0Pu - Pd (MPa)
Q (
co/d
ay)
Estimated from pump B,k = 28 nD
Estimated from pump A,k = 26.8 nD
Figure 18
Evolution of the water fluxes with the pressure gradient on
the caprock sample CR-KTZ 1b.
TABLE 3
Characteristics of the caprock sample CR-KTZ 1b
Sample CR-KTZ 1b
Diameter 4.01 cm
Section 12.63 cm2
Length 6.46 cm
Permeability and storage factor
Permeability from
upstream volume
From steady state
26.8 nD
Permeability from
downstream
volume
28 nD
Mean permeability 27.4 nD
Storage factor From pulse test 1.1 3 10�6 m�1
7.0
7.5
8.0
8.5
9.0
0 2 4 6 8 10 12 14 16
Experimental data
Simulated curves
Time (h)
Upstream pressure
Downstream pressure
Pre
ssur
e (M
Pa)
Figure 19
Results of the pulse decay experiment on the caprock sam-
ple CR-KTZ 1b (Experimental data and best fit simula-
tions).
572 Oil & Gas Science and Technology – Rev. IFP Energies nouvelles, Vol. 68 (2013), No. 3

For comparison, the dynamic method was
performed afterwards. The sample was resaturated with
water. Gas pressure at the inlet was set at 18.6 MPa
(DP = Pg – Pw = 16.0 MPa). Two different flow rates
were observed, before and after gas in contact with the
sample, and were respectively 1 cc/day and 0.15 cc/day.
The entry pressure value is therefore 13 MPa ± 12%.
More details on how the entry pressure were done on
the sample CR-KTZ are available in Boulin et al.
(2011). Here, the total duration is 3 days but this much
more rapid measurement is only possible when the initial
gas pressure is properly chosen.
The value obtained by the two techniques here is close
to 12 MPa and is representative of a sample at an effec-
tive stress of 25 MPa which is higher than the in situ
stress estimated at 10 MPa. To correct for the stress
effect, a relationship between permeability and entry
pressure can be used:
Pe � k�0:5 ð15ÞIn the above relationship, as in a capillary tube, the
entry pressure Pe is assumed to be related to a mean pore
diameter d, and the permeability k is assumed to be
proportional to d2. This is similar to the empirical
relationship proposed by Thomas et al. (1968). If the
confinement reduces the pore mean diameter d and does
not affect the internal structure or connectivity of the
porous structure, relation (15) is valid. Since permeabil-
ity is reduced from 28 nD (at in situ stress) to 16.5 nD,
the entry pressure should have been increased likewise.
The entry pressure measured at an effective pressure of
25 MPa (Pe = 12 MPa) is indeed higher than the
in situ Pe value. Using relation (15), the in situ Pe is
9 MPa.
Finally, a conversion to the CO2/brine system must be
performed. For CO2, the Pe value will be lower due to a
lower interfacial tension compared to the nitrogen/brine
one. The in situ pore pressure is higher than 5 MPa and
therefore CO2 pressure will be higher than 5MPa. In this
range of pressure, interfacial tension for CO2/brine can
be assumed constant (close to 28 mN/m, Chalbaud
et al., 2010). Assuming an interfacial tension of
73 mN/m for the nitrogen/brine system, the estimated
Pe value for CO2 is thus 3.5 MPa.
Diffusion
The relaxation data plotted for three different time
(Fig. 21) shows the decrease of the main peak
(T2 = 0.25 ms) containing most of the porous volume.
Some minor peaks below 1 000 ms representing larger
pores in small quantities are also present. Water diffus-
ing outside the sample is characterized by longer relaxa-
tion times (above 1 000 ms) and its contribution is not
taken into account in the magnetization decay curve.
From the magnetization decay curve, the fitted pore
diffusivity Dp is 0.8 9 10�9 m2/s at 30�C (Fig. 22, the
porosity of the sample is 21%). The bulk water
diffusivity D0 at the same temperature is 2.6 9 10�9 m2/s.
This result is coherent with an Archie relation of the
form:
Dp
D0¼ um�1 ð15Þ
where m = 1.77 is the cementation exponent usually
derived from electrical measurements. Such coherence
10-2 10-1 10-0 101 102 103 1040
10
20
30
40
50
60
T2 (ms)
A(T
2) (
a.u) t = 0.8 h
t = 8.1 h
t = 0.1 h
Bulk H2 O/D2O
Figure 21
T2 distribution at different times in the D2O diffusion
experiment. Caprock sample CR KTZ 2A, porosity 21%.
14.0
14.5
15.0
15.5
16.0
16.5
17.0
6/7 9/7 12/7 15/7 18/7 21/7 24/7 27/7 30/7
Date
9.92
9.94
9.96
9.98
10.00
10.02
10.04
Vol
ume
disp
lace
men
t (cc
)
Upstream pressureWater volume
Ups
trea
m p
ress
ure
(MP
a)
Figure 20
Water production during the step by step approach on the
caprock sample CR-KTZ 1b.
M. Fleury et al. / Advanced and Integrated Petrophysical Characterization for CO2 Storage:Application to the Ketzin Site
573
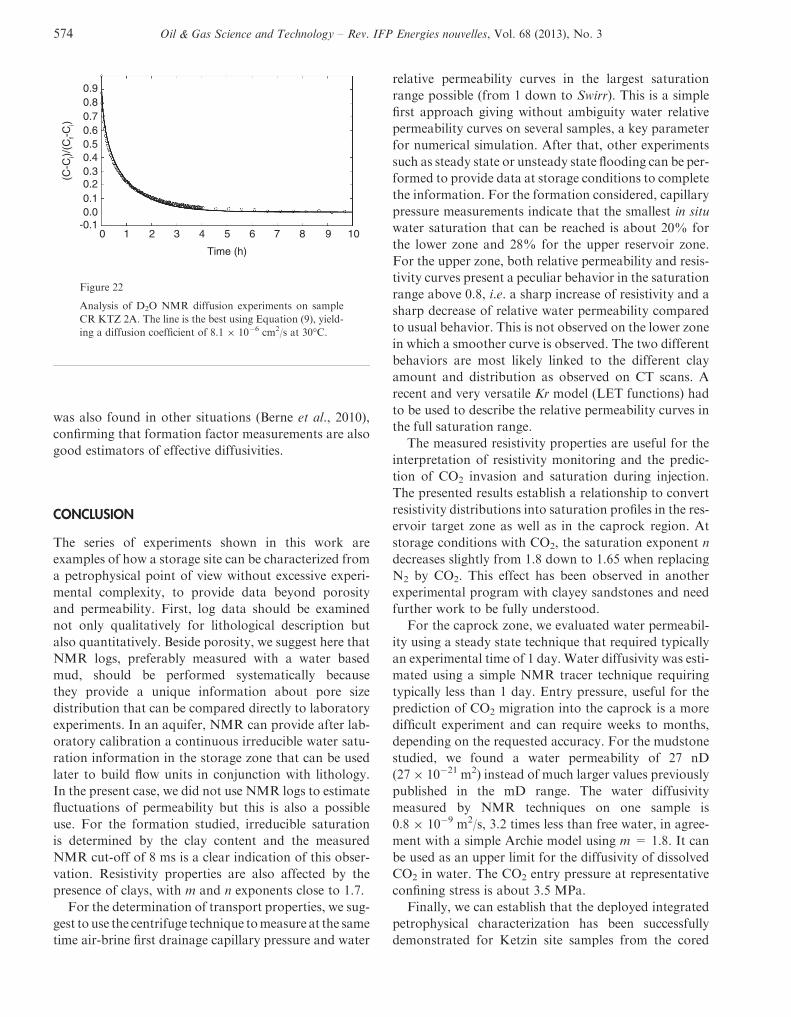
was also found in other situations (Berne et al., 2010),
confirming that formation factor measurements are also
good estimators of effective diffusivities.
CONCLUSION
The series of experiments shown in this work are
examples of how a storage site can be characterized from
a petrophysical point of view without excessive experi-
mental complexity, to provide data beyond porosity
and permeability. First, log data should be examined
not only qualitatively for lithological description but
also quantitatively. Beside porosity, we suggest here that
NMR logs, preferably measured with a water based
mud, should be performed systematically because
they provide a unique information about pore size
distribution that can be compared directly to laboratory
experiments. In an aquifer, NMR can provide after lab-
oratory calibration a continuous irreducible water satu-
ration information in the storage zone that can be used
later to build flow units in conjunction with lithology.
In the present case, we did not use NMR logs to estimate
fluctuations of permeability but this is also a possible
use. For the formation studied, irreducible saturation
is determined by the clay content and the measured
NMR cut-off of 8 ms is a clear indication of this obser-
vation. Resistivity properties are also affected by the
presence of clays, with m and n exponents close to 1.7.
For the determination of transport properties, we sug-
gest to use the centrifuge technique tomeasure at the same
time air-brine first drainage capillary pressure and water
relative permeability curves in the largest saturation
range possible (from 1 down to Swirr). This is a simple
first approach giving without ambiguity water relative
permeability curves on several samples, a key parameter
for numerical simulation. After that, other experiments
such as steady state or unsteady state flooding can be per-
formed to provide data at storage conditions to complete
the information. For the formation considered, capillary
pressure measurements indicate that the smallest in situ
water saturation that can be reached is about 20% for
the lower zone and 28% for the upper reservoir zone.
For the upper zone, both relative permeability and resis-
tivity curves present a peculiar behavior in the saturation
range above 0.8, i.e. a sharp increase of resistivity and a
sharp decrease of relative water permeability compared
to usual behavior. This is not observed on the lower zone
in which a smoother curve is observed. The two different
behaviors are most likely linked to the different clay
amount and distribution as observed on CT scans. A
recent and very versatile Kr model (LET functions) had
to be used to describe the relative permeability curves in
the full saturation range.
The measured resistivity properties are useful for the
interpretation of resistivity monitoring and the predic-
tion of CO2 invasion and saturation during injection.
The presented results establish a relationship to convert
resistivity distributions into saturation profiles in the res-
ervoir target zone as well as in the caprock region. At
storage conditions with CO2, the saturation exponent n
decreases slightly from 1.8 down to 1.65 when replacing
N2 by CO2. This effect has been observed in another
experimental program with clayey sandstones and need
further work to be fully understood.
For the caprock zone, we evaluated water permeabil-
ity using a steady state technique that required typically
an experimental time of 1 day. Water diffusivity was esti-
mated using a simple NMR tracer technique requiring
typically less than 1 day. Entry pressure, useful for the
prediction of CO2 migration into the caprock is a more
difficult experiment and can require weeks to months,
depending on the requested accuracy. For the mudstone
studied, we found a water permeability of 27 nD
(279 10�21 m2) instead of much larger values previously
published in the mD range. The water diffusivity
measured by NMR techniques on one sample is
0.8 9 10�9 m2/s, 3.2 times less than free water, in agree-
ment with a simple Archie model using m = 1.8. It can
be used as an upper limit for the diffusivity of dissolved
CO2 in water. The CO2 entry pressure at representative
confining stress is about 3.5 MPa.
Finally, we can establish that the deployed integrated
petrophysical characterization has been successfully
demonstrated for Ketzin site samples from the cored
0 1 2 3 4 5 6 7 8 9 10
Time (h)
-0.10.00.10.20.30.40.50.60.70.80.9
(C-C
i)/(C
f-Ci)
Figure 22
Analysis of D2O NMR diffusion experiments on sample
CR KTZ 2A. The line is the best using Equation (9), yield-
ing a diffusion coefficient of 8.1 9 10�6 cm2/s at 30�C.
574 Oil & Gas Science and Technology – Rev. IFP Energies nouvelles, Vol. 68 (2013), No. 3
reservoir and caprock section. The suggested best-prac-
tice workflow presents an instrument to improve the
coherency of the experimental data and it contributes
to the necessary conversion of measured resistivity field
data into CO2 saturation distribution as well.
In general, the integrated petrophysical characteriza-
tion supports the link between geophysical monitoring
and fluid-flow modeling, and represents itself as
indispensible tool in the phase of data integration of a
CO2 storage site.
ACKNOWLEDGMENTS
The authors thank theFrenchNationalResearchAgency
(ANR) for supporting this research in the framework of
the COSMOS-2 project, which was connected with the
German COSMOS project (CO2 Storage, Monitoring
and Safety Technologies) via the Eurogia programme.
P. Poulain, F. Norrant and Y. Larabi from IFPEN con-
tributed also to the data acquisition in the experimental
program. E. Brosse from IFPEN contributed also to the
improvement of the final manuscript.
REFERENCES
Bauget F., Gautier S., Lenormand R., Samouillet A. (2012)Gas-liquid relative permeability from one-step and multi-stepcentrifuge experiments, International Symposium of the Societyof Core Analysts, 27-30 Aug., Aberdeen, United Kingdom,available at http://www.scaweb.org/.
Bennion B., Bachu S. (2008) Drainage and imbibition relativepermeability relationships for supercritical CO2/brine andH2S/brine systems in intergranular sandstone, carbonate,shale, and anhydrite rocks, SPE Reserv. Eval. Eng. 11, 3,487-496.
Bergmann P., Lengler U., Schmidt-Hattenberger C., Giese R.,Norden B. (2010) Modelling the geoelectric and seismic reser-voir response caused by carbon dioxide injection based on mul-tiphase flow simulation: Results from the CO2SINK project,Chem. Erde 70, 3, 173-183.
Berne Ph, Bachaud P., Fleury M. (2010) Diffusion propertiesof carbonated caprocks from the Paris Basin, Oil Gas Sci.Technol. 65, 3, 473-484.
BeutlerG.,NitschE. (2005) Palaographischer Uberblick, inStra-tigraphie von Deutschland IV, Keuper, Beutler G. et al. (eds) 253,15-30, Courier Forschungsinstitut Senckenberg, Stuttgart.
Boulin P.F., Bretonnier P., Gland N., Lombard J.M. (2012)Contribution of steady state methods to water permeabilitymeasurement in very low permeability porous media, Oil GasSci. Technol. 67, 3, 387-401.
Boulin P.F., Bretonnier P., Vassil V., Samouillet A., FleuryM.,Lombard J.M. (2011) Entry pressure measurements using threeunconventional experimental methods, International Sympo-sium of the Society of Core Analysts, 18-21 Sept., Austin,USA, SCA2011-02.
Brace W.F., Walsh J.B., Frangos W.T. (1968) Permeabilityof Granite under High Pressure, J. Geophys. Res. 73, 6, 2225-2236.
Chalbaud C., RobinM., Lombard J.M., BertinH., Egermann P.(2010) Brine/CO2 Interfacial Properties and Effects on CO2
Storage in Deep Saline Aquifers, Oil Gas Sci. Technol. 65, 4,541-555.
Christensen N.B., Sherlock D., Dodds K. (2006) MonitoringCO2 injection with cross-hole electrical resistivity tomography,Explor. Geophys. 37, 44-49.
Dullien F.A.L. (1992) Porous Media Fluid Transport and PoreStructure, 2nd ed., Academic Press, San Diego, pp. 333-486.
Egermann P., Lombard J.-M., Bretonnier P. (2006) A fast andaccurate method to measure threshold capillary pressure ofcaprocks under representative conditions, International Sym-posium of the Society of Core Analysts, 12-16 Sept., Trondheim,Norway, available at http://www.scaweb.org/, SCA2006-07.
FleuryM. (1998) FRIM: a Fast Resistivity IndexMeasurementMethod, International Symposium of the Society of CoreAnalysts, 14-16 Sept., The Hague, The Netherlands, availableat http://www.scaweb.org/.
Fleury M., Poulain P., Ringot G. (1998) A capacitance tech-nique for measuring production while centrifuging, Interna-tional Symposium of the Society of Core Analysts, 14-16 Sept.,The Hague, The Netherlands, available at http://www.sca-web.org/, SCA-9833.
Fleury M., Liu F. (2000) Frequency effect on resistivity indexcurves using a new method, 41st Annual SPWLA Symposium,4-7 June, Dallas, USA.
Fleury M. (2003) Advances in Resistivity Measurements usingthe FRIM Method at Reservoir Conditions. Applications toCarbonates, International Symposium of the Society of CoreAnalysts, 21-24 Sept., Pau, France, available at http://www.scaweb.org/, SCA2003-31.
Fleury M. (2007) NMR surface relaxivity determination usingNMR apparent diffusion curves and BET measurements,International Symposium of the Society of Core Analysts, 10-12 Sept., Calgary, Canada, available at http://www.scaweb.org/, SCA2007-35.
Fleury M., Berne P., Bachaud P. (2009) Diffusion of dissolvedCO2 in caprock, Energy Procedia 1, 3461-3468.
Forbes P.L (1991) Simple and Accurate Methods for Convert-ing Centrifuge Data into Drainage and Imbibition CapillaryPressure Curves, International Symposium of the Society ofCore Analysts, London, England, available at http://www.sca-web.org/, SCA Conference Paper Number 9107.
Forster A., Norden B., Zinck-Jørgensen K., Frykman P.,Kulenkampff J., Spangenberg E., Erzinger J., Zimmer M.,Kopp J., Borm G., Juhlin C., Cosma C., Hurter S. (2006) Base-line characterization of the CO2SINK geological storage site atKetzin, Germany, Environ. Geosci. 133, 145-161.
ForsterA., SchonerR., ForsterH.-J.,NordenB., BlaschkeA.-W.,Luckert J., BeutlerG.,GauppR.,RhedeD. (2010)Reservoir char-acterizationof aCO2 storage aquifer:TheUpperTriassic StuttgartFormation in the Northeast German Basin,Mar. Petrol. Geol. 27,2156-2172.
Giese R., Henninges J., Luth S., Morozova D., Schmidt-Hattenberger C., Wurdemann H., Zimmer M., Cosma C.,Juhlin C., CO2SINK Group (2009) Monitoring at theCO2SINK Site: A Concept Integrating Geophysics Geochem-istry and Microbiology, Energy Procedia 1, 1, 2251-2259.
M. Fleury et al. / Advanced and Integrated Petrophysical Characterization for CO2 Storage:Application to the Ketzin Site
575

Girard J.-F., Coppo N., Rohmer J., Bourgeois B., Naudet V.,Schmidt-Hattenberger C. (2011) Time-lapse CSEMmonitoring of the Ketzin (Germany) CO2 injection using29MAM configuration, Energy Procedia 4, 3322-3329.
Han M., Fleury M., Levitz P. (2007) Effect of the pore struc-ture on resistivity index curves, International Symposium ofthe Society of Core Analysts, 10-13 Sept., Calgary, Canada,available at http://www.scaweb.org/, SCA2007-34.
Honarpour M., Koederitz L., Harvey A.H. (1986)Relative per-meability of Petroleum Reservoir, CRC Press, Boca Raton,Florida.
Kummerow J., Spangenberg E. (2011) Experimental evalua-tion of the impact of the interactions of CO2-SO2, brine, andreservoir rock on petrophysical properties: A case study fromthe Ketzin test site, Germany, Geochem. Geophys. Geosyst.12, Q05010.
KiesslingD., Schmidt-HattenbergerC., SchuettH., SchillingF.,Krueger K., Schoebel B., Danckwardt E., Kummerow J.,CO2SINKGroup (2010) Geoelectrical methods for monitoringgeological CO2 storage: First results from cross-hole and sur-face-downhole measurements from the CO2SINK test site atKetzin (Germany), Int. J. Greenhouse Gas Control 4, 5, 816-826.
Lenormand R. (2003) Interpretation of mercury injectioncurves to derive pore size distribution, International Symposiumof the Society of Core Analysts, 21-24 Sept., Pau, France, avail-able at http://www.scaweb.org/, SCA2003-52.
Li S., DongM., Li Z., Huang S., Qing H., Nickel E. (2005) Gasbreakthrough pressure for hydrocarbon reservoir seal rocks:implications for the security of a long-term CO2 storage inthe Weyburn field, Geofluids 5, 326-334.
Lomeland F., Ebeltoft E., Hammervold Thomas W. (2005) ANew Versatile Relative Permeability Correlation, InternationalSymposium of the Society of Core Analysts, 21-25 August,Toronto, Canada, available at http://www.scaweb.org/,SCA2005-32.
Martens S., Liebscher A., Moller F., Wurdemann H., SchillingF., Kuhn M., Ketzin Group (2011) Progress report on the firstEuropean on-shore CO2 storage site at Ketzin (Germany) –Second year of injection, Energy Procedia 4, 3246-3253.
Nakatsuka Y., Xue Z., Garcia H., Matsuoka T. (2010) Exper-imental study on CO2 monitoring and quantification of storedCO2 in saline formations using resistivity measurements, Int. J.Greenhouse Gas Control 4, 209-216.
Norden B., Forster A., Vu-Hoang D.,Marcelis F., Springer N.,Le Nir I. (2010) Lithological and petrophysical core-log inter-pretation in the CO2SINK, the European CO2 onshoreresearch storage and verification project, SPE J. 13, 2,179-192.
PrevedelB.,WohlgemuthL.,Henninges J.,KrugerK.,NordenB.,Forster A., CO2SINK Drilling Group (2008) The CO2SINKboreholes for geological storage testing,ScientificDrilling 6, 32-37.
Prevedel B.,Wohlgemuth L., Legarth B., Henninges J., Schutt H.,Schmidt-Hattenberger C., Norden B., Forster A., Hurter S.(2009) The CO2SINK boreholes for geological CO2-storagetesting, Energy Procedia 1, 1, 2087-2094.
Ramirez A.L., Newmark R.L., Daily W.D. (2003) MonitoringCarbon Dioxide Floods Using Electrical Resistance Tomogra-phy (ERT): Sensitivity Studies, J. Environ. Eng. Geophys. 8, 3,187-208.
Schilling F., Borm G., Wurdemann H., Moller F., Kuhn M.,CO2SINK Group (2009) Status Report on the First Europeanon-shore CO2 Storage Site at Ketzin (Germany), Energy Proce-dia 1, 1, 2029-2035.
Schmidt-Hattenberger C., Bergmann P., Kießling D., Kruger K.,Rucker C., Schutt H., Ketzin Group (2011a) Application of aVertical Electrical Resistivity Array (VERA) for monitoring CO2
migration at theKetzin site: First performance evaluation,EnergyProcedia 4, 3363-3370.
Schmidt-Hattenberger C., Bergmann P., Labitzke T., Schroder S.,Kruger K., Rucker C., Schutt H. (2011b) Amodular geoelectricalmonitoring system as part of the surveillance concept in CO2 stor-age projects, Energy Procedia 23, 400-407.
Skurtveit E., Aker E., Angeli N., Soldal M. (2009) Coupledflow geomechanical testing of low permeable material – Appli-cation for CO2 storage, 2nd International Conference on Faultand Top Seals, 21-24, Sept., Montpellier, France.
Streich R., Becken M., Matzander U., Ritter O. (2011) Strate-gies for land-based controlled-source electromagnetic survey-ing in high-noise regions, Leading Edge 30, 1174-1181.
Thomas L.K., Katz D.L., Tek M.R. (1968) Threshold pressurephenomena in porous media, SPE J. 243, 174-184.
Zemke K., Liebscher A., Wandrey M., CO2SINK Group(2010) Petrophysical analysis to investigate the effects ofcarbon dioxide storage in a subsurface saline aquifer at Ketzin,Germany (CO2SINK), Int. J. Greenhouse Gas Control 4, 6,990-999.
Wuerdemann H., Moeller F., Kuehn M., Heidug W.,Christensen N.P., Borm G., Schilling F.R., CO2Sink Group(2010) CO2SINK-From site characterisation and risk assess-ment to monitoring and verification: One year of operationalexperience with the field laboratory for CO2 storage at Ketzin,Germany, Int. J. Greenhouse Gas Control 4, 6, 938-951.
Final manuscript received in November 2012
Published online in June 2013
Copyright � 2013 IFP Energies nouvelles
Permission to make digital or hard copies of part or all of this work for personal or classroom use is granted without fee provided that copies are notmade or distributed for profit or commercial advantage and that copies bear this notice and the full citation on the first page. Copyrights forcomponents of this work owned by others than IFP Energies nouvelles must be honored. Abstracting with credit is permitted. To copy otherwise,to republish, to post on servers, or to redistribute to lists, requires prior specific permission and/or a fee: Request permission from InformationMission, IFP Energies nouvelles, fax. +33 1 47 52 70 96, or [email protected].
576 Oil & Gas Science and Technology – Rev. IFP Energies nouvelles, Vol. 68 (2013), No. 3


