characterization of co2 laser browning of dough
TRANSCRIPT

Contents lists available at ScienceDirect
Innovative Food Science and Emerging Technologies
journal homepage: www.elsevier.com/locate/ifset
Characterization of CO2 laser browning of doughJonathan David Blutingera,⁎, Yorán Meijersa,b, Peter Yichen Chena, Changxi Zhenga,Eitan Grinspuna, Hod Lipsona
a Columbia University, 500 W 120 St., New York, NY 10027, United States of AmericabWageningen University, 6708 PB Wageningen, Netherlands
A R T I C L E I N F O
Keywords:CO2 laserDoughBrowningFluxStarch gelatinizationFood layered manufacture
A B S T R A C T
We study the application of laser-heating technology to browning dough, due to its potential for high-resolutionspatial and surface color control. An important component of this process is the identification of how laserparameters affect browning and baking and whether desirable results can be achieved. In this study, we analyzethe performance of a carbon dioxide (CO2) mid-infrared laser (operating at 10.6 μm wavelength) during thebrowning of dough. Dough samples—consisting of flour and water—were exposed to the infrared laser at dif-ferent laser power, beam diameter, and sample exposure time. At a laser energy flux of 0.32 MW m−2 (beamdiameter of 5.7 mm) and sample exposure time of 180 s we observe a maximum thermal penetration of 0.77 mmand satisfactory dough browning. These results suggest that a CO2 laser is ideal for browning thin goods as wellas for food layered manufacture.Industrial relevance: A CO2 laser that operates at a wavelength of 10.6 μm (IR) was used as an alternative methodfor browning dough. The high-power flux of the laser and the high energy absorption of food at this wavelengthallow for rapid surface browning; however, the high absorption limits thermal penetration depth. Nevertheless,accuracy of the laser beam enables high resolution spatial and thermal control of the non-enzymatic browningprocess. This high precision cooking makes laser-browning particularly ideal for food layered manufacture(FLM), a food processing technique that has gained increased attention in recent years. Using FLM, one canadjust the printed layer height to match cooking penetration depth. As a digital manufacturing technology, laser-browning could also enable manufacture of highly complex and customized food geometries and textures.
1. Introduction
Lasers offer a relatively unexplored food processing techniqueuseful for precision cooking. Potential applications range frombrowning food in a microwave to broiling thin layers of food usingsoftware-driven patterns. One particular application of laser cooking isits use in conjunction with Food Layered Manufacture (FLM). FLM is anapplication of additive manufacturing technology that utilizes food as amaterial to print three-dimensional (3D) food products.
Food printing, first demonstrated by Periard et al. (2007), has be-come a growing trend (Lipson & Kurman, 2013; Sun et al., 2015;Wegrzyn, Golding, & Archer, 2012). Due to the thin layer deposition offood in an FLM application and the ability to print multi-ingredientfood products (Hertafeld et al., 2018), precise heat delivery is needed(Zoran & Coelho, 2011) to tune heating parameters for each food in-gredient. While laser technology is used extensively in medical(Gordon, 2000; Wheeland, 1995) and industrial applications (Kaplan,
1994), their ability to provide targeted and repeatable energy makethem ideal for use in some areas of food cooking (Blutinger et al.,2018). The specific characteristics of lasers for food processing includetheir ability to provide uniform heating, repeatable and precise controlof energy delivery, resolution of spatial placement of the energy, andprecise localized heating (Singh, 2013).
We have previously explored the use of lasers to bake dough(Blutinger et al., 2018). We parameterized the use of a blue laser tobake dough and found that it can provide the necessary heat to gela-tinize starch, yet it lacks the ability to effectively brown the surface ofdough (Blutinger et al., 2018). Aside from this investigation into laser-heating, other published research regarding laser cooking is very lim-ited. Lasers are applied in additive manufacturing for selective lasersintering (SLS) of edible objects, but the technique is limited to a spe-cific range of food powders (Diaz et al., 2014). Fukuchi, Jo, Tomiyama,and Takao (2012) reports the use of a CO2 laser cutter to selectivelycook the fat portion of bacon while leaving the meat untouched. Other
https://doi.org/10.1016/j.ifset.2018.11.013Received 10 April 2018; Received in revised form 30 October 2018; Accepted 28 November 2018
⁎ Corresponding author.E-mail addresses: [email protected] (J.D. Blutinger), [email protected] (P.Y. Chen), [email protected] (C. Zheng),
[email protected] (E. Grinspun), [email protected] (H. Lipson).
Innovative Food Science and Emerging Technologies 52 (2019) 145–157
Available online 29 November 20181466-8564/ © 2018 Elsevier Ltd. All rights reserved.
T

researchers have used a CO2 laser for the improvement of food quality,specifically for clarification and antimicrobial irradiation (Panchev,Kirtchev, & Dimitrov, 2011). Additionally, several patents regardinglaser cooking exist. Muchnik (2008) reported the use of a CO2 laser torapidly cook food, Singh (2013) used several types of lasers to preparefoods and Gracia and Sepulveda (2015) combined lasers and electro-magnetic waves in the cooking chamber of a 3D food printer. Re-grettably, these patents do not characterize optimal laser heatingparameters, thus further studies are required to advance understandingof laser cooking.
Dough color can suggest certain textural properties such as firmness,stiffness, hardness, and—most importantly—serve as an indicator ofquality (Abdullah, 2008; Ahrné et al., 2007). The driving force behindthese structural changes in dough is temperature (Ploteau, Glouannec,Nicolas, & Magueresse, 2015). Formation of color by heating can beattributed to non-enzymatic browning processes (i.e., Maillard reactionand caramelization) (Purlis, 2010). Conventional ovens do not lendthemselves well to controlling the browning process since heat dis-tribution is uniform with no high-fidelity heating capabilities (Datta &Rakesh, 2013). As such, this paper aims to explore the extent ofbrowning development in laser-heated dough.
Complete starch gelatinization is another important indicator ofdough quality, which is used to qualify sensory acceptability (Purlis,2012). Degree of starch gelatinization can be used as an indication ofproduct digestibility and nutritional content (Wang & Copeland, 2013).The temperature and moisture dependence of the starch gelatinizationprocess has been studied extensively (Lineback & Wongsrikasem, 1980;Mondal & Datta, 2008; Olkku & Rha, 1978; Wang & Copeland, 2013;Zanoni, Peri, & Bruno, 1995). Notably, it was found that completestarch gelatinization is achieved one the dough core reaches 95 °C(Zanoni et al., 1995). Due to the size of wheat starch granules (Olkku &Rha, 1978), scanning electron microscopy (SEM) can be used to capturethe dough microstructure and assess for the completion of the gelati-nization process (Almeida & Chang, 2013; Miller, Derby, & Trimbo,1973). SEM has been used to characterize changes in potato starchgranules (Huang et al., 1990) and assess the quality of laser-bakeddough (Blutinger et al., 2018).
Heating characteristics of lasers are very much dependent on thelight's operating wavelength. Longwave infrared (IR) light providesfaster heating rates (Westerberg, 1998) while shorter wavelength ra-diation provides deeper heat penetration (Blutinger et al., 2018; Dessev,Jury, & Le-Bail, 2011; Lentz et al., 1995; Skjöldebrand & Andersson,1989). The CO2 laser (10.6 μm wavelength) used in this study falls inthe mid-infrared (MIR) region of the electromagnetic spectrum (basedon ISO 20473) and shows high absorbance by organic materials(Baranov et al., 2005). While the radiation depth of the MIR energyonly reaches a few microns (Salagnac, Glouannec, & Lecharpentier,2004), the energy is transferred via conduction to the inner part of thefood being heated (Lentz et al., 1995). This laser's high-resolution(millimeter scale) heating capabilities make it ideal for various foodapplications, including in situ food processing for FLM and the additionof grill marks on foods (Griesbach et al., 2004).
We investigate the ability of a CO2 laser (Fig. 1) to effectively browndough. Dough consisting of flour and water was prepared as a modelfood system to develop an understanding of the parameters of a CO2
laser. Two approaches were taken to observe browning, thermal pe-netration, and the general appearance of the food product: 1) the doughwas exposed to different amounts of total laser energy and 2) a constanttotal laser energy was maintained to observe the effects of varying laserintensity (or beam flux, measured in W m−2). Additional tests con-ducted on the dough samples include measurement of weight loss afterheating, measurement of temperature during the laser-heating process,imaging to assess degree of browning, and SEM-imaging to examinemicrostructure and degree of starch gelatinization.
2. Materials and methods
2.1. Dough sample preparation
Commercial all-purpose flour (Heckers, Kansas City, USA) was ac-quired for this study. According to the manufacturer, 100 g of flourcontains 73 g of carbohydrate and 10 g of protein. To prepare thedough, 200 g of flour was mixed with 120 g of tap water for 2 min atlow speed in a food processor (FP-8FR series, Cuisinart, East Windsor,USA) at ambient temperature (23 °C). The recipe did not include yeastto prevent fermentation and expansion of the dough during furtherprocessing. After mixing, the dough was left to rest for 15 min andstored at 4 °C to prevent reactions from taking place within the dough.The dough was divided into small pieces and laminated with a rolleruntil a thickness of 2 mm ( ± 0.1 mm) was achieved. Finally, the doughsheet was cut into squares of side length 30 mm.
2.2. Laser apparatus
A CO2 laser cutter and engraver (Nova 35, Thunder LaserEquipment Co., Ltd., Dongguan, China) was used in this study, oper-ating at the infrared wavelength of 10.6 μm with a maximum allowablepower of 80 W (Fig. 1). RDWorks V.8 software was used to set laserparameters. Scan mode (x-swing) was applied for all heating purposes,with a 0.1 mm interval between passes. The software allowed for a laserspeed of up to 1000 mm s−1 and laser power of 10 to 70% (8 to 56 W).
Fig. 1. Experimental setup showing uncooked dough sample prior to CO2 laserexposure. The laser head (blue nozzle) is mounted to a track that allows it tomove in 2D Cartesian space. The laser bed (honeycomb mesh) moves in the z-direction, thereby affecting the laser energy flux that interacts with the doughsample.
J.D. Blutinger et al. Innovative Food Science and Emerging Technologies 52 (2019) 145–157
146

The manufacturer states that the power consumption for the 80 W laseris 1400 W (yielding a 6% efficiency).
2.3. Image acquisition of dough samples
A controlled environment was maintained for repeatable imagecapture. The samples were placed in a white ceramic bowl with onelight source from directly above the bowl. The bowl was white to reflectthe light and create a uniform lighting condition. The camera, mountedto a tripod, was angled downward directly above the bowl opening,giving a top view of the browned samples. This setup was maintainedfor the duration of the experiments.
All of the photos were taken using a digital single-lens reflex camera(EOS Rebel T5i, Canon, Tokyo, Japan). The images were taken in un-compressed form as a “Canon Raw Version 2” to allow for the highestresolution. Post-processing of the images involved color balancing all ofthe photos with a white color swatch, which was placed into the en-vironment. Adobe Photoshop CS6 was used to correct the images to aknown color value. The L*a*b* color model was used for the symbolicregression in Section 3.2.3 since it has the largest gamut of colorsamong all the color models (i.e., RGB, CMYK, HSV) (Yam & Papadakis,2004). Cropping and white color adjustment were the only post-pro-cessing performed on the original images.
2.4. Determination of laser beam divergence
The Nova 35 laser uses a lens to focus the beam. This particular laserhas a focus distance of 4.5 mm, which is where the beam waist occurs(beam diameter = 0.1 mm) and energy flux is at a maximum. Themanufacturer of the laser does not have documentation regarding thebeam divergence, hence one must calculate the half-angle (measure ofdivergence) experimentally. Height in the z coordinate is used to referto the distance from the laser head to the surface of the sample (Fig. 3).Further analysis was needed in order to determine the divergence of thebeam as a function of z.
To assess the beam divergence, lines were etched onto a piece ofacrylic at constant speed and power at various heights. Following thesetests, high-quality photos were taken of the etched lines using a macrolens (EF 100 mm f/2.8 Macro USM Lens, Canon, Tokyo, Japan). InPhotoshop, the width of the heat-affected zone (HAZ) on the acrylic wasmeasured on the enlarged images (Fig. 2). HAZ refers to the area on the
acrylic (or dough) that was affected by the heat of the laser beam, theextent of which is also affected by the speed of the moving laser.
2.5. Calculating variables that affect dough browning
The main variables that affected the degree of dough browning fromcontinued laser exposure include total laser energy per beam area (e,J m−2), laser beam flux (f, W m−2), point exposure time (p, s), andvariance of laser energy supplied to each dough sample (v). Laser speed(s, m s−1), beam diameter (d, m), laser power (P, W), sample exposuretime (t, s), dough sample side length (w, m), and gap between laser scanlines (g, m) are the main variables used to calculate these four derivedunits.
Laser flux (f) was calculated using Eq. (1), where power is dividedby the total area of the beam, yielding the appropriate units of powerper area (W m−2).
f Pd
42= (1)
To calculate the total laser energy supplied per beam area to thedough sample during a trial, Eq. (2) was used.
e fwgs
2=
(2)
Point exposure time (p) is another derived unit that is calculatedusing the following method (Eq. (3)):
p d tw4
.2
2= (3)
Finally, variance of laser energy supplied to the dough was calcu-lated used MATLAB, computer software optimal for data processing. Acustom simulation was generated to model the laser beam (assumed tobe Gaussian) as it scanned a 30 mm square dough sample. The doughwas split into voxels of square length 0.1 mm and energy over time wasrecorded for each voxel on the dough surface as the laser performed anx-swing raster scanning pattern. Energy variance over time was re-corded for the square voxel in the center of the dough and the varianceof laser energy over time was calculated for the simulated time series.
2.6. Measuring weight loss in the laser-heated dough
Weight loss was measured immediately after sample preparation bycalculating the difference between the weight before and after laserprocessing. This value was converted into a percentage by dividing thechange in mass by the preheated mass of the dough in order to providea more comparable unit of measure. Measurements were performed induplicate and error bars indicate standard error of the mean, exceptwhere noted.
2.7. Measuring thermal penetration depth in laser-heated dough
After laser heating, the samples were cut in half. Depth of heatpenetration was determined by a visual assessment of the transition ofdough into crumb and crust. A digital caliper (0.02 mm accuracy) wasused to measure the depth of heat penetration. Due to the resolution ofthe measuring tool, the smallest thermal penetration depth was as-sumed to be 0.1 mm. The measurements were performed in duplicateand error bars indicate standard error except where noted.
2.8. Measuring temperature within the dough
To measure the temperature inside the dough at different distancesfrom the surface, two Leaton 4-Channel K-Type Digital ThermometerThermocouple Sensors were used, each with four K-thermocouples (at1 °C accuracy); allowing for eight points of temperature data. Thethermocouples were inserted into a raw dough sample at increasing
Fig. 2. Acrylic exposed to the CO2 laser beam. The HAZ on the acrylic liesbetween the red dashed lines. A) Top view of HAZ. B) Side view of HAZ.
J.D. Blutinger et al. Innovative Food Science and Emerging Technologies 52 (2019) 145–157
147
depths below the surface. Each thermocouple was placed at steps of0.25 mm from the surface; the deepest thermocouple was at 2 mm fromthe surface. The measurements were performed in duplicate and errorbars indicate standard error except where noted.
2.9. Analyzing dough microstructure via SEM
The microstructure of the dough and the laser-heated samples wasexamined under an SEM (Sigma VP, Zeiss, Oberkochen, Germany),under the following conditions: high vacuum (< 2 · 10−5 Pa), a workingdistance of 3.5 mm, and an acceleration voltage of 5 kV. Prior to SEManalysis, samples were oven-dried at 50 °C overnight and sputter-coatedwith gold.
3. Results and discussion
3.1. Calculating laser beam divergence
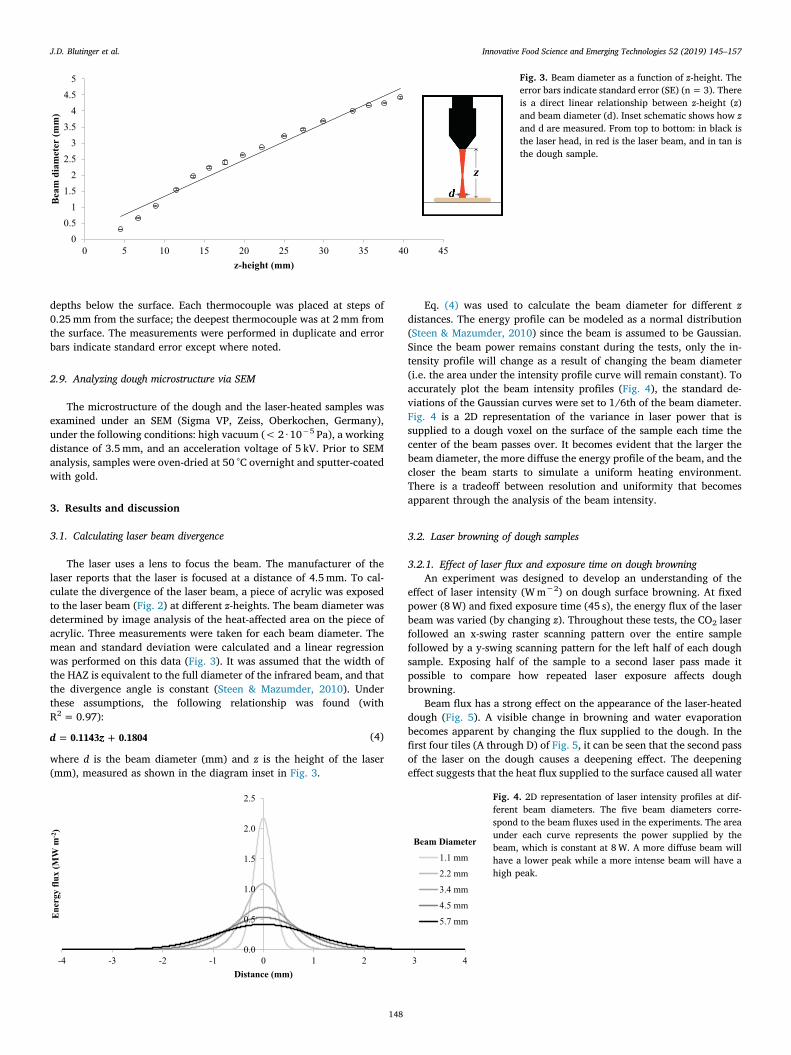
The laser uses a lens to focus the beam. The manufacturer of thelaser reports that the laser is focused at a distance of 4.5 mm. To cal-culate the divergence of the laser beam, a piece of acrylic was exposedto the laser beam (Fig. 2) at different z-heights. The beam diameter wasdetermined by image analysis of the heat-affected area on the piece ofacrylic. Three measurements were taken for each beam diameter. Themean and standard deviation were calculated and a linear regressionwas performed on this data (Fig. 3). It was assumed that the width ofthe HAZ is equivalent to the full diameter of the infrared beam, and thatthe divergence angle is constant (Steen & Mazumder, 2010). Underthese assumptions, the following relationship was found (withR2 = 0.97):
d z0.1143 0.1804= + (4)
where d is the beam diameter (mm) and z is the height of the laser(mm), measured as shown in the diagram inset in Fig. 3.
Eq. (4) was used to calculate the beam diameter for different zdistances. The energy profile can be modeled as a normal distribution(Steen & Mazumder, 2010) since the beam is assumed to be Gaussian.Since the beam power remains constant during the tests, only the in-tensity profile will change as a result of changing the beam diameter(i.e. the area under the intensity profile curve will remain constant). Toaccurately plot the beam intensity profiles (Fig. 4), the standard de-viations of the Gaussian curves were set to 1/6th of the beam diameter.Fig. 4 is a 2D representation of the variance in laser power that issupplied to a dough voxel on the surface of the sample each time thecenter of the beam passes over. It becomes evident that the larger thebeam diameter, the more diffuse the energy profile of the beam, and thecloser the beam starts to simulate a uniform heating environment.There is a tradeoff between resolution and uniformity that becomesapparent through the analysis of the beam intensity.
3.2. Laser browning of dough samples
3.2.1. Effect of laser flux and exposure time on dough browningAn experiment was designed to develop an understanding of the
effect of laser intensity (W m−2) on dough surface browning. At fixedpower (8 W) and fixed exposure time (45 s), the energy flux of the laserbeam was varied (by changing z). Throughout these tests, the CO2 laserfollowed an x-swing raster scanning pattern over the entire samplefollowed by a y-swing scanning pattern for the left half of each doughsample. Exposing half of the sample to a second laser pass made itpossible to compare how repeated laser exposure affects doughbrowning.
Beam flux has a strong effect on the appearance of the laser-heateddough (Fig. 5). A visible change in browning and water evaporationbecomes apparent by changing the flux supplied to the dough. In thefirst four tiles (A through D) of Fig. 5, it can be seen that the second passof the laser on the dough causes a deepening effect. The deepeningeffect suggests that the heat flux supplied to the surface caused all water
0
0.5
1
1.5
2
2.5
3
3.5
4
4.5
5
0 5 10 15 20 25 30 35 40 45
Bea
m d
iam
eter
(mm
)
z-height (mm)
Fig. 3. Beam diameter as a function of z-height. Theerror bars indicate standard error (SE) (n = 3). Thereis a direct linear relationship between z-height (z)and beam diameter (d). Inset schematic shows how zand d are measured. From top to bottom: in black isthe laser head, in red is the laser beam, and in tan isthe dough sample.
0.0
0.5
1.0
1.5
2.0
2.5
-4 -3 -2 -1 0 1 2 3 4
Ene
rgy
flux
(MW
m-2
)
Distance (mm)
1.1 mm
2.2 mm
3.4 mm
4.5 mm
5.7 mm
Beam Diameter
Fig. 4. 2D representation of laser intensity profiles at dif-ferent beam diameters. The five beam diameters corre-spond to the beam fluxes used in the experiments. The areaunder each curve represents the power supplied by thebeam, which is constant at 8 W. A more diffuse beam willhave a lower peak while a more intense beam will have ahigh peak.
J.D. Blutinger et al. Innovative Food Science and Emerging Technologies 52 (2019) 145–157
148

to rapidly evaporate. The dough dries out before browning reactionscan take place and turns into a powder. Further increase in the beamdiameter however will decrease the heat flux, allowing more time forbrowning reactions to take place, since water evaporates less rapidly. Ata beam flux of 1.1 MW m−2 (E, Fig. 5), no deepening effect can beobserved and the second pass of the laser increases browning. As theoptical intensity decreases further (E through H, Fig. 5), laser flux isn'tsufficient to increase the dough surface temperature fast enough toallow water to evaporate and cause browning reactions.
Singh (2013) also reported a clear relationship between laser beamdiameter and applicable cooking threshold. Increasing beam diameterwill decrease laser resolution and laser flux variance. A low variance inthe supplied energy will resemble a more uniform conventional heatingprocess, such as a convection oven. Minimum tunable laser power forthese experiments was 8 W, resulting in a heat flux of approximately8.5 MW m−2 at a beam diameter of 1.1 mm and 0.32 MW m−2 at abeam diameter of 5.7 mm. These values are high compared to infraredbaking, where heat flux values are closer to 1050 and 5500 W m−2
(Dessev et al., 2011). This difference in energy flux can be accounted forwith a difference in exposure time. Infrared baking uniformly exposesthe product to heat for the entire heating process, while laser heatingexposes dough to the beam spot for a limited duration, resulting in“pulsed heating”.
These results indicate that there is a narrow range of laser energyfluxes suitable for browning. In the experiments that follow (Fig. 6),laser energy flux and sample exposure time were varied by adjusting z-height and laser speed, respectively. Overexposure to infrared radiationimpaired quality of dough browning (Rastogi, 2015). At high opticalintensity (beam diameter of 1.1 mm), the surface of the sample eitherlacks browning development (e.g. exposure time 36 and 45 s) or iscovered by a layer of powder due to dough vaporization. Samples laserheated at high exposure times produced more powder because moistureevaporation was too fast for browning reactions to occur.
High power density can significantly affect the usual baking beha-vior of dough (Salagnac et al., 2004). This altered baking behavior canbe observed at a beam flux of 2.03 MW m−2 and an exposure time of180 s (Fig. 6), where a great deal of browning occurs. At this energy flux(2.03 MW m−2), samples prepared in 45, 60, and 90 s show a morereasonable degree of browning while an exposure time of 36 s results inan increase in lightness after processing. During conventional breadbaking, an increase in dough lightness tends to correspond to the firststage of baking (Purlis, 2010). The temperature and water activity of
the food system conditions do not allow for browning reactions tooccur. This same effect can be observed for the sample heated for 90 s ata beam flux of 0.32 MW m−2 and the samples laser-heated for 36, 45,and 60 s at a beam flux of 0.89 MW m−2 where an exposure time of180 s still results in excessive browning; dough underneath the crustbecomes visible due to clumping of the burnt material.
More optimal browning occurs at an exposure time of 90 s and en-ergy flux of 0.89 MW m−2. Samples processed for 36, 45, and 60 s witha beam flux of 0.50 and 0.32 MW m−2 show a negligible difference.These samples appear slightly darker than raw dough. Degree ofbrowning in dough is very sensitive to beam flux; for an exposure timeof 180 s, dough transition from very dark at 0.50 MW m−2 to a moreconventional brown at 0.32 MW m−2.
While optimal sample exposure time and beam flux for browningare limited, these variables can be tuned to achieve desired surfacecolor for browning and crust development. Qualitative analyses by vi-sual inspection and quantitative analyses by imaging surface color areimportant for assessing quality of baked dough (Yam & Papadakis,2004). An approximate color range of 31–72 for L, 3–15 for a, and15–33 for b can be used to determine satisfactory crust development(Shittu, Raji, & Sanni, 2007). Qualitatively, the most satisfactorybrowning in dough was achieved at a beam flux of 0.32 MW m−2 andexposure time of 180 s. Quantitatively, the mean surface color(L= 57.1, a= 7.8, b= 35.4) generated by these laser-heating para-meters, however, narrowly misses the region of colors that wouldclassify it as bread crust (b is slightly higher) (Mohd Jusoh, Chin, Yusof,& Rahman, 2009; Shittu et al., 2007); this variance can be accounted forwith dough recipe and lighting conditions. Other laser fluxes thatgenerated favorable browning results include 1) a flux of 2.03 MW m−2
at 45, 60, and 90 s exposure time; 2) a flux of 0.89 MW m−2 at 90 sexposure time; and 3) a flux of 0.5 MW m−2 at 90 s exposure time. Ofthese listed test cases, a flux of 2.03 MW m−2 at 60 and 90 s exposuretime and a flux of 0.89 MW m−2 at 90 s exposure time yield Lab surfacecolors that match the quality of the outer crust of conventionally bakedbread (Mohd Jusoh et al., 2009). Fig. 7 and Video 1 display the con-trolled progression of laser-induced browning.
3.2.2. Effect of beam power on dough browningChanging the laser power while keeping the speed and beam dia-
meter of the laser constant allows for tunable and controlled browning(Fig. 8). There are two ways to increase laser energy flux: 1) increasethe spot size by increasing z or 2) increase the power of the laser. In the
Fig. 5. Dough exposed to a laser beam (8 W, sample exposure time = 45 s) at decreasing beam flux. A) 21 MW m−2, B) 6.4 MW m−2, C) 3.0 MW m−2, D)1.8 MW m−2, E) 1.1 MW m−2, F) 0.8 MW m−2, G) 0.6 MW m−2, H) 0.5 MW m−2. The right-hand portion of each sample has been cooked once, while the left-handportion has been cooked twice. Optimal browning starts to occur in sample E.
J.D. Blutinger et al. Innovative Food Science and Emerging Technologies 52 (2019) 145–157
149

Fig. 6. Dough samples browned with a CO2 laser. The raw dough sample is shown at an exposure time of 0 s. Duplicate tests were run for each of the heated samples;the left-hand portion of the tile is the first test and the right-hand portion is the second test. The tests were very repeatable.
Fig. 7. Laser browning time-lapse of dough sample, where parameters lead to browning (power = 8 W, beam diameter = 4.5 mm, flux = 0.5 MW m−2, sampleexposure time = 90 s, speed = 100 mm s−1). The laser head (blue) moves in an x-swing scanning pattern.
J.D. Blutinger et al. Innovative Food Science and Emerging Technologies 52 (2019) 145–157
150
prior Section (3.2.1), the first method was used, while in this section thesecond method is explored. In these tests, the power of the laser issteadily increased at constant beam diameter, resulting in an increasedenergy flux. By increasing the amount of flux, and keeping other vari-ables constant, the effect of increasing power can be observed. In-creasing energy supplied clearly results in additional surface browningof the samples.
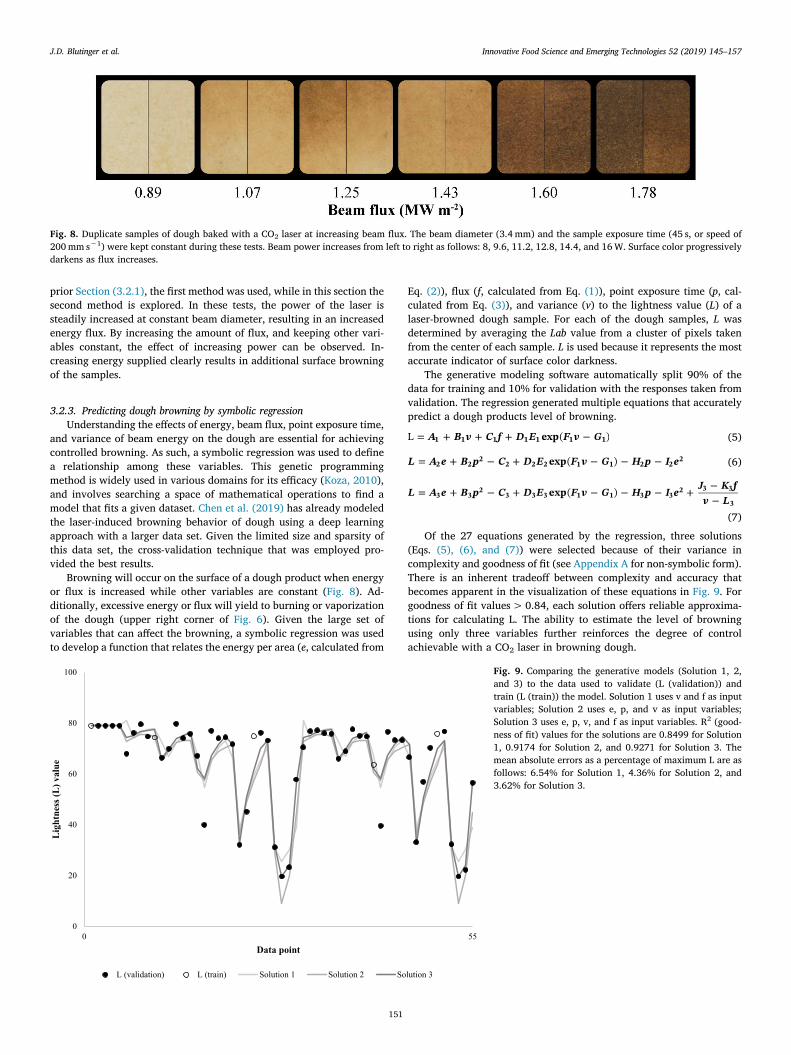
3.2.3. Predicting dough browning by symbolic regressionUnderstanding the effects of energy, beam flux, point exposure time,
and variance of beam energy on the dough are essential for achievingcontrolled browning. As such, a symbolic regression was used to definea relationship among these variables. This genetic programmingmethod is widely used in various domains for its efficacy (Koza, 2010),and involves searching a space of mathematical operations to find amodel that fits a given dataset. Chen et al. (2019) has already modeledthe laser-induced browning behavior of dough using a deep learningapproach with a larger data set. Given the limited size and sparsity ofthis data set, the cross-validation technique that was employed pro-vided the best results.
Browning will occur on the surface of a dough product when energyor flux is increased while other variables are constant (Fig. 8). Ad-ditionally, excessive energy or flux will yield to burning or vaporizationof the dough (upper right corner of Fig. 6). Given the large set ofvariables that can affect the browning, a symbolic regression was usedto develop a function that relates the energy per area (e, calculated from
Eq. (2)), flux (f, calculated from Eq. (1)), point exposure time (p, cal-culated from Eq. (3)), and variance (v) to the lightness value (L) of alaser-browned dough sample. For each of the dough samples, L wasdetermined by averaging the Lab value from a cluster of pixels takenfrom the center of each sample. L is used because it represents the mostaccurate indicator of surface color darkness.
The generative modeling software automatically split 90% of thedata for training and 10% for validation with the responses taken fromvalidation. The regression generated multiple equations that accuratelypredict a dough products level of browning.
A B v C f D E F v GexpL ( )1 1 1 1 1 1 1= + + + (5)
L A e B p C D E F v G H p I eexp( )2 22
2 2 2 1 1 2 22= + + (6)
L A e B p C D E F v G H p I e J K fv L
exp( )3 32
3 3 3 1 1 3 32 3 3
3= + + +
(7)
Of the 27 equations generated by the regression, three solutions(Eqs. (5), (6), and (7)) were selected because of their variance incomplexity and goodness of fit (see Appendix A for non-symbolic form).There is an inherent tradeoff between complexity and accuracy thatbecomes apparent in the visualization of these equations in Fig. 9. Forgoodness of fit values > 0.84, each solution offers reliable approxima-tions for calculating L. The ability to estimate the level of browningusing only three variables further reinforces the degree of controlachievable with a CO2 laser in browning dough.
Fig. 8. Duplicate samples of dough baked with a CO2 laser at increasing beam flux. The beam diameter (3.4 mm) and the sample exposure time (45 s, or speed of200 mm s−1) were kept constant during these tests. Beam power increases from left to right as follows: 8, 9.6, 11.2, 12.8, 14.4, and 16 W. Surface color progressivelydarkens as flux increases.
0
20
40
60
80
100
0 55
Lig
htne
ss (L
) val
ue
Data point
L (validation) L (train) Solution 1 Solution 2 Solution 3
Fig. 9. Comparing the generative models (Solution 1, 2,and 3) to the data used to validate (L (validation)) andtrain (L (train)) the model. Solution 1 uses v and f as inputvariables; Solution 2 uses e, p, and v as input variables;Solution 3 uses e, p, v, and f as input variables. R2 (good-ness of fit) values for the solutions are 0.8499 for Solution1, 0.9174 for Solution 2, and 0.9271 for Solution 3. Themean absolute errors as a percentage of maximum L are asfollows: 6.54% for Solution 1, 4.36% for Solution 2, and3.62% for Solution 3.
J.D. Blutinger et al. Innovative Food Science and Emerging Technologies 52 (2019) 145–157
151

3.2.4. Effect of laser flux on weight loss and thermal penetration depthSimilar to browning, weight loss is positively correlated to beam
flux (Fig. 10); weight loss increases from 2.4% at 0.89 MW m−2 to 7.4%at 1.78 MW m−2. Purlis and Salvadori (2007) also found a clear re-lationship between weight loss and brown color formation. The effecton thermal penetration depth was more difficult to measure because ofthe shallow penetration at these process parameters. Nonetheless, heatpenetration depth increases from an average of 0.1 mm at0.89 MW m−2 to 0.22 mm at a beam flux of 1.78 MW m−2 (Fig. 10).Increasing the amount of energy supplied increases moisture evapora-tion, brown color formation, and slightly increases heat penetration.
Amount of weight loss in the sample can be used to infer the amountof energy absorbed by the dough surface. As a control, an uncookeddough sample was exposed to ambient conditions and no change inweight was recorded over the course of 5 min, which exceeds theamount of time that a sample was exposed to the laser in a single test.One can, therefore, assume that change in weight is solely due tomoisture evaporation from heating as opposed to ambient conditions.Fig. 11 shows the weight loss of the heated samples obtained by settingdifferent laser beam fluxes for different exposure times.
At low exposure time, weight loss isn't very sensitive to beam dia-meter. This could be due to the fact that at a certain exposure time, total
amount of energy applied remains the same. As exposure time is in-creased, however, beam diameter (i.e., energy flux) more greatly in-fluences the weight loss. Weight loss reaches a maximum at highestenergy flux—or smallest beam diameter—with a value of 24.8%(measured as a percent change from the pre-heated dough sample).Heat flux at small beam diameter is large enough to induce rapidmoisture evaporation before conductive heat transfer can occur throughthe food. High energy flux also causes more moisture loss due to eva-poration and dough powder to form. Due to high laser flux, moistureevaporation is so fast that dough completely dries out and transitions topowder before browning reactions can occur.
3.2.5. Effect of energy flux on thermal penetration depth in doughHeat penetration inside the samples was measured at increasing
exposure time and beam diameter (Fig. 12). As total laser energy sup-plied to the dough increases (directly proportional to exposure time),heat penetration depth increases (Fig. 12). At longer exposure times,laser flux more greatly affects thermal penetration. While weight lossreaches a maximum (24.8%) at the smallest beam diameter (1.1 mm),thermal penetration depth is highest (0.77 mm) at the largest testedbeam diameter (5.7 mm). This can most likely be explained by thermalconduction. A larger beam diameter results in a lower laser heat flux,
0
0.05
0.1
0.15
0.2
0.25
0.3
0%
1%
2%
3%
4%
5%
6%
7%
8%
9%
10%
0.713 0.891 1.069 1.247 1.425 1.603 1.781 1.959
Pen
etra
tion
dep
th (m
m)
Wei
ght l
oss
(%)
Flux (MW/m2)
Weight loss Penetration depth
Fig. 10. Weight loss and penetration depth as a function of flux (beam diameter = 3.4 mm, sample exposure time = 45 s, speed = 200 mm s−1). The error barsindicate standard error (SE) (n = 2). Weight loss increases with beam flux, while penetration depth was less conclusive.
0%
5%
10%
15%
20%
25%
30%
0 20 40 60 80 100 120 140 160 180 200
Wei
ght l
oss
(%)
Exposure time (s)
8.50 MW/m²
2.03 MW/m²
0.89 MW/m²
0.50 MW/m²
0.32 MW/m²
Beam flux
Fig. 11. Total weight loss of the dough samples obtained atdifferent beam fluxes as a function of total exposure time.Low beam diameters correspond to high energy flux. Laserpower remained constant at 8 W for these tests. The errorbars indicate standard error (SE) (n = 2). There is a directrelationship between exposure time and weight loss.
J.D. Blutinger et al. Innovative Food Science and Emerging Technologies 52 (2019) 145–157
152

but the total amount of energy supplied to the food is constant. Theinterval between passes of the laser is fixed at 0.1 mm, therefore thematerial will be exposed to the laser during multiple passes. This resultsin a decrease in moisture evaporation and an increase in conductiveheat transfer through the food, with time being the limiting factor inheat transfer. In brief, an increase in the penetration depth slows downthe overall temperature increase of the food sample (Krishnamurthyet al., 2008), resulting in less moisture evaporation.
A linear regression was performed on the data to find a relationshipbetween the different parameters. For the obtained results, heat pene-tration (h, mm) can be accurately estimated by the following formula,where t is the exposure time (s) and δ is the weight loss (g) (adjustedR2 = 0.90):
h t0.004441 0.75003 0.01932= (8)
Beam diameter is accounted for in Eq. (8) since it plays an importantrole in weight loss by determining how much energy is transferred fromthe surface to the inside of the dough. At small beam diameters, weightloss is caused by moisture evaporation and material loss as well.
3.2.6. Effect of laser heating on internal dough temperatureStarch gelatinization is an important process that occurs only once
certain temperatures are reached within the dough. Eight thermo-couples were placed at 0.25 mm increments from the surface in order tomeasure the depth of heat penetration. A dough sample was exposed tothe IR laser at a beam diameter of 5.7 mm for 180 s. Because the doughheating originates from the surface of the dough and relies on con-ductive heat transfer, maximum recorded temperatures decrease with
increasing depth (Fig. 13), which is consistent with prior research(Blutinger et al., 2018).
Thermal penetration depth measured at these heating conditionswas 0.77 mm. Temperatures less than a millimeter from the doughsurface exceed 70 °C, which is just above the minimum temperature forinitial swelling of starch granules (Olkku & Rha, 1978). Either thetemperature was not maintained for sufficient time at deeper penetra-tion depths for gelatinization to occur, or the temperatures reachedwere too low for gelatinization to take place. At a depth of 2 mm, themaximum temperature measured was 58 °C, which is too low to allowfor starch gelatinization. Temperatures are not sufficient for completestarch gelatinization, which is required in bread crumb (Purlis, 2012).The minimum temperature should reach at least 95 °C to ensure com-plete gelatinization (Zanoni et al., 1995). Though full gelatinizationwas not achieved, SEM microscopy would allow for further micro-structure analysis of the samples.
3.2.7. Comparing dough microstructureDough that has been heated via laser—as opposed to via oven—-
develops different textural and visual properties (Fig. 14). The laser-browned dough product (beam diameter of 5.7 mm; sample exposuretime of 180 s; laser power of 8 W) was compared to a sample preparedin a conventional hot air convection oven for 5 min—based on doughsize and thickness—at 220 °C (heat setting for average baking appli-cation). With thin dough products, preparation in an oven will result inpillow-shaped dough expansion (right, Fig. 14). Blutinger et al. (2018)have already laser-baked dough with a blue laser and no significantexpansion was observed, as is similar for the CO2 laser-heated sample
0.00
0.10
0.20
0.30
0.40
0.50
0.60
0.70
0.80
0.90
0 20 40 60 80 100 120 140 160 180 200
Hea
t pen
etra
tion
(mm
)
Exposure time (s)
8.50 MW/m²
2.03 MW/m²
0.89 MW/m²
0.50 MW/m²
0.32 MW/m²
Beam flux
Fig. 12. Heat penetration depth in the dough samples ob-tained at different beam diameters as a function of totalexposure time. Laser power remained constant at 8 W forthese tests while beam diameter—therefore beamflux—was varied. The error bars indicate standard error(SE) (n = 2). There is a direct relationship between ex-posure time and weight loss.
0
10
20
30
40
50
60
70
80
90
0.0 0.5 1.0 1.5 2.0
Max
imum
tem
pera
ture
(°C
)
Penetration depth (mm)
Fig. 13. Maximum temperatures inside the dough samples measured at increasing depth. The following laser parameters were held constant during these tests: beamdiameter = 5.7 mm, exposure time = 180 s, and laser power = 8 W. The error bars indicate standard error (SE) (n = 2).
J.D. Blutinger et al. Innovative Food Science and Emerging Technologies 52 (2019) 145–157
153

(left, Fig. 14). This is an advantage for FLM, where printed shape pre-servation is desired. Another disadvantage of preparing thin doughproducts in a convection oven is that the inside will be baked beforesufficient browning can occur on the outside.
The transition of dough into crust and crumb can be examined bystudying the microstructure by SEM. Gelatinization of starch can beused as an indication of the transition of dough into crumb. Fig. 15presents a side view of the laser-browned dough sample, where theuncooked dough can be distinguished from the crumb by a difference incolor. The darker portion underneath the dough crust was identified ascrumb and analyzed by SEM.
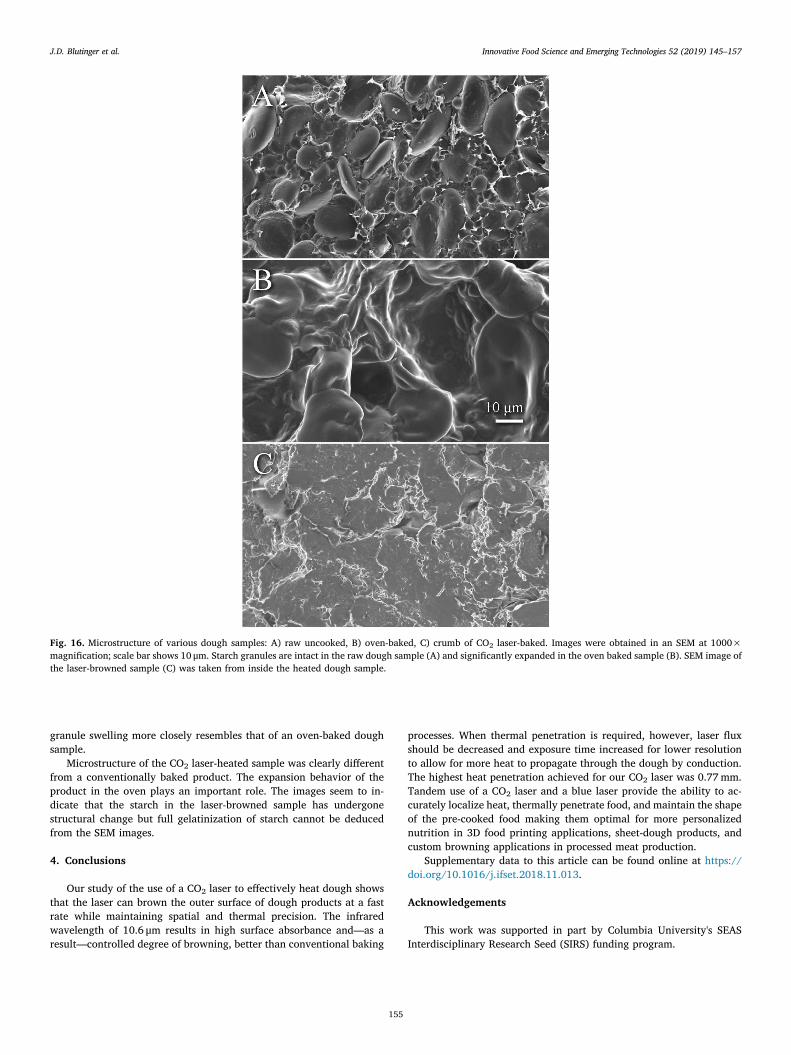
SEM images can be used to check whether the starch granules arestill intact (Almeida & Chang, 2013; Blutinger et al., 2018; Huang et al.,1990), because the granular form of starch is lost upon gelatinization(Ratnayake & Jackson, 2009). The microstructure of dough clearly
consists of starch granules which are still intact. The variation in size issomewhere between 2 and 20 μm (A, Fig. 16), which corresponds towheat starch granule sizes reported in literature (Olkku & Rha, 1978).Starch granules in the SEM image of the oven-baked sample (B, Fig. 16)show a dramatic size increase, which indicates starch swelling. This isin agreement with the results of Almeida and Chang (2013). Some ofthe smaller starch granules have lost their shape and become part of thenetwork. The presence of air pockets in the structure is also evident,which occurred due to convective heating causing an expansion of theproduct. Conversely, the microstructure of the crumb of the CO2 laser-heated sample (C, Fig. 16) shows starch granules that cannot be clearlydistinguished. Granules appear to be swollen, disintegrated, and themicrostructure is very tightly packed corresponding to the doughmacrostructure. SEM images of CO2 laser-browned dough also greatlydiffer from blue laser-baked dough (Blutinger et al., 2018) where starch
Fig. 14. Comparing a CO2 laser-heated dough sample (left) to an oven-baked dough sample (right). Left: CO2 laser-browned sample (beam diameter = 5.7 mm;sample exposure time = 180 s; laser power = 8 W); Right: oven-baked sample (220 °C for 5 min). The shape of the laser-heated sample remains the same while theoven-baked sample changes to a pillow-shape. Controlled browning is achieved in the laser-heated sample, while the oven-baked sample only browns at the center.
Fig. 15. Side view of a CO2 laser-heated dough sample. Below the crust, the crumb can be observed, which is darker than the uncooked dough underneath it. Thelaser parameters for this test are as follows: beam diameter of 5.7 mm, sample exposure time of 180 s, laser power of 8 W.
J.D. Blutinger et al. Innovative Food Science and Emerging Technologies 52 (2019) 145–157
154
granule swelling more closely resembles that of an oven-baked doughsample.
Microstructure of the CO2 laser-heated sample was clearly differentfrom a conventionally baked product. The expansion behavior of theproduct in the oven plays an important role. The images seem to in-dicate that the starch in the laser-browned sample has undergonestructural change but full gelatinization of starch cannot be deducedfrom the SEM images.
4. Conclusions
Our study of the use of a CO2 laser to effectively heat dough showsthat the laser can brown the outer surface of dough products at a fastrate while maintaining spatial and thermal precision. The infraredwavelength of 10.6 μm results in high surface absorbance and—as aresult—controlled degree of browning, better than conventional baking
processes. When thermal penetration is required, however, laser fluxshould be decreased and exposure time increased for lower resolutionto allow for more heat to propagate through the dough by conduction.The highest heat penetration achieved for our CO2 laser was 0.77 mm.Tandem use of a CO2 laser and a blue laser provide the ability to ac-curately localize heat, thermally penetrate food, and maintain the shapeof the pre-cooked food making them optimal for more personalizednutrition in 3D food printing applications, sheet-dough products, andcustom browning applications in processed meat production.
Supplementary data to this article can be found online at https://doi.org/10.1016/j.ifset.2018.11.013.
Acknowledgements
This work was supported in part by Columbia University's SEASInterdisciplinary Research Seed (SIRS) funding program.
Fig. 16. Microstructure of various dough samples: A) raw uncooked, B) oven-baked, C) crumb of CO2 laser-baked. Images were obtained in an SEM at 1000×magnification; scale bar shows 10 μm. Starch granules are intact in the raw dough sample (A) and significantly expanded in the oven baked sample (B). SEM image ofthe laser-browned sample (C) was taken from inside the heated dough sample.
J.D. Blutinger et al. Innovative Food Science and Emerging Technologies 52 (2019) 145–157
155

Appendix A
Full solutions from symbolic regression:All of the data was normalized, prior to feeding it into the generative model, by means of subtracting the average of each data set and dividing by
the standard deviation. Large coefficients are a result of very small values for the variance of energy supplied to the dough sample (v).
Solution 1:
L v f18 7.371 10 5.589 4.732 0.001674 v10 (7.371 10 0.4)10= + × + + × ×
R2 = 0.8499, MAE= 5.2096(6.54%).
Solution 2:
L e p p e0.206 1.309 33.54 26.03 0.02573 2.402 8.933 10v2 (7.371 10 0.4) 5 210= + + × ××
R2 = 0.9174, MAE= 3.4772(4.36%).
Solution 3:
L e p p e fv
0.2039 1.32 33.18 27.79 0.02942 2.422 8.807 10 9.133 10 9.559 105.426 10
v2 (7.371 10 0.4) 5 212 13
1210= + + × × + × ×
××
R2 = 0.9271, MAE= 2.8825(3.62%).
References
Abdullah, M. Z. (2008). 20 – Quality evaluation of bakery products. Computer visiontechnology for food quality evaluation (pp. 481–522). .
Ahrné, L., et al. (2007). Effect of crust temperature and water content on acrylamideformation during baking of white bread: Steam and falling temperature baking. LWT -Food Science and Technology, 40(10), 1708–1715.
Almeida, E. L., & Chang, Y. K. (2013). Structural changes in the dough during the pre-baking and re-baking of French bread made with whole wheat flour. Food andBioprocess Technology, 6(10), 2808–2819.
Baranov, G. A., et al. (2005). Modification of biological objects in water media by CO2laser radiation. Quantum Electronics, 35(9), 867–872.
Blutinger, J. D., et al. (2018). Characterization of dough baked via blue laser. Journal ofFood Engineering, 232, 56–64. http://linkinghub.elsevier.com/retrieve/pii/S026087741830133X (April 3, 2018).
Chen, P. Y., et al. (2019). Visual modeling of laser-induced dough browning. Journal ofFood Engineering, 243, 9–21. https://www.sciencedirect.com/science/article/pii/S0260877418303595 (September 11, 2018).
Datta, A. K., & Rakesh, V. (2013). Principles of microwave combination heating.Comprehensive Reviews in Food Science and Food Safety, 12(1), 24–39. http://doi.wiley.com/10.1111/j.1541-4337.2012.00211.x (September 27, 2018).
Dessev, T., Jury, V., & Le-Bail, A. (2011). The effect of moisture content on short infraredabsorptivity of bread dough. Journal of Food Engineering, 104(4), 571–576.
Diaz, J. V., et al. (2014). Method for the production of edible objects using SLS and foodproducts WO 2014193226 A1.
Fukuchi, K., Jo, K., Tomiyama, A., & Takao, S. (2012). Laser cooking. Proceedings of theACM multimedia 2012 workshop on multimedia for cooking and eating activities - CEA '12(pp. 55). New York, New York, USA: ACM Press.
Gordon, E. I. (2000). Use of lasers in ophthalmic surgery. IEEE Journal of Selected Topics inQuantum Electronics, 6(6), 1116–1121. http://ieeexplore.ieee.org/document/902160/ (October 18, 2017).
Gracia, A., & Sepulveda, E. (2015). Apparatus and method for heating and cooking food usinglaser beams and electromagnetic radiation WO 2016053681 A1.
Griesbach, L.,. et al. Method of providing grill marks on a foodstuff. (2004). https://patents.google.com/patent/US20050008742A1/en (July 26, 2018).
Hertafeld, E., Zhang, C., Jin, Z., Jakub, A., Russell, K., Lakehal, Y., ... Lipson, H. (2018).Multi-material three-dimensional food printing with simultaneous infrared cooking.3D Printing and Additive Manufacturing: 3dp (pp. 0042). . (November 28, 2018)https://www.liebertpub.com/doi/10.1089/3dp.2018.0042.
Huang, J., et al. (1990). Scanning electron microscopy: tissue characteristics and starchgranule variations of potatoes after microwave and conductive heating. FoodStructure, 9(9), 113–122. http://digitalcommons.usu.edu/foodmicrostructure(February 3, 2018).
Kaplan, A. (1994). A model of deep penetration laser welding based on calculation of thekeyhole profile. Journal of Physics D: Applied Physics, 27(9), 1805–1814. http://stacks.iop.org/0022-3727/27/i=9/a=002?key=crossref.03f7e3ef991bd0b56cbc882399ebf226 (October 18, 2017).
Koza, J. R. (2010). Human-competitive results produced by genetic programming. GeneticProgramming and Evolvable Machines, 11(3–4), 251–284. http://link.springer.com/10.1007/s10710-010-9112-3 (October 20, 2017).
Krishnamurthy, K., et al. (2008). Infrared heating in food processing: An overview.Comprehensive Reviews in Food Science and Food Safety, 7(1), 2–13.
Lentz, R. R., et al. (1995). Method of processing food utilizing infrared radiation US5382441 A.
Lineback, D. R., & Wongsrikasem, E. (1980). Gelatinization of starch in baked products.Journal of Food Science, 45(1), 71–74.
Lipson, H., & Kurman, M.. Fabricated: The new world of 3D printing. (2013). https://books.google.com/books?hl=en&lr=&id=MpLXWHp-srIC&oi=fnd&pg=PA1&dq=3d+food+printing&ots=Z3bZySJ3_H&sig=J0B9KCDystLtS9v1aa-Ub2wECzg#v=onepage&q=3d+food+printing&f=false (May 27, 2018).
Miller, B. S., Derby, R. I., & Trimbo, H. B. (1973). A pictorial explanation for the increasein viscosity of a heated wheat starch-water suspension. Cereal Chemistry, 50,271–280.
Mohd Jusoh, Y. M., Chin, N. L., Yusof, Y. A., & Rahman, R. A. (2009). Bread crustthickness measurement using digital imaging and L a b colour system. Journal of FoodEngineering, 94(3–4), 366–371. https://www.sciencedirect.com/science/article/pii/S0260877409001885 (October 25, 2018).
Mondal, A., & Datta, A. K. (2008). Bread baking – A review. Journal of Food Engineering,86(4), 465–474.
Muchnik, B. (2008). Laser cooking apparatus US 20080282901 A1.Olkku, J., & Rha, C. K. (1978). Gelatinisation of starch and wheat flour starch—A review.
Food Chemistry, 3(4), 293–317.Panchev, I. N., Kirtchev, N. A., & Dimitrov, D. D. (2011). Possibilities for application of
laser ablation in food technologies. Innovative Food Science & Emerging Technologies,12(3), 369–374.
Periard, D., et al. (2007). Printing food. Proceedings of the 18th Solid Freeform FabricationSymposium, Austin, TX (pp. 564–574). . https://sffsymposium.engr.utexas.edu/Manuscripts/2007/2007-48-Periard.pdf (November 30, 2017).
Ploteau, J. P., Glouannec, P., Nicolas, V., & Magueresse, A. (2015). Experimental in-vestigation of French bread baking under conventional conditions or short infraredemitters. Applied Thermal Engineering, 75, 461–467.
Purlis, E. (2010). Browning development in bakery products – A review. Journal of FoodEngineering, 99(3), 239–249.
Purlis, E. (2012). Baking process design. Handbook of food process design (pp. 743–768).Oxford, UK: Wiley-Blackwell.
Purlis, E., & Salvadori, V. O. (2007). Bread browning kinetics during baking. Journal ofFood Engineering, 80(4), 1107–1115.
Rastogi, N. K. (2015). 5 – Infrared heating of foods and its combination with electronbeam processing. Electron beam pasteurization and complementary food processingtechnologies (pp. 61–82). .
Ratnayake, W. S., & Jackson, D. S. (2009). Starch gelatinization. Advances in Food andNutrition Research, 55, 221–268.
Salagnac, P., Glouannec, P., & Lecharpentier, D. (2004). Numerical modeling of heat andmass transfer in porous medium during combined hot air, infrared and microwavesdrying. International Journal of Heat and Mass Transfer, 47(19), 4479–4489.
Shittu, T. A., Raji, A. O., & Sanni, L. O. (2007). Bread from composite cassava-wheat flour:I. Effect of baking time and temperature on some physical properties of bread loaf.Food Research International, 40(2), 280–290. https://www.sciencedirect.com/science/article/pii/S0963996906001815 (October 25, 2018).
Singh, I. (2013). Method and apparatus for plasma assisted laser cooking of food products US2013/0344208 A1. 14.
Skjöldebrand, C., & Andersson, C. (1989). A comparison of infrared bread baking andconventional baking. Journal of Microwave Power and Electromagnetic Energy, 24(2),91–101.
Steen, W. M., & Mazumder, J. (2010). Laser material processing (4th ed.). Springer.Sun, J., et al. (2015). An overview of 3D printing technologies for food fabrication. Food
and Bioprocess Technology, 8(8), 1605–1615. http://link.springer.com/10.1007/s11947-015-1528-6 (May 27, 2018).
Wang, S., & Copeland, L. (2013). Molecular disassembly of starch granules during
J.D. Blutinger et al. Innovative Food Science and Emerging Technologies 52 (2019) 145–157
156

gelatinization and its effect on starch digestibility: A review. Food & Function, 4(11),1564.
Wegrzyn, T. F., Golding, M., & Archer, R. H. (2012). Food layered manufacture: A newprocess for constructing solid foods. Trends in Food Science & Technology, 27(2),66–72. https://www.sciencedirect.com/science/article/pii/S0924224412000921(April 24, 2018).
Westerberg, E. R. (1998). Apparatus and method for cooking food with a controlled spectrumUS 6069345 A.
Wheeland, R. G. (1995). Clinical uses of lasers in dermatology. Lasers in Surgery andMedicine, 16(1), 2–23. http://doi.wiley.com/10.1002/lsm.1900160103 (October 18,
2017).Yam, K. L., & Papadakis, S. E. (2004). A simple digital imaging method for measuring and
analyzing color of food surfaces. Journal of Food Engineering, 61(1), 137–142. https://www.sciencedirect.com/science/article/pii/S026087740300195X (October 25,2018).
Zanoni, B., Peri, C., & Bruno, D. (1995). Modelling of browning kinetics of bread crustduring baking. LWT - Food Science and Technology, 28(6), 604–609.
Zoran, A., & Coelho, M. (2011). Cornucopia: The concept of digital gastronomy. 44(5), MITPress425–431. http://muse.jhu.edu/journals/len/summary/v044/44.5.zoran.html(December 5, 2017).
J.D. Blutinger et al. Innovative Food Science and Emerging Technologies 52 (2019) 145–157
157