2020 Office of Personnel Management
Federal Employee Viewpoint SurveyEmpowering Employees. Inspiring Change.
Governmentwide Management Report
United States Office of Personnel Management OPM.GOV/FEVS #OPMFEVS
A Message from the Acting Director
2020 was a year of both challenges and changes. Together, leaders and employees faced an unprecedented reality – the COVID-19 pandemic. Life and work changed for many of us. While some Federal employees have continued to commute to a central worksite, others have worked from home, and some have engaged a hybrid approach with work from home combined with trips to a central office.
The 2020 OPM FEVS addressed changes to Federal work and workplaces during the pandemic. Results from the OPM Governmentwide FEVS describe a Federal workforce that has remained strong and dedicated despite circumstances. Federal employees were able to maintain a strong connection between their work and the agency’s goals with 87% responding affirmatively to “I know how my work relates to the agency’s goals” — tied for the highest rated question on the survey. Also of note, over 80% of responding Federal employees agree that the people they work with cooperate to get the job done and their agency is successful at accomplishing its mission.
Workplace flexibilities played a significant role in ensuring employees were able to meet both their work and family responsibilities. Prior to the pandemic, only 3% of employees teleworked daily, but that number grew substantially during the peak of the pandemic when a record 59% of employees teleworked every day.
There was no one perfect solution for everyone, and workplace flexibilities allowed employees to find the best way to remain safe while accomplishing the agency mission. I invite you to read this report and see for yourself how resilience remains the hallmark of the Federal workforce, even during these most challenging of times.
In closing, I offer my thanks to the men and women of the Federal workforce for your willingness to respond to the survey and contribute the insights that are so vital to the success of critical Federal missions. I am deeply grateful as well for the dedication and commitment you have shown to your agencies and your service to the American people each and every day during this challenging time.
Kathleen M. McGettigan Acting DirectorU.S. Office of Personnel Management
Table of Contents
Introduction ...........................................................................................................................................................................................1
A Responsive Survey to Meet New Conditions .................................................................................................................................1
Background to Results ......................................................................................................................................................................1
At a Glance ............................................................................................................................................................................................3
Participant Overview .........................................................................................................................................................................4
Response Rates .................................................................................................................................................................................5
Top Response Rates......................................................................................................................................................................6
Top Response Rate Increases .......................................................................................................................................................6
Creating an Engaging Agency Culture: Understanding the Employee Engagement Index ......................................................................7
Assessing the Engagement Potential of Federal Workplaces: The Employee Engagement Index (EEI) ...............................................7
Employee Engagement Index Results by Agency Size, Top Agency Scores, and Greatest Increases ..............................................8
Core Questions in Regulation .............................................................................................................................................................. 10
The COVID-19 Pandemic: Federal Employee Experiences .................................................................................................................... 14
Highlights: Where and How Federal Employees Work .................................................................................................................... 14
Employee Support .......................................................................................................................................................................... 15
Work Consequences ....................................................................................................................................................................... 16
Support of Employee Work ............................................................................................................................................................. 16
Workplace Effectiveness ................................................................................................................................................................ 17
Leaning Toward the Future: Conclusions and Next Steps .................................................................................................................... 18
Appendix A: Participating Agency Response Rates by Employee Population Size Categories ............................................................. 19
Appendix B: Analytical Methods and Additional OPM FEVS Reports .................................................................................................. 23
Appendix C: Item Comparisons Across Years ..................................................................................................................................... 24
Appendix D: COVID-19 Pandemic Results .......................................................................................................................................... 28
Appendix E: Work-Life Program Results ............................................................................................................................................. 36
Appendix F: Governmentwide Respondent Characteristics ............................................................................................................... 40
Appendix G: OPM FEVS Indices .......................................................................................................................................................... 46
Introduction
For nearly two decades the OPM Federal Employee Viewpoint Survey (OPM FEVS) has provided a resource for Federal employees to express how management practices and policies influence their workplace experiences, shaping service to the American people. As an organizational climate survey,1 the OPM FEVS provides Federal agency leadership with critical information to assess whether, and to what extent, workplace conditions characterizing successful organizations are present in Federal agencies. Year after year, OPM FEVS findings have consistently painted a picture of a resilient Federal workforce committed to public service regardless of circumstances.
The resilience of the workforce was fully tested during 2020 when the COVID-19 pandemic challenged Federal employees to perform under unique and very difficult conditions. Responding to the numerous changes in government workplaces, OPM updated the 2020 OPM FEVS to ensure an instrument aligned with current circumstances and capable of assessing the impact of COVID-19 on employees and agencies. The goal of the 2020 OPM FEVS has been to provide useful information to agency leaders as they strive to identify actions to effectively address demands on the workforce and responses to future emergencies. The purpose of this report is to provide an overview of insights gained from the Federal workforce in an unusual year marked by a pandemic.
A Responsive Survey to Meet New ConditionsTwo changes set the 2020 OPM FEVS apart from previous years. First, the survey was postponed from the normal spring schedule with OPM twice delaying the survey to allow agencies to focus on core missions and adjust to the demands of the COVID-19 pandemic. The survey was administered during the fall, launching on September 14, 2020, and closing in all agencies on November 5, 2020.
Second, the content of the survey was subject to more significant revision than at any other time since the development of the instrument nearly two decades ago. The core set of standard items was streamlined to allow for the addition of a comprehensive section examining how the pandemic has affected employees and their Federal work. Questions probe numerous topics, for example, where employees have performed work during the pandemic and perspectives on leadership efforts to support employee health and safety. Results will inform agency evaluations of current efforts as well as shape actions to respond to future emergencies.
To further meet stakeholder needs, key content from prior survey administrations was retained in the 2020 OPM FEVS, including items required by regulation for agency surveys (5 CFR Part 250; Subpart C - Employee Surveys). Two widely consulted indices — the Global Satisfaction and the Employee Engagement Index — were kept in their entirety in the survey. Note that, while items have been retained and results shown in comparison with prior scores throughout the report, interpretation of any score changes between 2020 and prior years must be made very cautiously. As confirmed by research, revisions to survey instrument content and the timing of survey administration have an impact on the perceptions of respondents and by extension, results.2 Care should be taken in attributing score differences to any one cause especially with respect to 2020 in which large changes were made to both the instrument (e.g., removal of core items, introduction of a new content, new introductory text) and survey administration procedures (e.g., timeframe for the survey delaying to fall rather than the usual spring administration).
1 Organizational climate is a multi-dimensional construct comprised of discreet dimensions, capturing how employees jointly experience the policies, practices, and procedures of their organizations. Employee perceptions of climate influence organizational effectiveness by shaping, for example, employee engagement, satisfaction, motivation, commitment, and turnover.
Patterson, M. G., West, M. A., Shackleton, V. J., Dawson, J. F., Lawthom, R., Maitlis, S., et al. (2005). Validating the organizational climate measure: Links to managerial practices, productivity and innovation. Journal of Organizational Behavior, 26, 379–408.
Schneider, B., Brief, A. P., & Guzzo, R. A. (1996). Creating a climate and culture for sustainable organizational change. Organizational Dynamics, 24, 7–19.
2 Pew Research Center Method, Questionnaire design - https://www.pewresearch.org/methods/u-s-survey-research/questionnaire-design.
Ingram DD, Malec DJ, Makuc DM, Kruszon-Moran D, Gindi RM, Albert M, et al. National Center for Health Statistics Guidelines for Analysis of Trends. National Center for Health Statistics. Vital Health Stat 2(179). 2018.
Introduction 1
Introduction (continued)
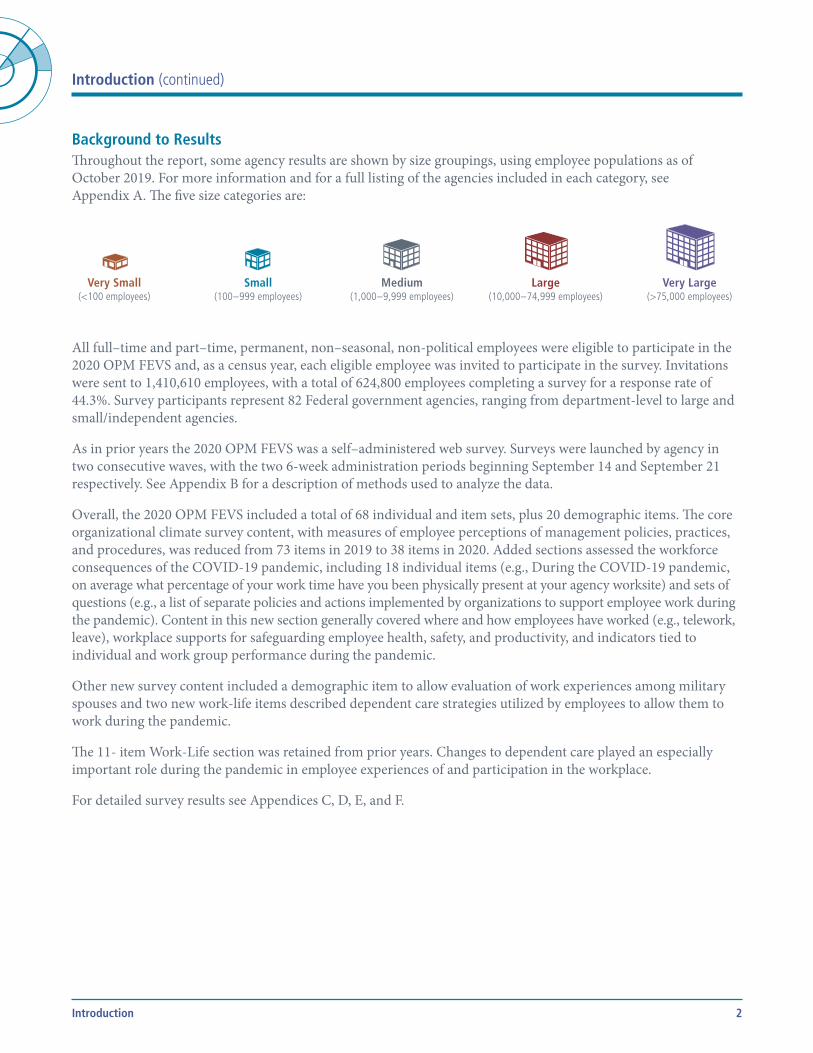
Background to ResultsThroughout the report, some agency results are shown by size groupings, using employee populations as of October 2019. For more information and for a full listing of the agencies included in each category, see Appendix A. The five size categories are:
Very Small(<100 employees)
Small(100 – 999 employees)
Medium(1,000 – 9,999 employees)
Large(10,000 – 74,999 employees)
Very Large(>75,000 employees)
All full–time and part–time, permanent, non–seasonal, non-political employees were eligible to participate in the 2020 OPM FEVS and, as a census year, each eligible employee was invited to participate in the survey. Invitations were sent to 1,410,610 employees, with a total of 624,800 employees completing a survey for a response rate of 44.3%. Survey participants represent 82 Federal government agencies, ranging from department-level to large and small/independent agencies.
As in prior years the 2020 OPM FEVS was a self–administered web survey. Surveys were launched by agency in two consecutive waves, with the two 6-week administration periods beginning September 14 and September 21 respectively. See Appendix B for a description of methods used to analyze the data.
Overall, the 2020 OPM FEVS included a total of 68 individual and item sets, plus 20 demographic items. The core organizational climate survey content, with measures of employee perceptions of management policies, practices, and procedures, was reduced from 73 items in 2019 to 38 items in 2020. Added sections assessed the workforce consequences of the COVID-19 pandemic, including 18 individual items (e.g., During the COVID-19 pandemic, on average what percentage of your work time have you been physically present at your agency worksite) and sets of questions (e.g., a list of separate policies and actions implemented by organizations to support employee work during the pandemic). Content in this new section generally covered where and how employees have worked (e.g., telework, leave), workplace supports for safeguarding employee health, safety, and productivity, and indicators tied to individual and work group performance during the pandemic.
Other new survey content included a demographic item to allow evaluation of work experiences among military spouses and two new work-life items described dependent care strategies utilized by employees to allow them to work during the pandemic.
The 11- item Work-Life section was retained from prior years. Changes to dependent care played an especially important role during the pandemic in employee experiences of and participation in the workplace.
For detailed survey results see Appendices C, D, E, and F.
Introduction 2
At a Glance
A few brief highlights from the 2020 OPM FEVS results show a Federal workforce that, even during the pandemic, are inspired by their work, positive about interactions between colleagues, and optimistic about their agencies and the inclusivity of their workplaces. Such results support overall perceptions of workforce resilience and performance, with the following highlights:
• 87% responded affirmatively to “I know how my work relates to the agency’s goals” – tied for the highest rated question on the survey.
• 75% of employees agree their work gives them a feeling of personal accomplishment.• 84% agree the people they work with cooperate to get the job done.• 71% would recommend their organization as a good place to work.• 81% believe their agency is successful at accomplishing its mission.• 79% of employees agree their supervisor is committed to a workforce representative of all segments of society.
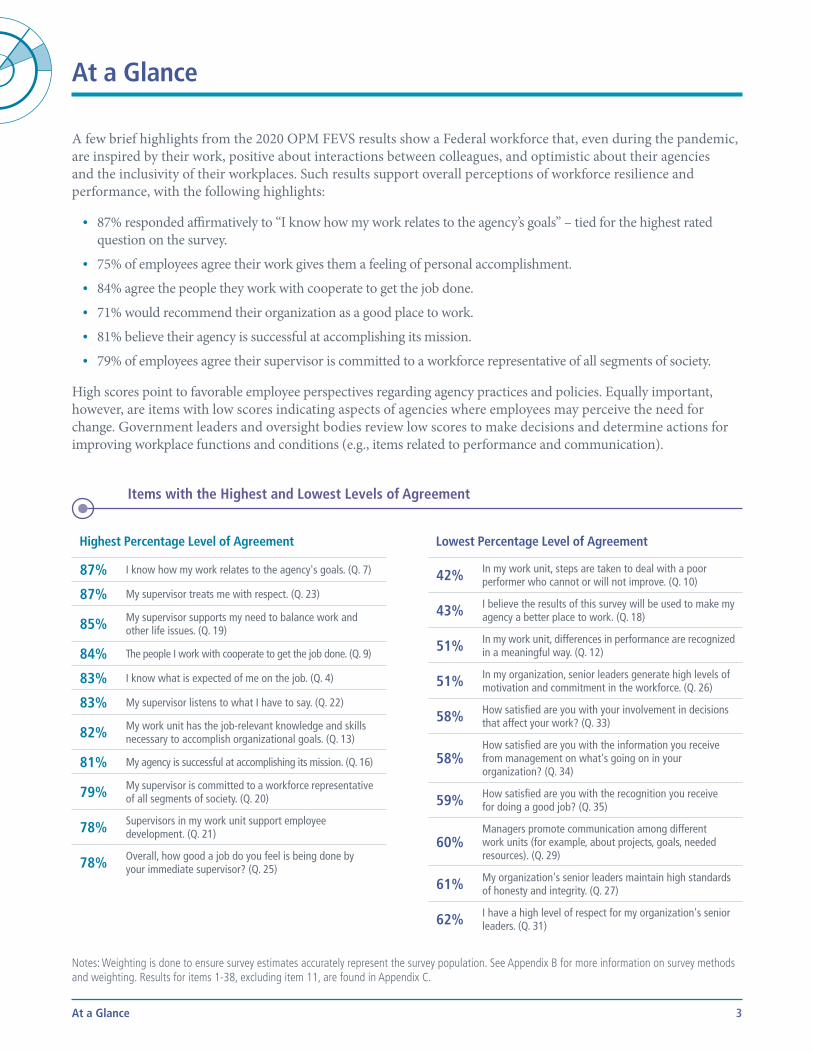
High scores point to favorable employee perspectives regarding agency practices and policies. Equally important, however, are items with low scores indicating aspects of agencies where employees may perceive the need for change. Government leaders and oversight bodies review low scores to make decisions and determine actions for improving workplace functions and conditions (e.g., items related to performance and communication).
Items with the Highest and Lowest Levels of Agreement
Highest Percentage Level of Agreement
87% I know how my work relates to the agency's goals. (Q. 7)
87% My supervisor treats me with respect. (Q. 23)
85% My supervisor supports my need to balance work and other life issues. (Q. 19)
84% The people I work with cooperate to get the job done. (Q. 9)
83% I know what is expected of me on the job. (Q. 4)
83% My supervisor listens to what I have to say. (Q. 22)
82% My work unit has the job-relevant knowledge and skills necessary to accomplish organizational goals. (Q. 13)
81% My agency is successful at accomplishing its mission. (Q. 16)
79% My supervisor is committed to a workforce representative of all segments of society. (Q. 20)
78% Supervisors in my work unit support employee development. (Q. 21)
78% Overall, how good a job do you feel is being done by your immediate supervisor? (Q. 25)
Lowest Percentage Level of Agreement
42% In my work unit, steps are taken to deal with a poor performer who cannot or will not improve. (Q. 10)
43% I believe the results of this survey will be used to make my agency a better place to work. (Q. 18)
51% In my work unit, differences in performance are recognized in a meaningful way. (Q. 12)
51% In my organization, senior leaders generate high levels of motivation and commitment in the workforce. (Q. 26)
58% How satisfied are you with your involvement in decisions that affect your work? (Q. 33)
58%How satisfied are you with the information you receive from management on what's going on in your organization? (Q. 34)
59% How satisfied are you with the recognition you receive for doing a good job? (Q. 35)
60%Managers promote communication among different work units (for example, about projects, goals, needed resources). (Q. 29)
61% My organization's senior leaders maintain high standards of honesty and integrity. (Q. 27)
62% I have a high level of respect for my organization's senior leaders. (Q. 31)
Notes: Weighting is done to ensure survey estimates accurately represent the survey population. See Appendix B for more information on survey methods and weighting. Results for items 1-38, excluding item 11, are found in Appendix C.
At a Glance 3
At a Glance (continued)
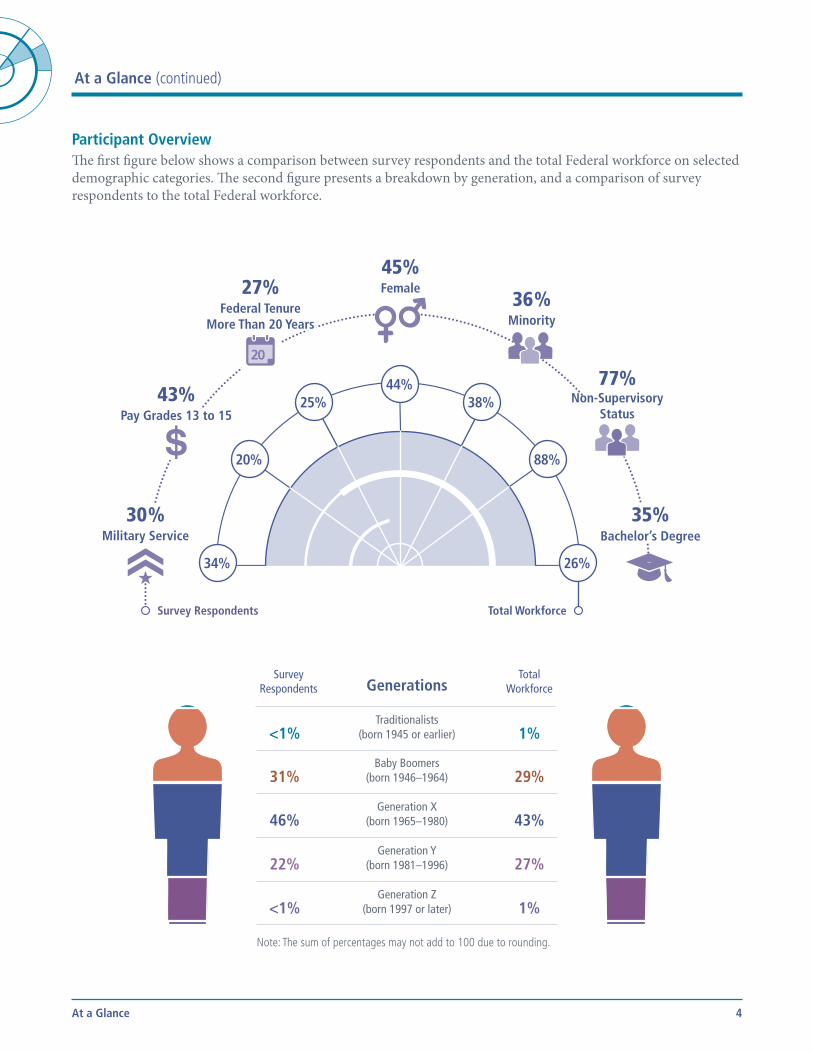
Participant OverviewThe first figure below shows a comparison between survey respondents and the total Federal workforce on selected demographic categories. The second figure presents a breakdown by generation, and a comparison of survey respondents to the total Federal workforce.
Survey Respondents Total Workforce
Military Service
Survey Respondents
30 %
Total Workforce
34%
Pay Grades 13 to 15
Survey Respondents
43%
Total Workforce
20%
20
Federal Tenure More Than 20 Years
Survey Respondents
27%
Total Workforce
25%
Female
Survey Respondents
45%
Total Workforce
44%
Minority
Survey Respondents
36 %
Total Workforce
38% Non-Supervisory Status
Survey Respondents
77%
Total Workforce
88%
Bachelor’s Degree
Survey Respondents
35%
Total Workforce
26%
GenerationsSurvey
RespondentsTotal
Workforce
Traditionalists (born 1945 or earlier)
Survey Respondents
<1%Total Workforce
1%
Baby Boomers (born 1946–1964)
Survey Respondents
31%Total Workforce
29%
Generation X (born 1965–1980)
Survey Respondents
46%Total Workforce
43%
Generation Y (born 1981–1996)
Survey Respondents
22%Total Workforce
27%
Generation Z (born 1997 or later)
Survey Respondents
<1%Total Workforce
1%
Note: The sum of percentages may not add to 100 due to rounding.
At a Glance 4
At a Glance (continued)
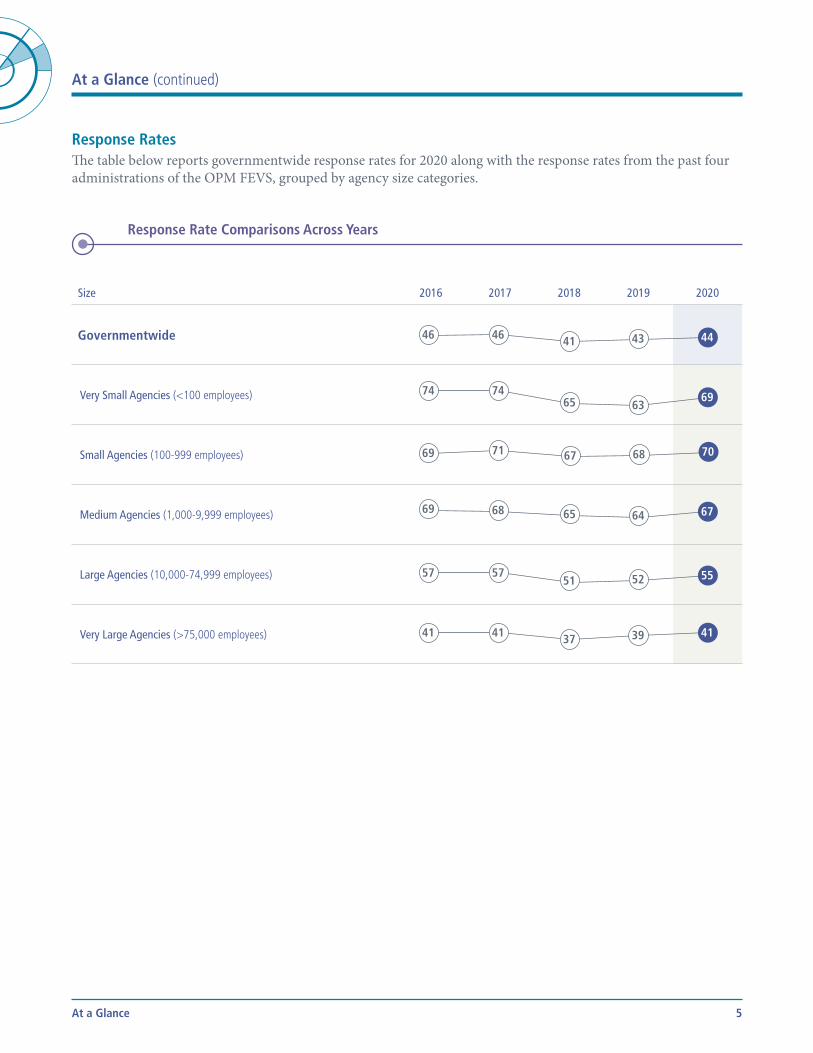
Response RatesThe table below reports governmentwide response rates for 2020 along with the response rates from the past four administrations of the OPM FEVS, grouped by agency size categories.
Response Rate Comparisons Across Years
Size 2016 2017 2018 2019 2020
Governmentwide
46. 46. No change from 2016. 41. Decreased from 2017. 43. Increased from 2018. 44. Increased from 2019.
46 46 41 43 44
Very Small Agencies (<100 employees)
74. 74. No change from 2016. 65. Decreased from 2017. 63. Decreased from 2018. 69. Increased from 2019.
74 7465 63
69
Small Agencies (100-999 employees)
69. 71. Increased from 2016. 67. Decreased from 2017. 68. Increased from 2018. 70. Increased from 2019.
69 71 67 68 70
Medium Agencies (1,000-9,999 employees)
69. 68. Decreased from 2016. 65. Decreased from 2017. 64. Decreased from 2018. 67. Increased from 2019.
69 68 65 64 67
Large Agencies (10,000-74,999 employees)
57. 57. No change from 2016. 51. Decreased from 2017. 52. Increased from 2018. 55. Increased from 2019.
57 5751 52 55
Very Large Agencies (>75,000 employees)
41. 41. No change from 2016. 37. Decreased from 2017. 39. Increased from 2018. 41. Increased from 2019.
41 41 37 39 41
At a Glance 5
At a Glance (continued)
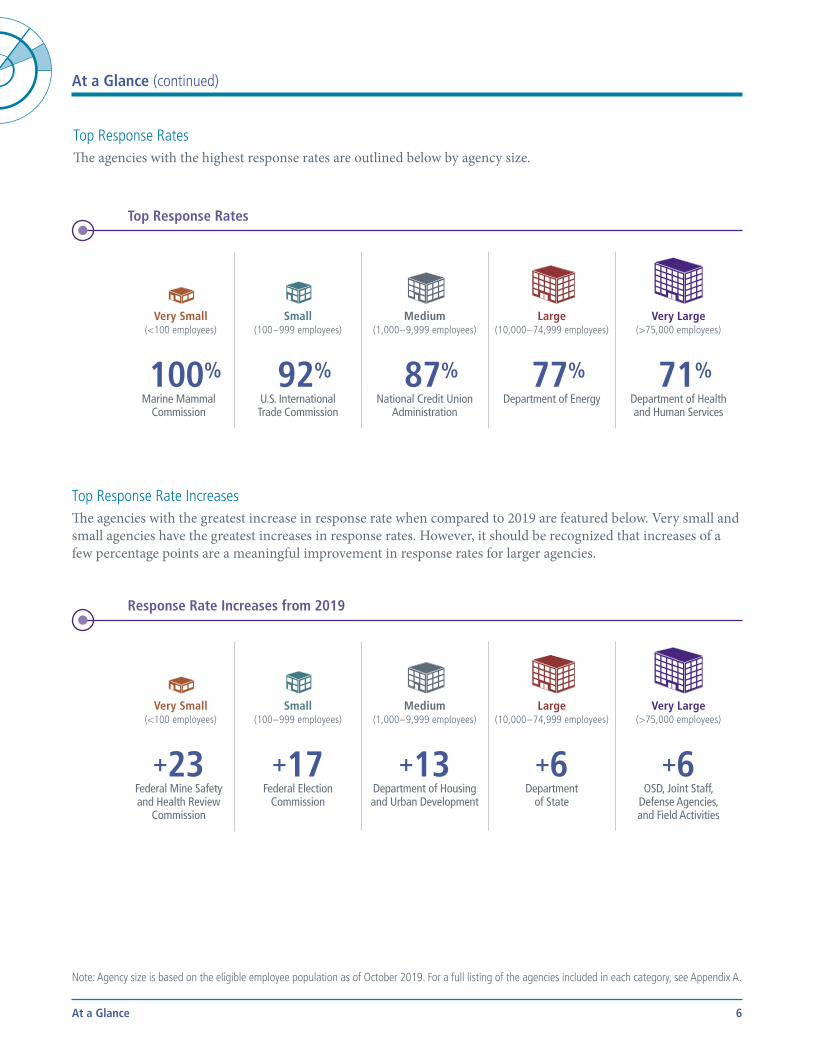
Top Response RatesThe agencies with the highest response rates are outlined below by agency size.
Top Response Rates
Very Small(<100 employees)
100%Marine Mammal
Commission
Small(100 – 999 employees)
92%U.S. International Trade Commission
Medium(1,000 – 9,999 employees)
87%National Credit Union
Administration
Large(10,000 – 74,999 employees)
77%Department of Energy
Very Large(>75,000 employees)
71%Department of Health and Human Services
Top Response Rate IncreasesThe agencies with the greatest increase in response rate when compared to 2019 are featured below. Very small and small agencies have the greatest increases in response rates. However, it should be recognized that increases of a few percentage points are a meaningful improvement in response rates for larger agencies.
Response Rate Increases from 2019
Very Small(<100 employees)
+23Federal Mine Safety and Health Review
Commission
Small(100 – 999 employees)
+17Federal Election
Commission
Medium(1,000 – 9,999 employees)
+13Department of Housing and Urban Development
Large(10,000 – 74,999 employees)
+6Department
of State
Very Large(>75,000 employees)
+6OSD, Joint Staff,
Defense Agencies, and Field Activities
Note: Agency size is based on the eligible employee population as of October 2019. For a full listing of the agencies included in each category, see Appendix A.
At a Glance 6
Creating an Engaging Agency Culture: Understanding the Employee Engagement Index
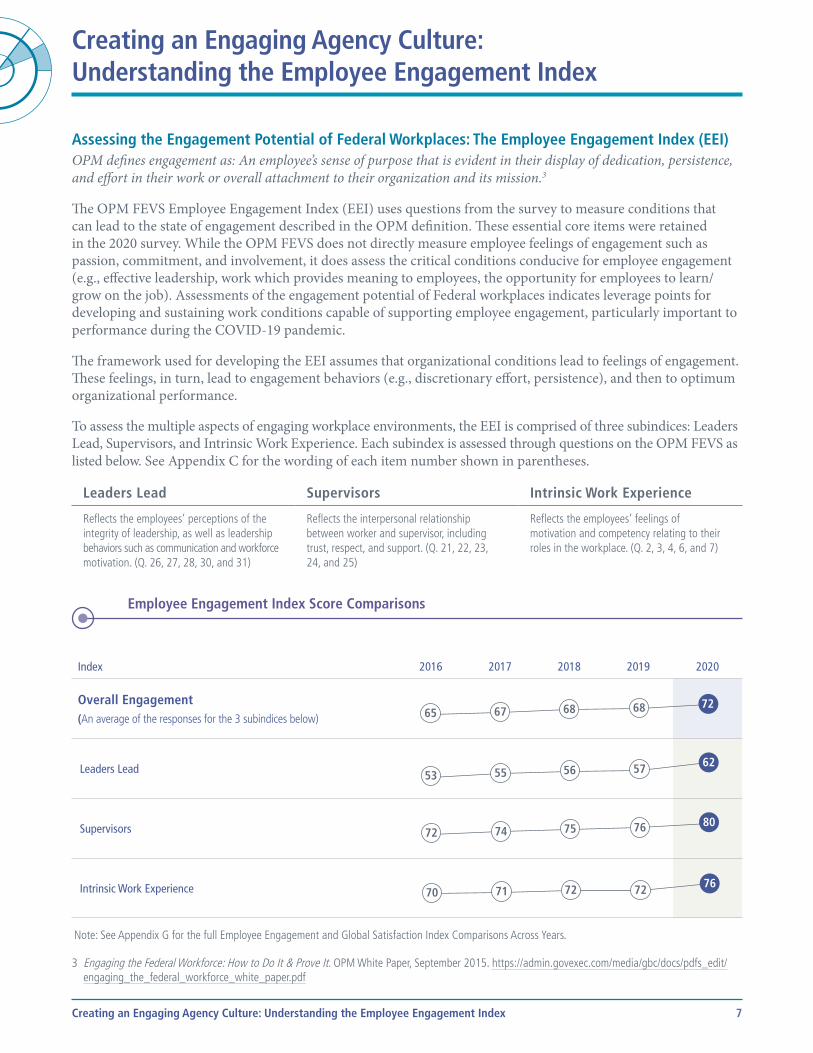
Assessing the Engagement Potential of Federal Workplaces: The Employee Engagement Index (EEI)OPM defines engagement as: An employee’s sense of purpose that is evident in their display of dedication, persistence, and effort in their work or overall attachment to their organization and its mission.3
The OPM FEVS Employee Engagement Index (EEI) uses questions from the survey to measure conditions that can lead to the state of engagement described in the OPM definition. These essential core items were retained in the 2020 survey. While the OPM FEVS does not directly measure employee feelings of engagement such as passion, commitment, and involvement, it does assess the critical conditions conducive for employee engagement (e.g., effective leadership, work which provides meaning to employees, the opportunity for employees to learn/grow on the job). Assessments of the engagement potential of Federal workplaces indicates leverage points for developing and sustaining work conditions capable of supporting employee engagement, particularly important to performance during the COVID-19 pandemic.
The framework used for developing the EEI assumes that organizational conditions lead to feelings of engagement. These feelings, in turn, lead to engagement behaviors (e.g., discretionary effort, persistence), and then to optimum organizational performance.
To assess the multiple aspects of engaging workplace environments, the EEI is comprised of three subindices: Leaders Lead, Supervisors, and Intrinsic Work Experience. Each subindex is assessed through questions on the OPM FEVS as listed below. See Appendix C for the wording of each item number shown in parentheses.
Leaders Lead Supervisors Intrinsic Work Experience
Reflects the employees’ perceptions of the integrity of leadership, as well as leadership behaviors such as communication and workforce motivation. (Q. 26, 27, 28, 30, and 31)
Reflects the interpersonal relationship between worker and supervisor, including trust, respect, and support. (Q. 21, 22, 23, 24, and 25)
Reflects the employees’ feelings of motivation and competency relating to their roles in the workplace. (Q. 2, 3, 4, 6, and 7)
Employee Engagement Index Score Comparisons
Index 2016 2017 2018 2019 2020
Overall Engagement (An average of the responses for the 3 subindices below)
65. 67. Increased from 2016. 68. Increased from 2017. 68. No change from 2018. 72. Increased from 2019.
65 67 68 68 72
Leaders Lead
53. 55. Increased from 2016. 56. Increased from 2017. 57. Increased from 2018. 62. Increased from 2019.
53 55 56 57 62
Supervisors
72. 74. Increased from 2016. 75. Increased from 2017. 76. Increased from 2018. 80. Increased from 2019.
72 74 75 76 80
Intrinsic Work Experience
70. 71. Increased from 2016. 72. Increased from 2017. 72. No change from 2018. 76. Increased from 2019.
70 71 72 72 76
Note: See Appendix G for the full Employee Engagement and Global Satisfaction Index Comparisons Across Years.
3 Engaging the Federal Workforce: How to Do It & Prove It. OPM White Paper, September 2015. https://admin.govexec.com/media/gbc/docs/pdfs_edit/engaging_the_federal_workforce_white_paper.pdf
Creating an Engaging Agency Culture: Understanding the Employee Engagement Index 7
Creating an Engaging Agency Culture: Understanding the Employee Engagement Index (continued)
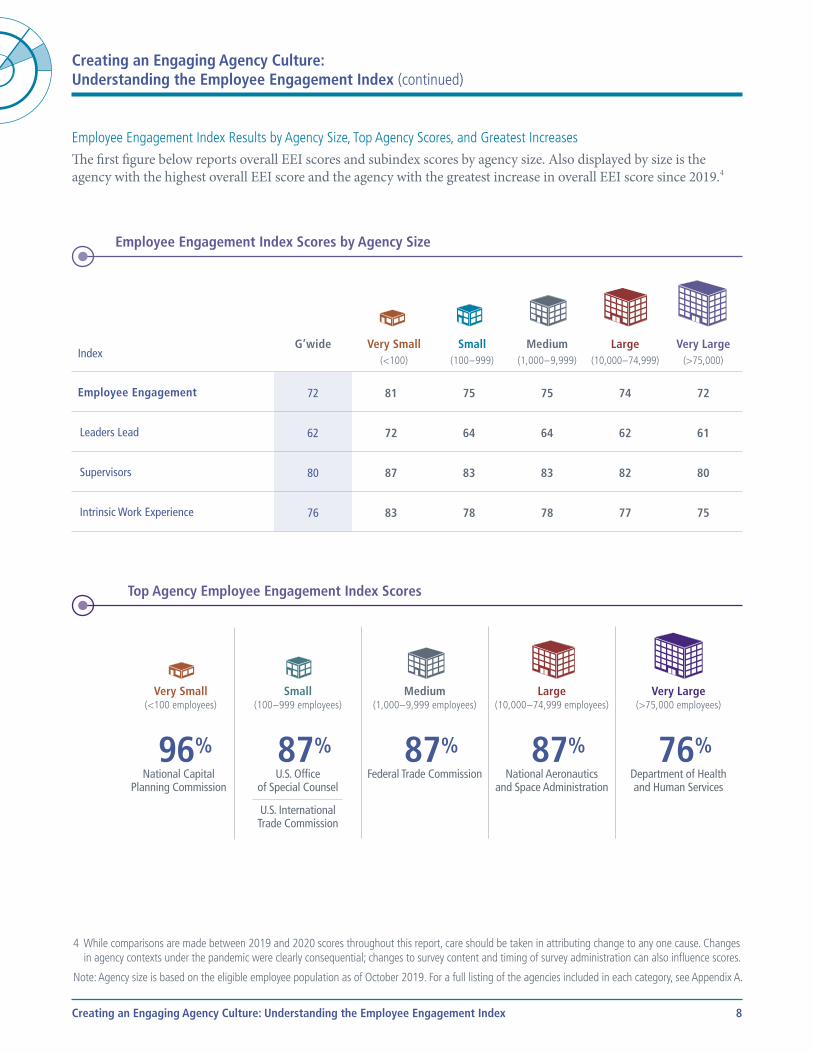
Employee Engagement Index Results by Agency Size, Top Agency Scores, and Greatest Increases
The first figure below reports overall EEI scores and subindex scores by agency size. Also displayed by size is the agency with the highest overall EEI score and the agency with the greatest increase in overall EEI score since 2019.4
Employee Engagement Index Scores by Agency Size
IndexG’wide Very Small
(<100)
Small(100 – 999)
Medium(1,000 – 9,999)
Large(10,000 – 74,999)
Very Large(>75,000)
Employee Engagement 72 81 75 75 74 72
Leaders Lead 62 72 64 64 62 61
Supervisors 80 87 83 83 82 80
Intrinsic Work Experience 76 83 78 78 77 75
Top Agency Employee Engagement Index Scores
Very Small(<100 employees)
96%National Capital
Planning Commission
Small(100 – 999 employees)
87%U.S. Office
of Special Counsel
U.S. International Trade Commission
Medium(1,000 – 9,999 employees)
87%Federal Trade Commission
Large(10,000 – 74,999 employees)
87%National Aeronautics
and Space Administration
Very Large(>75,000 employees)
76%Department of Health and Human Services
4 While comparisons are made between 2019 and 2020 scores throughout this report, care should be taken in attributing change to any one cause. Changes in agency contexts under the pandemic were clearly consequential; changes to survey content and timing of survey administration can also influence scores.
Note: Agency size is based on the eligible employee population as of October 2019. For a full listing of the agencies included in each category, see Appendix A.
Creating an Engaging Agency Culture: Understanding the Employee Engagement Index 8
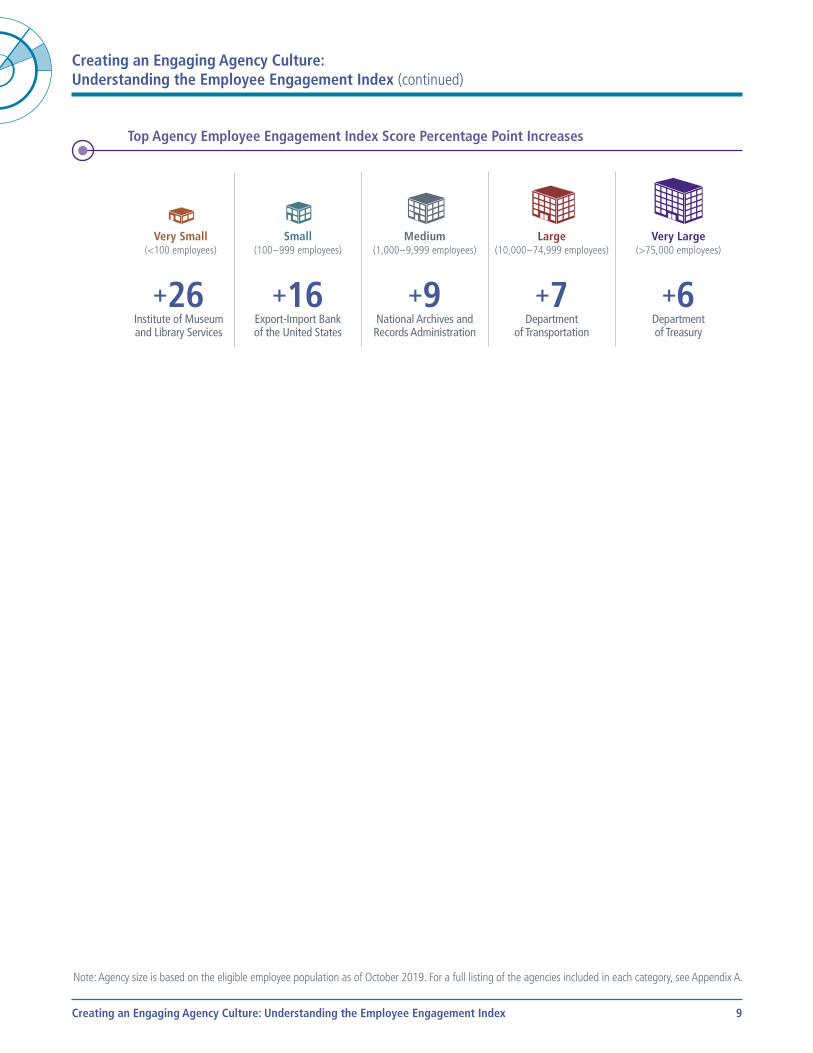
Creating an Engaging Agency Culture: Understanding the Employee Engagement Index (continued)
Top Agency Employee Engagement Index Score Percentage Point Increases
Very Small(<100 employees)
+26Institute of Museum and Library Services
Small(100 – 999 employees)
+16Export-Import Bank of the United States
Medium(1,000 – 9,999 employees)
+9National Archives and Records Administration
Large(10,000 – 74,999 employees)
+7Department
of Transportation
Very Large(>75,000 employees)
+6Department of Treasury
Note: Agency size is based on the eligible employee population as of October 2019. For a full listing of the agencies included in each category, see Appendix A.
Creating an Engaging Agency Culture: Understanding the Employee Engagement Index 9
Core Questions in Regulation
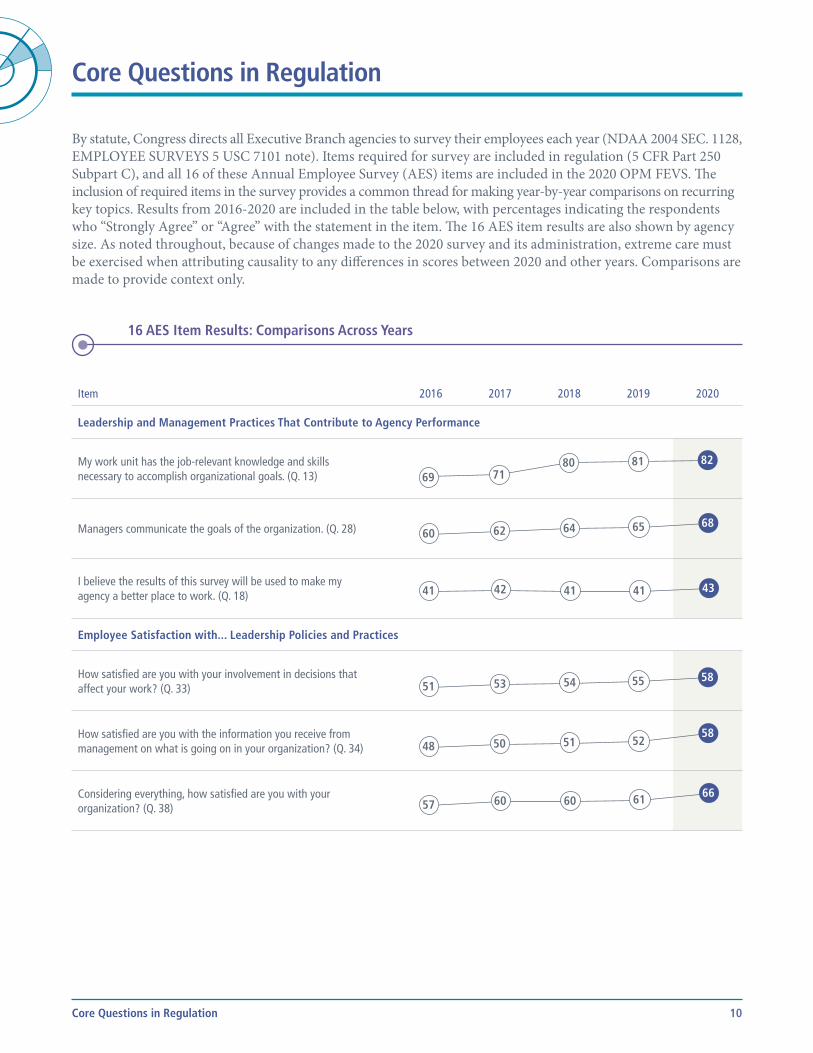
By statute, Congress directs all Executive Branch agencies to survey their employees each year (NDAA 2004 SEC. 1128, EMPLOYEE SURVEYS 5 USC 7101 note). Items required for survey are included in regulation (5 CFR Part 250 Subpart C), and all 16 of these Annual Employee Survey (AES) items are included in the 2020 OPM FEVS. The inclusion of required items in the survey provides a common thread for making year-by-year comparisons on recurring key topics. Results from 2016-2020 are included in the table below, with percentages indicating the respondents who “Strongly Agree” or “Agree” with the statement in the item. The 16 AES item results are also shown by agency size. As noted throughout, because of changes made to the 2020 survey and its administration, extreme care must be exercised when attributing causality to any differences in scores between 2020 and other years. Comparisons are made to provide context only.
16 AES Item Results: Comparisons Across Years
Item 2016 2017 2018 2019 2020
Leadership and Management Practices That Contribute to Agency Performance
My work unit has the job-relevant knowledge and skills necessary to accomplish organizational goals. (Q. 13)
69. 71. Increased from 2016. 80. Increased from 2017. 81. Increased from 2018. 82. Increased from 2019.
69 7180 81 82
Managers communicate the goals of the organization. (Q. 28)
60. 62. Increased from 2016. 64. Increased from 2017. 65. Increased from 2018. 68. Increased from 2019.
60 62 64 65 68
I believe the results of this survey will be used to make my agency a better place to work. (Q. 18)
41. 42. Increased from 2016. 41. Decreased from 2017. 41. No change from 2018. 43. No Change from 2019.
41 42 41 41 43
Employee Satisfaction with... Leadership Policies and Practices
How satisfied are you with your involvement in decisions that affect your work? (Q. 33)
51. 53. Increased from 2016. 54. Increased from 2017. 55. Increased from 2018. 58. Increased from 2019.
51 53 54 55 58
How satisfied are you with the information you receive from management on what is going on in your organization? (Q. 34)
48. 50. Increased from 2016. 51. Increased from 2017. 52. Increased from 2018. 58. Increased from 2019.
48 50 51 5258
Considering everything, how satisfied are you with your organization? (Q. 38)
57. 60. Increased from 2016. 60. No change from 2017. 61. Increased from 2018. 66. Increased from 2019.
57 60 60 61 66
Core Questions in Regulation 10
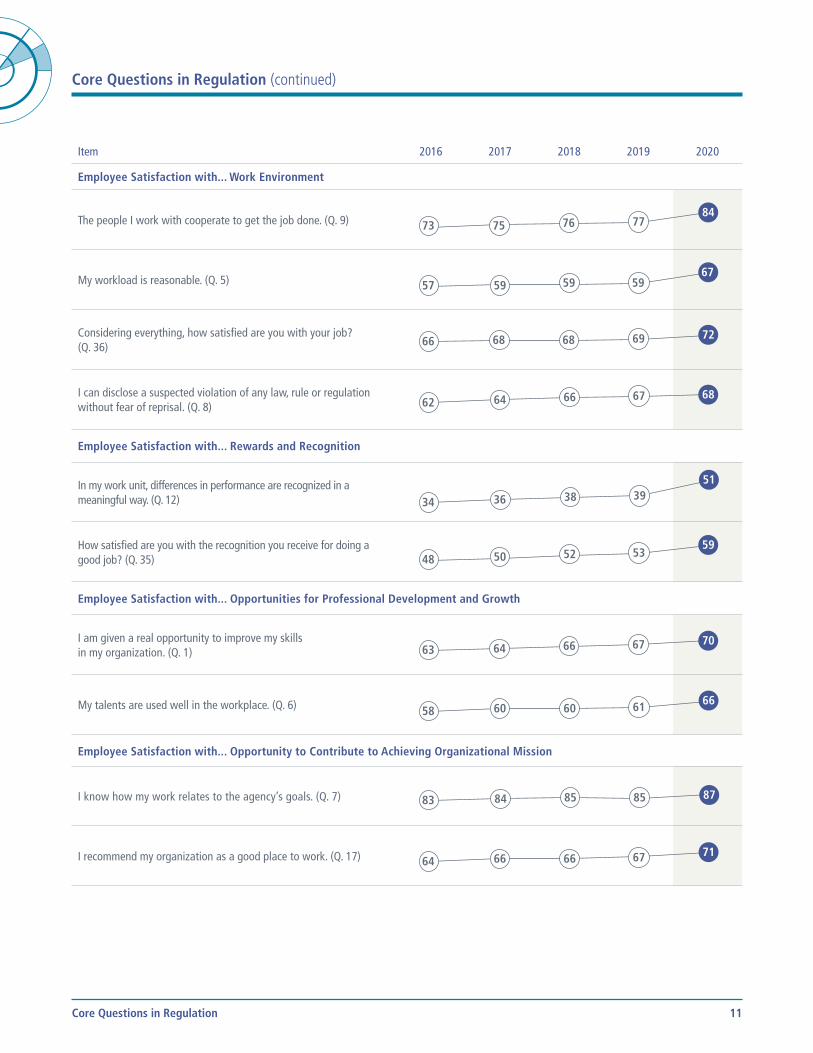
Core Questions in Regulation (continued)
Item 2016 2017 2018 2019 2020
Employee Satisfaction with... Work Environment
The people I work with cooperate to get the job done. (Q. 9)
73. 75. Increased from 2016. 76. Increased from 2017. 77. Increased from 2018. 84. Increased from 2019.
73 75 76 7784
My workload is reasonable. (Q. 5)
57. 59. Increased from 2016. 59. No change from 2017. 59. No Change from 2018. 67. Increased from 2019.
57 59 59 5967
Considering everything, how satisfied are you with your job? (Q. 36)
66. 68. Increased from 2016. 68. No change from 2017. 69. Increased from 2018. 72. Increased from 2019.
66 68 68 69 72
I can disclose a suspected violation of any law, rule or regulation without fear of reprisal. (Q. 8)
62. 64. Increased from 2016. 66. Increased from 2017. 67. Increased from 2018. 68. Increased from 2019.
62 64 66 67 68
Employee Satisfaction with... Rewards and Recognition
In my work unit, differences in performance are recognized in a meaningful way. (Q. 12)
34. 36. Increased from 2016. 38. Increased from 2017. 39. Increased from 2018. 51. Increased from 2019.
34 36 38 3951
How satisfied are you with the recognition you receive for doing a good job? (Q. 35)
48. 50. Increased from 2016. 52. Increased from 2017. 53. Increased from 2018. 59. Increased from 2019.
48 50 52 5359
Employee Satisfaction with... Opportunities for Professional Development and Growth
I am given a real opportunity to improve my skills in my organization. (Q. 1)
63. 64. Increased from 2016. 66. Increased from 2017. 67. Increased from 2018. 70. Increased from 2019.
63 64 66 67 70
My talents are used well in the workplace. (Q. 6)
58. 60. Increased from 2016. 60. No change from 2017. 61. Increased from 2018. 66. Increased from 2019.
58 60 60 61 66
Employee Satisfaction with... Opportunity to Contribute to Achieving Organizational Mission
I know how my work relates to the agency’s goals. (Q. 7)
83. 84. Increased from 2016. 85. Increased from 2017. 85. No change from 2018. 87. Increased from 2019.
83 84 85 85 87
I recommend my organization as a good place to work. (Q. 17)
64. 66. Increased from 2016. 66. No change from 2017. 67. Increased from 2018. 71. Increased from 2019.
64 66 66 67 71
Core Questions in Regulation 11
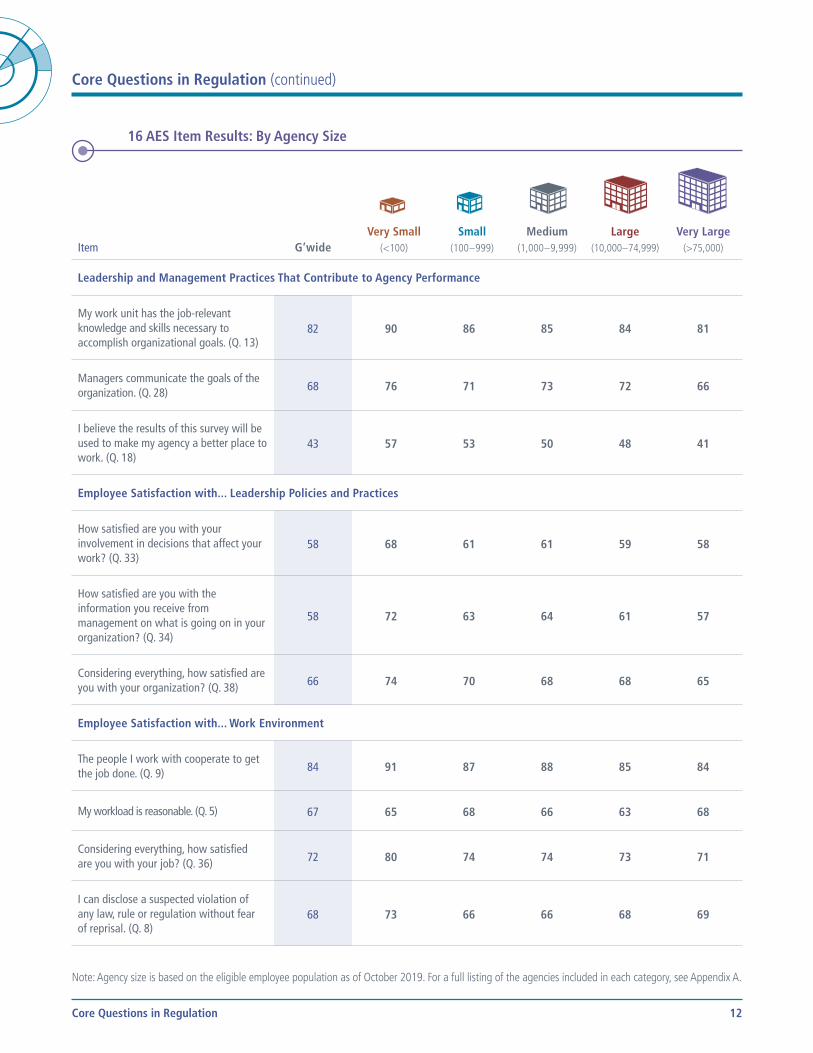
Core Questions in Regulation (continued)
16 AES Item Results: By Agency Size
Item G’wideVery Small
(<100)
Small(100 – 999)
Medium(1,000 – 9,999)
Large(10,000 – 74,999)
Very Large(>75,000)
Leadership and Management Practices That Contribute to Agency Performance
My work unit has the job-relevant knowledge and skills necessary to accomplish organizational goals. (Q. 13)
82 90 86 85 84 81
Managers communicate the goals of the organization. (Q. 28) 68 76 71 73 72 66
I believe the results of this survey will be used to make my agency a better place to work. (Q. 18)
43 57 53 50 48 41
Employee Satisfaction with... Leadership Policies and Practices
How satisfied are you with your involvement in decisions that affect your work? (Q. 33)
58 68 61 61 59 58
How satisfied are you with the information you receive from management on what is going on in your organization? (Q. 34)
58 72 63 64 61 57
Considering everything, how satisfied are you with your organization? (Q. 38) 66 74 70 68 68 65
Employee Satisfaction with... Work Environment
The people I work with cooperate to get the job done. (Q. 9) 84 91 87 88 85 84
My workload is reasonable. (Q. 5) 67 65 68 66 63 68
Considering everything, how satisfied are you with your job? (Q. 36) 72 80 74 74 73 71
I can disclose a suspected violation of any law, rule or regulation without fear of reprisal. (Q. 8)
68 73 66 66 68 69
Note: Agency size is based on the eligible employee population as of October 2019. For a full listing of the agencies included in each category, see Appendix A.
Core Questions in Regulation 12
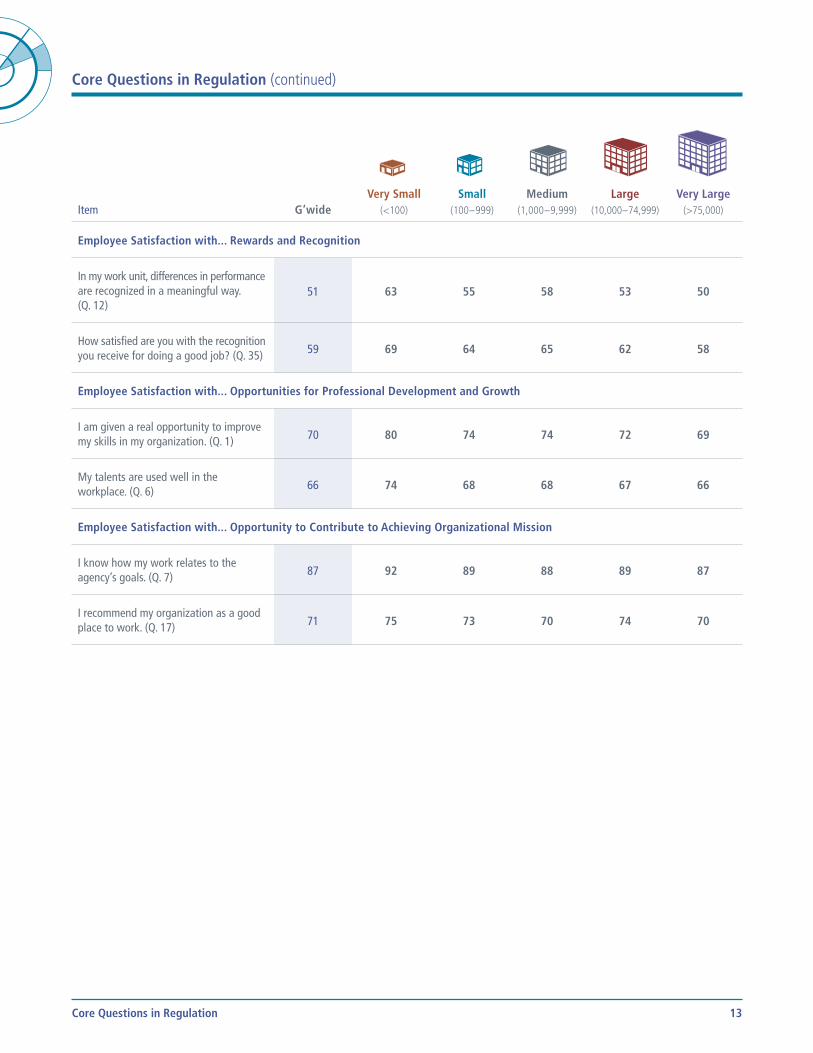
Core Questions in Regulation (continued)
Item G’wideVery Small
(<100)
Small(100 – 999)
Medium(1,000 – 9,999)
Large(10,000 – 74,999)
Very Large(>75,000)
Employee Satisfaction with... Rewards and Recognition
In my work unit, differences in performance are recognized in a meaningful way. (Q. 12)
51 63 55 58 53 50
How satisfied are you with the recognition you receive for doing a good job? (Q. 35) 59 69 64 65 62 58
Employee Satisfaction with... Opportunities for Professional Development and Growth
I am given a real opportunity to improve my skills in my organization. (Q. 1) 70 80 74 74 72 69
My talents are used well in the workplace. (Q. 6) 66 74 68 68 67 66
Employee Satisfaction with... Opportunity to Contribute to Achieving Organizational Mission
I know how my work relates to the agency’s goals. (Q. 7) 87 92 89 88 89 87
I recommend my organization as a good place to work. (Q. 17) 71 75 73 70 74 70
Core Questions in Regulation 13
The COVID-19 Pandemic: Federal Employee Experiences
The COVID-19 pandemic has impacted every aspect of life. The challenges and changes brought by the pandemic have impacted employee work and personal lives in unique ways, including the way employees do their jobs, how managers supervise and coach employees to succeed, personal stresses introduced by child care center closings, isolation from family and friends, and the illness or loss of loved ones.
While no survey can capture the entire range of impacts, OPM added an extensive section to the 2020 OPM FEVS to address some of the challenges and changes employees may have faced as a result of the COVID-19 pandemic. Keep in mind that the survey does not measure mental health or morale, nor are those the objectives of any additions. Added questions were intended to achieve several goals, including:
• ensure a survey responsive to changes to the work environment under the pandemic and needs of agency leadership to understand the impact of those actions;
• capitalize on an important opportunity for data collection to inform policy and guidance;• describe how Federal employees have continued to work and deliver critical services while combating an
unprecedented health crisis; and• engage interagency learning by identifying and sharing examples of effective responses to inform future crisis planning.
Content for the COVID-19 section on the 2020 OPM FEVS was organized as four sections: • Background – identifies strategies employees used to manage their work demands while simultaneously meeting
the personal challenges of the COVID-19 pandemic (e.g., telework, leave).• Employee support – assesses the organizational climate established by leadership to support employee safety and
health and evaluates the need and availability of practices and policies designed to support employee well-being.• Work and COVID-19 – assesses the availability of and employee need for policies, practices, and resources
designed to support employee productivity and continuity of agency operations.• Performance and workplace effectiveness – evaluates the impact of the pandemic on performance-related aspects
of work (e.g., customer service, work quality).
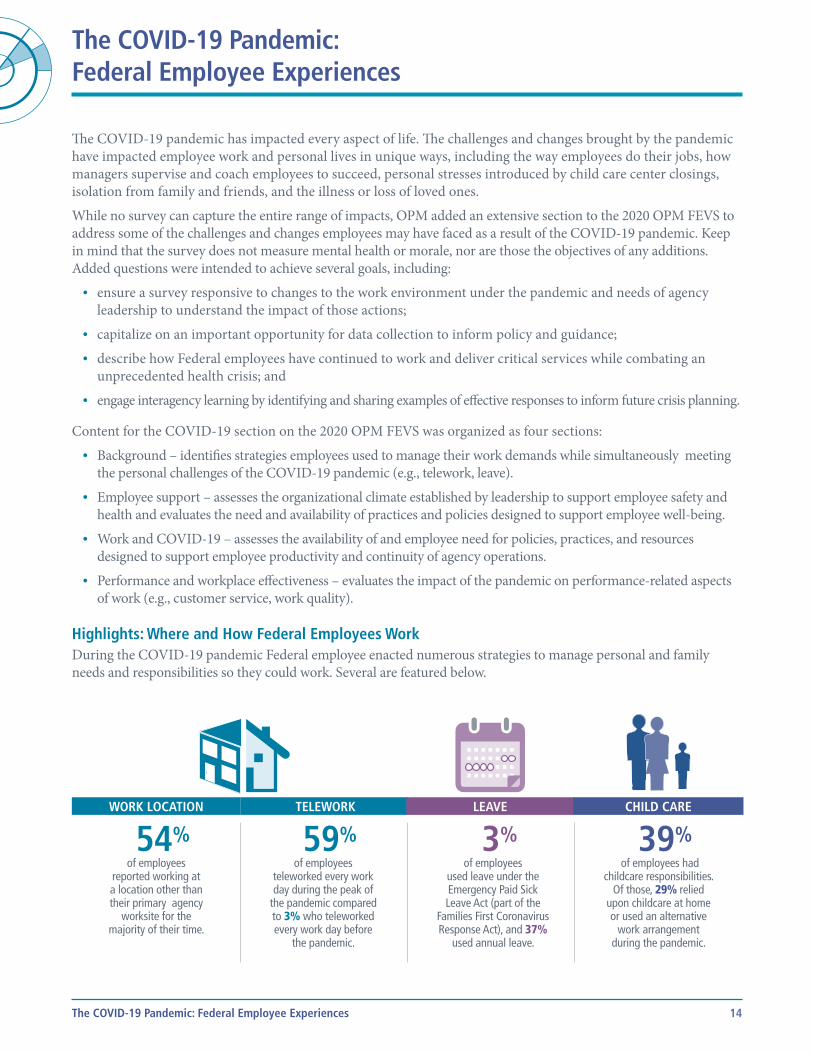
Highlights: Where and How Federal Employees WorkDuring the COVID-19 pandemic Federal employee enacted numerous strategies to manage personal and family needs and responsibilities so they could work. Several are featured below.
WORK LOCATION
54%of employees
reported working at a location other than their primary agency
worksite for the majority of their time.
TELEWORK
59%of employees
teleworked every work day during the peak of
the pandemic compared to 3% who teleworked every work day before
the pandemic.
LEAVE
3%of employees
used leave under the Emergency Paid Sick Leave Act (part of the
Families First Coronavirus Response Act), and 37%
used annual leave.
CHILD CARE
39% of employees had
childcare responsibilities. Of those, 29% relied
upon childcare at home or used an alternative
work arrangement during the pandemic.
The COVID-19 Pandemic: Federal Employee Experiences 14
The COVID-19 Pandemic: Federal Employee Experiences (continued)
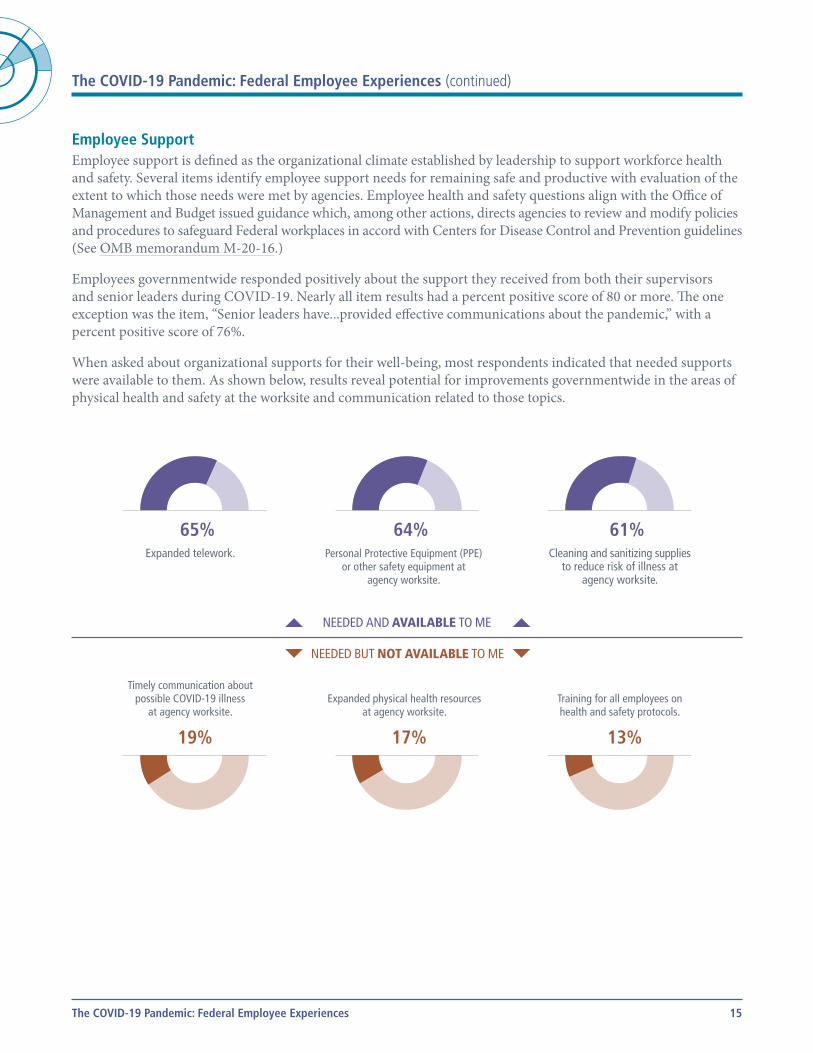
Employee Support Employee support is defined as the organizational climate established by leadership to support workforce health and safety. Several items identify employee support needs for remaining safe and productive with evaluation of the extent to which those needs were met by agencies. Employee health and safety questions align with the Office of Management and Budget issued guidance which, among other actions, directs agencies to review and modify policies and procedures to safeguard Federal workplaces in accord with Centers for Disease Control and Prevention guidelines (See OMB memorandum M-20-16.)
Employees governmentwide responded positively about the support they received from both their supervisors and senior leaders during COVID-19. Nearly all item results had a percent positive score of 80 or more. The one exception was the item, “Senior leaders have...provided effective communications about the pandemic,” with a percent positive score of 76%.
When asked about organizational supports for their well-being, most respondents indicated that needed supports were available to them. As shown below, results reveal potential for improvements governmentwide in the areas of physical health and safety at the worksite and communication related to those topics.
NEEDED AND AVAILABLE TO ME
65%Expanded telework.
64%Personal Protective Equipment (PPE)
or other safety equipment at agency worksite.
61%Cleaning and sanitizing supplies
to reduce risk of illness at agency worksite.
NEEDED BUT NOT AVAILABLE TO ME
19%
Timely communication about possible COVID-19 illness
at agency worksite.
17%
Expanded physical health resources at agency worksite.
13%
Training for all employees on health and safety protocols.
The COVID-19 Pandemic: Federal Employee Experiences 15
The COVID-19 Pandemic: Federal Employee Experiences (continued)
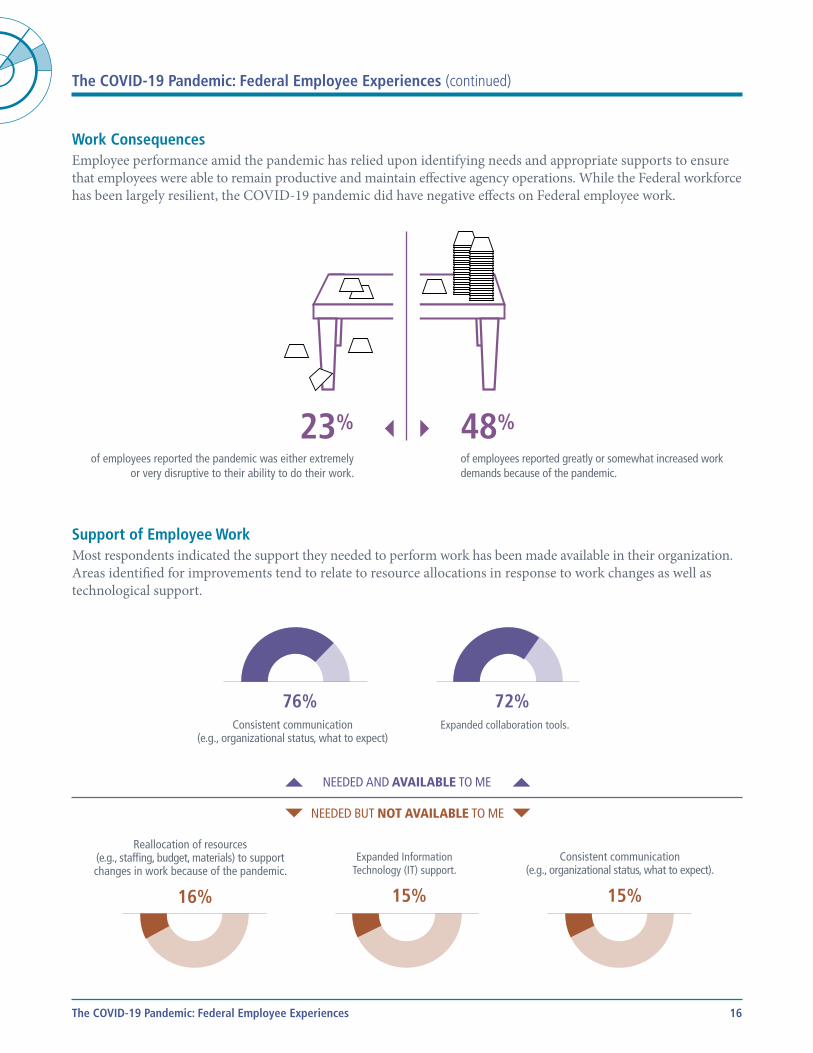
Work Consequences Employee performance amid the pandemic has relied upon identifying needs and appropriate supports to ensure that employees were able to remain productive and maintain effective agency operations. While the Federal workforce has been largely resilient, the COVID-19 pandemic did have negative effects on Federal employee work.
23%
of employees reported the pandemic was either extremely or very disruptive to their ability to do their work.
48%
of employees reported greatly or somewhat increased work demands because of the pandemic.
Support of Employee Work Most respondents indicated the support they needed to perform work has been made available in their organization. Areas identified for improvements tend to relate to resource allocations in response to work changes as well as technological support.
NEEDED AND AVAILABLE TO ME
76%Consistent communication
(e.g., organizational status, what to expect)
72%Expanded collaboration tools.
NEEDED BUT NOT AVAILABLE TO ME
16%
Reallocation of resources (e.g., staffing, budget, materials) to support changes in work because of the pandemic.
15%
Expanded Information Technology (IT) support.
15%
Consistent communication (e.g., organizational status, what to expect).
The COVID-19 Pandemic: Federal Employee Experiences 16
The COVID-19 Pandemic: Federal Employee Experiences (continued)
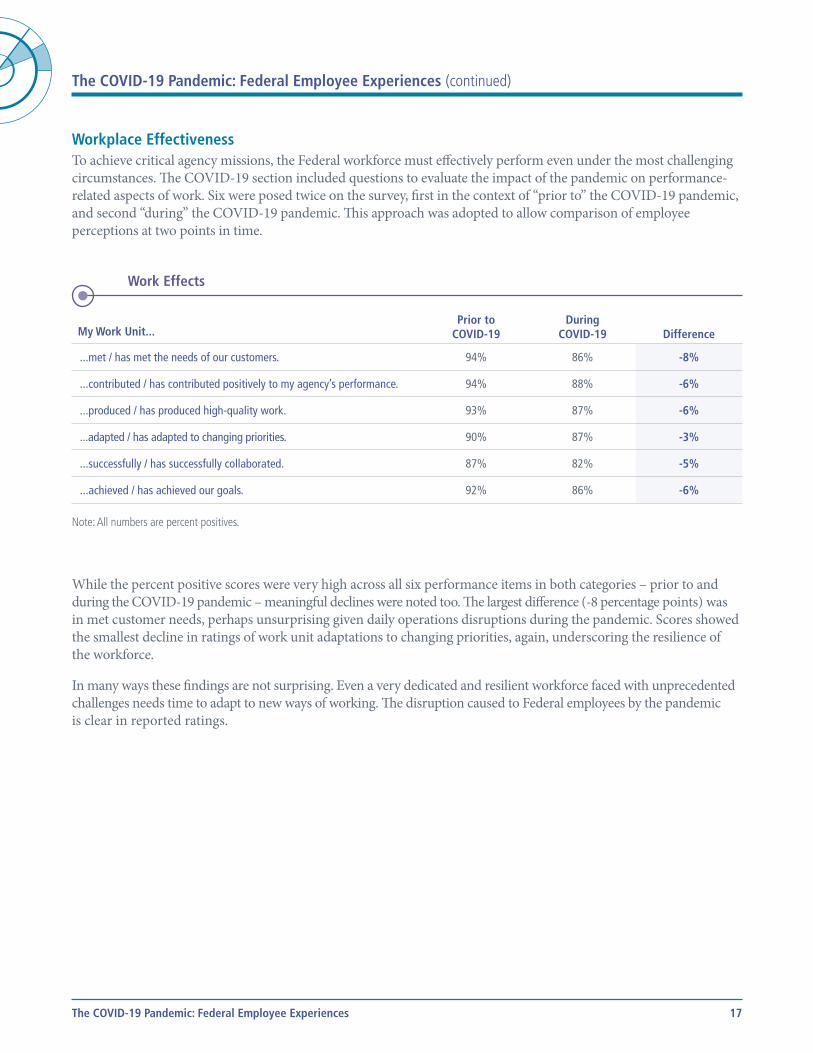
Workplace Effectiveness To achieve critical agency missions, the Federal workforce must effectively perform even under the most challenging circumstances. The COVID-19 section included questions to evaluate the impact of the pandemic on performance-related aspects of work. Six were posed twice on the survey, first in the context of “prior to” the COVID-19 pandemic, and second “during” the COVID-19 pandemic. This approach was adopted to allow comparison of employee perceptions at two points in time.
Work Effects
My Work Unit...Prior to
COVID-19During
COVID-19 Difference
...met / has met the needs of our customers. 94% 86% -8%
...contributed / has contributed positively to my agency’s performance. 94% 88% -6%
...produced / has produced high-quality work. 93% 87% -6%
...adapted / has adapted to changing priorities. 90% 87% -3%
...successfully / has successfully collaborated. 87% 82% -5%
...achieved / has achieved our goals. 92% 86% -6%
Note: All numbers are percent positives.
While the percent positive scores were very high across all six performance items in both categories – prior to and during the COVID-19 pandemic – meaningful declines were noted too. The largest difference (-8 percentage points) was in met customer needs, perhaps unsurprising given daily operations disruptions during the pandemic. Scores showed the smallest decline in ratings of work unit adaptations to changing priorities, again, underscoring the resilience of the workforce.
In many ways these findings are not surprising. Even a very dedicated and resilient workforce faced with unprecedented challenges needs time to adapt to new ways of working. The disruption caused to Federal employees by the pandemic is clear in reported ratings.
The COVID-19 Pandemic: Federal Employee Experiences 17
Leaning Toward the Future: Conclusions and Next Steps
The inclusion of a section in the 2020 OPM FEVS to assess the impact of the COVID-19 pandemic on the Federal workforce was an important step toward achieving OPM goals of a responsive survey, addressing contemporary issues with useful, actionable data resulting. Survey findings overall provide insights for a way forward from 2020 challenges and others that are yet unanticipated.
Survey results show that agency efforts to safely and effectively address challenges introduced by the pandemic did not go unnoticed. Looking at the phased return of employees to their worksites, an encouraging 74% of respondents agreed that agencies made their safety a top priority. Basing perceptions on how COVID-19 has been handled, 73% of respondents also believed their organization will respond effectively to future emergencies.
Employees within individual agencies, however, have had varying workplace experiences during the pandemic. Results by agency will be featured in data reports to be posted on the OPM FEVS website (www.opm.gov/FEVS) and reviewing those forthcoming reports will provide insights into individual agency responses. Findings from successful as well as less effective agency responses to the pandemic provide important opportunities for learning across agencies and a resource across employment sectors.
A major objective for addressing the COVID-19 pandemic in the 2020 OPM FEVS has been to capture Federal employee perceptions as a source for identifying strategies for navigating current and future emergencies. Beneficial next steps should include partnering of leadership with policy experts to review results. Such partnerships will aid in understanding the full implications of OPM FEVS results and guide planning to effectively support the workforce during turbulent times. Results in this report provide a starting point by confirming that timely, consistent, and clear communication is critical to continuity of operations. Planning for future emergencies should also account for disruptions on employee workload, needs, and productivity.
Changes in management practices and policies in responses to the pandemic have driven widespread speculation about how workplaces might look and function post-pandemic. Sweeping changes to agency designs, for example, have meant a substantial portion of Federal employees have worked in technology-mediated contexts, completely remote from traditional worksites. Such changes have profound implications for management of the workforce, with typical questions centering on performance management. Next steps should include review of OPM FEVS results by decision-makers at all levels to identify how workplace innovations can be retained to foster and support an agile workforce capable of performing despite any external disruptions.
Finally, the 2020 OPM FEVS reflects a multi-year initiative to modernize and continuously improve the survey. OPM efforts to ensure content responsive to events and priorities were showcased in 2019 with items added to assess the impact of the partial government shutdown on agency workforces. Substantive changes in 2020 allowed for the addition of entire new sections for evaluating the implications of the COVID-19 pandemic on workforce and agency effectiveness. Changes to survey content are always made in collaboration with subject matter experts and agencies to ensure the best data to meet the widest possible needs. Modernization and improvement will continue to be hallmarks of the OPM FEVS program as we look toward future survey administrations.
Leaning Toward the Future: Conclusions and Next Steps 18
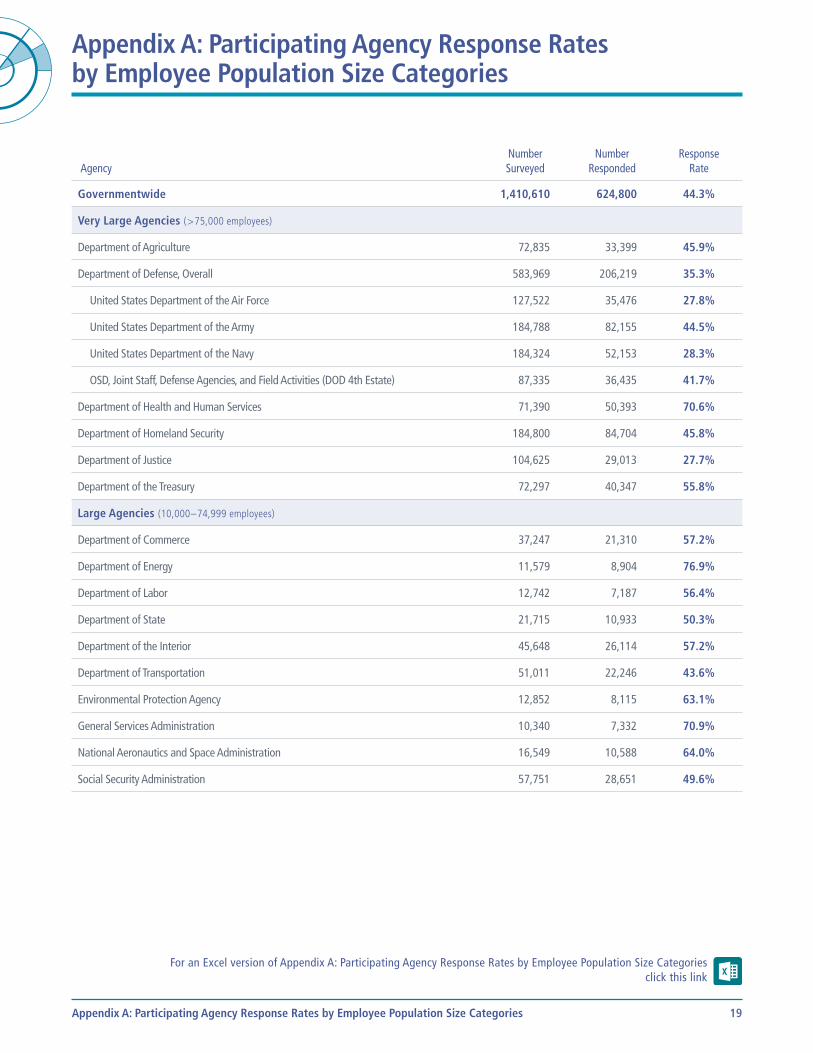
Appendix A: Participating Agency Response Rates by Employee Population Size Categories
AgencyNumber Surveyed
Number Responded
Response Rate
Governmentwide 1,410,610 624,800 44.3%
Very Large Agencies ( > 75,000 employees)
Department of Agriculture 72,835 33,399 45.9%
Department of Defense, Overall 583,969 206,219 35.3%
United States Department of the Air Force 127,522 35,476 27.8%
United States Department of the Army 184,788 82,155 44.5%
United States Department of the Navy 184,324 52,153 28.3%
OSD, Joint Staff, Defense Agencies, and Field Activities (DOD 4th Estate) 87,335 36,435 41.7%
Department of Health and Human Services 71,390 50,393 70.6%
Department of Homeland Security 184,800 84,704 45.8%
Department of Justice 104,625 29,013 27.7%
Department of the Treasury 72,297 40,347 55.8%
Large Agencies (10,000 – 74,999 employees)
Department of Commerce 37,247 21,310 57.2%
Department of Energy 11,579 8,904 76.9%
Department of Labor 12,742 7,187 56.4%
Department of State 21,715 10,933 50.3%
Department of the Interior 45,648 26,114 57.2%
Department of Transportation 51,011 22,246 43.6%
Environmental Protection Agency 12,852 8,115 63.1%
General Services Administration 10,340 7,332 70.9%
National Aeronautics and Space Administration 16,549 10,588 64.0%
Social Security Administration 57,751 28,651 49.6%
For an Excel version of Appendix A: Participating Agency Response Rates by Employee Population Size Categories click this link
Appendix A: Participating Agency Response Rates by Employee Population Size Categories 19
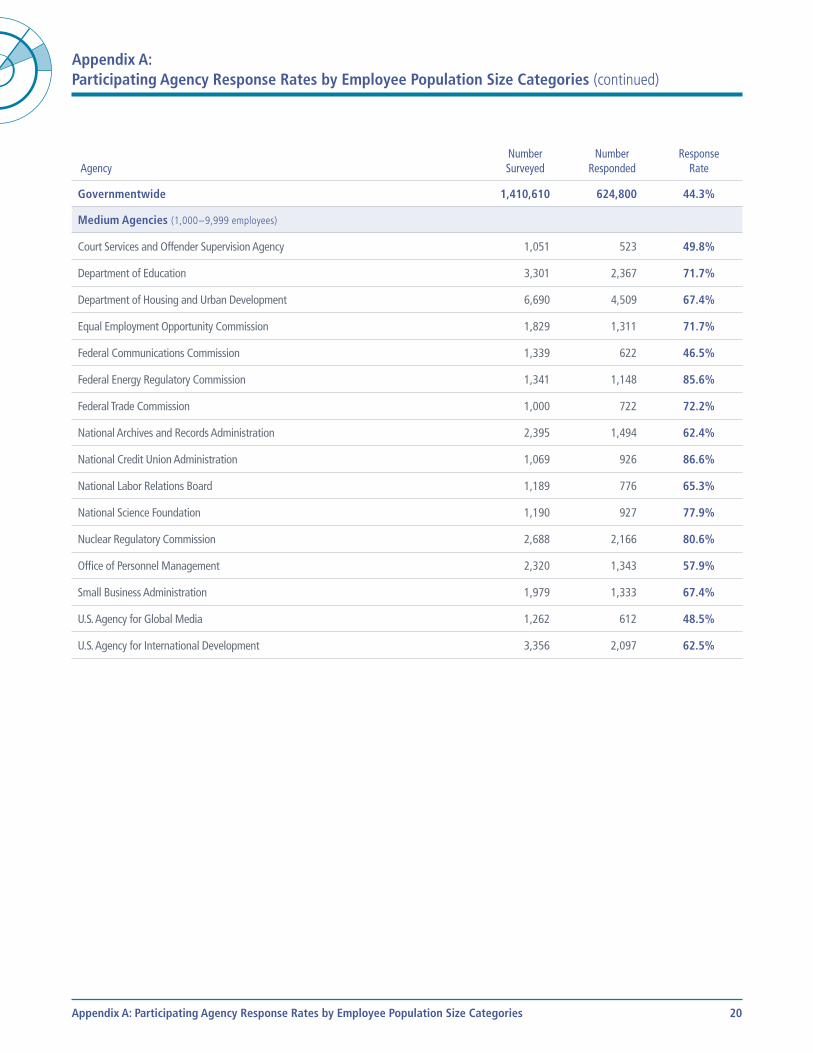
Appendix A: Participating Agency Response Rates by Employee Population Size Categories (continued)
AgencyNumber Surveyed
Number Responded
Response Rate
Governmentwide 1,410,610 624,800 44.3%
Medium Agencies (1,000 – 9,999 employees)
Court Services and Offender Supervision Agency 1,051 523 49.8%
Department of Education 3,301 2,367 71.7%
Department of Housing and Urban Development 6,690 4,509 67.4%
Equal Employment Opportunity Commission 1,829 1,311 71.7%
Federal Communications Commission 1,339 622 46.5%
Federal Energy Regulatory Commission 1,341 1,148 85.6%
Federal Trade Commission 1,000 722 72.2%
National Archives and Records Administration 2,395 1,494 62.4%
National Credit Union Administration 1,069 926 86.6%
National Labor Relations Board 1,189 776 65.3%
National Science Foundation 1,190 927 77.9%
Nuclear Regulatory Commission 2,688 2,166 80.6%
Office of Personnel Management 2,320 1,343 57.9%
Small Business Administration 1,979 1,333 67.4%
U.S. Agency for Global Media 1,262 612 48.5%
U.S. Agency for International Development 3,356 2,097 62.5%
Appendix A: Participating Agency Response Rates by Employee Population Size Categories 20
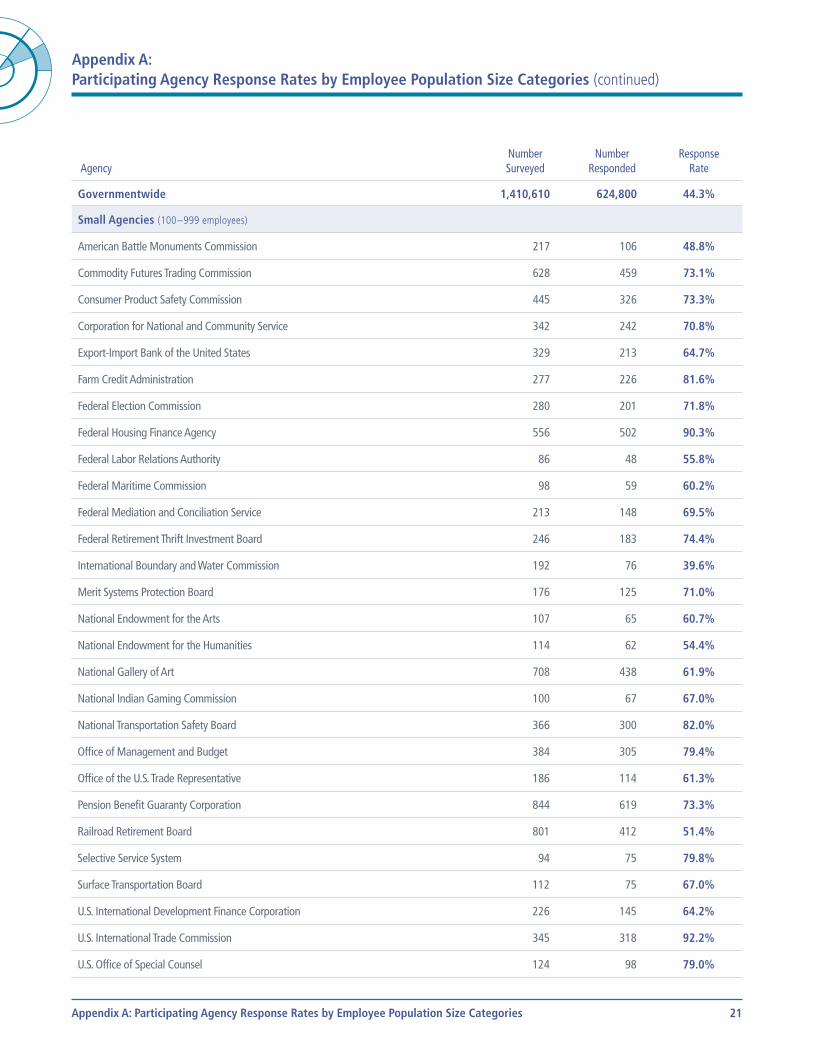
Appendix A: Participating Agency Response Rates by Employee Population Size Categories (continued)
AgencyNumber Surveyed
Number Responded
Response Rate
Governmentwide 1,410,610 624,800 44.3%
Small Agencies (100 – 999 employees)
American Battle Monuments Commission 217 106 48.8%
Commodity Futures Trading Commission 628 459 73.1%
Consumer Product Safety Commission 445 326 73.3%
Corporation for National and Community Service 342 242 70.8%
Export-Import Bank of the United States 329 213 64.7%
Farm Credit Administration 277 226 81.6%
Federal Election Commission 280 201 71.8%
Federal Housing Finance Agency 556 502 90.3%
Federal Labor Relations Authority 86 48 55.8%
Federal Maritime Commission 98 59 60.2%
Federal Mediation and Conciliation Service 213 148 69.5%
Federal Retirement Thrift Investment Board 246 183 74.4%
International Boundary and Water Commission 192 76 39.6%
Merit Systems Protection Board 176 125 71.0%
National Endowment for the Arts 107 65 60.7%
National Endowment for the Humanities 114 62 54.4%
National Gallery of Art 708 438 61.9%
National Indian Gaming Commission 100 67 67.0%
National Transportation Safety Board 366 300 82.0%
Office of Management and Budget 384 305 79.4%
Office of the U.S. Trade Representative 186 114 61.3%
Pension Benefit Guaranty Corporation 844 619 73.3%
Railroad Retirement Board 801 412 51.4%
Selective Service System 94 75 79.8%
Surface Transportation Board 112 75 67.0%
U.S. International Development Finance Corporation 226 145 64.2%
U.S. International Trade Commission 345 318 92.2%
U.S. Office of Special Counsel 124 98 79.0%
Appendix A: Participating Agency Response Rates by Employee Population Size Categories 21
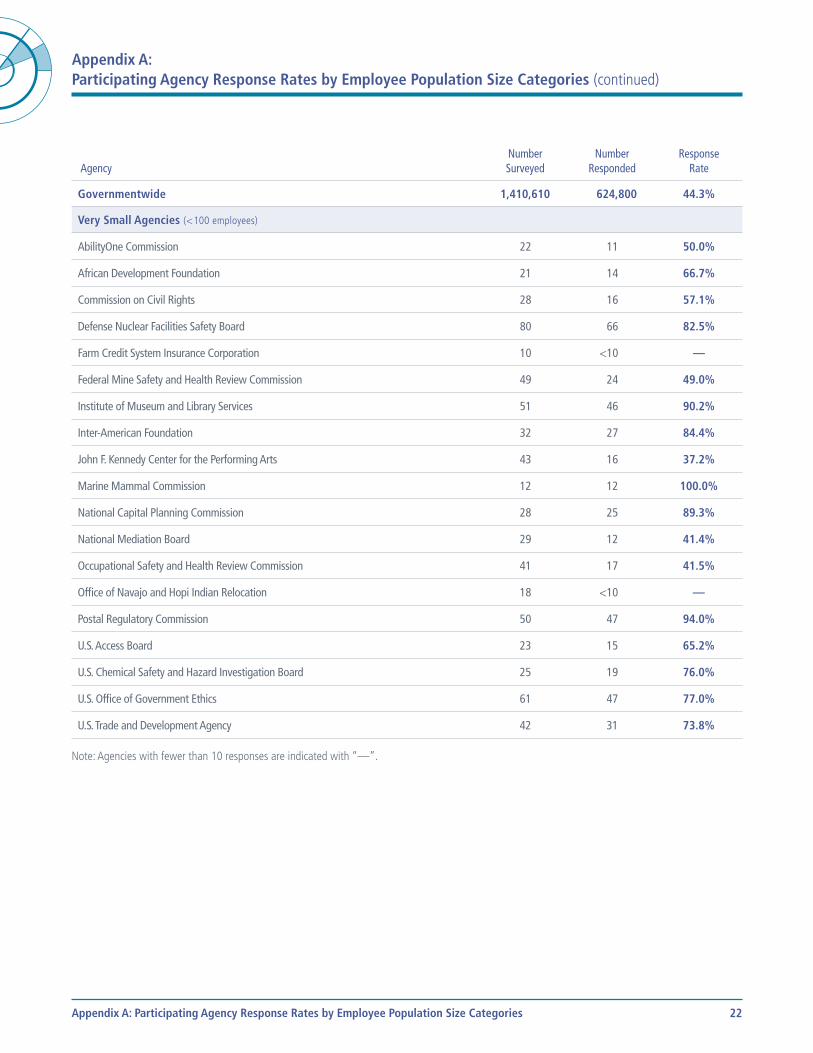
Appendix A: Participating Agency Response Rates by Employee Population Size Categories (continued)
AgencyNumber Surveyed
Number Responded
Response Rate
Governmentwide 1,410,610 624,800 44.3%
Very Small Agencies (< 100 employees)
AbilityOne Commission 22 11 50.0%
African Development Foundation 21 14 66.7%
Commission on Civil Rights 28 16 57.1%
Defense Nuclear Facilities Safety Board 80 66 82.5%
Farm Credit System Insurance Corporation 10 <10 —
Federal Mine Safety and Health Review Commission 49 24 49.0%
Institute of Museum and Library Services 51 46 90.2%
Inter-American Foundation 32 27 84.4%
John F. Kennedy Center for the Performing Arts 43 16 37.2%
Marine Mammal Commission 12 12 100.0%
National Capital Planning Commission 28 25 89.3%
National Mediation Board 29 12 41.4%
Occupational Safety and Health Review Commission 41 17 41.5%
Office of Navajo and Hopi Indian Relocation 18 <10 —
Postal Regulatory Commission 50 47 94.0%
U.S. Access Board 23 15 65.2%
U.S. Chemical Safety and Hazard Investigation Board 25 19 76.0%
U.S. Office of Government Ethics 61 47 77.0%
U.S. Trade and Development Agency 42 31 73.8%
Note: Agencies with fewer than 10 responses are indicated with “—”.
Appendix A: Participating Agency Response Rates by Employee Population Size Categories 22
Appendix B: Analytical Methods and Additional OPM FEVS Reports
Analytical MethodsThe data collected from 2020 survey respondents are weighted to ensure survey estimates accurately represent the survey population. Use of unweighted data could produce biased estimates of population statistics. The final data set reflects the agency composition and demographic makeup of the Federal workforce within plus or minus 1 percentage point. Demographic results are not weighted. OPM employed a number of grouping procedures to simplify presentation of data analysis results in this report. Most of the items had six response categories: Strongly Agree, Agree, Neither Agree nor Disagree, Disagree, Strongly Disagree, and No Basis to Judge/Do Not Know. In some instances, these responses are collapsed into one positive category (Strongly Agree and Agree), one negative category (Strongly Disagree and Disagree), and a neutral category (Neither Agree nor Disagree). For more information on OPM FEVS methods, including data weighting and analysis, see the OPM FEVS Technical Report at www.opm.gov/fevs/reports/technical-reports.
Other OPM FEVS Reports and Governmentwide Data Reports In addition to the Governmentwide Management Report, there are three additional governmentwide data reports available on the OPM FEVS website under “Reports” (access the OPM FEVS website at www.opm.gov/fevs/reports).
Report by Agency
Displays question-by-question counts and percentages for each response option of the OPM FEVS by participating agency and also governmentwide. Reports are available as far back as 2004.
Report by Demographics
Displays question-by-question counts and percentages for each response option of the OPM FEVS by demographic groups and also governmentwide. Reports are available as far back as 2004.
Report on Demographic Questions by Agency (unweighted)
Displays counts and percentages by participating agencies’ demographic and workforce profile (e.g., work location, supervisory status, sex, age, pay category, intention to retire) of the OPM FEVS. Both respondent counts and percentage estimates are unweighted. Reports are available as far back as 2004.
Appendix B: Analytical Methods and Additional OPM FEVS Reports 23
Appendix C: Item Comparisons Across Years
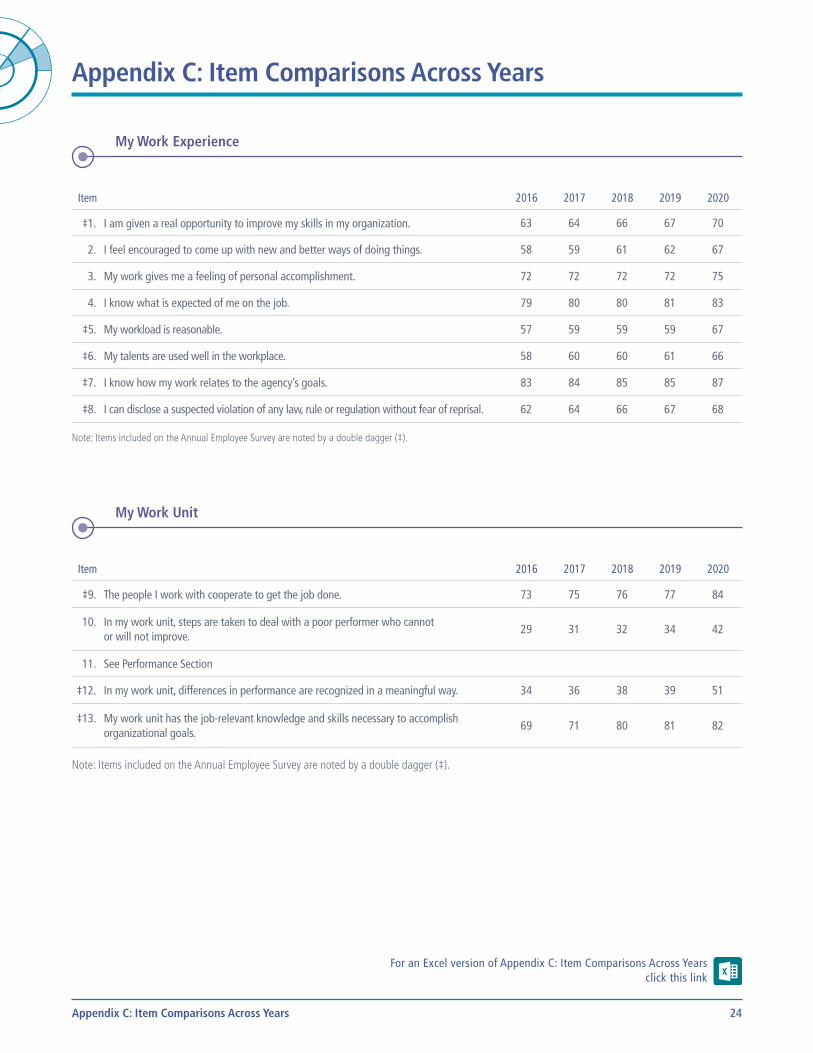
My Work Experience
Item 2016 2017 2018 2019 2020
‡1. I am given a real opportunity to improve my skills in my organization. 63 64 66 67 70
2. I feel encouraged to come up with new and better ways of doing things. 58 59 61 62 67
3. My work gives me a feeling of personal accomplishment. 72 72 72 72 75
4. I know what is expected of me on the job. 79 80 80 81 83
‡5. My workload is reasonable. 57 59 59 59 67
‡6. My talents are used well in the workplace. 58 60 60 61 66
‡7. I know how my work relates to the agency’s goals. 83 84 85 85 87
‡8. I can disclose a suspected violation of any law, rule or regulation without fear of reprisal. 62 64 66 67 68
Note: Items included on the Annual Employee Survey are noted by a double dagger (‡).
My Work Unit
Item 2016 2017 2018 2019 2020
‡9. The people I work with cooperate to get the job done. 73 75 76 77 84
10. In my work unit, steps are taken to deal with a poor performer who cannot or will not improve.
29 31 32 34 42
11. See Performance Section
‡12. In my work unit, differences in performance are recognized in a meaningful way. 34 36 38 39 51
‡13. My work unit has the job-relevant knowledge and skills necessary to accomplish organizational goals.
69 71 80 81 82
Note: Items included on the Annual Employee Survey are noted by a double dagger (‡).
For an Excel version of Appendix C: Item Comparisons Across Years click this link
Appendix C: Item Comparisons Across Years 24
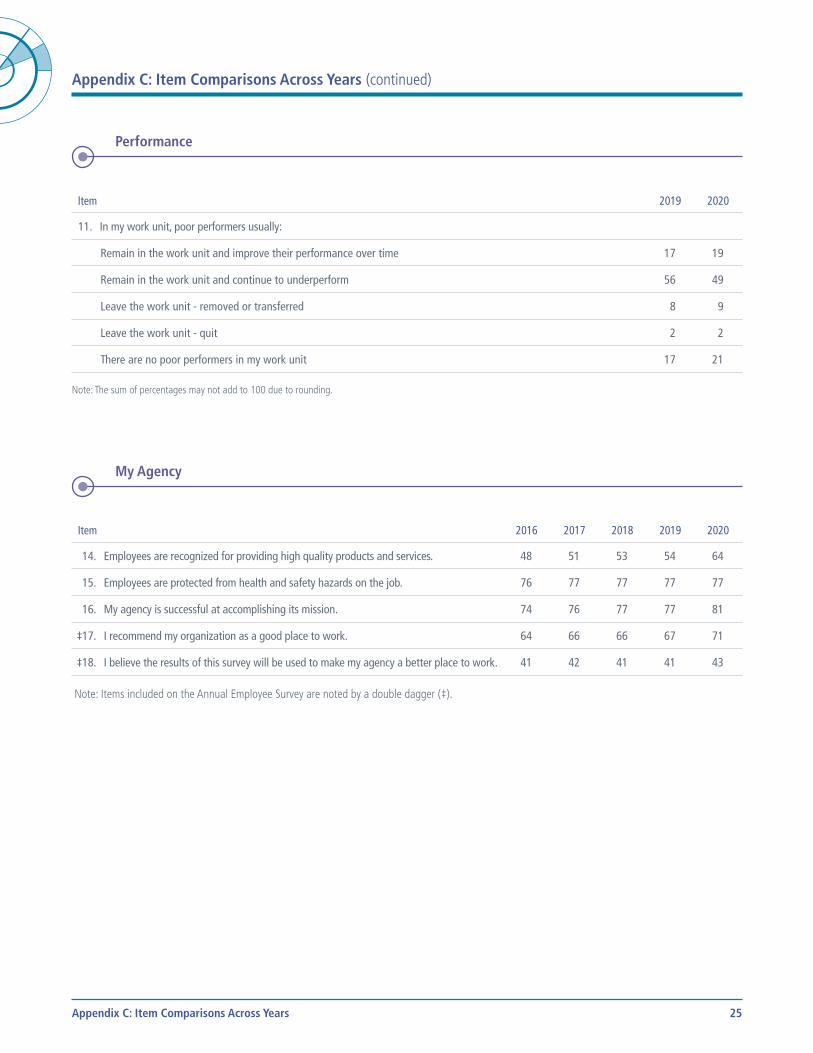
Appendix C: Item Comparisons Across Years (continued)
Performance
Item 2019 2020
11. In my work unit, poor performers usually:
Remain in the work unit and improve their performance over time 17 19
Remain in the work unit and continue to underperform 56 49
Leave the work unit - removed or transferred 8 9
Leave the work unit - quit 2 2
There are no poor performers in my work unit 17 21
Note: The sum of percentages may not add to 100 due to rounding.
My Agency
Item 2016 2017 2018 2019 2020
14. Employees are recognized for providing high quality products and services. 48 51 53 54 64
15. Employees are protected from health and safety hazards on the job. 76 77 77 77 77
16. My agency is successful at accomplishing its mission. 74 76 77 77 81
‡17. I recommend my organization as a good place to work. 64 66 66 67 71
‡18. I believe the results of this survey will be used to make my agency a better place to work. 41 42 41 41 43
Note: Items included on the Annual Employee Survey are noted by a double dagger (‡).
Appendix C: Item Comparisons Across Years 25
Appendix C: Item Comparisons Across Years (continued)
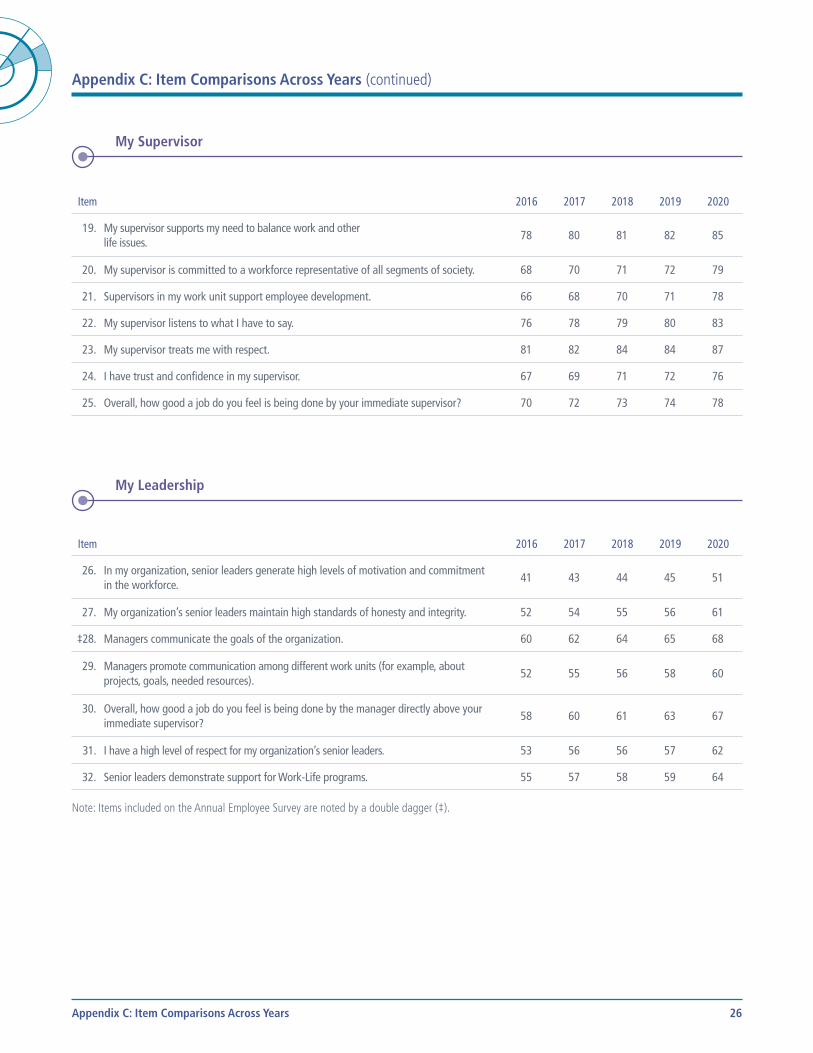
My Supervisor
Item 2016 2017 2018 2019 2020
19. My supervisor supports my need to balance work and other life issues.
78 80 81 82 85
20. My supervisor is committed to a workforce representative of all segments of society. 68 70 71 72 79
21. Supervisors in my work unit support employee development. 66 68 70 71 78
22. My supervisor listens to what I have to say. 76 78 79 80 83
23. My supervisor treats me with respect. 81 82 84 84 87
24. I have trust and confidence in my supervisor. 67 69 71 72 76
25. Overall, how good a job do you feel is being done by your immediate supervisor? 70 72 73 74 78
My Leadership
Item 2016 2017 2018 2019 2020
26. In my organization, senior leaders generate high levels of motivation and commitment in the workforce.
41 43 44 45 51
27. My organization’s senior leaders maintain high standards of honesty and integrity. 52 54 55 56 61
‡28. Managers communicate the goals of the organization. 60 62 64 65 68
29. Managers promote communication among different work units (for example, about projects, goals, needed resources).
52 55 56 58 60
30. Overall, how good a job do you feel is being done by the manager directly above your immediate supervisor?
58 60 61 63 67
31. I have a high level of respect for my organization’s senior leaders. 53 56 56 57 62
32. Senior leaders demonstrate support for Work-Life programs. 55 57 58 59 64
Note: Items included on the Annual Employee Survey are noted by a double dagger (‡).
Appendix C: Item Comparisons Across Years 26
Appendix C: Item Comparisons Across Years (continued)
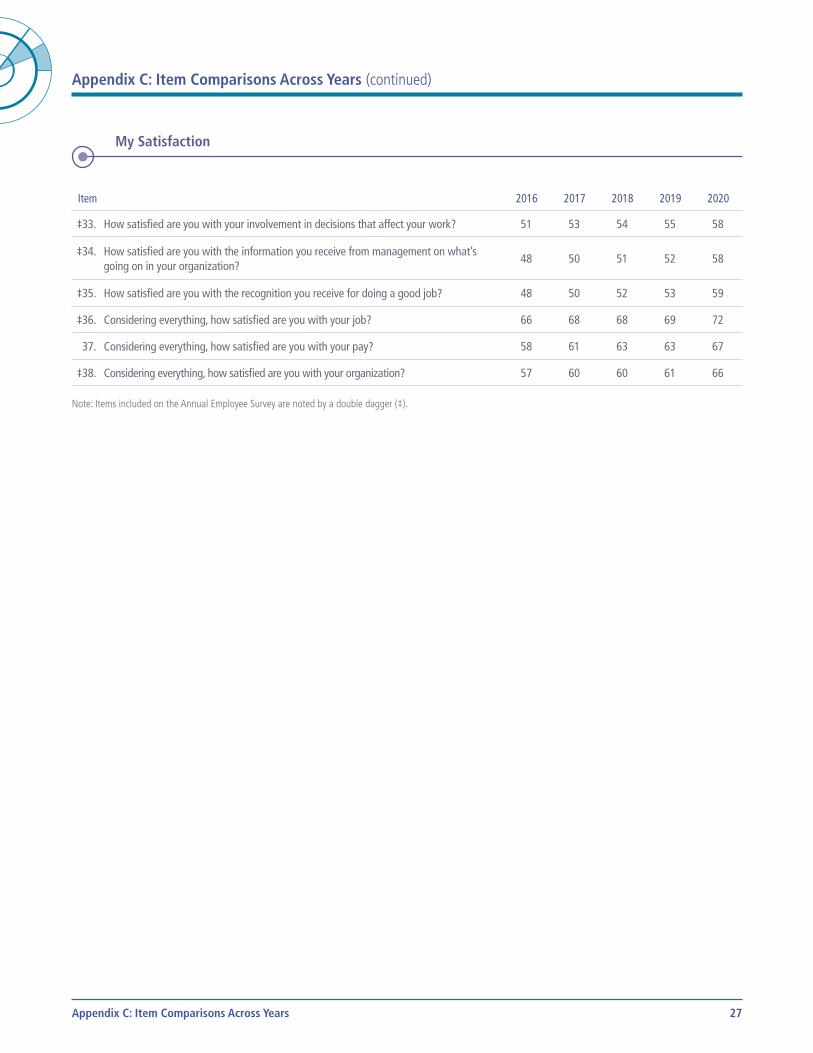
My Satisfaction
Item 2016 2017 2018 2019 2020
‡33. How satisfied are you with your involvement in decisions that affect your work? 51 53 54 55 58
‡34. How satisfied are you with the information you receive from management on what’s going on in your organization?
48 50 51 52 58
‡35. How satisfied are you with the recognition you receive for doing a good job? 48 50 52 53 59
‡36. Considering everything, how satisfied are you with your job? 66 68 68 69 72
37. Considering everything, how satisfied are you with your pay? 58 61 63 63 67
‡38. Considering everything, how satisfied are you with your organization? 57 60 60 61 66
Note: Items included on the Annual Employee Survey are noted by a double dagger (‡).
Appendix C: Item Comparisons Across Years 27
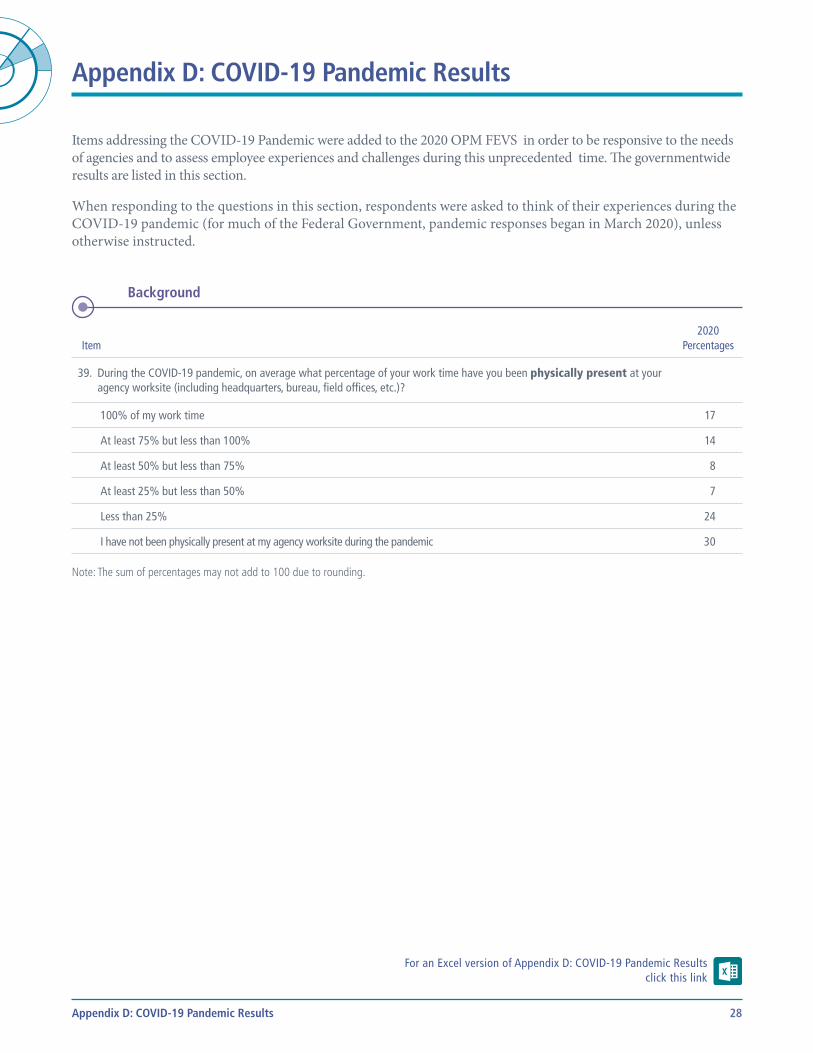
Appendix D: COVID-19 Pandemic Results
Items addressing the COVID-19 Pandemic were added to the 2020 OPM FEVS in order to be responsive to the needs of agencies and to assess employee experiences and challenges during this unprecedented time. The governmentwide results are listed in this section.
When responding to the questions in this section, respondents were asked to think of their experiences during the COVID-19 pandemic (for much of the Federal Government, pandemic responses began in March 2020), unless otherwise instructed.
Background
Item2020
Percentages
39. During the COVID-19 pandemic, on average what percentage of your work time have you been physically present at your agency worksite (including headquarters, bureau, field offices, etc.)?
100% of my work time 17
At least 75% but less than 100% 14
At least 50% but less than 75% 8
At least 25% but less than 50% 7
Less than 25% 24
I have not been physically present at my agency worksite during the pandemic 30
Note: The sum of percentages may not add to 100 due to rounding.
For an Excel version of Appendix D: COVID-19 Pandemic Results click this link
Appendix D: COVID-19 Pandemic Results 28
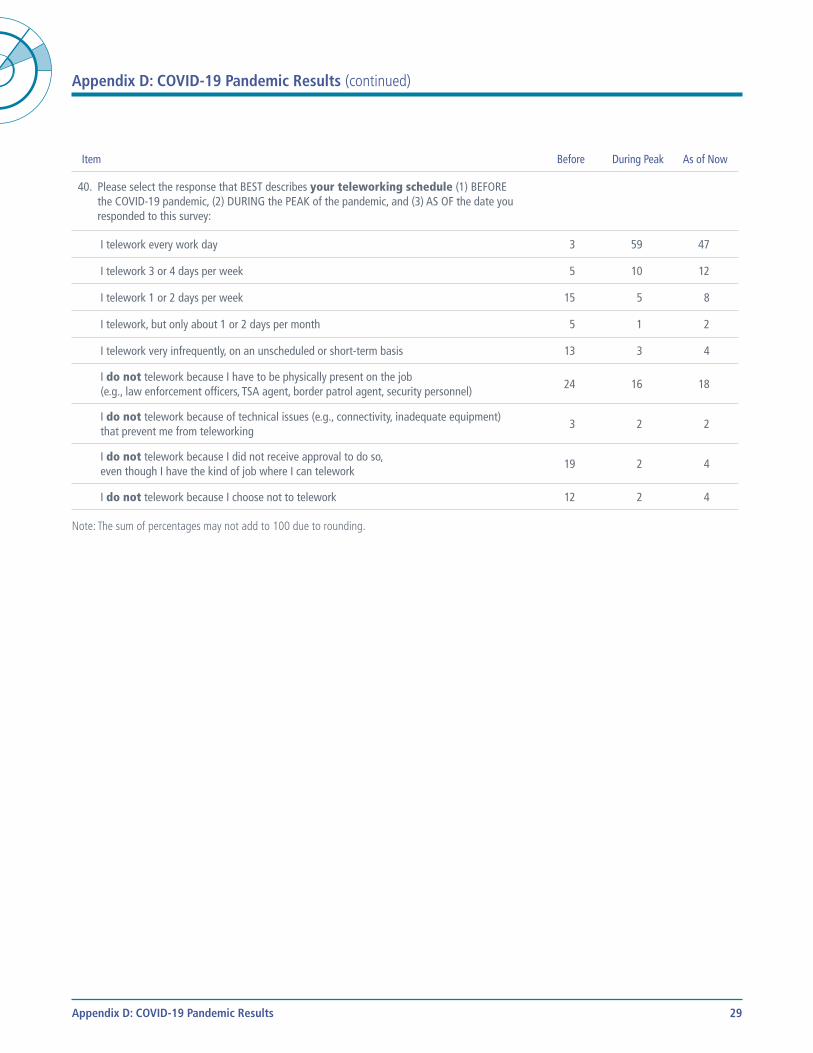
Appendix D: COVID-19 Pandemic Results (continued)
Item Before During Peak As of Now
40. Please select the response that BEST describes your teleworking schedule (1) BEFORE the COVID-19 pandemic, (2) DURING the PEAK of the pandemic, and (3) AS OF the date you responded to this survey:
I telework every work day 3 59 47
I telework 3 or 4 days per week 5 10 12
I telework 1 or 2 days per week 15 5 8
I telework, but only about 1 or 2 days per month 5 1 2
I telework very infrequently, on an unscheduled or short-term basis 13 3 4
I do not telework because I have to be physically present on the job (e.g., law enforcement officers, TSA agent, border patrol agent, security personnel)
24 16 18
I do not telework because of technical issues (e.g., connectivity, inadequate equipment) that prevent me from teleworking
3 2 2
I do not telework because I did not receive approval to do so, even though I have the kind of job where I can telework
19 2 4
I do not telework because I choose not to telework 12 2 4
Note: The sum of percentages may not add to 100 due to rounding.
Appendix D: COVID-19 Pandemic Results 29
Appendix D: COVID-19 Pandemic Results (continued)
Item2020
Percentages
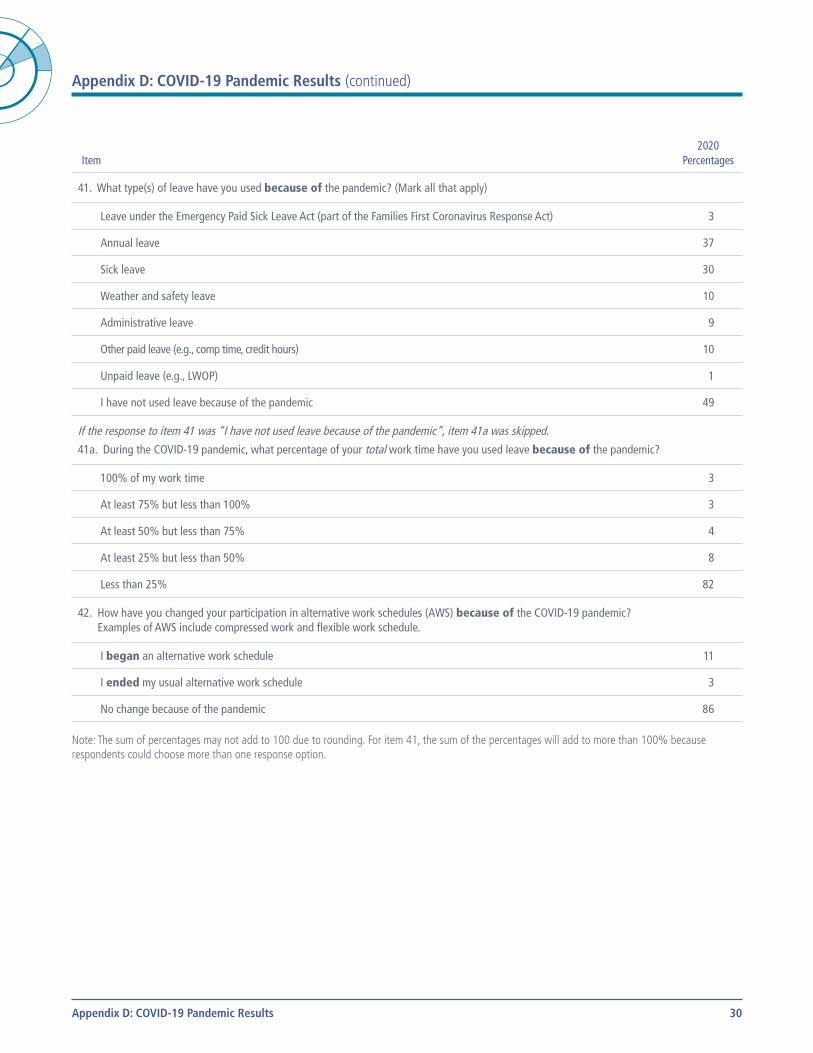
41. What type(s) of leave have you used because of the pandemic? (Mark all that apply)
Leave under the Emergency Paid Sick Leave Act (part of the Families First Coronavirus Response Act) 3
Annual leave 37
Sick leave 30
Weather and safety leave 10
Administrative leave 9
Other paid leave (e.g., comp time, credit hours) 10
Unpaid leave (e.g., LWOP) 1
I have not used leave because of the pandemic 49
If the response to item 41 was “I have not used leave because of the pandemic”, item 41a was skipped.
41a. During the COVID-19 pandemic, what percentage of your total work time have you used leave because of the pandemic?
100% of my work time 3
At least 75% but less than 100% 3
At least 50% but less than 75% 4
At least 25% but less than 50% 8
Less than 25% 82
42. How have you changed your participation in alternative work schedules (AWS) because of the COVID-19 pandemic? Examples of AWS include compressed work and flexible work schedule.
I began an alternative work schedule 11
I ended my usual alternative work schedule 3
No change because of the pandemic 86
Note: The sum of percentages may not add to 100 due to rounding. For item 41, the sum of the percentages will add to more than 100% because respondents could choose more than one response option.
Appendix D: COVID-19 Pandemic Results 30
Appendix D: COVID-19 Pandemic Results (continued)
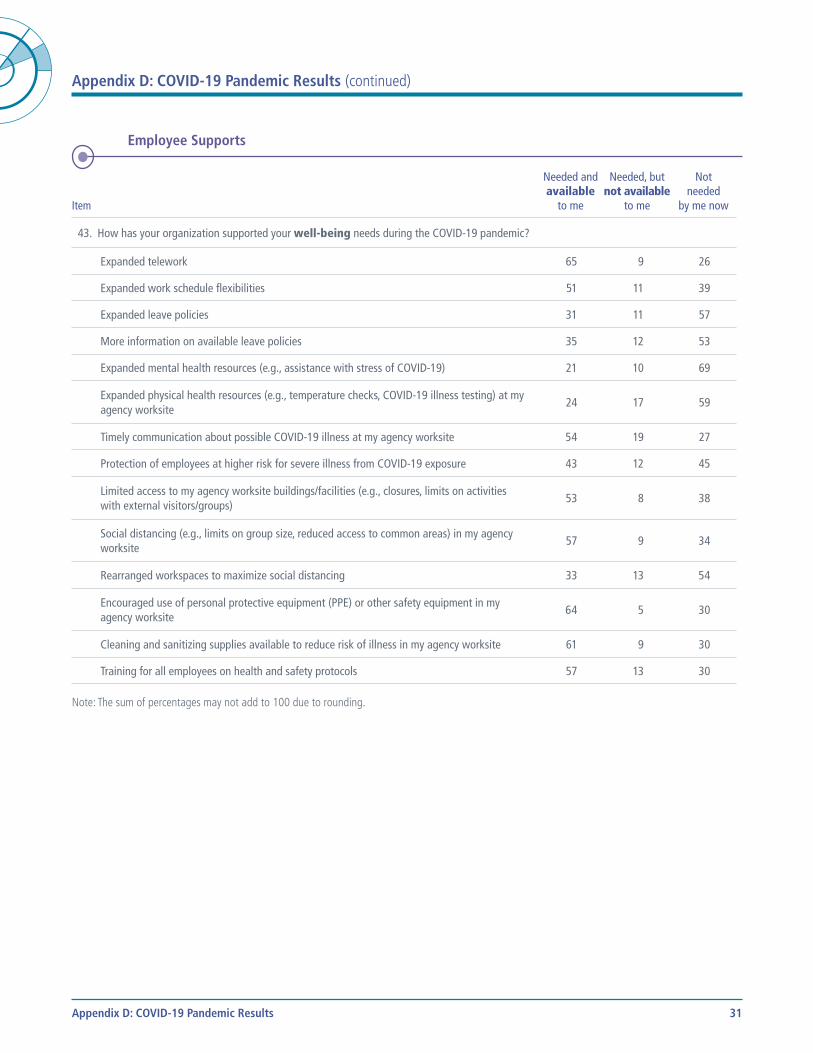
Employee Supports
Item
Needed and available
to me
Needed, but not available
to me
Not needed
by me now
43. How has your organization supported your well-being needs during the COVID-19 pandemic?
Expanded telework 65 9 26
Expanded work schedule flexibilities 51 11 39
Expanded leave policies 31 11 57
More information on available leave policies 35 12 53
Expanded mental health resources (e.g., assistance with stress of COVID-19) 21 10 69
Expanded physical health resources (e.g., temperature checks, COVID-19 illness testing) at my agency worksite
24 17 59
Timely communication about possible COVID-19 illness at my agency worksite 54 19 27
Protection of employees at higher risk for severe illness from COVID-19 exposure 43 12 45
Limited access to my agency worksite buildings/facilities (e.g., closures, limits on activities with external visitors/groups)
53 8 38
Social distancing (e.g., limits on group size, reduced access to common areas) in my agency worksite
57 9 34
Rearranged workspaces to maximize social distancing 33 13 54
Encouraged use of personal protective equipment (PPE) or other safety equipment in my agency worksite
64 5 30
Cleaning and sanitizing supplies available to reduce risk of illness in my agency worksite 61 9 30
Training for all employees on health and safety protocols 57 13 30
Note: The sum of percentages may not add to 100 due to rounding.
Appendix D: COVID-19 Pandemic Results 31
Appendix D: COVID-19 Pandemic Results (continued)
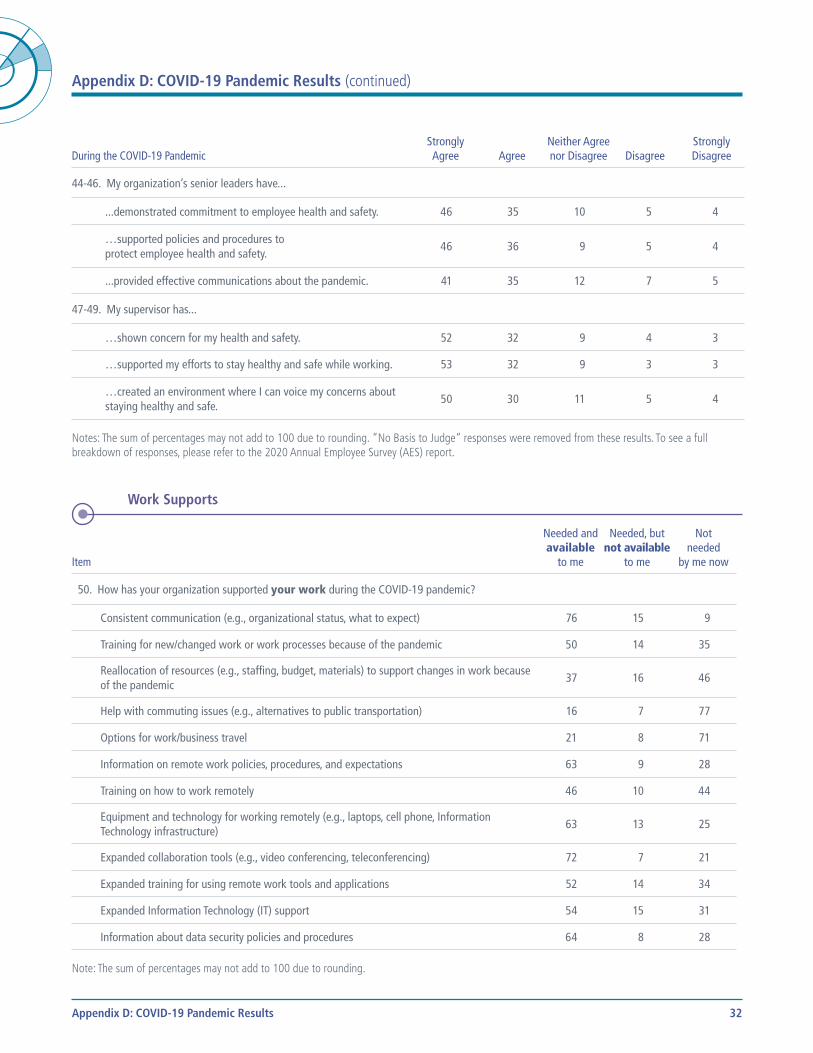
During the COVID-19 PandemicStrongly Agree Agree
Neither Agree nor Disagree Disagree
Strongly Disagree
44-46. My organization’s senior leaders have...
...demonstrated commitment to employee health and safety. 46 35 10 5 4
…supported policies and procedures to protect employee health and safety.
46 36 9 5 4
...provided effective communications about the pandemic. 41 35 12 7 5
47-49. My supervisor has...
…shown concern for my health and safety. 52 32 9 4 3
…supported my efforts to stay healthy and safe while working. 53 32 9 3 3
…created an environment where I can voice my concerns about staying healthy and safe.
50 30 11 5 4
Notes: The sum of percentages may not add to 100 due to rounding. ”No Basis to Judge” responses were removed from these results. To see a full breakdown of responses, please refer to the 2020 Annual Employee Survey (AES) report.
Work Supports
Item
Needed and available
to me
Needed, but not available
to me
Not needed
by me now
50. How has your organization supported your work during the COVID-19 pandemic?
Consistent communication (e.g., organizational status, what to expect) 76 15 9
Training for new/changed work or work processes because of the pandemic 50 14 35
Reallocation of resources (e.g., staffing, budget, materials) to support changes in work because of the pandemic
37 16 46
Help with commuting issues (e.g., alternatives to public transportation) 16 7 77
Options for work/business travel 21 8 71
Information on remote work policies, procedures, and expectations 63 9 28
Training on how to work remotely 46 10 44
Equipment and technology for working remotely (e.g., laptops, cell phone, Information Technology infrastructure)
63 13 25
Expanded collaboration tools (e.g., video conferencing, teleconferencing) 72 7 21
Expanded training for using remote work tools and applications 52 14 34
Expanded Information Technology (IT) support 54 15 31
Information about data security policies and procedures 64 8 28
Note: The sum of percentages may not add to 100 due to rounding.
Appendix D: COVID-19 Pandemic Results 32
Appendix D: COVID-19 Pandemic Results (continued)
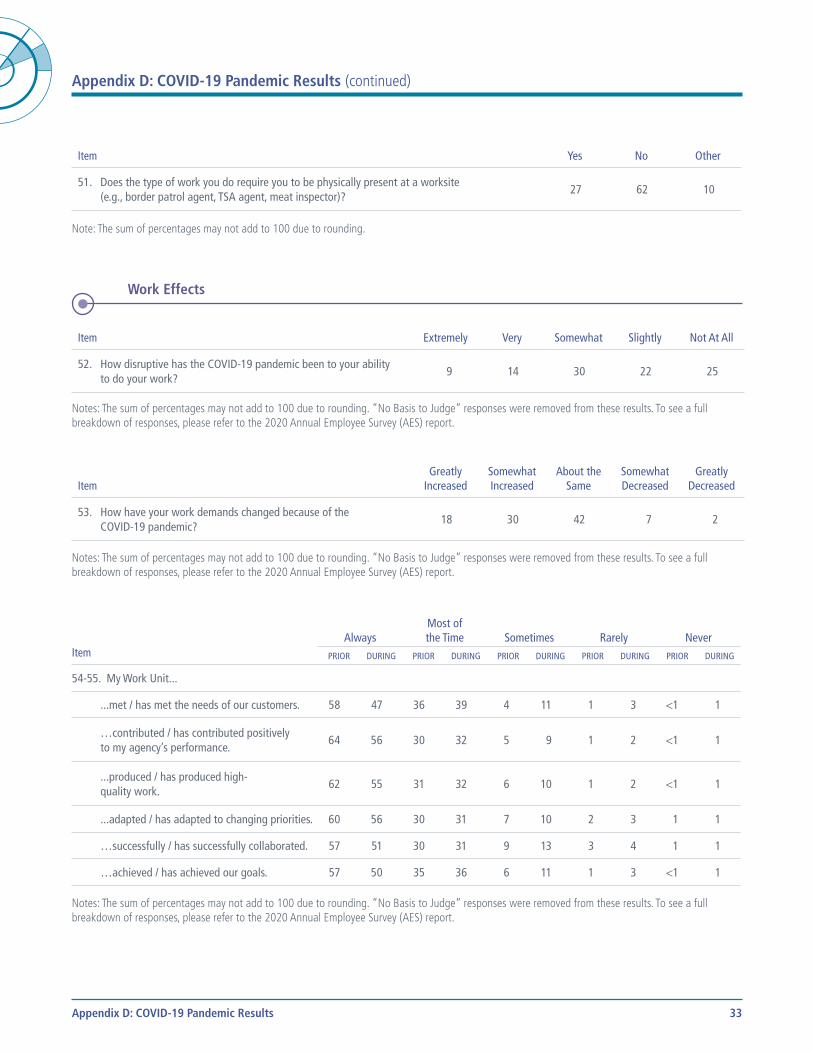
Item Yes No Other
51. Does the type of work you do require you to be physically present at a worksite (e.g., border patrol agent, TSA agent, meat inspector)?
27 62 10
Note: The sum of percentages may not add to 100 due to rounding.
Work Effects
Item Extremely Very Somewhat Slightly Not At All
52. How disruptive has the COVID-19 pandemic been to your ability to do your work?
9 14 30 22 25
Notes: The sum of percentages may not add to 100 due to rounding. ”No Basis to Judge” responses were removed from these results. To see a full breakdown of responses, please refer to the 2020 Annual Employee Survey (AES) report.
ItemGreatly
IncreasedSomewhat Increased
About the Same
Somewhat Decreased
Greatly Decreased
53. How have your work demands changed because of the COVID-19 pandemic?
18 30 42 7 2
Notes: The sum of percentages may not add to 100 due to rounding. ”No Basis to Judge” responses were removed from these results. To see a full breakdown of responses, please refer to the 2020 Annual Employee Survey (AES) report.
ItemAlways
Most of the Time Sometimes Rarely Never
PRIOR DURING PRIOR DURING PRIOR DURING PRIOR DURING PRIOR DURING
54-55. My Work Unit...
...met / has met the needs of our customers. 58 47 36 39 4 11 1 3 <1 1
…contributed / has contributed positively to my agency’s performance.
64 56 30 32 5 9 1 2 <1 1
...produced / has produced high-quality work.
62 55 31 32 6 10 1 2 <1 1
...adapted / has adapted to changing priorities. 60 56 30 31 7 10 2 3 1 1
…successfully / has successfully collaborated. 57 51 30 31 9 13 3 4 1 1
…achieved / has achieved our goals. 57 50 35 36 6 11 1 3 <1 1
Notes: The sum of percentages may not add to 100 due to rounding. ”No Basis to Judge” responses were removed from these results. To see a full breakdown of responses, please refer to the 2020 Annual Employee Survey (AES) report.
Appendix D: COVID-19 Pandemic Results 33
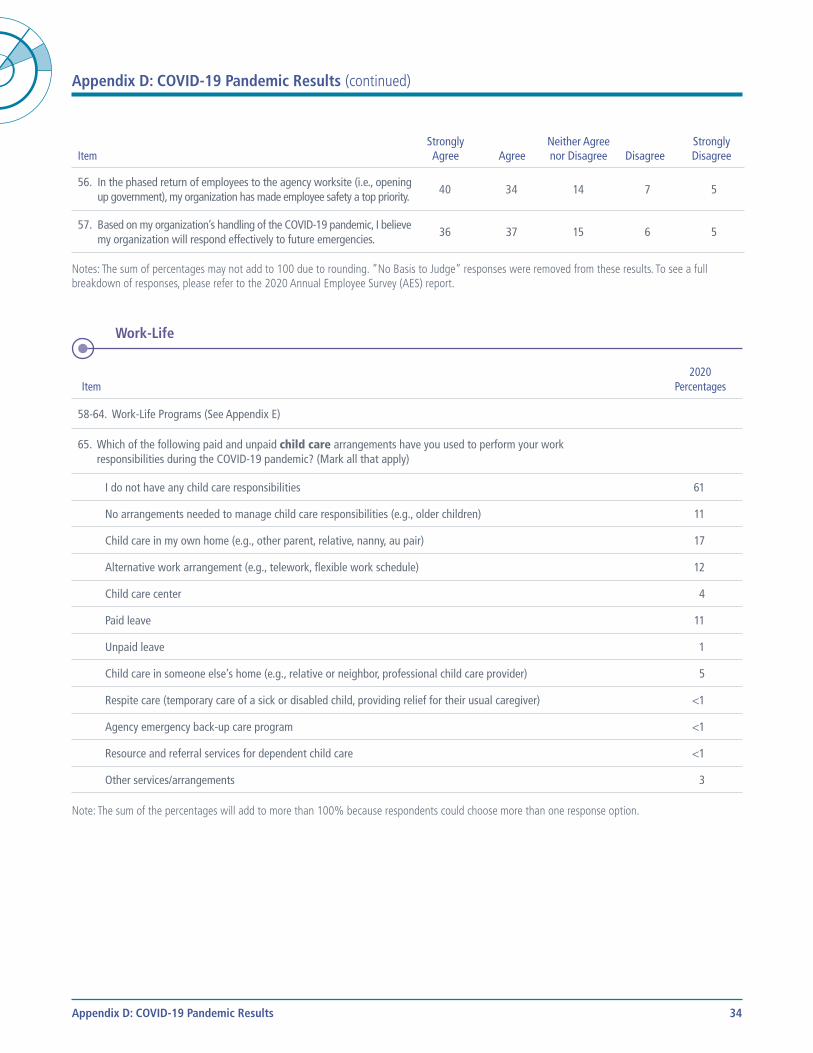
Appendix D: COVID-19 Pandemic Results (continued)
ItemStrongly Agree Agree
Neither Agree nor Disagree Disagree
Strongly Disagree
56. In the phased return of employees to the agency worksite (i.e., opening up government), my organization has made employee safety a top priority.
40 34 14 7 5
57. Based on my organization’s handling of the COVID-19 pandemic, I believe my organization will respond effectively to future emergencies.
36 37 15 6 5
Notes: The sum of percentages may not add to 100 due to rounding. ”No Basis to Judge” responses were removed from these results. To see a full breakdown of responses, please refer to the 2020 Annual Employee Survey (AES) report.
Work-Life
Item2020
Percentages
58-64. Work-Life Programs (See Appendix E)
65. Which of the following paid and unpaid child care arrangements have you used to perform your work responsibilities during the COVID-19 pandemic? (Mark all that apply)
I do not have any child care responsibilities 61
No arrangements needed to manage child care responsibilities (e.g., older children) 11
Child care in my own home (e.g., other parent, relative, nanny, au pair) 17
Alternative work arrangement (e.g., telework, flexible work schedule) 12
Child care center 4
Paid leave 11
Unpaid leave 1
Child care in someone else’s home (e.g., relative or neighbor, professional child care provider) 5
Respite care (temporary care of a sick or disabled child, providing relief for their usual caregiver) <1
Agency emergency back-up care program <1
Resource and referral services for dependent child care <1
Other services/arrangements 3
Note: The sum of the percentages will add to more than 100% because respondents could choose more than one response option.
Appendix D: COVID-19 Pandemic Results 34
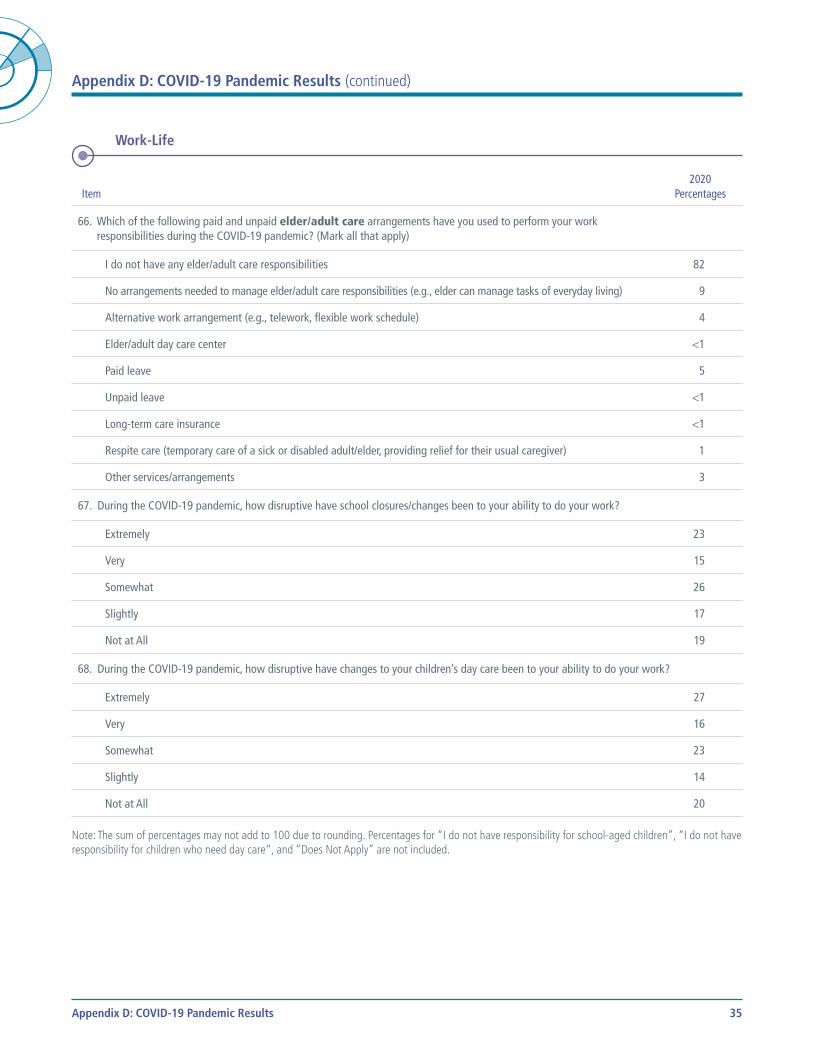
Appendix D: COVID-19 Pandemic Results (continued)
Work-Life
Item2020
Percentages
66. Which of the following paid and unpaid elder/adult care arrangements have you used to perform your work responsibilities during the COVID-19 pandemic? (Mark all that apply)
I do not have any elder/adult care responsibilities 82
No arrangements needed to manage elder/adult care responsibilities (e.g., elder can manage tasks of everyday living) 9
Alternative work arrangement (e.g., telework, flexible work schedule) 4
Elder/adult day care center <1
Paid leave 5
Unpaid leave <1
Long-term care insurance <1
Respite care (temporary care of a sick or disabled adult/elder, providing relief for their usual caregiver) 1
Other services/arrangements 3
67. During the COVID-19 pandemic, how disruptive have school closures/changes been to your ability to do your work?
Extremely 23
Very 15
Somewhat 26
Slightly 17
Not at All 19
68. During the COVID-19 pandemic, how disruptive have changes to your children’s day care been to your ability to do your work?
Extremely 27
Very 16
Somewhat 23
Slightly 14
Not at All 20
Note: The sum of percentages may not add to 100 due to rounding. Percentages for “I do not have responsibility for school-aged children”, “I do not have responsibility for children who need day care“, and “Does Not Apply” are not included.
Appendix D: COVID-19 Pandemic Results 35
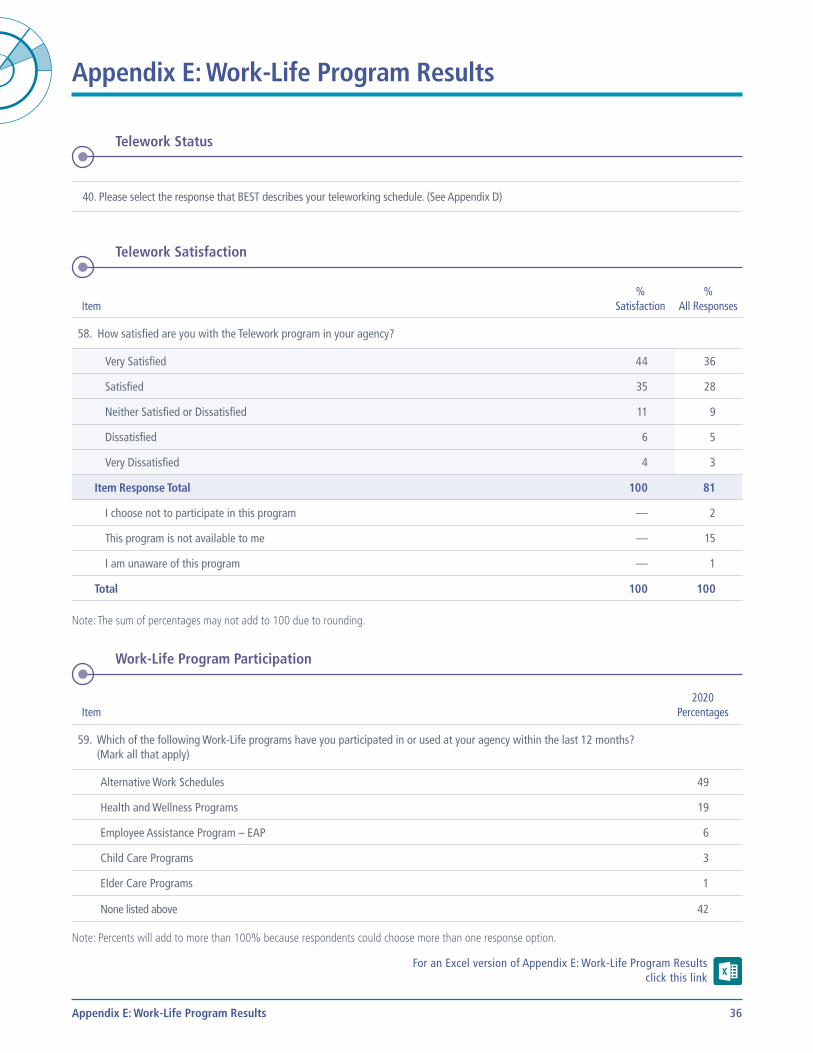
Appendix E: Work-Life Program Results
Telework Status
40. Please select the response that BEST describes your teleworking schedule. (See Appendix D)
Telework Satisfaction
Item%
Satisfaction%
All Responses
58. How satisfied are you with the Telework program in your agency?
Very Satisfied 44 36
Satisfied 35 28
Neither Satisfied or Dissatisfied 11 9
Dissatisfied 6 5
Very Dissatisfied 4 3
Item Response Total 100 81
I choose not to participate in this program — 2
This program is not available to me — 15
I am unaware of this program — 1
Total 100 100
Note: The sum of percentages may not add to 100 due to rounding.
Work-Life Program Participation
Item2020
Percentages
59. Which of the following Work-Life programs have you participated in or used at your agency within the last 12 months? (Mark all that apply)
Alternative Work Schedules 49
Health and Wellness Programs 19
Employee Assistance Program – EAP 6
Child Care Programs 3
Elder Care Programs 1
None listed above 42
Note: Percents will add to more than 100% because respondents could choose more than one response option.
For an Excel version of Appendix E: Work-Life Program Results click this link
Appendix E: Work-Life Program Results 36
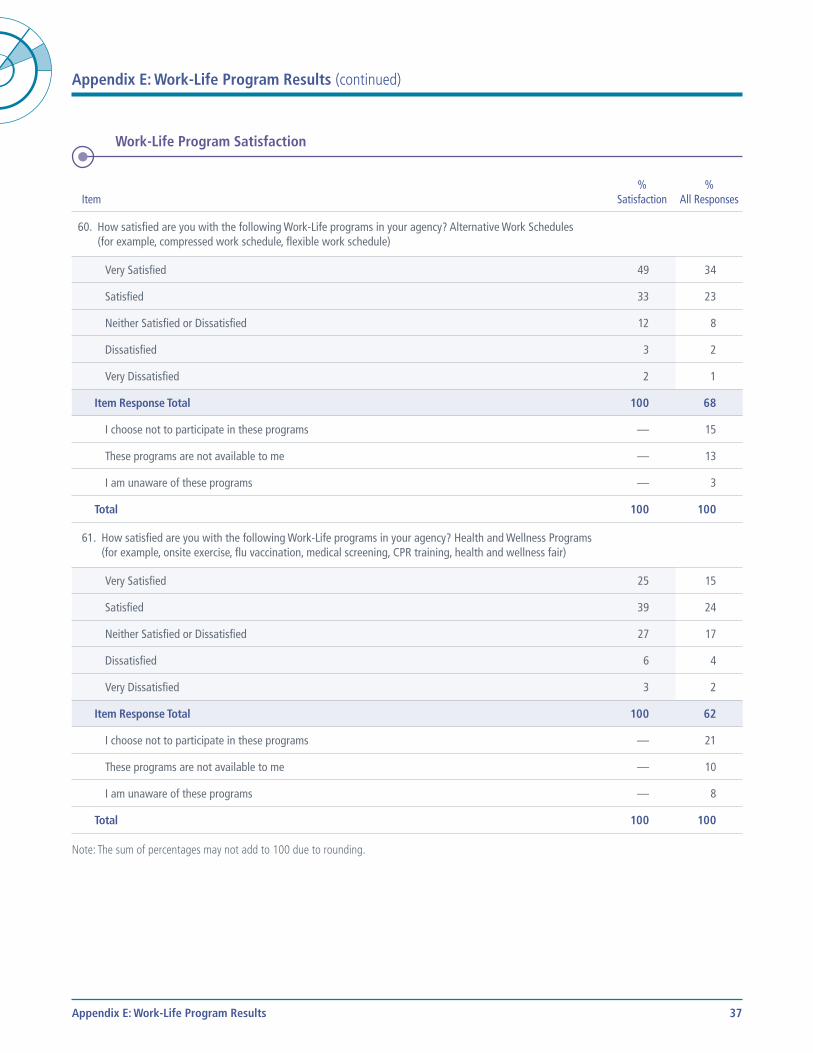
Appendix E: Work-Life Program Results (continued)
Work-Life Program Satisfaction
Item%
Satisfaction%
All Responses
60. How satisfied are you with the following Work-Life programs in your agency? Alternative Work Schedules (for example, compressed work schedule, flexible work schedule)
Very Satisfied 49 34
Satisfied 33 23
Neither Satisfied or Dissatisfied 12 8
Dissatisfied 3 2
Very Dissatisfied 2 1
Item Response Total 100 68
I choose not to participate in these programs — 15
These programs are not available to me — 13
I am unaware of these programs — 3
Total 100 100
61. How satisfied are you with the following Work-Life programs in your agency? Health and Wellness Programs (for example, onsite exercise, flu vaccination, medical screening, CPR training, health and wellness fair)
Very Satisfied 25 15
Satisfied 39 24
Neither Satisfied or Dissatisfied 27 17
Dissatisfied 6 4
Very Dissatisfied 3 2
Item Response Total 100 62
I choose not to participate in these programs — 21
These programs are not available to me — 10
I am unaware of these programs — 8
Total 100 100
Note: The sum of percentages may not add to 100 due to rounding.
Appendix E: Work-Life Program Results 37
Appendix E: Work-Life Program Results (continued)
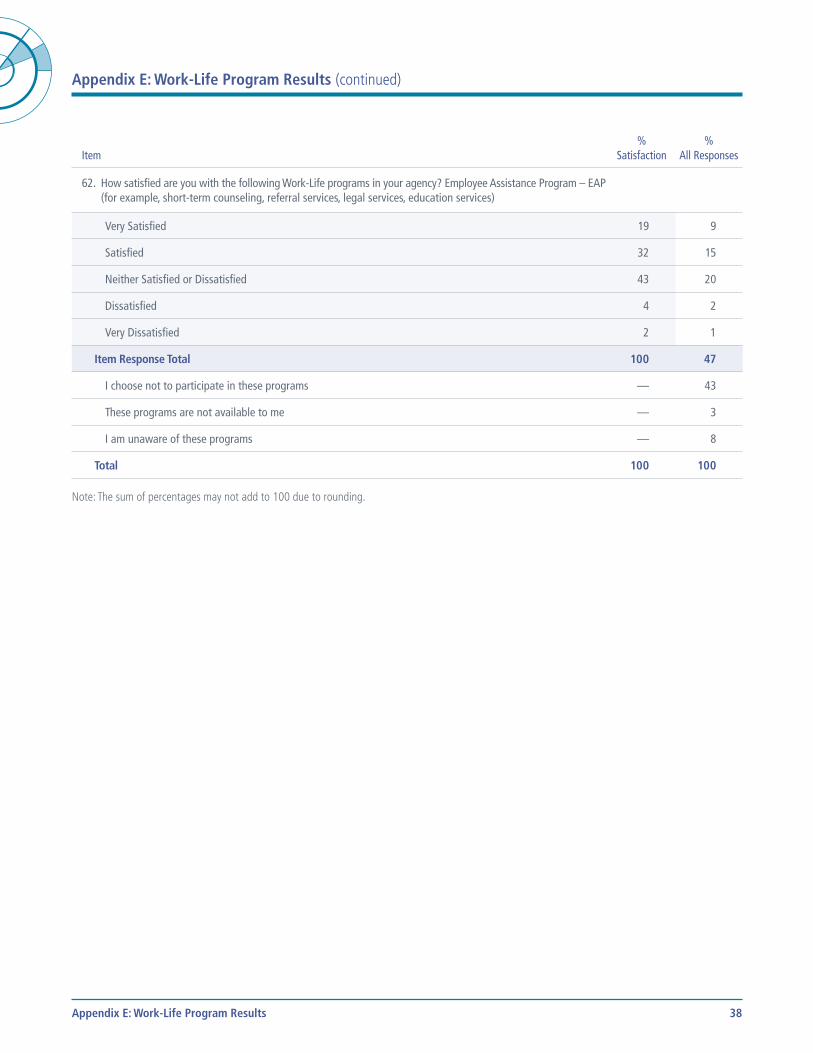
Item%
Satisfaction%
All Responses
62. How satisfied are you with the following Work-Life programs in your agency? Employee Assistance Program – EAP (for example, short-term counseling, referral services, legal services, education services)
Very Satisfied 19 9
Satisfied 32 15
Neither Satisfied or Dissatisfied 43 20
Dissatisfied 4 2
Very Dissatisfied 2 1
Item Response Total 100 47
I choose not to participate in these programs — 43
These programs are not available to me — 3
I am unaware of these programs — 8
Total 100 100
Note: The sum of percentages may not add to 100 due to rounding.
Appendix E: Work-Life Program Results 38
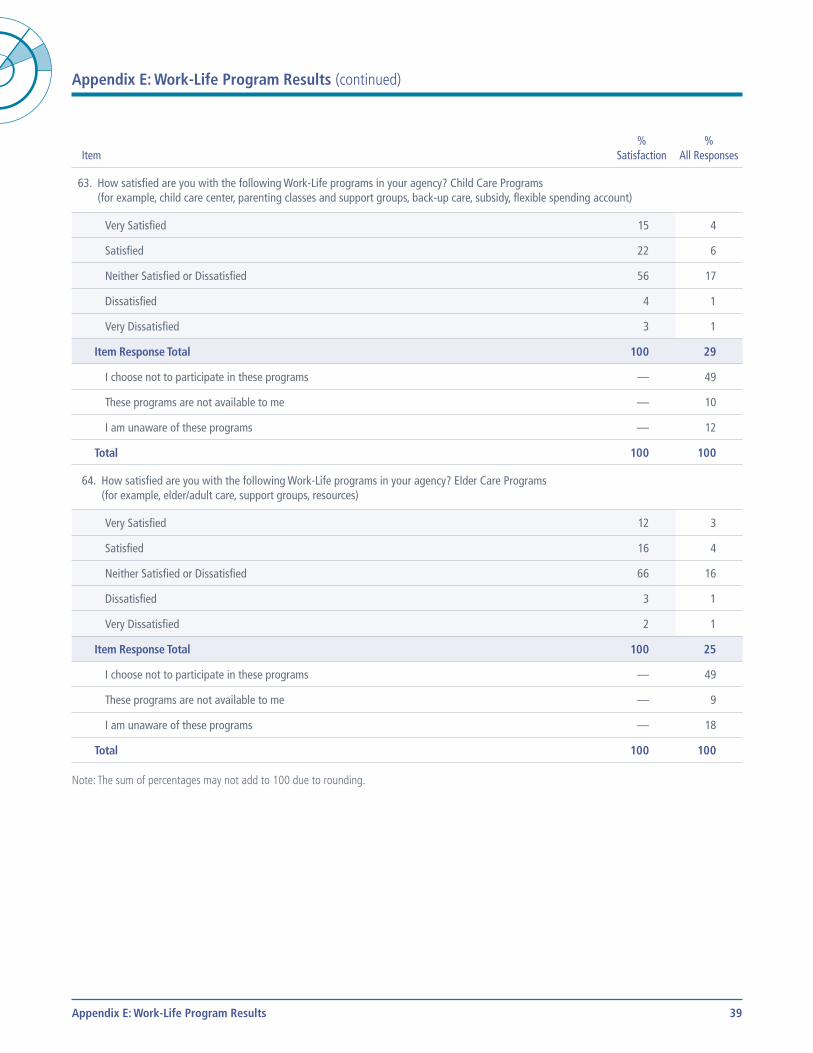
Appendix E: Work-Life Program Results (continued)
Item%
Satisfaction%
All Responses
63. How satisfied are you with the following Work-Life programs in your agency? Child Care Programs (for example, child care center, parenting classes and support groups, back-up care, subsidy, flexible spending account)
Very Satisfied 15 4
Satisfied 22 6
Neither Satisfied or Dissatisfied 56 17
Dissatisfied 4 1
Very Dissatisfied 3 1
Item Response Total 100 29
I choose not to participate in these programs — 49
These programs are not available to me — 10
I am unaware of these programs — 12
Total 100 100
64. How satisfied are you with the following Work-Life programs in your agency? Elder Care Programs (for example, elder/adult care, support groups, resources)
Very Satisfied 12 3
Satisfied 16 4
Neither Satisfied or Dissatisfied 66 16
Dissatisfied 3 1
Very Dissatisfied 2 1
Item Response Total 100 25
I choose not to participate in these programs — 49
These programs are not available to me — 9
I am unaware of these programs — 18
Total 100 100
Note: The sum of percentages may not add to 100 due to rounding.
Appendix E: Work-Life Program Results 39
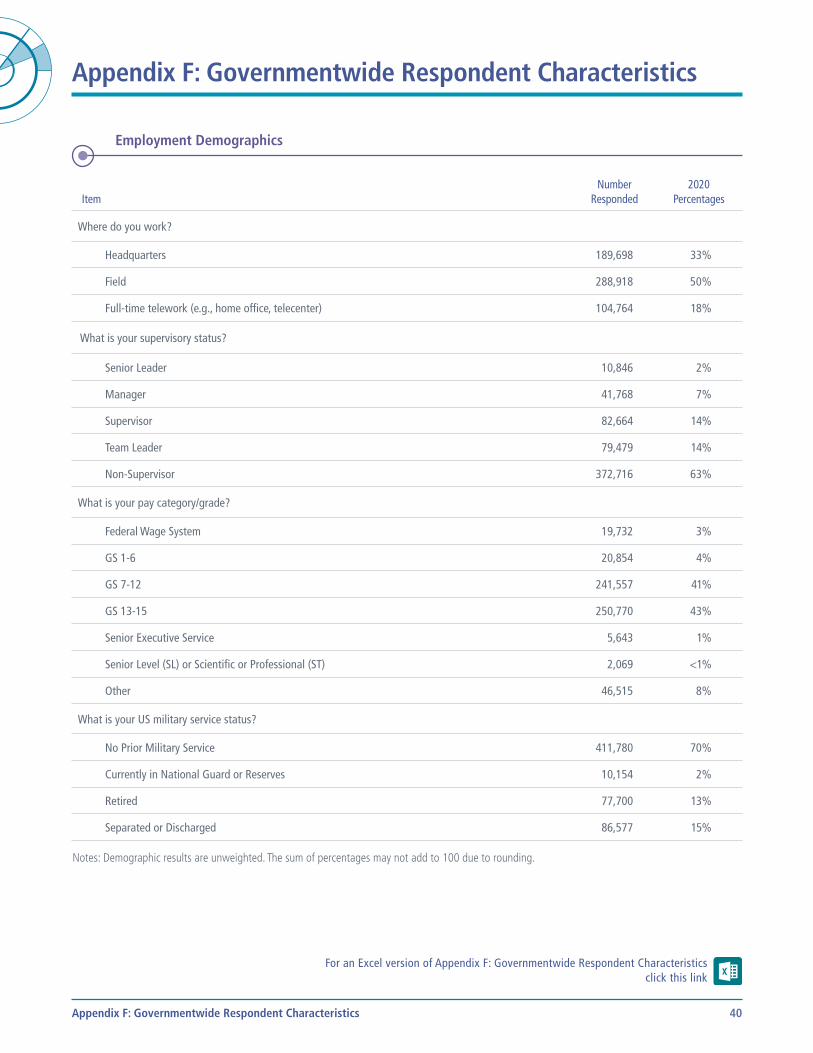
Appendix F: Governmentwide Respondent Characteristics
Employment Demographics
ItemNumber
Responded2020
Percentages
Where do you work?
Headquarters 189,698 33%
Field 288,918 50%
Full-time telework (e.g., home office, telecenter) 104,764 18%
What is your supervisory status?
Senior Leader 10,846 2%
Manager 41,768 7%
Supervisor 82,664 14%
Team Leader 79,479 14%
Non-Supervisor 372,716 63%
What is your pay category/grade?
Federal Wage System 19,732 3%
GS 1-6 20,854 4%
GS 7-12 241,557 41%
GS 13-15 250,770 43%
Senior Executive Service 5,643 1%
Senior Level (SL) or Scientific or Professional (ST) 2,069 <1%
Other 46,515 8%
What is your US military service status?
No Prior Military Service 411,780 70%
Currently in National Guard or Reserves 10,154 2%
Retired 77,700 13%
Separated or Discharged 86,577 15%
Notes: Demographic results are unweighted. The sum of percentages may not add to 100 due to rounding.
For an Excel version of Appendix F: Governmentwide Respondent Characteristics click this link
Appendix F: Governmentwide Respondent Characteristics 40
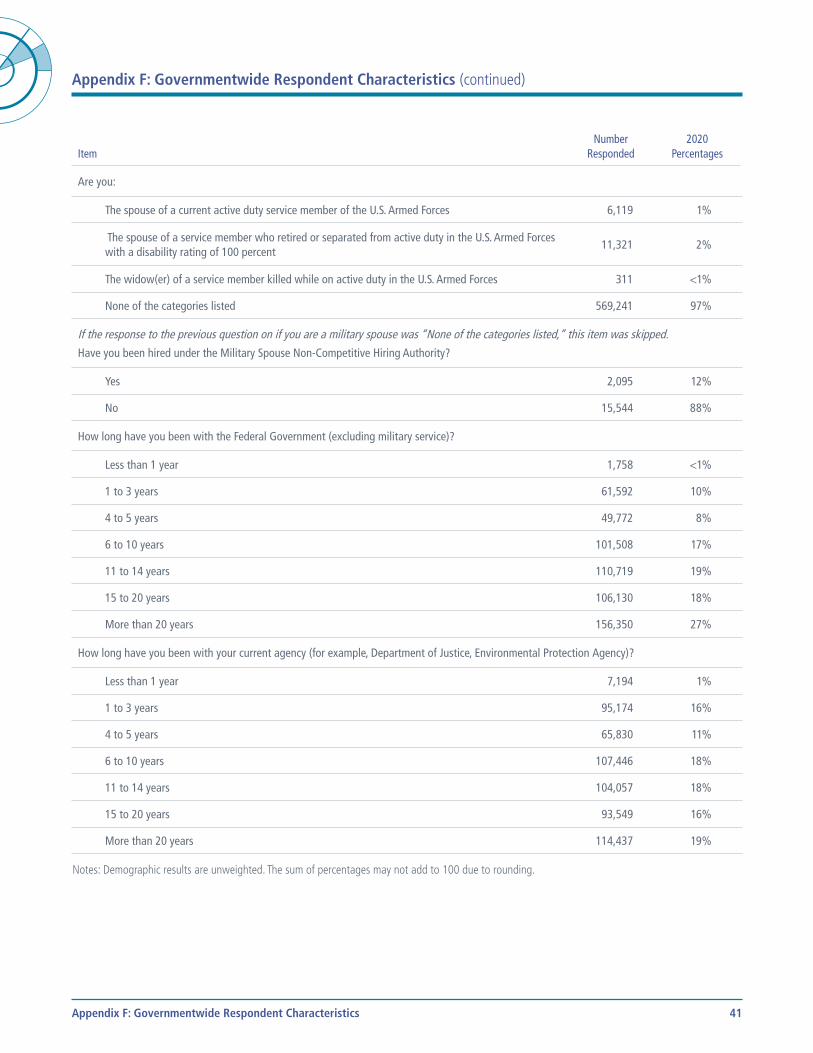
Appendix F: Governmentwide Respondent Characteristics (continued)
ItemNumber
Responded2020
Percentages
Are you:
The spouse of a current active duty service member of the U.S. Armed Forces 6,119 1%
The spouse of a service member who retired or separated from active duty in the U.S. Armed Forces with a disability rating of 100 percent
11,321 2%
The widow(er) of a service member killed while on active duty in the U.S. Armed Forces 311 <1%
None of the categories listed 569,241 97%
If the response to the previous question on if you are a military spouse was “None of the categories listed,” this item was skipped.
Have you been hired under the Military Spouse Non-Competitive Hiring Authority?
Yes 2,095 12%
No 15,544 88%
How long have you been with the Federal Government (excluding military service)?
Less than 1 year 1,758 <1%
1 to 3 years 61,592 10%
4 to 5 years 49,772 8%
6 to 10 years 101,508 17%
11 to 14 years 110,719 19%
15 to 20 years 106,130 18%
More than 20 years 156,350 27%
How long have you been with your current agency (for example, Department of Justice, Environmental Protection Agency)?
Less than 1 year 7,194 1%
1 to 3 years 95,174 16%
4 to 5 years 65,830 11%
6 to 10 years 107,446 18%
11 to 14 years 104,057 18%
15 to 20 years 93,549 16%
More than 20 years 114,437 19%
Notes: Demographic results are unweighted. The sum of percentages may not add to 100 due to rounding.
Appendix F: Governmentwide Respondent Characteristics 41
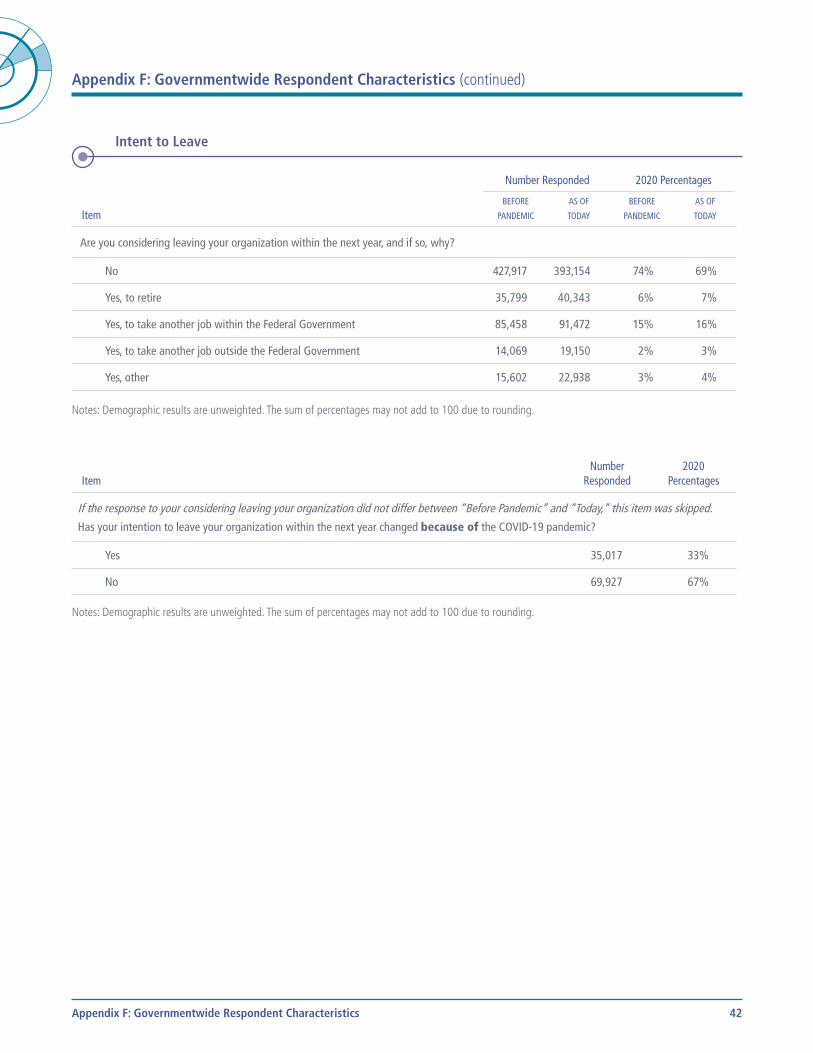
Appendix F: Governmentwide Respondent Characteristics (continued)
Intent to Leave
Item
Number Responded 2020 Percentages
BEFORE
PANDEMIC
AS OF
TODAY
BEFORE
PANDEMIC
AS OF
TODAY
Are you considering leaving your organization within the next year, and if so, why?
No 427,917 393,154 74% 69%
Yes, to retire 35,799 40,343 6% 7%
Yes, to take another job within the Federal Government 85,458 91,472 15% 16%
Yes, to take another job outside the Federal Government 14,069 19,150 2% 3%
Yes, other 15,602 22,938 3% 4%
Notes: Demographic results are unweighted. The sum of percentages may not add to 100 due to rounding.
ItemNumber
Responded2020
Percentages
If the response to your considering leaving your organization did not differ between “Before Pandemic” and “Today,” this item was skipped.
Has your intention to leave your organization within the next year changed because of the COVID-19 pandemic?
Yes 35,017 33%
No 69,927 67%
Notes: Demographic results are unweighted. The sum of percentages may not add to 100 due to rounding.
Appendix F: Governmentwide Respondent Characteristics 42
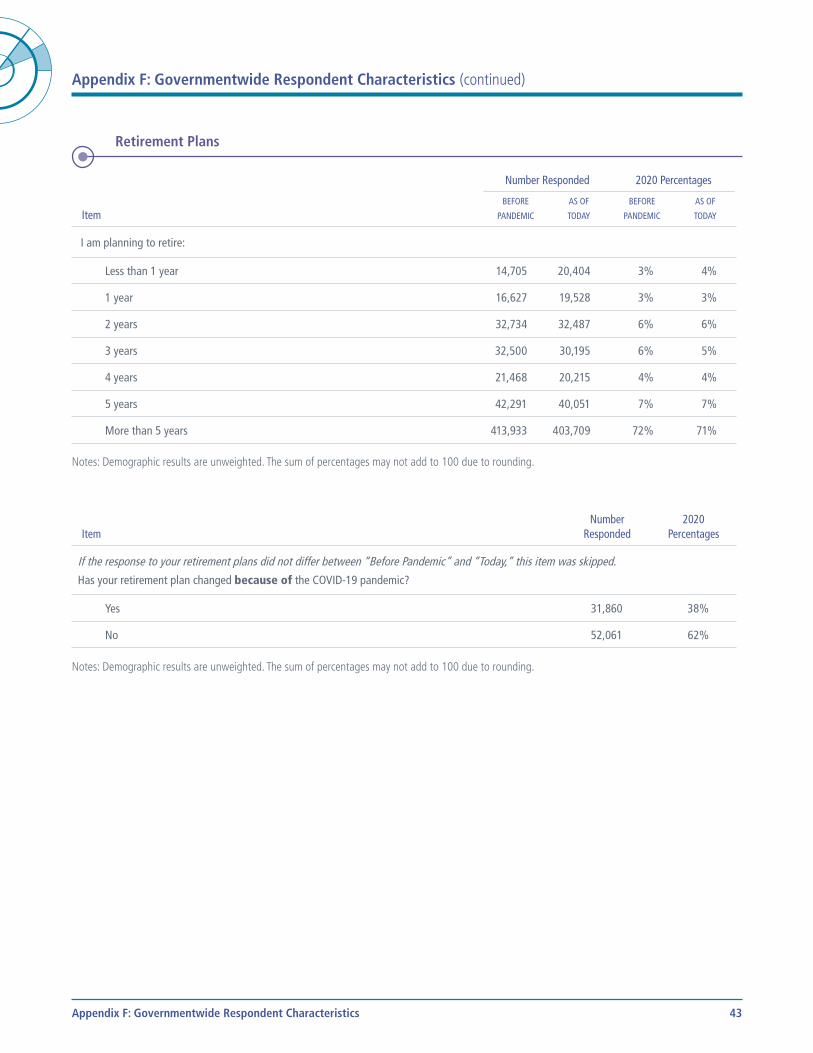
Appendix F: Governmentwide Respondent Characteristics (continued)
Retirement Plans
Item
Number Responded 2020 Percentages
BEFORE
PANDEMIC
AS OF
TODAY
BEFORE
PANDEMIC
AS OF
TODAY
I am planning to retire:
Less than 1 year 14,705 20,404 3% 4%
1 year 16,627 19,528 3% 3%
2 years 32,734 32,487 6% 6%
3 years 32,500 30,195 6% 5%
4 years 21,468 20,215 4% 4%
5 years 42,291 40,051 7% 7%
More than 5 years 413,933 403,709 72% 71%
Notes: Demographic results are unweighted. The sum of percentages may not add to 100 due to rounding.
ItemNumber
Responded2020
Percentages
If the response to your retirement plans did not differ between “Before Pandemic” and “Today,” this item was skipped.
Has your retirement plan changed because of the COVID-19 pandemic?
Yes 31,860 38%
No 52,061 62%
Notes: Demographic results are unweighted. The sum of percentages may not add to 100 due to rounding.
Appendix F: Governmentwide Respondent Characteristics 43
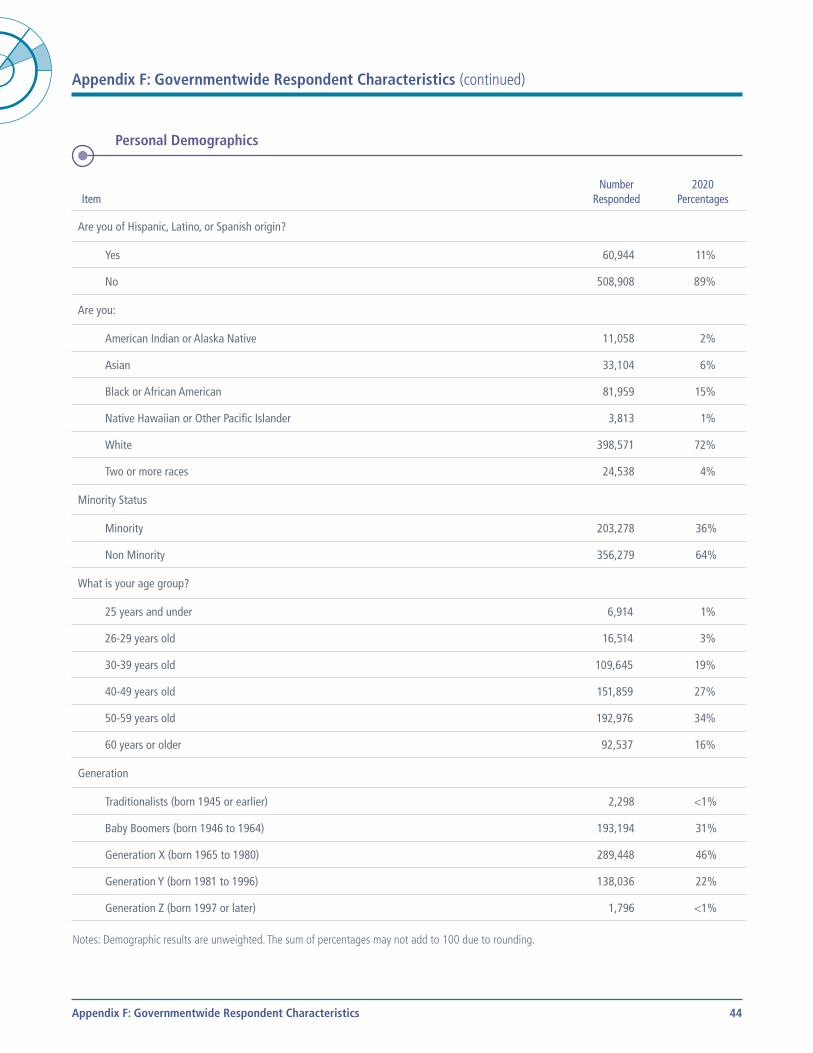
Appendix F: Governmentwide Respondent Characteristics (continued)
Personal Demographics
ItemNumber
Responded2020
Percentages
Are you of Hispanic, Latino, or Spanish origin?
Yes 60,944 11%
No 508,908 89%
Are you:
American Indian or Alaska Native 11,058 2%
Asian 33,104 6%
Black or African American 81,959 15%
Native Hawaiian or Other Pacific Islander 3,813 1%
White 398,571 72%
Two or more races 24,538 4%
Minority Status
Minority 203,278 36%
Non Minority 356,279 64%
What is your age group?
25 years and under 6,914 1%
26-29 years old 16,514 3%
30-39 years old 109,645 19%
40-49 years old 151,859 27%
50-59 years old 192,976 34%
60 years or older 92,537 16%
Generation
Traditionalists (born 1945 or earlier) 2,298 <1%
Baby Boomers (born 1946 to 1964) 193,194 31%
Generation X (born 1965 to 1980) 289,448 46%
Generation Y (born 1981 to 1996) 138,036 22%
Generation Z (born 1997 or later) 1,796 <1%
Notes: Demographic results are unweighted. The sum of percentages may not add to 100 due to rounding.
Appendix F: Governmentwide Respondent Characteristics 44
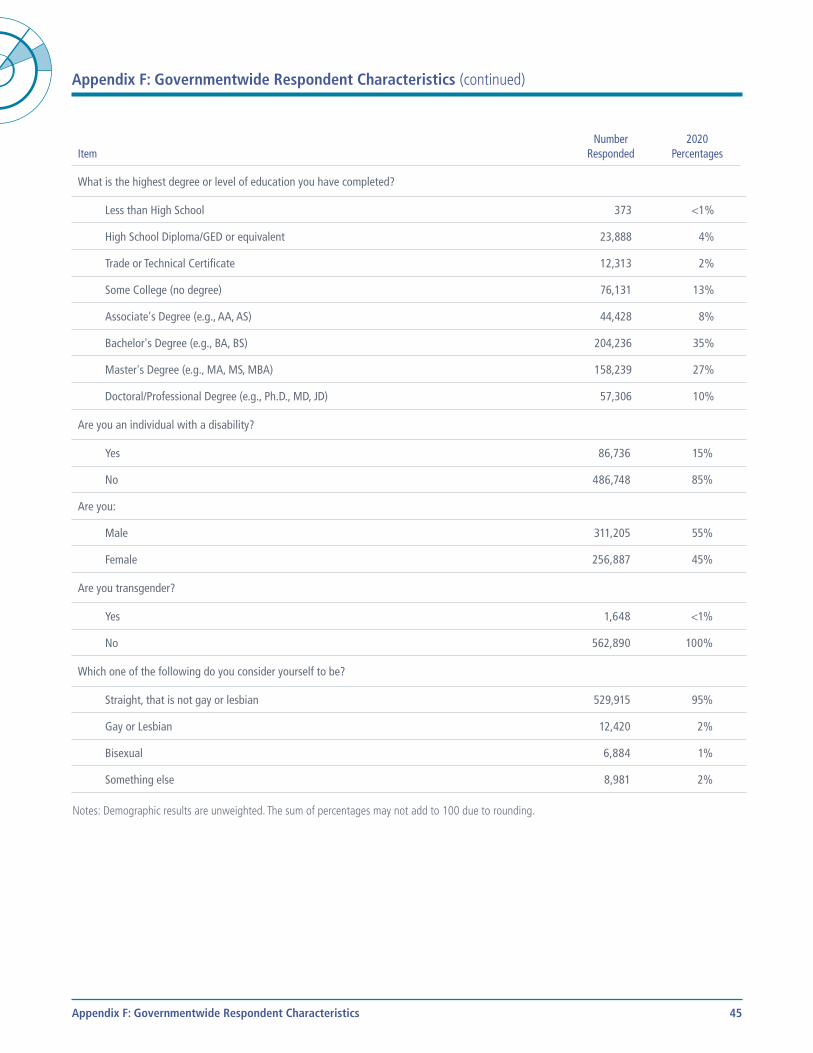
Appendix F: Governmentwide Respondent Characteristics (continued)
ItemNumber
Responded2020
Percentages
What is the highest degree or level of education you have completed?
Less than High School 373 <1%
High School Diploma/GED or equivalent 23,888 4%
Trade or Technical Certificate 12,313 2%
Some College (no degree) 76,131 13%
Associate's Degree (e.g., AA, AS) 44,428 8%
Bachelor's Degree (e.g., BA, BS) 204,236 35%
Master's Degree (e.g., MA, MS, MBA) 158,239 27%
Doctoral/Professional Degree (e.g., Ph.D., MD, JD) 57,306 10%
Are you an individual with a disability?
Yes 86,736 15%
No 486,748 85%
Are you:
Male 311,205 55%
Female 256,887 45%
Are you transgender?
Yes 1,648 <1%
No 562,890 100%
Which one of the following do you consider yourself to be?
Straight, that is not gay or lesbian 529,915 95%
Gay or Lesbian 12,420 2%
Bisexual 6,884 1%
Something else 8,981 2%
Notes: Demographic results are unweighted. The sum of percentages may not add to 100 due to rounding.
Appendix F: Governmentwide Respondent Characteristics 45
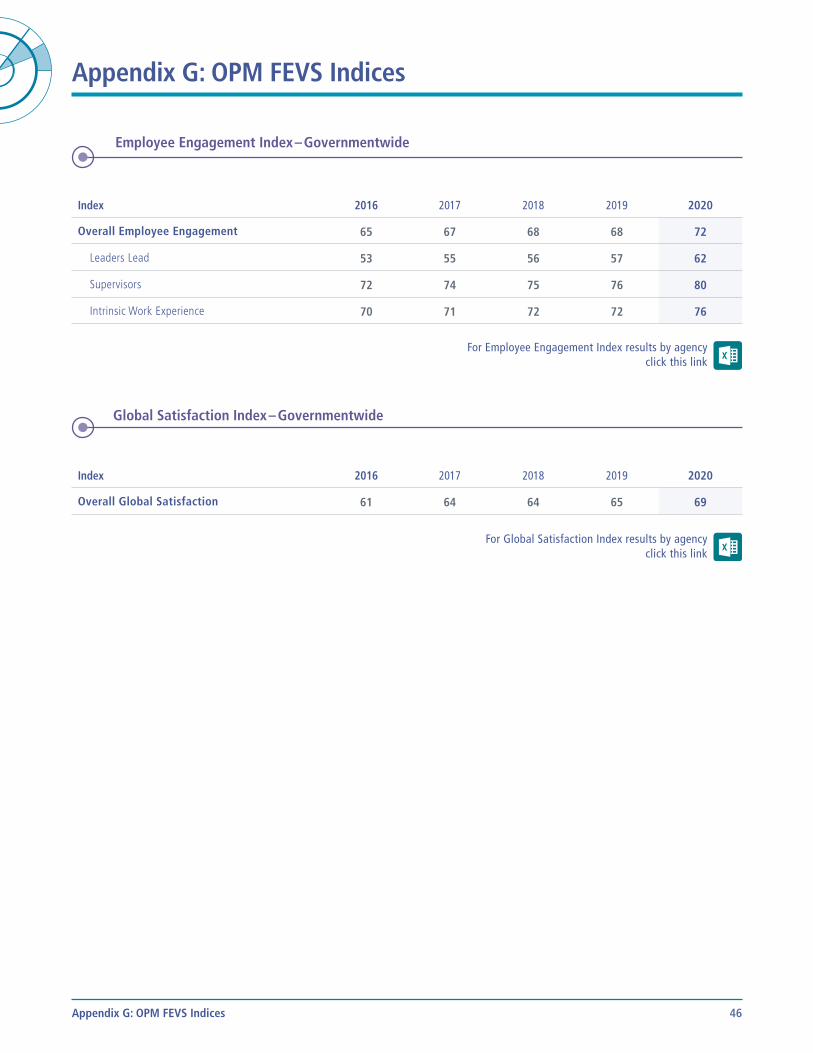
Appendix G: OPM FEVS Indices
Employee Engagement Index – Governmentwide
Index 2016 2017 2018 2019 2020
Overall Employee Engagement 65 67 68 68 72
Leaders Lead 53 55 56 57 62
Supervisors 72 74 75 76 80
Intrinsic Work Experience 70 71 72 72 76
For Employee Engagement Index results by agency click this link
Global Satisfaction Index – Governmentwide
Index 2016 2017 2018 2019 2020
Overall Global Satisfaction 61 64 64 65 69
For Global Satisfaction Index results by agency click this link
Appendix G: OPM FEVS Indices 46

United States Office of Personnel Management Office of Strategy and Innovation
1900 E Street, NW Washington, DC 20415
www.opm.gov/FEVS


