2010 employee viewpoint survey (fedview) results summary
TRANSCRIPT
2010 Employee Viewpoint Survey (FedView) Results Summary
Date of Report: 7/22/10

2
TABLE OF CONTENTS Section 1: Survey Overview……..………………………..….….…………………….…...3 Section 2: How the Survey was Conducted……………………………………………....4 Section 3: Description of Sample…………………………………….………………...….6 Section 4: Interpretation of Results……………….……………………………………...10 Section 5: Conclusion……………………………………………………………………...17

3
SECTION 1: SURVEY OVERVIEW
This report summarizes the results of NARA’s 2010 Employee Viewpoint Survey (FedView), formally the Federal Human Capital Survey (FHCS), and complies with the U.S. Office of Personnel Management’s (OPM) requirement that agencies analyze and provide a summary of their FedView results within 120 days from the close of the survey collection period. The report is intended as an initial high-level summary of NARA’s agency-wide results; additional, more detailed analyses will be conducted over the next several weeks as additional data reports are received from OPM. Agencies are required to administer an Annual Employee Survey to assess employee satisfaction. Traditionally, the agency has been responsible for administration of the survey in the odd-numbered years, while OPM handled the administration in the even years. While the results from the survey each year are reviewed and communicated, NARA has chosen to use the results from the even numbered years to conduct in-depth quantitative and qualitative analysis to measure progress and current satisfaction, as well as for action planning purposes. This decision was based on the availability of OPM’s tools and resources to provide agencies with a survey tool that would provide anonymous, summarized results, and the ability to conduct additional and more meaningful statistical analyses. In addition, based on the timing of the survey administration, 3-5 month lag in receiving the results, the time it takes to develop individual program office reports and communicate the information, and have program offices develop action plans, there is inadequate time to develop and implement meaningful action plans and see true results/progress on an annual basis. By reserving our detailed analysis and action planning for the even-numbered years, we can ensure that we are developing meaningful action plans based on thorough analysis and maximum employee input. Starting in 2010, OPM has announced that they will begin administering FedView on an annual basis. However, based on the factors outlined above, NARA will continue to focus primarily on the data from the even-numbered years for conducting detailed analysis and action planning as we have done in the past.

4
SECTION 2 : HOW THE SURVEY WAS CONDUCTED: The survey was administered by OPM from February 8 until March 26, 2010. An invitation to participate in the survey was sent by e-mail from OPM to NARA full-time permanent staff employed as of June 30th 2009. An aggressive communication campaign was launched to encourage staff participation and notify all employees about the survey open period. The annual survey questions were prescribed by OPM. The survey questions were designed to assess seven overall themes: Personal Work Experiences; Recruitment; Development and Retention; Performance Culture; Leadership; Learning (Knowledge Management); Job Satisfaction; and Work/life. Demographic information was also collected. There are 58 items (excluding demographics) in common between the 2008 and 2010 surveys. New for 2010, OPM collected feedback on the following questions not previously assessed:
#6. I know what is expected of me on the job.
#7. When needed I am willing to put in the extra effort to get a job done.
#8. I am constantly looking for ways to do my job better.
#31. Employees are recognized for providing high quality products and services.
#39. My agency is successful at accomplishing its mission.
#41. I believe the results of this survey will be used to make my agency a better place to work.
#43. My supervisor/team leader provides me with opportunities to demonstrate my leadership skills.
#45. My supervisor/team leader is committed to a workforce representative of all segments of society.
#46. My supervisor/team leader provides me with constructive suggestions to improve my job performance.
#48. My supervisor/team leader listens to what I have to say.
#49. My supervisor/team leader treats me with respect.
#50. In the last six months, my supervisor/team leader has talked with me about my performance.
#59. Managers support collaboration across work units to accomplish work objectives.

5
#60. Overall, how good a job do you feel is being done by the manager directly above your immediate supervisor/team leader?
#62. Senior leaders demonstrate support for Work/Life programs.
#72. Please select the response below that BEST describes your teleworking situation – telework on a regular basis, telework infrequently, no telework physical presence required, no telework not allowed though ok for job type, no telework personal choice.
#75. How satisfied are you with the following Work/Life programs in your agency... Health and Wellness Programs (for example, exercise, medical screening, quit smoking programs)?
#76. How satisfied are you with the following Work/Life programs in your agency... Employee Assistance Program (EAP)?
#77. How satisfied are you with the following Work/Life programs in your agency... Child Care Programs (for example, daycare, parenting classes, parenting support groups)?
#78. How satisfied are you with the following Work/Life programs in your agency... Elder Care Programs (for example, support groups, speakers)?
In addition, OPM removed questions relating to Federal benefits from the 2010 survey and updated the format by grouping questions by the following categories:
My Work Experience
My Work Unit
My Agency
My Supervisor/Team Leader
Leadership
My Satisfaction
Work/Life
Demographics

6
SECTION 3: DESCRIPTION OF SAMPLE: All NARA full-time permanent staff employed as of June 30th 2009 were invited to participate in the survey. Number of employees surveyed, number responded, and representativeness of respondents: Of the 2,413 full-time permanent employees who received the survey, 1,986 responded for an overall response rate of 82.3%. Demographics1:
Where do you work? N Respondents (%)
Population (%)
Headquarters 958 50.3 45.4
Field 947 49.7 54.6
What is your Supervisory Status? N Respondents (%)
Population
(%)
Non-supervisor 1,194 61.3 82.4
Team Leader 398 20.4 1.57
Supervisor/Manager 330 16.9 16.0
Executive 25 1.3 --
Are you: N Respondents
(%) Population
(%)
Male 894 45.8 48.0
Female 1,058 54.2 52.0
1 Population figures are sourced from Performance Measurement and Reporting System (PMRS) as of
June 30, 2009 for full-time permanent employees.

7
Are you: Hispanic or Latino N Respondents
(%) Population
(%)
Yes 57 2.9 1.3
No 1,876 97.1 98.7
Please select the racial category or categories with which you most closely identify:
N Respondents (%)
Population
(%)
American Indian or Alaskan Native 12 .6 .3
Asian 37 1.9 2.0
Black or African American 478 25.0 27.3
Native Hawaiian or other Pacific Islander 7 .4 --
White 1,325 69.3 68.5
Two or more races 52 2.7 .47
What is your age group? N Respondents
(%) Population
(%)
25 and under 23 1.2 2.2
26 – 29 103 5.3 5.4
30 – 39 318 16.4 16.8
40 – 49 554 28.5 28.5
50 – 59 683 35.2 33.5
60 or older 261 13.4 13.6
What is your pay category/grade? N Respondents
(%) Population
(%)
Federal Wage System 6 .3 --
GS 1 – 6 570 29.3 35.8
GS 7 – 12 860 44.2 40.9
GS 13 – 15 483 24.8 22.0
Senior Executive Service 17 .9 1.3
Senior Level (SL) or Scientific or Professional (ST)
4 .2 --
Other 4 .2 --

8
How long have you been with the Federal Government (excluding military service)?
N Respondents (%)
Population
(%)
Less than 1 year 33 1.7 4.0
1 to 3 years 202 10.5 10.2
4 to 5 years 169 8.7 7.8
6 to 10 years 407 21.1 19.7
11 to 14 years 178 9.2 11.0
15 to 20 years 291 15.1 16.0
More than 20 years 653 33.8 31.3
How long have you been with your current agency?
N Respondents (%)
Population
(%)
Less than 1 year 47 2.4 --
1 to 3 years 291 15.0 --
4 to 5 years 218 11.3 --
6 to 10 years 460 23.7 --
11 to 20 years 431 22.3 --
More than 20 years 490 25.3 --
Are you considering leaving your organization with the next year, and if so why?
N Respondents (%)
Population
(%)
No 1,399 71.9 --
Yes, to retire 103 5.3 --
Yes, to take another job in the federal government
336 17.3 --
Yes, to take another job outside the federal government
42 2.2 --
Yes, other
67 3.4 --

9
I am planning to retire: N Respondents (%)
Population
(%)
Within 1 year 53 2.8 --
Between 1 and 3 years 173 9.0 --
Between 3 and 5 years 188 9.8 --
Five or more years 1,499 78.4 --

10
SECTION 4: INTERPRETATION OF RESULTS Overall, NARA’s 2010 results are largely consistent with the results from the 2008 and 2006 surveys:
The majority of NARA employees continue to like the work they do, believe the work they do is important, feel a sense of personal accomplishment from their work, and know how their work relates to the agency’s goals and priorities.
NARA continues to receive high marks in the area of performance management and awards. 72.3% of NARA staff agree that their performance appraisal is a fair reflection of their performance and 83% feel they are held accountable for achieving results. 75.6% of NARA employees indicated that in their most recent performance appraisal, they understood what was required of them to be rated at different performance levels (e.g., Fully Successful, Outstanding). This is 7.8 percentage points higher than the government-wide average. Additionally, 51.9% of NARA employees indicated that awards in their work unit depend on how well employees perform their jobs – 8.4 percentage points higher than the government-wide average.
NARA staff continue to express trust and confidence in their immediate supervisors, feel that they support employee development, and understand staff’s needs to balance work and family issues. However, they continue to respond less favorably to the statement, “In my organization, leaders generate high levels of motivation and commitment in the workforce” (only 37.3% responded positively).
NARA employees continue to express concern regarding their opportunities to get a better job in their organization (41% negative response rate). Positive responses to this question (35.8 %) are 5.9 percentage points below the government-wide average.
11
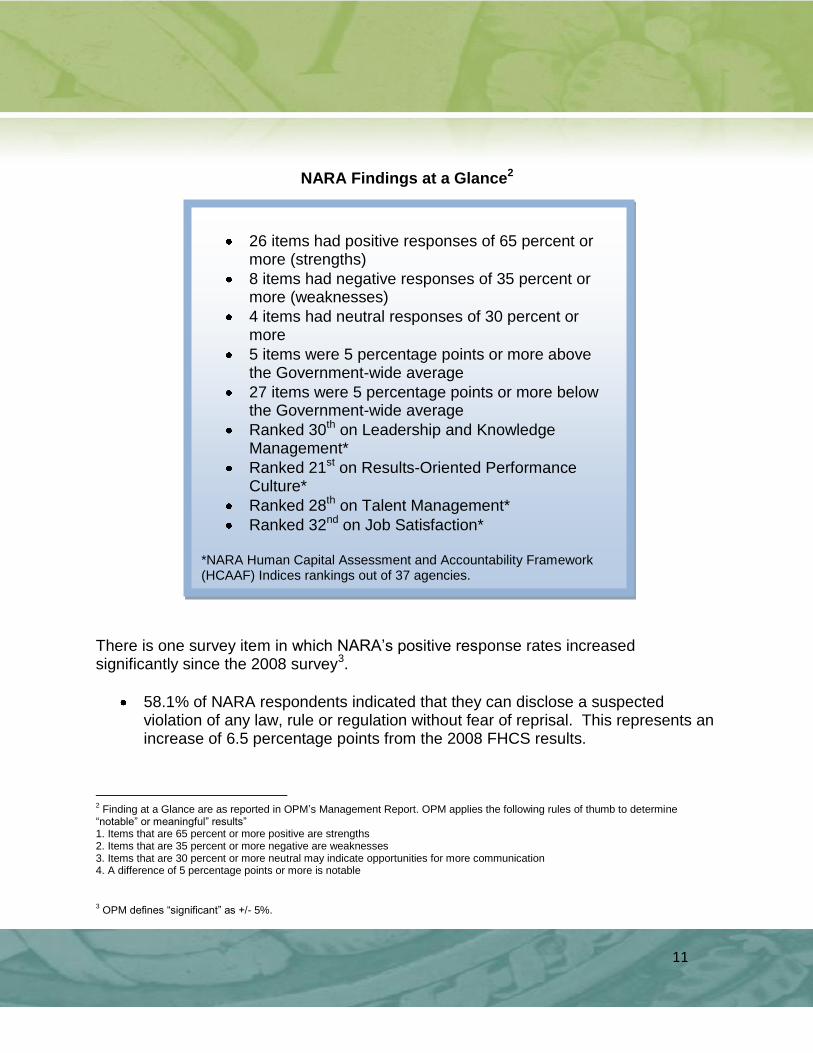
26 items had positive responses of 65 percent or more (strengths)
8 items had negative responses of 35 percent or more (weaknesses)
4 items had neutral responses of 30 percent or more
5 items were 5 percentage points or more above the Government-wide average
27 items were 5 percentage points or more below the Government-wide average
Ranked 30th on Leadership and Knowledge Management*
Ranked 21st on Results-Oriented Performance Culture*
Ranked 28th on Talent Management*
Ranked 32nd on Job Satisfaction* *NARA Human Capital Assessment and Accountability Framework (HCAAF) Indices rankings out of 37 agencies.
NARA Findings at a Glance2
There is one survey item in which NARA’s positive response rates increased significantly since the 2008 survey3.
58.1% of NARA respondents indicated that they can disclose a suspected violation of any law, rule or regulation without fear of reprisal. This represents an increase of 6.5 percentage points from the 2008 FHCS results.
2 Finding at a Glance are as reported in OPM’s Management Report. OPM applies the following rules of thumb to determine
“notable” or meaningful” results” 1. Items that are 65 percent or more positive are strengths 2. Items that are 35 percent or more negative are weaknesses 3. Items that are 30 percent or more neutral may indicate opportunities for more communication 4. A difference of 5 percentage points or more is notable
3 OPM defines “significant” as +/- 5%.

12
There are two areas in which NARA’s positive response rates have declined in any significant amount since the 2008 survey:
Fewer NARA employees feel that the people they work with cooperate to get the job done. Positive responses to this item were down 11.2 percentage points from 2008, and are below the government-wide average by 3.3 percentage points.
NARA’s positive responses decreased by 7.5 percentage points from 2008 on the item “Policies and programs promote diversity in the workplace (for example, recruiting minorities and women, training in awareness of diversity issues, mentoring).”
Additionally, there are areas where we continue to lag behind the rest of the Federal government, including:
Knowledge management. 47.4% of NARA respondents indicated that their training needs are assessed. NARA positive responses are 6.4 percentage points lower than the government-wide average. In addition, NARA’s positive responses were 6.8 percentage points lower than the government-wide average on the item “Employees in my work unit share knowledge with each other” and 10.5 percentage points lower than the government-wide average on the item: “Managers promote communication among different work units (for example, about projects, goals, and needed resources).”
Health and safety. Approximately 65% of NARA employees feel they are protected from health and safety hazards on the job. This response rate is lower than the government-wide average by approximately 11 percentage points. Also, NARA’s positive responses were 11 percentage points lower than the government-wide average on the item “My organization has prepared employees for potential security threats.”
Diversity. Over half of NARA’s respondents believe their supervisors and team leaders are committed to a workforce representative of all segments of society. However, NARA positive responses to the items of “Policies and programs promoted diversity in the workplace (for example, recruiting minorities and women, training in awareness of diversity issues, mentoring)” trail the government-wide average by 10.5 percentage points and “Managers, supervisors, and team leaders work well with employee’s of different backgrounds” remain 7.6 percentage points lower than the government-wide average.
13
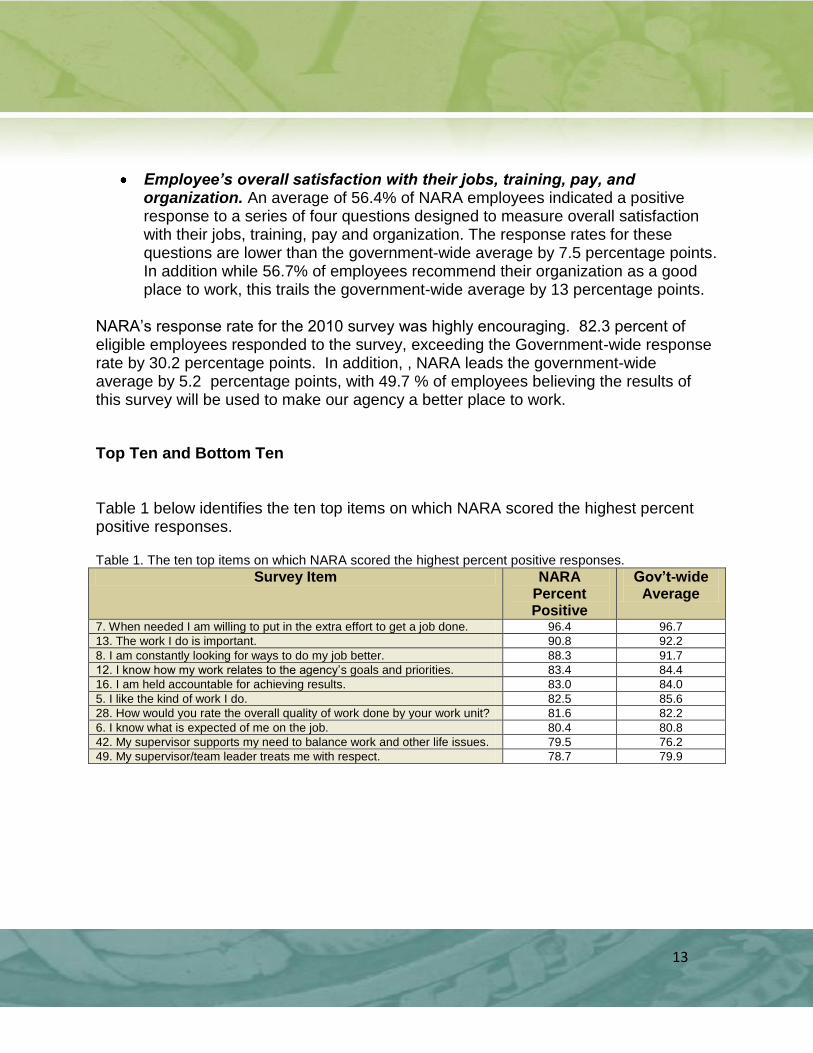
Employee’s overall satisfaction with their jobs, training, pay, and organization. An average of 56.4% of NARA employees indicated a positive response to a series of four questions designed to measure overall satisfaction with their jobs, training, pay and organization. The response rates for these questions are lower than the government-wide average by 7.5 percentage points. In addition while 56.7% of employees recommend their organization as a good place to work, this trails the government-wide average by 13 percentage points.
NARA’s response rate for the 2010 survey was highly encouraging. 82.3 percent of eligible employees responded to the survey, exceeding the Government-wide response rate by 30.2 percentage points. In addition, , NARA leads the government-wide average by 5.2 percentage points, with 49.7 % of employees believing the results of this survey will be used to make our agency a better place to work.
Top Ten and Bottom Ten Table 1 below identifies the ten top items on which NARA scored the highest percent positive responses. Table 1. The ten top items on which NARA scored the highest percent positive responses.
Survey Item NARA Percent Positive
Gov’t-wide Average
7. When needed I am willing to put in the extra effort to get a job done. 96.4 96.7
13. The work I do is important. 90.8 92.2
8. I am constantly looking for ways to do my job better. 88.3 91.7
12. I know how my work relates to the agency’s goals and priorities. 83.4 84.4
16. I am held accountable for achieving results. 83.0 84.0
5. I like the kind of work I do. 82.5 85.6
28. How would you rate the overall quality of work done by your work unit? 81.6 82.2
6. I know what is expected of me on the job. 80.4 80.8
42. My supervisor supports my need to balance work and other life issues. 79.5 76.2
49. My supervisor/team leader treats me with respect. 78.7 79.9

14
Table 2 below identifies the ten items NARA scored the lowest percent positive responses. Table 2. The ten items NARA scored the lowest percent positive responses.
Survey Item NARA Percent Positive
Gov’t-wide Average
78. How satisfied are you with the following Work/Life programs in your agency… Elder Care Programs (for example, support groups, speakers)?
16.7 19.9
77. How satisfied are you with the following Work/ Life programs in your agency… Child Care Programs (for example, daycare, parenting classes, parenting support groups)?
25.8 23.1
33. Pay raises depend on how well employees perform their jobs. 27.8 26.3
23. In my work unit, steps are taken to deal with a poor performer who cannot or will not improve.
34.6 30.8
67. How satisfied are you with your opportunity to get a better job in your organization?
35.8 41.7
24. In my work unit, differences in performance are recognized in a meaningful way.
36.7 36.2
53. In my organization, leaders generate high levels of motivation and commitment in the workforce.
37.3 44.5
32. Creativity and innovation are rewarded. 37.4 41.1
22. Promotions in my work unit are based on merit. 37.5 35.4
30. Employees have a feeling of personal empowerment with respect to work processes.
38.5 47.6
Items Trailing the Government, Decreases in Satisfaction – 2008 to 2010 Trends and HCAAF Indices We’ve also identified 1) the top 10 items on which we scored lowest compared to the rest of the government, 2) those items on which employee satisfaction decreased from the 2008 FHCS and 3) NARA’s HCAAF indices scoring lower than the government.

15
Table 3 identifies the ten items on which we scored lowest compared to the rest of the government: Table 3. Trailing the Government - Ten lowest scored items compared to the rest of the government.
Survey Item NARA Percent Positive
Gov’t-wide Average
40. I recommend my organization as a good place to work. 56.7 69.7
39. My agency is successful at accomplishing its mission. 66.1 77.6
35. Employees are protected from health and safety hazards on the job. 65.2 76.4
36. My organization has prepared employees for potential security threats. 65.3 76.3
59. Managers support collaboration across work units to accomplish work objectives.
47.4 57.5
34. Policies and programs promote diversity in the workplace (for example, recruiting minorities and women, training in awareness of diversity issues, mentoring).
47.5 58.0
58. Managers promote communication among different work units (for example, about projects, goals, needed resources).
44.0 54.5
71. Considering everything, how satisfied are you with your organization? 53.2 62.4
30. Employees have a feeling of personal empowerment with respect to work processes.
38.5 47.6
70. Considering everything, how satisfied are you with your pay? 57.2 65.8
Table 4 below identifies items where employee satisfaction decreased by 5 percentage points or more since the 2008 FHCS. For NARA, there are two survey items that fell into this category: Table 4. Items where employee satisfaction decreased by 5 percentage points or more since the 2008 FHCS.
Survey Item 2008 NARA Percent Positive
2010 NARA Percent Positive
20. The people I work with cooperate to get the job done. 82.6 71.4
34. Policies and programs promote diversity in the workplace (for example, recruiting minorities and women, training in awareness of diversity issues, mentoring).
55.0 47.5

16
Table 5 below identifies the HCAAF indices in which NARA scored lower than the rest of the government: Table 5. HCAAF indices in which the agency scored lower than the rest of the government.
4
HCAAF Index NARA Average Gov’t-wide Average Leadership and Knowledge Management
56% 61%
Talent Management 56% 60%
Job Satisfaction 65% 69%
4 The Leadership & Knowledge Management Index indicates the extent employees hold their leadership in high
regard, both overall and on specific facets of leadership. It is made up of the following twelve items: 10, 35, 36, 51, 52, 53, 55, 56, 57, 61, 64, and 66. The Results-Oriented Performance Culture Index indicates the extent employees believe their organizational
culture promotes improvement in processes, products and services, and organizational outcomes. It is made up of the following thirteen items: 12, 14, 15, 20, 22, 23, 24, 30, 32, 33, 42, 44, and 65. The Talent Management Index indicates the extent employees think the organization has the talent necessary to
achieve organizational goals. It is made up of the following seven items: 1, 11, 18, 21, 29, 47, and 68. The Job Satisfaction Index indicates the extent employees are satisfied with their jobs and various aspects thereof.
It is made up of the following seven items: 4, 5, 13, 63, 67, 69, and 70.

17
SECTION 5: CONCLUSION NARA is encouraged by the fact that we had such a high participation rate (82.3 percent of eligible NARA staff) and that NARA staff believe that we will actually do something with the results. 49.7 % of NARA employees said they believe the results of the EVS will be used to make our agency a better place to work. This response rate leads the government-wide average by 5.2 percentage points. With such a high participation rate, the 2010 results serve as a good baseline with which to measure our progress moving forward. OPM will provide the survey results for individual NARA program offices over the course of the next several weeks. Additional, more detailed analyses will be conducted as these additional data reports are received from OPM. Program offices will be expected to share the results with their staff and engage staff in developing an action plan for addressing their results. In addition, an agency-level task force has been established to develop, implement, and evaluate an agency-wide action plan for employee satisfaction. This task force will be reviewing the agency-wide results in more detail and incorporating the results into our agency-level action planning efforts.