doubling up: intensive math education and educational ... · intensive math education and...
TRANSCRIPT
Doubling Up:Intensive Math Education and Educational Attainment∗
Kalena CortesThe Bush School of Government and Public Service
Texas A&M [email protected]
Joshua GoodmanJohn F. Kennedy School of Government
Harvard Universityjoshua [email protected]
Takako NomiConsortium on Chicago School Research
University of [email protected]
Abstract
Success or failure in freshman algebra has long been thought to have a strong impact onsubsequent high school outcomes. We study an intensive algebra policy implemented by theChicago Public Schools for cohorts entering high school in 2003 and 2004. Students scoringbelow the national median on an eighth grade exam were assigned in ninth grade to an al-gebra course that doubled instructional time and emphasized problem solving skills. Usinga regression discontinuity design, we confirm prior work showing little short-run impact onalgebra passing rates and math scores. We show, however, positive and substantial long runimpacts of double-dose algebra on college entrance exam scores, high school graduation ratesand college enrollment rates. The bulk of this impact comes from students with below averagereading skills, perhaps because the intervention focused on written expression of mathemati-cal concepts. These facts point to the importance both of evaluating interventions beyond theshort run and of targeting interventions toward appropriately skilled students. This is the firstevidence we know of to demonstrate long run impacts of such intensive math education.
∗We are indebted to Sue Sporte, Associate Director for Evaluation and Data Resources, the Consortium on ChicagoSchool Research (CCSR), University of Chicago, for making the data available for this project. Special thanks for helpfulcomments from Richard Murnane, Bridget Terry Long, Jeffrey D. Kubik, Lori Taylor, Jacob Vigdor and Nora Gordon.Also, we would like to thank the seminar participants at Harvard University’s Program on Education Policy and Gov-ernance (PEPG) Education Policy Colloquia Series, State of Texas Education Research Center (ERC) at Texas A&M Uni-versity; and conference participants at the Association for Education Finance and Policy (AEFP). Institutional supportfrom Texas A&M University and Harvard University are also gratefully acknowledged. Research results, conclusions,and all errors are naturally our own.
1 Introduction
There is an increasing recognition and concern that too few high school students, especially those
in urban areas, are graduating with the necessary skills needed for college and the workforce.
The high school completion rate has been declining over the past decade among students at all
income levels and only about half of racial minority students finish high school (NCES, 2004).1
Despite increases in college enrollment, there has been little increase in college graduation rates
among African-American and Latino students, who often struggle on entering college (NCES,
2011). High schools, particularly urban ones, are often blamed for not graduating students with
the skills and coursework they need to be successful in college.
There is now a national movement calling for more rigorous high school requirements that are
explicitly linked to the skills that students will need for work and college. The National Gover-
nor’s Association, for example, has recommended enacting high school reform through rigorous
college preparatory graduation requirements, programs to encourage disadvantaged students to
take Advanced Placement (AP) exams and college-preparatory classes, and the design of literacy
and math support courses for students with below-grade level performance.2 These recommen-
dations are already being followed. A number of states are in the process of raising curricular
requirements for graduation (e.g., Arkansas, Mississippi, and Illinois), and other states have en-
acted incentives to particularly encourage disadvantaged students to take rigorous high school
course loads (e.g., Arkansas, Maine, Missouri, and Oklahoma).3
Calls to increase both curricular offerings and requirements are based on a large amount of ev-
idence tying school curriculum to student outcomes. Since the late 1980s there has been evidence
that requiring students to take college preparatory classes could produce higher overall levels
of achievement and reduce racial and socioeconomic achievement gaps (Bryk, Lee and Holland,
1993; Goodman, 2009). Some of this evidence comes from studies of the curricular organization
of public and Catholic high schools. Of particular interest is the nature of remedial education in
1Data from the National Center for Education Statistics (NCES) Digest of Education Statistics (2004) shows that thepercentage of 17 year olds completing a high school degree has decreased from approximately 76 percent in the 1960sto about 70 percent in the late 1990s.
2National Governors Association Center for Best Practices (2005a).3National Governors Association Center for Best Practices (2005b).
1
the PK-12 setting, which has historically been quite different in these two educational sectors. In
public high schools, remedial coursework constituted an entire set of courses that could be used
to satisfy graduation requirements. In contrast, in Catholic schools, students were required to
enroll in additional courses to build their skills through a ”double dose” of coursework. Some
researchers have attributed at least part of the apparent success of Catholic schooling to such rig-
orous curricular requirements (Bryk, Lee and Holland, 1993; Lee, Croninger and Smith, 1997; Lee,
Smith and Croninger, 1997).
Unfortunately, the vast majority of studies on the impact of coursework and curricula on stu-
dent achievement have relied on cross-sectional samples analyzed with empirical strategies prone
to generate substantial selection bias. The few studies on remedial education that have seriously
grappled with the issue of causal inference have either looked at short-run outcomes such as test
scores (Jacob and Lefgren, 2004) or longer-run outcomes in the context of U.S. colleges or high
schools in other nations (Calcagno and Long, 2008; Bettinger and Long, 2009; Lavy and Schlosser,
2005). None of these studies have analyzed longer-term outcomes in American high schools.
However, the one study of remedial education in an urban American high school is by Nomi
and Allensworth (2009) that study on which this current study builds on, the authors examined
the short-term impact of a remedial math policy known as ”double-dose” algebra, enacted by the
Chicago Public Schools in 2003. Under this policy, students scoring below the national median on
their 8th grade math exam were required to take two periods of algebra a day during the 9th grade.
Students placed into these remedial classes thus received substantially more instruction time in
algebra. Nomi and Allensworth (2009) analyzed the early high school outcomes of this policy by
following students only through the 10th grade, and found positive and substantial impacts on
G.P.A and standardized test scores, but no improvement in 9th grade algebra course failure rates.
The time frame of their initial study did not, however, allow them to explore other important out-
comes beyond 10th grade, such as learning in higher mathematics, high school graduation, and
college attendance. Our study examines the impact of Chicago Public Schools’ remedial math
policy on longer-term outcomes that are ultimately of more concern to students, parents and pol-
icymakers. Specifically, we analyze advanced math coursework and performance, ACT scores,
2
high school graduation rates and college enrollment using longitudinal transcript data from the
Chicago Public Schools (CPS), which allow us to track students from 8th grade through college
enrollment.
To analyze the effect of this innovative double-dose curriculum, we employ a regression dis-
continuity design, which compares the outcomes of students just above and just below the double-
dose threshold. This design generates local average treatment effects by comparing students of
nearly identical academic skill, only some of whom were treated by this intervention. Using lon-
gitudinal data that tracks students from eight grade to college enrollment, we confirm prior work
showing little short-run impact on algebra passing rates and math scores. We show, however,
positive and substantial long run impacts of double-dose algebra on college entrance exam scores,
high school graduation rates and college enrollment rates. The bulk of this impact comes from
students with below average reading skills, perhaps because the intervention focused on writ-
ten expression of mathematical concepts. These facts point to the importance both of evaluating
interventions beyond the short run and of targeting interventions toward appropriately skilled
students. This is the first evidence we know of to demonstrate long run impacts of such intensive
math education.
The double dose strategy has become an increasingly popular way to aid students struggling
in mathematics. Today, nearly half of large urban districts report doubled math instruction as the
most common form of support for students with lower skills (Council of Great City Schools, 2009).
The central concern of urban school districts is that algebra may be a gateway for later academic
success, so that early high school failure in math may have large effects on subsequent academic
achievement and graduation rates. As the current policy environment calls for ”algebra for all”
in 9th grade or earlier grades, providing an effective and proactive intervention is particularly
critical for those who lack foundational mathematical skills. A successful early intervention may
have the greatest chance of having longer-term effects on students’ academic outcomes.
3
2 Implementing Double-Dose Algebra
Since the late 1990s, Chicago Public Schools (CPS) has been at the forefront of curriculum re-
form designed to increase the rigor of student coursework and prepare students for college en-
trance. Starting with students entering high school in the fall of 1997, CPS raised its graduation
requirements to align with the New Basics Curriculum.4 CPS eliminated lower-level and reme-
dial courses so that all first-time freshmen would enroll in algebra in 9th grade, geometry in 10th
grade and algebra II or trigonometry in 11th grade. Soon after these reforms, CPS officials realized
that students were unable to master the new college-prep curriculum. Passing rates in 9th grade
algebra were quite low, largely because students entered high school with such poor math skills
(Roderick & Camburn, 1999).
In response to these low passing rates in 9th grade algebra, CPS launched the double-dose
algebra policy for all students entering high school in the fall of 2003. Instead of reinstating the
traditional remedial courses from previous years, CPS required enrollment in two periods of al-
gebra coursework for all first-time 9th graders testing below the national median on the math
portion of the 8th grade Iowa Tests of Basic Skills (ITBS).5 Such students enrolled for two math
credits, a full-year regular algebra class plus a full-year algebra support class.6 Three student co-
horts, those entering high school in the fall of 2003, 2004 and 2005, were subject to the double-dose
policy. Our analysis focuses on the first two cohorts because the test score-based assignment rule
was not followed closely for the final cohort. We will refer to these as the 2003 and 2004 cohorts.
Prior to the double-dose policy, algebra curricula had varied considerably across CPS high
schools, due to the fairly decentralized nature of the district. Conversely, CPS offered teachers
4The new basics curriculum was a minimum curriculum recommended by the National Commission of Excellence inEducation in 1983, which consists of four years of English, three years of each mathematics, science, and social studies,and one-half year of computer science. The CPS requirements are actually slightly higher than the New Basics Cur-riculum, which includes two years of a foreign language and specific courses in mathematics (i.e., algebra, geometry,advanced algebra, and trigonometry).
5All CPS high schools were subject to the double-dose algebra policy, including 60 neighborhood schools, 11 magnetschools, and 6 vocational schools (Nomi and Allensworth, 2009).
6Double-dose algebra students received 90 minutes of math class time every day for a full academic year. Thefirst math course, regular algebra, consisted mostly of class lectures. The second math course, algebra with support,focused on building math skills that students lacked and covered materials in a different than the textbook. Double-dose teachers used various instructional activities, such as working in small groups, asking probing and open-endedquestions, and using board work (Starkel, Martinez, and Price, 2006; Wenzel, Lawal, Conway, Fendt, and Stoelinga,2005).
4
of double-dose algebra two specific curricula called Agile Mind and Cognitive Tutor, stand-alone
lesson plans they could use, and thrice annual professional development workshops where teach-
ers were given suggestions about how to use the extra instructional time.7 Though it is difficult
to know precisely what occurred in these extra classes, Nomi and Allensworth (2010) surveyed
students to learn more about the classroom learning environment. They found that students as-
signed to double-dose algebra reported much more frequently: writing sentences to explain how
they solved a math problem; explaining how they solved a problem to the class; writing math
problems for other students to solve; discussing possible solutions with other students; and ap-
plying math to situations in life outside of school. The additional time thus focused on building
verbal and analytical skills may have conferred benefits in subjects other than math.
CPS also strongly advised schools to schedule their algebra support courses in three specific
ways. First, double-dose algebra students should have the same teacher for their two periods of
algebra. Second, the two algebra periods should be offered consecutively. Third, double-dose
students should take their algebra support class with the same students who are in their regular
algebra class. Most CPS schools followed these recommendations in the initial year (Nomi and
Allensworth, 2009). For the 2003 cohort, 80 percent of double-dose students had the same teacher
for both courses, 72 percent took the two courses consecutively, and rates of overlap between
the two classes’ rosters exceeded 90 percent. By 2004, schools began to object to the scheduling
difficulties of assigning the same teacher to both periods so CPS removed that recommendation.
For the 2004 cohort, only 54 percent of double-dose students had the same teacher for both courses
and only 48 percent took the two courses consecutively. Overlap between the rosters remained,
however, close to 90%. In the analysis below, we explore whether the program’s impacts vary by
cohort in part because of this variation in implementation.
7The district made the new double-dose curricula and professional development available only to teachers teachingdouble-dose algebra courses, but there was a possibility of spillover effects for teachers in regular algebra. However, theprofessional development was geared towards helping teachers structure two periods of algebra instruction. Moreover,based on CPS officials and staff members’ observations of double-dose classrooms, they found that even teachers whotaught both single-period and double-dose algebra tended to differentiate their instruction between the two types ofclasses. Specifically, teachers tended to use new practices with the double-period class, but continued to use traditionalmethods with the single-period class. Teachers told them that they did not feel they needed to change methods withthe advanced students (i.e., non double-dose students), and that they were hesitant to try new practices that may bemore time-consuming with just a single period. The double period of algebra allowed these teachers to feel like theyhad the time to try new practices (e.g., cooperative groups).
5
The treatment under consideration here thus had many components. Assignment to double-
dose algebra doubled the amount of instructional time and exposed students to the curricula and
activities discussed above. As we will show, the recommendation that students take the two
classes with the same set of peers caused tracking by skill to increase, thus reducing classroom
heterogeneity. All of these factors were likely to, if anything, improve student outcomes. We will
also show, however, that the increase tracking by skill placed remediated students among sub-
stantially lower skilled peers than non-remediated students. Anecdotal evidence suggests that
remedial classes were taught by less experienced teachers. Both of these factors were likely to, if
anything, hurt student outcomes. Our estimates will capture the net impact of all of these compo-
nents.
3 Data and Descriptive Statistics
We use longitudinal data from CPS that tracks students from eighth grade through college enroll-
ment. These data include demographic information, detailed high school transcripts, numerous
standardized test scores, and graduation and college enrollment information. Our sample consists
of all students entering ninth-grade for the first time in the fall of 2003 and 2004. We include only
students who have valid 8th grade math scores and who enroll in freshman algebra. We include
only high schools in which at least one classroom of students was assigned to double-dose alge-
bra. For binary outcomes, students who leave the CPS school system are coded as zeroes. CPS
attempts to track students’ reasons for leaving. In our sample, students who leave CPS are about
evenly divided between those who are known dropouts, those leave for other schools (private
schools or public schools outside of Chicago), and those who reasons for leaving are unknown.
The summary statistics of the analytic sample are shown in Table 1. Column (1) includes the
entire sample and column (2) includes only students within 10 percentiles of the double-dose
threshold, our main analytic sample. Columns (3) and (4) separate that sample by cohort. As seen
in panel (A), about 90% of CPS students are black or Hispanic, with 20% in special education.
Though not shown here, over 90% of CPS students are low income as indicated by participation
in the federal subsidized lunch program. We will therefore use as controls more informative so-
6
cioeconomic and poverty measures constructed for each student’s residential block group from
the 2000 Census.
The first row of panel (B) shows our instrument, each student’s 8th grade score on the math
portion of the Iowa Test of Basic Skills (ITBS), which all CPS 8th graders are required to take. The
mean CPS student scores between the 45th and 46th percentiles on this nationally normed exam.
55% of CPS students score below the 50th percentile and thus should be assigned to double-dose
algebra, though the transcript data reveal that only 42% actually are assigned to this class. As a re-
sult, the average CPS freshman in our sample takes 1.4 math courses freshman year. The transcript
data allow for detailed exploration of the treatment itself. We construct variables, shown in panel
(B), showing the extent to which schools were complying with CPS’ guidelines for implementing
double-dose algebra. The average student attended a school in which 63% of double-dosed stu-
dents had their two algebra courses during consecutive periods, in which 71% of double-dosed
students had the same teacher for both courses, and in which 90% of double-dosed students’ reg-
ular algebra classmates were themselves double-dosed. Consistent with schools’ complaints that
scheduling double-dose algebra according to these guidelines was quite challenging, compliance
was substantially lower in 2004 than in 2003, as can be seen in columns (3) and (4).
We focus on two primary sets of outcomes. First, in panel (C), we explore whether double-
dosing helps students’s academic achievement by constructing a variety of variables measuring
grades, coursework and standardized test scores. The grades and coursework variables reveal
that only 62% of the full sample pass algebra, while even fewer pass higher level courses such
as geometry and trigonometry. Given that grades are subjective measures, we construct a variety
of test scores standardized by cohort, including the PLAN exam, which all CPS students take
in September of both their second and third years in high school, and the ACT exam, which all
CPS students take in April of their third year and is commonly used in the Midwest for college
applications.
Second, in panel (D), we explore whether double-dosing improves educational attainment by
constructing measures of high school graduation and college enrollment. Students are coded as
high school graduates if they received a regular CPS diploma within four or five years of starting
7
high school. About 50% of CPS students in our sample graduate high school within four years,
with another 5% graduating in their fifth year. CPS has matched its data on high school graduates
with National Student Clearinghouse data on college enrollment, allowing us to observe initial
college enrollment for any CPS student with a high school diploma. We construct indicators for
enrollment in college by October 1 of the fifth year after starting high school. Only 28% of our
sample both graduate from a CPS high school and enroll in college within this time frame. Of
these, 13% enroll in two-year colleges and 15% enroll in four-year colleges.
4 Empirical Strategy
Comparison of the outcomes of students who are and are not assigned to double-dosed algebra
would likely yield biased estimates of the policy’s impacts given potentially large differences in
unobserved characteristics between the two groups of students. To eliminate this potential bias,
we exploit the fact that students scoring below the 50th percentile on the 8th grade ITBS math
test were supposed to enroll in double-dose algebra. This rule allows us to identify the impact of
double-dose algebra using a regression discontinuity design applied to the two treated cohorts.
We use the assignment rule as an exogenous source of variation in the probability that a given
student will be remediated.
We implement the regression discontinuity approach using the regressions below:
Yit = α0 + α1lowscoreit + α2math8it + α3lowscoreit ∗math8it + εit (1)
DoubleDoseit = γ0 + γ1lowscoreit + γ2math8it + γ3lowscoreit ∗math8it + εit (2)
Yit = β0 + β1DoubleDoseit + β2math8it + β3lowscoreit ∗math8it + εit (3)
where for student i in cohort t, lowscore indicates an 8th grade math score below the 50th per-
centile, math8 is each student’s 8th grade math score re-centered around the 50th percentile cut-
off, DoubleDose is an indicator for assignment to the extra algebra period, and Y represents an
outcome of interest. The lowscore coefficient (α1) from equation (1) estimates the discontinuity
of interest by comparing the outcomes of students just below and just above the double-dose
8
threshold. This reduced form equation produces an intent-to-treat estimate because of imperfect
compliance with the assignment rule. The lowscore coefficient (γ1) from the first stage equation
(2) measures the difference in double-dose rates between students just below and just above the
threshold.
Our ultimate estimate of interest is thus the DoubleDose coefficient (β1) from equation (3), in
which DoubleDose has been instrumented with lowscore using that first stage. This approach
estimates a local average treatment effect of double-dose algebra for students near the 50th per-
centile of 8th grade math skill. Here, students just above the threshold serve as a control group for
students just below the threshold, so that these estimates will be unbiased under the assumption
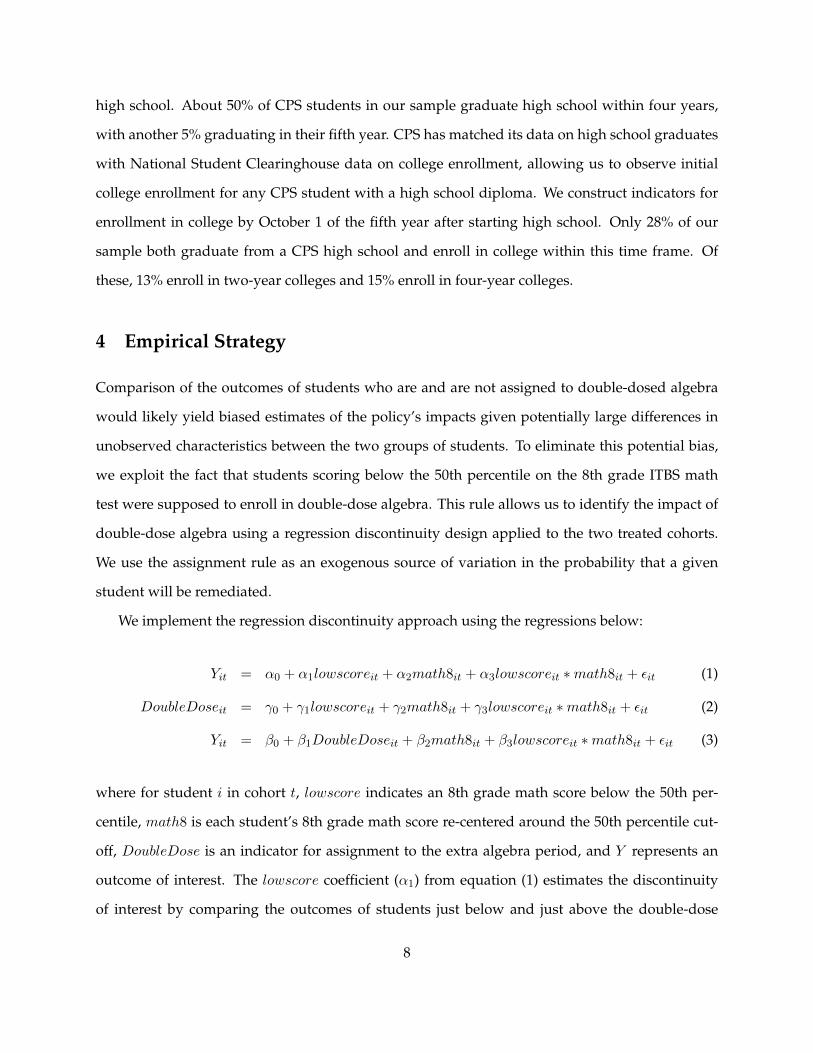
that no other factors change discontinuously around the threshold itself. We show in figure 1 that
the density of 8th grade math scores is quite smooth around the cutoff, suggesting little scope
for manipulation of such scores by students or teachers and little impact of the threshold on the
probability of appearing in our sample.
Our preferred specification will fit straight lines on either side of the threshold using a band-
width of 10 percentiles, and will also control for gender, race, special education status, socioeco-
nomic and poverty measures, and 8th grade reading scores. We will show that our central results
are robust to alternative choices of controls and bandwidths. In all specifications, heteroskedas-
ticity robust standard errors will be clustered by each student’s initial high school to account for
within high school correlations in the error terms.
5 The Treatment
We first explore the treatment itself to learn more about how the double-dose algebra policy was
changing students’ freshman year experiences. Before turning to regression results, we look at
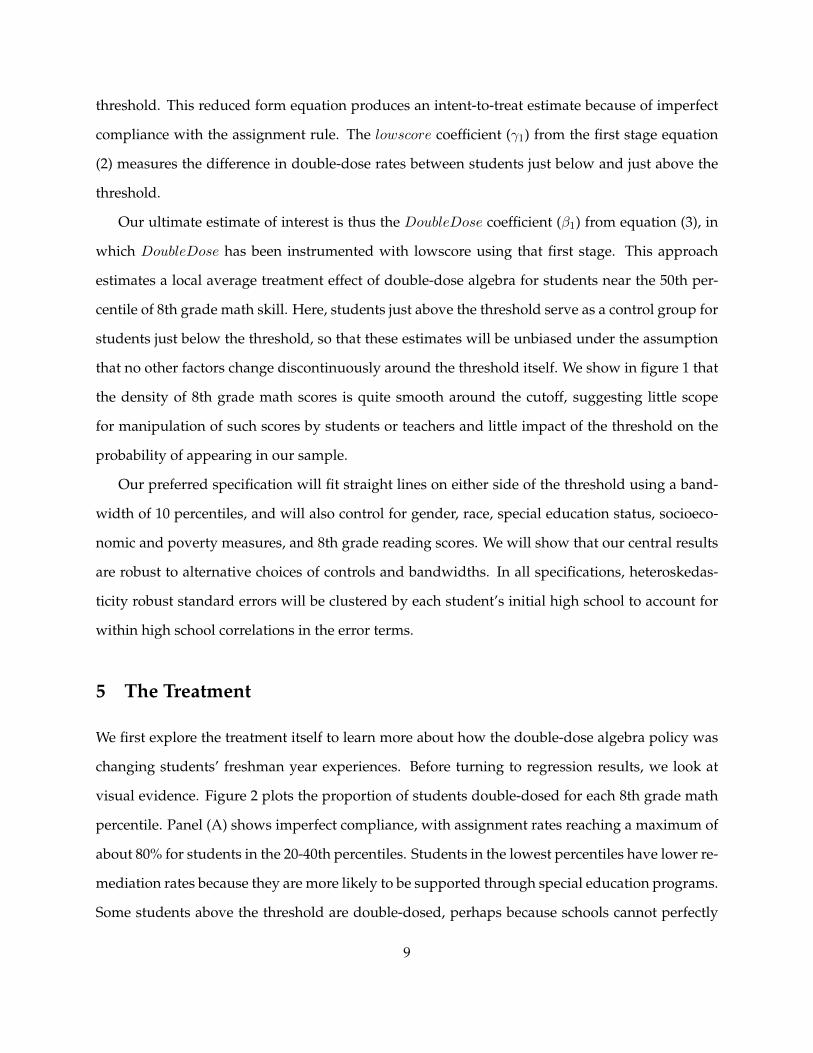
visual evidence. Figure 2 plots the proportion of students double-dosed for each 8th grade math
percentile. Panel (A) shows imperfect compliance, with assignment rates reaching a maximum of
about 80% for students in the 20-40th percentiles. Students in the lowest percentiles have lower re-
mediation rates because they are more likely to be supported through special education programs.
Some students above the threshold are double-dosed, perhaps because schools cannot perfectly
9
divide students into appropriately sized classes by the assignment rule. Panel (B) reveals that
compliance for students just below the threshold is substantially lower in the 2004 cohort than the
2003 cohort, providing further motivation to analyze program impacts separately by cohort.
Table 2 shows the first-stage results using a low 8th grade math score indicator as an instru-
ment for assignment to double-dose algebra. Panel (A) pools the cohorts while panel (B) allows
the estimate to vary by cohort. Column (1) implements equation equation (2), including only co-
hort indicators as controls. Column (2) adds demographic and test score controls as described in
the table. Column (3) includes those controls and high school fixed effects. Column (4) expands
the bandwidth from 10 to 20 percentiles and fits quadratic functions on either side of the threshold
instead of linear functions.
The first-stage discontinuity estimates suggest that students just below the threshold were 40
percentage points more likely to be double-dosed than students just above the threshold. Con-
sistent with Figure 2, this discontinuity was much larger in 2003 (48 percentage points) than in
2004 (32 percentage points), further motivating our decision throughout the paper to explore dif-
ferential impacts by cohort. These estimates are highly robust to inclusion of controls, inclusion of
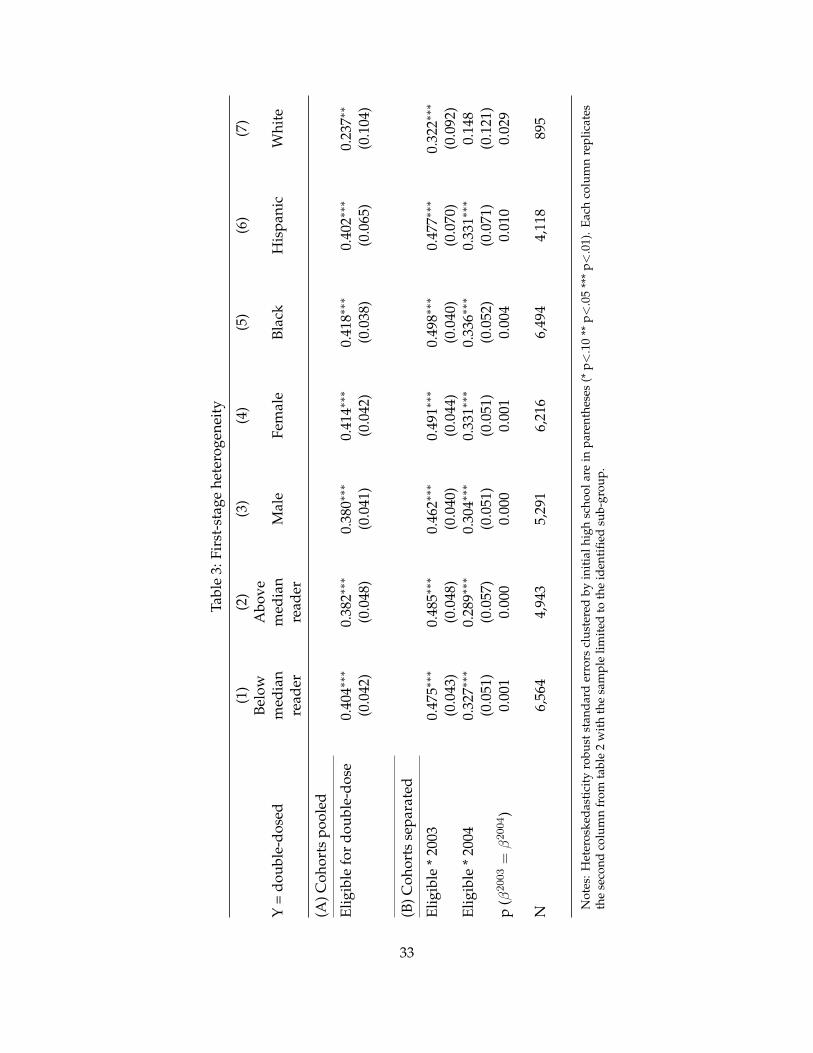
high school fixed effects, and to alternative bandwidth and functional form assumptions. Table 3
explores heterogeneity by reading skill, by gender and by race/ethnicity. Each column replicates
the second column from table 2 with the sample limited to the identified sub-group. There is little
indication of differential compliance by reading skill, gender or race/ethnicity, with the excep-
tion of lower compliance rates among the small number of white students in our sample. These
patterns hold true for both cohorts.
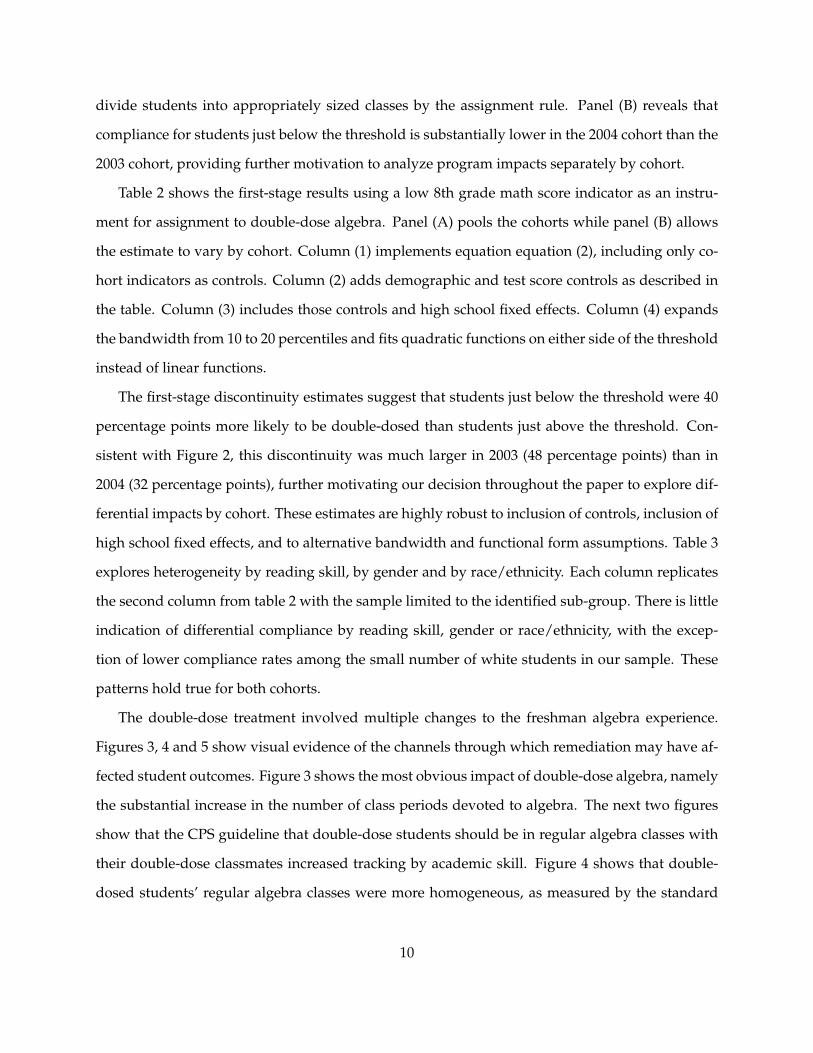
The double-dose treatment involved multiple changes to the freshman algebra experience.
Figures 3, 4 and 5 show visual evidence of the channels through which remediation may have af-
fected student outcomes. Figure 3 shows the most obvious impact of double-dose algebra, namely
the substantial increase in the number of class periods devoted to algebra. The next two figures
show that the CPS guideline that double-dose students should be in regular algebra classes with
their double-dose classmates increased tracking by academic skill. Figure 4 shows that double-
dosed students’ regular algebra classes were more homogeneous, as measured by the standard
10
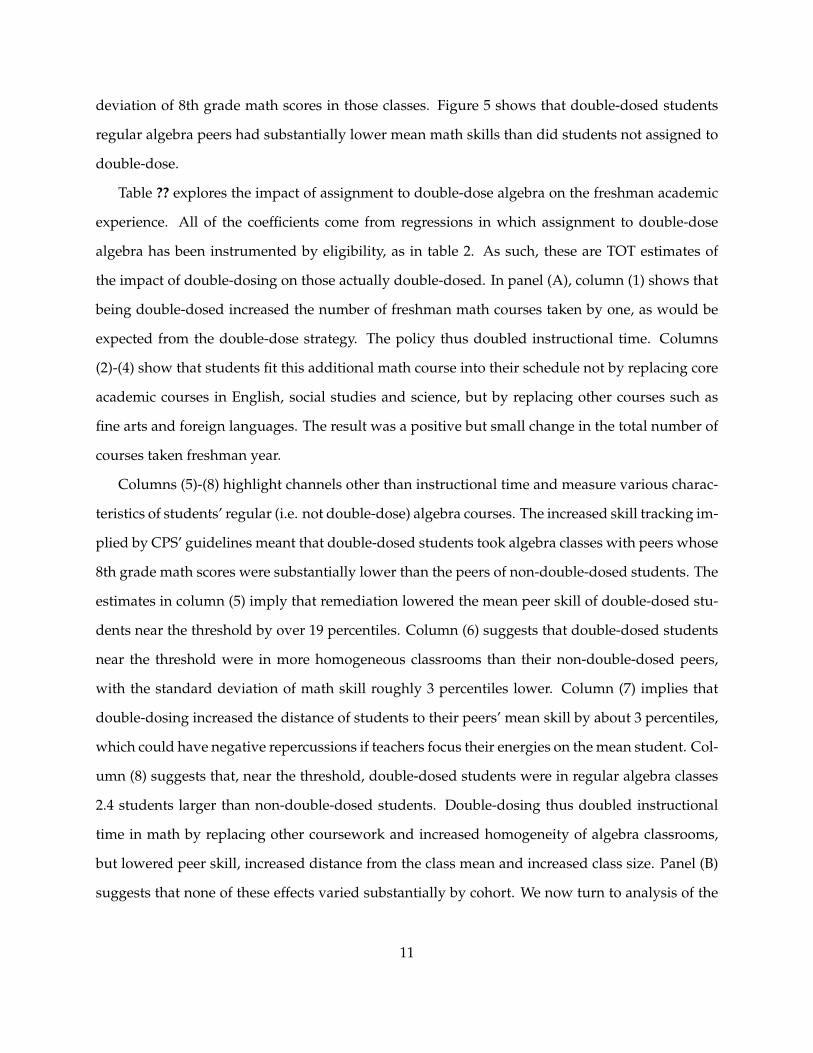
deviation of 8th grade math scores in those classes. Figure 5 shows that double-dosed students
regular algebra peers had substantially lower mean math skills than did students not assigned to
double-dose.
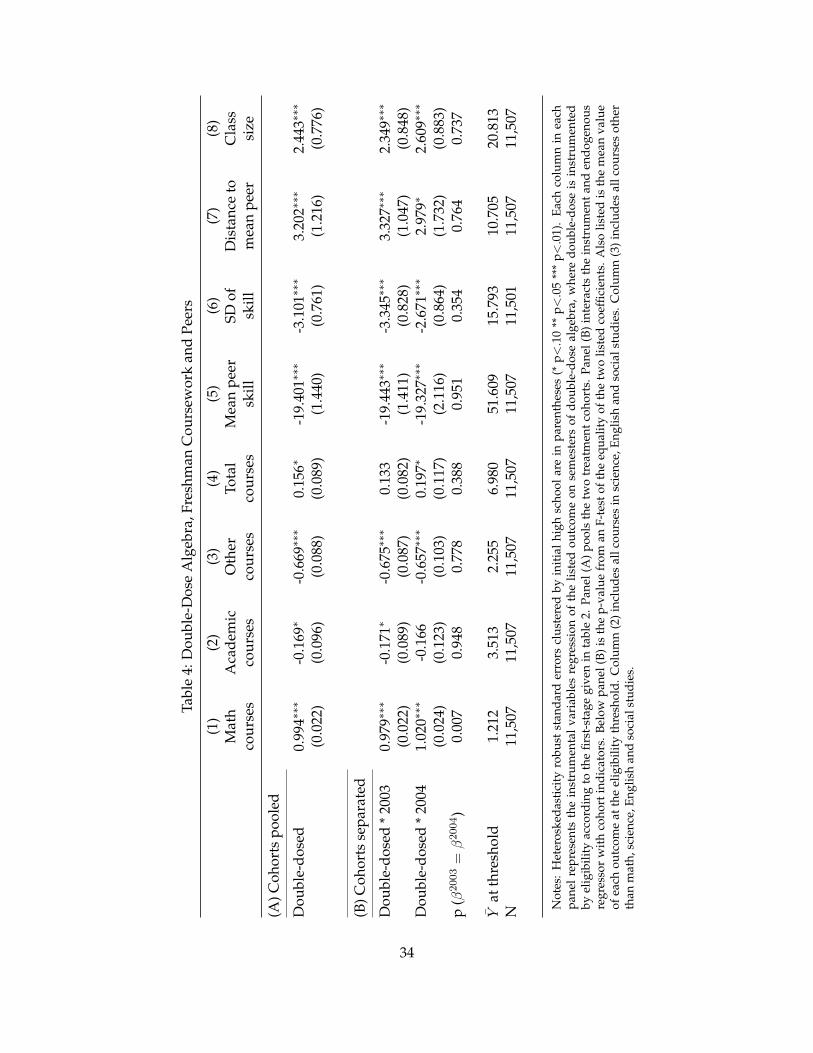
Table ?? explores the impact of assignment to double-dose algebra on the freshman academic
experience. All of the coefficients come from regressions in which assignment to double-dose
algebra has been instrumented by eligibility, as in table 2. As such, these are TOT estimates of
the impact of double-dosing on those actually double-dosed. In panel (A), column (1) shows that
being double-dosed increased the number of freshman math courses taken by one, as would be
expected from the double-dose strategy. The policy thus doubled instructional time. Columns
(2)-(4) show that students fit this additional math course into their schedule not by replacing core
academic courses in English, social studies and science, but by replacing other courses such as
fine arts and foreign languages. The result was a positive but small change in the total number of
courses taken freshman year.
Columns (5)-(8) highlight channels other than instructional time and measure various charac-
teristics of students’ regular (i.e. not double-dose) algebra courses. The increased skill tracking im-
plied by CPS’ guidelines meant that double-dosed students took algebra classes with peers whose
8th grade math scores were substantially lower than the peers of non-double-dosed students. The
estimates in column (5) imply that remediation lowered the mean peer skill of double-dosed stu-
dents near the threshold by over 19 percentiles. Column (6) suggests that double-dosed students
near the threshold were in more homogeneous classrooms than their non-double-dosed peers,
with the standard deviation of math skill roughly 3 percentiles lower. Column (7) implies that
double-dosing increased the distance of students to their peers’ mean skill by about 3 percentiles,
which could have negative repercussions if teachers focus their energies on the mean student. Col-
umn (8) suggests that, near the threshold, double-dosed students were in regular algebra classes
2.4 students larger than non-double-dosed students. Double-dosing thus doubled instructional
time in math by replacing other coursework and increased homogeneity of algebra classrooms,
but lowered peer skill, increased distance from the class mean and increased class size. Panel (B)
suggests that none of these effects varied substantially by cohort. We now turn to analysis of the
11
overall impact of these various changes on coursework, test scores and educational attainment.
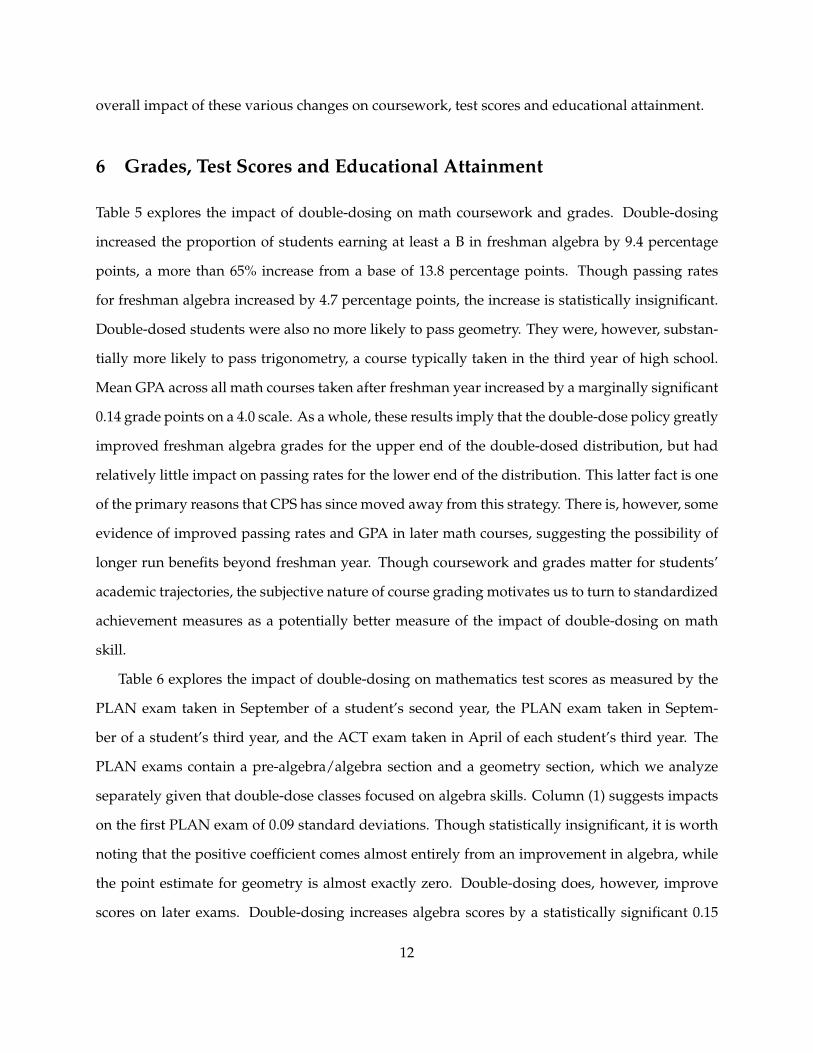
6 Grades, Test Scores and Educational Attainment
Table 5 explores the impact of double-dosing on math coursework and grades. Double-dosing
increased the proportion of students earning at least a B in freshman algebra by 9.4 percentage
points, a more than 65% increase from a base of 13.8 percentage points. Though passing rates
for freshman algebra increased by 4.7 percentage points, the increase is statistically insignificant.
Double-dosed students were also no more likely to pass geometry. They were, however, substan-
tially more likely to pass trigonometry, a course typically taken in the third year of high school.
Mean GPA across all math courses taken after freshman year increased by a marginally significant
0.14 grade points on a 4.0 scale. As a whole, these results imply that the double-dose policy greatly
improved freshman algebra grades for the upper end of the double-dosed distribution, but had
relatively little impact on passing rates for the lower end of the distribution. This latter fact is one
of the primary reasons that CPS has since moved away from this strategy. There is, however, some
evidence of improved passing rates and GPA in later math courses, suggesting the possibility of
longer run benefits beyond freshman year. Though coursework and grades matter for students’
academic trajectories, the subjective nature of course grading motivates us to turn to standardized
achievement measures as a potentially better measure of the impact of double-dosing on math
skill.
Table 6 explores the impact of double-dosing on mathematics test scores as measured by the
PLAN exam taken in September of a student’s second year, the PLAN exam taken in Septem-
ber of a student’s third year, and the ACT exam taken in April of each student’s third year. The
PLAN exams contain a pre-algebra/algebra section and a geometry section, which we analyze
separately given that double-dose classes focused on algebra skills. Column (1) suggests impacts
on the first PLAN exam of 0.09 standard deviations. Though statistically insignificant, it is worth
noting that the positive coefficient comes almost entirely from an improvement in algebra, while
the point estimate for geometry is almost exactly zero. Double-dosing does, however, improve
scores on later exams. Double-dosing increases algebra scores by a statistically significant 0.15
12
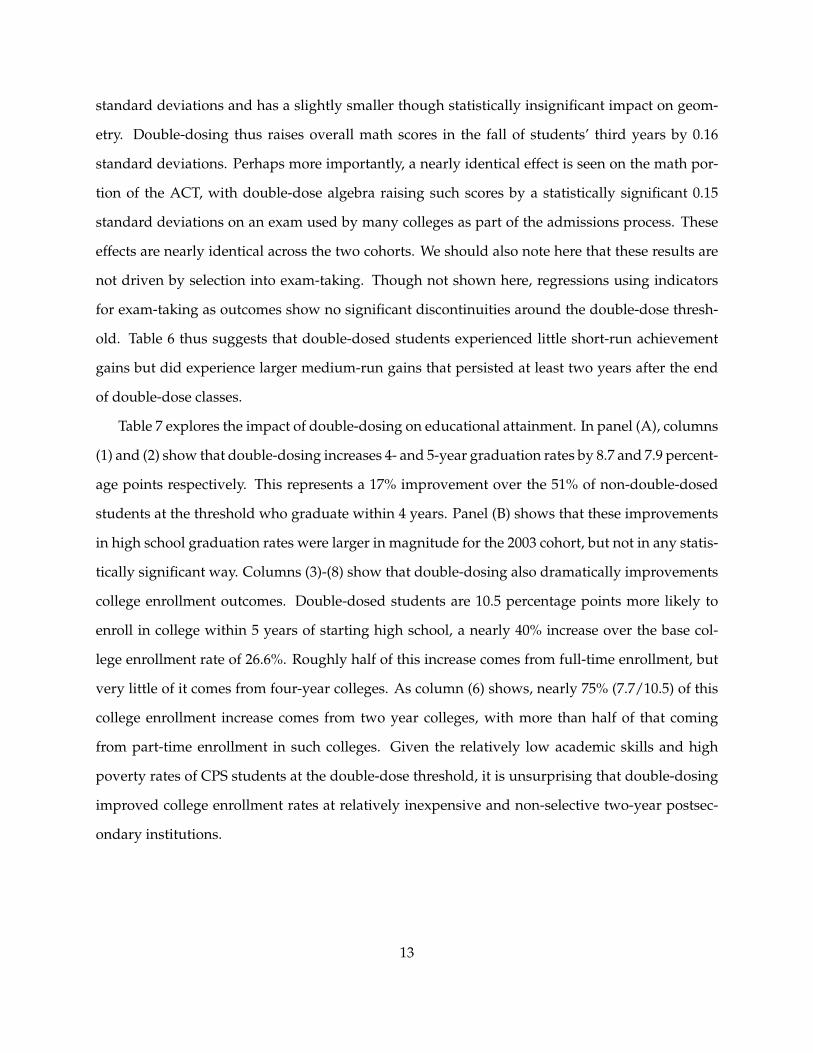
standard deviations and has a slightly smaller though statistically insignificant impact on geom-
etry. Double-dosing thus raises overall math scores in the fall of students’ third years by 0.16
standard deviations. Perhaps more importantly, a nearly identical effect is seen on the math por-
tion of the ACT, with double-dose algebra raising such scores by a statistically significant 0.15
standard deviations on an exam used by many colleges as part of the admissions process. These
effects are nearly identical across the two cohorts. We should also note here that these results are
not driven by selection into exam-taking. Though not shown here, regressions using indicators
for exam-taking as outcomes show no significant discontinuities around the double-dose thresh-
old. Table 6 thus suggests that double-dosed students experienced little short-run achievement
gains but did experience larger medium-run gains that persisted at least two years after the end
of double-dose classes.
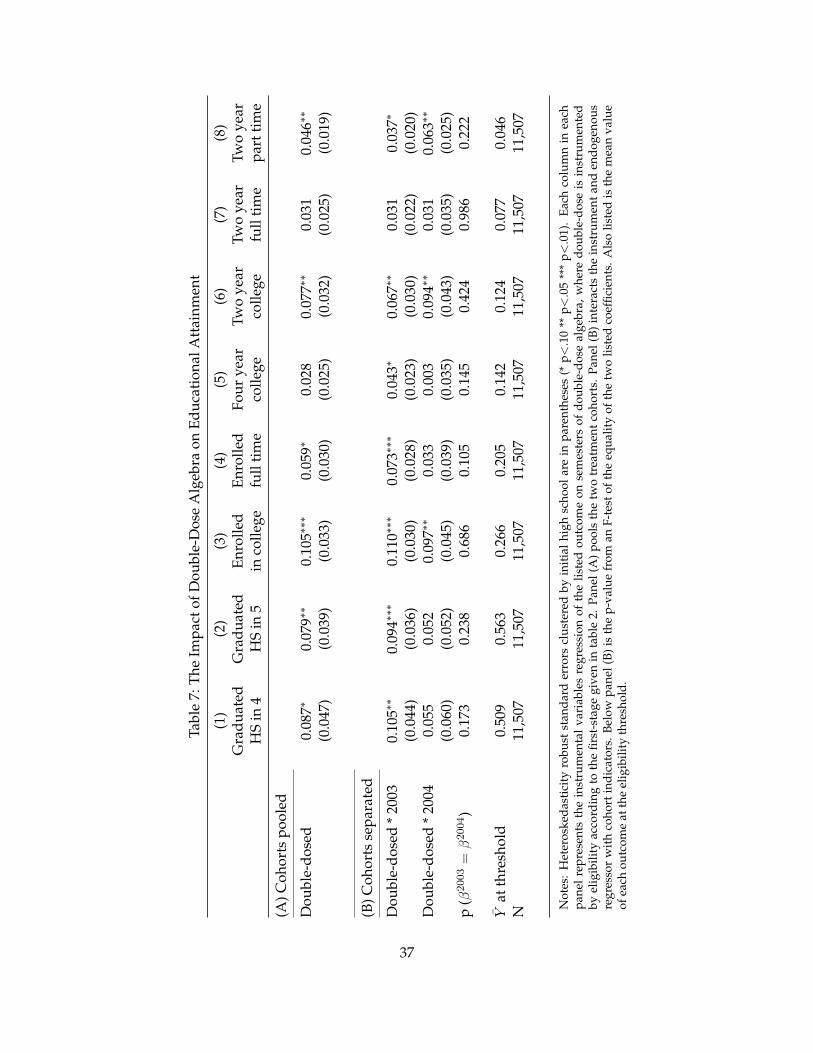
Table 7 explores the impact of double-dosing on educational attainment. In panel (A), columns
(1) and (2) show that double-dosing increases 4- and 5-year graduation rates by 8.7 and 7.9 percent-
age points respectively. This represents a 17% improvement over the 51% of non-double-dosed
students at the threshold who graduate within 4 years. Panel (B) shows that these improvements
in high school graduation rates were larger in magnitude for the 2003 cohort, but not in any statis-
tically significant way. Columns (3)-(8) show that double-dosing also dramatically improvements
college enrollment outcomes. Double-dosed students are 10.5 percentage points more likely to
enroll in college within 5 years of starting high school, a nearly 40% increase over the base col-
lege enrollment rate of 26.6%. Roughly half of this increase comes from full-time enrollment, but
very little of it comes from four-year colleges. As column (6) shows, nearly 75% (7.7/10.5) of this
college enrollment increase comes from two year colleges, with more than half of that coming
from part-time enrollment in such colleges. Given the relatively low academic skills and high
poverty rates of CPS students at the double-dose threshold, it is unsurprising that double-dosing
improved college enrollment rates at relatively inexpensive and non-selective two-year postsec-
ondary institutions.
13
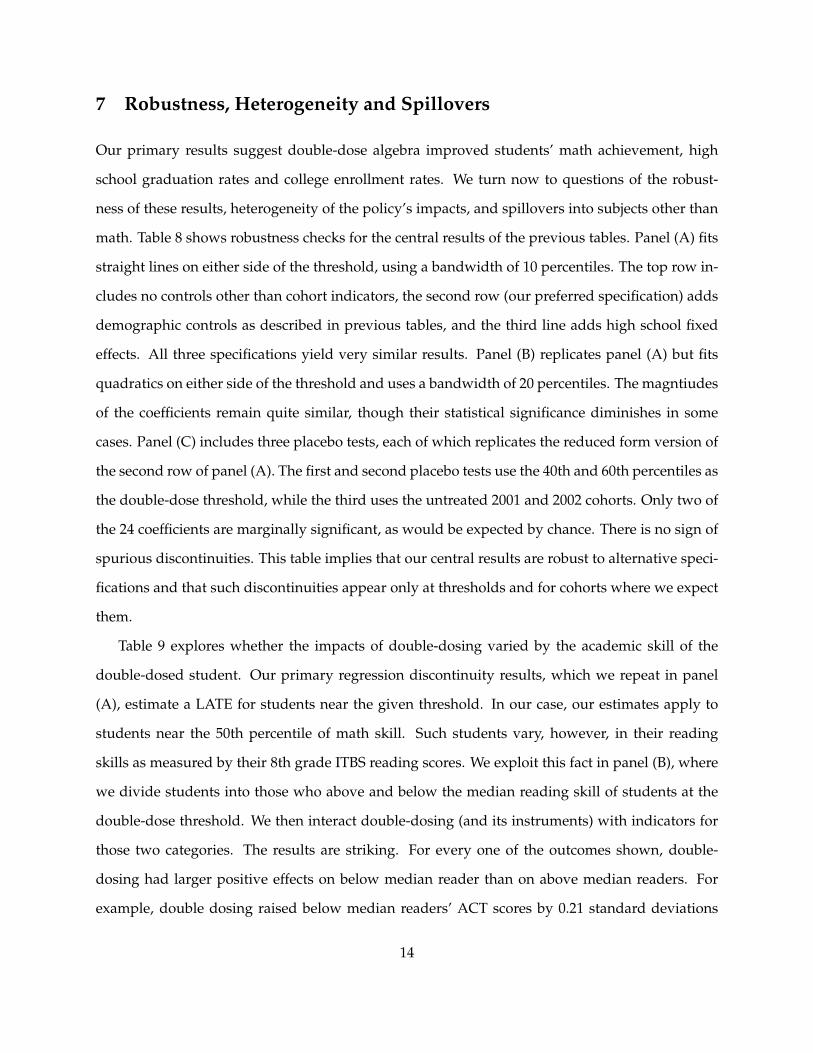
7 Robustness, Heterogeneity and Spillovers
Our primary results suggest double-dose algebra improved students’ math achievement, high
school graduation rates and college enrollment rates. We turn now to questions of the robust-
ness of these results, heterogeneity of the policy’s impacts, and spillovers into subjects other than
math. Table 8 shows robustness checks for the central results of the previous tables. Panel (A) fits
straight lines on either side of the threshold, using a bandwidth of 10 percentiles. The top row in-
cludes no controls other than cohort indicators, the second row (our preferred specification) adds
demographic controls as described in previous tables, and the third line adds high school fixed
effects. All three specifications yield very similar results. Panel (B) replicates panel (A) but fits
quadratics on either side of the threshold and uses a bandwidth of 20 percentiles. The magntiudes
of the coefficients remain quite similar, though their statistical significance diminishes in some
cases. Panel (C) includes three placebo tests, each of which replicates the reduced form version of
the second row of panel (A). The first and second placebo tests use the 40th and 60th percentiles as
the double-dose threshold, while the third uses the untreated 2001 and 2002 cohorts. Only two of
the 24 coefficients are marginally significant, as would be expected by chance. There is no sign of
spurious discontinuities. This table implies that our central results are robust to alternative speci-
fications and that such discontinuities appear only at thresholds and for cohorts where we expect
them.
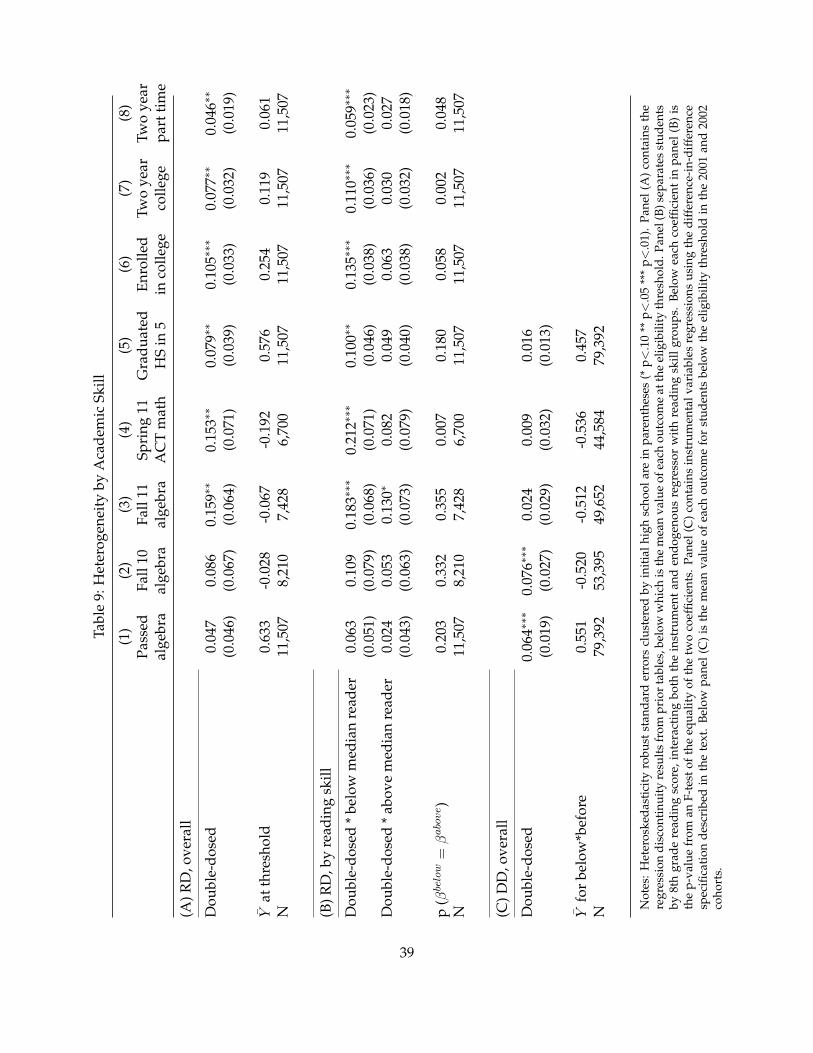
Table 9 explores whether the impacts of double-dosing varied by the academic skill of the
double-dosed student. Our primary regression discontinuity results, which we repeat in panel
(A), estimate a LATE for students near the given threshold. In our case, our estimates apply to
students near the 50th percentile of math skill. Such students vary, however, in their reading
skills as measured by their 8th grade ITBS reading scores. We exploit this fact in panel (B), where
we divide students into those who above and below the median reading skill of students at the
double-dose threshold. We then interact double-dosing (and its instruments) with indicators for
those two categories. The results are striking. For every one of the outcomes shown, double-
dosing had larger positive effects on below median reader than on above median readers. For
example, double dosing raised below median readers’ ACT scores by 0.21 standard deviations
14
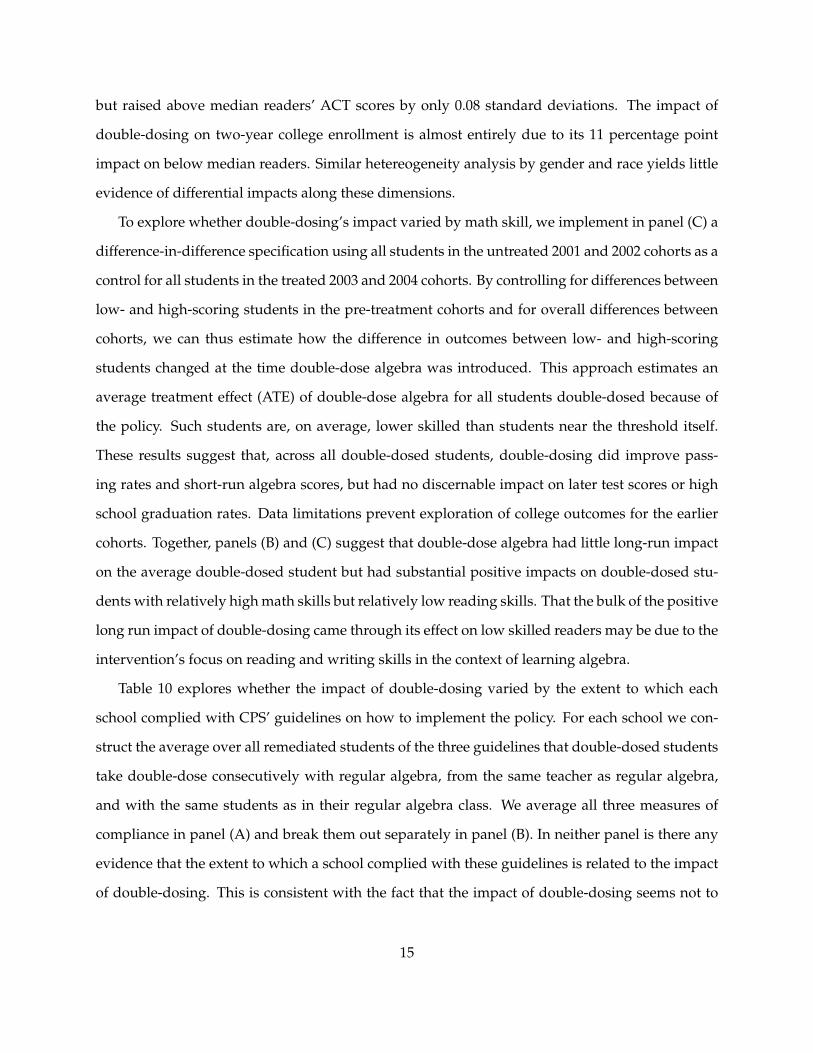
but raised above median readers’ ACT scores by only 0.08 standard deviations. The impact of
double-dosing on two-year college enrollment is almost entirely due to its 11 percentage point
impact on below median readers. Similar hetereogeneity analysis by gender and race yields little
evidence of differential impacts along these dimensions.
To explore whether double-dosing’s impact varied by math skill, we implement in panel (C) a
difference-in-difference specification using all students in the untreated 2001 and 2002 cohorts as a
control for all students in the treated 2003 and 2004 cohorts. By controlling for differences between
low- and high-scoring students in the pre-treatment cohorts and for overall differences between
cohorts, we can thus estimate how the difference in outcomes between low- and high-scoring
students changed at the time double-dose algebra was introduced. This approach estimates an
average treatment effect (ATE) of double-dose algebra for all students double-dosed because of
the policy. Such students are, on average, lower skilled than students near the threshold itself.
These results suggest that, across all double-dosed students, double-dosing did improve pass-
ing rates and short-run algebra scores, but had no discernable impact on later test scores or high
school graduation rates. Data limitations prevent exploration of college outcomes for the earlier
cohorts. Together, panels (B) and (C) suggest that double-dose algebra had little long-run impact
on the average double-dosed student but had substantial positive impacts on double-dosed stu-
dents with relatively high math skills but relatively low reading skills. That the bulk of the positive
long run impact of double-dosing came through its effect on low skilled readers may be due to the
intervention’s focus on reading and writing skills in the context of learning algebra.
Table 10 explores whether the impact of double-dosing varied by the extent to which each
school complied with CPS’ guidelines on how to implement the policy. For each school we con-
struct the average over all remediated students of the three guidelines that double-dosed students
take double-dose consecutively with regular algebra, from the same teacher as regular algebra,
and with the same students as in their regular algebra class. We average all three measures of
compliance in panel (A) and break them out separately in panel (B). In neither panel is there any
evidence that the extent to which a school complied with these guidelines is related to the impact
of double-dosing. This is consistent with the fact that the impact of double-dosing seems not to
15
have varied by cohort, even though schools were less likely to comply with the guidelines for the
second cohort. CPS’ focus on these guidelines may therefore have been misplaced.
Finally, the increased focus on algebra at the cost of other coursework may potentially have
affected achievement in other academic subjects. Table 11 looks at outcomes in other subjects.
We find strong evidence that, rather than harming other achievement, double-dosing had positive
spillovers in reading and science. Double-dosed students scored nearly 0.2 standard deviations
higher on the verbal portion of their ACTs, were substantially more likely to pass chemistry classes
usually taken in 10th or 11th grade, and had marginally high GPAs across all of their non-math
classes in years after 9th grade. If anything, the skills gained in double-dose algebra seem to have
helped, not hindered, students in other subjects and subsequent years.
8 Conclusion
We provide the first evidnce of positive and substantial long run impacts of intensive math edu-
cation on college entrance exam scores, high school graduation rates and college enrollment rates.
We also show that the intervention was most successful for students with relatively high math
skills but relatively low readings skills. The intervention was not particularly effective for the av-
erage affected student. Given the number of school districts that struggle with low-performing
and at-risk students, the possibility that such an intervention might improve high school gradua-
tion and college enrollment rates for a subset of such students is extraordinarily promising.
16
REFERENCESAaronson, D., Barrow, L., and Sander, W. (2002). ”Teachers and student achievement in theChicago public high schools.” Working Paper Series WP-02-28, Federal Reserve Bank of Chicago.
Bryk, A. S., Lee, V. E., and Holland, P. B. (1993). Catholic schools and the common good. Cam-bridge, MA: Harvard University Press.
Bettinger, E. and Long, B.T. (2009). ”Addressing the Needs of Under-Prepared College Students:Does College Remediation Work?” Journal of Human Resources. 44(3): 736-771
Calcagno, C. and Long, B.T. (2008). ”The Impact of Postsecondary Remediation Using a Re-gression Discontinuity Approach: Addressing Endogenous Sorting and Noncompliance.” NCPRWorking Paper.
Cullen, J., Jacob, B. and Levitt, S. (2005). ”The Impact of School Choice on Student Outcomes:An Analysis of the Chicago Public Schools.” Journal of Public Economics. 89(5-6): 729-760.
Cullen, J., Jacob, B. and Levitt, S. (2006). ”The Effect of School Choice on Student Outcomes:Evidence from Randomized Lotteries.” Econometrica. 74(5): 1191-1230.
Goodman, J. (2009). ”The Labor of Division: The Labor Market Returns to Compulsory MathCoursework.” Unpublished manuscript, Harvard Kennedy School.
Jacob, B. (2005). ”Accountability, Incentives and Behavior: Evidence from School Reform inChicago.” Journal of Public Economics. 89(5-6): 761-796.
Jacob, B. and Lefgren, L. (2003). ”Are Idle Hands the Devil’s Workshop? Incapacitation, Con-centration and Juvenile Crime.” NBER Working Papers No. 9653.
Jacob, B. and Lefgren, L. (2004). ”Remedial Education and Student Achievement: A Regression-Discontinuity Analysis.” Review of Economics and Statistics. LXXXVI (1): 226-244.
Jacob, B. and Levitt, S. (2003). ”Rotten Apples: An Investigation of the Prevalence and Predic-tors of Teacher Cheating.” Quarterly Journal of Economics. 118(3): 843-877.
Lavy, V. and Schlosser, A. (2005). ”Targeted Remedial Education for Underperforming Teenagers:Costs and Benefits.” Journal of Labor Economics. 23(4): 839-874.
Lee, V. E., Croninger, R.G. and Smith, J.B. (1997). ”Course taking, equity, and mathematics learn-ing: Testing the constrained curriculum hypothesis in U.S. secondary schools.” Educational Eval-uation and Policy Analysis. 19(2): 99-121.
Lee, V. E., Smith, J.B, and Croninger, R.G. (1997). ”How high school organization influences theequitable distribution of learning in mathematics and science.” Sociology of Education. 70(2): 129-152.
17
National Commission on Excellence in Education. (1983). A Nation at risk: The imperative foreducation reform. Washington, DC: U.S. Government Printing Office.
National Governors Association Center for Best Practices. (2005a). Getting it done: Ten stepsfor a state action agenda. (Retrieved from: http://www.nga.org/Files/pdf/05warnerguide.pdf.)
National Governors Association Center for Best Practices. (2005b). A profile of state action toimprove America’s high schools.
Nomi, T., and Allensworth, E. (2009). ”Double-dose” algebra as an alternative strategy to remedi-ation: Effects on students’ academic outcomes.” Journal of Research on Educational Effectiveness.2: 111-148.
Roderick, M., and Camburn, E. (1999). ”Risk and recovery from course failure in the early yearsof high school.” American Educational Research Journal. 36: 303-343.
Starkel, R., Martinez, J., and Price, K. (2006). ”Two-period Algebra in the 05-06 school year: Im-plementation Report.”
U.S. Department of Education, National Center for Education Statistics (2004). The Conditionof Education 2004 (NCES 2004-077). Washington, DC: U.S. Government Printing Office.
U.S. Department of Education, National Center for Education Statistics. (2011). Digest of Edu-cation Statistics, 2010 (NCES 2011-015), Table 235.
Wenzel, S., Lawal, K., Conway, B., Fendt, C., and Stoelinga, S. (2005). ”Algebra problem solv-ing: Teachers talk about their experiences, December 2004.” Retrieved May 3, 2012 from
18
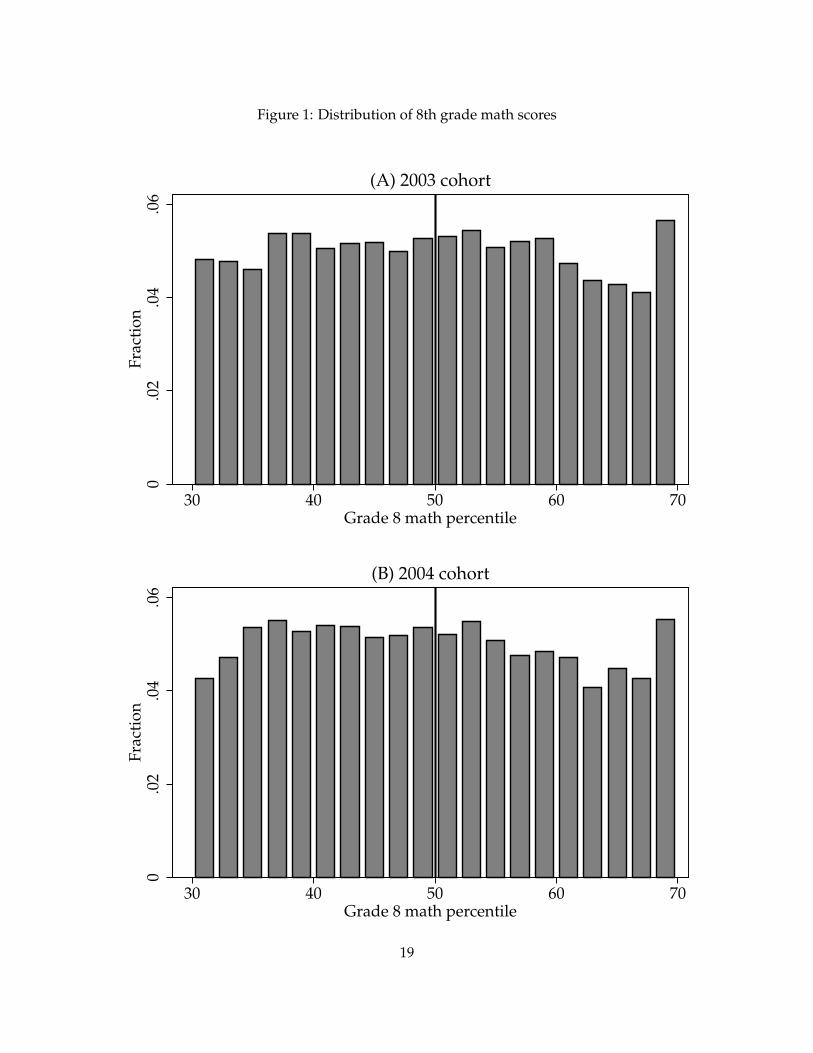
Figure 1: Distribution of 8th grade math scores
0.0
2.0
4.0
6F
ract
ion
30 40 50 60 70Grade 8 math percentile
(A) 2003 cohort
0.0
2.0
4.0
6F
ract
ion
30 40 50 60 70Grade 8 math percentile
(B) 2004 cohort
19
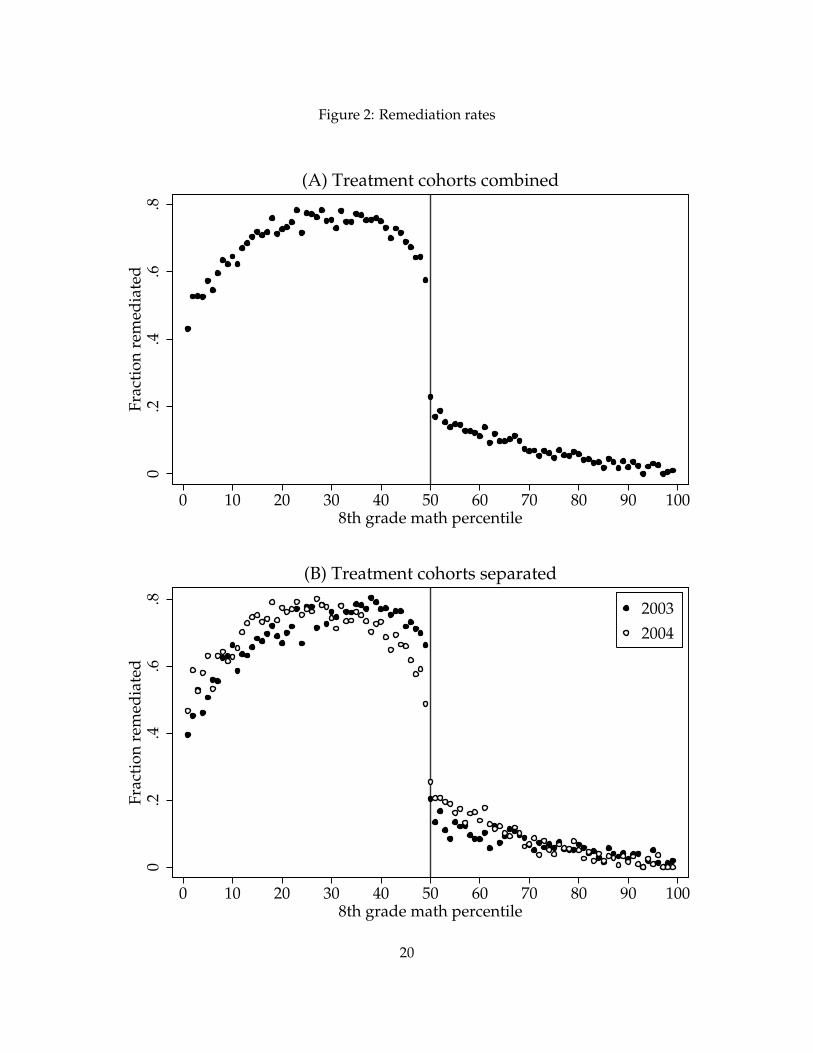
Figure 2: Remediation rates
0.2
.4.6
.8F
ract
ion
rem
edia
ted
0 10 20 30 40 50 60 70 80 90 1008th grade math percentile
(A) Treatment cohorts combined
0.2
.4.6
.8F
ract
ion
rem
edia
ted
0 10 20 30 40 50 60 70 80 90 1008th grade math percentile
2003
2004
(B) Treatment cohorts separated
20
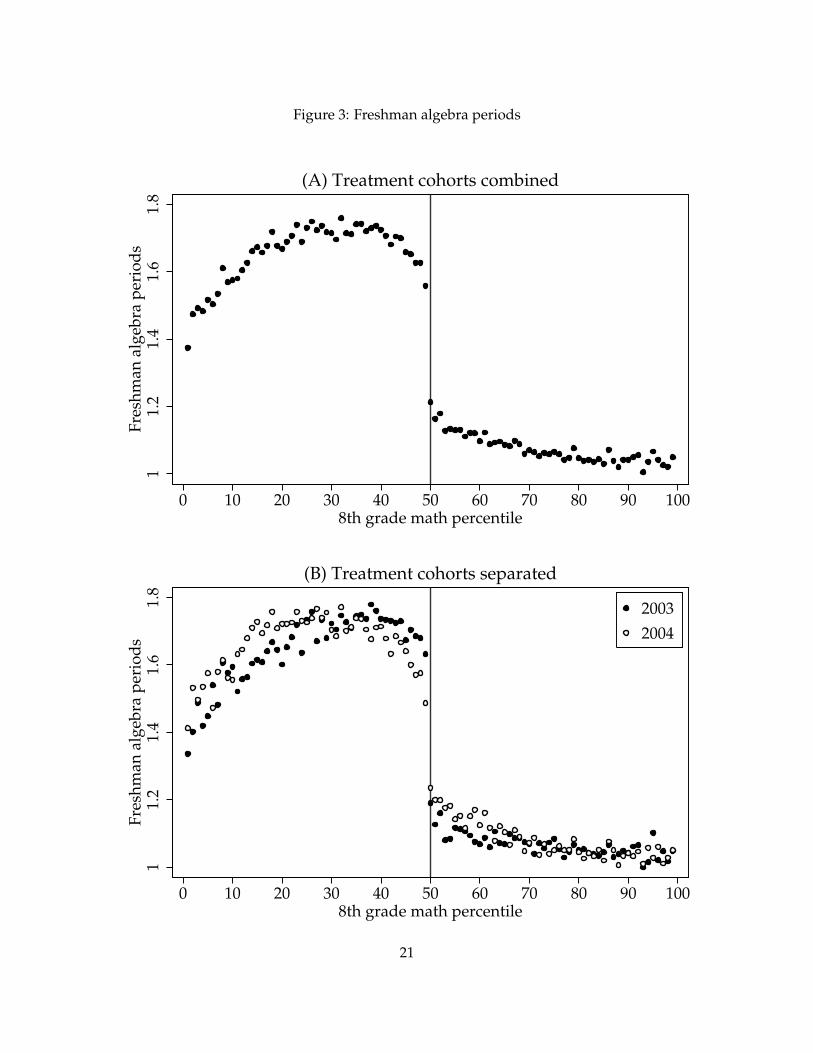
Figure 3: Freshman algebra periods
11.
21.
41.
61.
8F
resh
man
alg
ebra
per
iod
s
0 10 20 30 40 50 60 70 80 90 1008th grade math percentile
(A) Treatment cohorts combined
11.
21.
41.
61.
8F
resh
man
alg
ebra
per
iod
s
0 10 20 30 40 50 60 70 80 90 1008th grade math percentile
2003
2004
(B) Treatment cohorts separated
21
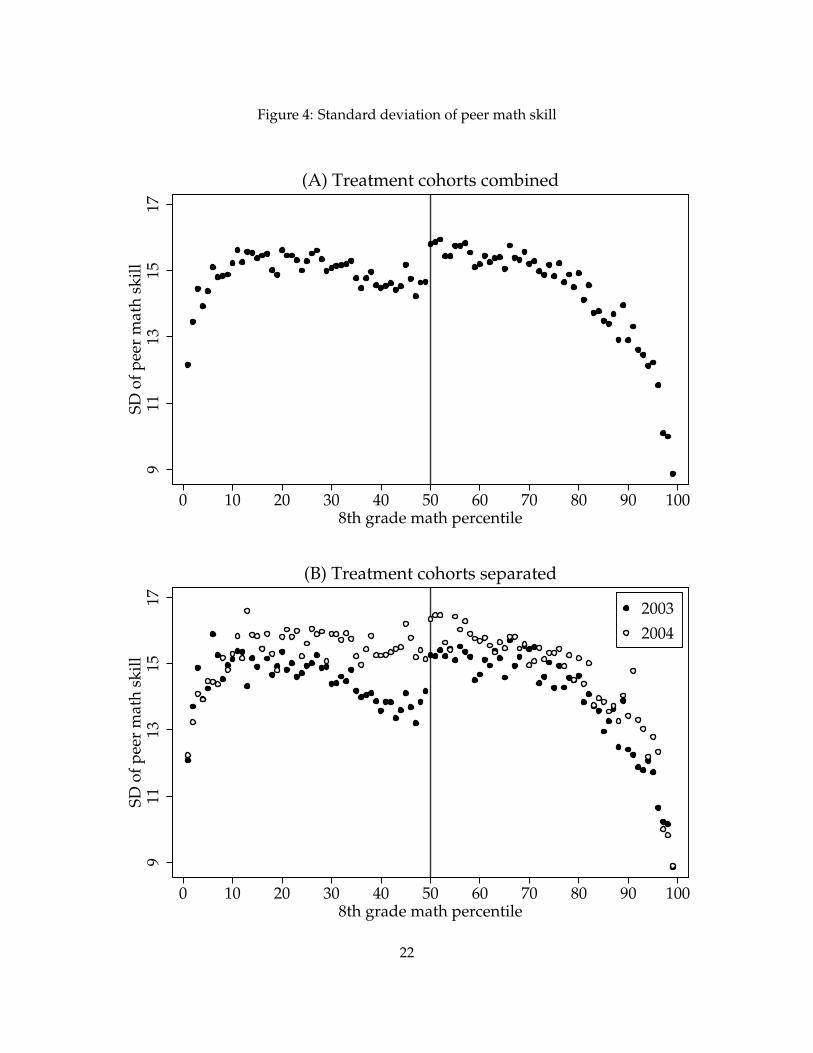
Figure 4: Standard deviation of peer math skill
911
1315
17S
D o
f p
eer
mat
h s
kil
l
0 10 20 30 40 50 60 70 80 90 1008th grade math percentile
(A) Treatment cohorts combined
911
1315
17S
D o
f p
eer
mat
h s
kil
l
0 10 20 30 40 50 60 70 80 90 1008th grade math percentile
2003
2004
(B) Treatment cohorts separated
22
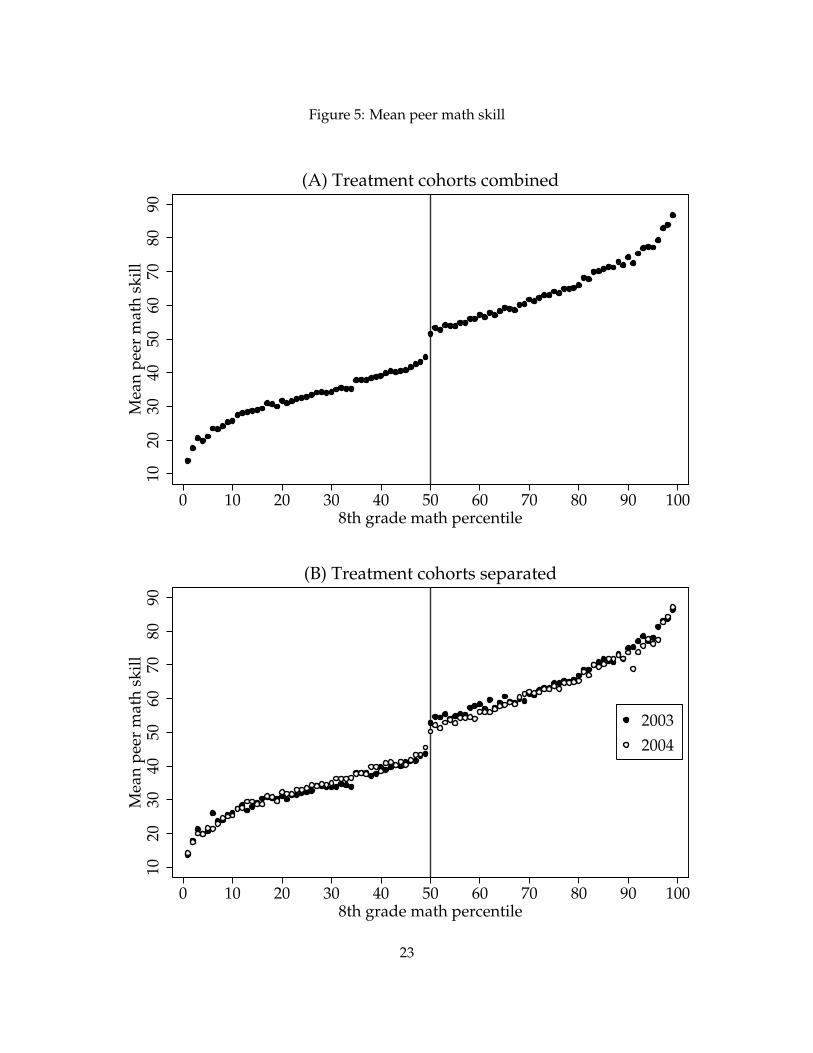
Figure 5: Mean peer math skill
1020
3040
5060
7080
90M
ean
pee
r m
ath
sk
ill
0 10 20 30 40 50 60 70 80 90 1008th grade math percentile
(A) Treatment cohorts combined
1020
3040
5060
7080
90M
ean
pee
r m
ath
sk
ill
0 10 20 30 40 50 60 70 80 90 1008th grade math percentile
2003
2004
(B) Treatment cohorts separated
23
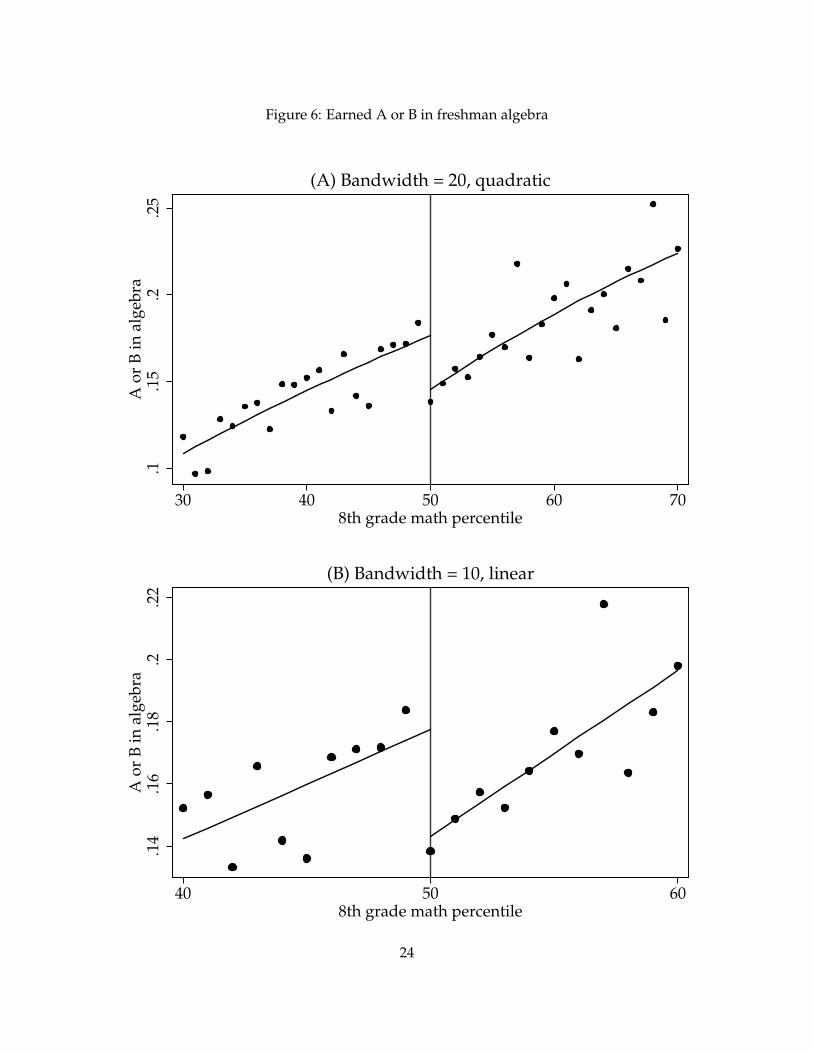
Figure 6: Earned A or B in freshman algebra
.1.1
5.2
.25
A o
r B
in
alg
ebra
30 40 50 60 708th grade math percentile
(A) Bandwidth = 20, quadratic
.14
.16
.18
.2.2
2A
or
B i
n a
lgeb
ra
40 50 608th grade math percentile
(B) Bandwidth = 10, linear
24
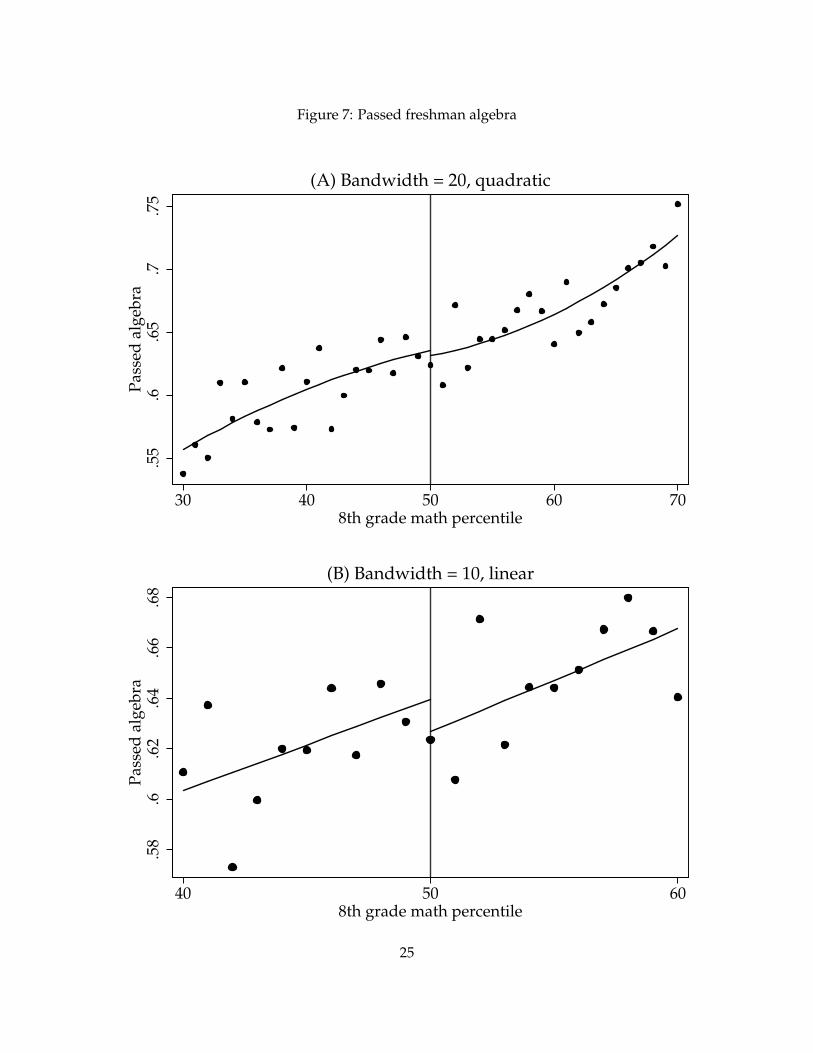
Figure 7: Passed freshman algebra
.55
.6.6
5.7
.75
Pas
sed
alg
ebra
30 40 50 60 708th grade math percentile
(A) Bandwidth = 20, quadratic
.58
.6.6
2.6
4.6
6.6
8P
asse
d a
lgeb
ra
40 50 608th grade math percentile
(B) Bandwidth = 10, linear
25
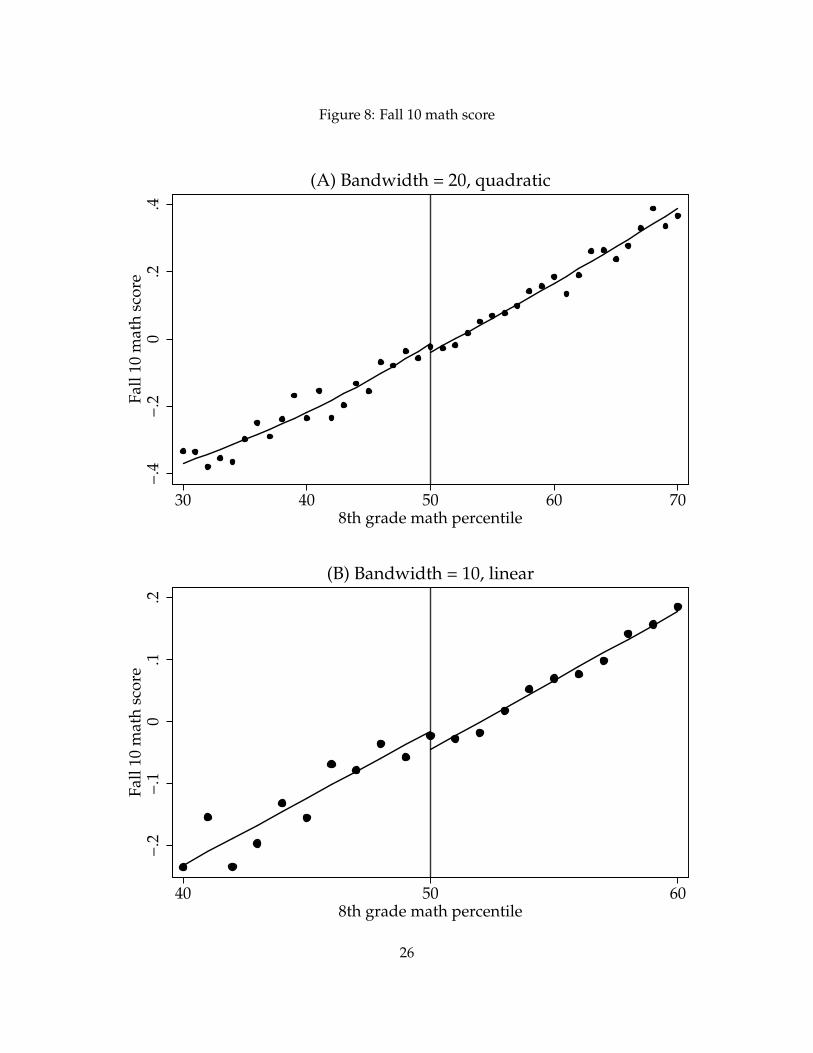
Figure 8: Fall 10 math score
−.4
−.2
0.2
.4F
all
10 m
ath
sco
re
30 40 50 60 708th grade math percentile
(A) Bandwidth = 20, quadratic
−.2
−.1
0.1
.2F
all
10 m
ath
sco
re
40 50 608th grade math percentile
(B) Bandwidth = 10, linear
26
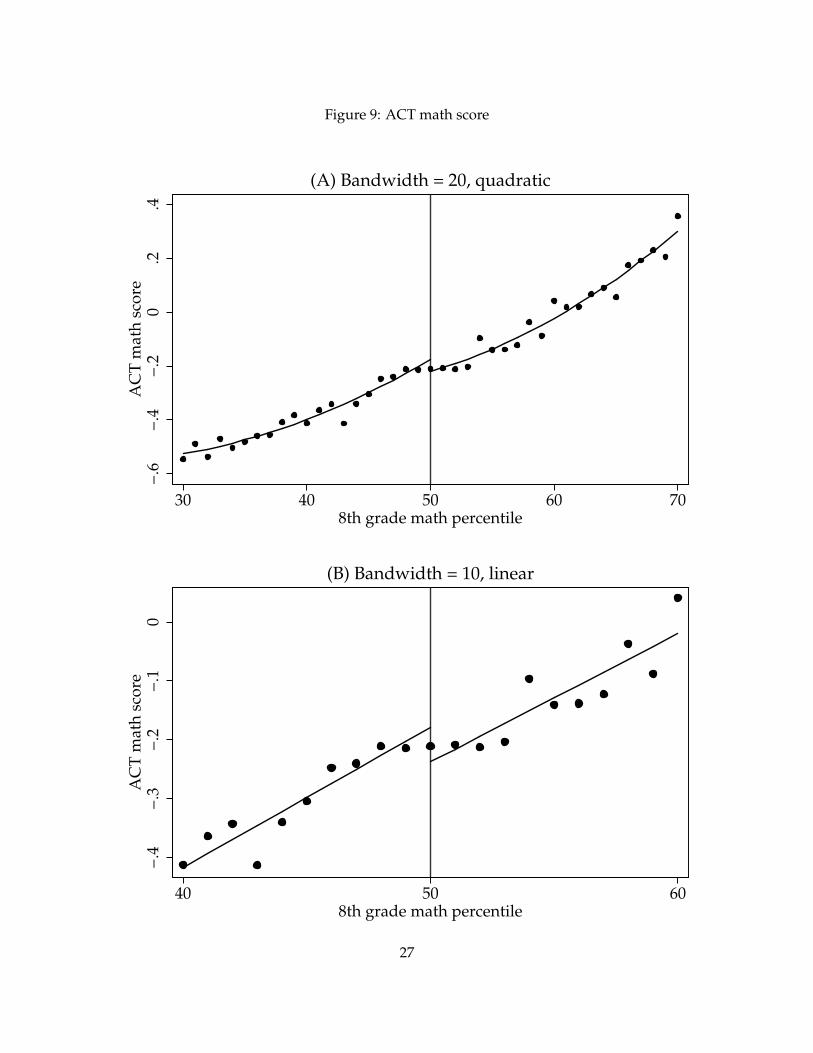
Figure 9: ACT math score
−.6
−.4
−.2
0.2
.4A
CT
mat
h s
core
30 40 50 60 708th grade math percentile
(A) Bandwidth = 20, quadratic
−.4
−.3
−.2
−.1
0A
CT
mat
h s
core
40 50 608th grade math percentile
(B) Bandwidth = 10, linear
27
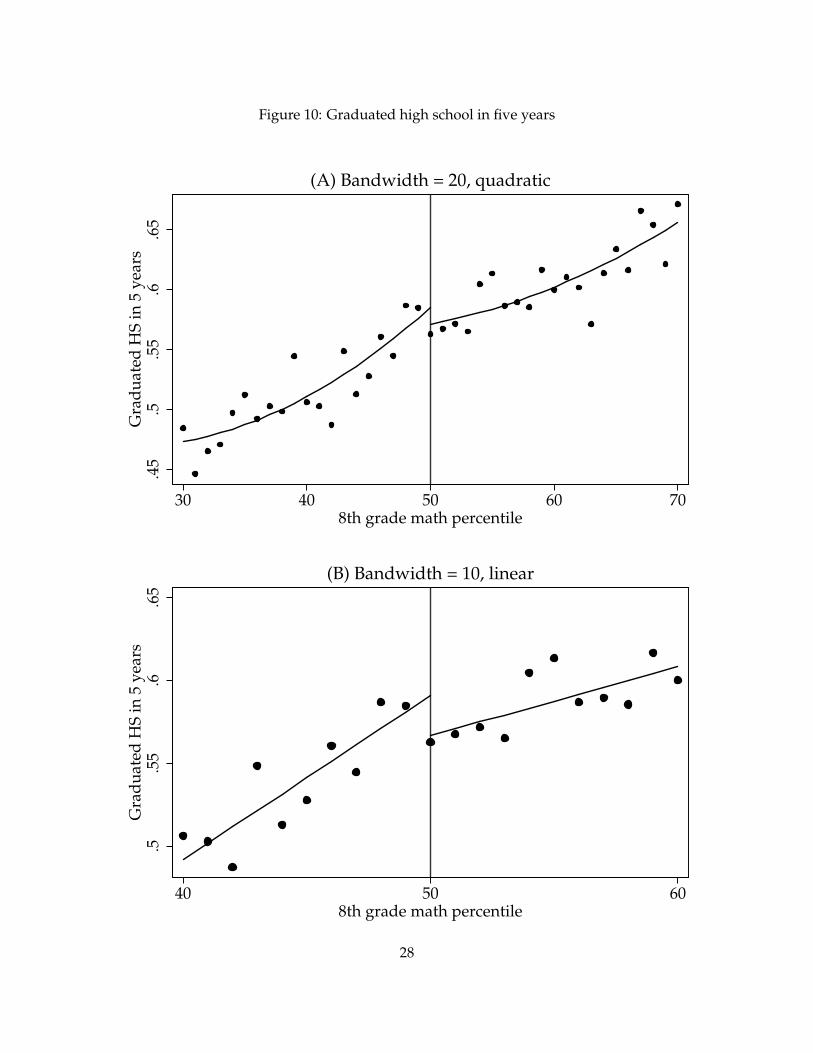
Figure 10: Graduated high school in five years
.45
.5.5
5.6
.65
Gra
du
ated
HS
in
5 y
ears
30 40 50 60 708th grade math percentile
(A) Bandwidth = 20, quadratic
.5.5
5.6
.65
Gra
du
ated
HS
in
5 y
ears
40 50 608th grade math percentile
(B) Bandwidth = 10, linear
28
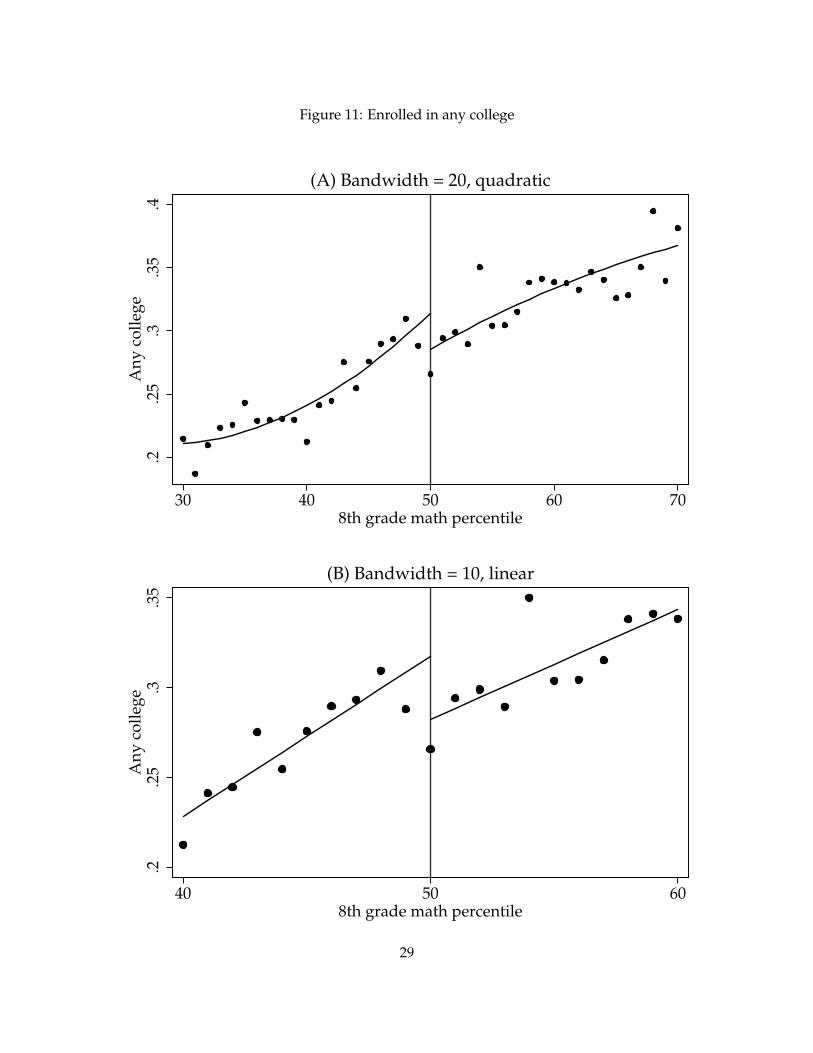
Figure 11: Enrolled in any college
.2.2
5.3
.35
.4A
ny
co
lleg
e
30 40 50 60 708th grade math percentile
(A) Bandwidth = 20, quadratic
.2.2
5.3
.35
An
y c
oll
ege
40 50 608th grade math percentile
(B) Bandwidth = 10, linear
29
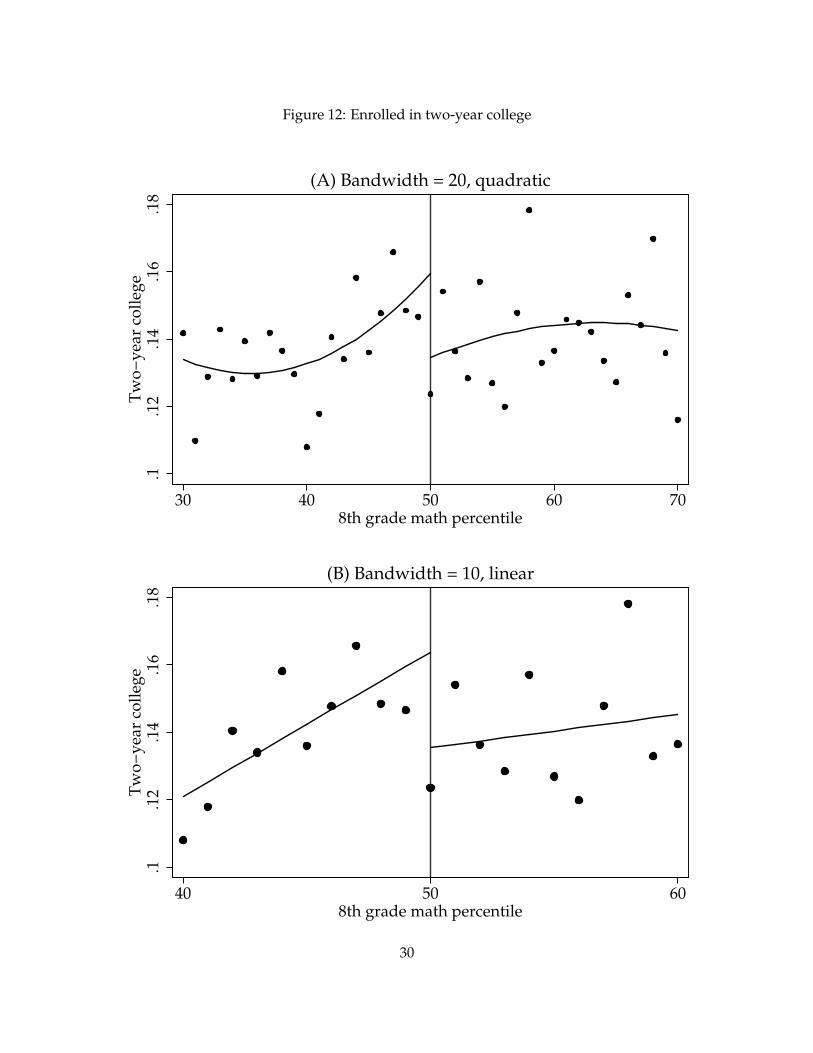
Figure 12: Enrolled in two-year college
.1.1
2.1
4.1
6.1
8T
wo
−y
ear
coll
ege
30 40 50 60 708th grade math percentile
(A) Bandwidth = 20, quadratic
.1.1
2.1
4.1
6.1
8T
wo
−y
ear
coll
ege
40 50 608th grade math percentile
(B) Bandwidth = 10, linear
30
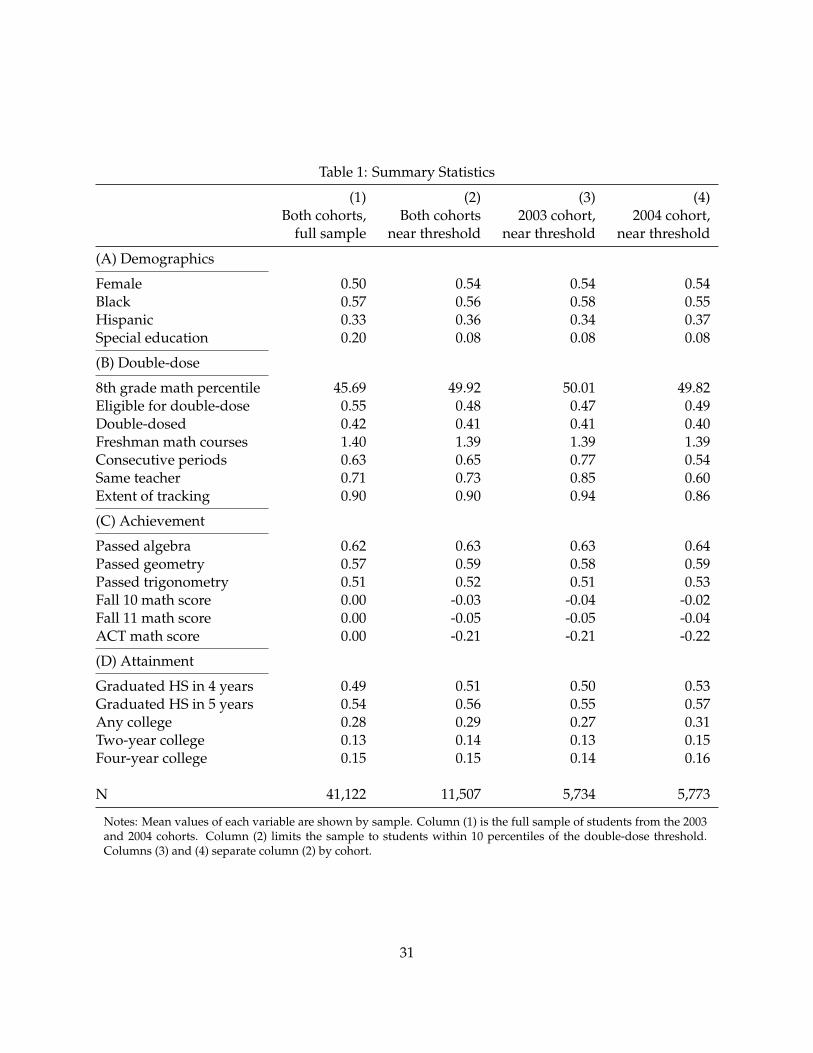
Table 1: Summary Statistics
(1) (2) (3) (4)Both cohorts, Both cohorts 2003 cohort, 2004 cohort,
full sample near threshold near threshold near threshold
(A) Demographics
Female 0.50 0.54 0.54 0.54Black 0.57 0.56 0.58 0.55Hispanic 0.33 0.36 0.34 0.37Special education 0.20 0.08 0.08 0.08
(B) Double-dose
8th grade math percentile 45.69 49.92 50.01 49.82Eligible for double-dose 0.55 0.48 0.47 0.49Double-dosed 0.42 0.41 0.41 0.40Freshman math courses 1.40 1.39 1.39 1.39Consecutive periods 0.63 0.65 0.77 0.54Same teacher 0.71 0.73 0.85 0.60Extent of tracking 0.90 0.90 0.94 0.86
(C) Achievement
Passed algebra 0.62 0.63 0.63 0.64Passed geometry 0.57 0.59 0.58 0.59Passed trigonometry 0.51 0.52 0.51 0.53Fall 10 math score 0.00 -0.03 -0.04 -0.02Fall 11 math score 0.00 -0.05 -0.05 -0.04ACT math score 0.00 -0.21 -0.21 -0.22
(D) Attainment
Graduated HS in 4 years 0.49 0.51 0.50 0.53Graduated HS in 5 years 0.54 0.56 0.55 0.57Any college 0.28 0.29 0.27 0.31Two-year college 0.13 0.14 0.13 0.15Four-year college 0.15 0.15 0.14 0.16
N 41,122 11,507 5,734 5,773
Notes: Mean values of each variable are shown by sample. Column (1) is the full sample of students from the 2003and 2004 cohorts. Column (2) limits the sample to students within 10 percentiles of the double-dose threshold.Columns (3) and (4) separate column (2) by cohort.
31
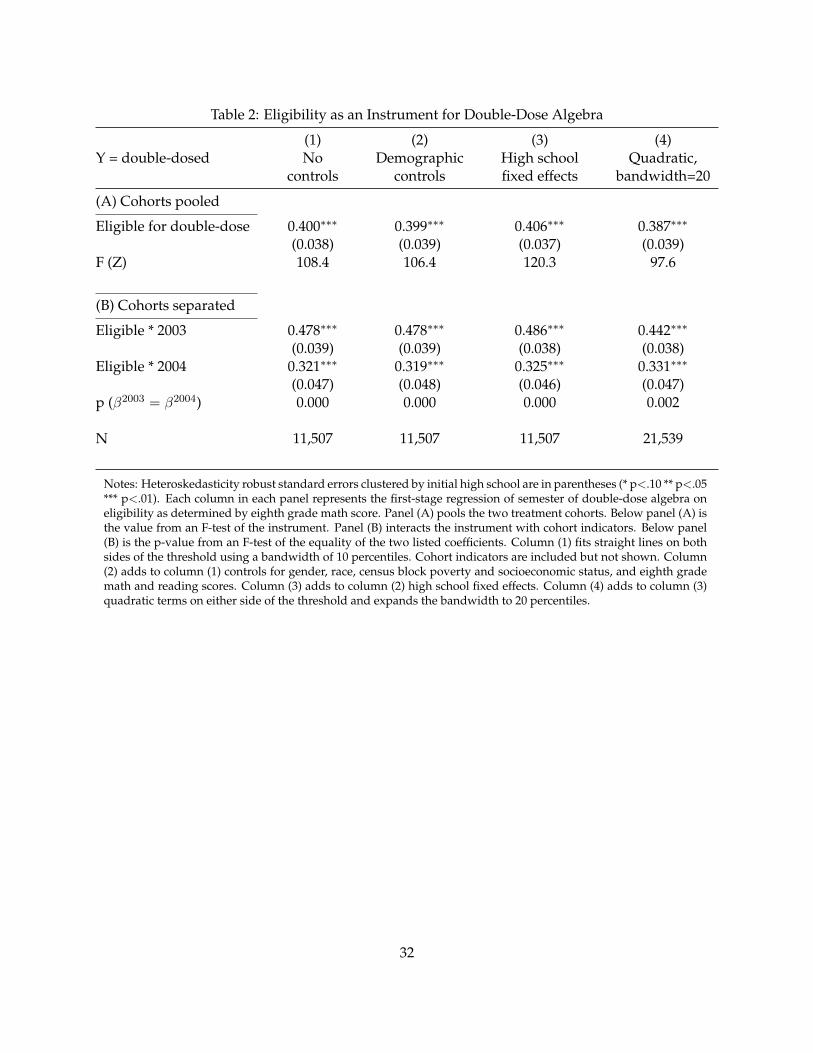
Table 2: Eligibility as an Instrument for Double-Dose Algebra
(1) (2) (3) (4)Y = double-dosed No Demographic High school Quadratic,
controls controls fixed effects bandwidth=20
(A) Cohorts pooled
Eligible for double-dose 0.400∗∗∗ 0.399∗∗∗ 0.406∗∗∗ 0.387∗∗∗
(0.038) (0.039) (0.037) (0.039)F (Z) 108.4 106.4 120.3 97.6
(B) Cohorts separated
Eligible * 2003 0.478∗∗∗ 0.478∗∗∗ 0.486∗∗∗ 0.442∗∗∗
(0.039) (0.039) (0.038) (0.038)Eligible * 2004 0.321∗∗∗ 0.319∗∗∗ 0.325∗∗∗ 0.331∗∗∗
(0.047) (0.048) (0.046) (0.047)p (β2003 = β2004) 0.000 0.000 0.000 0.002
N 11,507 11,507 11,507 21,539
Notes: Heteroskedasticity robust standard errors clustered by initial high school are in parentheses (* p<.10 ** p<.05*** p<.01). Each column in each panel represents the first-stage regression of semester of double-dose algebra oneligibility as determined by eighth grade math score. Panel (A) pools the two treatment cohorts. Below panel (A) isthe value from an F-test of the instrument. Panel (B) interacts the instrument with cohort indicators. Below panel(B) is the p-value from an F-test of the equality of the two listed coefficients. Column (1) fits straight lines on bothsides of the threshold using a bandwidth of 10 percentiles. Cohort indicators are included but not shown. Column(2) adds to column (1) controls for gender, race, census block poverty and socioeconomic status, and eighth grademath and reading scores. Column (3) adds to column (2) high school fixed effects. Column (4) adds to column (3)quadratic terms on either side of the threshold and expands the bandwidth to 20 percentiles.
32
Tabl
e3:
Firs
t-st
age
hete
roge
neit
y
(1)
(2)
(3)
(4)
(5)
(6)
(7)
Belo
wA
bove
Y=
doub
le-d
osed
med
ian
med
ian
Mal
eFe
mal
eBl
ack
His
pani
cW
hite
read
erre
ader
(A)C
ohor
tspo
oled
Elig
ible
for
doub
le-d
ose
0.40
4∗∗∗
0.38
2∗∗∗
0.38
0∗∗∗
0.41
4∗∗∗
0.41
8∗∗∗
0.40
2∗∗∗
0.23
7∗∗
(0.0
42)
(0.0
48)
(0.0
41)
(0.0
42)
(0.0
38)
(0.0
65)
(0.1
04)
(B)C
ohor
tsse
para
ted
Elig
ible
*20
030.
475∗
∗∗0.
485∗
∗∗0.
462∗
∗∗0.
491∗
∗∗0.
498∗
∗∗0.
477∗
∗∗0.
322∗
∗∗
(0.0
43)
(0.0
48)
(0.0
40)
(0.0
44)
(0.0
40)
(0.0
70)
(0.0
92)
Elig
ible
*20
040.
327∗
∗∗0.
289∗
∗∗0.
304∗
∗∗0.
331∗
∗∗0.
336∗
∗∗0.
331∗
∗∗0.
148
(0.0
51)
(0.0
57)
(0.0
51)
(0.0
51)
(0.0
52)
(0.0
71)
(0.1
21)
p(β
2003
=β2004)
0.00
10.
000
0.00
00.
001
0.00
40.
010
0.02
9
N6,
564
4,94
35,
291
6,21
66,
494
4,11
889
5
Not
es:
Het
eros
keda
stic
ity
robu
stst
anda
rder
rors
clus
tere
dby
init
ialh
igh
scho
olar
ein
pare
nthe
ses
(*p<
.10
**p<
.05
***
p<.0
1).
Each
colu
mn
repl
icat
esth
ese
cond
colu
mn
from
tabl
e2
wit
hth
esa
mpl
elim
ited
toth
eid
enti
fied
sub-
grou
p.
33
Tabl
e4:
Dou
ble-
Dos
eA
lgeb
ra,F
resh
man
Cou
rsew
ork
and
Peer
s
(1)
(2)
(3)
(4)
(5)
(6)
(7)
(8)
Mat
hA
cade
mic
Oth
erTo
tal
Mea
npe
erSD
ofD
ista
nce
toC
lass
cour
ses
cour
ses
cour
ses
cour
ses
skill
skill
mea
npe
ersi
ze
(A)C
ohor
tspo
oled
Dou
ble-
dose
d0.
994∗
∗∗-0
.169
∗-0
.669
∗∗∗
0.15
6∗-1
9.40
1∗∗∗
-3.1
01∗∗
∗3.
202∗
∗∗2.
443∗
∗∗
(0.0
22)
(0.0
96)
(0.0
88)
(0.0
89)
(1.4
40)
(0.7
61)
(1.2
16)
(0.7
76)
(B)C
ohor
tsse
para
ted
Dou
ble-
dose
d*
2003
0.97
9∗∗∗
-0.1
71∗
-0.6
75∗∗
∗0.
133
-19.
443∗
∗∗-3
.345
∗∗∗
3.32
7∗∗∗
2.34
9∗∗∗
(0.0
22)
(0.0
89)
(0.0
87)
(0.0
82)
(1.4
11)
(0.8
28)
(1.0
47)
(0.8
48)
Dou
ble-
dose
d*
2004
1.02
0∗∗∗
-0.1
66-0
.657
∗∗∗
0.19
7∗-1
9.32
7∗∗∗
-2.6
71∗∗
∗2.
979∗
2.60
9∗∗∗
(0.0
24)
(0.1
23)
(0.1
03)
(0.1
17)
(2.1
16)
(0.8
64)
(1.7
32)
(0.8
83)
p(β
2003
=β2004)
0.00
70.
948
0.77
80.
388
0.95
10.
354
0.76
40.
737
Yat
thre
shol
d1.
212
3.51
32.
255
6.98
051
.609
15.7
9310
.705
20.8
13N
11,5
0711
,507
11,5
0711
,507
11,5
0711
,501
11,5
0711
,507
Not
es:
Het
eros
keda
stic
ity
robu
stst
anda
rder
rors
clus
tere
dby
init
ialh
igh
scho
olar
ein
pare
nthe
ses
(*p<
.10
**p<
.05
***
p<.0
1).
Each
colu
mn
inea
chpa
nel
repr
esen
tsth
ein
stru
men
tal
vari
able
sre
gres
sion
ofth
elis
ted
outc
ome
onse
mes
ters
ofdo
uble
-dos
eal
gebr
a,w
here
doub
le-d
ose
isin
stru
men
ted
byel
igib
ility
acco
rdin
gto
the
first
-sta
gegi
ven
inta
ble
2.Pa
nel(
A)
pool
sth
etw
otr
eatm
entc
ohor
ts.
Pane
l(B)
inte
ract
sth
ein
stru
men
tand
endo
geno
usre
gres
sor
wit
hco
hort
indi
cato
rs.
Belo
wpa
nel(
B)is
the
p-va
lue
from
anF-
test
ofth
eeq
ualit
yof
the
two
liste
dco
effic
ient
s.A
lso
liste
dis
the
mea
nva
lue
ofea
chou
tcom
eat
the
elig
ibili
tyth
resh
old.
Col
umn
(2)i
nclu
des
allc
ours
esin
scie
nce,
Engl
ish
and
soci
alst
udie
s.C
olum
n(3
)inc
lude
sal
lcou
rses
othe
rth
anm
ath,
scie
nce,
Engl
ish
and
soci
alst
udie
s.
34
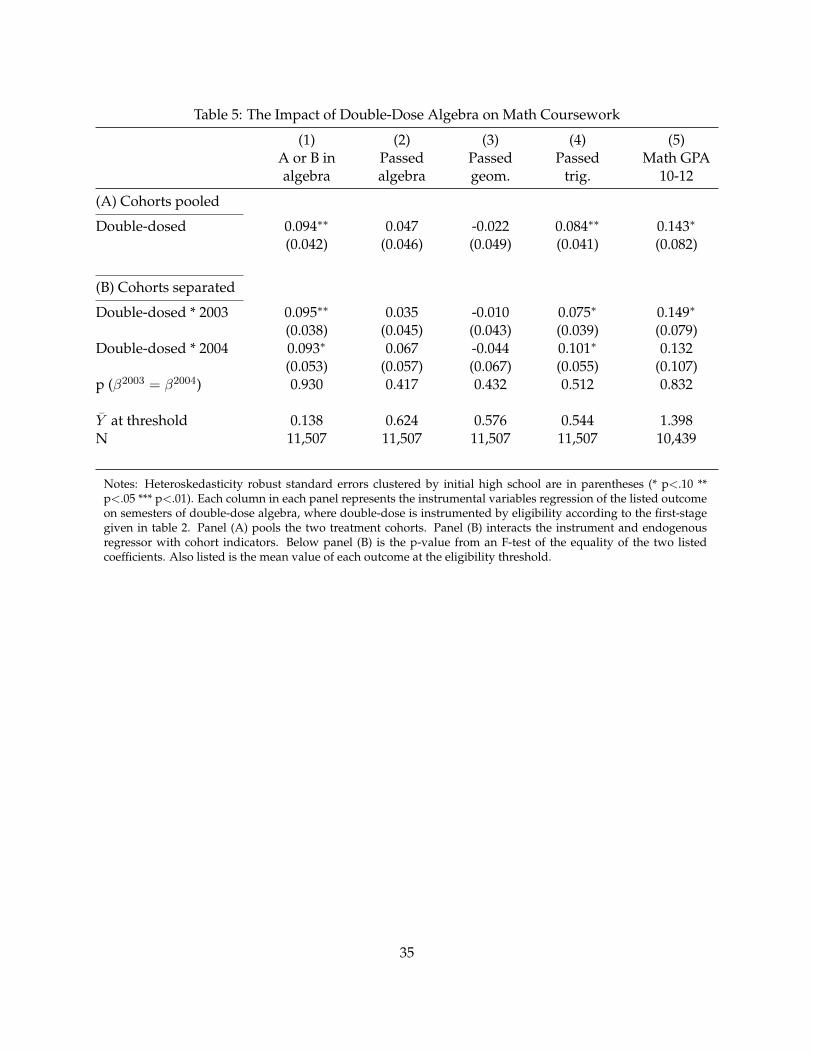
Table 5: The Impact of Double-Dose Algebra on Math Coursework
(1) (2) (3) (4) (5)A or B in Passed Passed Passed Math GPAalgebra algebra geom. trig. 10-12
(A) Cohorts pooled
Double-dosed 0.094∗∗ 0.047 -0.022 0.084∗∗ 0.143∗
(0.042) (0.046) (0.049) (0.041) (0.082)
(B) Cohorts separated
Double-dosed * 2003 0.095∗∗ 0.035 -0.010 0.075∗ 0.149∗
(0.038) (0.045) (0.043) (0.039) (0.079)Double-dosed * 2004 0.093∗ 0.067 -0.044 0.101∗ 0.132
(0.053) (0.057) (0.067) (0.055) (0.107)p (β2003 = β2004) 0.930 0.417 0.432 0.512 0.832
Y at threshold 0.138 0.624 0.576 0.544 1.398N 11,507 11,507 11,507 11,507 10,439
Notes: Heteroskedasticity robust standard errors clustered by initial high school are in parentheses (* p<.10 **p<.05 *** p<.01). Each column in each panel represents the instrumental variables regression of the listed outcomeon semesters of double-dose algebra, where double-dose is instrumented by eligibility according to the first-stagegiven in table 2. Panel (A) pools the two treatment cohorts. Panel (B) interacts the instrument and endogenousregressor with cohort indicators. Below panel (B) is the p-value from an F-test of the equality of the two listedcoefficients. Also listed is the mean value of each outcome at the eligibility threshold.
35
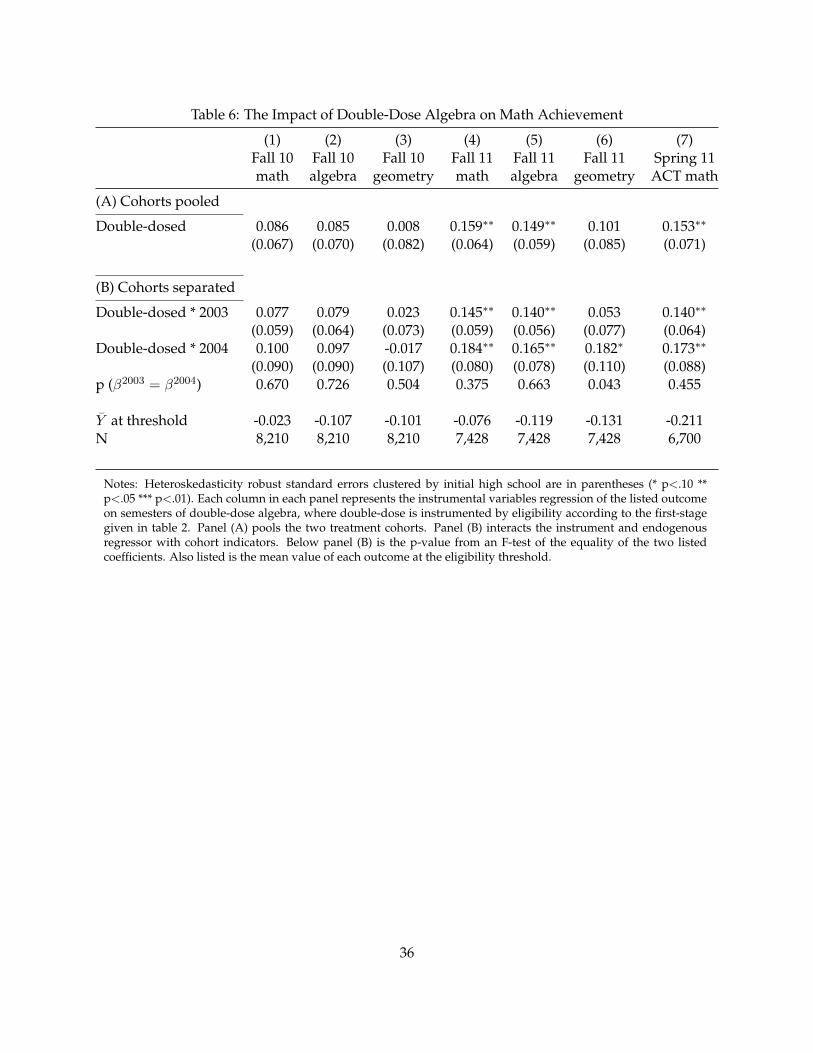
Table 6: The Impact of Double-Dose Algebra on Math Achievement
(1) (2) (3) (4) (5) (6) (7)Fall 10 Fall 10 Fall 10 Fall 11 Fall 11 Fall 11 Spring 11math algebra geometry math algebra geometry ACT math
(A) Cohorts pooled
Double-dosed 0.086 0.085 0.008 0.159∗∗ 0.149∗∗ 0.101 0.153∗∗
(0.067) (0.070) (0.082) (0.064) (0.059) (0.085) (0.071)
(B) Cohorts separated
Double-dosed * 2003 0.077 0.079 0.023 0.145∗∗ 0.140∗∗ 0.053 0.140∗∗
(0.059) (0.064) (0.073) (0.059) (0.056) (0.077) (0.064)Double-dosed * 2004 0.100 0.097 -0.017 0.184∗∗ 0.165∗∗ 0.182∗ 0.173∗∗
(0.090) (0.090) (0.107) (0.080) (0.078) (0.110) (0.088)p (β2003 = β2004) 0.670 0.726 0.504 0.375 0.663 0.043 0.455
Y at threshold -0.023 -0.107 -0.101 -0.076 -0.119 -0.131 -0.211N 8,210 8,210 8,210 7,428 7,428 7,428 6,700
Notes: Heteroskedasticity robust standard errors clustered by initial high school are in parentheses (* p<.10 **p<.05 *** p<.01). Each column in each panel represents the instrumental variables regression of the listed outcomeon semesters of double-dose algebra, where double-dose is instrumented by eligibility according to the first-stagegiven in table 2. Panel (A) pools the two treatment cohorts. Panel (B) interacts the instrument and endogenousregressor with cohort indicators. Below panel (B) is the p-value from an F-test of the equality of the two listedcoefficients. Also listed is the mean value of each outcome at the eligibility threshold.
36
Tabl
e7:
The
Impa
ctof
Dou
ble-
Dos
eA
lgeb
raon
Educ
atio
nalA
ttai
nmen
t
(1)
(2)
(3)
(4)
(5)
(6)
(7)
(8)
Gra
duat
edG
radu
ated
Enro
lled
Enro
lled
Four
year
Two
year
Two
year
Two
year
HS
in4
HS
in5
inco
llege
full
tim
eco
llege
colle
gefu
llti
me
part
tim
e
(A)C
ohor
tspo
oled
Dou
ble-
dose
d0.
087∗
0.07
9∗∗
0.10
5∗∗∗
0.05
9∗0.
028
0.07
7∗∗
0.03
10.
046∗
∗
(0.0
47)
(0.0
39)
(0.0
33)
(0.0
30)
(0.0
25)
(0.0
32)
(0.0
25)
(0.0
19)
(B)C
ohor
tsse
para
ted
Dou
ble-
dose
d*
2003
0.10
5∗∗
0.09
4∗∗∗
0.11
0∗∗∗
0.07
3∗∗∗
0.04
3∗0.
067∗
∗0.
031
0.03
7∗
(0.0
44)
(0.0
36)
(0.0
30)
(0.0
28)
(0.0
23)
(0.0
30)
(0.0
22)
(0.0
20)
Dou
ble-
dose
d*
2004
0.05
50.
052
0.09
7∗∗
0.03
30.
003
0.09
4∗∗
0.03
10.
063∗
∗
(0.0
60)
(0.0
52)
(0.0
45)
(0.0
39)
(0.0
35)
(0.0
43)
(0.0
35)
(0.0
25)
p(β
2003
=β2004)
0.17
30.
238
0.68
60.
105
0.14
50.
424
0.98
60.
222
Yat
thre
shol
d0.
509
0.56
30.
266
0.20
50.
142
0.12
40.
077
0.04
6N
11,5
0711
,507
11,5
0711
,507
11,5
0711
,507
11,5
0711
,507
Not
es:
Het
eros
keda
stic
ity
robu
stst
anda
rder
rors
clus
tere
dby
init
ialh
igh
scho
olar
ein
pare
nthe
ses
(*p<
.10
**p<
.05
***
p<.0
1).
Each
colu
mn
inea
chpa
nel
repr
esen
tsth
ein
stru
men
tal
vari
able
sre
gres
sion
ofth
elis
ted
outc
ome
onse
mes
ters
ofdo
uble
-dos
eal
gebr
a,w
here
doub
le-d
ose
isin
stru
men
ted
byel
igib
ility
acco
rdin
gto
the
first
-sta
gegi
ven
inta
ble
2.Pa
nel(
A)
pool
sth
etw
otr
eatm
entc
ohor
ts.
Pane
l(B)
inte
ract
sth
ein
stru
men
tand
endo
geno
usre
gres
sor
wit
hco
hort
indi
cato
rs.
Belo
wpa
nel(
B)is
the
p-va
lue
from
anF-
test
ofth
eeq
ualit
yof
the
two
liste
dco
effic
ient
s.A
lso
liste
dis
the
mea
nva
lue
ofea
chou
tcom
eat
the
elig
ibili
tyth
resh
old.
37

Tabl
e8:
Rob
ustn
ess
Che
cks
(1)
(2)
(3)
(4)
(5)
(6)
(7)
(8)
Pass
edFa
ll10
Fall
11Sp
ring
11G
radu
ated
Enro
lled
Two
year
Two
year
alge
bra
alge
bra
alge
bra
AC
Tm
ath
HS
in5
inco
llege
colle
gepa
rtti
me
(A)L
inea
r,ba
ndw
idth
=10
No
cont
rols
0.03
20.
069
0.13
7∗∗
0.14
1∗0.
060
0.08
7∗∗
0.07
1∗∗
0.04
3∗∗
(0.0
46)
(0.0
71)
(0.0
64)
(0.0
74)
(0.0
42)
(0.0
37)
(0.0
32)
(0.0
19)
+de
mog
raph
icco
ntro
ls0.
047
0.08
60.
159∗
∗0.
153∗
∗0.
079∗
∗0.
105∗
∗∗0.
077∗
∗0.
046∗
∗
(0.0
46)
(0.0
67)
(0.0
64)
(0.0
71)
(0.0
39)
(0.0
33)
(0.0
32)
(0.0
19)
+hi
ghsc
hool
fixed
effe
cts
0.04
50.
044
0.12
9∗∗
0.12
7∗0.
071∗
0.09
0∗∗∗
0.06
8∗∗
0.04
4∗∗
(0.0
45)
(0.0
63)
(0.0
62)
(0.0
73)
(0.0
39)
(0.0
34)
(0.0
31)
(0.0
19)
(B)Q
uadr
atic
,ban
dwid
th=2
0
No
cont
rols
0.01
20.
060
0.12
8∗0.
113
0.03
80.
077∗
0.06
6∗0.
044∗
(0.0
54)
(0.0
81)
(0.0
74)
(0.0
85)
(0.0
50)
(0.0
46)
(0.0
40)
(0.0
24)
+de
mog
raph
icco
ntro
ls0.
029
0.08
40.
156∗
∗0.
137∗
0.05
70.
093∗
∗0.
072∗
0.04
7∗
(0.0
53)
(0.0
77)
(0.0
74)
(0.0
80)
(0.0
46)
(0.0
41)
(0.0
39)
(0.0
24)
+hi
ghsc
hool
fixed
effe
cts
0.02
90.
060
0.13
9∗0.
120
0.05
70.
085∗
∗0.
063∗
0.04
4∗
(0.0
52)
(0.0
73)
(0.0
73)
(0.0
80)
(0.0
45)
(0.0
41)
(0.0
38)
(0.0
23)
(C)P
lace
bote
sts
(red
uced
form
)
Thr
esho
ldat
40th
perc
enti
le-0
.000
0.03
3-0
.003
0.02
50.
036∗
0.00
90.
011
-0.0
03(0
.017
)(0
.032
)(0
.030
)(0
.025
)(0
.021
)(0
.016
)(0
.013
)(0
.010
)T
hres
hold
at60
thpe
rcen
tile
0.03
1∗0.
027
-0.0
11-0
.029
0.02
10.
019
0.00
90.
005
(0.0
18)
(0.0
28)
(0.0
31)
(0.0
30)
(0.0
22)
(0.0
20)
(0.0
14)
(0.0
09)
Earl
ier
coho
rts
0.01
90.
018
-0.0
16-0
.001
0.01
3-0
.011
0.00
80.
002
(0.0
14)
(0.0
30)
(0.0
30)
(0.0
29)
(0.0
20)
(0.0
17)
(0.0
12)
(0.0
11)
Not
es:
Het
eros
keda
stic
ity
robu
stst
anda
rder
rors
clus
tere
dby
init
ialh
igh
scho
olar
ein
pare
nthe
ses
(*p<
.10
**p<
.05
***
p<.0
1).
Pane
l(A
)fit
sst
raig
htlin
eson
eith
ersi
deof
the
thre
shol
d,us
ing
aba
ndw
idth
of10
perc
enti
les.
Pane
l(B)
fits
quad
rati
cson
eith
ersi
deof
the
thre
shol
d,us
ing
aba
ndw
idth
of20
perc
enti
les.
Pane
l(C
)inc
lude
sth
ree
plac
ebo
test
s,ea
chof
whi
chre
plic
ates
the
redu
ced
form
vers
ion
ofth
ese
cond
row
ofpa
nel(
A).
The
first
and
seco
ndpl
aceb
ote
sts
use
the
40th
and
60th
perc
enti
les
asth
edo
uble
-dos
eth
resh
old,
whi
leth
eth
ird
uses
the
untr
eate
d20
01an
d20
02co
hort
s.
38
Tabl
e9:
Het
erog
enei
tyby
Aca
dem
icSk
ill
(1)
(2)
(3)
(4)
(5)
(6)
(7)
(8)
Pass
edFa
ll10
Fall
11Sp
ring
11G
radu
ated
Enro
lled
Two
year
Two
year
alge
bra
alge
bra
alge
bra
AC
Tm
ath
HS
in5
inco
llege
colle
gepa
rtti
me
(A)R
D,o
vera
ll
Dou
ble-
dose
d0.
047
0.08
60.
159∗
∗0.
153∗
∗0.
079∗
∗0.
105∗
∗∗0.
077∗
∗0.
046∗
∗
(0.0
46)
(0.0
67)
(0.0
64)
(0.0
71)
(0.0
39)
(0.0
33)
(0.0
32)
(0.0
19)
Yat
thre
shol
d0.
633
-0.0
28-0
.067
-0.1
920.
576
0.25
40.
119
0.06
1N
11,5
078,
210
7,42
86,
700
11,5
0711
,507
11,5
0711
,507
(B)R
D,b
yre
adin
gsk
ill
Dou
ble-
dose
d*
belo
wm
edia
nre
ader
0.06
30.
109
0.18
3∗∗∗
0.21
2∗∗∗
0.10
0∗∗
0.13
5∗∗∗
0.11
0∗∗∗
0.05
9∗∗∗
(0.0
51)
(0.0
79)
(0.0
68)
(0.0
71)
(0.0
46)
(0.0
38)
(0.0
36)
(0.0
23)
Dou
ble-
dose
d*
abov
em
edia
nre
ader
0.02
40.
053
0.13
0∗0.
082
0.04
90.
063
0.03
00.
027
(0.0
43)
(0.0
63)
(0.0
73)
(0.0
79)
(0.0
40)
(0.0
38)
(0.0
32)
(0.0
18)
p(β
below
=βabove)
0.20
30.
332
0.35
50.
007
0.18
00.
058
0.00
20.
048
N11
,507
8,21
07,
428
6,70
011
,507
11,5
0711
,507
11,5
07
(C)D
D,o
vera
ll
Dou
ble-
dose
d0.
064∗
∗∗0.
076∗
∗∗0.
024
0.00
90.
016
(0.0
19)
(0.0
27)
(0.0
29)
(0.0
32)
(0.0
13)
Yfo
rbe
low
*bef
ore
0.55
1-0
.520
-0.5
12-0
.536
0.45
7N
79,3
9253
,395
49,6
5244
,584
79,3
92
Not
es:
Het
eros
keda
stic
ity
robu
stst
anda
rder
rors
clus
tere
dby
init
ialh
igh
scho
olar
ein
pare
nthe
ses
(*p<
.10
**p<
.05
***
p<.0
1).
Pane
l(A
)co
ntai
nsth
ere
gres
sion
disc
onti
nuit
yre
sult
sfr
ompr
ior
tabl
es,b
elow
whi
chis
the
mea
nva
lue
ofea
chou
tcom
eat
the
elig
ibili
tyth
resh
old.
Pane
l(B)
sepa
rate
sst
uden
tsby
8th
grad
ere
adin
gsc
ore,
inte
ract
ing
both
the
inst
rum
ent
and
endo
geno
usre
gres
sor
wit
hre
adin
gsk
illgr
oups
.Be
low
each
coef
ficie
ntin
pane
l(B)
isth
ep-
valu
efr
oman
F-te
stof
the
equa
lity
ofth
etw
oco
effic
ient
s.Pa
nel(
C)c
onta
ins
inst
rum
enta
lvar
iabl
esre
gres
sion
sus
ing
the
diff
eren
ce-i
n-di
ffer
ence
spec
ifica
tion
desc
ribe
din
the
text
.Be
low
pane
l(C
)is
the
mea
nva
lue
ofea
chou
tcom
efo
rst
uden
tsbe
low
the
elig
ibili
tyth
resh
old
inth
e20
01an
d20
02co
hort
s.
39
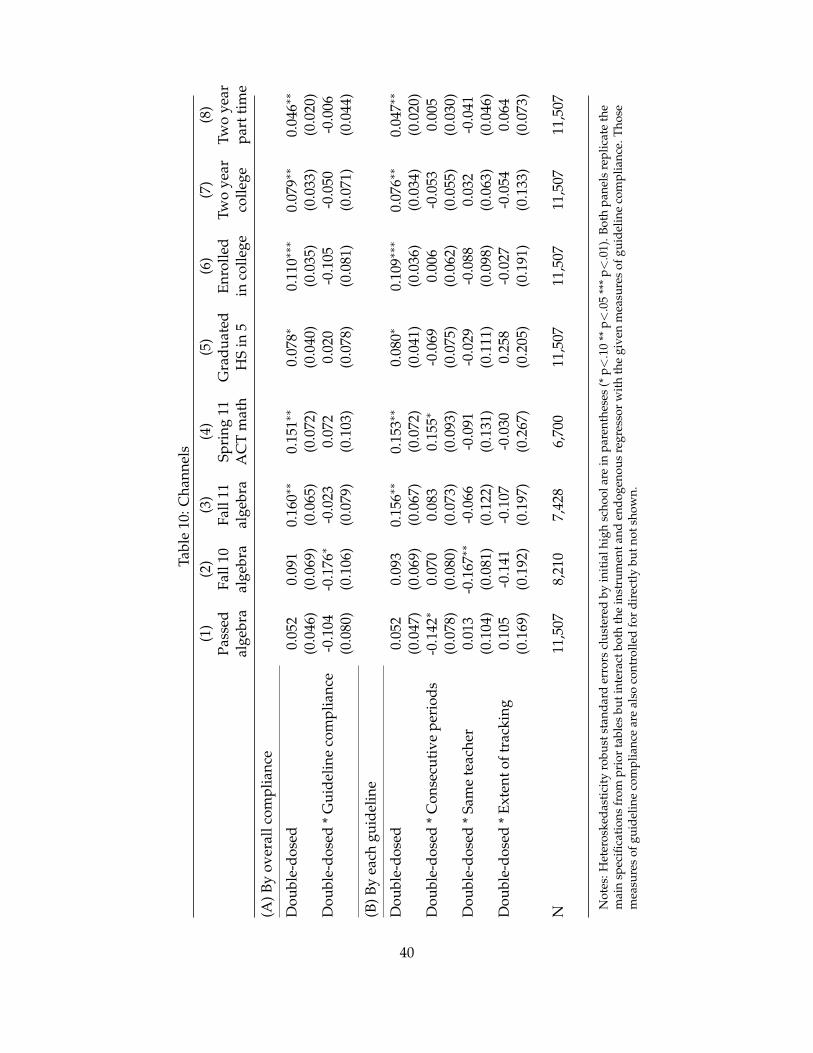
Tabl
e10
:Cha
nnel
s(1
)(2
)(3
)(4
)(5
)(6
)(7
)(8
)Pa
ssed
Fall
10Fa
ll11
Spri
ng11
Gra
duat
edEn
rolle
dTw
oye
arTw
oye
aral
gebr
aal
gebr
aal
gebr
aA
CT
mat
hH
Sin
5in
colle
geco
llege
part
tim
e
(A)B
yov
eral
lcom
plia
nce
Dou
ble-
dose
d0.
052
0.09
10.
160∗
∗0.
151∗
∗0.
078∗
0.11
0∗∗∗
0.07
9∗∗
0.04
6∗∗
(0.0
46)
(0.0
69)
(0.0
65)
(0.0
72)
(0.0
40)
(0.0
35)
(0.0
33)
(0.0
20)
Dou
ble-
dose
d*
Gui
delin
eco
mpl
ianc
e-0
.104
-0.1
76∗
-0.0
230.
072
0.02
0-0
.105
-0.0
50-0
.006
(0.0
80)
(0.1
06)
(0.0
79)
(0.1
03)
(0.0
78)
(0.0
81)
(0.0
71)
(0.0
44)
(B)B
yea
chgu
idel
ine
Dou
ble-
dose
d0.
052
0.09
30.
156∗
∗0.
153∗
∗0.
080∗
0.10
9∗∗∗
0.07
6∗∗
0.04
7∗∗
(0.0
47)
(0.0
69)
(0.0
67)
(0.0
72)
(0.0
41)
(0.0
36)
(0.0
34)
(0.0
20)
Dou
ble-
dose
d*
Con
secu
tive
peri
ods
-0.1
42∗
0.07
00.
083
0.15
5∗-0
.069
0.00
6-0
.053
0.00
5(0
.078
)(0
.080
)(0
.073
)(0
.093
)(0
.075
)(0
.062
)(0
.055
)(0
.030
)D
oubl
e-do
sed
*Sa
me
teac
her
0.01
3-0
.167
∗∗-0
.066
-0.0
91-0
.029
-0.0
880.
032
-0.0
41(0
.104
)(0
.081
)(0
.122
)(0
.131
)(0
.111
)(0
.098
)(0
.063
)(0
.046
)D
oubl
e-do
sed
*Ex
tent
oftr
acki
ng0.
105
-0.1
41-0
.107
-0.0
300.
258
-0.0
27-0
.054
0.06
4(0
.169
)(0
.192
)(0
.197
)(0
.267
)(0
.205
)(0
.191
)(0
.133
)(0
.073
)
N11
,507
8,21
07,
428
6,70
011
,507
11,5
0711
,507
11,5
07
Not
es:H
eter
oske
dast
icit
yro
bust
stan
dard
erro
rscl
uste
red
byin
itia
lhig
hsc
hool
are
inpa
rent
hese
s(*
p<.1
0**
p<.0
5**
*p<
.01)
.Bot
hpa
nels
repl
icat
eth
em
ain
spec
ifica
tion
sfr
ompr
ior
tabl
esbu
tint
erac
tbot
hth
ein
stru
men
tand
endo
geno
usre
gres
sor
wit
hth
egi
ven
mea
sure
sof
guid
elin
eco
mpl
ianc
e.Th
ose
mea
sure
sof
guid
elin
eco
mpl
ianc
ear
eal
soco
ntro
lled
for
dire
ctly
butn
otsh
own.
40
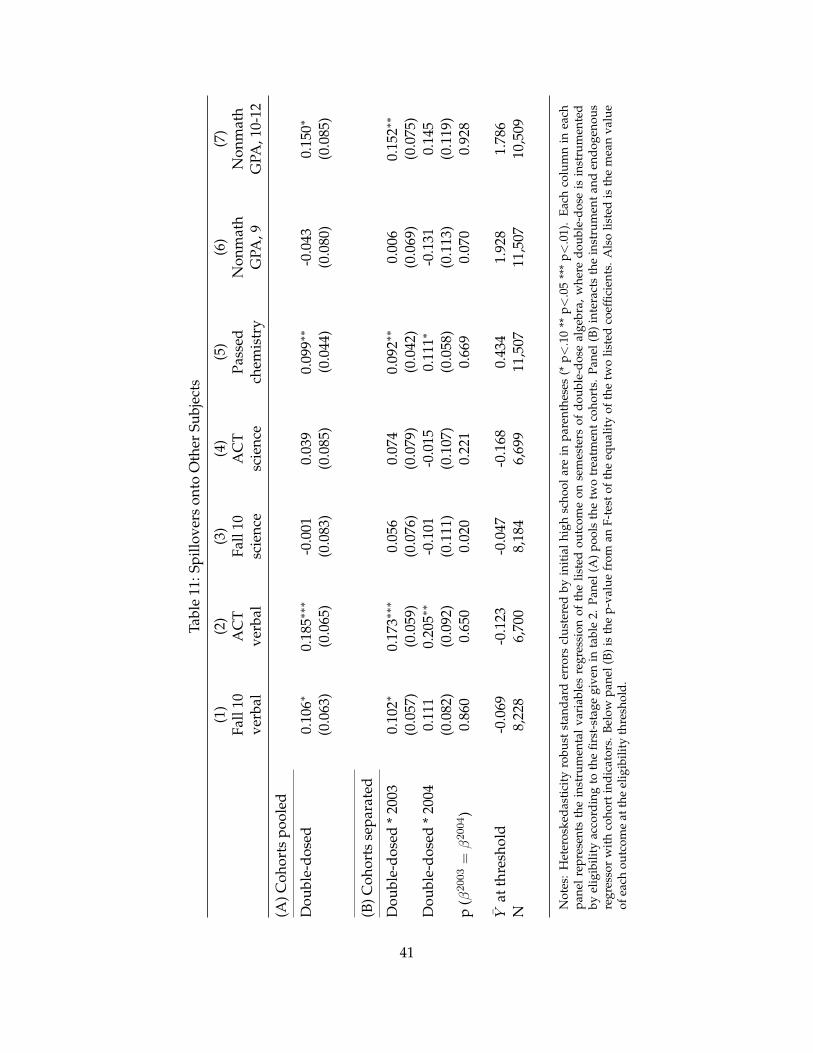
Tabl
e11
:Spi
llove
rson
toO
ther
Subj
ects
(1)
(2)
(3)
(4)
(5)
(6)
(7)
Fall
10A
CT
Fall
10A
CT
Pass
edN
onm
ath
Non
mat
hve
rbal
verb
alsc
ienc
esc
ienc
ech
emis
try
GPA
,9G
PA,1
0-12
(A)C
ohor
tspo
oled
Dou
ble-
dose
d0.
106∗
0.18
5∗∗∗
-0.0
010.
039
0.09
9∗∗
-0.0
430.
150∗
(0.0
63)
(0.0
65)
(0.0
83)
(0.0
85)
(0.0
44)
(0.0
80)
(0.0
85)
(B)C
ohor
tsse
para
ted
Dou
ble-
dose
d*
2003
0.10
2∗0.
173∗
∗∗0.
056
0.07
40.
092∗
∗0.
006
0.15
2∗∗
(0.0
57)
(0.0
59)
(0.0
76)
(0.0
79)
(0.0
42)
(0.0
69)
(0.0
75)
Dou
ble-
dose
d*
2004
0.11
10.
205∗
∗-0
.101
-0.0
150.
111∗
-0.1
310.
145
(0.0
82)
(0.0
92)
(0.1
11)
(0.1
07)
(0.0
58)
(0.1
13)
(0.1
19)
p(β
2003
=β2004)
0.86
00.
650
0.02
00.
221
0.66
90.
070
0.92
8
Yat
thre
shol
d-0
.069
-0.1
23-0
.047
-0.1
680.
434
1.92
81.
786
N8,
228
6,70
08,
184
6,69
911
,507
11,5
0710
,509
Not
es:
Het
eros
keda
stic
ity
robu
stst
anda
rder
rors
clus
tere
dby
init
ialh
igh
scho
olar
ein
pare
nthe
ses
(*p<
.10
**p<
.05
***
p<.0
1).
Each
colu
mn
inea
chpa
nel
repr
esen
tsth
ein
stru
men
tal
vari
able
sre
gres
sion
ofth
elis
ted
outc
ome
onse
mes
ters
ofdo
uble
-dos
eal
gebr
a,w
here
doub
le-d
ose
isin
stru
men
ted
byel
igib
ility
acco
rdin
gto
the
first
-sta
gegi
ven
inta
ble
2.Pa
nel(
A)
pool
sth
etw
otr
eatm
entc
ohor
ts.
Pane
l(B)
inte
ract
sth
ein
stru
men
tand
endo
geno
usre
gres
sor
wit
hco
hort
indi
cato
rs.
Belo
wpa
nel(
B)is
the
p-va
lue
from
anF-
test
ofth
eeq
ualit
yof
the
two
liste
dco
effic
ient
s.A
lso
liste
dis
the
mea
nva
lue
ofea
chou
tcom
eat
the
elig
ibili
tyth
resh
old.
41