doubleline multi asset growth fund live webcast hosted by · william shakespeare, julius caeser,...
TRANSCRIPT

“To QE3 or not to QE3That is the Question”
DoubleLine Multi‐Asset Growth FundLive Webcast hosted by:Live Webcast hosted by:
Jeffrey Gundlach Chief Executive Officer
Jeff ShermanPortfolio Manager,Commodities
April 17 2012 BondsApril 17, 2012 Bonds

Disclosures
Multi‐Asset Growth FundInvestments in debt securities typically decrease in value when interest rates rise. This risk is usually greater for longer‐term debt securities. Investments in Asset‐Backed and Mortgage‐Backed Securities include risks that investors should be aware of such as credit risk, prepayment risk, possible illiquidity and default, as well as increased susceptibility to adverse economic developments. The Fund invests in foreign securities which typically involve greater volatility and political, economic and currency risks then do investments in domestic securities and the issuers of which are typically subject to different accounting standards. These risks are greater for investments in emerging markets. Investments in lower‐rated and non‐rated securities present a greater risk of loss to principal and interest than higher‐rated securities. The Fund may invest in securities related to real estate, which may decline in value as a result of factors affecting the real estate industry Derivatives may involve certain costs and risks such as liquidity interest rate market creditfactors affecting the real estate industry. Derivatives may involve certain costs and risks such as liquidity, interest rate, market, credit, management and the risk that a position could not be closed when most advantageous. Investing in derivatives could lose more than the amount invested. Commodity‐linked derivative instruments may involve additional costs and risks such as changes in commodityindex volatility or factors affecting a particular industry or commodity, such as drought, floods, weather, livestock disease, embargoes, tariffs and international economic, political and regulatory developments. Investing in derivatives could lose more than the amount invested. Equities may decline in value due to both real and perceived general market, economic, and industry conditions. The Fund is q y p g ynon‐diversified, which means that it may concentrate its assets in a smaller number of issuers than a diversified fund.
1

Risk Disclosures
Total Return Bond FundInvestments in debt securities typically decrease in value when interest rates rise. This risk is usually greater for longer‐term debt securities. Investments in Asset‐Backed and Mortgage‐Backed Securities include additional risks that investors should be aware of such as credit risk, prepayment risk, possible illiquidity and default, as well as increased susceptibility to adverse economic developments. Investments in lower‐rated and non‐rated securities present a greater risk of loss to principal and interest than higher‐rated securities. D bl Li T t l R t B d F d i t d t i t th 50% f it t t i t b k d iti f t itDoubleLine Total Return Bond Fund intends to invest more than 50% of its net assets in mortgage‐backed securities of any maturity or type. The Fund therefore potentially is more likely to react to any volatility or changes in the mortgage‐backed securities marketplace.
Core Fixed Income FundInvestments in debt securities typically decrease in value when interest rates rise. This risk is usually greater for longer‐term debt securities Investments in Asset‐Backed and Mortgage‐Backed Securities include additional risks that investors should be aware of suchsecurities. Investments in Asset Backed and Mortgage Backed Securities include additional risks that investors should be aware of such as credit risk, prepayment risk, possible illiquidity and default, as well as increased susceptibility to adverse economic developments. The Fund invests in foreign securities which involve greater volatility and political, economic and currency risks and differences in accounting methods. These risks are greater for investments in emerging markets. Investments in lower‐rated and non‐rated securities present a greater risk of loss to principal and interest than higher‐rated securities.
While the Fund is no‐load, management fees and other expenses still apply. DoubleLine Funds are distributed by Quasar Distributors, LLC.
2

Fund OfferingsMulti Asset Growth FundRetail and Institutional ClassNo Load Mutual Fund
Retail Inst.A‐share I‐share
Multi‐Asset Growth Fund
A share I share
Ticker DMLAX DMLIXMaximum Sales Charge 4.25%1 NoneMin Investment $2,000 $100,000Mi IRA I t t $500 $5 000Min IRA Investment $500 $5,000Net Expense Ratio2 1.45% 1.20%
1. Breakpoints are available. Contingent deferred sales load of up to 0.75% applies in certain circumstances for A‐shares. Please see the prospectus for additional details.2. Net Expense Ratio does not include Acquired Fund Fees and Expenses and reflects the inclusion of the Advisor’s commitment to waive a portion of its investment
advisory fee to limit operating expenses. Please see the prospectus for additional details.
The Fund’s investment objectives, risks, charges and expenses must be considered carefully before investing. The prospectus contains this and other important information about the investment company and it may be obtained by calling 1 (877) 354 6311 / 1 (877) DLine11 or visitingcompany, and it may be obtained by calling 1 (877) 354‐6311 / 1 (877) DLine11, or visiting www.doublelinefunds.com. Read it carefully before investing. Performance data quoted represents past performance; past performance does not guarantee future results. The investment return and principal value of an investment will fluctuate so that an investor's shares, when redeemed, may be worth more or less than their original cost. P P f d f l I d f i ill i f f d f A iPast Performance does not guarantee future results. Index performance is not illustrative of fund performance. An investment cannot be made directly in an index. For standardized performance of the Multi‐Asset Growth Fund, current to the most recent quarter end, please call 1 (877) DLine11/1 (877) 354 ‐6311 or visit www.doublelinefunds.com.Opinions expressed as subject to change at any time, are not forecasts and should not be considered investment advice.While the I‐Shares are no‐load, management fees and other expenses still apply. Please refer to the prospectus for further details. 3

PerformanceDoubleLine Multi‐Asset Growth Fund – Quarter Ending March 31, 2012
March 1Q121 Year
(Annualized)
Since Inception Annualized(12‐20‐10 to 3‐31‐12)
I‐share ‐0.05% 1.87% 2.67% 3.07%
I‐share A‐share
Gross Expense Ratio 1 42% 2 32%
A‐share (No Load) ‐0.10% 1.81% 2.57% 2.82%
A‐share (With Load) ‐4.35% ‐2.52% ‐1.79% ‐0.62%
As of March 31, 2012 I‐share A‐share
Gross SEC 30‐Day Yield 4 81% 4 36%
P f d t t d t t f t f d t t f f t lt Th i t t t d
Gross Expense Ratio 1.42% 2.32%
Net Expense Ratio* 1.20% 1.45%
Gross SEC 30 Day Yield 4.81% 4.36%
Net SEC 30‐Day Yield 5.09% 4.63%
Performance data quoted represents past performance; past performance does not guarantee of future results. The investment return and principal value of an investment will fluctuate so that an investor's shares when redeemed may be worth more or less than their original cost. Current performance of the Fund may be lower or higher than the performance quoted. Performance data current to the most recent month‐end may be obtained by calling 213‐633‐8200 or by visiting www.doublelinefunds.com. Performance data shown reflects the Class A maximum sales charge of 4.25%. The Fund imposes a Deferred Sales Charge of 0.75% on purchases of $1 million or more of Class A shares if redeemed within 18 months of purchase. The Fund imposes a Redemption Fee of 1.00% on all share classes if shares are sold within 90 days of purchase. Performance data does not reflect the deferred sales charge or the redemption fee. If it had, returns would be reduced. Investment performance reflects fee waivers in effect. In the absence of such waivers, total return would be reduced.*Net Expense Ratio does not include Acquired Fund Fees and Expenses and reflects the inclusion of the Advisor's commitment to waive a portion of its investment advisory fee to limit operating expenses. Please see the prospectus for additional details.The Advisor has contractually agreed to waive fees through July 24, 2012.
4

Announcements
Webcast News –Jeffrey Gundlach – April 19, 2012Litman Gregory Masters Alternative Strategies Fund1
April 19, 2012 1:15 pm PTPlease visit www.mastersfund.com
Jeffrey Gundlach – May 8, 2012DoubleLine Total Return & Core Fixed Income Bond FundsMay 8, 2012 1:15 pm PDT/4:15 pm EDT
Luz Padilla – June 12, 2012D bl Li E i M k t Fi d I F dDoubleLine Emerging Markets Fixed Income FundJune 12, 2012 1:15 pm PDT/4:15 pm EDTPlease visit www.astonfunds.com
T R i P t ti SlidTo Receive Presentation Slides:You can email [email protected]
1. The Fund’s investment objectives, risks, charges and expenses must be considered carefully before investing.
5
j , , g p y gThe prospectus contains this and other important information about the investment company, and it may be obtained by calling 1‐800‐960‐0188. Read it carefully before investing.References to other mutual funds should not be interpreted as an offer of these securities. Jeffrey Gundlach is a sub‐advisor to the Litman Gregory Masters Fund, which is also distributed by Quasar Distributors, LLC.

“To QE3 or not to QE3That is the Question”
DoubleLine Multi‐Asset Growth FundLive Webcast hosted by:Live Webcast hosted by:
Jeffrey Gundlach Chief Executive Officer
Global Theater
Cast:Ben
BernankeAngela Merkel
April 17, 2012 Bonds
Central Banks
MerkelMario Draghi
Bonds

Years of Soaring National DebtThe Great Prosperity: 1947‐1979“Neither a borrower nor a lender be”
William Shakespeare, Hamlet, Act 1, Scene 3
Source: NY Times “The Dangerous Notion That Debt Doesn’t Matter, January 20,2012 http://www.nytimes.com/imagepages/2012/01/20/opinion/sunday/debt‐graphic.html?ref=sunday
7
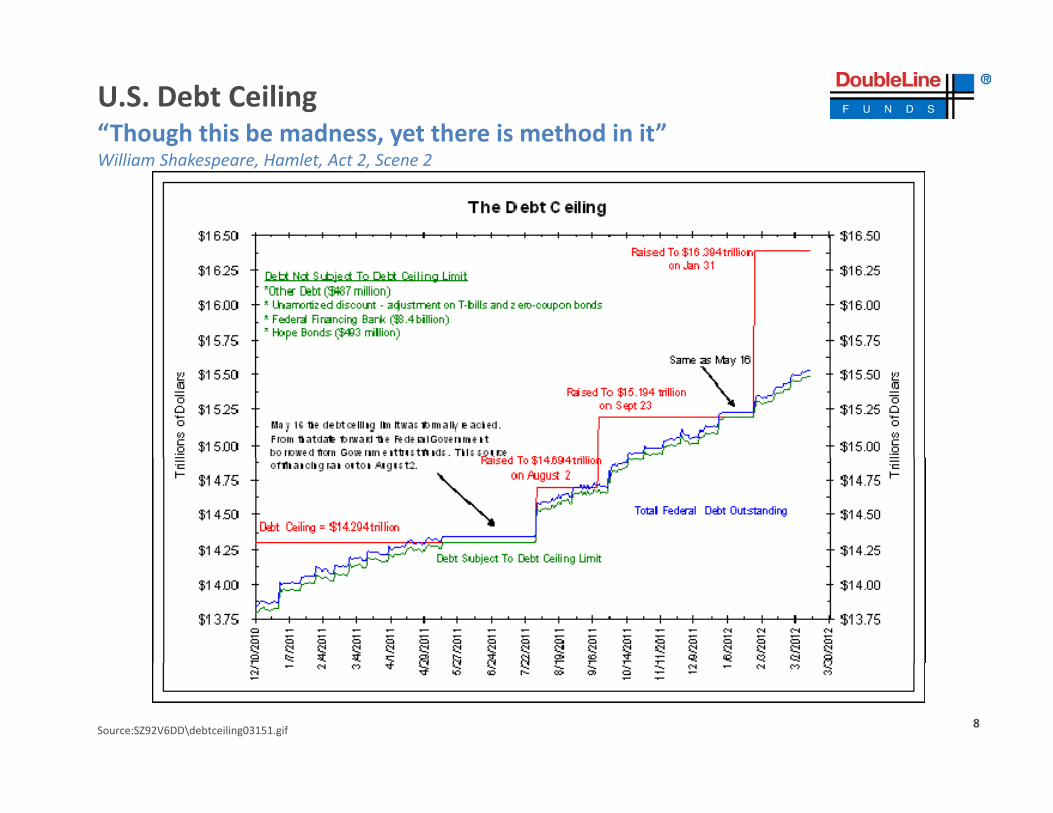
U.S. Debt CeilingThe Great Prosperity: 1947‐1979“Though this be madness, yet there is method in it”William Shakespeare, Hamlet, Act 2, Scene 2
Source:SZ92V6DD\debtceiling03151.gif 8

Whose Tax Rate Rose or FellThe Great Prosperity: 1947‐1979“If you have tears, prepare to shed them now”William Shakespeare, Julius Caeser, Act 3, Scene 2
Change in total federal tax rate –Which includes income, payroll, estate and other taxes – for income groups 1960 to 2004, the
2004 rates include the Bush tax cuts. The major change since then is the Obama g p ,
most recent data available stimulus, which reduced the overall federal tax rate by between 1 and 1.5 percentage points for many households
Segment 1960 Average Of Income Tax Rate For Distribution
h
households
Each income group
Source: http://www.nytimes.com/imagepages/2012/04/13/opinion/sunday/0415web‐leonhardt.html?ref=sunday‐reviewNew York Times 1960 through 2004.
9

Debt to Gross Domestic Product (GDP)The Great Prosperity: 1947‐1979
“Wh t’ d ’t b d ”
250 Debt to GDP
“What’s done can’t be undone”William Shakespeare, Macbeth, Act 5, Scene 1
200
100
150
%
50
0
Source: CIA Workd Factbook. Includes public sector debt, not including inter‐governmental debt or social security as of December 31, 2011.GDP = the monetary value of all the finished goods and services produced within a country’s borders in a specific time period, though GDP is usually calculated on an annual basis.
10

The Great Prosperity: 1947‐1979
World Wide Debt“When sorrows come, they come not in single spies but in battalions”, y g pWilliam Shakespeare, Hamlet, Act 4, Scene 5
11

The Great Prosperity: 1947‐1979
2012 Debt Rollovers and Interest Payments
“H th th h t k l th th k t“Have more than thou showest, speak less than thou knowest, lend less than thou owest”William Shakespeare, King Lear, Act 1, Scene 4
Country2012 Bond, Bill Redemptions ($) Coupon Payments ($)
Japan 3000 billion 117 billionU.S. 2783 billion 212 billionItaly 428 billion 72 billionFrance 367 billion 54 billionGermany 285 billion 45 billionGermany 285 billion 45 billionCanada 221 billion 14 billionBrazil 169 billion 31 billionU.K. 165 billion 67 billionChina 121 billion 41 billionIndia 57 billion 39 billionRussia 13 billion 9 billion
12Source: MISH’s Global Economic Trend Analysis, Tuesday January 3, 2012http://globaleconomicanalysis.blogspot.com/2012/01/worlds‐biggest‐economies‐face‐76t‐debt.html

The Great Prosperity: 1947‐1979
Central Bank Balance Sheets“Fortune brings in some boats that are not steered”
10/31/1113.20
William Shakespeare, Cymbeline, Act 4, Scene 3
12/31/0810 12
13.20
11/30/1010.87
10.12
2/28/098.95
5/31/064.99
8/31/087.23
13Source: Bianco Research, LLC, February 2, 2012ECB = European Central Bank

The Great Prosperity: 1947‐1979
What Happens When the Stimulus Ends?“You pay a great deal too dear for what’s given freely””p y g g yWilliam Shakespeare, The Winter’s Tale, Act 1, Scene 1
14
Source: http://www.ritholtz.com/blog/2012/02/who‐took‐my‐easy‐button/ , February 4, 2012 John Mauldin “Who Took My Easy Button”PIDSDCWT Index = US Disposable Personal Income chained 2005 dollars seasonally adjusted PIDSPINX Index = US Personal income excluding transfer receipts chained 2005 dollars seasonal adjusted annual rateAn investment cannot be made directly in an index..

The Great Prosperity: 1947‐1979
Fed Stimulus Effect on S&P 500“Can one desire too much of a good thing?”William Shakespeare, As You Like It, Act 4, Scene 3
1409.75
15
Source: http://www.zerohedge.com/sites/default/files/images/user3303/imageroot/2012/03/20120319_QE3_2.pngAs of March 19, 2012.S&P 500 Index = An index of 500 stocks chosen for market size, liquidity and industry grouping, among other factors. The S&P 500 is designed to be a leading indicator of U.S. equities and is meant to reflect the risk/return characteristics of the large cap universe. An investment cannot be made directly in an index..

Quantitative Easing (QE) Impact on Stocks and Commodities“Some rise by sin and some by virtue fall”William Shakespeare Measure For Measure Act 4 Scene 3
400
1400
1500QE Impact on Stocks and Commodities
September 2, 2008 through April 16, 2012
1369.57
William Shakespeare, Measure For Measure, Act 4, Scene 3
300
350
1200
130011/25/08
QE1 announced
1/1/09QE1purchasesbegin
3/31/10QE1 purchases end
8/27/10JacksonHole speech ‐
QE2 hinted
277 98
250
900
1000
1100QE1 purchasesbegin
6/30/11QE2 purchases end
9/21/11Operation Twist begins
277.98
200
700
800
900
Jan 1, 2009: QE 1 Start ‐ $600 bnMar 18, 2009: QE1 Expanded to $1.725 tn
3/18/09QE1 expanded
11/3/10QE2 purchases begin
100
150
500
600 S&P 500
DJ UBS Commodity Index
, Q p $Mar 31, 2010: QE1 EndsNov 3, 2010: QE2 Start ‐ $600 bnJun 30, 2011: QE2 EndSep 21, 2011: Operation Twist StartJun 30, 2012: Operation Twist End
16
Source: Standard & Poor’s, Down Jones, UBS and Bloomberg Financial as ofQE = Quantitative Easing is an unconventional monetary policy used by central banks to stimulate the national economy when conventional monetary policy has become inefficient.Stocks = Refers to S&P 500. Please refer to definitions on page 31.Commodities = Dow Jones UBS Commodity Index. Please refer to definition on page 31 for more detail.

QE Impact on 10‐Year Treasuries“The miserable have no other medicine but only hope”
4.5%QE Impact on 10‐Year TSY
September 2, 2008 through April 16, 2012
William Shakespeare, Measure for Measure, Act 3, Scene 1
3.5%
4.0%
11/25/08QE1 announced
3/31/10QE1 purchases end
6/30/11QE2 purchases end
3.0%3/18/09
QE1 expanded
2.5%
1/1/09QE1 purchasesbegin
Q p
11/3/10QE2 purchases begin
1.5%
2.0%
QE1 purchasesbegin
8/27/10JacksonHole speech ‐
QE2 hinted
Jan 1, 2009: QE 1 Start ‐ $600 bnMar 18, 2009: QE1 Expanded to $1.725 tnMar 31, 2010: QE1 EndsNov 3, 2010: QE2 Start ‐ $600 bnJun 30, 2011: QE2 EndSep 21, 2011: Operation Twist StartJun 30, 2012: Operation Twist End
9/21/11Qperation Twist begins 1.98%
17Source: Standard & Poor’s, Down Jones, UBS and Bloomberg Financial as of QE = Quantitative Easing is an unconventional monetary policy used by central banks to stimulate the national economy when conventional monetary policy has become inefficient.10‐Year Treasury Bond = a debt obligation issued by the U.S. Treasury that has a term of more than one year, but not more than 10 years.

S&P 500 Index and Shanghai Index
Source: Bloomberg Financial Services, DoubleLine Capital LPS&P 500 index is a basket of 500 stocks that are considered to be widely held. It is weighted by market value and its performance is thought to be representative of the stock market as a whole. SPXT is the S&P 500 index net total return index.SHCOMP = The Shanghai Stock Exchange Composite is a capitalization‐weighted index tracking daily price performance of all A and B‐shares listed on the Shanghai Stock Exchange. This index was developed December 19, 1990 with a base value of 100.An investment cannot be made directly in an index.
18

Emerging Markets Index and S&P 500 Index
l b i i l i bl i i lSource: Bloomberg Financial Services, DoubleLine Capital LPS&P 500 index is a basket of 500 stocks that are considered to be widely held. It is weighted by market value and its performance is thought to be representative of the stock market as a whole.MXEF = The MSCI Emerging Markets Index is a free float‐adjusted market capitalization index that is designed to measure equity market performance of emerging markets. The MSCI Emerging Markets Index consists of the following 21 emerging market country indices: Brazil, Chile, China, Colombia, Czech Republic, Egypt, Hungary, India, Indonesia, Korea, Malaysia, Mexico, Morocco, Peru, Philippines, Poland, Russia, South Africa, Taiwan, Thailand, and Turkey.An investment cannot be made directly in an index.
19

European Markets Index and S&P 500 Index
l b i i l i bl i i lSource: Bloomberg Financial Services, DoubleLine Capital LPS&P 500 index is a basket of 500 stocks that are considered to be widely held. It is weighted by market value and its performance is thought to be representative of the stock market as a whole.MXEA = The MSCI EAFE Index (Europe, Australasia, Far East) is a free float‐adjusted market capitalization index that is designed to measure the equity market performance of developed markets, excluding the US & Canada. The MSCI EAFE Index consists of the following 22 developed market country indices: Australia, Austria, Belgium, Denmark, Finland, France, Germany, Greece, Hong Kong, Ireland, Israel, Italy, Japan, the Netherlands, New Zealand, Norway, Portugal, Singapore, Spain, Sweden, Switzerland, and the United Kingdom.An investment cannot be made directly in an index.
20

“To QE3 or not to QE3That is the Question”
DoubleLine Multi‐Asset Growth FundLive Webcast hosted by:Live Webcast hosted by:
Jeff ShermanPortfolio Manager,Commodities
BondsApril 17, 2012
Bonds

US and Global Leading Index Returns“Better three hours too soon than a minute too late”
Blue= YTD ending 4/12/12Grey = Year 2011
Better three hours too soon than a minute too lateWilliam Shakespeare, Merry Wives of Windsor, Act 2, Scene 2
‐14.69%
‐18.11%
6 90%
14.32%
11.11%
Germany (DAX)
Brazil Bovespa (IBOV)
Grey = Year 2011
1
1
0%
2.11%
‐20.22%
4.76%
11.01%
6.90%
High Yield (JOAO)
S&P 500 (SPX)
Shanghai (SHCOMP)1
5.60%
8.16%
4.50%
0.48%
4.91%
International‐Developed (NOGO)
International‐Emerging (IGOV)
High Yield (JOAO)
6.14%
7.51%
‐0.33%
1.09%
2.90%
Government (G0A0)
Mortgages (MOAO)
Corporate (COAO)
9.19%Government (G0A0)
Data Source: Merrill Lynch Indices, Bloomberg1. Foreign indices returns are quoted in their own currencies.Please see the Appendix for index definitions. An investment cannot be made directly in an index.
22

Commodities Have Followed Stocks in Risk On / Risk Off
H tl th t h di d ith diti lli t thHowever, recently the two have diverged with commodities rolling over two months ago
23Source: Bloomberg FinancialPlease see the appendix for index definition. An investment cannot be made directly in an index.

Copper Spot Prices – Looking Weak Once Again
24Source: Bloomberg FinancialPlease see the appendix for index definition. An investment cannot be made directly in an index.

Gold Rally Has Consolidated in the $1600/oz ‐ $1800/ozRange
25Source: Bloomberg FinancialPlease see the appendix for index definition. An investment cannot be made directly in an index.

March 2012 Warmest Month on Record Relative to March Norms in Contiguous 48 States –Weather 5 1 degrees Fahrenheit over averageWeather 5.1 degrees Fahrenheit over average
26Source: National Oceanic and Atmospheric Administration

U.S Average Temperature Relative to Normals –3‐month Average
• Using a rolling 3‐month average the variance is the greatest over the past 17 years
27Source: Bianco Research

Natural Gas Spot Price Near the Low of 2002“All that glisters is not gold”g gWilliam Shakespeare, The Merchant of Venice, Act 2, Scene 7
28Source: Bloomberg FinancialPlease see the appendix for index definition. An investment cannot be made directly in an index.
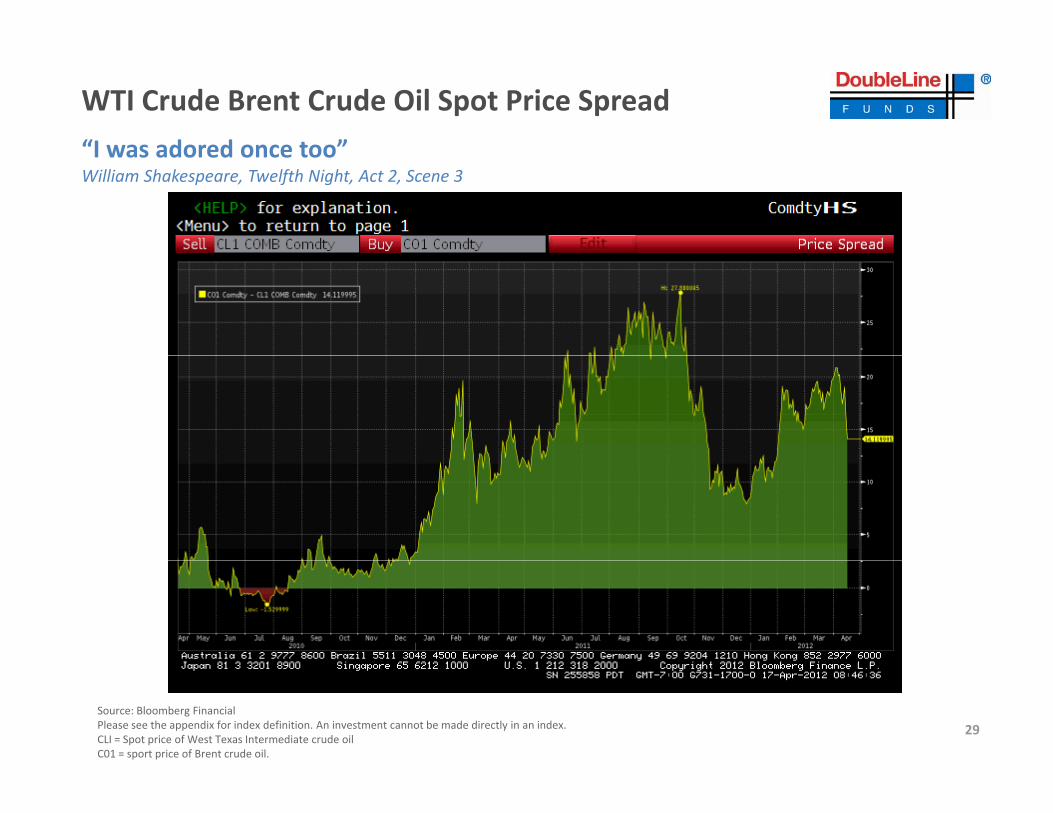
WTI Crude Brent Crude Oil Spot Price Spread
“I was adored once too”I was adored once tooWilliam Shakespeare, Twelfth Night, Act 2, Scene 3
29Source: Bloomberg FinancialPlease see the appendix for index definition. An investment cannot be made directly in an index.CLI = Spot price of West Texas Intermediate crude oilC01 = sport price of Brent crude oil.

Multi‐Asset Growth Fund Philosophy
The DoubleLine Multi‐Asset Growth Fund provides a flexible global asset allocation framework that
seeks long‐term capital appreciation while managing “tail risk” as we endeavor to exploit marketseeks long term capital appreciation while managing tail risk as we endeavor to exploit market
volatility and avoid catastrophic principal losses.
30

Investment Process
Market Timeliness“Typical”Portfolio Allocation
Top Down Secular TrendsLong‐TermApprox. 35%
Economic and BusinessEconomic and Business Cycle IntermediateApprox. 50%
Market Micro Structure Short‐TermApprox. 15%
31

Multi‐Asset Growth Fund Investment HorizonInvestment Horizon
The Fund combines different investment horizons in an effort to capture long‐term secular trends, relative positioning in the economic and business cycles, as well as short‐term market p g yopportunities.
Investment Horizon Strategic Allocation Current AllocationInvestment Hori on Strategic Allocation Current Allocation
Long‐Term 35% 26%
I di 50% 43%Intermediate 50% 43%
Short‐Term 15% 31%
32Source: DoubleLine Capital LP as of September 30, 2011Portfolio allocations are subject to change at any time.

Asset Class Outlook Over Time
• DoubleLine’s outlook for the various asset classes appear in green for the classes we view as favorable, yellow for classes we view with caution, and red for a negative outlook.
Short Term Medium Term Long Term
Fi d IFixed Income
Equities
Commodities
FX (USD)( )
Cash
33Source: DoubleLine Capital LP

Multi‐Asset Growth Portfolio Breakdown By Asset ClassesAs of March 31, 2012
Cash21.84%
US Fixed Income**50.01%
Real Assets**11.36%
US Equity9.20%
International Equity3.19%
** N i l d Sh i i
International Fixed Income
4.40%
34
** Net amount includes Short positions.Source: DoubleLine Capital LP as of March 31, 2012Fixed Income = Refers to investments which are not equity, that obligates the borrower/issuer to make payments on a fixed schedule.International Fixed Income = Refers to investments in international bonds.Equities = Equity investments refer to stocks or capital and growth equity in public companies that issue stock.Real Assets = A non‐financial asset is an asset with a physical value such as land, property or some type of object.Portfolio allocations are subject to change at any time.

Multi‐Asset Growth Portfolio Breakdown By Commodity SectorAs of March 31, 2012
Agriculture **
Energy **40.6%Precious
Metals37.5%
‐11.7%
Industrial Metals **
**Net amounts include Short positions.Source: DoubleLine Capital LP as of March 31, 2012Energy = Includes energy related commodities including crude oil, gas oil, heating oil, crude oil and natural gas.Precious Metals = Includes metals that are considered rare and/or have a high economic value including gold silver platinum and palladium They are highly resistant to corrosion
Metals 33.6%
35
Precious Metals = Includes metals that are considered rare and/or have a high economic value including gold, silver, platinum and palladium. They are highly resistant to corrosion.Industrial Metals = Includes metals that are used in industry or base metals including aluminum, lead, copper, zinc, iron, etc.Agriculture = Agriculture crops are derived from farming or th ecultivation of the soil. They include, soybeans, corn, wheat, sugar, coffee, etc.Livestock = Commodities that were or are derived from living animals including cattle, hogs, etc.Portfolio allocations are subject to change at any time.

“Efficient Portfolio” Definitions
“U.S. Bonds” = Barclays Capital US Aggregate Index ‐ The Barclays Capital US Aggregate Index represents securities that are SEC‐registered, taxable, and dollar denominated. The index covers the US investment grade fixed rate bond market, with index components for government and corporate securities, mortgage pass‐through securities, and asset‐backed securities. These major sectors are subdivided into more specific indices that are calculated and reported on a regular basis.
“Munis”= BofA Merrill Lynch U.S. Municipal Securities Index (UOA0)This index tracks the performance of US dollar denominated investment grade tax‐exempt debt publicly issued by US states and territories, and their political subdivisions, in the US domestic market. Qualifying securities must have at least one year remaining term to final maturity, a fixed coupon schedule and an investment grade rating (based on Moody’s, S&P and Fitch). Minimum size vary based on the initial term to final maturity at time of issuance.
“Agency MBS” = Barclays Capital US Mortgage‐Backed Securities (MBS) Index ‐ This index is the US MBS component of the US Aggregate index. It covers the mortgage‐backed pass‐through securities of Ginnie Mae (GNMA), Fannie Mae (FNMA), and Freddie Mac (FHLMC). The MBS Index is formed by grouping the universe of over 600 00 individual fixed rate MBS pools into approximately 3 500 generic aggregates They are defined according to the following parameters: Agency (GNMA FNMA FHLMC)600,00 individual fixed rate MBS pools into approximately 3,500 generic aggregates. They are defined according to the following parameters: Agency (GNMA, FNMA, FHLMC), Program (30‐year, 15‐year, balloon, GPM), Pass‐through coupon (6.0%, 6.5% etc.), Origination year (1987, 1988, etc.)
Barclays Capital Commercial Mortgage‐Backed Securities (CMBS) Index ‐ This index is the CMBS component of the US Aggregate Index. It includes investment grade securities that are ERISA eligible under the underwriter’s exemption and is the only CMBS sector that is included in the US Aggregate Index
“Non‐Agency MBS”The DoubleLine Non‐Agency MBS index is comprised of mortgage‐backed securities issued by non‐agency entities/private labels. The loan data is supplied by LoanPerformance.
“ABS” Barclays Capital Asset‐Backed Securities (ABS) Index ‐ This index is the ABS component of the US Aggregate Index. It includes securities whose value and y p ( ) p gg gincome payments are derived from and collateralized (‘or backed”) by a specified pool of underlying assets including credit cards, auto loans, etc.
“U.S. High Yield”= Barclays Capital US High Yield Cash Pay Index (JOA0) A.K.A. “Junk Bonds”‐ The Barclays Capital US High Yield Index covers the universe of fixed rate, non‐investment grade debt. Eurobonds and debt issuer from countries designated as emerging markets (e.g. Argentina, Brazil, Venezuela, etc.) are excluded, but Canadian and global bonds (SEC registered) of issuers in non‐EMG countries are included. Original issue zereos, step‐up coupon structures, 144‐As and pay‐in‐kind (PIK, as of October 1, 2009) are also included.
“Convertibles”= BofA Merrill Lynch US All Convertibles Index (VOSO) ‐ The Merrill Lynch All Convertible Index is a rule driven index. which includes all bonds d f d k f U S i d i hi h h $50 illi i k l d ibl i U S d ll d i d k ADRand preferred stocks of U.S.‐registered companies, which have $50 million or more in aggregate market value and are convertibles in U.S. dollar‐denominated common stocks, ADRs
or cash equivalents. Please note an investor cannot invest directly in an index.“EM Equities”= Emerging Equity (EAFE)Countries considered to be emerging economies whose public/private corporations issue stock to raise capital.“International Sovereign”= Barclays Capital Global Treasury x US Total Return Index Value Unhedged USD (LGTITRUU)Includes Sovereign debt for Australia, Belgium, Brazil, Canada, Syprus, Czech Republic, Germany, Denmark, France, Hungary, Israel, Ireland, Italy, Japan, Luxembourg, Mexico, Malayasia, Morooco, Korean, Netherlands, Norway, New Zealand, Portugal, Poland, Austria, Finland, Russia, South Africa, Sweden, Singapore, Slovak Republic, Spain, and Switzerland.
36

“Efficient Portfolio” Definitions
“EM Sovereign”= JP Morgan Emerging Markets Bond Index Global Diversified (EMBI GD)This index is uniquely‐weighted version of the EMBI Global. It limits the weights of those index countries with larger debt stocks by only including specified portions of these countries’ eligible current face amounts of debt outstanding. The countries covered in the EMBI Global Diversified are identical to those covered by EMBI Global.“EM Corporate Debt”= JP Morgan Corporate Emerging Markets Bond Index Broad Diversifed (CEMBI BD)This index is a market capitalization weighted index consisting of US‐denominated Emerging Market corporate bonds. It is a liquid global corporate benchmark representing Asia, Latin America, Europe and the Middle East/Africa. This index also includes two subindices: J.P. Morgan Corporate Broad EMBI Diversified High Yield Index Level (JBCDNOIG) and the J.P. Morgan Corporate Broad EMBI Diversified High Grade Index Level (JBCDIGIG).“DJ UBS Commodities”= Dow Jones UBS Excess Return Commodity Index – (DJUBSTR)The index is composed of futures contracts on 19 physical commodities. It reflects the return on fully collateralized futures positions. It is quoted in USD.“US Equities”= S&P 500 (SPX)Standard & Poor’s US 500 Index, a capitalized‐weighted index of 500 stocks.Standard & Poor s US 500 Index, a capitalized weighted index of 500 stocks.“International Equities”= (MSCI EAFE)MSCI Country index is a free float‐adjusted market capitalization index that is designed to measure the equity market performance of developed markets, excluding the US & Canada. The MSCI EAFE Index consists of the following 22 developed market country indices: Australia, Austria, Belgium, Denmark, Finland, France, Germany, Greece, Hong Kong, Ireland, Israel, Italy, Japan, the Netherlands, New Zealand, Norway, Portugal, Singapore, Spain, Sweden, Switzerland, and the United Kingdom.Dow Jones UBS Commodity IndexIs a broadly diversified index that allows investors to track commodity futures through a single, simple measure. It’s composed fo futures contracts on physical commodities except metal commodities such as aluminum zinc nickel which are traded on the London Metal Exchangemetal commodities, such as, aluminum, zinc, nickel which are traded on the London Metal Exchange.“Copper”= Copper Spot Price (HGI)Copper is the world’s third most used metal behind iron and aluminum primarily used in highly cyclical industries including construction and industrial machinery manufacturing. Spot price quoted in USD/lb.“Gold”= Gold Spot Price (Golds)The Gold Spot price is quoted as US Dollar per Troy Ounce.Crude Oil= Crude oil varies greatly in appearance depending on its composition.West Texas intermediate (WTI )= Texas light sweet crude is used as a benchmark in oil pricing. It’s “light” because of the low density and sweet because of low sulfur.Brent crude = Is a major trading classification of sweet light crude. Brent is the oil maker also known as Brent Blend.“Inflation Linked”= Citigroup Inflation Linked Securities Local Currency Index (SBUSILSI)Bonds where the principal is indexed to inflation. They are thus designed to cut out the inflation risk of an investment. The inflation linked market primarily consists of sovereign bonds with privately issued inflation‐linked bonds.
37

Other Index Descriptions
BofA Merrill Lynch US Treasury Index (G0Q0) –The Merrill Lynch US Treasury Index tracks the performance of US dollar denominated sovereign debt publicly issued by the US government in its domestic market QualifyingThe Merrill Lynch US Treasury Index tracks the performance of US dollar denominated sovereign debt publicly issued by the US government in its domestic market. Qualifying securities must have at least one year remaining term to final maturity, a fixed coupon schedule and a minimum amount outstanding of $1 billion.
BofA Merrill Lynch US MBS Index (MOAO) –The Merrill Lynch US MBS tracks the performance of US dollar denominated fixed rate and hybrid residential mortgage pass‐through securities publically issued by US agencies in the US domestic market. 30‐year, 20‐year, 15‐year and interest only fixed rate mortgage pools are included in the Index provided they have at least one year remaining term to final maturity.
BofA Merrill Lynch US Dollar Emerging Markets Sovereign Plus Index (IGOV) –The Merrill Lynch US Dollar Emerging Markets Sovereign Plus Index tracks the performance of US dollar denominated emerging market and cross‐over sovereign debt publicly issued in the eurobond or US domestic market. Qualifying countries must have a BBB1 or lower foreign currency long‐term sovereign debt rating (based on average of Moody’s, S&P, Fitch).
BofA Merrill Lynch International Government Index (NOGO)The Merrill Lynch International Index tracks the performance of Australia, Canadian, French, German, Japan, Dutch, Swiss and UK investment grade sovereign debt publicly issued and denominated in the issuer’s own domestic market and currency. Qualifying securities must have at least one year remaining term to final maturity, a fixed coupon schedule and a minimum amount outstanding.
BofA Merrill Lynch US Corporate Index (COAO) ‐ The Merrill Lynch Corporate Index tracks the performance of US dollar denominated investment grade corporateBofA Merrill Lynch US Corporate Index (COAO) ‐ The Merrill Lynch Corporate Index tracks the performance of US dollar denominated investment grade corporate debt publicly issued in the US domestic market. Qualifying securities must have an investment grade rating (based on an average of Moody’s, S&P and Fitch) and an investment grade rated country of risk (based on an average of Moody’s, S&P and Fitch foreign currency long term sovereign debt ratings). Securities must have at least one year remaining term to final maturity, a fixed coupon schedule and a minimum amount outstanding of $250MM.
BofA Merrill Lynch US Government Index (GOAO) ‐ The Merrill Lynch US Government Index tracks the performance of US government (i.e. securities in the Treasury and Agency indices.)
Barclays Capital Global Emerging Markets Index ‐ The Barclays Capital Global Emerging Markets Index represents the union of the USD‐denominated US Emerging y p g gMarkets index and the predominately EUR‐denominated Pan Euro Emerging Markets Index, covering emerging markets in the following regions: Americas, Europe, Middle East, Africa, and Asia. As with other fixed income benchmarks provided by Barclays Capital, the index is rules‐based, which allows for an unbiased view of the marketplace and easy replicability.
Barclays Capital G‐7 Global Treasuries Index ‐ This index includes investment‐grade, local currency‐denominated sovereign debt from US, France, Germany, Italy, Japan, Canada and United Kingdom.
Barclays Capital US Treasury Index ‐ This index is the US Treasury component of the US Government index. Public obligations of the US Treasury with a remaining t it fmaturity of one year or more.
38
getIndexA1U.S. AggrIWS?requBack to In

Other Index Descriptions
JP Morgan Emerging Markets Bond Index Global Diversified (EMBI GD)This index is uniquely‐weighted version of the EMBI Global. It limits the weights of those index countries with larger debt stocks by only including specified portions of these countries’ eligible current face amounts of debt outstanding. The countries covered in the EMBI Global Diversified are identical to those covered by EMBI Global.JP Morgan Emerging Markets Government/Soveriegn Bond Index (GBI‐EM)This index is the first comprehensive, global local Emerging Markets index, and consists of regularly traded, liquid fixed‐rate, domestic currency government bonds to which international investors can gain exposure. Volatility Index (VIX)The VIX shows the market's expectation of 30‐day volatility. It is constructed using the implied volatilities of a wide range of S&P 500 index options. This volatility is meant to be forward looking and is calculated from both calls and puts. The VIX is a widely used measure of market risk and is often referred to as the "investor fear gauge". ECRI Index (ECRWGROW)The ECRI Weekly Leading Index of US economic growth is available to the general public by Economic Cycle ResearchThe ECRI Weekly Leading Index of US economic growth is available to the general public by Economic Cycle Research.German Stock Index (DAX) The German Stock Index is a total return index of 30 selected German blue chip stocks traded on the Frankfurt Stock exchange. The equities use free float shares in the index calculation. The DAX has a base value of 1,000 as of December 31, 1987. Brazil Bovespa Index (IBOV)The Bovespa Idnex is a gross return index weighted by traded volume and is comprised of the most liquid stocks traded on the Sao Paulo Stock Exchange. The Bovespa Index has been divided 10 times by a factor of 10 since January 1, 1985.Sh h i I d (SHCO )Shanghai Index (SHCOMP)The Shanghai Stock Exchange Composite Index is a capitalization‐weighted index. The index tracks the daily performance of all A‐shares and B‐shares listed on the Shanghai Stock Exchange. The index was developed on December 19,1990 with a base value of 100.BSE India Sensitive Index (Sensex)The Sensex is a cap‐weighted index. The selection of the index memebers has been made on the basis of liquidity, depth and floating‐stock‐adjustment depth and industry representation. Dow Jones Industrial Average (INDU)g ( )Dow Jones Industrial Average is a price weighted average of 30 blue‐chip stocks that are generally the leaders in their industry. It has bee a widely followed indicator of the stock market since October 1, 1928.National Association of Securities Dealers Automated Quotation (NASDAQ)NASDAQ is a computerized system that facilitates trading and provides price quotations on more than 5,000 of the more actively traded over the counter stocks. Created in 1971, the NASDAQ was the world’s first electronci stock market.
An investment cannot be made in an index.
39

Additional Definitionsd ( )CRB Index (CRY) The TR/J CRB Commodity Excess Return Index is an arithmetic average of commodity futures prices with monthly rebalancing.
Exchange Traded Fund (ETF) An ETF is a security that tracks an index, a commodity or a basket of assets like an index fund, but trades like a stock on an exchange.
MarkIt Prime X Index Markit Prime X index is a synthetic CDS index referencing a basket of prime mortgage‐backed securities that was launched April 28, 2010 with the intent to create a liquid, tradeable tool allowing investors to take positions on prime mortgage‐backed securities via CDS contracts.
DoubleLine Definitions for SubPrime, Alt‐A and Prime Non‐Agency Mortgage‐Backed Securities There are no set industry wide definitions defining the differences in the non‐agency mortgage market. Any references made to these sectors of the non‐agency mortgage market are defined using DoubleLine’s internally developed definitions and are as follows: Prime defined as FICO > 725 and LTV < 75, Alt‐A defined as FICO 675‐725; or FICO > 725 and LTV >= 75, Subprime defined as FICO < 675Standard Deviation The measure of dispersion of a set of data from its mean. A measure of an investment’s volatility. The more spread apart the data, the higher the deviation.BRIC Countries BRIC is an acronym that refers to Brazil, Russia, India and China which are all deemed to be at a similar stage of newly advanced economic development.
Developed Markets The Developed Markets, as defined by JP Morgan, are Australia, Canada, France, Germany, Italy, Japan, New Zealand, Norway, Sweden, Switzerland, the p p , y g , , , , y, y, p , , y, , ,United Kingdom, and the United States.
Duration Duration is a commonly used measure of the potential volatility of the price of a debt security, or the aggregate market value of a portfolio of debt securities, prior to maturity. Securities with longer duration generally have more volatile prices than securities of comparable quality with a shorter duration.
Net Asset Value (NAV) A mutual funds’ price per share or exchange‐traded fund’s (ETF) per‐share value. In both cases, the per‐share dollar amount of the fund is calculated by dividing the toal value of all the securities in its portfolio, less any liabilities, by the number of fund shares outstanding.
Credit Default Swaps (CDS) Credit Default Swaps are designed to transfer the credit exposure of fixed income products between parties.
Emerging Markets Nations with developing financial markets, which are defined by JP Morgan as Argentina, Brazil, Chile, Colombia, Ecuador, Mexico, Peru, Venezuela, China Hong Kong, India, Indonesia, Korea, Malaysia, Philippines, Singapore, Taiwan, Thailand, Bulgaria, Czech Republic, Hungary, Israel, Poland, Romania, Russia, South Africa, and Turkey.
G3 G3 countries are the United States, Japan, and the European Union.G7 G7 countries are the United States, Canada, France, Germany, Italy, Japan, and the United Kingdom.
Market Price Market price is the weighted average of the prices of the fund’s portfolio holdings. While a component of the fund’s Net Asset Value (NAV), it should not be confused with the fund’s NAV.confused with the fund s NAV.
Basis Point A unit that is equal to 1/100th of 1%, and is used to denote the change in a financial instrument. The basis point is commonly used for calculating changes in interest rates, equity indexes and the yield of a fixed income security.
Correlation Is a statistical measurement of the relationship between two variables. Possible correlations range from +1 to ‐1. A zero correlation indicated that there is no relationship between the variables. A correlation of ‐1 indicated a perfect negative correlation and +1 indicates a perfect positive correlation.
Cash Flow Measures the cash generating capability of a company by adding non‐cash charges (e.g. depreciation) and interest expense to pretax income.
As of October 11, 2011 DoubleLine Capital LP mutual fund held 0% in Annaly Capital REIT.DoubleLine Mutual Funds had the following breakdown in Ginnie Mae, Fannie Mae and Freddie Mac: DoubleLine Total Return Bond Fund held 2.5% GNMA, 22.6% FNMA and 18.8% FHLMC. DoubleLine Core Fixed Income Fund held 1.7% GNMA, 9.4% FNMA and 13.3% FHLMC.Fund holdings are subject to change and are not recommendations to buy or sell any security. 40

Disclaimer
Important Information Regarding This ReportThis report was prepared as a private communication and was not intended for public circulation. Clients or prospects may authorize distribution to their consultants or other agents.
Issue selection processes and tools illustrated throughout this presentation are samples and may be modified periodically. Such charts are not the only tools used b th i t t t t l hi ti t d t l d th i t d d lt d t i t d d f b f i lby the investment teams, are extremely sophisticated, may not always produce the intended results and are not intended for use by non‐professionals.
DoubleLine has no obligation to provide revised assessments in the event of changed circumstances. While we have gathered this information from sources believed to be reliable, DoubleLine cannot guarantee the accuracy of the information provided. Securities discussed are not recommendations and are presented as examples of issue selection or portfolio management processes. They have been picked for comparison or illustration purposes only. No security presented within is either offered for sale or purchase. DoubleLine reserves the right to change its investment perspective and outlook without notice as market conditions dictate or as additional information becomes available.dictate or as additional information becomes available.
Important Information Regarding Risk FactorsInvestment strategies may not achieve the desired results due to implementation lag, other timing factors, portfolio management decision‐making, economic or market conditions or other unanticipated factors. The views and forecasts expressed in this material are as of the date indicated, are subject to change without notice, may not come to pass and do not represent a recommendation or offer of any particular security, strategy, or investment. Past performance is no guarantee of future results.
Important Information Regarding DoubleLineIn preparing the client reports (and in managing the portfolios), DoubleLine and its vendors price separate account portfolio securities using various sources, including independent pricing services and fair value processes such as benchmarking.
To receive a complimentary copy of DoubleLine’s current Form ADV Part II (which contains important additional disclosure information), a copy of the bl ’ l d d b dd l f bl ’ d l bl ’ lDoubleLine’s proxy voting policies and procedures, or to obtain additional information on DoubleLine’s proxy voting decisions, please contact DoubleLine’s Client
Services.
41

Disclaimer
Important Information Regarding DoubleLine’s Investment StyleDoubleLine seeks to maximize investment results consistent with our interpretation of client guidelines and investment mandate. While DoubleLine seeks to maximize returns for our clients consistent with guidelines, DoubleLine cannot guarantee that DoubleLine will outperform a client's specified benchmark or the market. Additionally, the nature of portfolio diversification implies that certain holdings and sectors in a client's portfolio may be rising in price while others are falling; or, that some issues and sectors are outperforming while others are underperforming. Such out or underperformance can be the result of many factors, such as but not limited to duration/interest rate exposure, yield curve exposure, bond sector exposure, or news or rumors specific to a single name.DoubleLine is an active manager and will adjust the composition of client’s portfolios consistent with our investment team’s judgment concerning market conditions and any particular sector or security. The construction of DoubleLine portfolios may differ substantially from the construction of any of a variety of bond market indices. As such, a DoubleLine portfolio has the potential to underperform or outperform a bond market index. Since markets can remain inefficiently priced for long periods, DoubleLine’s performance is properly assessed over a full multi‐year market cycle.
Important Information Regarding Client ResponsibilitiesImportant Information Regarding Client ResponsibilitiesClients are requested to carefully review all portfolio holdings and strategies, including by comparing the custodial statement to any statements received from DoubleLine. Clients should promptly inform DoubleLine of any potential or perceived policy or guideline inconsistencies. In particular, DoubleLine understands that guideline enabling language is subject to interpretation and DoubleLine strongly encourages clients to express any contrasting interpretation as soon as practical. Clients are also requested to notify DoubleLine of any updates to Client’s organization, such as (but not limited to) adding affiliates (including broker dealer affiliates), issuing additional securities, name changes, mergers or other alterations to Client’s legal structure.
DoubleLine® is a registered trademark of DoubleLine Capital LP.
© 2011 DoubleLine Capital LP© 2011 DoubleLine Capital LP
42

PerformanceDoubleLine Total Return Bond Fund – Quarter Ending March 31, 2012
Si I ti
March 1Q20121 Year
(Annualized)
Since Inception Annualized
(4‐6‐10 to 3‐31‐12)
I‐share 0.45% 2.96% 10.18% 14.77%N‐share 0.44% 2.90% 9.83% 14.47%
Barclays US Aggregate Index ‐0 55% 0 30% 7 71% 6 76%Barclays US Aggregate Index ‐0.55% 0.30% 7.71% 6.76%
As of March 31, 2012 I‐share N‐shareGross SEC 30‐Day Yield 6.33% 6.08%
Net SEC 30‐Day Yield 6.34% 6.09%
Morningstar Intermediate Term Bond Fund Rankings*
As of March 31, 2012 I‐share N‐share1‐Year (Absolute Rank) 19 of 1,179 27 of 1,179
I‐share N‐shareGross Expense Ratio 0.54% 0.79%
Net Expense Ratio 0.49% 0.74%
( )
1‐Year (% Rank) 2% 3%For the period ending 3‐31‐12, Morningstar ranked the Total Return
Bond Fund in the top 2% and 3% (for the I and N‐share classes, respectively) among the 1,179 Funds in the Intermediate‐Term Bond Fund category based
on total returns.
Performance data quoted represents past performance; past performance does not guarantee future results. The investment return and principal value of an investment will fluctuate so that an investor's shares, when redeemed, may be worth more or less than the original cost. Current performance of the fund may be lower or higher than the performance quoted. Performance data current to the most recent month‐end may be obtained by calling 213‐633‐8200 or by visiting www.doublelinefunds.com. The Advisor has contractually agreed to waive fees through July 24 2012
on total returns.
The Advisor has contractually agreed to waive fees through July 24, 2012.Barclays US Aggregate Index represents securities that are SEC‐registered, taxable, and dollar denominated. The index covers the US investment grade fixed rate bond market, with index components for government and corporate securities, mortgage pass‐through securities, and asset‐backed securities. These major sectors are subdivided into more specific indices that are calculated and reported on a regular basis. It is not possible to invest in an index.Past Performance does not guarantee future results. Index performance is not illustrative of fund performance. An investment cannot be made in an index.*Morningstar rankings (% Rank) represent a fund's total‐return percentile rank relative to all funds that have the same Morningstar category. The highest percentile rank is 1 and the lowest is 100. Morningstar Rankings (Absolute) represent a fund’s total return rank relative to all funds that have the same Morningstar
43
Category. The highest rank is 1 and the lowest is based on the total number of funds in the category. It is based on Morningstar total return, which includes both income and capital gains or losses and is not adjusted for sales charges or redemption fees.© 2011 Morningstar Inc. All Right Reserved. The information contained herein: (1) is proprietary to Morningstar; (2) may not be copied or distributed; and (3) is not warranted to be accurate, complete or timely. Neither Morningstar nor its content providers are responsible for any damages or losses arising from any use of this information.

PerformanceDoubleLine Core Fixed Income Fund – Quarter Ending March 31, 2012
1‐Year Since Inception
March 1Q2012
1 Year (Annualized
)
Since Inception Annualized
(6‐1‐10 to 3‐31‐12)
I‐share 0.00% 1.99% 11.19% 11.57%
N‐share ‐0.11% 1.93% 10.85% 11.28%
B l US A t I d 0 55% 0 30% 7 71% 5 92%Barclays US Aggregate Index ‐0.55% 0.30% 7.71% 5.92%
As of March 31, 2012 I‐share N‐share
Gross SEC 30‐Day Yield 4.01% 3.75%
Net SEC 30‐Day Yield 4.08% 3.83%
Morningstar Intermediate Term Bond Fund Rankings*
As of March 31, 2012 I‐share N‐share
1‐Year (Absolute Rank) 5 of 1,179 12 of 1,179
I‐share N‐share
Gross Expense Ratio 0.85% 1.10%
Net Expense Ratio 0.49% 0.74%
1‐Year (% Rank) 1% 1%
For the period ending 3‐31‐12, Morningstar ranked the Core Fixed Income
Bond Fund in the top 1% (both I and N‐shares) among the 1,179 Funds in the Intermediate‐Term
Bond Fund category based on total returns.
Performance data quoted represents past performance; past performance does not guarantee future results. The investment return and principal value of an investment will fluctuate so that an investor's shares, when redeemed, may be worth more or less than the original cost. Current performance of the fund may be lower or higher than the performance quoted. Performance data current to the most recent month‐end may be obtained by calling 213‐633‐8200 or by visiting www.doublelinefunds.com. The Advisor has contractually agreed to waive fees through July 24 2012The Advisor has contractually agreed to waive fees through July 24, 2012.Barclays US Aggregate Index represents securities that are SEC‐registered, taxable, and dollar denominated. The index covers the US investment grade fixed rate bond market, with index components for government and corporate securities, mortgage pass‐through securities, and asset‐backed securities. These major sectors are subdivided into more specific indices that are calculated and reported on a regular basis. It is not possible to invest in an index.Past Performance does not guarantee future results. Index performance is not illustrative of fund performance. An investment cannot be made in an index.*Morningstar rankings (% Rank) represent a fund's total‐return percentile rank relative to all funds that have the same Morningstar category. The highest percentile rank is 1 and the lowest is 100. Morningstar Rankings (Absolute) represent a fund’s total return rank relative to all funds that have the same Morningstar
44
Category. The highest rank is 1 and the lowest is based on the total number of funds in the category. It is based on Morningstar total return, which includes both income and capital gains or losses and is not adjusted for sales charges or redemption fees.© 2012 Morningstar Inc. All Right Reserved. The information contained herein: (1) is proprietary to Morningstar; (2) may not be copied or distributed; and (3) is not warranted to be accurate, complete or timely. Neither Morningstar nor its content providers are responsible for any damages or losses arising from any use of this information.